Embed Size (px)
Citation preview

JETRO’s FY2015 Survey on Business
Conditions of Japanese-Affiliated
Firms in the Middle East
February 2016
Middle East and Africa Division
Overseas Research Department
Japan External Trade Organization (JETRO)
Copyright © 2016 JETRO. All rights reserved. Reproduction without permission is prohibited.

Japanese-affiliated companies in the Middle East
Despite public security risks and low oil prices, the majority of Japanese-affiliated
companies post a surplus and have an incentive to expand their business.
2 Copyright © 2016 JETRO. All rights reserved. Reproduction without permission is prohibited.
Key Points of Survey Results
1 2 3 4 5
In 2015, the majority of companies posted a surplus. In terms of operating profit forecasts for 2015, 56.2% of companies replied that they would post a surplus. The percentage of those which replied that they would suffer a loss remained at 15.7%. By country, the percentage of companies in the black in the UAE was largest, at 64.3%. Meanwhile, about 30% of companies in Saudi Arabia replied that they would suffer a loss, suggesting that they operated in a harsh business environment.
The business sentiment for 2016 indicated that a little over 40% of companies expected their business to improve. Asked about prospects for 2016, 44.1% of companies expected their operating profits to improve, indicating that more companies had brighter prospects of profitability than in the previous year. The largest reason for improvement was “sales increase in local markets” (74.0%), followed by “sales increase due to increased exports” (51.9%).
Seventy-percent of companies were having an incentive to expand their future business. As to business development policy for the next one to two years, about 70% of companies in each country and territory replied that they planned to expand their business. The two greatest reasons for expansion were “high growth potential” (68.3%) and “increasing sales” (67.5%), and many of them (75.6%) intended to expand their sales functions.
In order to localize management, companies aimed to hire more employees locally rather than bring them from Japan. Cited as major initiatives to localize management were “strengthen systems to train/cultivate local human resources” (54.0%), “encourage mid-level hiring activities to obtain competent local staff” (44.4%), and “assign local staff to a general manager/manager position” (40.6%), but “insufficient performance/awareness among local staff” (43.2%) and “difficulty in recruiting local candidates for executive positions” (39.3%) were cited as issues to be addressed. An overwhelming percentage of companies (about 70%) replied that in the future the number of Japanese employees would remain at almost the same level, but the percentage of companies that expected to hire more local employees in the years to come was high, at about 60%.
UAE’s investment environment was beneficial in terms of taxation and free zoning, but the challenge was growing costs. Many companies considered UAE’s investment environment as attractive because of “merits of tax systems (no corporate tax and no income tax)” (78.2%), “free zones (no regulation for foreign investment and one-stop service)” (70.6%), and “political/social stability” (63.0%), but many of them cited soaring costs such as real estate rent, personnel expenses, and handling fees as issues to be addressed.

Survey Items for this Year
3 Copyright © 2016 JETRO. All rights reserved. Reproduction without permission is prohibited.
Outline of the Survey for This Year
Company Profile
1. Operating Profit
(1) Operating Profit Estimate for 2015 (total, by country)
(2) Operating Profit Estimate for 2015, Forecast for 2016 (compared to results in the previous year, total, by country)
(3) Operating Profit Estimate for 2015, Reasons for Improvement or Decline (multiple answers allowed, total, by country)
(4) Operating Profit Forecast for 2016, Reasons for Improvement or Decline (multiple answers allowed, total, by country)
2. Future Business Plan
(1) Business Operations in the Next One or Two Years (total, by country)
(2) Reasons for Business “Expansion” and Functions to be Expanded in the Next One or Two Years (multiple answers allowed,
total, by country)
3. Management Localization
(1) Approaches to Management Localization (multiple answers allowed, total, by country)
(2) Challenges in Management Localization (multiple answers allowed, total, by country)
4. Changes in Human Resource Structures
(1) Changes in the Number of Local Staff Over the Past Year, Future Plans (total, by country)
(2) Changes in the Number of Japanese Staff Over the Past Year, Future Plans (total, by country)
5. Evaluation of Investment Environments in UAE
Advantages and Disadvantages of the Investment Environments in UAE
4
5
7
8
9
10
11
12
13
14
15
16
17

To grasp the actual condition of Japanese-affiliated companies’ business activities in the Middle East (United Arab Emirates (UAE), Saudi Arabia, and Turkey) and provide the results to the public
Objective
A questionnaire survey was locally conducted for Japanese-affiliated companies operating in the Middle East.
Valid replies were received from 191 companies (120 from UAE, 36 from Saudi Arabia, and 35 from Turkey)
Companies Surveyed
September 28 to October 22, 2015
Period
The response rate was 46.6% (questionnaires were distributed to 410 companies, and valid replies were received from 191 of them).
By country, the response rate was 49.2% for UAE (120 of 244 companies), 50.7% for Saudi Arabia (36 of 71), and 36.8% for Turkey (35 of 95).
Response Rate
This was the third survey for UAE and the second for Saudi Arabia. For Turkey, it was the first survey that covered all industries; the previous ones targeted only the manufacturing industry.
JETRO informed companies to be surveyed of the URL for the questionnaire and asked them to complete and return it or sent them questionnaires written in Japanese by email.
Remarks
All response rates are shown in percentages (%). The response rate was rounded to the second decimal place. As a result, some total figures do not amount to 100%.
“N” stands for the number of valid responses.
Notes
Map of the Middle East
4
Copyright © 2016 JETRO. All rights reserved. Reproduction without permission is prohibited.
Survey Overview
Turkey
Saudi Arabia
United Arab
Emirates
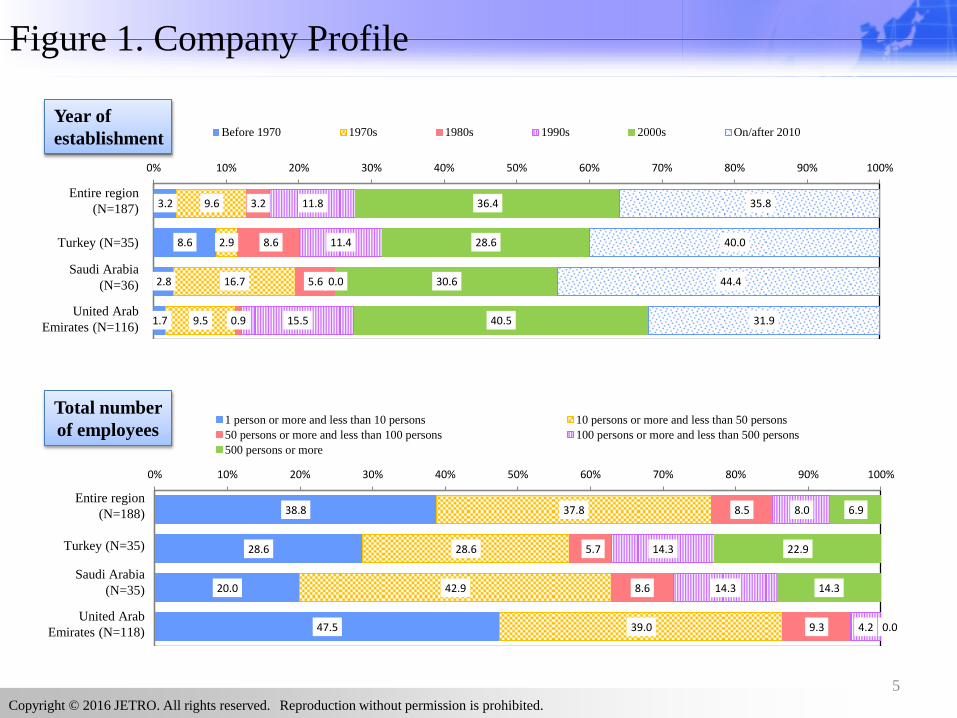
Figure 1. Company Profile
Year of
establishment
Entire region
(N=187)
Turkey (N=35)
Saudi Arabia
(N=36)
Total number
of employees
United Arab
Emirates (N=116)
3.2
8.6
2.8
1.7
9.6
2.9
16.7
9.5
3.2
8.6
5.6
0.9
11.8
11.4
0.0
15.5
36.4
28.6
30.6
40.5
35.8
40.0
44.4
31.9
0% 10% 20% 30% 40% 50% 60% 70% 80% 90% 100%
Before 1970 1970s 1980s 1990s 2000s On/after 2010
38.8
28.6
20.0
47.5
37.8
28.6
42.9
39.0
8.5
5.7
8.6
9.3
8.0
14.3
14.3
4.2
6.9
22.9
14.3
0.0
0% 10% 20% 30% 40% 50% 60% 70% 80% 90% 100%
1 person or more and less than 10 persons 10 persons or more and less than 50 persons
50 persons or more and less than 100 persons 100 persons or more and less than 500 persons
500 persons or more
Entire region
(N=188)
Turkey (N=35)
Saudi Arabia
(N=35)
United Arab
Emirates (N=118)
5
Copyright © 2016 JETRO. All rights reserved. Reproduction without permission is prohibited.
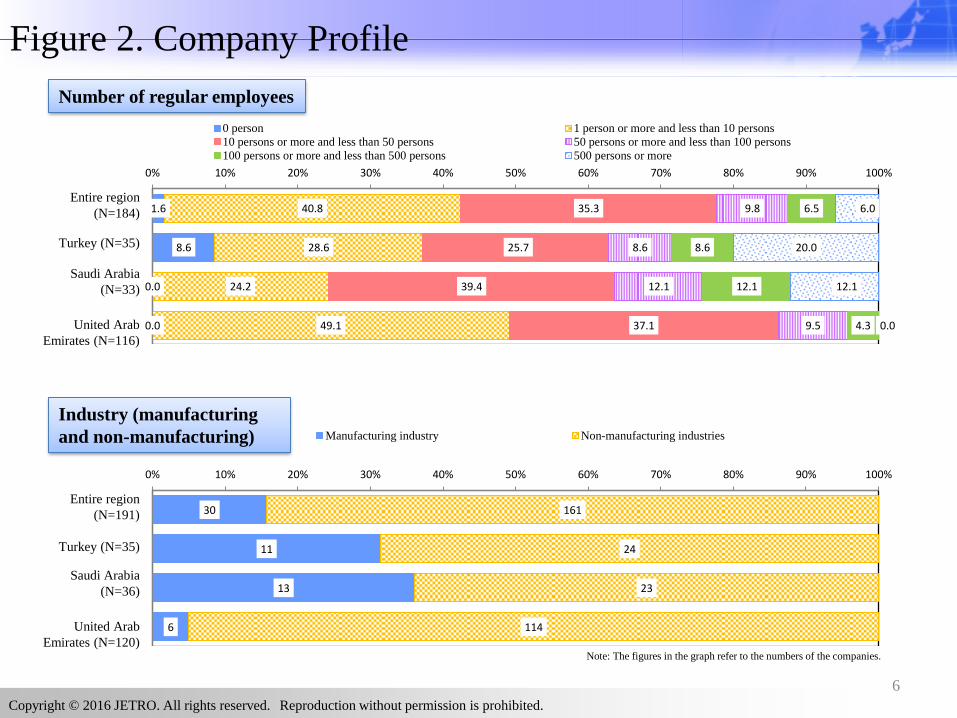
Figure 2. Company Profile
Number of regular employees
1.6
8.6
0.0
0.0
40.8
28.6
24.2
49.1
35.3
25.7
39.4
37.1
9.8
8.6
12.1
9.5
6.5
8.6
12.1
4.3
6.0
20.0
12.1
0.0
0% 10% 20% 30% 40% 50% 60% 70% 80% 90% 100%
0 person 1 person or more and less than 10 persons
10 persons or more and less than 50 persons 50 persons or more and less than 100 persons
100 persons or more and less than 500 persons 500 persons or more
Entire region
(N=184)
Turkey (N=35)
Saudi Arabia
(N=33)
United Arab
Emirates (N=116)
Industry (manufacturing
and non-manufacturing)
30
11
13
6
161
24
23
114
0% 10% 20% 30% 40% 50% 60% 70% 80% 90% 100%
Manufacturing industry Non-manufacturing industries
Entire region
(N=191)
Turkey (N=35)
Saudi Arabia
(N=36)
United Arab
Emirates (N=120) Note: The figures in the graph refer to the numbers of the companies.
6
Copyright © 2016 JETRO. All rights reserved. Reproduction without permission is prohibited.

Figure 3. Operating Profit Estimate (1)
A look at operating profit forecasts for the entire Middle East in 2015 indicated that the majority of companies replied that they
had posted a surplus and that the percentage of those which replied that they had suffered a loss was only 15.7%.
By country, the percentage of companies that answered, “Surplus,” in UAE was largest, at over 60%, followed by Turkey,
where it was also high, at a little less than 50%, but that for Saudi Arabia was low, at 30%. Meanwhile, the percentage of
companies that answered, “Deficit” was largest in Saudi Arabia, at 30%, suggesting that the Saudi business environment was
relatively harsh.
A comparison with the previous year showed that the percentage of companies operating at a profit declined from 65.4% to
64.3% in UAE and from 41.9% to 33.3% in Saudi Arabia. On the other hand, the percentage of loss-making companies in UAE
and Saudi Arabia also dropped, from 12.8% to 11.3% in UAE and from 35.5% to 33.3% in Saudi Arabia. The percentage of
companies that answered, “Break even” increased compared to the previous year.
Operating Profit Estimate for 2015
Entire region
(N=178)
Turkey (N=33)
Saudi Arabia
(N=30)
United Arab
Emirates (N=115)
56.2
48.5
33.3
64.3
28.1
36.4
33.3
24.3
15.7
15.2
33.3
11.3
0% 10% 20% 30% 40% 50% 60% 70% 80% 90% 100%
Surplus Break even Deficit
7
Copyright © 2016 JETRO. All rights reserved. Reproduction without permission is prohibited.

Figure 4. Operating Profit Estimate (2)
A look at operating profit forecast for the entire Middle East showed that in 2016 the percentage of companies replying that the forecast would improve compared to the
previous year increased from 31.8% to 44.1%, while the percentage of companies replying that it would deteriorate decreased from 26.8% to 14.7%. Overall, for 2016, an
increasing percentage of companies had a brighter operating profit forecast than in the previous year.
By country, the percentage of companies replying that in 2016 the forecast would improve compared to the previous year was largest in Saudi Arabia, at 53.3%, followed by
Turkey, where it was also high, at 48.5%. The percentage for UAE was relatively low, at 40.4%. On the other hand, the percentage of companies in Turkey replying that it
would deteriorate compared to the previous year was largest, 18.2%, followed by UAE, at 14.9%, and that for Saudi Arabia was lowest, at 10.0%.
A comparison with the previous year indicated that the percentage of companies that expected operating profit to improve increased in all countries, from 36.7% to 53.3% in
Saudi Arabia, from 27.3% to 48.5% in Turkey, and from 31.9% to 40.4% in UAE. On the other hand, the percentage of those which expected it to deteriorate nearly halved,
from 20.0% to 10.0% in Saudi Arabia, from 27.6% to 14.9% in UAE, and from 30.3% to 18.2% in Turkey. In all countries, the operating profit forecast change for the better.
2015 operating profit forecast (compared to 2014)
2016 operating profit forecast (compared to 2015)
Entire region
(N=179)
Turkey (N=33) Saudi Arabia
(N=30)
United Arab
Emirates (N=116)
Entire region
(N=177)
Turkey (N=33)
Saudi Arabia
(N=30)
United Arab
Emirates (N=114)
31.8
27.3
36.7
31.9
41.3
42.4
43.3
40.5
26.8
30.3
20.0
27.6
0% 10% 20% 30% 40% 50% 60% 70% 80% 90% 100%
Improve Remain the same Deteriorate
44.1
48.5
53.3
40.4
41.2
33.3
36.7
44.7
14.7
18.2
10.0
14.9
0% 10% 20% 30% 40% 50% 60% 70% 80% 90% 100%
Improve Remain the same Deteriorate
8
Copyright © 2016 JETRO. All rights reserved. Reproduction without permission is prohibited.

Figure 5. Operating Profit Estimate (3)
A look at operating profit forecast for 2015 showed that in all countries the percentage of companies that cited “sales increase in local markets” as the main reason the forecast improved was largest, at 50-
70%, followed by companies that mentioned “sales increase due to export expansion” (over 40%) except for Saudi Arabia. In Saudi Arabia, on the other hand, a large percentage of companies cited “reduction
of labor costs” as the reason for improvement (a little less than 20%) with the percentage of “sales increase due to export expansion” being low, at less than 10%.
In all countries, the percentage of companies that citied “sales decrease in local markets” as the reason for deterioration was largest, at about 60%. In the entire region, the second largest reason was “sales
decrease due to export slowdown,” which accounted for a little more than 30%, but by country, the reasons were varied, with half of the companies in Turkey citing “effects of exchange rate fluctuation,” 40%
of those in Saudi Arabia mentioning “increase of labor costs” and “production costs insufficiently shifted to selling price of goods,” and the same percentage of those in UAE choosing “sales decrease due to
export slowdown.“
Reasons 2015 operating profit forecasts
Reasons 2015 operating profit forecasts deteriorate
N=57
N=47
(%)
(%)
70.2
42.1
15.8 7.0 5.3 5.3 3.5 1.8
17.5
66.7
44.4
11.1 11.1
0.0 0.0 0.0
11.1
22.2
54.5
9.1
0.0 0.0
18.2
0.0
9.1
0.0
27.3
75.7
51.4
21.6
8.1 2.7
8.1 2.7 0.0
13.5
0
10
20
30
40
50
60
70
80 Entire region Turkey Saudi Arabia United Arab Emirates
Sales increase in
local markets
Sales increase due
to export expansion
Effects of exchange
rate fluctuation
Reduction of
procurement costs
Reduction of labor
costs
Improvement of
sales efficiency
Reduction of other
expenditures (e.g., administrative/
utility costs/fuel costs)
Improvement of
production
efficiency
Other
59.6
31.9
21.3 21.3 19.1
10.6 8.5 2.1
27.7
60.0
20.0
50.0
20.0 20.0
20.0
10.0 10.0
20.0
60.0
0.0 0.0
40.0 40.0
20.0 20.0
0.0
40.0
59.4
40.6
15.6 18.8
15.6
6.3 6.3 0.0
28.1
0
10
20
30
40
50
60
70 Entire region Turkey Saudi Arabia United Arab Emirates
Sales decrease in
local markets
Sales decrease due
to export slowdown
Effects of exchange
rate fluctuation
Increase of labor
costs
Production costs
insufficiently
shifted to selling
price of goods
Increase of other
expenditures (e.g., administrative/
utility costs/fuel costs)
Increase of
procurement costs
Rising interest rates Other
9
Copyright © 2016 JETRO. All rights reserved. Reproduction without permission is prohibited.
Multiple answers allowed

Figure 6. Operating Profit Estimate (4)
A look at operating profit forecast for 2016 indicated that in all countries 70-90% of companies cited “sales increase in local markets” as the largest reason operating profit improved.
The second reason was “sales increase due to export expansion.” However, in countries other than Saudi Arabia, 50-60% of companies mentioned “export expansion” as the reason for
improvement, but in Saudi Arabia, the percentage of such companies was low, at a little less than 30%, and the percentage of companies that cited “improvement of production
efficiency” was also high, at 50-60%.
In all countries, the largest reason for deterioration cited was “sales decrease in local markets” (57.7% for the entire region). The second reasons were “sales decrease due to export
slowdown” and “increase of labor costs” for the entire region (a little more than 20% for both), but by country, the reasons were varied, with 50% of companies in Turkey citing “effects
of exchange rate fluctuation,” 33.3% of those in Saudi Arabia mentioning “increase of labor costs” and “increase of procurement costs,” and 29.4% of those in UAE choosing “sales
decrease due to export slowdown.”
Reasons 2016 operating profit forecasts improve
Reasons 2016 operating profit forecasts deteriorate
N=77
N=26
(%)
(%)
74.0
51.9
14.3 6.5 6.5
5.2 5.2 3.9 18.2
68.8
50.0
25.0 18.8
6.3 6.3
18.8
0.0
25.0
93.8
25.0
0.0
6.3
25.0
0.0 0.0 0.0
18.8
68.9 62.2
15.6
2.2 0.0
6.7 2.2
6.7 15.6
0102030405060708090
100
Entire region Turkey Saudi Arabia United Arab Emirates
Sales increase in
local markets
Sales increase due
to export expansion
Improvement of
sales efficiency
Reduction of labor
costs
Improvement of
production
efficiency
Effects of exchange
rate fluctuation
Reduction of
procurement costs
Reduction of other
expenditures (e.g., administrative/
utility costs/fuel costs)
Other
57.7
23.1 23.1 19.2
15.4 15.4 7.7
0.0
26.9
50.0
16.7
33.3 33.3
50.0
33.3
16.7
0.0
16.7
66.7
0.0
33.3
0.0 0.0 0.0
33.3
0.0
33.3
58.8
29.4
17.6 17.6
5.9 11.8
0.0 0.0
29.4
0
10
20
30
40
50
60
70
80 Entire region Turkey Saudi Arabia United Arab Emirates
Sales decrease in
local markets
Sales decrease due to
export slowdown
Increase of labor
costs
Increase of other
expenditures (e.g., administrative/
utility costs/fuel costs
Effects of exchange
rate fluctuation
Production costs
insufficiently shifted
to selling price of
goods
Increase of
procurement costs
Rising interest rates Other
10 Copyright © 2016 JETRO. All rights reserved. Reproduction without permission is prohibited.
Multiple answers allowed

Figure 7. Business Expansion in the Next One or Two Years (1)
Asked about their approach to business development over the next one to two years from 2015, more than 60% of companies in each country
replied that they planned to expand their business. If companies that replied that they would maintain the status quo (about 30%) are included,
almost all companies expected that they planned to expand their business or maintain the status quo. However, 5.7% of companies in Turkey
chose to reduce their business, highlighting the difference between Turkey and other countries.
Business operations in the next one or two years
Entire region
(N=186)
Turkey (N=35)
Saudi Arabia
(N=32)
United Arab
Emirates
(N=119)
67.7
65.7
68.8
68.1
30.6
28.6
31.3
31.1
1.6
5.7
0.0
0.8
0.0
0.0
0.0
0.0
0% 10% 20% 30% 40% 50% 60% 70% 80% 90% 100%
Expansion Remaining the same Reduction Transferring to a third country/region or withdrawal from current local market
11
Copyright © 2016 JETRO. All rights reserved. Reproduction without permission is prohibited.

Figure 8. Business Expansion in the Next One or Two Years (2)
Reasons for expansion
Functions to be expanded
The two major reasons for expansion were “high growth potential” and “sales increase,” each of which accounted for 60-70% of the companies surveyed. The third largest reason for
many companies was “reviewing production and distribution networks” for Turkey and UAE and “high receptivity for high-value added products” for Saudi Arabia.
An overwhelming percentage of companies planned to expand their “sales function” (50% to a little less than 90%). By country, the second and lower reasons were “production (high-
value added products)” and “production (ubiquitous products)” for Turkey (26.1% each), “production (high-value added products)” for Saudi Arabia (28.6%), and “function of regional
headquarters” for UAE (25.3%), indicating that the reasons varied from one country to another.
N=126
(%)
(%)
N=123
68.3 67.5
23.0 20.6 17.5
5.6 3.2 0.0 6.3
65.2 60.9
26.1 17.4 17.4
0.0
8.7
0.0 0.0
59.1
77.3
4.5 9.1
27.3
4.5 0.0 0.0
4.5
71.6 66.7
27.2 24.7
14.8 7.4
2.5 0.0 8.6
0
10
20
30
40
50
60
70
80
90 Entire region Turkey Saudi Arabia United Arab Emirates
High growth
potential
Sales increase Reviewing
production and
distribution
networks
Relationship with
clients
High receptivity
for high-value
added products
Deregulation
Reduction of costs (e.g., procurement/
labor costs)
Ease in securing
labor force
Other
75.6
17.1 17.1 15.4 9.8 8.9
2.4
13.0
52.2
0.0
13.0
26.1 26.1
4.3 4.3
21.7
57.1
4.8
14.3
28.6
14.3 14.3
0.0
23.8
87.3
25.3 19.0
8.9 3.8
8.9 2.5
7.6
0
10
20
30
40
50
60
70
80
90Entire region Turkey Saudi Arabia United Arab Emirates
Sales function Function of regional
headquarters
Logistics function Production (high-
value added
products)
Production
(ubiquitous products)
Administrative
functions in
providing services (e.g., shared service
center, call center)
R&D Other
12
Copyright © 2016 JETRO. All rights reserved. Reproduction without permission is prohibited.
Multiple answers allowed

Figure 9. Management Localization (1)
Approaches to management localization
In terms of approaches to management localization, the percentages of three replies were largest in all countries: “strengthen systems to train/cultivate local human
resources” (54.0% for the entire region), “encourage mid-level hiring activities to obtain competent local staff” (44.4%), and “assign local staff to a general
manager/manager position” (40.6%).
The percentages of the top three approaches were high in all countries, but those of approaches in lower ranks varied from one country to another. A look at the
characteristics of each country indicated that while in Saudi Arabia the percentage of “reform personnel systems, such as a merit-based promotion system by focusing on
localization of corporate management” was high (33.3%) compared to other countries, the replies of companies in UAE reflected the degree to which the duty to employ
people of the country was imposed, as they cited “strengthen authority in local office to allow them to make their own decisions for sales strategies” and “no particular
actions are taken” (19.3% each).
N=187
(%)
54.0
44.4 40.6
21.9
17.6 15.5 13.9 13.4
9.1
2.1 4.8
57.1
45.7
40.0
20.0 22.9
8.6
2.9
11.4
17.1
2.9
8.6
66.7
51.5 48.5
33.3
21.2
9.1 6.1
9.1
15.2
6.1
15.2
49.6
42.0 38.7
19.3 15.1
19.3 19.3 15.1
5.0 0.8 0.8
0
10
20
30
40
50
60
70
80Entire region Turkey Saudi Arabia United Arab Emirates
Strengthen systems
to train/cultivate
local human
resources by
focusing on
localization of
corporate
management
Encourage mid-
level hiring
activities to obtain
competent local
staff by focusing
on localization of
corporate
management
Assign local staff
to a general
manager/
manager position
Reform
personnel
systems, such as
a merit-based
promotion
system, by
focusing on
localization of
corporate
management
Strengthen R&D
capacity to
develop quality
of products/
services for local
markets
Strengthen
authority in local
office to allow
them to make their
own decisions for
sales strategies
No particular
actions are taken
Delegate
authority to local
office from
headquarters
Assign local staff
to an executive
position
Obtain human
resources/
management
resources
through M&As
Other
13
Copyright © 2016 JETRO. All rights reserved. Reproduction without permission is prohibited.
Multiple answers allowed

Figure 10. Management Localization (2)
Asked about challenges in management localization, the largest percentage of companies cited “insufficient performance/awareness among local
staff” (43.2% for the entire region), followed by companies that mentioned “difficulty in recruiting local candidates for executive positions” (39.3%).
In Saudi Arabia, however, the percentage of companies that chose the two answers was as high as about 60% (59.4%), suggesting that they were the
challenges shared by companies that operated in the country.
Apart from the top two challenges, a look at the characteristics of each country showed that in Turkey the percentage of “little progress in delegating
authority from the headquarters to local offices” was high, at 25.7%, and in Saudi Arabia that of “a high turnover rate of local candidates for
executive positions” and “difficulty in reducing the number of Japanese expatriate staff” was high, at 25.0% each. One characteristic of UAE is that
the percentages of all replies except the top two were equalized, as none of them exceeded 20%.
N=183
(%)
43.2 39.3
18.6 17.5 16.4
13.7 12.6 9.8 8.7 8.2 7.1 7.1
6.0 5.5 5.5 4.9 2.2
51.4
40.0
25.7
8.6
22.9 22.9 20.0
2.9 2.9
11.4 14.3
8.6
2.9 8.6
14.3 11.4
2.9
59.4 59.4
15.6
25.0 25.0
6.3
12.5
3.1 3.1
12.5 9.4
3.1 6.3
12.5
6.3 3.1
6.3
36.2 33.6
17.2 18.1
12.1 12.9
10.3
13.8 12.1
6.0 4.3
7.8 6.9
2.6 2.6 3.4
0.9
0
10
20
30
40
50
60
70Entire region Turkey Saudi Arabai United Arab Emirates
Insufficient
performance/
awareness among
local staff
Difficulty in
recruiting local
candidates for
executive
positions
Little progress
in delegating
authority from
the
headquarters to
local offices
A high turnover
rate of local
candidates for
executive
positions
Difficulty in
reducing the
number of
Japanese
expatriate staff
Insufficient
capabilities for
local planning
and marketing
Insufficient
management
capabilities of
Japanese
expatriate staff
No plan for
promoting
management
localization
There is no
particular
issue
Inadequate
language skills
of Japanese
expatriate staff
(English and
local languages)
Shortage of
positions to be
allocated to
local staff
Insufficient
capabilities to
develop local
products and
services
Disagreement
over policy for
recruitment
between local
office and
headquarters
Other issues
with the
headquarters/
Japan side
Other issues with
the local side
Inadequate
language skills
of local staff
(Japanese and
English)
Other
14 Copyright © 2016 JETRO. All rights reserved. Reproduction without permission is prohibited.
Challenges in localization
Multiple answers allowed

Figure 11. Changes in Human Resource Structures (1)
Changes in the number of local employees over the past year
Future plans
A look at the changes in the number of local employees during the past year showed that the percentage of companies that had seen the number increase was
38.9% and that of those whose number had remained at almost the same level was 51.4%. By country, while more than 40% of companies in Turkey and Saudi
Arabia replied that the number had increased, the percentage of such companies in UAE remained at 35.6%. In Saudi Arabia, on the other hand, the percentage
of companies replying that the number had decreased was 18.8%, more than double that for Turkey (8.6%) and UAE (7.6%).
In terms of future plans, the percentage of “increase” (60.7%) exceeded that of “no change” (35.5%) with that of “decrease” being small, at 3.8%. By country,
the percentage of companies in Saudi Arabia that answered, “Increase,” was largest among the three countries, at about 70%, and that of companies that
answered, “Decrease,” was smallest among the three, at 3.0%. On the other hand, the percentage of “increase” for Turkey (45.7%) was smallest among the
three, and that of “decrease” (5.7%) was largest. This indicated that in the future, companies in Saudi Arabia would be most active in hiring local employees
and that those in Turkey would be relatively cautious.
Entire region
(N=185)
Turkey (N=35) Saudi Arabia
(N=32)
United Arab
Emirates (N=118)
Entire region
(N=183)
Turkey (N=35) Saudi Arabia
(N=33)
United Arab
Emirates (N=115)
38.9
45.7
43.8
35.6
51.4
45.7
37.5
56.8
9.7
8.6
18.8
7.6
0% 10% 20% 30% 40% 50% 60% 70% 80% 90% 100%
Increase No change Decrease
60.7
45.7
69.7
62.6
35.5
48.6
27.3
33.9
3.8
5.7
3.0
3.5
0% 10% 20% 30% 40% 50% 60% 70% 80% 90% 100%
Increase No change Decrease
15
Copyright © 2016 JETRO. All rights reserved. Reproduction without permission is prohibited.

Figure 12. Changes in Human Resource Structures (2)
At look at the changes in the number of Japanese expatriate employees during the past year showed that the percentage of “no change” was 66.7%, that of “increase” was
21.1%, and that of “decrease” was 12.2%. By country, in terms of the percentage of companies replying that the number had increased, there was no major difference
among the three as the percentage stood at a little more than 20% in each, but the percentage of companies in Saudi Arabia replying that the number had decreased was
largest, at 21.9%, followed by UAE (10.6%) and Turkey (8.6%), and this highlighted a greater decrease for Saudi Arabia.
Asked about future plans, 71.2% of companies answered, “No change,” 20.3% replied, “Increase,” and 8.5% said, “Decrease.” By country, the percentage of companies
in Turkey replying that they planned to increase the number of Japanese expatriate employees was largest, at 28.6%, followed by Saudi Arabia (24.2%) and UAE
(16.5%). On the other hand, the percentage of companies in Saudi Arabia replying that they planned to decrease the number was largest, 21.2%, four times that for
Turkey (5.7%) and UAE (5.5%). In particular, for Saudi Arabia, the percentage of companies replying that they planned to decrease Japanese expatriate employees was
remarkably high.
Changes in the number of Japanese expatriate employees over the past year
Future plans
Entire region
(N=180)
Turkey (N=35)
Saudi Arabia
(N=32)
United Arab
Emirates (N=113)
Entire region
(N=177) Turkey (N=35)
Saudi Arabia
(N=33)
United Arab
Emirates (N=109)
21.1
22.9
21.9
20.4
66.7
68.6
56.3
69.0
12.2
8.6
21.9
10.6
0% 10% 20% 30% 40% 50% 60% 70% 80% 90% 100%
Increase No change Decrease
20.3
28.6
24.2
16.5
71.2
65.7
54.5
78.0
8.5
5.7
21.2
5.5
0% 10% 20% 30% 40% 50% 60% 70% 80% 90% 100%
Increase No change Decrease
16
Copyright © 2016 JETRO. All rights reserved. Reproduction without permission is prohibited.

Figure 13. Investment Environment (United Arab Emirates Only)
• Overall, more than half of companies cited as the advantages of the investment environment in UAE “merits of tax systems (no corporate tax and no income tax)” (78.2%), “free zone (no regulation for
foreign investment and one-stop service)” (70.6%), “political/social stability” (63/0%), and “good living environment for Japanese expatriates” (59.7%). In the non-manufacturing industries, companies
generally gave almost the same replies as mentioned above, but manufacturers favorably evaluated “market scale or growth potential” (66.7%) and “sufficient infrastructures (electricity, distribution and
telecommunication, etc.” (50.0%) while the percentage of companies that chose “political/social stability” was low, at only 16.7%.
• A large percentage of companies cited “increase of real estate rental fees” (64.1%) and “increase of labor costs” (59.8%) as the disadvantages of the investment environment in UAE, irrespective of whether
they were in the manufacturing or non-manufacturing industries. One characteristic of manufacturers was that the percentage of those which mentioned “political/social instability” was high, at 66.7%. In
the manufacturing industry, “transaction risks (such as debt collecting risk)” (33.3%) and “regulations for foreign investment” (16.7%) were also cited by many firms as problematic.
• (Note) (1) This survey was carried out only for companies operating in UAE. (2) Since non-manufacturing industries account for an extremely high percentage of all industries in UAE, the survey results
generally indicate the same trends as for the non-manufacturing industries.
Advantages of the investment environment in UAE
(%)
(%)
78.2 70.6
63.0 59.7
46.2 43.7 42.0
28.6 22.7 21.0
8.4 5.9 2.5 1.7
83.3 83.3
16.7
50.0
33.3
50.0
66.7
33.3
16.7 16.7
0.0 0.0 0.0 0.0
77.9 69.9
65.5 60.2
46.9 43.4 40.7
28.3 23.0 21.2
8.8 6.2 2.7 1.8
0102030405060708090
All industries Manufacturing industry Non-manufacturing industries
64.1 59.8
45.3 41.9
28.2 23.9
17.1 16.2 14.5 13.7
3.4 0.9 0.9 5.1
66.7
50.0
33.3
16.7 16.7
33.3
66.7
0.0
16.7
0.0 0.0 0.0 0.0 0.0
64.0 60.4
45.9 43.2
28.8 23.4
14.4 17.1 14.4 14.4
3.6 0.9 0.9 5.4
0
10
20
30
40
50
60
70
80
All industries Manufacturing industry Non-manufacturing industries
Merits of tax
systems
(No corporate tax
and no income tax)
Free zone
(No regulation for
foreign investment
and one-stop service)
Political/social
stability
Good living
environment for
Japanese
expatriates
Less linguistic/
communication
problems
Sufficient
infrastructures (electricity,
distribution and
telecommunication,
etc.
Market scale or
growth potential
Positive image
regarding Japan
Formation of local
industrial clusters
by relevant
companies (client
companies etc.)
No labor dispute Sufficient labor
supply
Quick
administrative
procedures
Good incentives
for investment
Other
Increase of real
estate rental fees
Increase of labor
costs
Increase of
administrative
commissions
Underdeveloped
legal system or
unclear legal
system operation
Slow
administrative
procedures
Transaction risks
(such as debt
collecting risk)
Political/social
instability
Labor shortage or
difficulty in
recruiting
Regulations for
foreign investment
Market scale or
growth potential
Insufficient
infrastructures
(electricity,
distribution and
telecommunication,
etc.)
Insufficient
incentives for
investment
Linguistic/
communication
problems
Other
Disadvantages of the investment environment in UAE
N=117
(including 6 manufacturers)
N=119
(including 6 manufacturers)
17
Copyright © 2016 JETRO. All rights reserved. Reproduction without permission is prohibited.
Multiple answers allowed

Copyright © 2016 JETRO. All rights reserved. Reproduction without permission is prohibited.
Any use of information in this report shall be at the user’s discretion and under its own
responsibility. JETRO makes every effort to provide accurate information and data. However,
JETRO cannot be held liable whatsoever for damages or losses arising from the use of
information in this report.
Middle East and Africa Division
Overseas Research Department
Japan External Trade Organization (JETRO)
1-12-32 Akasaka, Minato-ku, Tokyo, 107-6006
Tel: +81-3-3582-5180
Fax: +81-3-3587-2485
Email: [email protected]


![Rotor 90 [.pdf 15.7 Mb]](https://img.pdfslide.net/doc/110x75/586ce1f41a28abf6518bbde9/rotor-90-pdf-157-mb.jpg)
![ดาวน์โหลด [15.7 Mb.]](https://img.pdfslide.net/doc/110x75/588c553b1a28abe9208b5126/-157-mb.jpg)