Embed Size (px)
Citation preview
Jimmy R. Willis
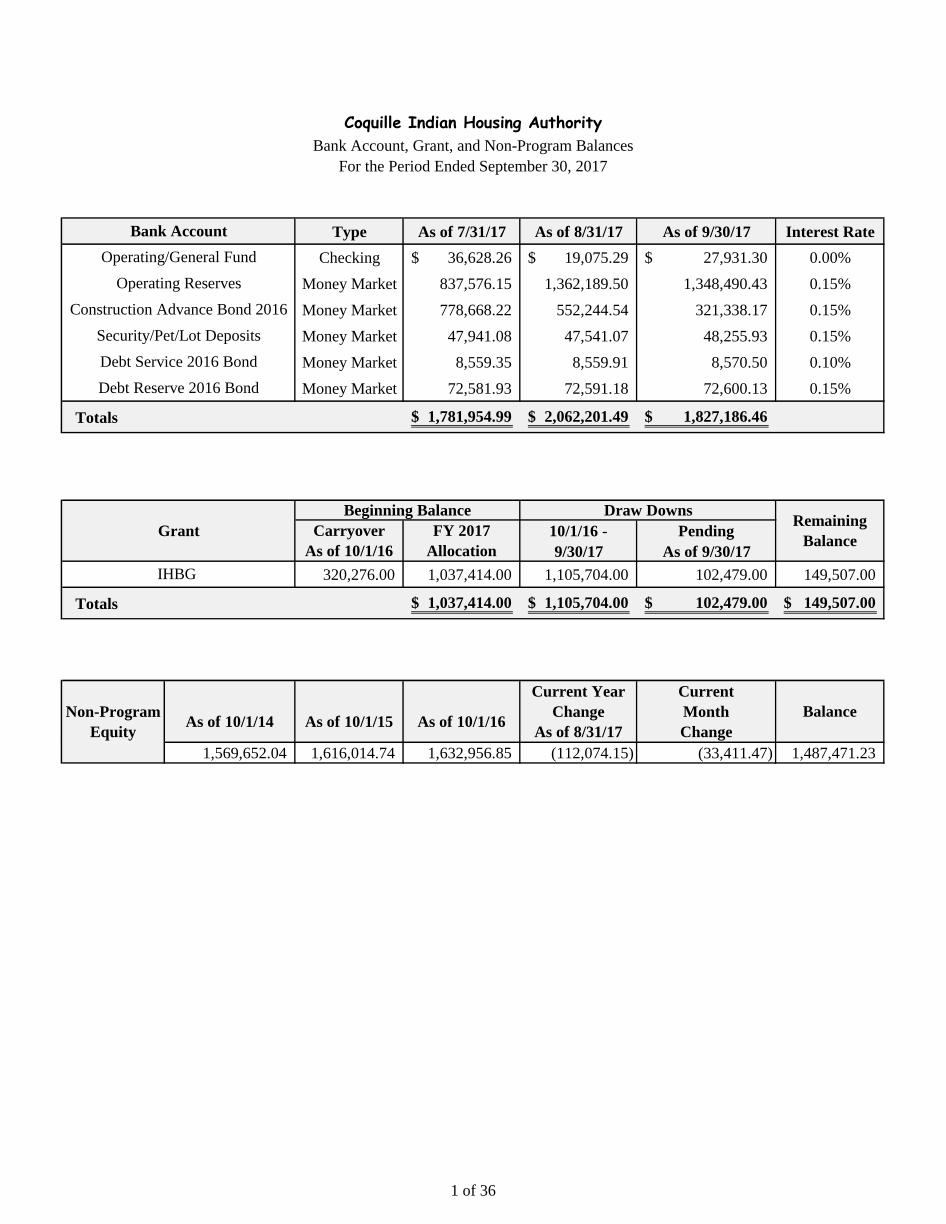
Type As of 7/31/17 As of 8/31/17 As of 9/30/17 Interest Rate
Checking 36,628.26$ 19,075.29$ 27,931.30$ 0.00%
Money Market 837,576.15 1,362,189.50 1,348,490.43 0.15%
Money Market 778,668.22 552,244.54 321,338.17 0.15%
Money Market 47,941.08 47,541.07 48,255.93 0.15%
Money Market 8,559.35 8,559.91 8,570.50 0.10%
Money Market 72,581.93 72,591.18 72,600.13 0.15%
Totals 1,781,954.99$ 2,062,201.49$ 1,827,186.46$
10/1/16 - Pending
9/30/17 As of 9/30/17
320,276.00 1,037,414.00 1,105,704.00 102,479.00 149,507.00
Totals 1,037,414.00$ 1,105,704.00$ 102,479.00$ 149,507.00$
1,569,652.04 1,616,014.74 1,632,956.85 (112,074.15) (33,411.47) 1,487,471.23
Coquille Indian Housing Authority
Bank Account, Grant, and Non-Program Balances
For the Period Ended September 30, 2017
Bank Account
Operating/General Fund
Operating Reserves
Construction Advance Bond 2016
Security/Pet/Lot Deposits
Grant FY 2017
Allocation
Carryover
As of 10/1/16
Beginning Balance
Debt Service 2016 Bond
Debt Reserve 2016 Bond
Draw DownsRemaining
Balance
BalanceNon-Program
EquityAs of 10/1/14
IHBG
As of 10/1/15 As of 10/1/16
Current Year
Change
As of 8/31/17
Current
Month
Change
1 of 36
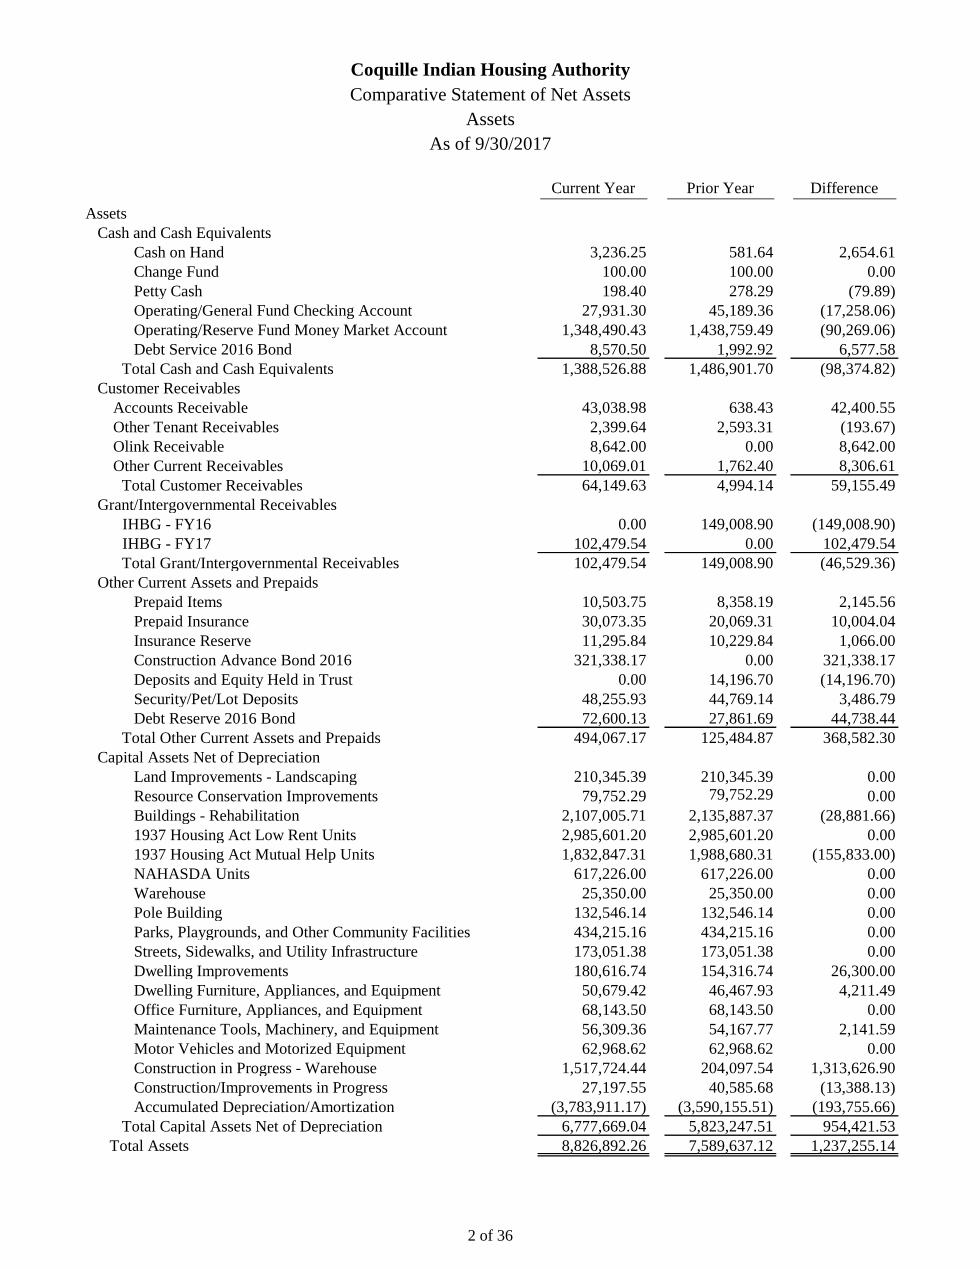
Current Year Prior Year Difference
Assets
Cash and Cash Equivalents
Cash on Hand 3,236.25 581.64 2,654.61
Change Fund 100.00 100.00 0.00
Petty Cash 198.40 278.29 (79.89)
Operating/General Fund Checking Account 27,931.30 45,189.36 (17,258.06)
Operating/Reserve Fund Money Market Account 1,348,490.43 1,438,759.49 (90,269.06)
Debt Service 2016 Bond 8,570.50 1,992.92 6,577.58
Total Cash and Cash Equivalents 1,388,526.88 1,486,901.70 (98,374.82)
Customer Receivables
Accounts Receivable 43,038.98 638.43 42,400.55
Other Tenant Receivables 2,399.64 2,593.31 (193.67)
Olink Receivable 8,642.00 0.00 8,642.00
Other Current Receivables 10,069.01 1,762.40 8,306.61
Total Customer Receivables 64,149.63 4,994.14 59,155.49
Grant/Intergovernmental Receivables
IHBG - FY16 0.00 149,008.90 (149,008.90)
IHBG - FY17 102,479.54 0.00 102,479.54
Total Grant/Intergovernmental Receivables 102,479.54 149,008.90 (46,529.36)
Other Current Assets and Prepaids
Prepaid Items 10,503.75 8,358.19 2,145.56
Prepaid Insurance 30,073.35 20,069.31 10,004.04
Insurance Reserve 11,295.84 10,229.84 1,066.00
Construction Advance Bond 2016 321,338.17 0.00 321,338.17
Deposits and Equity Held in Trust 0.00 14,196.70 (14,196.70)
Security/Pet/Lot Deposits 48,255.93 44,769.14 3,486.79
Debt Reserve 2016 Bond 72,600.13 27,861.69 44,738.44
Total Other Current Assets and Prepaids 494,067.17 125,484.87 368,582.30
Capital Assets Net of Depreciation
Land Improvements - Landscaping 210,345.39 210,345.39 0.00
Resource Conservation Improvements 79,752.29 79,752.29 0.00
Buildings - Rehabilitation 2,107,005.71 2,135,887.37 (28,881.66)
1937 Housing Act Low Rent Units 2,985,601.20 2,985,601.20 0.00
1937 Housing Act Mutual Help Units 1,832,847.31 1,988,680.31 (155,833.00)
NAHASDA Units 617,226.00 617,226.00 0.00
Warehouse 25,350.00 25,350.00 0.00
Pole Building 132,546.14 132,546.14 0.00
Parks, Playgrounds, and Other Community Facilities 434,215.16 434,215.16 0.00
Streets, Sidewalks, and Utility Infrastructure 173,051.38 173,051.38 0.00
Dwelling Improvements 180,616.74 154,316.74 26,300.00
Dwelling Furniture, Appliances, and Equipment 50,679.42 46,467.93 4,211.49
Office Furniture, Appliances, and Equipment 68,143.50 68,143.50 0.00
Maintenance Tools, Machinery, and Equipment 56,309.36 54,167.77 2,141.59
Motor Vehicles and Motorized Equipment 62,968.62 62,968.62 0.00
Construction in Progress - Warehouse 1,517,724.44 204,097.54 1,313,626.90
Construction/Improvements in Progress 27,197.55 40,585.68 (13,388.13)
Accumulated Depreciation/Amortization (3,783,911.17) (3,590,155.51) (193,755.66)
Total Capital Assets Net of Depreciation 6,777,669.04 5,823,247.51 954,421.53
Total Assets 8,826,892.26 7,589,637.12 1,237,255.14
Coquille Indian Housing Authority
Comparative Statement of Net Assets
Assets
As of 9/30/2017
2 of 36
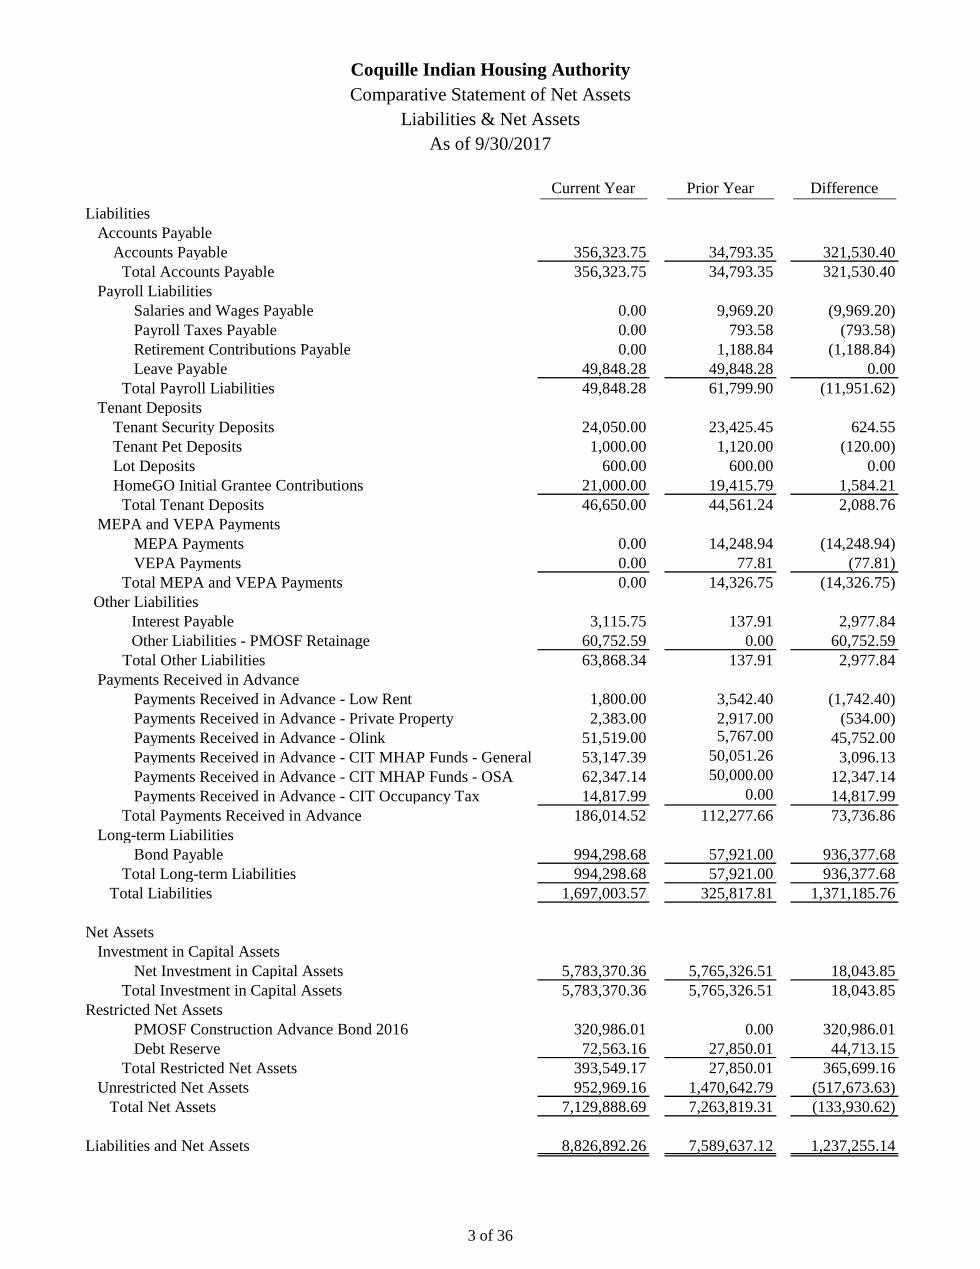
Current Year Prior Year Difference
Liabilities
Accounts Payable
Accounts Payable 356,323.75 34,793.35 321,530.40
Total Accounts Payable 356,323.75 34,793.35 321,530.40
Payroll Liabilities
Salaries and Wages Payable 0.00 9,969.20 (9,969.20)
Payroll Taxes Payable 0.00 793.58 (793.58)
Retirement Contributions Payable 0.00 1,188.84 (1,188.84)
Leave Payable 49,848.28 49,848.28 0.00
Total Payroll Liabilities 49,848.28 61,799.90 (11,951.62)
Tenant Deposits
Tenant Security Deposits 24,050.00 23,425.45 624.55
Tenant Pet Deposits 1,000.00 1,120.00 (120.00)
Lot Deposits 600.00 600.00 0.00
HomeGO Initial Grantee Contributions 21,000.00 19,415.79 1,584.21
Total Tenant Deposits 46,650.00 44,561.24 2,088.76
MEPA and VEPA Payments
MEPA Payments 0.00 14,248.94 (14,248.94)
VEPA Payments 0.00 77.81 (77.81)
Total MEPA and VEPA Payments 0.00 14,326.75 (14,326.75)
Other Liabilities
Interest Payable 3,115.75 137.91 2,977.84
Other Liabilities - PMOSF Retainage 60,752.59 0.00 60,752.59
Total Other Liabilities 63,868.34 137.91 2,977.84
Payments Received in Advance
Payments Received in Advance - Low Rent 1,800.00 3,542.40 (1,742.40)
Payments Received in Advance - Private Property 2,383.00 2,917.00 (534.00)
Payments Received in Advance - Olink 51,519.00 5,767.00 45,752.00
Payments Received in Advance - CIT MHAP Funds - General 53,147.39 50,051.26 3,096.13
Payments Received in Advance - CIT MHAP Funds - OSA 62,347.14 50,000.00 12,347.14
Payments Received in Advance - CIT Occupancy Tax 14,817.99 0.00 14,817.99
Total Payments Received in Advance 186,014.52 112,277.66 73,736.86
Long-term Liabilities
Bond Payable 994,298.68 57,921.00 936,377.68
Total Long-term Liabilities 994,298.68 57,921.00 936,377.68
Total Liabilities 1,697,003.57 325,817.81 1,371,185.76
Net Assets
Investment in Capital Assets
Net Investment in Capital Assets 5,783,370.36 5,765,326.51 18,043.85
Total Investment in Capital Assets 5,783,370.36 5,765,326.51 18,043.85
Restricted Net Assets
PMOSF Construction Advance Bond 2016 320,986.01 0.00 320,986.01
Debt Reserve 72,563.16 27,850.01 44,713.15
Total Restricted Net Assets 393,549.17 27,850.01 365,699.16
Unrestricted Net Assets 952,969.16 1,470,642.79 (517,673.63)
Total Net Assets 7,129,888.69 7,263,819.31 (133,930.62)
Liabilities and Net Assets 8,826,892.26 7,589,637.12 1,237,255.14
Comparative Statement of Net Assets
Coquille Indian Housing Authority
Liabilities & Net Assets
As of 9/30/2017
3 of 36
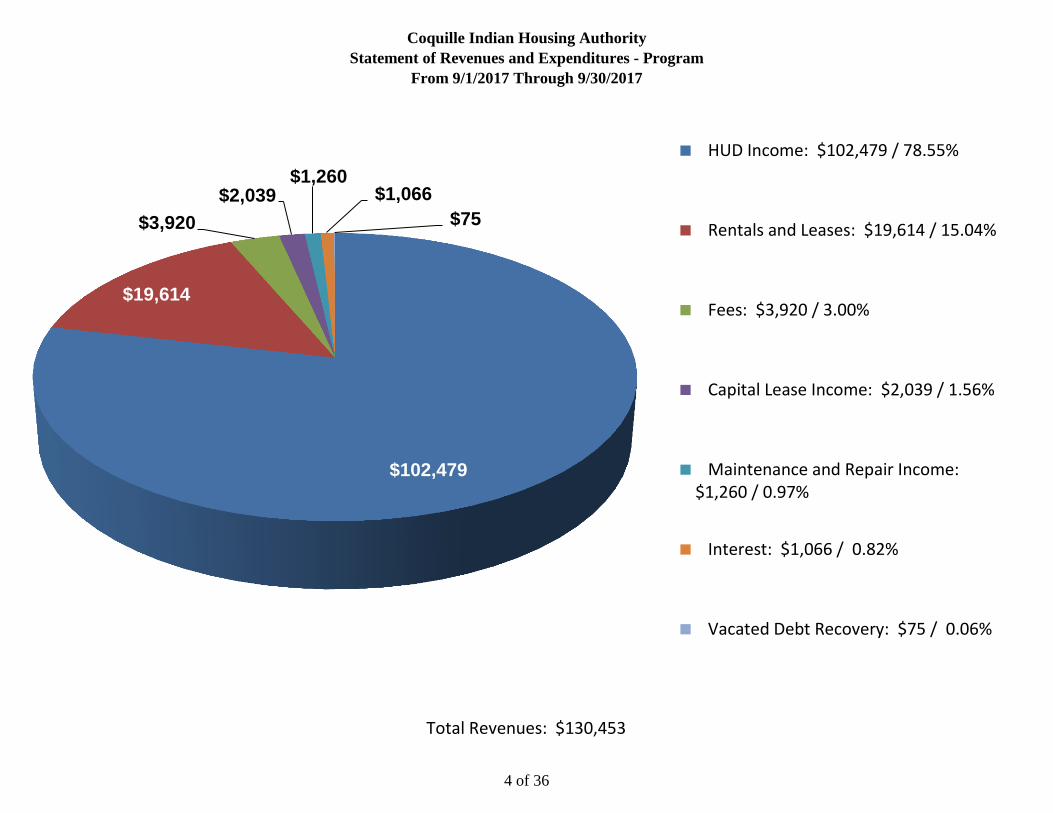
Coquille Indian Housing Authority
Statement of Revenues and Expenditures - Program
From 9/1/2017 Through 9/30/2017
Total Revenues: $130,453
$102,479
$19,614
$3,920
$2,039 $1,260
$1,066
$75
HUD Income: $102,479 / 78.55%
Rentals and Leases: $19,614 / 15.04%
Fees: $3,920 / 3.00%
Capital Lease Income: $2,039 / 1.56%
Maintenance and Repair Income:$1,260 / 0.97%
Interest: $1,066 / 0.82%
Vacated Debt Recovery: $75 / 0.06%
4 of 36
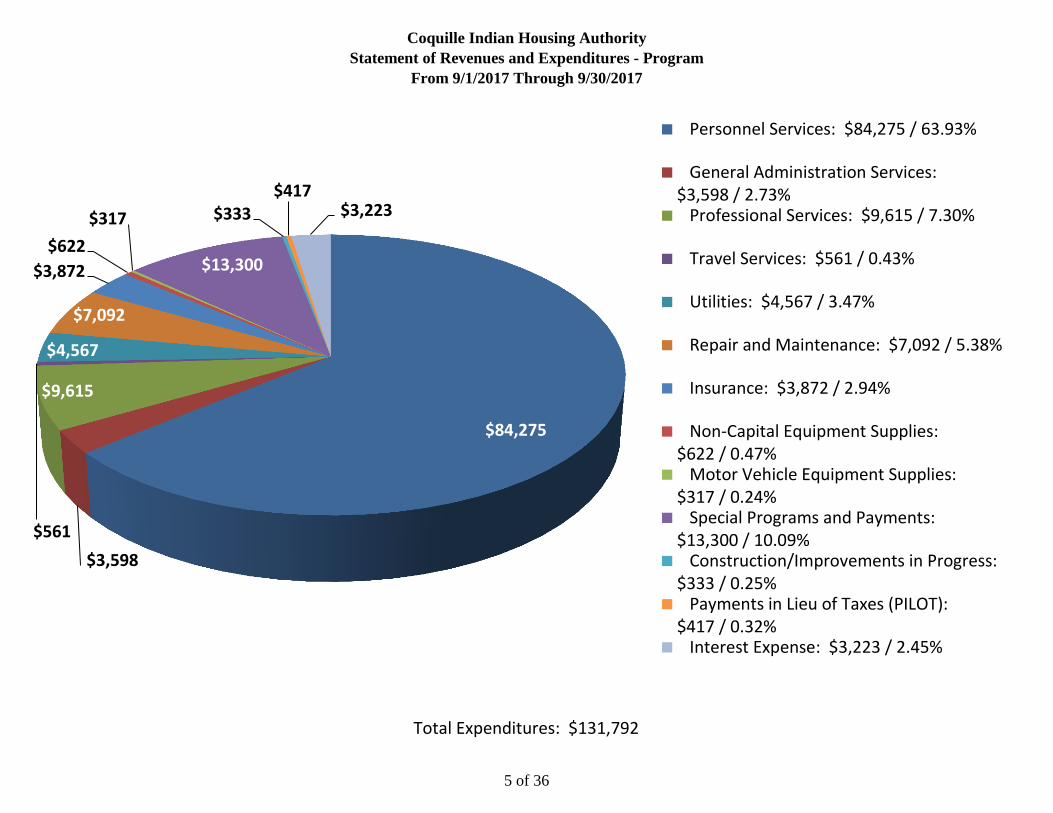
Coquille Indian Housing Authority
Statement of Revenues and Expenditures - Program
From 9/1/2017 Through 9/30/2017
Total Expenditures: $131,792
$84,275
$3,598
$9,615
$561
$4,567
$7,092
$3,872
$622
$317
$13,300
$333 $417
$3,223
Personnel Services: $84,275 / 63.93%
General Administration Services:$3,598 / 2.73% Professional Services: $9,615 / 7.30%
Travel Services: $561 / 0.43%
Utilities: $4,567 / 3.47%
Repair and Maintenance: $7,092 / 5.38%
Insurance: $3,872 / 2.94%
Non-Capital Equipment Supplies:$622 / 0.47% Motor Vehicle Equipment Supplies:$317 / 0.24% Special Programs and Payments:$13,300 / 10.09% Construction/Improvements in Progress:$333 / 0.25% Payments in Lieu of Taxes (PILOT):$417 / 0.32% Interest Expense: $3,223 / 2.45%
5 of 36
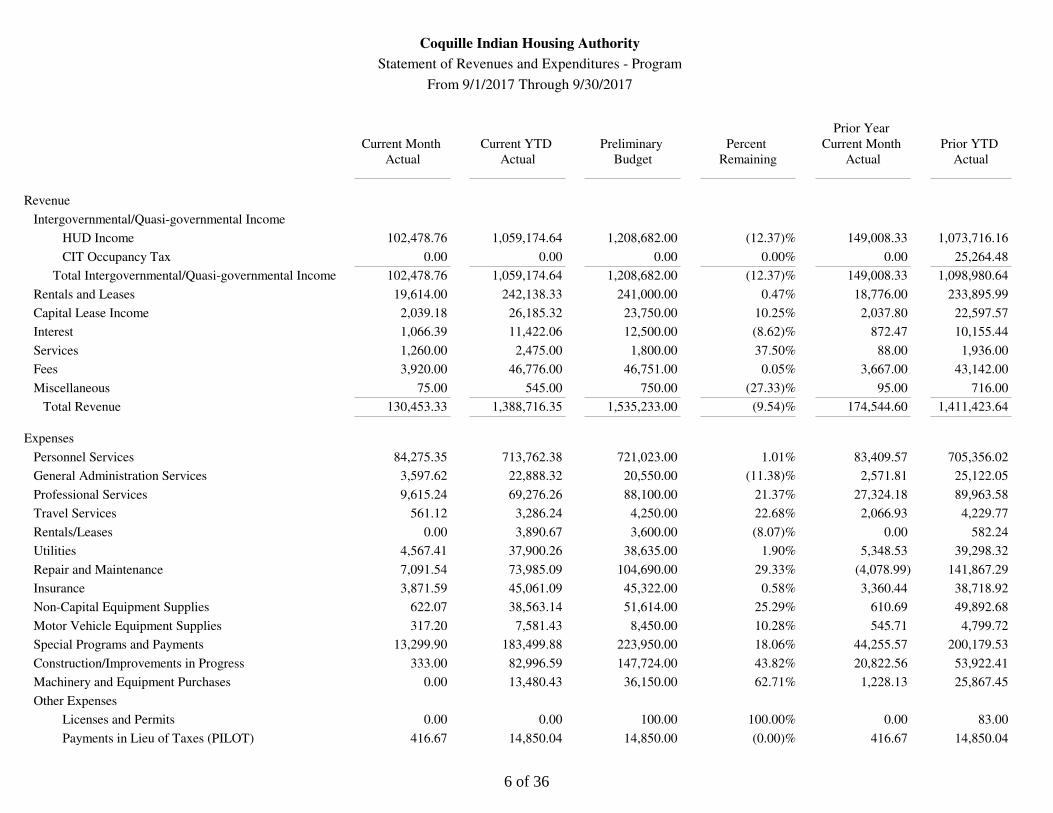
Coquille Indian Housing Authority
Statement of Revenues and Expenditures - Program
From 9/1/2017 Through 9/30/2017
Actual
Current Month
Actual
Current YTD
Budget
Preliminary
Remaining
Percent
Actual
Current Month
Prior Year
Actual
Prior YTD
Revenue
Intergovernmental/Quasi-governmental Income
HUD Income 102,478.76 1,059,174.64 1,208,682.00 (12.37)% 149,008.33 1,073,716.16
CIT Occupancy Tax 0.00 0.00 0.00 0.00% 0.00 25,264.48
Total Intergovernmental/Quasi-governmental Income 102,478.76 1,059,174.64 1,208,682.00 (12.37)% 149,008.33 1,098,980.64
Rentals and Leases 19,614.00 242,138.33 241,000.00 0.47% 18,776.00 233,895.99
Capital Lease Income 2,039.18 26,185.32 23,750.00 10.25% 2,037.80 22,597.57
Interest 1,066.39 11,422.06 12,500.00 (8.62)% 872.47 10,155.44
Services 1,260.00 2,475.00 1,800.00 37.50% 88.00 1,936.00
Fees 3,920.00 46,776.00 46,751.00 0.05% 3,667.00 43,142.00
Miscellaneous 75.00 545.00 750.00 (27.33)% 95.00 716.00
Total Revenue 130,453.33 1,388,716.35 1,535,233.00 (9.54)% 174,544.60 1,411,423.64
Expenses
Personnel Services 84,275.35 713,762.38 721,023.00 1.01% 83,409.57 705,356.02
General Administration Services 3,597.62 22,888.32 20,550.00 (11.38)% 2,571.81 25,122.05
Professional Services 9,615.24 69,276.26 88,100.00 21.37% 27,324.18 89,963.58
Travel Services 561.12 3,286.24 4,250.00 22.68% 2,066.93 4,229.77
Rentals/Leases 0.00 3,890.67 3,600.00 (8.07)% 0.00 582.24
Utilities 4,567.41 37,900.26 38,635.00 1.90% 5,348.53 39,298.32
Repair and Maintenance 7,091.54 73,985.09 104,690.00 29.33% (4,078.99) 141,867.29
Insurance 3,871.59 45,061.09 45,322.00 0.58% 3,360.44 38,718.92
Non-Capital Equipment Supplies 622.07 38,563.14 51,614.00 25.29% 610.69 49,892.68
Motor Vehicle Equipment Supplies 317.20 7,581.43 8,450.00 10.28% 545.71 4,799.72
Special Programs and Payments 13,299.90 183,499.88 223,950.00 18.06% 44,255.57 200,179.53
Construction/Improvements in Progress 333.00 82,996.59 147,724.00 43.82% 20,822.56 53,922.41
Machinery and Equipment Purchases 0.00 13,480.43 36,150.00 62.71% 1,228.13 25,867.45
Other Expenses
Licenses and Permits 0.00 0.00 100.00 100.00% 0.00 83.00
Payments in Lieu of Taxes (PILOT) 416.67 14,850.04 14,850.00 (0.00)% 416.67 14,850.04
6 of 36
Coquille Indian Housing Authority
Statement of Revenues and Expenditures - Program
From 9/1/2017 Through 9/30/2017
Actual
Current Month
Actual
Current YTD
Budget
Preliminary
Remaining
Percent
Actual
Current Month
Prior Year
Actual
Prior YTD
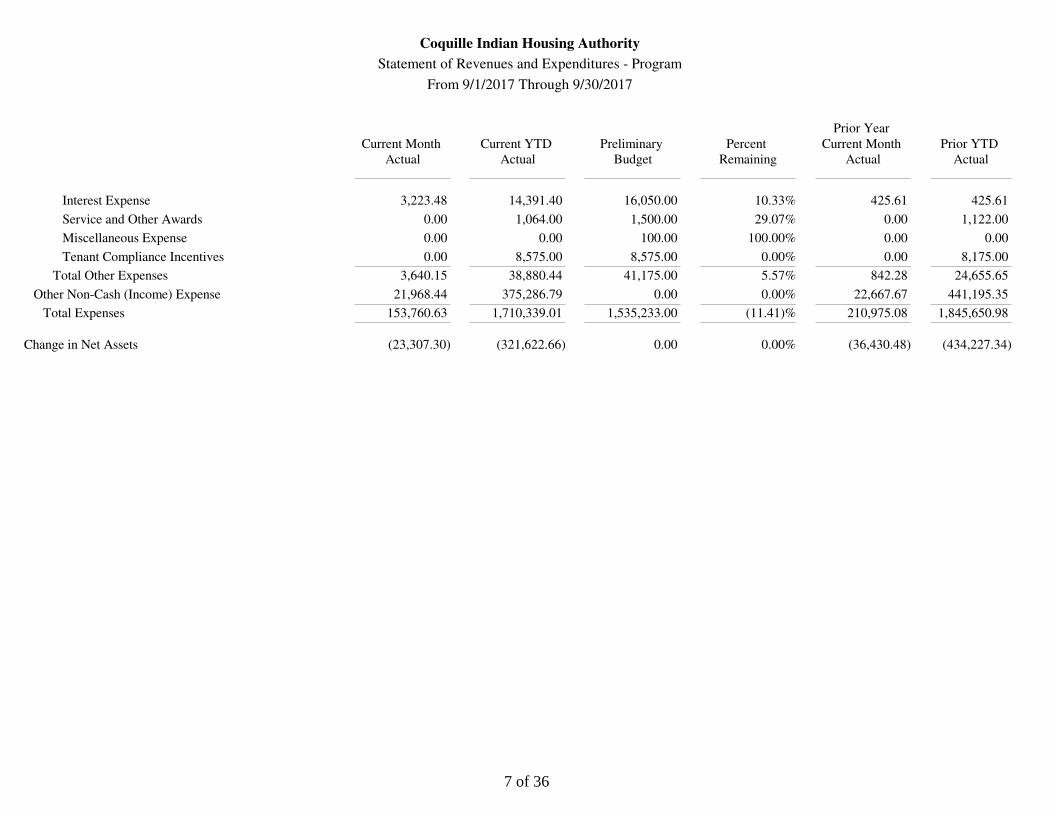
Interest Expense 3,223.48 14,391.40 16,050.00 10.33% 425.61 425.61
Service and Other Awards 0.00 1,064.00 1,500.00 29.07% 0.00 1,122.00
Miscellaneous Expense 0.00 0.00 100.00 100.00% 0.00 0.00
Tenant Compliance Incentives 0.00 8,575.00 8,575.00 0.00% 0.00 8,175.00
Total Other Expenses 3,640.15 38,880.44 41,175.00 5.57% 842.28 24,655.65
Other Non-Cash (Income) Expense 21,968.44 375,286.79 0.00 0.00% 22,667.67 441,195.35
Total Expenses 153,760.63 1,710,339.01 1,535,233.00 (11.41)% 210,975.08 1,845,650.98
Change in Net Assets (23,307.30) (321,622.66) 0.00 0.00% (36,430.48) (434,227.34)
7 of 36
Coquille Indian Housing Authority
Statement of Revenues and Expenditures - Program
From 9/1/2017 Through 9/30/2017
Actual
Current Month
Actual
Current YTD
Budget
Preliminary
Remaining
Percent
Actual
Current Month
Prior Year
Actual
Prior YTD
Revenue
Intergovernmental/Quasi-governmental Income
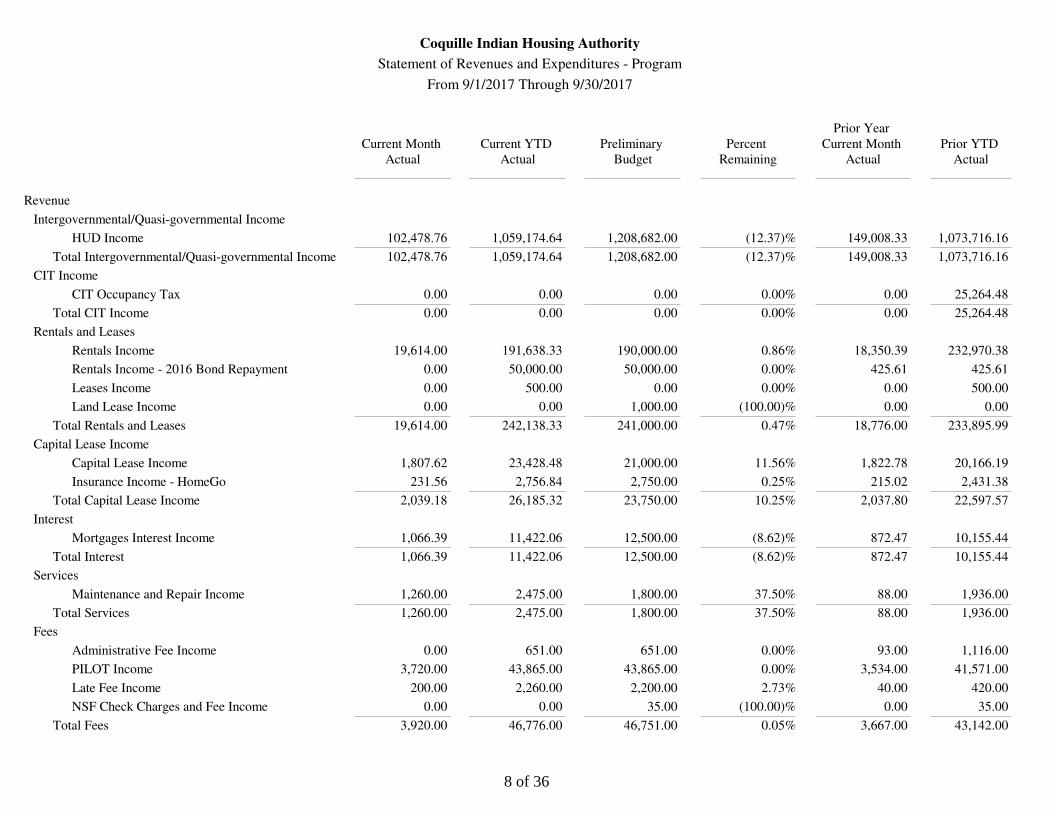
HUD Income 102,478.76 1,059,174.64 1,208,682.00 (12.37)% 149,008.33 1,073,716.16
Total Intergovernmental/Quasi-governmental Income 102,478.76 1,059,174.64 1,208,682.00 (12.37)% 149,008.33 1,073,716.16
CIT Income
CIT Occupancy Tax 0.00 0.00 0.00 0.00% 0.00 25,264.48
Total CIT Income 0.00 0.00 0.00 0.00% 0.00 25,264.48
Rentals and Leases
Rentals Income 19,614.00 191,638.33 190,000.00 0.86% 18,350.39 232,970.38
Rentals Income - 2016 Bond Repayment 0.00 50,000.00 50,000.00 0.00% 425.61 425.61
Leases Income 0.00 500.00 0.00 0.00% 0.00 500.00
Land Lease Income 0.00 0.00 1,000.00 (100.00)% 0.00 0.00
Total Rentals and Leases 19,614.00 242,138.33 241,000.00 0.47% 18,776.00 233,895.99
Capital Lease Income
Capital Lease Income 1,807.62 23,428.48 21,000.00 11.56% 1,822.78 20,166.19
Insurance Income - HomeGo 231.56 2,756.84 2,750.00 0.25% 215.02 2,431.38
Total Capital Lease Income 2,039.18 26,185.32 23,750.00 10.25% 2,037.80 22,597.57
Interest
Mortgages Interest Income 1,066.39 11,422.06 12,500.00 (8.62)% 872.47 10,155.44
Total Interest 1,066.39 11,422.06 12,500.00 (8.62)% 872.47 10,155.44
Services
Maintenance and Repair Income 1,260.00 2,475.00 1,800.00 37.50% 88.00 1,936.00
Total Services 1,260.00 2,475.00 1,800.00 37.50% 88.00 1,936.00
Fees
Administrative Fee Income 0.00 651.00 651.00 0.00% 93.00 1,116.00
PILOT Income 3,720.00 43,865.00 43,865.00 0.00% 3,534.00 41,571.00
Late Fee Income 200.00 2,260.00 2,200.00 2.73% 40.00 420.00
NSF Check Charges and Fee Income 0.00 0.00 35.00 (100.00)% 0.00 35.00
Total Fees 3,920.00 46,776.00 46,751.00 0.05% 3,667.00 43,142.00
8 of 36
Coquille Indian Housing Authority
Statement of Revenues and Expenditures - Program
From 9/1/2017 Through 9/30/2017
Actual
Current Month
Actual
Current YTD
Budget
Preliminary
Remaining
Percent
Actual
Current Month
Prior Year
Actual
Prior YTD
Other Sources of Funds
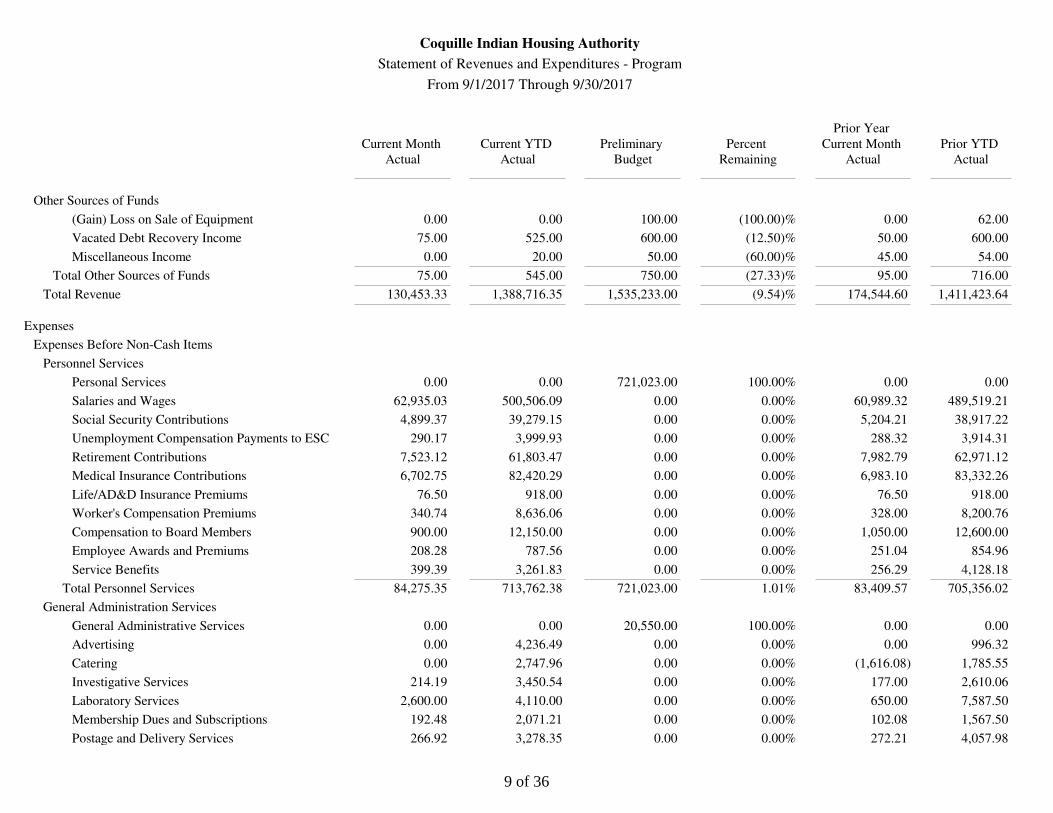
(Gain) Loss on Sale of Equipment 0.00 0.00 100.00 (100.00)% 0.00 62.00
Vacated Debt Recovery Income 75.00 525.00 600.00 (12.50)% 50.00 600.00
Miscellaneous Income 0.00 20.00 50.00 (60.00)% 45.00 54.00
Total Other Sources of Funds 75.00 545.00 750.00 (27.33)% 95.00 716.00
Total Revenue 130,453.33 1,388,716.35 1,535,233.00 (9.54)% 174,544.60 1,411,423.64
Expenses
Expenses Before Non-Cash Items
Personnel Services
Personal Services 0.00 0.00 721,023.00 100.00% 0.00 0.00
Salaries and Wages 62,935.03 500,506.09 0.00 0.00% 60,989.32 489,519.21
Social Security Contributions 4,899.37 39,279.15 0.00 0.00% 5,204.21 38,917.22
Unemployment Compensation Payments to ESC 290.17 3,999.93 0.00 0.00% 288.32 3,914.31
Retirement Contributions 7,523.12 61,803.47 0.00 0.00% 7,982.79 62,971.12
Medical Insurance Contributions 6,702.75 82,420.29 0.00 0.00% 6,983.10 83,332.26
Life/AD&D Insurance Premiums 76.50 918.00 0.00 0.00% 76.50 918.00
Worker's Compensation Premiums 340.74 8,636.06 0.00 0.00% 328.00 8,200.76
Compensation to Board Members 900.00 12,150.00 0.00 0.00% 1,050.00 12,600.00
Employee Awards and Premiums 208.28 787.56 0.00 0.00% 251.04 854.96
Service Benefits 399.39 3,261.83 0.00 0.00% 256.29 4,128.18
Total Personnel Services 84,275.35 713,762.38 721,023.00 1.01% 83,409.57 705,356.02
General Administration Services
General Administrative Services 0.00 0.00 20,550.00 100.00% 0.00 0.00
Advertising 0.00 4,236.49 0.00 0.00% 0.00 996.32
Catering 0.00 2,747.96 0.00 0.00% (1,616.08) 1,785.55
Investigative Services 214.19 3,450.54 0.00 0.00% 177.00 2,610.06
Laboratory Services 2,600.00 4,110.00 0.00 0.00% 650.00 7,587.50
Membership Dues and Subscriptions 192.48 2,071.21 0.00 0.00% 102.08 1,567.50
Postage and Delivery Services 266.92 3,278.35 0.00 0.00% 272.21 4,057.98
9 of 36
Coquille Indian Housing Authority
Statement of Revenues and Expenditures - Program
From 9/1/2017 Through 9/30/2017
Actual
Current Month
Actual
Current YTD
Budget
Preliminary
Remaining
Percent
Actual
Current Month
Prior Year
Actual
Prior YTD
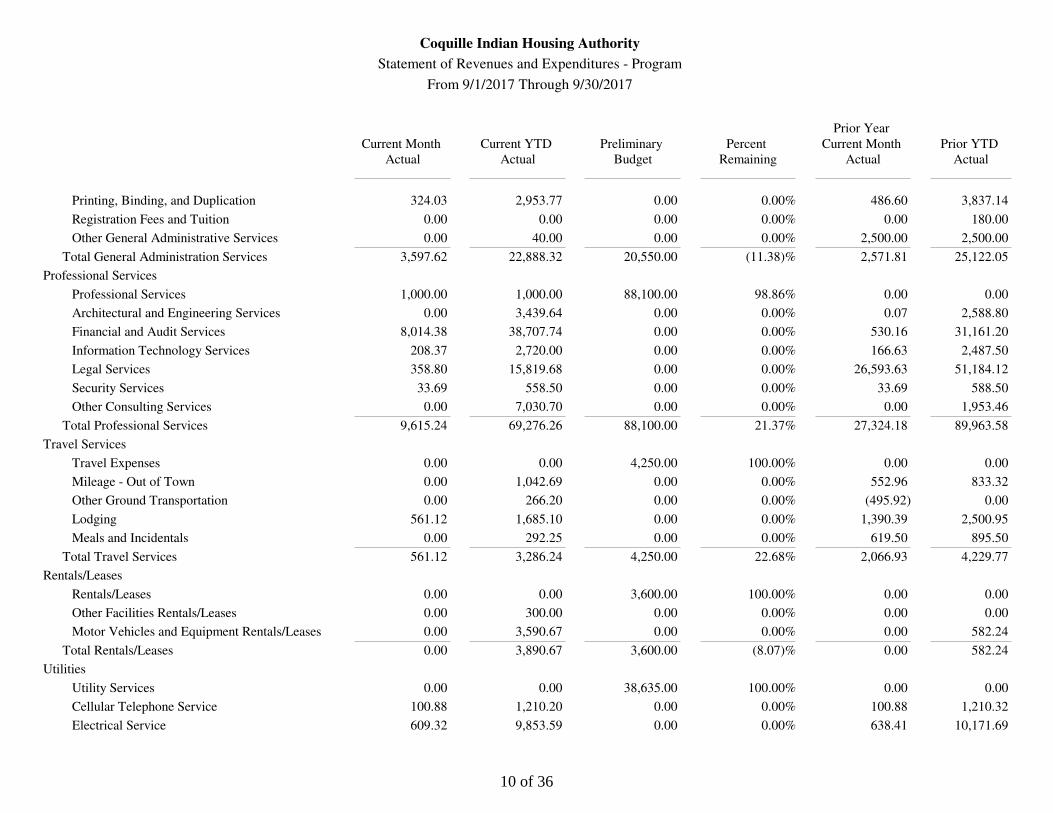
Printing, Binding, and Duplication 324.03 2,953.77 0.00 0.00% 486.60 3,837.14
Registration Fees and Tuition 0.00 0.00 0.00 0.00% 0.00 180.00
Other General Administrative Services 0.00 40.00 0.00 0.00% 2,500.00 2,500.00
Total General Administration Services 3,597.62 22,888.32 20,550.00 (11.38)% 2,571.81 25,122.05
Professional Services
Professional Services 1,000.00 1,000.00 88,100.00 98.86% 0.00 0.00
Architectural and Engineering Services 0.00 3,439.64 0.00 0.00% 0.07 2,588.80
Financial and Audit Services 8,014.38 38,707.74 0.00 0.00% 530.16 31,161.20
Information Technology Services 208.37 2,720.00 0.00 0.00% 166.63 2,487.50
Legal Services 358.80 15,819.68 0.00 0.00% 26,593.63 51,184.12
Security Services 33.69 558.50 0.00 0.00% 33.69 588.50
Other Consulting Services 0.00 7,030.70 0.00 0.00% 0.00 1,953.46
Total Professional Services 9,615.24 69,276.26 88,100.00 21.37% 27,324.18 89,963.58
Travel Services
Travel Expenses 0.00 0.00 4,250.00 100.00% 0.00 0.00
Mileage - Out of Town 0.00 1,042.69 0.00 0.00% 552.96 833.32
Other Ground Transportation 0.00 266.20 0.00 0.00% (495.92) 0.00
Lodging 561.12 1,685.10 0.00 0.00% 1,390.39 2,500.95
Meals and Incidentals 0.00 292.25 0.00 0.00% 619.50 895.50
Total Travel Services 561.12 3,286.24 4,250.00 22.68% 2,066.93 4,229.77
Rentals/Leases
Rentals/Leases 0.00 0.00 3,600.00 100.00% 0.00 0.00
Other Facilities Rentals/Leases 0.00 300.00 0.00 0.00% 0.00 0.00
Motor Vehicles and Equipment Rentals/Leases 0.00 3,590.67 0.00 0.00% 0.00 582.24
Total Rentals/Leases 0.00 3,890.67 3,600.00 (8.07)% 0.00 582.24
Utilities
Utility Services 0.00 0.00 38,635.00 100.00% 0.00 0.00
Cellular Telephone Service 100.88 1,210.20 0.00 0.00% 100.88 1,210.32
Electrical Service 609.32 9,853.59 0.00 0.00% 638.41 10,171.69
10 of 36
Coquille Indian Housing Authority
Statement of Revenues and Expenditures - Program
From 9/1/2017 Through 9/30/2017
Actual
Current Month
Actual
Current YTD
Budget
Preliminary
Remaining
Percent
Actual
Current Month
Prior Year
Actual
Prior YTD
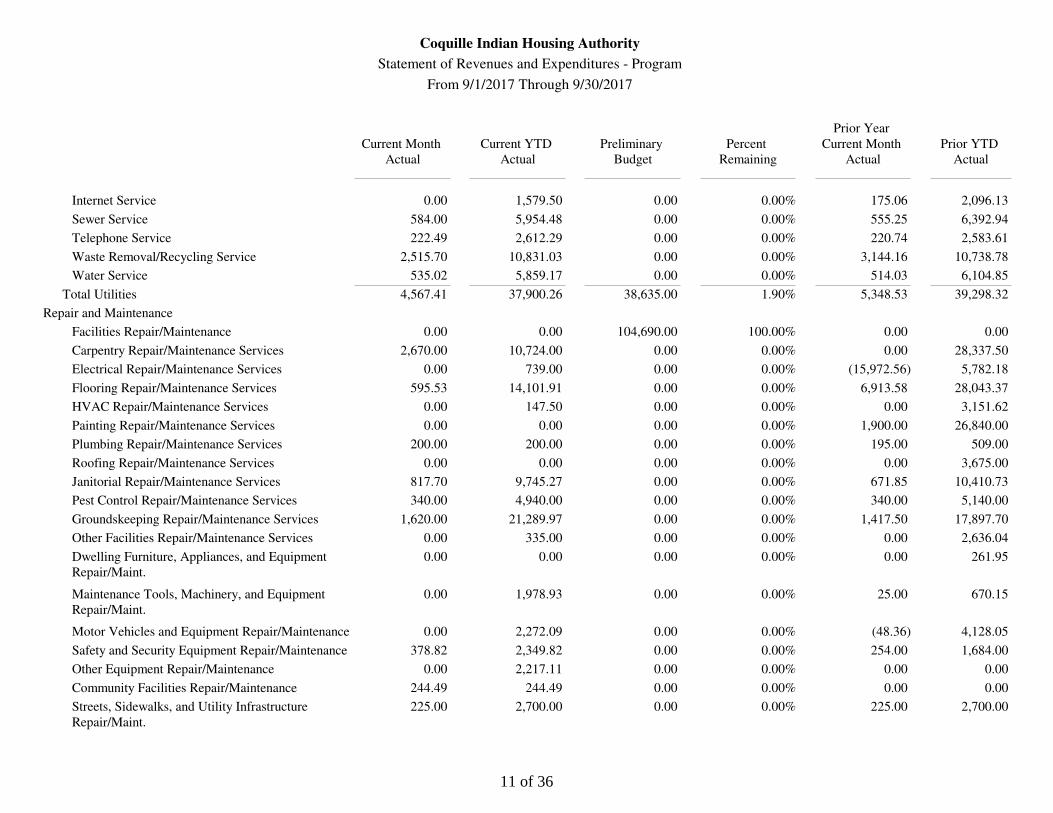
Internet Service 0.00 1,579.50 0.00 0.00% 175.06 2,096.13
Sewer Service 584.00 5,954.48 0.00 0.00% 555.25 6,392.94
Telephone Service 222.49 2,612.29 0.00 0.00% 220.74 2,583.61
Waste Removal/Recycling Service 2,515.70 10,831.03 0.00 0.00% 3,144.16 10,738.78
Water Service 535.02 5,859.17 0.00 0.00% 514.03 6,104.85
Total Utilities 4,567.41 37,900.26 38,635.00 1.90% 5,348.53 39,298.32
Repair and Maintenance
Facilities Repair/Maintenance 0.00 0.00 104,690.00 100.00% 0.00 0.00
Carpentry Repair/Maintenance Services 2,670.00 10,724.00 0.00 0.00% 0.00 28,337.50
Electrical Repair/Maintenance Services 0.00 739.00 0.00 0.00% (15,972.56) 5,782.18
Flooring Repair/Maintenance Services 595.53 14,101.91 0.00 0.00% 6,913.58 28,043.37
HVAC Repair/Maintenance Services 0.00 147.50 0.00 0.00% 0.00 3,151.62
Painting Repair/Maintenance Services 0.00 0.00 0.00 0.00% 1,900.00 26,840.00
Plumbing Repair/Maintenance Services 200.00 200.00 0.00 0.00% 195.00 509.00
Roofing Repair/Maintenance Services 0.00 0.00 0.00 0.00% 0.00 3,675.00
Janitorial Repair/Maintenance Services 817.70 9,745.27 0.00 0.00% 671.85 10,410.73
Pest Control Repair/Maintenance Services 340.00 4,940.00 0.00 0.00% 340.00 5,140.00
Groundskeeping Repair/Maintenance Services 1,620.00 21,289.97 0.00 0.00% 1,417.50 17,897.70
Other Facilities Repair/Maintenance Services 0.00 335.00 0.00 0.00% 0.00 2,636.04
Dwelling Furniture, Appliances, and Equipment
Repair/Maint.
0.00 0.00 0.00 0.00% 0.00 261.95
Maintenance Tools, Machinery, and Equipment
Repair/Maint.
0.00 1,978.93 0.00 0.00% 25.00 670.15
Motor Vehicles and Equipment Repair/Maintenance 0.00 2,272.09 0.00 0.00% (48.36) 4,128.05
Safety and Security Equipment Repair/Maintenance 378.82 2,349.82 0.00 0.00% 254.00 1,684.00
Other Equipment Repair/Maintenance 0.00 2,217.11 0.00 0.00% 0.00 0.00
Community Facilities Repair/Maintenance 244.49 244.49 0.00 0.00% 0.00 0.00
Streets, Sidewalks, and Utility Infrastructure
Repair/Maint.
225.00 2,700.00 0.00 0.00% 225.00 2,700.00
11 of 36
Coquille Indian Housing Authority
Statement of Revenues and Expenditures - Program
From 9/1/2017 Through 9/30/2017
Actual
Current Month
Actual
Current YTD
Budget
Preliminary
Remaining
Percent
Actual
Current Month
Prior Year
Actual
Prior YTD
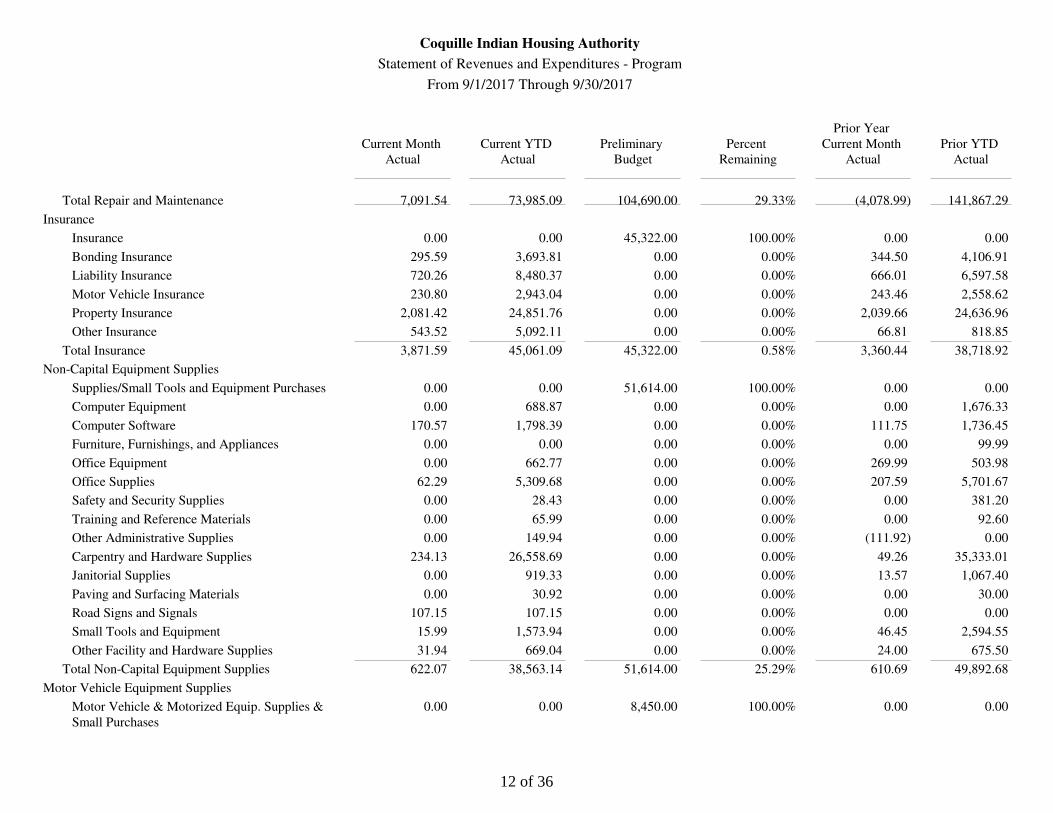
Total Repair and Maintenance 7,091.54 73,985.09 104,690.00 29.33% (4,078.99) 141,867.29
Insurance
Insurance 0.00 0.00 45,322.00 100.00% 0.00 0.00
Bonding Insurance 295.59 3,693.81 0.00 0.00% 344.50 4,106.91
Liability Insurance 720.26 8,480.37 0.00 0.00% 666.01 6,597.58
Motor Vehicle Insurance 230.80 2,943.04 0.00 0.00% 243.46 2,558.62
Property Insurance 2,081.42 24,851.76 0.00 0.00% 2,039.66 24,636.96
Other Insurance 543.52 5,092.11 0.00 0.00% 66.81 818.85
Total Insurance 3,871.59 45,061.09 45,322.00 0.58% 3,360.44 38,718.92
Non-Capital Equipment Supplies
Supplies/Small Tools and Equipment Purchases 0.00 0.00 51,614.00 100.00% 0.00 0.00
Computer Equipment 0.00 688.87 0.00 0.00% 0.00 1,676.33
Computer Software 170.57 1,798.39 0.00 0.00% 111.75 1,736.45
Furniture, Furnishings, and Appliances 0.00 0.00 0.00 0.00% 0.00 99.99
Office Equipment 0.00 662.77 0.00 0.00% 269.99 503.98
Office Supplies 62.29 5,309.68 0.00 0.00% 207.59 5,701.67
Safety and Security Supplies 0.00 28.43 0.00 0.00% 0.00 381.20
Training and Reference Materials 0.00 65.99 0.00 0.00% 0.00 92.60
Other Administrative Supplies 0.00 149.94 0.00 0.00% (111.92) 0.00
Carpentry and Hardware Supplies 234.13 26,558.69 0.00 0.00% 49.26 35,333.01
Janitorial Supplies 0.00 919.33 0.00 0.00% 13.57 1,067.40
Paving and Surfacing Materials 0.00 30.92 0.00 0.00% 0.00 30.00
Road Signs and Signals 107.15 107.15 0.00 0.00% 0.00 0.00
Small Tools and Equipment 15.99 1,573.94 0.00 0.00% 46.45 2,594.55
Other Facility and Hardware Supplies 31.94 669.04 0.00 0.00% 24.00 675.50
Total Non-Capital Equipment Supplies 622.07 38,563.14 51,614.00 25.29% 610.69 49,892.68
Motor Vehicle Equipment Supplies
Motor Vehicle & Motorized Equip. Supplies &
Small Purchases
0.00 0.00 8,450.00 100.00% 0.00 0.00
12 of 36
Coquille Indian Housing Authority
Statement of Revenues and Expenditures - Program
From 9/1/2017 Through 9/30/2017
Actual
Current Month
Actual
Current YTD
Budget
Preliminary
Remaining
Percent
Actual
Current Month
Prior Year
Actual
Prior YTD
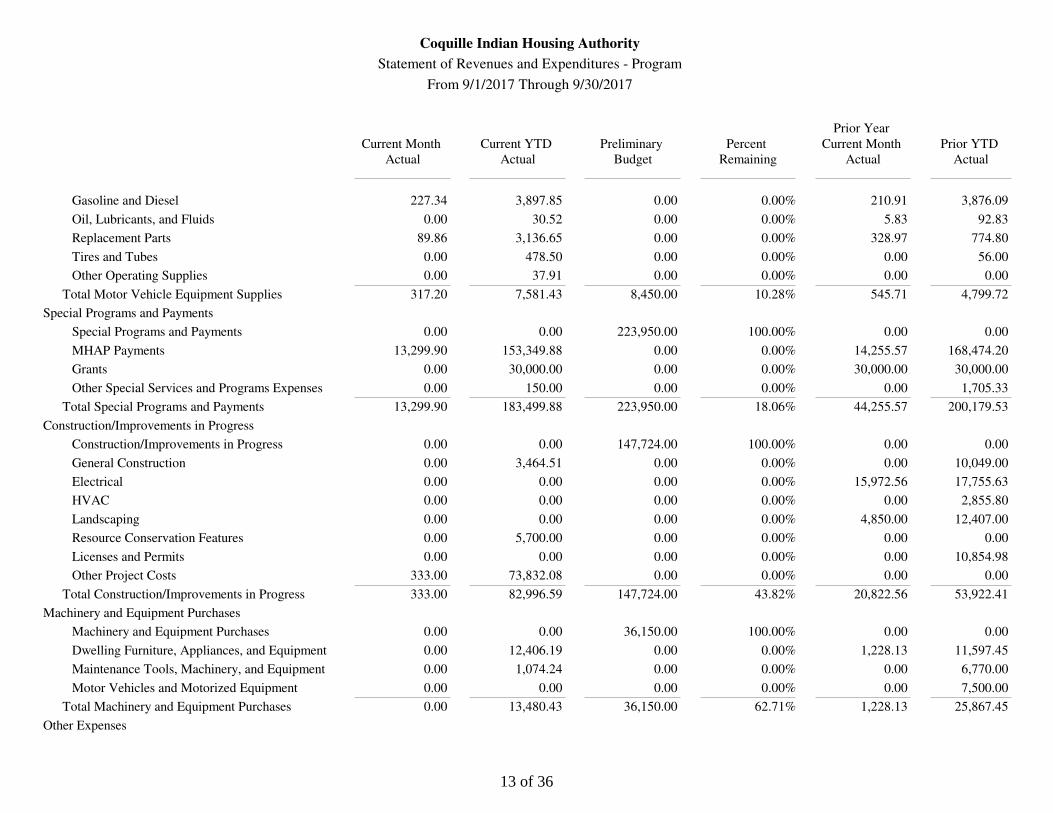
Gasoline and Diesel 227.34 3,897.85 0.00 0.00% 210.91 3,876.09
Oil, Lubricants, and Fluids 0.00 30.52 0.00 0.00% 5.83 92.83
Replacement Parts 89.86 3,136.65 0.00 0.00% 328.97 774.80
Tires and Tubes 0.00 478.50 0.00 0.00% 0.00 56.00
Other Operating Supplies 0.00 37.91 0.00 0.00% 0.00 0.00
Total Motor Vehicle Equipment Supplies 317.20 7,581.43 8,450.00 10.28% 545.71 4,799.72
Special Programs and Payments
Special Programs and Payments 0.00 0.00 223,950.00 100.00% 0.00 0.00
MHAP Payments 13,299.90 153,349.88 0.00 0.00% 14,255.57 168,474.20
Grants 0.00 30,000.00 0.00 0.00% 30,000.00 30,000.00
Other Special Services and Programs Expenses 0.00 150.00 0.00 0.00% 0.00 1,705.33
Total Special Programs and Payments 13,299.90 183,499.88 223,950.00 18.06% 44,255.57 200,179.53
Construction/Improvements in Progress
Construction/Improvements in Progress 0.00 0.00 147,724.00 100.00% 0.00 0.00
General Construction 0.00 3,464.51 0.00 0.00% 0.00 10,049.00
Electrical 0.00 0.00 0.00 0.00% 15,972.56 17,755.63
HVAC 0.00 0.00 0.00 0.00% 0.00 2,855.80
Landscaping 0.00 0.00 0.00 0.00% 4,850.00 12,407.00
Resource Conservation Features 0.00 5,700.00 0.00 0.00% 0.00 0.00
Licenses and Permits 0.00 0.00 0.00 0.00% 0.00 10,854.98
Other Project Costs 333.00 73,832.08 0.00 0.00% 0.00 0.00
Total Construction/Improvements in Progress 333.00 82,996.59 147,724.00 43.82% 20,822.56 53,922.41
Machinery and Equipment Purchases
Machinery and Equipment Purchases 0.00 0.00 36,150.00 100.00% 0.00 0.00
Dwelling Furniture, Appliances, and Equipment 0.00 12,406.19 0.00 0.00% 1,228.13 11,597.45
Maintenance Tools, Machinery, and Equipment 0.00 1,074.24 0.00 0.00% 0.00 6,770.00
Motor Vehicles and Motorized Equipment 0.00 0.00 0.00 0.00% 0.00 7,500.00
Total Machinery and Equipment Purchases 0.00 13,480.43 36,150.00 62.71% 1,228.13 25,867.45
Other Expenses
13 of 36
Coquille Indian Housing Authority
Statement of Revenues and Expenditures - Program
From 9/1/2017 Through 9/30/2017
Actual
Current Month
Actual
Current YTD
Budget
Preliminary
Remaining
Percent
Actual
Current Month
Prior Year
Actual
Prior YTD
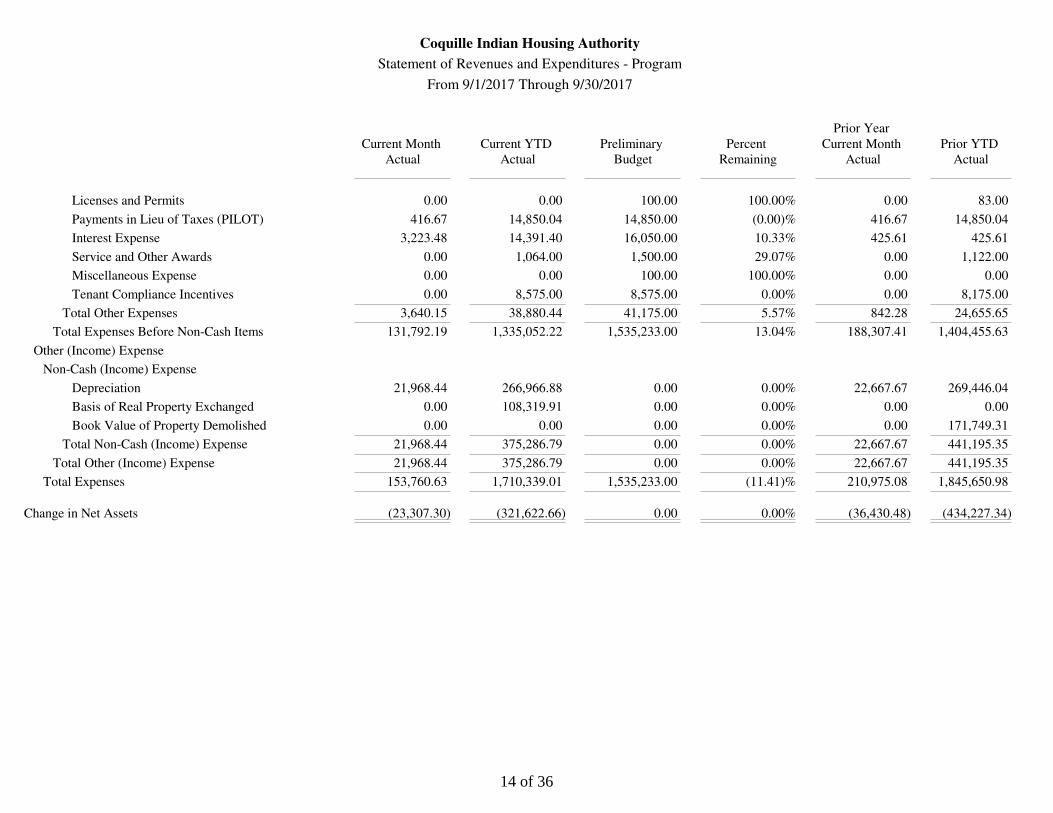
Licenses and Permits 0.00 0.00 100.00 100.00% 0.00 83.00
Payments in Lieu of Taxes (PILOT) 416.67 14,850.04 14,850.00 (0.00)% 416.67 14,850.04
Interest Expense 3,223.48 14,391.40 16,050.00 10.33% 425.61 425.61
Service and Other Awards 0.00 1,064.00 1,500.00 29.07% 0.00 1,122.00
Miscellaneous Expense 0.00 0.00 100.00 100.00% 0.00 0.00
Tenant Compliance Incentives 0.00 8,575.00 8,575.00 0.00% 0.00 8,175.00
Total Other Expenses 3,640.15 38,880.44 41,175.00 5.57% 842.28 24,655.65
Total Expenses Before Non-Cash Items 131,792.19 1,335,052.22 1,535,233.00 13.04% 188,307.41 1,404,455.63
Other (Income) Expense
Non-Cash (Income) Expense
Depreciation 21,968.44 266,966.88 0.00 0.00% 22,667.67 269,446.04
Basis of Real Property Exchanged 0.00 108,319.91 0.00 0.00% 0.00 0.00
Book Value of Property Demolished 0.00 0.00 0.00 0.00% 0.00 171,749.31
Total Non-Cash (Income) Expense 21,968.44 375,286.79 0.00 0.00% 22,667.67 441,195.35
Total Other (Income) Expense 21,968.44 375,286.79 0.00 0.00% 22,667.67 441,195.35
Total Expenses 153,760.63 1,710,339.01 1,535,233.00 (11.41)% 210,975.08 1,845,650.98
Change in Net Assets (23,307.30) (321,622.66) 0.00 0.00% (36,430.48) (434,227.34)
14 of 36
Coquille Indian Housing Authority
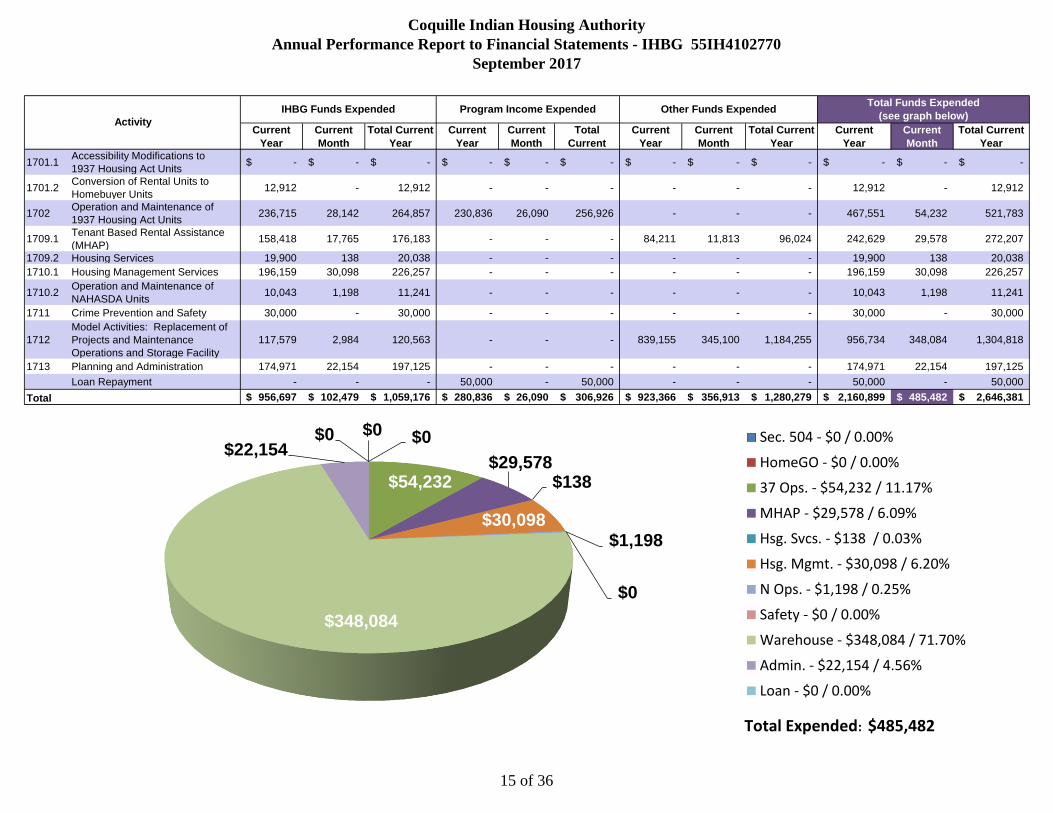
Annual Performance Report to Financial Statements - IHBG 55IH4102770
September 2017
Current
Year
Current
Month
Total Current
Year
Current
Year
Current
Month
Total
Current
Current
Year
Current
Month
Total Current
Year
Current
Year
Current
Month
Total Current
Year
1701.1Accessibility Modifications to
1937 Housing Act Units-$ -$ -$ -$ -$ -$ -$ -$ -$ -$ -$ -$
1701.2Conversion of Rental Units to
Homebuyer Units12,912 - 12,912 - - - - - - 12,912 - 12,912
1702Operation and Maintenance of
1937 Housing Act Units236,715 28,142 264,857 230,836 26,090 256,926 - - - 467,551 54,232 521,783
1709.1Tenant Based Rental Assistance
(MHAP)158,418 17,765 176,183 - - - 84,211 11,813 96,024 242,629 29,578 272,207
1709.2 Housing Services 19,900 138 20,038 - - - - - - 19,900 138 20,038
1710.1 Housing Management Services 196,159 30,098 226,257 - - - - - - 196,159 30,098 226,257
1710.2Operation and Maintenance of
NAHASDA Units10,043 1,198 11,241 - - - - - - 10,043 1,198 11,241
1711 Crime Prevention and Safety 30,000 - 30,000 - - - - - - 30,000 - 30,000
1712
Model Activities: Replacement of
Projects and Maintenance
Operations and Storage Facility
117,579 2,984 120,563 - - - 839,155 345,100 1,184,255 956,734 348,084 1,304,818
1713 Planning and Administration 174,971 22,154 197,125 - - - - - - 174,971 22,154 197,125
Loan Repayment - - - 50,000 - 50,000 - - - 50,000 - 50,000
Total 956,697$ 102,479$ 1,059,176$ 280,836$ 26,090$ 306,926$ 923,366$ 356,913$ 1,280,279$ 2,160,899$ 485,482$ 2,646,381$
IHBG Funds Expended Program Income Expended Other Funds Expended
Activity
Total Funds Expended
(see graph below)
$0 $0
$54,232 $29,578
$138
$30,098 $1,198
$0
$348,084
$22,154 $0 Sec. 504 - $0 / 0.00%
HomeGO - $0 / 0.00%
37 Ops. - $54,232 / 11.17%
MHAP - $29,578 / 6.09%
Hsg. Svcs. - $138 / 0.03%
Hsg. Mgmt. - $30,098 / 6.20%
N Ops. - $1,198 / 0.25%
Safety - $0 / 0.00%
Warehouse - $348,084 / 71.70%
Admin. - $22,154 / 4.56%
Loan - $0 / 0.00%
Total Expended: $485,482
15 of 36
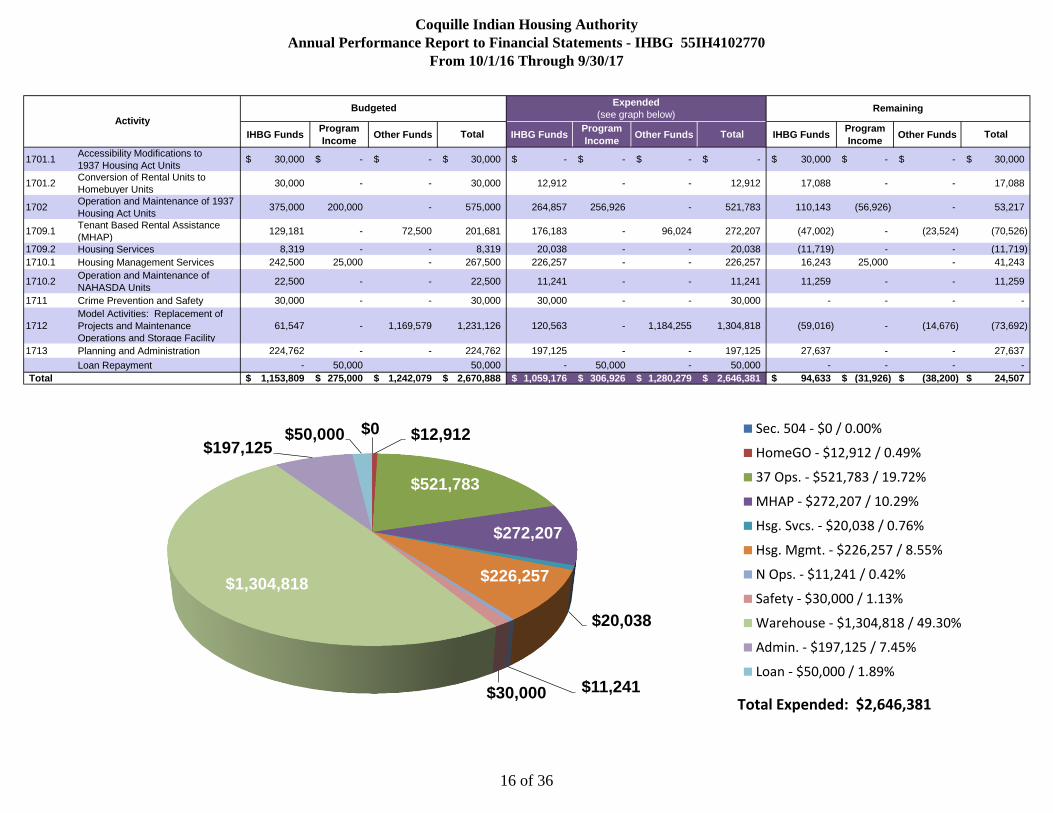
Coquille Indian Housing Authority
Annual Performance Report to Financial Statements - IHBG 55IH4102770
From 10/1/16 Through 9/30/17
IHBG FundsProgram
IncomeOther Funds Total IHBG Funds
Program
IncomeOther Funds Total IHBG Funds
Program
IncomeOther Funds Total
1701.1Accessibility Modifications to
1937 Housing Act Units30,000$ -$ -$ 30,000$ -$ -$ -$ -$ 30,000$ -$ -$ 30,000$
1701.2Conversion of Rental Units to
Homebuyer Units30,000 - - 30,000 12,912 - - 12,912 17,088 - - 17,088
1702Operation and Maintenance of 1937
Housing Act Units375,000 200,000 - 575,000 264,857 256,926 - 521,783 110,143 (56,926) - 53,217
1709.1Tenant Based Rental Assistance
(MHAP)129,181 - 72,500 201,681 176,183 - 96,024 272,207 (47,002) - (23,524) (70,526)
1709.2 Housing Services 8,319 - - 8,319 20,038 - - 20,038 (11,719) - - (11,719)
1710.1 Housing Management Services 242,500 25,000 - 267,500 226,257 - - 226,257 16,243 25,000 - 41,243
1710.2Operation and Maintenance of
NAHASDA Units22,500 - - 22,500 11,241 - - 11,241 11,259 - - 11,259
1711 Crime Prevention and Safety 30,000 - - 30,000 30,000 - - 30,000 - - - -
1712
Model Activities: Replacement of
Projects and Maintenance
Operations and Storage Facility
61,547 - 1,169,579 1,231,126 120,563 - 1,184,255 1,304,818 (59,016) - (14,676) (73,692)
1713 Planning and Administration 224,762 - - 224,762 197,125 - - 197,125 27,637 - - 27,637
Loan Repayment - 50,000 50,000 - 50,000 - 50,000 - - - -
Total 1,153,809$ 275,000$ 1,242,079$ 2,670,888$ 1,059,176$ 306,926$ 1,280,279$ 2,646,381$ 94,633$ (31,926)$ (38,200)$ 24,507$
-
Activity
BudgetedExpended
(see graph below)Remaining
$0 $12,912
$521,783
$272,207
$20,038
$226,257
$11,241 $30,000
$1,304,818
$197,125 $50,000 Sec. 504 - $0 / 0.00%
HomeGO - $12,912 / 0.49%
37 Ops. - $521,783 / 19.72%
MHAP - $272,207 / 10.29%
Hsg. Svcs. - $20,038 / 0.76%
Hsg. Mgmt. - $226,257 / 8.55%
N Ops. - $11,241 / 0.42%
Safety - $30,000 / 1.13%
Warehouse - $1,304,818 / 49.30%
Admin. - $197,125 / 7.45%
Loan - $50,000 / 1.89%
Total Expended: $2,646,381
16 of 36
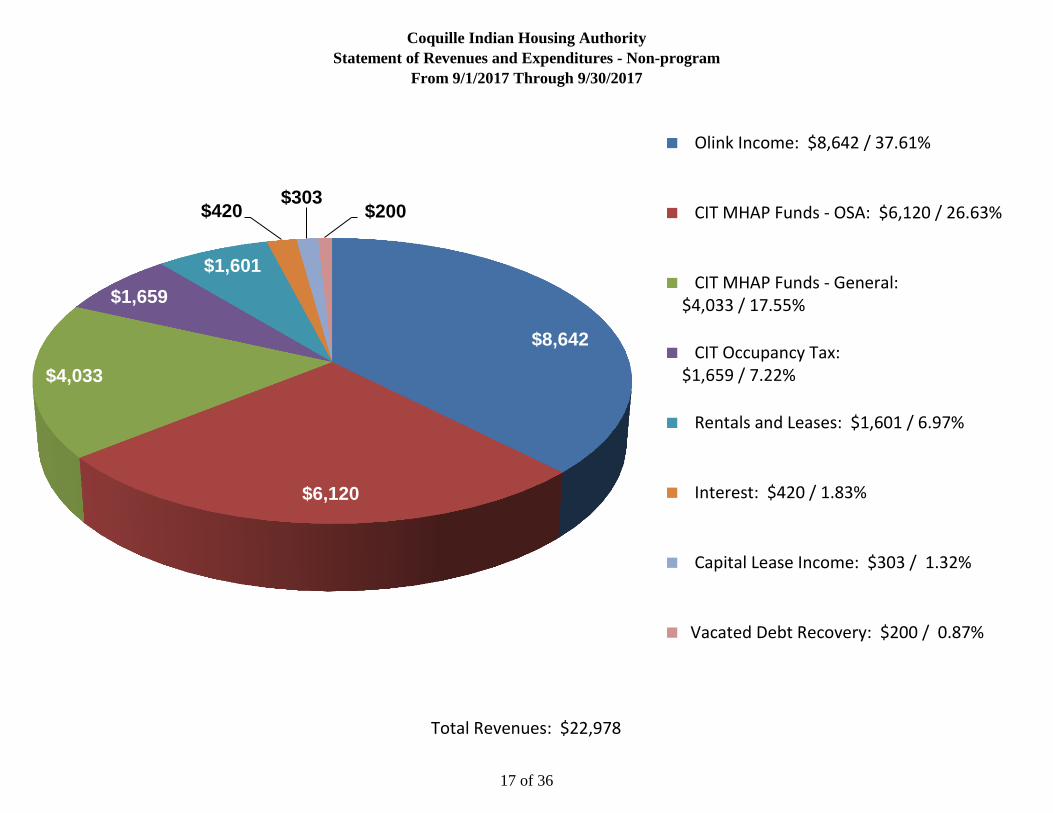
Coquille Indian Housing Authority
Statement of Revenues and Expenditures - Non-program
From 9/1/2017 Through 9/30/2017
Total Revenues: $22,978
$8,642
$6,120
$4,033
$1,659
$1,601
$420 $303
$200
Olink Income: $8,642 / 37.61%
CIT MHAP Funds - OSA: $6,120 / 26.63%
CIT MHAP Funds - General:$4,033 / 17.55%
CIT Occupancy Tax:$1,659 / 7.22%
Rentals and Leases: $1,601 / 6.97%
Interest: $420 / 1.83%
Capital Lease Income: $303 / 1.32%
Vacated Debt Recovery: $200 / 0.87%
17 of 36
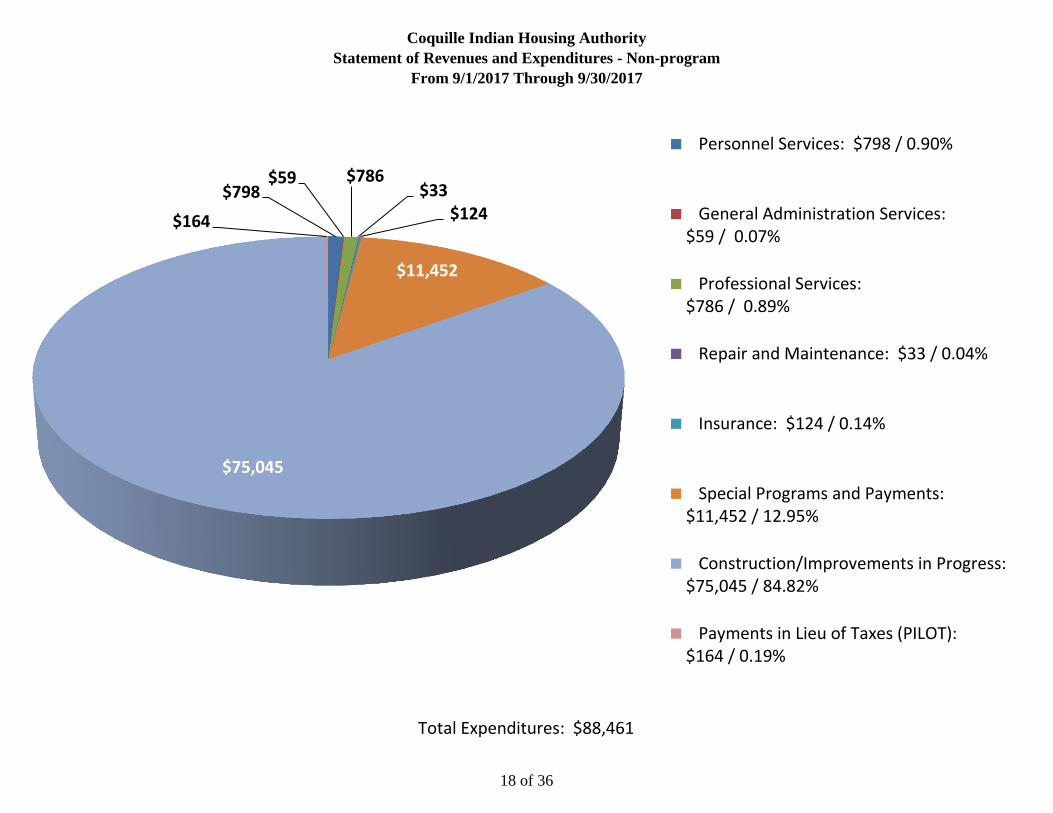
Coquille Indian Housing Authority
Statement of Revenues and Expenditures - Non-program
From 9/1/2017 Through 9/30/2017
Total Expenditures: $88,461
$798 $59 $786
$33 $124
$11,452
$75,045
$164
Personnel Services: $798 / 0.90%
General Administration Services:$59 / 0.07%
Professional Services:$786 / 0.89%
Repair and Maintenance: $33 / 0.04%
Insurance: $124 / 0.14%
Special Programs and Payments:$11,452 / 12.95%
Construction/Improvements in Progress:$75,045 / 84.82%
Payments in Lieu of Taxes (PILOT):$164 / 0.19%
18 of 36
Coquille Indian Housing Authority
Statement of Revenues and Expenditures - Non-program
From 9/1/2017 Through 9/30/2017
Actual
Current Month
Actual
Current YTD
Budget
Preliminary
Remaining
Percent
Actual
Current Month
Prior Year
Actual
Prior YTD
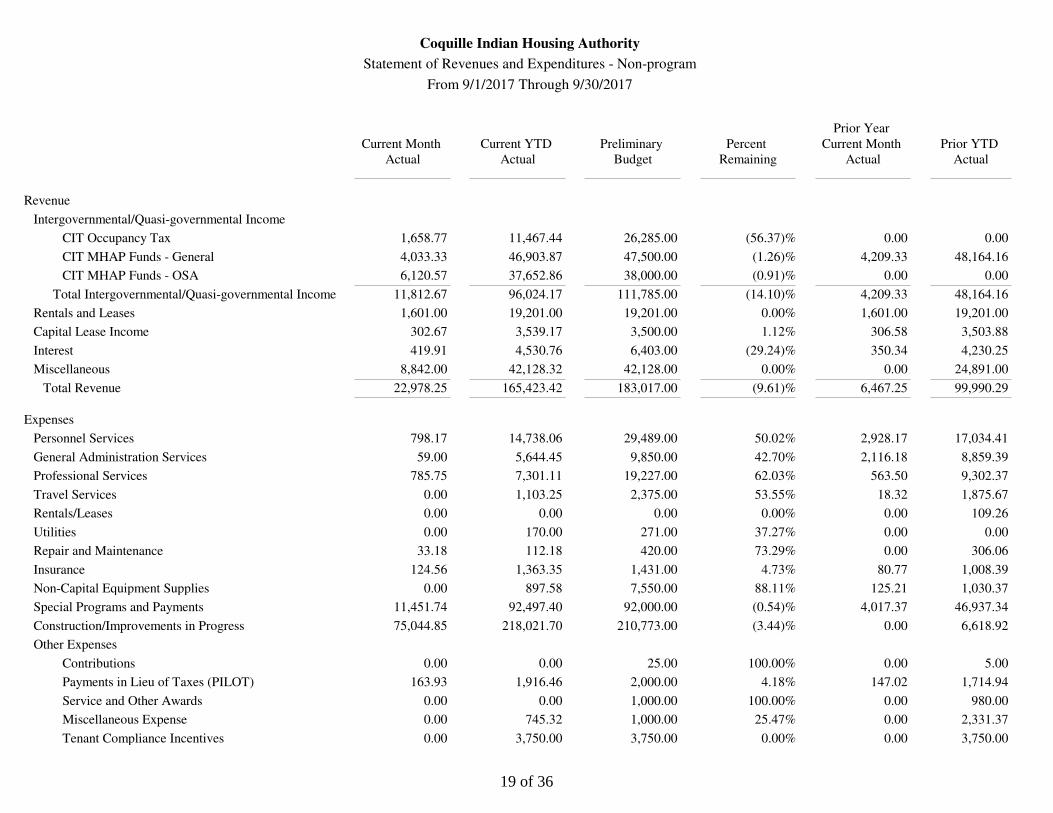
Revenue
Intergovernmental/Quasi-governmental Income
CIT Occupancy Tax 1,658.77 11,467.44 26,285.00 (56.37)% 0.00 0.00
CIT MHAP Funds - General 4,033.33 46,903.87 47,500.00 (1.26)% 4,209.33 48,164.16
CIT MHAP Funds - OSA 6,120.57 37,652.86 38,000.00 (0.91)% 0.00 0.00
Total Intergovernmental/Quasi-governmental Income 11,812.67 96,024.17 111,785.00 (14.10)% 4,209.33 48,164.16
Rentals and Leases 1,601.00 19,201.00 19,201.00 0.00% 1,601.00 19,201.00
Capital Lease Income 302.67 3,539.17 3,500.00 1.12% 306.58 3,503.88
Interest 419.91 4,530.76 6,403.00 (29.24)% 350.34 4,230.25
Miscellaneous 8,842.00 42,128.32 42,128.00 0.00% 0.00 24,891.00
Total Revenue 22,978.25 165,423.42 183,017.00 (9.61)% 6,467.25 99,990.29
Expenses
Personnel Services 798.17 14,738.06 29,489.00 50.02% 2,928.17 17,034.41
General Administration Services 59.00 5,644.45 9,850.00 42.70% 2,116.18 8,859.39
Professional Services 785.75 7,301.11 19,227.00 62.03% 563.50 9,302.37
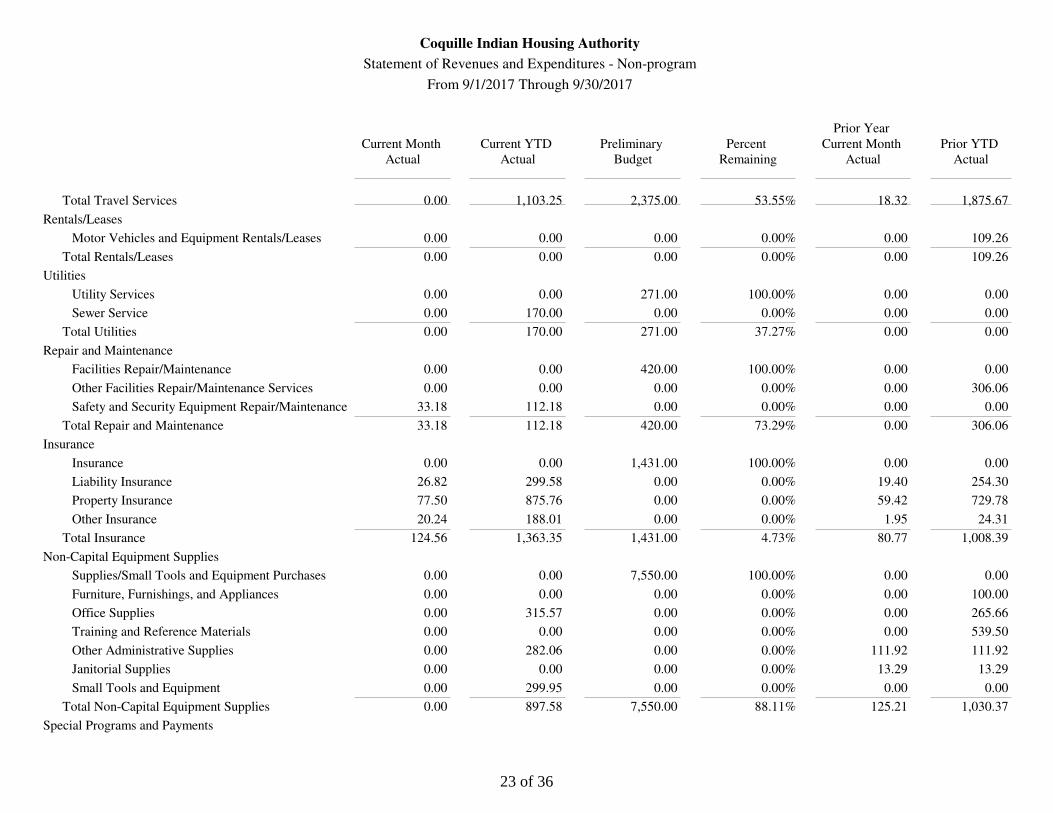
Travel Services 0.00 1,103.25 2,375.00 53.55% 18.32 1,875.67
Rentals/Leases 0.00 0.00 0.00 0.00% 0.00 109.26
Utilities 0.00 170.00 271.00 37.27% 0.00 0.00
Repair and Maintenance 33.18 112.18 420.00 73.29% 0.00 306.06
Insurance 124.56 1,363.35 1,431.00 4.73% 80.77 1,008.39
Non-Capital Equipment Supplies 0.00 897.58 7,550.00 88.11% 125.21 1,030.37
Special Programs and Payments 11,451.74 92,497.40 92,000.00 (0.54)% 4,017.37 46,937.34
Construction/Improvements in Progress 75,044.85 218,021.70 210,773.00 (3.44)% 0.00 6,618.92
Other Expenses
Contributions 0.00 0.00 25.00 100.00% 0.00 5.00
Payments in Lieu of Taxes (PILOT) 163.93 1,916.46 2,000.00 4.18% 147.02 1,714.94
Service and Other Awards 0.00 0.00 1,000.00 100.00% 0.00 980.00
Miscellaneous Expense 0.00 745.32 1,000.00 25.47% 0.00 2,331.37
Tenant Compliance Incentives 0.00 3,750.00 3,750.00 0.00% 0.00 3,750.00
19 of 36
Coquille Indian Housing Authority
Statement of Revenues and Expenditures - Non-program
From 9/1/2017 Through 9/30/2017
Actual
Current Month
Actual
Current YTD
Budget
Preliminary
Remaining
Percent
Actual
Current Month
Prior Year
Actual
Prior YTD
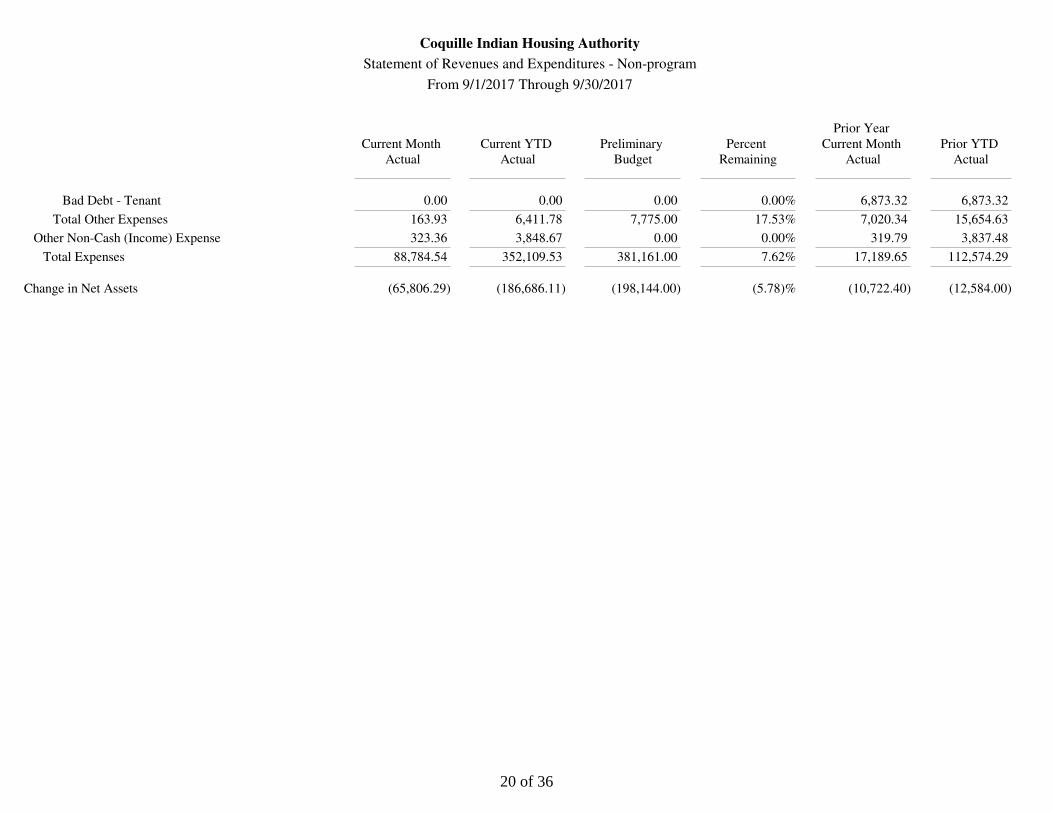
Bad Debt - Tenant 0.00 0.00 0.00 0.00% 6,873.32 6,873.32
Total Other Expenses 163.93 6,411.78 7,775.00 17.53% 7,020.34 15,654.63
Other Non-Cash (Income) Expense 323.36 3,848.67 0.00 0.00% 319.79 3,837.48
Total Expenses 88,784.54 352,109.53 381,161.00 7.62% 17,189.65 112,574.29
Change in Net Assets (65,806.29) (186,686.11) (198,144.00) (5.78)% (10,722.40) (12,584.00)
20 of 36
Coquille Indian Housing Authority
Statement of Revenues and Expenditures - Non-program
From 9/1/2017 Through 9/30/2017
Actual
Current Month
Actual
Current YTD
Budget
Preliminary
Remaining
Percent
Actual
Current Month
Prior Year
Actual
Prior YTD
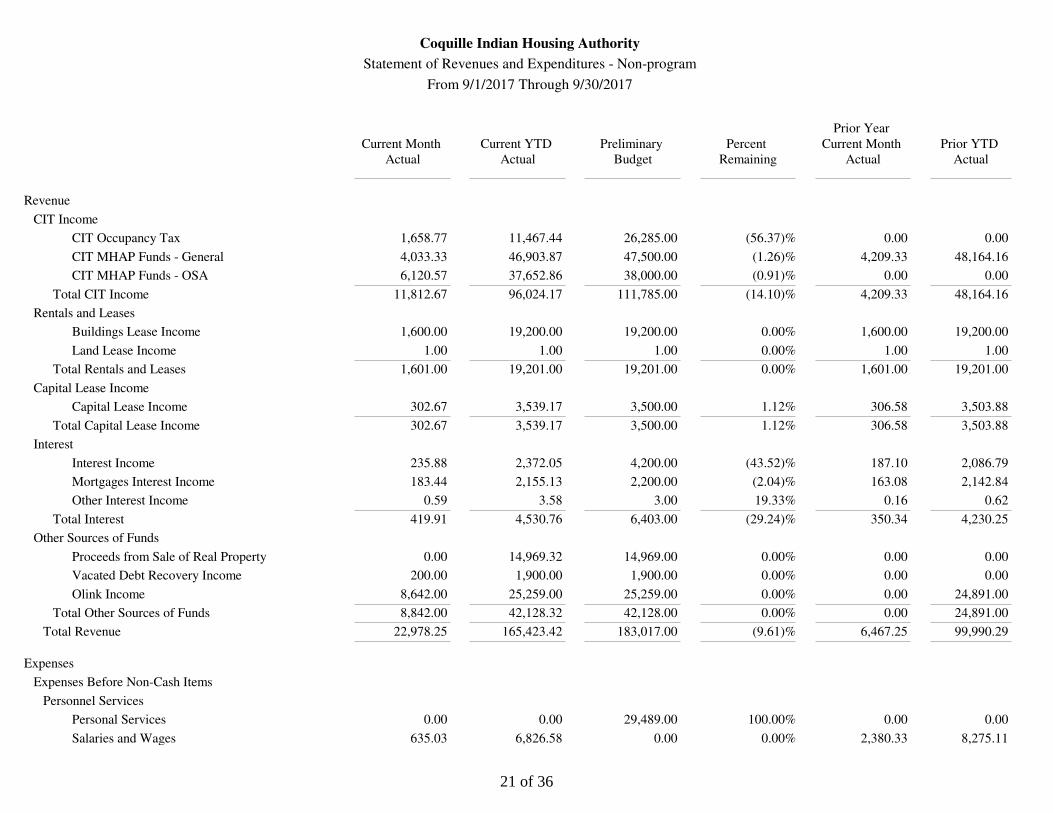
Revenue
CIT Income
CIT Occupancy Tax 1,658.77 11,467.44 26,285.00 (56.37)% 0.00 0.00
CIT MHAP Funds - General 4,033.33 46,903.87 47,500.00 (1.26)% 4,209.33 48,164.16
CIT MHAP Funds - OSA 6,120.57 37,652.86 38,000.00 (0.91)% 0.00 0.00
Total CIT Income 11,812.67 96,024.17 111,785.00 (14.10)% 4,209.33 48,164.16
Rentals and Leases
Buildings Lease Income 1,600.00 19,200.00 19,200.00 0.00% 1,600.00 19,200.00
Land Lease Income 1.00 1.00 1.00 0.00% 1.00 1.00
Total Rentals and Leases 1,601.00 19,201.00 19,201.00 0.00% 1,601.00 19,201.00
Capital Lease Income
Capital Lease Income 302.67 3,539.17 3,500.00 1.12% 306.58 3,503.88
Total Capital Lease Income 302.67 3,539.17 3,500.00 1.12% 306.58 3,503.88
Interest
Interest Income 235.88 2,372.05 4,200.00 (43.52)% 187.10 2,086.79
Mortgages Interest Income 183.44 2,155.13 2,200.00 (2.04)% 163.08 2,142.84
Other Interest Income 0.59 3.58 3.00 19.33% 0.16 0.62
Total Interest 419.91 4,530.76 6,403.00 (29.24)% 350.34 4,230.25
Other Sources of Funds
Proceeds from Sale of Real Property 0.00 14,969.32 14,969.00 0.00% 0.00 0.00
Vacated Debt Recovery Income 200.00 1,900.00 1,900.00 0.00% 0.00 0.00
Olink Income 8,642.00 25,259.00 25,259.00 0.00% 0.00 24,891.00
Total Other Sources of Funds 8,842.00 42,128.32 42,128.00 0.00% 0.00 24,891.00
Total Revenue 22,978.25 165,423.42 183,017.00 (9.61)% 6,467.25 99,990.29
Expenses
Expenses Before Non-Cash Items
Personnel Services
Personal Services 0.00 0.00 29,489.00 100.00% 0.00 0.00
Salaries and Wages 635.03 6,826.58 0.00 0.00% 2,380.33 8,275.11
21 of 36
Coquille Indian Housing Authority
Statement of Revenues and Expenditures - Non-program
From 9/1/2017 Through 9/30/2017
Actual
Current Month
Actual
Current YTD
Budget
Preliminary
Remaining
Percent
Actual
Current Month
Prior Year
Actual
Prior YTD
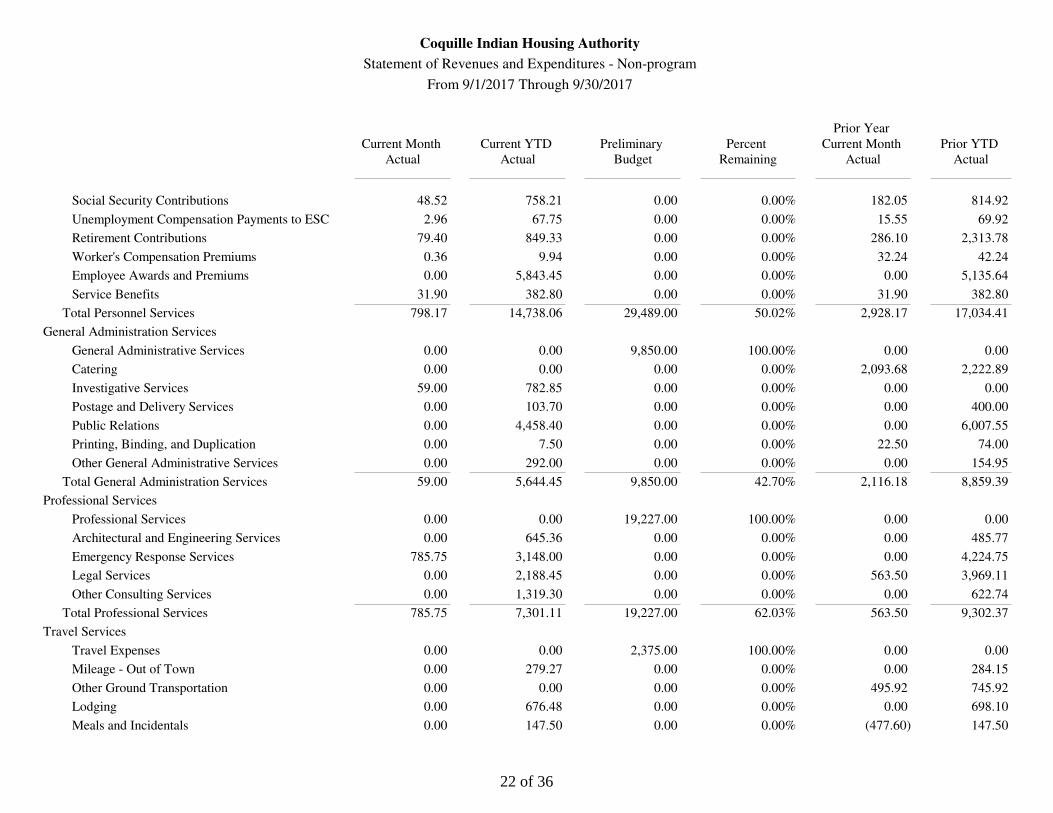
Social Security Contributions 48.52 758.21 0.00 0.00% 182.05 814.92
Unemployment Compensation Payments to ESC 2.96 67.75 0.00 0.00% 15.55 69.92
Retirement Contributions 79.40 849.33 0.00 0.00% 286.10 2,313.78
Worker's Compensation Premiums 0.36 9.94 0.00 0.00% 32.24 42.24
Employee Awards and Premiums 0.00 5,843.45 0.00 0.00% 0.00 5,135.64
Service Benefits 31.90 382.80 0.00 0.00% 31.90 382.80
Total Personnel Services 798.17 14,738.06 29,489.00 50.02% 2,928.17 17,034.41
General Administration Services
General Administrative Services 0.00 0.00 9,850.00 100.00% 0.00 0.00
Catering 0.00 0.00 0.00 0.00% 2,093.68 2,222.89
Investigative Services 59.00 782.85 0.00 0.00% 0.00 0.00
Postage and Delivery Services 0.00 103.70 0.00 0.00% 0.00 400.00
Public Relations 0.00 4,458.40 0.00 0.00% 0.00 6,007.55
Printing, Binding, and Duplication 0.00 7.50 0.00 0.00% 22.50 74.00
Other General Administrative Services 0.00 292.00 0.00 0.00% 0.00 154.95
Total General Administration Services 59.00 5,644.45 9,850.00 42.70% 2,116.18 8,859.39
Professional Services
Professional Services 0.00 0.00 19,227.00 100.00% 0.00 0.00
Architectural and Engineering Services 0.00 645.36 0.00 0.00% 0.00 485.77
Emergency Response Services 785.75 3,148.00 0.00 0.00% 0.00 4,224.75
Legal Services 0.00 2,188.45 0.00 0.00% 563.50 3,969.11
Other Consulting Services 0.00 1,319.30 0.00 0.00% 0.00 622.74
Total Professional Services 785.75 7,301.11 19,227.00 62.03% 563.50 9,302.37
Travel Services
Travel Expenses 0.00 0.00 2,375.00 100.00% 0.00 0.00
Mileage - Out of Town 0.00 279.27 0.00 0.00% 0.00 284.15
Other Ground Transportation 0.00 0.00 0.00 0.00% 495.92 745.92
Lodging 0.00 676.48 0.00 0.00% 0.00 698.10
Meals and Incidentals 0.00 147.50 0.00 0.00% (477.60) 147.50
22 of 36
Coquille Indian Housing Authority
Statement of Revenues and Expenditures - Non-program
From 9/1/2017 Through 9/30/2017
Actual
Current Month
Actual
Current YTD
Budget
Preliminary
Remaining
Percent
Actual
Current Month
Prior Year
Actual
Prior YTD
Total Travel Services 0.00 1,103.25 2,375.00 53.55% 18.32 1,875.67
Rentals/Leases
Motor Vehicles and Equipment Rentals/Leases 0.00 0.00 0.00 0.00% 0.00 109.26
Total Rentals/Leases 0.00 0.00 0.00 0.00% 0.00 109.26
Utilities
Utility Services 0.00 0.00 271.00 100.00% 0.00 0.00
Sewer Service 0.00 170.00 0.00 0.00% 0.00 0.00
Total Utilities 0.00 170.00 271.00 37.27% 0.00 0.00
Repair and Maintenance
Facilities Repair/Maintenance 0.00 0.00 420.00 100.00% 0.00 0.00
Other Facilities Repair/Maintenance Services 0.00 0.00 0.00 0.00% 0.00 306.06
Safety and Security Equipment Repair/Maintenance 33.18 112.18 0.00 0.00% 0.00 0.00
Total Repair and Maintenance 33.18 112.18 420.00 73.29% 0.00 306.06
Insurance
Insurance 0.00 0.00 1,431.00 100.00% 0.00 0.00
Liability Insurance 26.82 299.58 0.00 0.00% 19.40 254.30
Property Insurance 77.50 875.76 0.00 0.00% 59.42 729.78
Other Insurance 20.24 188.01 0.00 0.00% 1.95 24.31
Total Insurance 124.56 1,363.35 1,431.00 4.73% 80.77 1,008.39
Non-Capital Equipment Supplies
Supplies/Small Tools and Equipment Purchases 0.00 0.00 7,550.00 100.00% 0.00 0.00
Furniture, Furnishings, and Appliances 0.00 0.00 0.00 0.00% 0.00 100.00
Office Supplies 0.00 315.57 0.00 0.00% 0.00 265.66
Training and Reference Materials 0.00 0.00 0.00 0.00% 0.00 539.50
Other Administrative Supplies 0.00 282.06 0.00 0.00% 111.92 111.92
Janitorial Supplies 0.00 0.00 0.00 0.00% 13.29 13.29
Small Tools and Equipment 0.00 299.95 0.00 0.00% 0.00 0.00
Total Non-Capital Equipment Supplies 0.00 897.58 7,550.00 88.11% 125.21 1,030.37
Special Programs and Payments
23 of 36
Coquille Indian Housing Authority
Statement of Revenues and Expenditures - Non-program
From 9/1/2017 Through 9/30/2017
Actual
Current Month
Actual
Current YTD
Budget
Preliminary
Remaining
Percent
Actual
Current Month
Prior Year
Actual
Prior YTD
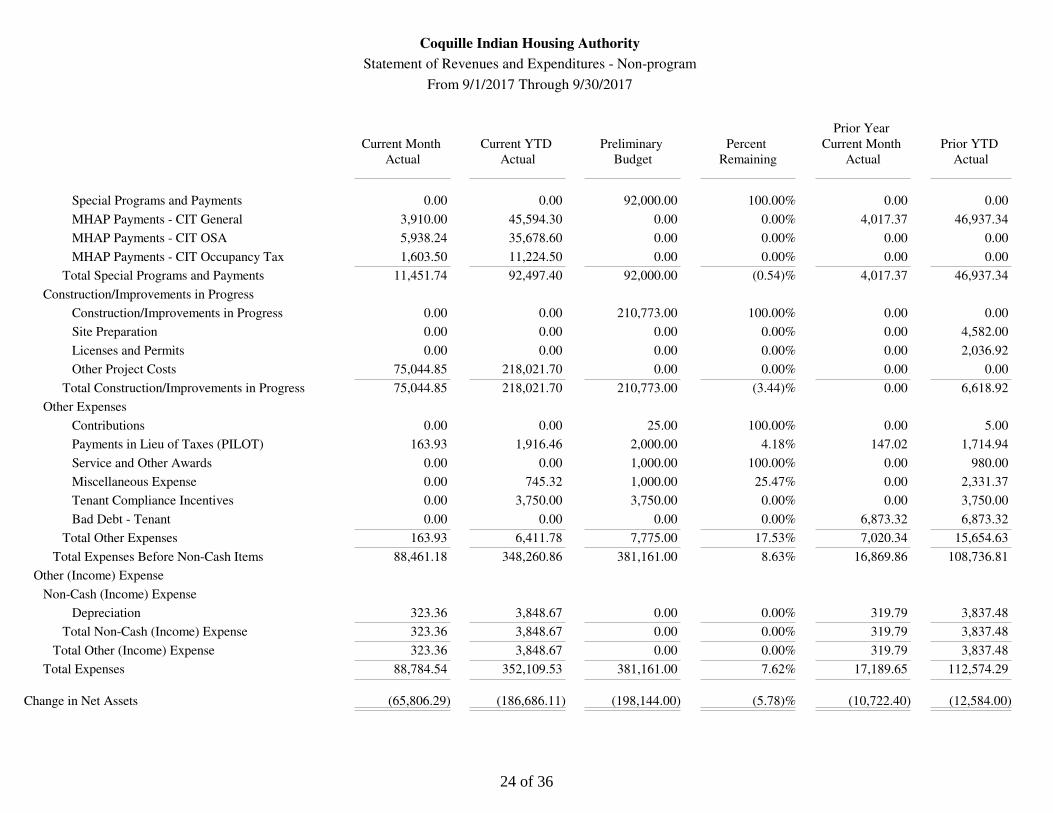
Special Programs and Payments 0.00 0.00 92,000.00 100.00% 0.00 0.00
MHAP Payments - CIT General 3,910.00 45,594.30 0.00 0.00% 4,017.37 46,937.34
MHAP Payments - CIT OSA 5,938.24 35,678.60 0.00 0.00% 0.00 0.00
MHAP Payments - CIT Occupancy Tax 1,603.50 11,224.50 0.00 0.00% 0.00 0.00
Total Special Programs and Payments 11,451.74 92,497.40 92,000.00 (0.54)% 4,017.37 46,937.34
Construction/Improvements in Progress
Construction/Improvements in Progress 0.00 0.00 210,773.00 100.00% 0.00 0.00
Site Preparation 0.00 0.00 0.00 0.00% 0.00 4,582.00
Licenses and Permits 0.00 0.00 0.00 0.00% 0.00 2,036.92
Other Project Costs 75,044.85 218,021.70 0.00 0.00% 0.00 0.00
Total Construction/Improvements in Progress 75,044.85 218,021.70 210,773.00 (3.44)% 0.00 6,618.92
Other Expenses
Contributions 0.00 0.00 25.00 100.00% 0.00 5.00
Payments in Lieu of Taxes (PILOT) 163.93 1,916.46 2,000.00 4.18% 147.02 1,714.94
Service and Other Awards 0.00 0.00 1,000.00 100.00% 0.00 980.00
Miscellaneous Expense 0.00 745.32 1,000.00 25.47% 0.00 2,331.37
Tenant Compliance Incentives 0.00 3,750.00 3,750.00 0.00% 0.00 3,750.00
Bad Debt - Tenant 0.00 0.00 0.00 0.00% 6,873.32 6,873.32
Total Other Expenses 163.93 6,411.78 7,775.00 17.53% 7,020.34 15,654.63
Total Expenses Before Non-Cash Items 88,461.18 348,260.86 381,161.00 8.63% 16,869.86 108,736.81
Other (Income) Expense
Non-Cash (Income) Expense
Depreciation 323.36 3,848.67 0.00 0.00% 319.79 3,837.48
Total Non-Cash (Income) Expense 323.36 3,848.67 0.00 0.00% 319.79 3,837.48
Total Other (Income) Expense 323.36 3,848.67 0.00 0.00% 319.79 3,837.48
Total Expenses 88,784.54 352,109.53 381,161.00 7.62% 17,189.65 112,574.29
Change in Net Assets (65,806.29) (186,686.11) (198,144.00) (5.78)% (10,722.40) (12,584.00)
24 of 36
Coquille Indian Housing Authority
Statement of Revenues and Expenditures - Combined
From 9/1/2017 Through 9/30/2017
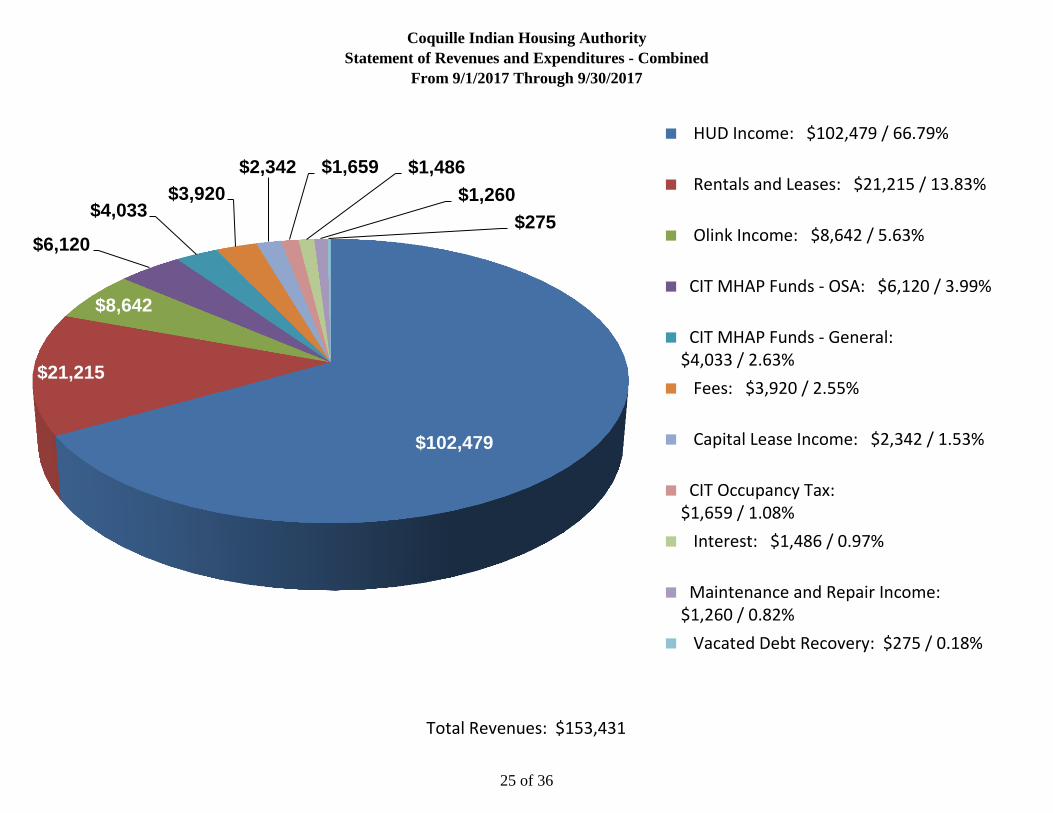
Total Revenues: $153,431
$102,479
$21,215
$8,642
$6,120
$4,033 $3,920
$2,342 $1,659 $1,486
$1,260
$275
HUD Income: $102,479 / 66.79%
Rentals and Leases: $21,215 / 13.83%
Olink Income: $8,642 / 5.63%
CIT MHAP Funds - OSA: $6,120 / 3.99%
CIT MHAP Funds - General:$4,033 / 2.63%
Fees: $3,920 / 2.55%
Capital Lease Income: $2,342 / 1.53%
CIT Occupancy Tax:$1,659 / 1.08%
Interest: $1,486 / 0.97%
Maintenance and Repair Income:$1,260 / 0.82%
Vacated Debt Recovery: $275 / 0.18%
25 of 36
Coquille Indian Housing Authority
Statement of Revenues and Expenditures - Combined
From 9/1/2017 Through 9/30/2017
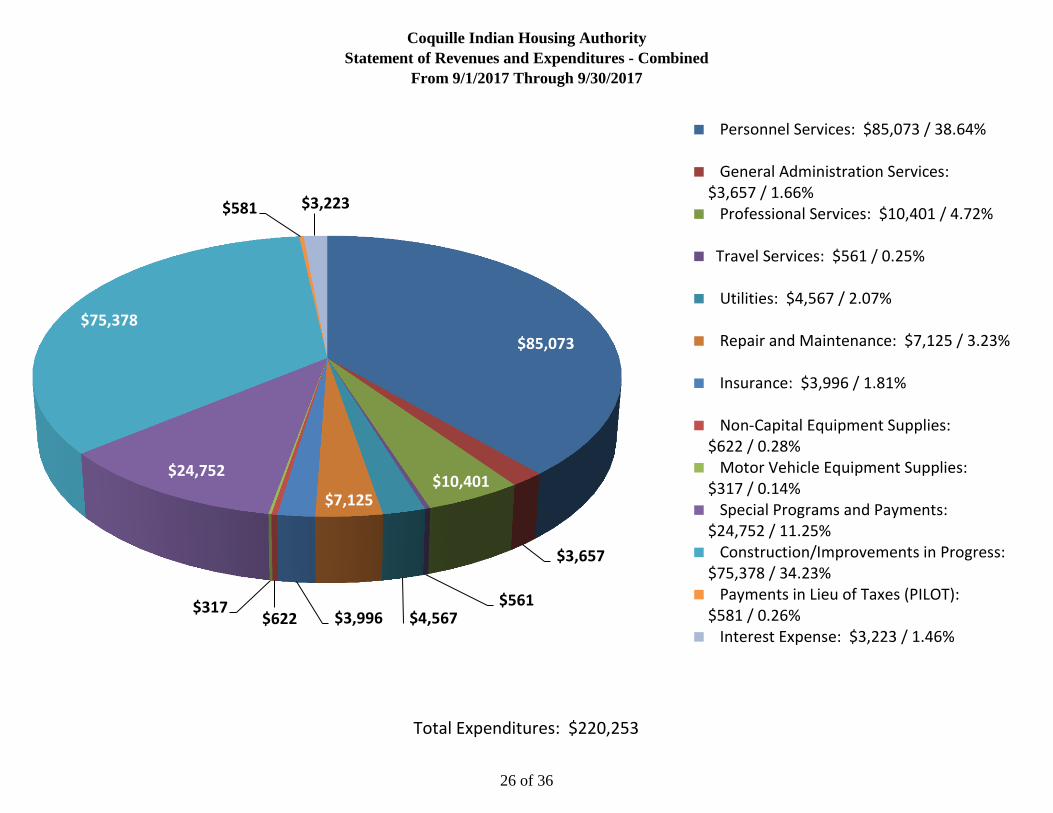
Total Expenditures: $220,253
$85,073
$3,657
$10,401
$561 $4,567
$7,125
$3,996 $622 $317
$24,752
$75,378
$581 $3,223
Personnel Services: $85,073 / 38.64%
General Administration Services:$3,657 / 1.66% Professional Services: $10,401 / 4.72%
Travel Services: $561 / 0.25%
Utilities: $4,567 / 2.07%
Repair and Maintenance: $7,125 / 3.23%
Insurance: $3,996 / 1.81%
Non-Capital Equipment Supplies:$622 / 0.28% Motor Vehicle Equipment Supplies:$317 / 0.14% Special Programs and Payments:$24,752 / 11.25% Construction/Improvements in Progress:$75,378 / 34.23% Payments in Lieu of Taxes (PILOT):$581 / 0.26% Interest Expense: $3,223 / 1.46%
26 of 36
Coquille Indian Housing Authority
Statement of Revenues and Expenditures - Combined
From 9/1/2017 Through 9/30/2017
Actual
Current Month
Actual
Current YTD
Budget
Preliminary
Remaining
Percent
Actual
Current Month
Prior Year
Actual
Prior YTD
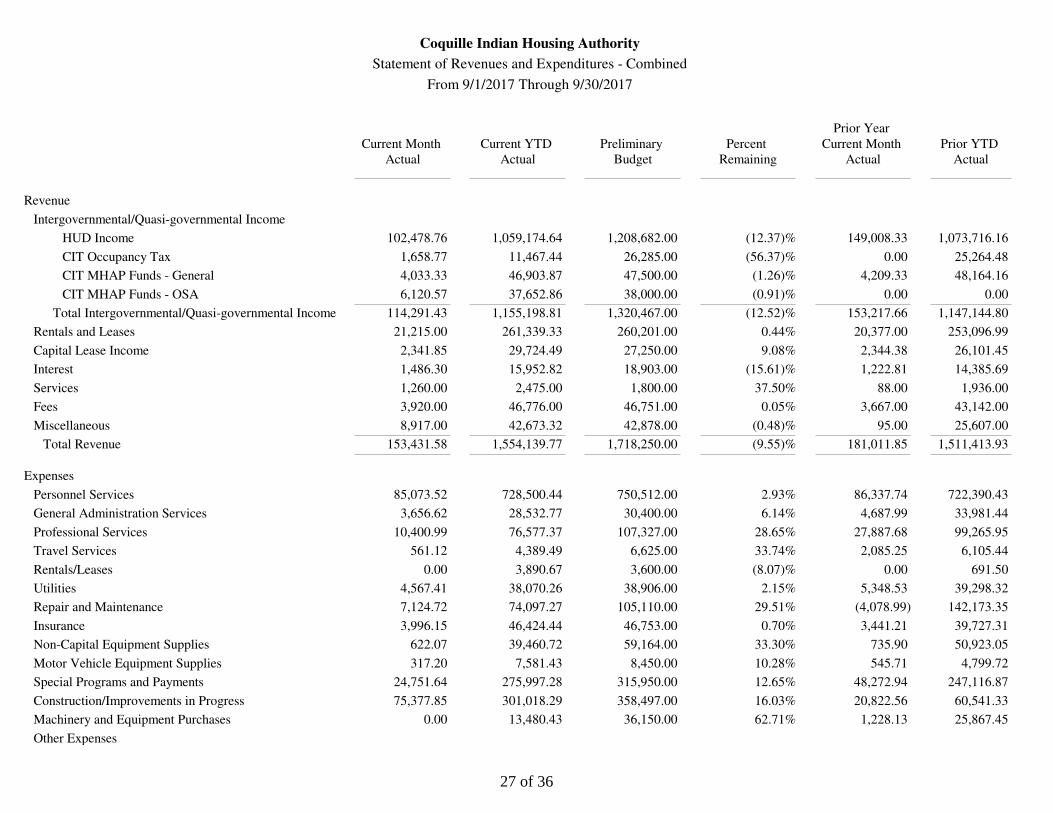
Revenue
Intergovernmental/Quasi-governmental Income
HUD Income 102,478.76 1,059,174.64 1,208,682.00 (12.37)% 149,008.33 1,073,716.16
CIT Occupancy Tax 1,658.77 11,467.44 26,285.00 (56.37)% 0.00 25,264.48
CIT MHAP Funds - General 4,033.33 46,903.87 47,500.00 (1.26)% 4,209.33 48,164.16
CIT MHAP Funds - OSA 6,120.57 37,652.86 38,000.00 (0.91)% 0.00 0.00
Total Intergovernmental/Quasi-governmental Income 114,291.43 1,155,198.81 1,320,467.00 (12.52)% 153,217.66 1,147,144.80
Rentals and Leases 21,215.00 261,339.33 260,201.00 0.44% 20,377.00 253,096.99
Capital Lease Income 2,341.85 29,724.49 27,250.00 9.08% 2,344.38 26,101.45
Interest 1,486.30 15,952.82 18,903.00 (15.61)% 1,222.81 14,385.69
Services 1,260.00 2,475.00 1,800.00 37.50% 88.00 1,936.00
Fees 3,920.00 46,776.00 46,751.00 0.05% 3,667.00 43,142.00
Miscellaneous 8,917.00 42,673.32 42,878.00 (0.48)% 95.00 25,607.00
Total Revenue 153,431.58 1,554,139.77 1,718,250.00 (9.55)% 181,011.85 1,511,413.93
Expenses
Personnel Services 85,073.52 728,500.44 750,512.00 2.93% 86,337.74 722,390.43
General Administration Services 3,656.62 28,532.77 30,400.00 6.14% 4,687.99 33,981.44
Professional Services 10,400.99 76,577.37 107,327.00 28.65% 27,887.68 99,265.95
Travel Services 561.12 4,389.49 6,625.00 33.74% 2,085.25 6,105.44
Rentals/Leases 0.00 3,890.67 3,600.00 (8.07)% 0.00 691.50
Utilities 4,567.41 38,070.26 38,906.00 2.15% 5,348.53 39,298.32
Repair and Maintenance 7,124.72 74,097.27 105,110.00 29.51% (4,078.99) 142,173.35
Insurance 3,996.15 46,424.44 46,753.00 0.70% 3,441.21 39,727.31
Non-Capital Equipment Supplies 622.07 39,460.72 59,164.00 33.30% 735.90 50,923.05
Motor Vehicle Equipment Supplies 317.20 7,581.43 8,450.00 10.28% 545.71 4,799.72
Special Programs and Payments 24,751.64 275,997.28 315,950.00 12.65% 48,272.94 247,116.87
Construction/Improvements in Progress 75,377.85 301,018.29 358,497.00 16.03% 20,822.56 60,541.33
Machinery and Equipment Purchases 0.00 13,480.43 36,150.00 62.71% 1,228.13 25,867.45
Other Expenses
27 of 36
Coquille Indian Housing Authority
Statement of Revenues and Expenditures - Combined
From 9/1/2017 Through 9/30/2017
Actual
Current Month
Actual
Current YTD
Budget
Preliminary
Remaining
Percent
Actual
Current Month
Prior Year
Actual
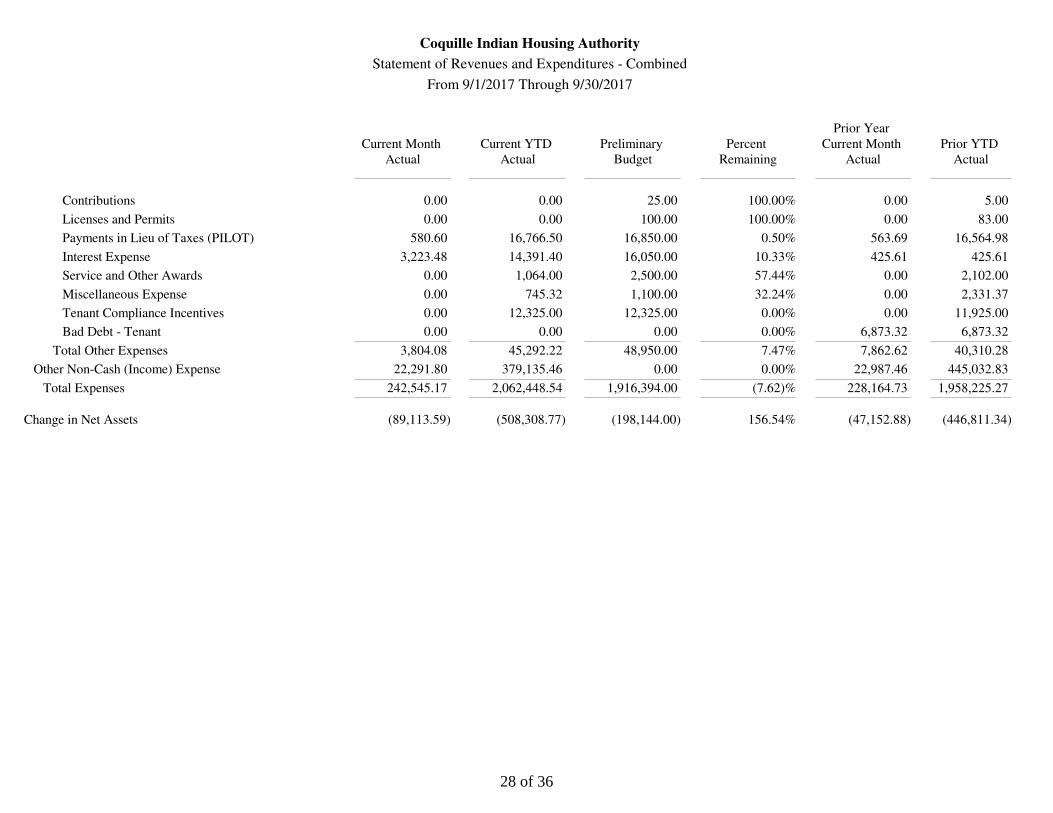
Prior YTD
Contributions 0.00 0.00 25.00 100.00% 0.00 5.00
Licenses and Permits 0.00 0.00 100.00 100.00% 0.00 83.00
Payments in Lieu of Taxes (PILOT) 580.60 16,766.50 16,850.00 0.50% 563.69 16,564.98
Interest Expense 3,223.48 14,391.40 16,050.00 10.33% 425.61 425.61
Service and Other Awards 0.00 1,064.00 2,500.00 57.44% 0.00 2,102.00
Miscellaneous Expense 0.00 745.32 1,100.00 32.24% 0.00 2,331.37
Tenant Compliance Incentives 0.00 12,325.00 12,325.00 0.00% 0.00 11,925.00
Bad Debt - Tenant 0.00 0.00 0.00 0.00% 6,873.32 6,873.32
Total Other Expenses 3,804.08 45,292.22 48,950.00 7.47% 7,862.62 40,310.28
Other Non-Cash (Income) Expense 22,291.80 379,135.46 0.00 0.00% 22,987.46 445,032.83
Total Expenses 242,545.17 2,062,448.54 1,916,394.00 (7.62)% 228,164.73 1,958,225.27
Change in Net Assets (89,113.59) (508,308.77) (198,144.00) 156.54% (47,152.88) (446,811.34)
28 of 36
Coquille Indian Housing Authority
Statement of Revenues and Expenditures - Combined
From 9/1/2017 Through 9/30/2017
Actual
Current Month
Actual
Current YTD
Budget
Preliminary
Remaining
Percent
Actual
Current Month
Prior Year
Actual
Prior YTD
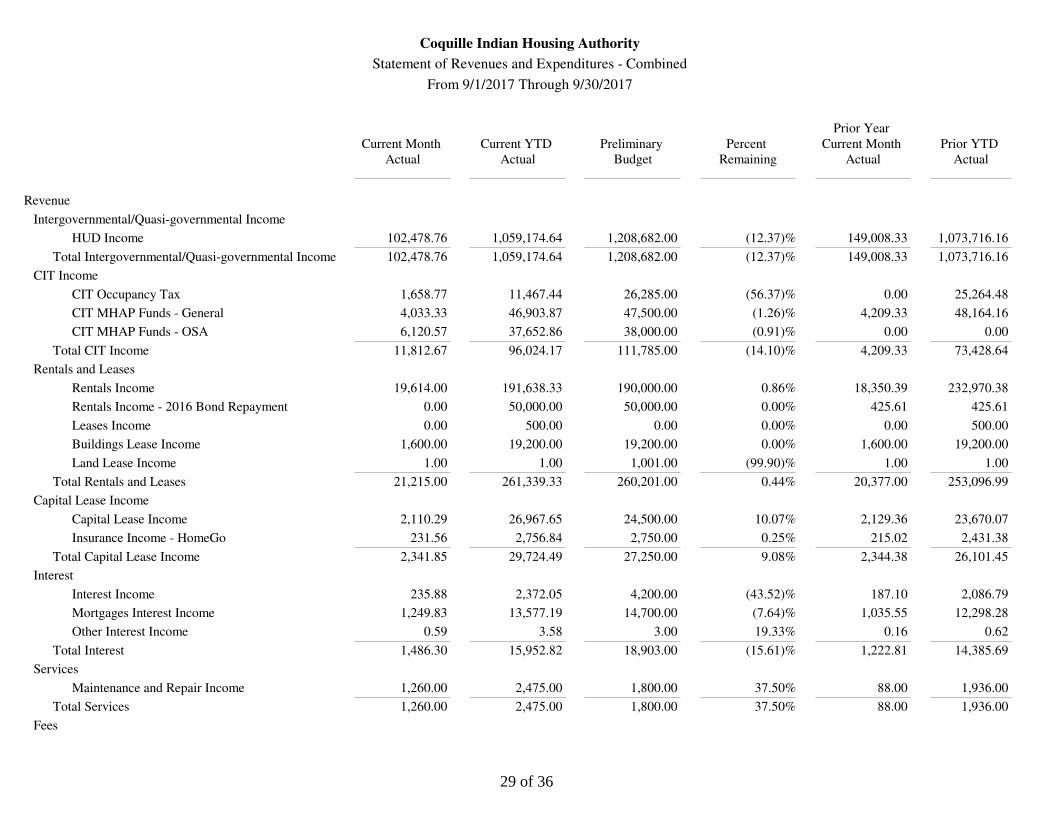
Revenue
Intergovernmental/Quasi-governmental Income
HUD Income 102,478.76 1,059,174.64 1,208,682.00 (12.37)% 149,008.33 1,073,716.16
Total Intergovernmental/Quasi-governmental Income 102,478.76 1,059,174.64 1,208,682.00 (12.37)% 149,008.33 1,073,716.16
CIT Income
CIT Occupancy Tax 1,658.77 11,467.44 26,285.00 (56.37)% 0.00 25,264.48
CIT MHAP Funds - General 4,033.33 46,903.87 47,500.00 (1.26)% 4,209.33 48,164.16
CIT MHAP Funds - OSA 6,120.57 37,652.86 38,000.00 (0.91)% 0.00 0.00
Total CIT Income 11,812.67 96,024.17 111,785.00 (14.10)% 4,209.33 73,428.64
Rentals and Leases
Rentals Income 19,614.00 191,638.33 190,000.00 0.86% 18,350.39 232,970.38
Rentals Income - 2016 Bond Repayment 0.00 50,000.00 50,000.00 0.00% 425.61 425.61
Leases Income 0.00 500.00 0.00 0.00% 0.00 500.00
Buildings Lease Income 1,600.00 19,200.00 19,200.00 0.00% 1,600.00 19,200.00
Land Lease Income 1.00 1.00 1,001.00 (99.90)% 1.00 1.00
Total Rentals and Leases 21,215.00 261,339.33 260,201.00 0.44% 20,377.00 253,096.99
Capital Lease Income
Capital Lease Income 2,110.29 26,967.65 24,500.00 10.07% 2,129.36 23,670.07
Insurance Income - HomeGo 231.56 2,756.84 2,750.00 0.25% 215.02 2,431.38
Total Capital Lease Income 2,341.85 29,724.49 27,250.00 9.08% 2,344.38 26,101.45
Interest
Interest Income 235.88 2,372.05 4,200.00 (43.52)% 187.10 2,086.79
Mortgages Interest Income 1,249.83 13,577.19 14,700.00 (7.64)% 1,035.55 12,298.28
Other Interest Income 0.59 3.58 3.00 19.33% 0.16 0.62
Total Interest 1,486.30 15,952.82 18,903.00 (15.61)% 1,222.81 14,385.69
Services
Maintenance and Repair Income 1,260.00 2,475.00 1,800.00 37.50% 88.00 1,936.00
Total Services 1,260.00 2,475.00 1,800.00 37.50% 88.00 1,936.00
Fees
29 of 36
Coquille Indian Housing Authority
Statement of Revenues and Expenditures - Combined
From 9/1/2017 Through 9/30/2017
Actual
Current Month
Actual
Current YTD
Budget
Preliminary
Remaining
Percent
Actual
Current Month
Prior Year
Actual
Prior YTD
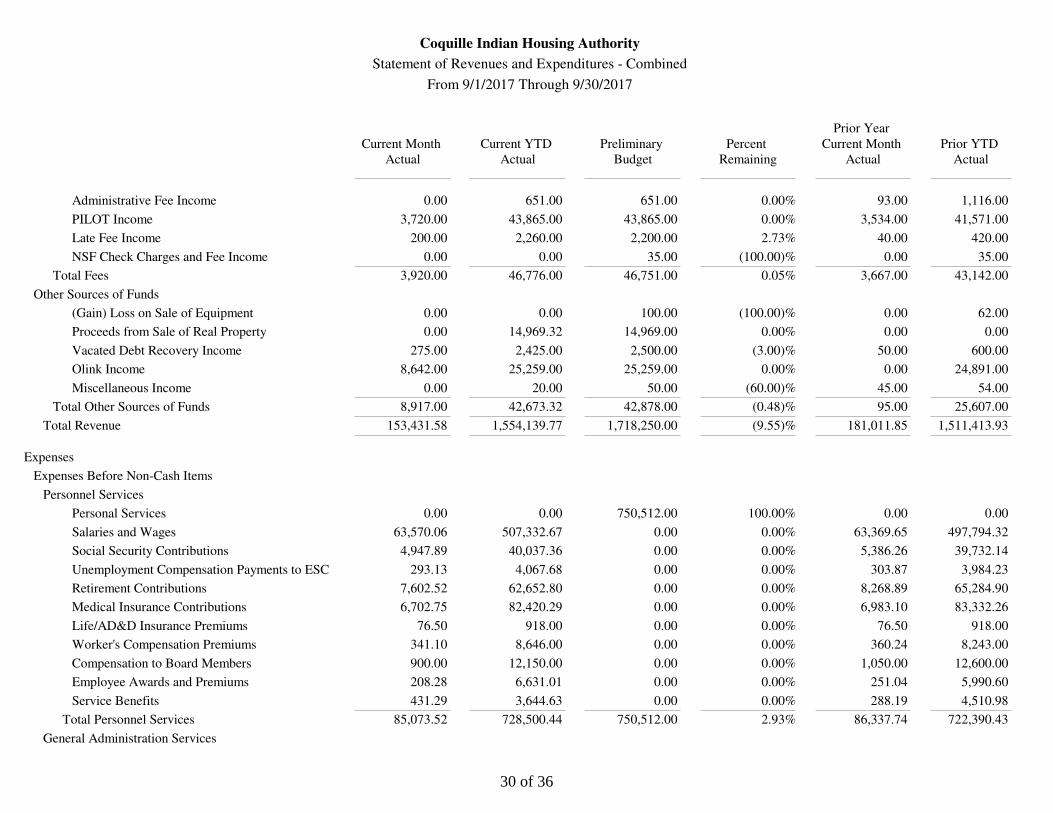
Administrative Fee Income 0.00 651.00 651.00 0.00% 93.00 1,116.00
PILOT Income 3,720.00 43,865.00 43,865.00 0.00% 3,534.00 41,571.00
Late Fee Income 200.00 2,260.00 2,200.00 2.73% 40.00 420.00
NSF Check Charges and Fee Income 0.00 0.00 35.00 (100.00)% 0.00 35.00
Total Fees 3,920.00 46,776.00 46,751.00 0.05% 3,667.00 43,142.00
Other Sources of Funds
(Gain) Loss on Sale of Equipment 0.00 0.00 100.00 (100.00)% 0.00 62.00
Proceeds from Sale of Real Property 0.00 14,969.32 14,969.00 0.00% 0.00 0.00
Vacated Debt Recovery Income 275.00 2,425.00 2,500.00 (3.00)% 50.00 600.00
Olink Income 8,642.00 25,259.00 25,259.00 0.00% 0.00 24,891.00
Miscellaneous Income 0.00 20.00 50.00 (60.00)% 45.00 54.00
Total Other Sources of Funds 8,917.00 42,673.32 42,878.00 (0.48)% 95.00 25,607.00
Total Revenue 153,431.58 1,554,139.77 1,718,250.00 (9.55)% 181,011.85 1,511,413.93
Expenses
Expenses Before Non-Cash Items
Personnel Services
Personal Services 0.00 0.00 750,512.00 100.00% 0.00 0.00
Salaries and Wages 63,570.06 507,332.67 0.00 0.00% 63,369.65 497,794.32
Social Security Contributions 4,947.89 40,037.36 0.00 0.00% 5,386.26 39,732.14
Unemployment Compensation Payments to ESC 293.13 4,067.68 0.00 0.00% 303.87 3,984.23
Retirement Contributions 7,602.52 62,652.80 0.00 0.00% 8,268.89 65,284.90
Medical Insurance Contributions 6,702.75 82,420.29 0.00 0.00% 6,983.10 83,332.26
Life/AD&D Insurance Premiums 76.50 918.00 0.00 0.00% 76.50 918.00
Worker's Compensation Premiums 341.10 8,646.00 0.00 0.00% 360.24 8,243.00
Compensation to Board Members 900.00 12,150.00 0.00 0.00% 1,050.00 12,600.00
Employee Awards and Premiums 208.28 6,631.01 0.00 0.00% 251.04 5,990.60
Service Benefits 431.29 3,644.63 0.00 0.00% 288.19 4,510.98
Total Personnel Services 85,073.52 728,500.44 750,512.00 2.93% 86,337.74 722,390.43
General Administration Services
30 of 36
Coquille Indian Housing Authority
Statement of Revenues and Expenditures - Combined
From 9/1/2017 Through 9/30/2017
Actual
Current Month
Actual
Current YTD
Budget
Preliminary
Remaining
Percent
Actual
Current Month
Prior Year
Actual
Prior YTD
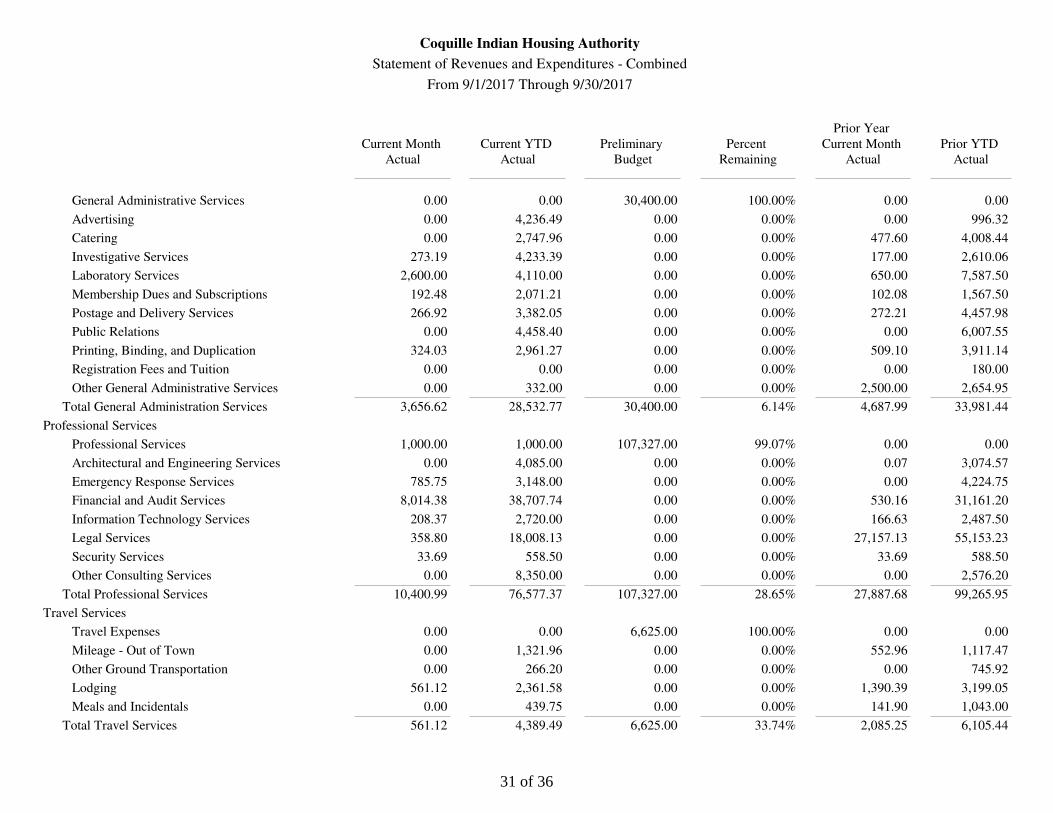
General Administrative Services 0.00 0.00 30,400.00 100.00% 0.00 0.00
Advertising 0.00 4,236.49 0.00 0.00% 0.00 996.32
Catering 0.00 2,747.96 0.00 0.00% 477.60 4,008.44
Investigative Services 273.19 4,233.39 0.00 0.00% 177.00 2,610.06
Laboratory Services 2,600.00 4,110.00 0.00 0.00% 650.00 7,587.50
Membership Dues and Subscriptions 192.48 2,071.21 0.00 0.00% 102.08 1,567.50
Postage and Delivery Services 266.92 3,382.05 0.00 0.00% 272.21 4,457.98
Public Relations 0.00 4,458.40 0.00 0.00% 0.00 6,007.55
Printing, Binding, and Duplication 324.03 2,961.27 0.00 0.00% 509.10 3,911.14
Registration Fees and Tuition 0.00 0.00 0.00 0.00% 0.00 180.00
Other General Administrative Services 0.00 332.00 0.00 0.00% 2,500.00 2,654.95
Total General Administration Services 3,656.62 28,532.77 30,400.00 6.14% 4,687.99 33,981.44
Professional Services
Professional Services 1,000.00 1,000.00 107,327.00 99.07% 0.00 0.00
Architectural and Engineering Services 0.00 4,085.00 0.00 0.00% 0.07 3,074.57
Emergency Response Services 785.75 3,148.00 0.00 0.00% 0.00 4,224.75
Financial and Audit Services 8,014.38 38,707.74 0.00 0.00% 530.16 31,161.20
Information Technology Services 208.37 2,720.00 0.00 0.00% 166.63 2,487.50
Legal Services 358.80 18,008.13 0.00 0.00% 27,157.13 55,153.23
Security Services 33.69 558.50 0.00 0.00% 33.69 588.50
Other Consulting Services 0.00 8,350.00 0.00 0.00% 0.00 2,576.20
Total Professional Services 10,400.99 76,577.37 107,327.00 28.65% 27,887.68 99,265.95
Travel Services
Travel Expenses 0.00 0.00 6,625.00 100.00% 0.00 0.00
Mileage - Out of Town 0.00 1,321.96 0.00 0.00% 552.96 1,117.47
Other Ground Transportation 0.00 266.20 0.00 0.00% 0.00 745.92
Lodging 561.12 2,361.58 0.00 0.00% 1,390.39 3,199.05
Meals and Incidentals 0.00 439.75 0.00 0.00% 141.90 1,043.00
Total Travel Services 561.12 4,389.49 6,625.00 33.74% 2,085.25 6,105.44
31 of 36
Coquille Indian Housing Authority
Statement of Revenues and Expenditures - Combined
From 9/1/2017 Through 9/30/2017
Actual
Current Month
Actual
Current YTD
Budget
Preliminary
Remaining
Percent
Actual
Current Month
Prior Year
Actual
Prior YTD
Rentals/Leases
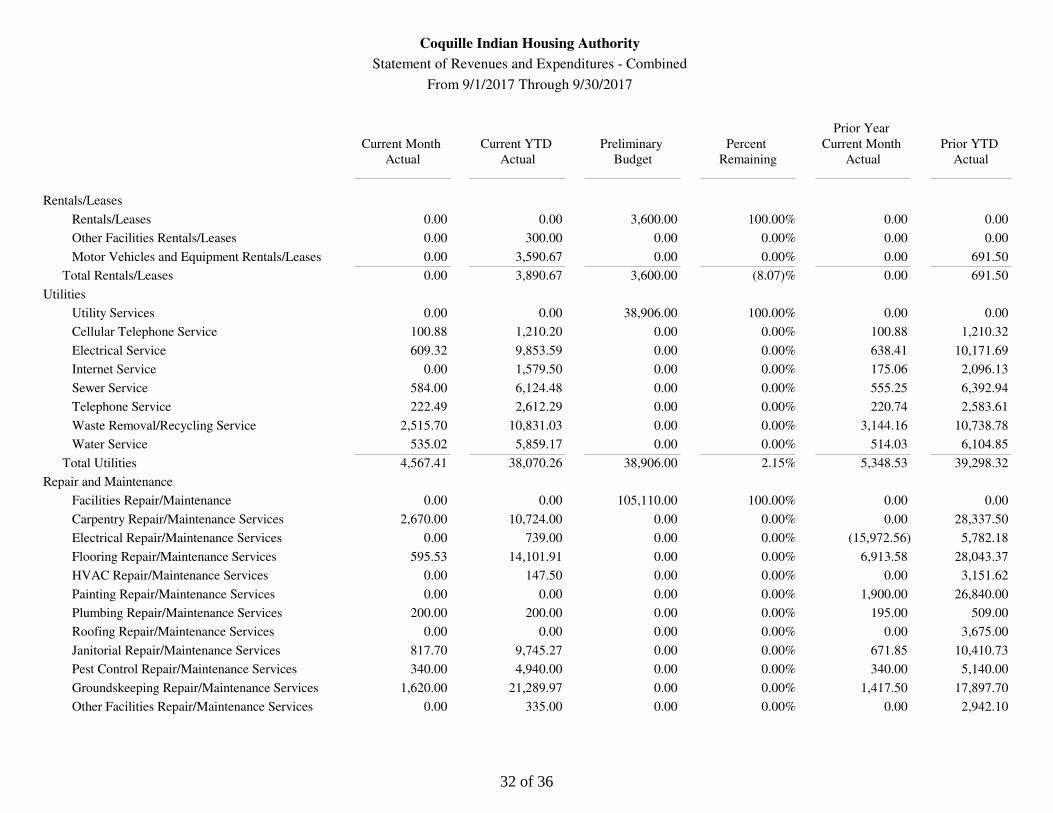
Rentals/Leases 0.00 0.00 3,600.00 100.00% 0.00 0.00
Other Facilities Rentals/Leases 0.00 300.00 0.00 0.00% 0.00 0.00
Motor Vehicles and Equipment Rentals/Leases 0.00 3,590.67 0.00 0.00% 0.00 691.50
Total Rentals/Leases 0.00 3,890.67 3,600.00 (8.07)% 0.00 691.50
Utilities
Utility Services 0.00 0.00 38,906.00 100.00% 0.00 0.00
Cellular Telephone Service 100.88 1,210.20 0.00 0.00% 100.88 1,210.32
Electrical Service 609.32 9,853.59 0.00 0.00% 638.41 10,171.69
Internet Service 0.00 1,579.50 0.00 0.00% 175.06 2,096.13
Sewer Service 584.00 6,124.48 0.00 0.00% 555.25 6,392.94
Telephone Service 222.49 2,612.29 0.00 0.00% 220.74 2,583.61
Waste Removal/Recycling Service 2,515.70 10,831.03 0.00 0.00% 3,144.16 10,738.78
Water Service 535.02 5,859.17 0.00 0.00% 514.03 6,104.85
Total Utilities 4,567.41 38,070.26 38,906.00 2.15% 5,348.53 39,298.32
Repair and Maintenance
Facilities Repair/Maintenance 0.00 0.00 105,110.00 100.00% 0.00 0.00
Carpentry Repair/Maintenance Services 2,670.00 10,724.00 0.00 0.00% 0.00 28,337.50
Electrical Repair/Maintenance Services 0.00 739.00 0.00 0.00% (15,972.56) 5,782.18
Flooring Repair/Maintenance Services 595.53 14,101.91 0.00 0.00% 6,913.58 28,043.37
HVAC Repair/Maintenance Services 0.00 147.50 0.00 0.00% 0.00 3,151.62
Painting Repair/Maintenance Services 0.00 0.00 0.00 0.00% 1,900.00 26,840.00
Plumbing Repair/Maintenance Services 200.00 200.00 0.00 0.00% 195.00 509.00
Roofing Repair/Maintenance Services 0.00 0.00 0.00 0.00% 0.00 3,675.00
Janitorial Repair/Maintenance Services 817.70 9,745.27 0.00 0.00% 671.85 10,410.73
Pest Control Repair/Maintenance Services 340.00 4,940.00 0.00 0.00% 340.00 5,140.00
Groundskeeping Repair/Maintenance Services 1,620.00 21,289.97 0.00 0.00% 1,417.50 17,897.70
Other Facilities Repair/Maintenance Services 0.00 335.00 0.00 0.00% 0.00 2,942.10
32 of 36
Coquille Indian Housing Authority
Statement of Revenues and Expenditures - Combined
From 9/1/2017 Through 9/30/2017
Actual
Current Month
Actual
Current YTD
Budget
Preliminary
Remaining
Percent
Actual
Current Month
Prior Year
Actual
Prior YTD
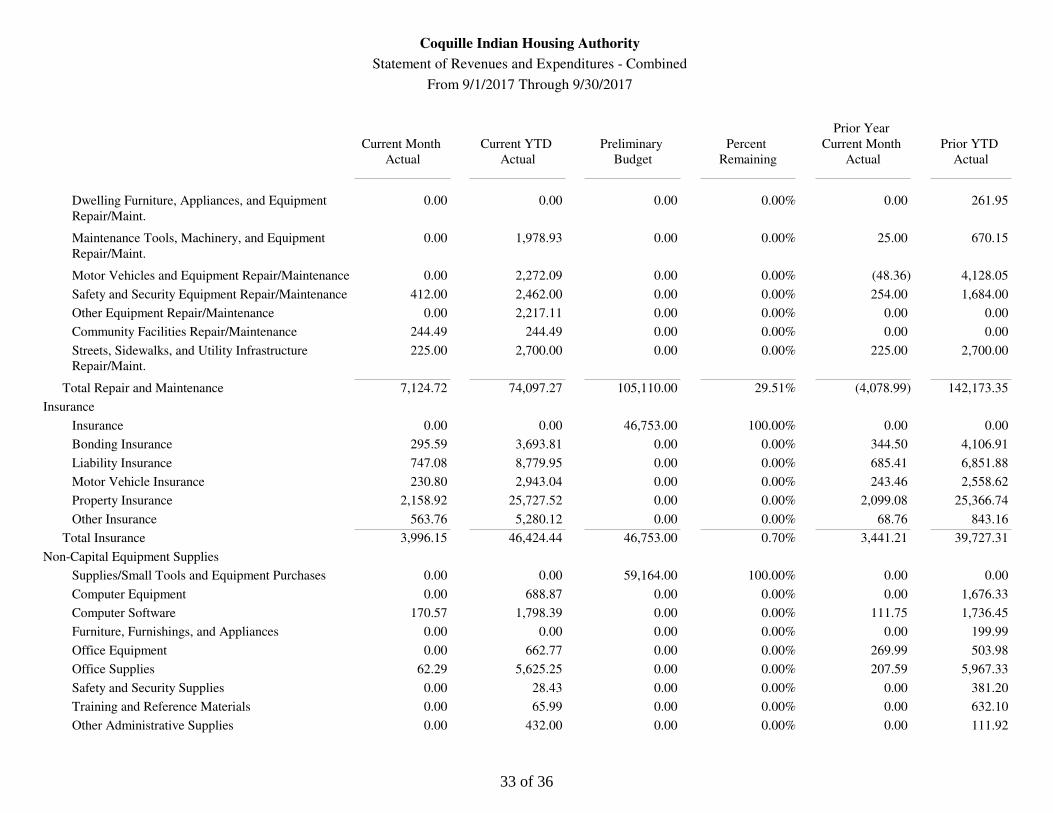
Dwelling Furniture, Appliances, and Equipment
Repair/Maint.
0.00 0.00 0.00 0.00% 0.00 261.95
Maintenance Tools, Machinery, and Equipment
Repair/Maint.
0.00 1,978.93 0.00 0.00% 25.00 670.15
Motor Vehicles and Equipment Repair/Maintenance 0.00 2,272.09 0.00 0.00% (48.36) 4,128.05
Safety and Security Equipment Repair/Maintenance 412.00 2,462.00 0.00 0.00% 254.00 1,684.00
Other Equipment Repair/Maintenance 0.00 2,217.11 0.00 0.00% 0.00 0.00
Community Facilities Repair/Maintenance 244.49 244.49 0.00 0.00% 0.00 0.00
Streets, Sidewalks, and Utility Infrastructure
Repair/Maint.
225.00 2,700.00 0.00 0.00% 225.00 2,700.00
Total Repair and Maintenance 7,124.72 74,097.27 105,110.00 29.51% (4,078.99) 142,173.35
Insurance
Insurance 0.00 0.00 46,753.00 100.00% 0.00 0.00
Bonding Insurance 295.59 3,693.81 0.00 0.00% 344.50 4,106.91
Liability Insurance 747.08 8,779.95 0.00 0.00% 685.41 6,851.88
Motor Vehicle Insurance 230.80 2,943.04 0.00 0.00% 243.46 2,558.62
Property Insurance 2,158.92 25,727.52 0.00 0.00% 2,099.08 25,366.74
Other Insurance 563.76 5,280.12 0.00 0.00% 68.76 843.16
Total Insurance 3,996.15 46,424.44 46,753.00 0.70% 3,441.21 39,727.31
Non-Capital Equipment Supplies
Supplies/Small Tools and Equipment Purchases 0.00 0.00 59,164.00 100.00% 0.00 0.00
Computer Equipment 0.00 688.87 0.00 0.00% 0.00 1,676.33
Computer Software 170.57 1,798.39 0.00 0.00% 111.75 1,736.45
Furniture, Furnishings, and Appliances 0.00 0.00 0.00 0.00% 0.00 199.99
Office Equipment 0.00 662.77 0.00 0.00% 269.99 503.98
Office Supplies 62.29 5,625.25 0.00 0.00% 207.59 5,967.33
Safety and Security Supplies 0.00 28.43 0.00 0.00% 0.00 381.20
Training and Reference Materials 0.00 65.99 0.00 0.00% 0.00 632.10
Other Administrative Supplies 0.00 432.00 0.00 0.00% 0.00 111.92
33 of 36
Coquille Indian Housing Authority
Statement of Revenues and Expenditures - Combined
From 9/1/2017 Through 9/30/2017
Actual
Current Month
Actual
Current YTD
Budget
Preliminary
Remaining
Percent
Actual
Current Month
Prior Year
Actual
Prior YTD
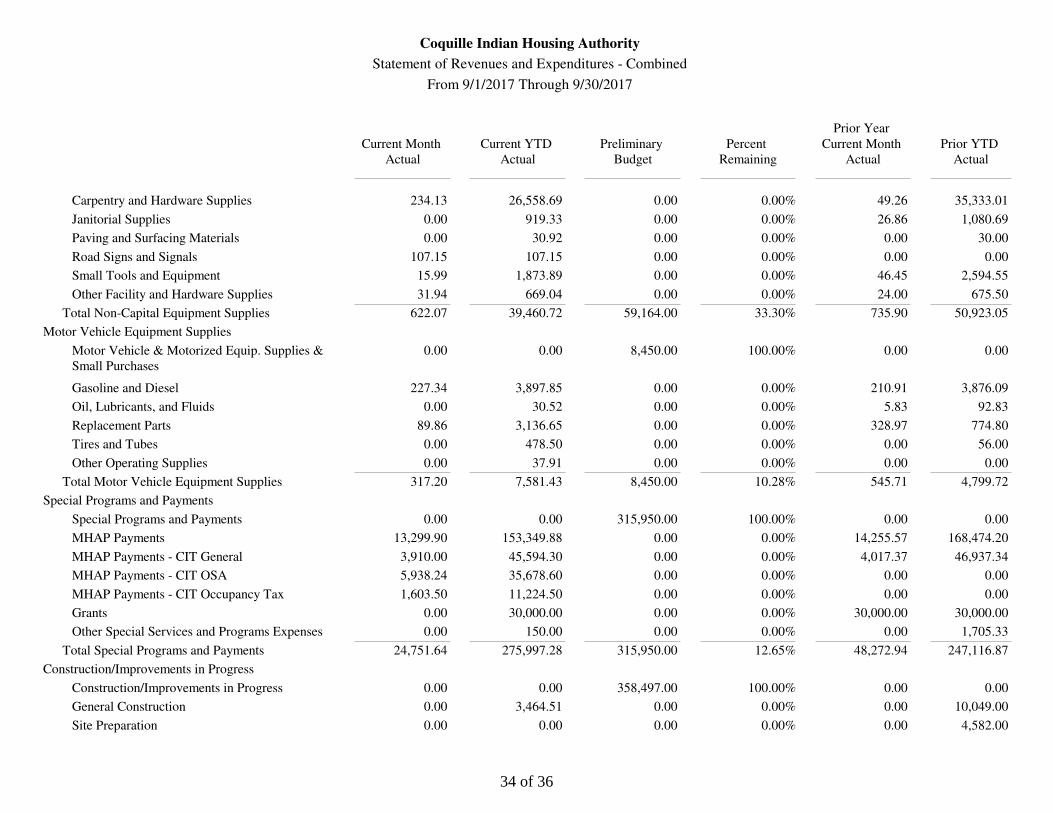
Carpentry and Hardware Supplies 234.13 26,558.69 0.00 0.00% 49.26 35,333.01
Janitorial Supplies 0.00 919.33 0.00 0.00% 26.86 1,080.69
Paving and Surfacing Materials 0.00 30.92 0.00 0.00% 0.00 30.00
Road Signs and Signals 107.15 107.15 0.00 0.00% 0.00 0.00
Small Tools and Equipment 15.99 1,873.89 0.00 0.00% 46.45 2,594.55
Other Facility and Hardware Supplies 31.94 669.04 0.00 0.00% 24.00 675.50
Total Non-Capital Equipment Supplies 622.07 39,460.72 59,164.00 33.30% 735.90 50,923.05
Motor Vehicle Equipment Supplies
Motor Vehicle & Motorized Equip. Supplies &
Small Purchases
0.00 0.00 8,450.00 100.00% 0.00 0.00
Gasoline and Diesel 227.34 3,897.85 0.00 0.00% 210.91 3,876.09
Oil, Lubricants, and Fluids 0.00 30.52 0.00 0.00% 5.83 92.83
Replacement Parts 89.86 3,136.65 0.00 0.00% 328.97 774.80
Tires and Tubes 0.00 478.50 0.00 0.00% 0.00 56.00
Other Operating Supplies 0.00 37.91 0.00 0.00% 0.00 0.00
Total Motor Vehicle Equipment Supplies 317.20 7,581.43 8,450.00 10.28% 545.71 4,799.72
Special Programs and Payments
Special Programs and Payments 0.00 0.00 315,950.00 100.00% 0.00 0.00
MHAP Payments 13,299.90 153,349.88 0.00 0.00% 14,255.57 168,474.20
MHAP Payments - CIT General 3,910.00 45,594.30 0.00 0.00% 4,017.37 46,937.34
MHAP Payments - CIT OSA 5,938.24 35,678.60 0.00 0.00% 0.00 0.00
MHAP Payments - CIT Occupancy Tax 1,603.50 11,224.50 0.00 0.00% 0.00 0.00
Grants 0.00 30,000.00 0.00 0.00% 30,000.00 30,000.00
Other Special Services and Programs Expenses 0.00 150.00 0.00 0.00% 0.00 1,705.33
Total Special Programs and Payments 24,751.64 275,997.28 315,950.00 12.65% 48,272.94 247,116.87
Construction/Improvements in Progress
Construction/Improvements in Progress 0.00 0.00 358,497.00 100.00% 0.00 0.00
General Construction 0.00 3,464.51 0.00 0.00% 0.00 10,049.00
Site Preparation 0.00 0.00 0.00 0.00% 0.00 4,582.00
34 of 36
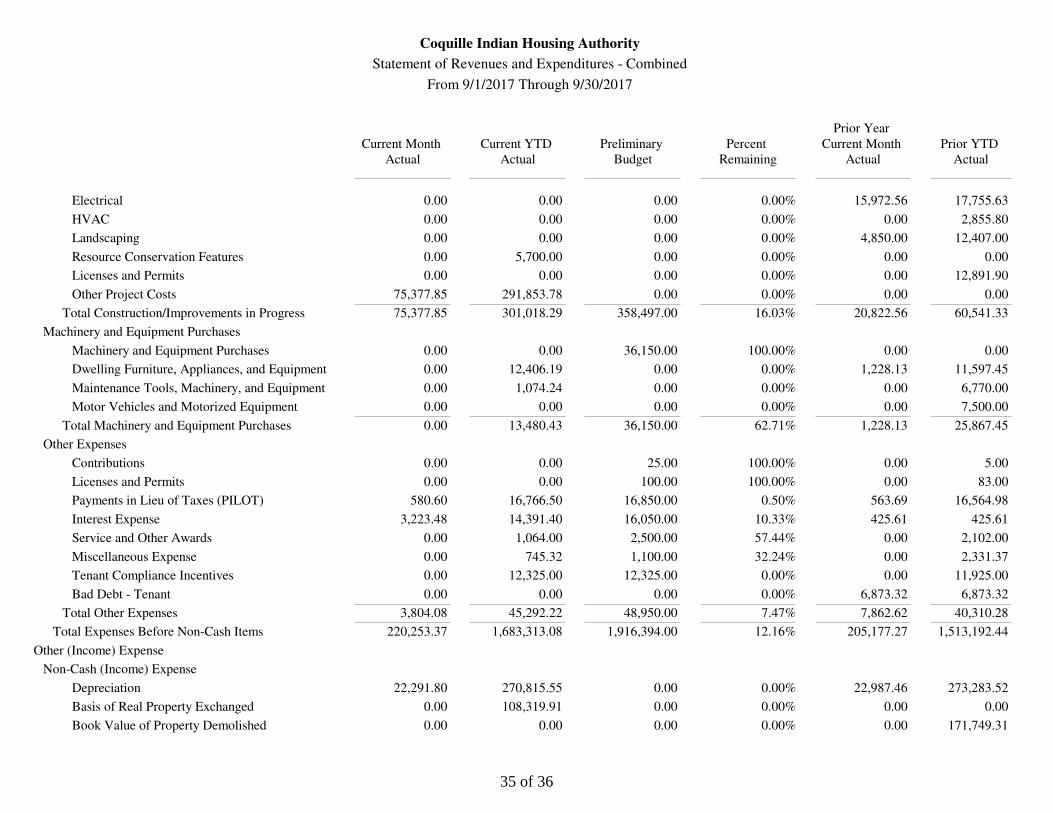
Coquille Indian Housing Authority
Statement of Revenues and Expenditures - Combined
From 9/1/2017 Through 9/30/2017
Actual
Current Month
Actual
Current YTD
Budget
Preliminary
Remaining
Percent
Actual
Current Month
Prior Year
Actual
Prior YTD
Electrical 0.00 0.00 0.00 0.00% 15,972.56 17,755.63
HVAC 0.00 0.00 0.00 0.00% 0.00 2,855.80
Landscaping 0.00 0.00 0.00 0.00% 4,850.00 12,407.00
Resource Conservation Features 0.00 5,700.00 0.00 0.00% 0.00 0.00
Licenses and Permits 0.00 0.00 0.00 0.00% 0.00 12,891.90
Other Project Costs 75,377.85 291,853.78 0.00 0.00% 0.00 0.00
Total Construction/Improvements in Progress 75,377.85 301,018.29 358,497.00 16.03% 20,822.56 60,541.33
Machinery and Equipment Purchases
Machinery and Equipment Purchases 0.00 0.00 36,150.00 100.00% 0.00 0.00
Dwelling Furniture, Appliances, and Equipment 0.00 12,406.19 0.00 0.00% 1,228.13 11,597.45
Maintenance Tools, Machinery, and Equipment 0.00 1,074.24 0.00 0.00% 0.00 6,770.00
Motor Vehicles and Motorized Equipment 0.00 0.00 0.00 0.00% 0.00 7,500.00
Total Machinery and Equipment Purchases 0.00 13,480.43 36,150.00 62.71% 1,228.13 25,867.45
Other Expenses
Contributions 0.00 0.00 25.00 100.00% 0.00 5.00
Licenses and Permits 0.00 0.00 100.00 100.00% 0.00 83.00
Payments in Lieu of Taxes (PILOT) 580.60 16,766.50 16,850.00 0.50% 563.69 16,564.98
Interest Expense 3,223.48 14,391.40 16,050.00 10.33% 425.61 425.61
Service and Other Awards 0.00 1,064.00 2,500.00 57.44% 0.00 2,102.00
Miscellaneous Expense 0.00 745.32 1,100.00 32.24% 0.00 2,331.37
Tenant Compliance Incentives 0.00 12,325.00 12,325.00 0.00% 0.00 11,925.00
Bad Debt - Tenant 0.00 0.00 0.00 0.00% 6,873.32 6,873.32
Total Other Expenses 3,804.08 45,292.22 48,950.00 7.47% 7,862.62 40,310.28
Total Expenses Before Non-Cash Items 220,253.37 1,683,313.08 1,916,394.00 12.16% 205,177.27 1,513,192.44
Other (Income) Expense
Non-Cash (Income) Expense
Depreciation 22,291.80 270,815.55 0.00 0.00% 22,987.46 273,283.52
Basis of Real Property Exchanged 0.00 108,319.91 0.00 0.00% 0.00 0.00
Book Value of Property Demolished 0.00 0.00 0.00 0.00% 0.00 171,749.31
35 of 36
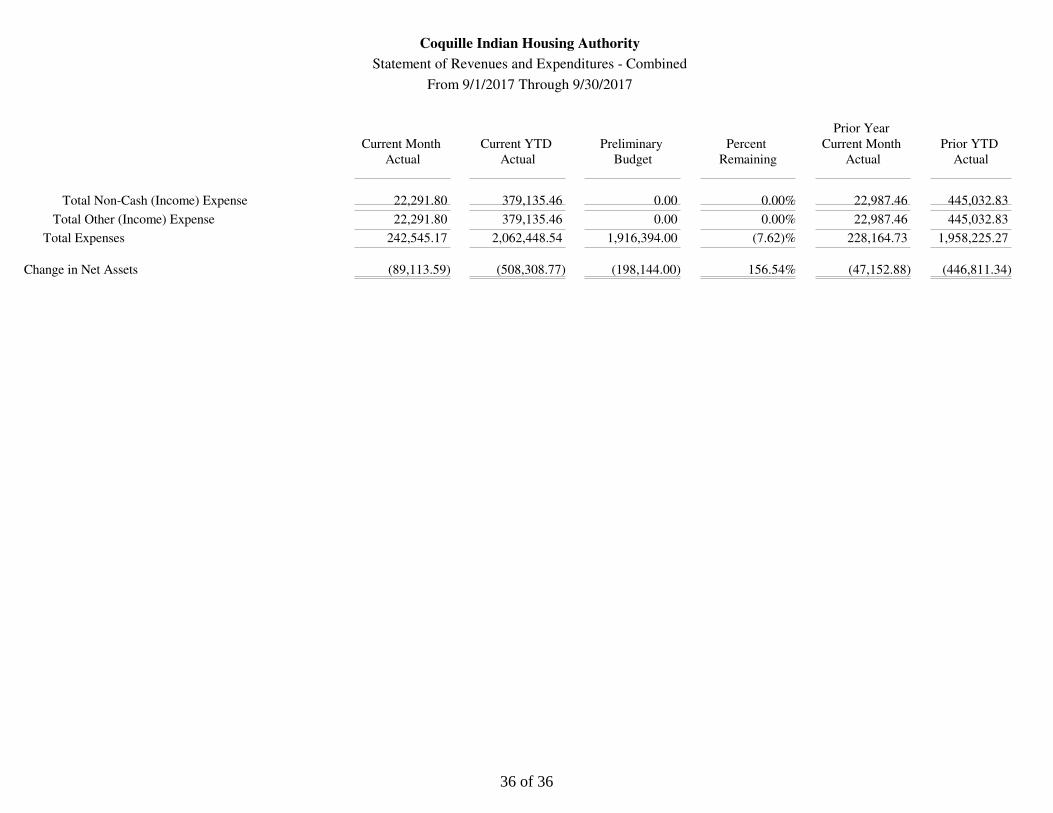
Coquille Indian Housing Authority
Statement of Revenues and Expenditures - Combined
From 9/1/2017 Through 9/30/2017
Actual
Current Month
Actual
Current YTD
Budget
Preliminary
Remaining
Percent
Actual
Current Month
Prior Year
Actual
Prior YTD
Total Non-Cash (Income) Expense 22,291.80 379,135.46 0.00 0.00% 22,987.46 445,032.83
Total Other (Income) Expense 22,291.80 379,135.46 0.00 0.00% 22,987.46 445,032.83
Total Expenses 242,545.17 2,062,448.54 1,916,394.00 (7.62)% 228,164.73 1,958,225.27
Change in Net Assets (89,113.59) (508,308.77) (198,144.00) 156.54% (47,152.88) (446,811.34)
36 of 36