Embed Size (px)
Citation preview
Debt Covenant Design and Creditor Control Rights:
Evidence from Covenant Restrictiveness and Loan Outcomes
Jing Wang*†
August 2013
Abstract
Using three measures of covenant restrictiveness, I examine the association between the ex ante
design of debt covenant restrictiveness and the ex post exercise of creditor control rights. I find
that contracts with higher level of covenant restrictiveness at loan origination are more likely to
subsequently experience both covenant violations and renegotiations, suggesting that stricter
covenants translate into more frequent exercise of creditor control rights. Further, I find that the
specific channel through which creditor control rights are exercised is influenced by the type of
the most restrictive covenant in the original contract. Overall, my results imply that the ex ante
design of covenant restrictiveness plays an important role in the ex post transfer of control rights.
* I thank David Denis, Mara Faccio, John McConnell, Jin Xu and Deniz Yavuz and seminar participants at Purdue University for helpful comments and suggestions. † Department of Finance, Fisher College of Business, Ohio State University, Columbus, OH 43210. Email: [email protected].

1
1. Introduction
Does the ex ante design of debt covenants influence the ex post exercise of creditor
control rights? Because prior studies document that borrowers with higher risk and lenders with
lower screening ability are more likely to write tighter covenants (Bradley and Roberts 2004,
Billett, King, and Mauer 2007, Murfin 2012), most prior literature on the design of debt
covenants shares the common assumption that tighter covenants will be triggered in more states
of the world. Thus, these covenants protect creditors from borrowers’ risk-shifting behavior
(Jensen and Meckling 1976, Smith and Warner 1979) by transferring control rights to creditors
more frequently.
Nonetheless, to my knowledge, no existing literature establishes the connection (if any)
between the ex ante design of debt covenants and the ex post transfer of control rights to
creditors. Specifically, it is unclear whether stricter covenants do indeed lead to more decision
rights being transferred from shareholders to creditors, and, if so, in which forms these creditor
control rights are exercised in the presence of stricter covenants.
Evidence on these issues is important in light of recent advances in the research on debt
contracts that have (sometimes conflicting) implications about the association between covenant
design and creditors’ interference. First, Demiroglu and James (2010) consider the signaling
motives of good borrowers and document that the selection of tight covenants incorporates
positive information about the borrower’s prospects and is associated with improvements in the
underlying covenant variables. If the choice of highly restrictive covenants mainly reflects the
incentive of good borrowers to signal the alignment of their interests with those of creditors, it is
possible that covenants with higher level of ex ante restrictiveness are not followed by a greater
frequency of breached covenant requirements (i.e., covenant violations). Second, in an
2
environment with information asymmetry and low renegotiation costs, Garleanu and Zwiebel
(2009) point out that debt covenant design is critical to another channel – covenant
renegotiations – through which creditors can influence firm behavior ex post. They argue that, in
face of information asymmetry, tight covenants allow creditors to defer some decision making to
the future. Contracting parties, therefore, are likely to renegotiate these original tight covenants
when more information is learned. Thus, if renegotiation costs are sufficiently low and the
design of stricter covenants takes account of ex post modifications of covenants, Garleanu and
Zwiebel’s (2009) model predicts that covenants with higher levels of ex ante restrictiveness are
associated with a higher likelihood of covenant renegotiations even in the absence of covenant
violations. Third, Christensen and Nikolaev (2012) argue that different types of covenants are
likely to mitigate agency problems through different mechanisms, i.e., either through ex ante
interest alignment or through ex post control rights transfer.1 As a result, apart from the level of
covenant restrictiveness, the types of highly restrictive covenants in the contracts, ex ante, might
be associated with the specific mechanism through with interest conflicts are mitigated and the
specific form through which creditor control rights are exercised.
I attempt to shed light on these issues by directly examining the association between
covenant restrictiveness and loan outcomes. For a sample of 1,000 credit agreements initiated
between 1996 and 2005, I compute the level of restrictiveness for the financial covenants in each
contract, and document the occurrence and frequency of covenant violations and covenant
renegotiations. I address the following questions: (1) How does covenant restrictiveness evolve
during the life of the contact? (2) Are ex ante stricter covenants more likely to trigger both
1 For example, covenants that specify various performance thresholds are more likely to serve as trip wires to transfer control rights to creditors in poor economic states; while covenants that set minimum capital requirement are more likely to align the interests between shareholders and creditors by requiring shareholders maintain a certain level of capital within the firm.
3
covenant violations and renegotiations? (3) Controlling for the level of covenant restrictiveness,
does the type of highly restrictive covenant incrementally influence the outcome of the loan?
Since control rights will be shifted to creditors if just a single covenant is about to be
breached, I focus on the most restrictive covenant in the contract to investigate the association
between the ex ante covenant restrictiveness and the ex post control rights transfer. I measure
covenant restrictiveness in three ways: (i) the covenant cushion which is the percentage
difference between the actual covenant variable and its contractual limit, (ii) the estimated
probability of violation based on the historical volatility of the covenant variable (Murfin 2012),
and (iii) whether the contractual threshold follows a predetermined tightening schedule over
time. I identify the most restrictive covenant in each contract by comparing the levels of
restrictiveness for the financial covenants in the same contract, using the three measures of
covenant restrictiveness respectively.
To assess the frequency of creditors’ exercise of control rights, I analyze the frequency of
covenant violations and renegotiations within my sample and find that both are very common.
Specifically, I find that 32% of the contracts experience at least one covenant violation, and half
of the sample experience at least one covenant renegotiation. More importantly, about 80% of
the contracts that experience some renegotiation do not have reported covenant violations that
occur within the same fiscal year of covenant renegotiation. This evidence suggests that
creditors obtain control rights through two equally important channels and it is necessary to
consider both of the two channels to understand the extent to which creditors can influence firm
behavior during the lending process.
To address whether the initial covenant restrictiveness is associated with the outcome of
the loan, I first document the evolution of covenant restrictiveness and computed percentage of
4
contracts in violation during the life of the contract. The purpose of this analysis is to gauge
whether there is a general pattern in how the level of covenant restrictiveness evolves after the
loan is established. If tighter covenants are designed with the purpose of leading to more
creditor control, we should observe that tighter covenants, on average, evolve to be very close to
the limits and a large fraction of them should fall in violation as maturity elapses. In contrast, if
tighter covenants are mainly a transmitter of positive information about good borrowers, the
actual covenant variables for tighter covenants should evolve to be further away from the limits,
and tighter covenants should, on average, do not breach the limits through the life of the
contracts. I find consistent evidence with the control rights transfer argument. In particular, for
the most restrictive covenants in my sample, the actual covenant variables, on average, do not
comply with their contractual limits after the loans are initiated. For example, the average
covenant cushion for the most restrictive covenants decreases from 5% at origination to -9% by
the time of maturity. Moreover, within the group of the most restrictive covenants and under the
original contracts, the percentage of violations for covenants with above median restrictiveness is
over 40%, which is more than double of that for covenants with below median restrictiveness.
The evolution of covenant restrictiveness suggests that covenants with different levels of
restrictiveness at loan origination do tend to evolve in exceptionally distinct patterns throughout
the lift of the loan.
To formally examine the relation between the initial covenant restrictiveness and the final
loan outcome, I utilize Probit models and find evidence that is consistent with the notion that ex
ante stricter covenants indicate greater ex post creditor decision rights. I find that the level of
covenant restrictiveness in the original contract is positively and significantly associated with the
likelihood of future exercise of creditor control rights through both covenant violations and
5
renegotiations. Moving the most restrictive covenant in a credit contract from below median to
above median restrictiveness significantly increases the likelihood of a covenant violation by
over 10% and the likelihood of a covenant renegotiation by over 20%. Considering that the
unconditional likelihoods of covenant violations and renegotiations are 32% and 49%,
respectively, the impact of the initial covenant restrictiveness on the outcome of the loan is
economically significant. Moreover, if the most restrictive covenant in a contract serves as the
trip wire for creditors’ intervention, it should be the exact covenant that transfers control rights to
creditors. I find that, compared to other covenants within the same contract, the most restrictive
covenant is significantly more likely to be modified in future renegotiations. This evidence
establishes a direct link between the initial covenant design and the ex post covenant
renegotiations, further suggesting that writing very stringent covenants that can later be modified
is an important channel through which creditors can obtain greater influence over borrowers.
To further understand the role of covenant restrictiveness in mitigating interest conflicts
and transferring control rights, I investigate another important aspect in the design of covenant
restrictiveness – the type of covenant that is selected to be the most restrictive one in a contract.
I assess whether the type of the most restrictive covenant in a contract is associated with the
outcome of the loan. Based on arguments in Aghion and Bolton (1992) and Christensen and
Nikolaev (2012), I hypothesize that contracts with capital expenditure restrictions (income
statement covenants) as the most restrictive covenants in the contracts will be more likely to
trigger creditor intervention through covenant renegotiations (covenant violations). By contrast,
contracts with balance sheet covenants as the most restrictive covenants will have a lower
probability of creditors’ intervention through either of the two channels.2 Consistent with these
2 A full discussion of these hypotheses is in section 2.
6
predictions, I find that controlling for the level of covenant restrictiveness, when a restriction on
capital expenditures represents the most restrictive covenant in a contract, the probability of any
covenant renegotiation increases by around 20%. If an income statement covenant is designed to
be the most restrictive covenant in a contract, the probability of a covenant violation increases by
7-12%. By contrast, when a balance sheet covenant sets the most restrictive requirement in a
contract, the likelihoods of covenant violations and renegotiations are both reduced.
Overall, my results support the argument that covenant design has an important influence
on the ex post allocation of decision rights. This study is the first, of which I am aware, to
provide evidence that writing highly restrictive covenants in the original contracts facilitates
future control rights transfer from borrowers to lenders. Such control rights are exercised
through two parallel channels: covenant violations and covenant renegotiations. Ex post, the
likelihood of creditor control exercised through either of the two channels is influenced by the
type of the most restrictive covenant in the contract.
My evidence supports the predictions of Garleanu and Zwiebel (2009). The strong
association between covenant restrictiveness and future covenant renegotiations in the absence of
a violation suggest that the possibility of future renegotiations of the contract plays an important
role in the initial design of the contract. With low renegotiation cost, writing very tight
covenants as a method of deferring some decision making into the future is an effective way of
debt governance. Although my evidence does not dispute the existence of the signaling
incentive of tight covenants proposed by Demiroglu and James (2010), my findings suggest that
it is unlikely to be the dominant motivation in writing highly restrictive covenants. My findings
also confirm Christensen and Nikolaev (2012) that covenants are designed to control agency
problems via different mechanisms. The ex post actions that contracting parties take to mitigate
7
interest conflicts are associated with the original choice of covenants. Taken together, my
findings imply that covenants are designed with the likely future outcomes in mind.
My findings also provide a more complete depiction of the extent of creditor control by
directly documenting the frequency of both covenant violations and covenant renegotiations.
The two channels of creditor control are both pervasive but with little overlap, indicating that it
is important to consider both of the two channels to understand the true impact of creditor control
rights. In addition, this paper studies covenant design from a more refined angle than most of the
prior literature that tends to focus on the number of covenants or an overall measurement of
covenant restrictiveness (e.g., Billett, King, and Mauer 2007, Murfin 2012). As far as I am
aware, this is the first study that investigates the structure of covenant restrictiveness within the
same contract. My findings suggest that the considerable variation in covenant restrictiveness
within the same contract is an important aspect that should not be overlooked in studying the
design of debt contract.
2. The Connection between Covenant Design and Creditor Control Rights
Prior literature establishes two stylized observations: (i) although covenants are on
average set tightly, there is sizeable variation in the level of covenant restrictiveness among
private debt contracts (e.g., Dichev and Skinner 2002, Chava and Roberts 2008, Demiroglu and
James 2010, Murfin 2012); and (ii) creditors frequently exercise their control rights during the
life of the loan through either covenant violations or covenant renegotiations (Chava and Roberts
2008, Sufi and Roberts 2009, Nini, Smith and Sufi 2012, Denis and Wang 2013). One natural
question from these empirical regularities is whether the initial restrictiveness of the covenants
plays a role in the ultimate allocation of control rights. In the following, I organize the
8
discussion of the association between covenant design and creditor control rights around two
aspects in the design of covenant restrictiveness: the level of restrictiveness and the type of
covenants that are selected to be the most restrictive one in a contract.
2.1 The level of covenant restrictiveness and creditor control rights
Theoretical studies yield mixed predictions for the association between the initial
tightness of covenant thresholds and the likelihood of future creditor intervention. Early studies,
such as Hart and Moore (1998), model the contracting process in an environment with symmetric
information and argue that assets are better managed under managers than creditors. Their
model implies that, considering ex ante distortion in investment and ex post inefficient
liquidation, weak covenants should be imposed and ex post transfer of control should be rare. In
addition, contracts should anticipate future states of the world as accurately as possible so as to
avoid renegotiations.
More recent studies on the design of debt covenant restrictiveness focus on the
asymmetry of information between borrowers and lenders and propose at least two different
arguments to rationalize the design of covenant restrictiveness. One strand of literature argues
that, in an environment in which borrowers know more about their own prospects than do
lenders, the selection of tight covenants can be a credible way for borrowers to convey private
information and signal their congruent interest with lenders (Dessein 2005). That is, the
seemingly high level of restrictiveness that is frequently observed might simply reflects how the
contracting parties expect the covenant variables to evolve. Demiroglu and James (2010)
provide empirical evidence to support this argument. They investigate the tightness of two
specific covenants and find that the underlying covenant variables tend to improve if tight
9
covenants are selected in the original contracts. In this case, covenants that are tight from an ex
ante perspective will, on average, not be tight enough to trigger creditor control rights from an ex
post perspective. This line of literature, therefore, implies that there is little association between
covenant restrictiveness in the initial contracts and creditors’ intervention in the future.
Although remaining within the information-asymmetric environment, a second strand of
literature generates different predictions for the association between covenant restrictiveness and
creditors’ intervention; in particular, covenant renegotiations. Garleanu and Zwiebel (2009)
argue that covenants are deliberately set in a very restrictive way so as to trigger future
renegotiations when more information is learned. That is, tighter covenants incentivize ex post
covenant modification precisely when enough new information is learned to reassess optimal
contracts. In Garleanu and Zwiebel’s (2009) model, it is costly for creditors to collect and verify
information ex ante. Instead of denying credit to borrowers, creditors can write covenants that
are initially very restrictive and that, as a consequence, are likely to force contract restructuring
at a future date when more information is available. Similarly, Murfin (2012) argues that tighter
covenants are an effective way for creditors to substitute ex ante screening with ex post
monitoring. That is, when covenants evolve close to their limits, creditors have the option to
accelerate or terminate the loan. Using the threat of exercising such an option, creditors retain
the rights to decide whether to modify the covenant requirements through renegotiations or let
borrowing firms fall into technical default (i.e., covenant violations). In other words, the highly
restrictive covenants are not placed to price default risk, but to allocate bargaining power in later
renegotiations (Gorton and Kahn 2000). The key feature of this scenario is that covenants that
are more restrictive are associated with a higher likelihood of future covenant renegotiations.
10
2.2 Covenant type and creditor control rights
Another important aspect of covenant design is the choice of covenants to be included in
the debt contract. As originally argued in Aghion and Bolton (1992), covenants are associated
with creditor control rights through two major mechanisms: first, covenants align interests
between shareholders and creditors by imposing specific restrictions that reduce the likelihood of
managerial actions that result in wealth transfers from creditors to stockholders; second,
covenants allow a state contingent transfer of control rights from shareholders to creditors when
interest alignment is difficult to achieve. That is, creditors can use the opportunity of a technical
default to pressure firms to alter their policies and reduce credit risk.
Christensen and Nikolaev (2012) argue that the two mechanisms are associated with two
different types of covenants, respectively. First, covenants that set minimum capital
requirements (i.e., balance sheet covenants) align the interest between shareholders and creditors,
because they make shareholder value sensitive to managerial actions. This reduces the need for
creditor governance. Second, covenants that specify various performance thresholds (i.e.,
income statement covenants) serve as trip wires that will cause covenant violations and,
therefore, transfer control rights to creditors in poor economic states.
In addition, besides the above two types of covenants that are studied in Christensen and
Nikolaev (2012), financial covenants in private debt contracts commonly include explicit
restrictions on the amount of capital expenditures that borrowers can spend each year (Nini,
Smith and Sufi 2009). Such covenants are unlikely to serve as trip wires to signal the true states
of the world because the actual amount of capital expenditures is under the control of the
managers. However, it is also unlikely that capital expenditure covenants are able to align the
interest between lenders and borrowers. As argued in prior studies, lenders usually possess less
11
information about borrowers’ investment opportunities than do managers, so it is difficult for the
lenders to gauge the optimal level of investment or the best projects for the borrowers to take at
the time of loan initiation and such restrictions may lead to distortion in firm investment (Jensen
and Mecking 1976, Smith and Warner 1979, Billett, King, and Mauer 2007). 3 Following
Garleanu and Zwiebel (2009), I hypothesize that this type of debt covenant mitigates agency
conflicts by engaging creditors in the process of decision making on borrowers’ capital
investment. However, to avoid potential distortion in firm investment policy, such covenants are
likely to be renegotiated when more information is revealed to the creditors about the optimal
investment amount and projects.4
If different types of covenants are associated with different mechanisms that control
agency problems, the specific nature of the most restrictive covenant in a contract should also be
connected with the ultimate resolution of agency conflicts, i.e., the outcome of the loan. I
hypothesize that contracts with capital expenditure restriction (income statement covenants) as
the most restrictive covenants in the contracts will be more likely to trigger creditor intervention
through covenant renegotiations (violations). By contrast, contracts with balance sheet
covenants as the most restrictive covenants will have a lower probability of both covenant
violations and covenant renegotiations.
Based on the above discussion, it is an empirical issue to evaluate whether stricter
covenants indeed lead to more decision rights being transferred from shareholders to creditors
and whether creditor control rights are exercised in both covenant violations and renegotiations.
3 These earlier studies focus on public debt and find that explicit restrictions on firms’ operating (such as capital expenditures) are very rare. 4 As argued in Smith and Warner (1979) and Leftwich (1981), the disperse ownership of public bonds make it extremely difficult to renegotiate their terms. The ability to renegotiate also explains why explicit restrictions on capital expenditures are only seen in private debt contract.
12
Such empirical evidence will help us to differentiate among various theoretical models and to
better understand the variation in covenant design. In addition, if covenants are in general
designed with their ex post impact in mind, the choice of the most restrictive covenant should
also hint at the likely outcome of the loan.
3. Data and Measurements
3.1 Sample and data
My sample consists of 1,000 private credit agreements between 819 unique non-financial
U.S. public firms and their lenders during the period 1996 to 2005. These debt contracts are
randomly selected from the sample used in Nini, Smith and Sufi (2009) which include 3,720
private loan contracts collected from the Loan Pricing Corporation’s (LPC) Dealscan database.5
I use a random sample because of the large amount of time involved in the calculation of
covenant restrictiveness and the collection of covenant renegotiations. These processes require
carefully reading through each debt contract and its amendments to locate specific covenant
definitions and any modifications (the specific details of data collection and calculation are
described below). Thus, a random sample that is smaller than the Dealscan universe helps to
make these processes manageable. Nonetheless, in an unreported table, I show that my sample is
representative of the original Nini, Smith and Sufi’s (2009) sample in most firm characteristics.6
5 They further require all the contracts in their sample have (i) available Compustat information, and (ii) their original credit agreements in the SEC filings. The 1,000 debt contracts in my random sample actually covers 1,149 contracts of the 3,720 contracts in Nini et al’s (2009) sample, because a proportion of their sample are actually renegotiated contracts of the existing contracts in the sample instead of independently initiated contracts. 6 The comparison between my random sample and the original Nini et al’s (2009) sample can be found in Denis and Wang (2013).
13
Although Dealscan contains information on financial covenants, the reporting is
insufficient and sometimes unreliable. Due to the purpose of this study, these limitations in the
Dealscan database are not negligible. For example, for some covenants, the covenant recording
in Dealscan is sparse, causing problems in identifying the most restrictive covenant in a
contract.7 For covenants that set different contractual limits for different periods during the life
of the contract (i.e., a tightening schedule, a loosening schedule or a fluctuating schedule),
Dealscan only reports the initial contractual limit. However, the different contractual limits
throughout the life of the contract are necessary in my measure of covenant restrictiveness and in
later investigation on the evolutions of covenant restrictiveness. Therefore, I collect detailed
covenant information for the 1,000 random credit contracts by reading the full text of the
contracts. Borrower-covenant information is then merged with firm information from Compustat
to calculate the actual covenant variables and to compute the measures of covenant
restrictiveness.
With respect to information on loan outcomes, covenant violation data are provided by
Nini, Smith and Sufi (2012). They collect the reported financial covenant violations available in
the SEC quarterly filings (10-Ks and 10-Qs). With respect to the renegotiation data, the SEC
also requires that all public firms file detailed credit agreements and report any material changes
to these credit agreements. Covenant renegotiation information is, therefore, collected by
reading amendments available in the SEC filings (10-Qs, 10-Ks and 8-Ks) from loan origination
until the time the loan expires or August 2011, whichever comes sooner, to identify any changes
in the covenants covered in this study. I read all the available renegotiation documents and
compare them with the original credit contracts (if no prior changes to the covenants exist) and
7 For example, Nini, Smith and Sufi (2009) find that the information on capital expenditures restriction is missing in Dealscan for many contracts in their sample.
14
previous amendments (if prior renegotiations of the covenants exist) to determine whether any of
the covenants in my sample are changed in a specific renegotiation document.8
3.2 Measurements of covenant restrictiveness
I measure the level of covenant restrictiveness in three ways. How restrictive a covenant
is largely depends on the amount of flexibility it gives the firm in its operation without triggering
a covenant violation. Therefore, the first measure of covenant restrictiveness is covenant
cushion, which is defined as the percentage distance between the actual covenant variable and its
contractual limit. More specifically, for covenants that set a maximum level for a financial ratio,
covenant cushion is calculated as:
Covenant cushion= 1-(Actual covenant variable/Contractual limit).
For covenants that set a minimum level for a financial ratio, the ratio in the parentheses is
inverted. Initial covenant cushion is measured in the period when the contract is originated.9
The advantage of this measure is that it intuitively quantifies the discretionary room given in the
covenants.
Following Murfin (2012), the second measure of covenant restrictiveness is an estimated
probability of violation. For a covenant that limits the maximum value of r for the financial ratio
r which is assumed to be normally distributed with standard deviation σ, the estimated
probability of violating the covenant (P) is calculated as:
P= 1- Φ[(r-rt)/ σ].
8 See Appendix for an example which shows the comparison between the original contract and its amendment for the same covenant. 9 Some covenant items are defined over a period of a quarter; while others are defined over a period of a fiscal year.
15
Φ denotes the cumulative standard normal distribution function. For covenants that set a
minimum level for a financial ratio, the numerator in the parentheses is multiplied by minus one.
The quarterly standard deviation of the covenant variable is estimated over the twelve quarters
before the credit contract is initiated. Similar to the first measure (i.e., the covenant cushions),
the estimated probability of violation is calculated for each period during the life of the loan and
the one that is calculated in the first period is regarded as the initial covenant restrictiveness.
Since the same distance of deviations from the contractual limit has different meanings for
different financial ratios of different borrowers, this measure is able to capture the differences by
scaling the covenant slack by its own variance.
In addition, some covenant restrictions are not static but adjusted following a
predetermined schedule over time. In particular, most of such covenants set more rigorous
requirements for the underlying covenant variables at some later time of the contracting period
than when the contract is first initiated. To capture the dynamic perspective of covenant
restrictiveness, the third measure of covenant restrictiveness is an indicator of whether the
covenant restriction follows a tightening schedule. Covenants that set a predetermined
tightening schedule are regarded as more restrictive than covenants without such schedule.
A complicating issue in the first two measures is that the actual covenant variable is
measured with error. The measurement error comes from two sources. First, the same covenant
may have slightly different definitions in different contracts. For example, different contracts
may modify the definition for “fixed charge” differently according to the firm’s specific charges
16
incurred in its operation. Second, some variables in covenant calculation are simply not
available to the public and some clauses associated with the covenants are difficult to verify.10
I conduct two steps to mitigate the potential measurement errors. First, I focus on the
covenants with relatively standard definitions. Restrictiveness of six covenants is studied in this
paper: capital expenditure restriction, minimum interest coverage ratio, maximum
DEBT/EBITDA ratio, net worth covenants (i.e., minimum net worth or minimum tangible net
worth), debt to balance sheet covenants (i.e., maximum debt/capital, maximum debt/net worth
and maximum debt/tangible net worth) and liquidity covenants (i.e., minimum current ratio or
minimum quick ratio). 11 Second, I read all contracts with those covenants to check their specific
definitions. If the definition of a covenant contains a large adjustment that is not publicly
available, the covenant is then excluded from the sample.12 Such exclusions occur to two
specific covenants: capital expenditure restriction and net worth covenant. Among the 321
capital expenditure restrictions in my sample, 20 observations are excluded due to large
adjustments; while among the 476 net worth covenants in my sample, 19 observations are
10 One of the challenges in computing covenant cushion is that the definitions of covenant variables in private debt contract can be different with various adjustment from the standard GAAP-based Compustat financial items across different debt contracts. Creditors may modify the definitions to suit different borrower characteristics (e.g., Leftwich 1983). For example, in the 2000 credit agreement for Marsh Supermarkets Inc., the fixed charge coverage ratio is defined as “(i) the sum of the amounts of EBITDA plus Rentals paid during such period, to (ii) the sum of the amounts paid during such period of (a) Interest Expense plus (b) scheduled amortization payments of the principal portion of all other Consolidated Indebtedness of the Borrowers made during such period plus (c) cash taxes paid by the Borrowers and their consolidated Subsidiaries during such period plus (d) Distributions plus (e) Capital Expenditures paid in cash from other than (x) a Revolving Loan or other Indebtedness or (y) Net Cash Proceeds of a Material Asset Sale, Equity Offering or Material Insured Casualty Loss used to acquire, repair or replace capital assets within twelve months following such transaction, plus (f) Rentals paid during such period.” 11 Restrictiveness for the following covenants are not calculated: fixed charge coverage ratio, minimum debt service coverage ratio, cash flow only covenants (i.e., minimum EBITDA and minimum net income), maximum senior DEBT/EBITDA ratio minimum, and other liquidity ratio. 12 For example, the definition of capital expenditures in the 1999 credit agreement for Bio-Rad Laboratories, Inc. is specified as: "Capital Expenditures" means, without duplication, any expenditures for any purchase or other acquisition of any asset which would be classified as a fixed or capital asset on a consolidated balance sheet of the Borrower and its Subsidiaries prepared in accordance with Agreement Accounting Principles, excluding (i) the trade-in value of equipment or other assets exchanged for replacement assets, (ii) expenditures of insurance proceeds to rebuild or replace any asset after a casualty loss, (iii) the PSD Acquisition and (iv) Permitted Acquisitions.
17
excluded due to large adjustments. Although my calculation of covenant restrictiveness is not
exhaustive, it covers the majority of financial covenants in the 1,000 debt contracts in my
sample.13 Therefore, the exclusion of certain covenants is not likely to bias the results.
3.3 Covenant restrictiveness within the same contract
I first document the distributions of the most restrictive covenants in the credit contracts
using the three measures of covenant restrictiveness, respectively. Panel A of Table 1 presents
the distributions of the most restrictive covenants in the 1,000 debt contracts, using covenant
cushion and estimated probability of violation.14 Each of the six covenants serves as the most
restrictive covenant in some credit contracts, although capital expenditure restriction,
DEBT/EBITDA ratio covenant and (tangible) net worth covenant are the most frequent ones.
The results also suggest that the most restrictive covenants are not clustered within a certain type
of covenants. In addition, the distributions of the most restrictive covenants using the two
measures are very similar.
Panel B of Table 1 presents the distribution of the most restrictive covenants, measured
by the existence of a tightening schedule. On average, 58% of the contracts in my sample
13 My calculation for covenant restrictiveness covers 75% of all financial covenants in the 1,000 random private credit contracts. To make exclusion of a concern even less, many excluded covenants are usually used in conjunction with the covenants that are calculated with covenant restrictiveness. For example, a minimum fixed charge coverage ratio covenant is likely to be used together with a minimum interest coverage ratio covenant. Although do not calculate covenant restrictiveness for fixed charge coverage ratio, interest coverage ratio covenant is indeed included in my sample. 14 When there is no covenant restrictiveness calculated for the contract at all, the contract is classified as not having restrictive covenants. In addition, when using the measure of estimated probability of violation, if each of the covenants in the contract has a zero estimated probability of violation, the contract is also classified as not having restrictive covenants. This occurs in 68 contracts. The majority of the “zero estimated probability of violation” covenants are DEBT/Balance sheet item ratio covenants. If the contract has a restrictiveness level calculated for only one covenant, that covenant is identified as the most restrictive covenant of the contract since no limits are set for other financial ratios.
18
contain at least one covenant with such schedule.15 Income statement covenants, which compare
a firm’s debt obligation with its performance, are likely to follow a predetermined tightening
schedule. Over 30% of the contracts specify either a tightening interest coverage ratio or a
tightening DEBT/EBITDA ratio. Among all the balance sheet covenants, contractual limits for
the firm’s net worth or tangible net worth are likely to increase over time.
Panel C and Panel D in Table 1 report the correlation between the most restrictive
covenants identified by the existence of a tightening schedule and those identified by the other
two measures, respectively, for the same contract. In general, the most restrictive covenants
identified by the other two measures are also likely to follow a predetermined tightening
schedule. Therefore, all my three measures of covenant restrictiveness exhibit high consistency
in identifying the most restrictive covenants in the contracts.
More importantly, there is considerable variation in covenant restrictiveness within the
same contract. Table 2 compares the covenant cushion of the most restrictive covenant and that
of the least restrictive covenant in the same contract.16 I restrict this analysis to the credit
contracts that have at least two covenants with available information to measure their covenant
cushions. This requirement yields 677 credit contracts. I find that, the covenant cushions of the
least restrictive covenants in the debt contracts give the covenant variables sizable room to
deviate from their current levels without triggering a covenant violation. In contrast, the
covenant cushions for the most restrictive covenants in the debt contracts are significantly
smaller. In fact, at the median level, the covenant cushion for the most restrictive covenant is
less than 25% of that for the least restrictive covenant in the same contract. Since some
15 Among the 576 contract which have at least one covenant with a tightening schedule in the contract, 307 contacts have only one covenant with such schedule. 16 I only present this comparison using covenant cushions, because this measure is more intuitive to interpret the discretionary room given in the covenants.
19
covenants are significantly less restrictive than the others in the same contract, if I consider the
average level of restrictiveness of all the covenants in the same contract to study the association
between the design of covenant restrictiveness and loan outcomes, the result will bias towards no
connection between the two. However, control rights transfer through covenants takes places if a
single covenant is in violation or needs to be modified. Therefore, the most restrictive covenant
in the contract is more relevant to the question I am trying to address in this study.
Compared to the limited prior research on covenant restrictiveness, results from Tables 1
and 2 imply that identifying the most restrictive covenant within a contract could provide a
promising approach to understanding the role of highly restrictive covenants. On one hand, the
relatively wide distribution of the most restrictive covenants suggests that focusing on the
restrictiveness of two selected covenants is unlikely to capture the whole picture of covenant
restrictiveness (Demiroglu and James 2010). On the other hand, the substantial differences
between the most restrictive and the least restrictive covenants imply that considering the
restrictiveness of all the covenants in the same contract could give a misleading picture of the
true restrictiveness if some of the covenants are much less restrictive than the others (Murfin
2012).17
4. Covenant Restrictiveness and Creditor Control Rights
This section studies the association between the initial covenant restrictiveness and the
loan outcomes. I first document the evolution of covenant restrictiveness during the life of the 17 For example, a contract with one highly restrictive (i.e., close to violation) DEBT/EBITDA ratio covenant and one loosely set current ratio may have a similar restrictiveness score as a contract with three loosely set financial covenants if the restrictiveness of the whole covenant package is considered. However, it may be very fast for the firm with the first contract to exceed the DEBT/EBITDA ratio requirement and therefore yield significant decision rights to the creditors. In contrast, the three loosely set financial covenants in the other contract may be complied with over the entire life of the contract. Thus, no control rights are transferred to the creditors.

20
contract conditional on (i) whether it is the most restrictive or the least restrictive covenant in the
contract and (ii) whether the most restrictive covenant is of high restrictiveness or low
restrictiveness. I then use Probit models to examine whether the initial covenant restrictiveness
is associated with the likelihoods of covenant violations and renegotiations in the future. Finally,
I investigate whether the most restrictive covenants are likely to serve as the exact trip wires that
shift control rights from shareholders to creditors.
4.1 The evolutions of covenant restrictiveness
To illuminate whether the initial level of covenant restrictiveness is likely to influence the
final resolution of control rights allocation, I first show the general pattern of how the level of
covenant restrictiveness evolves during the life of the loan. In this set of exercises, I focus on
covenant cushion to measure the level of covenant restrictiveness because covenant cushion
more directly demonstrates whether contractual limits are breached and therefore makes it easier
to gauge the extent of creditors’ influence.18
If tighter covenants are designed with the purpose of leading to more creditor control, we
should observe that tighter covenants, on average, evolve to be very close to the limit over time,
and a large fraction of them should fall into violation as maturity elapses. By contrast, if tighter
covenants are imposed primarily to signal positive information, we should observe that over
time, the average cushion for tighter covenants evolves to be further away from the limit, and the
percentage of covenants in violation is no higher for tighter covenant than for looser covenants.
18 Recall that the definition of covenant cushion is the percentage distance between the actual covenant variable and its contractual limit. As such, a positive cushion indicates no-violation and a negative cushion indicates violation.
21
To show whether there are distinct patterns in the evolution of covenant restrictiveness
conditional on the initial level of restrictiveness, I compare between two sets of covenant groups.
First, I separate the observations between covenants that are the least restrictive covenants in the
contracts and those that are the most restrictive ones in the contracts. Second, among the most
restrictive covenants in my sample, I group covenants into those with above median covenant
cushion (“low restrictive”) and those with below median covenant cushion (“high restrictive”). I
follow the average covenant cushion at loan origination, one third of the maturity, two-thirds of
the maturity, and the expiration date. In order to compare the evolution of covenant
restrictiveness between the least and the most restrictive covenants, I restrict this analysis to the
677 credit agreements that have at least two covenants with available information to calculate
their covenant cushions. In addition, I also show the evolution of the realized covenant
restrictiveness considering all the modifications caused by covenant renegotiations.
Panel A of Figure 1 compares the evolutions of covenant cushion between the least and
the most restrictive covenants. In general, covenant cushion tends to decrease as time passes,
even for the least restrictive covenants in the contracts, suggesting that the level of covenant
restrictiveness mostly evolves to be higher as the contract gets closer to maturity. Consistent
with the result in Table 2, during the life of the loan, the average covenant cushion for the most
restrictive covenants is significantly smaller than that for the least restrictive covenants.
Despite the general decreased trend in covenant cushion, the average covenant cushion
for the least restrictive covenants remains positive throughout the life of the contract. In striking
contrast, the covenant variables for the most restrictive covenants start to be very close to the
contractual limits at origination and quickly exceed the limits under the original covenant
requirements. However, future renegotiations bring covenant cushions back to the positive side.
22
Under the original contract, the average cushion turns negative after the contract is initiated only
for the most restrictive covenants, indicating that the purpose of imposing covenants with higher
restrictiveness is not likely to credibly signal more favorable information about the borrowers,
but to assign greater decision rights and more bargaining power to the creditors when the
contractual limits are approached.
Panel B of Figure 1 shows that, there is still considerable variation in the level of
covenant restrictiveness within the most restrictive covenants. During the life of the contract, the
average covenant cushion for the “low restrictive” group remains positive, while the average
covenant cushion for the “high restrictive” group stays negative. These patterns indicate that,
even as the most restrictive covenants in their contracts, if the covenants are of low
restrictiveness, the average covenant will still give the borrower enough slack in its operation
without the threat of an imminent violation. In contrast, if the covenants are of high
restrictiveness, the average covenant is in actual technical default which shifts significant
bargaining power and decision rights to creditors. These patterns are persistent across the life of
the contracts.
Another way to observe the evolution of covenant restrictiveness is to study the
percentage of covenants in violation during the life of the contract. A covenant is identified as in
violation if the computed underlying covenant variable does not comply with its contractual
limit, i.e., a negative covenant cushion. Panel A of Figure 2 shows that, a much larger
proportion of covenants are in violation for the most restrictive covenants than for the least
restrictive covenants. Within the most restrictive covenants, Panel B of Figure 2 compares the
percentage of covenants in violation during the life of the contract between the “low restrictive”
group and the “high restrictive” group. The figure shows that, at any point of time during the life
23
of the loans, the incidence of covenant violations are significantly higher for the “high
restrictive” group than that for the “low restrictive” group. These two figures provide further
evidence that as the initial covenant restrictiveness increases, more control rights transfers are
likely to occur.
In sum, the evolutions of covenant restrictiveness and computed percentage of violation
are better supported by the notion that the initial design of highly restrictive covenants facilitates
control rights being transferred to creditors since violations of these covenants are more likely.
The increased level of covenant restrictiveness and percentage of contracts in violation over time
cannot be reconciled with good borrowers’ signaling motivation.
In addition, the figures unanimously show that the average outcome of renegotiation is
relaxing the covenant limits. The average realized covenant cushion is larger than that under the
original contracts and the realized percentage of covenants in violation is smaller than that under
the original contracts, implying that covenant renegotiations help to proactively avoid some
potential violations before they actually happen.
4.2 Covenant restrictiveness and loan outcomes
Are ex ante covenant restrictiveness and ex post creditor control rights connected? The
univariate analysis in the previous subsection seems to suggest an affirmative answer to that
question. Although covenant cushions in general evolve to be much smaller, only the ones that
start with a small cushion appear to breach the limits. In addition, the realized cushions are
bigger than those that under the original contracts because covenant renegotiations inject some
slack into the cushions.
24
I estimate Probit models to formally examine to what extent covenant restrictiveness is
associated with actual covenant violations and renegotiations. The univariate analysis only
studies computed covenant violations of the least and the most restrictive covenants in the
contracts. In estimating Probit models, I include all the covenant violations reported to SEC
collected by Nini, Smith and Sufi (2012). More importantly, the univariate analysis shows that
covenant renegotiations appear to happen to covenants across all levels of restrictiveness.
Therefore, it is still not clear whether the positive association between covenant restrictiveness
and occurrence of covenant renegotiations predicted by Garleanu and Zwiebel (2009) exists.
As the basis of my main analysis, Table 3 reports the distribution of loan outcomes. Two
important observations emerge from the data. First, both covenant violations and renegotiations
are common. I find that over 30% of the contracts in my sample experience at least one
covenant violation and nearly half of the contracts experience at least one covenant renegotiation
before maturity. Second, renegotiations are not simply a remedy to fix covenant violations after
firms fall in technical default. Almost 90% of the covenant renegotiations do no occur within the
same fiscal year with any covenant violations. The above observations imply that it is critical to
study both covenant violations and renegotiations to fully understand how covenant design
influences the exercise of creditor control rights. Moreover, Table 3 also indicates that,
conditional on their existence, both covenant violations and renegotiations, on average, occur
more than once during the life of the contract.
To test whether the likelihoods of covenant violations and renegotiations increase as the
initial covenant restrictiveness increases, my Probit models are specified as:
Pr (Outcome i) = α + β Covenant restrictiveness i + γ ×X + εi (1)
25
I estimate the results for covenant violations and renegotiations separately using the above
equation. The dependent variable is 1 when at least one covenant violation (renegotiation)
occurs during the life of the contract i and 0 otherwise. The primary variable of interest,
“covenant restrictiveness” is presented in five different ways. I first use the three measures of
covenant restrictiveness directly. The covenant cushion and the estimated probability of violation
are continuous variables and the tightening schedule is a dummy variable.19 For the first two
measures, in order to make it easier to interpret the economic significance, I create a dummy
variable indicating whether the initial measure of covenant restrictiveness is above the median
level. Additionally, I control for loan characteristics and borrower credit risk at origination and
include year fixed effects and industry fixed effects. I also include a set of loan purpose dummy
variables to control for the potential impact of the purpose of the loan on the future occurrence of
creditor control.20
4.2.1 Covenant violations
Panel A of Table 4 reports estimates of the Probit models for covenant violations. Across
all measures of covenant restrictiveness, there is a strong positive association between initial
covenant restrictiveness and future occurrence of violations. With an unconditional likelihood of
a covenant violation of 32%, moving the most restrictive covenant in a credit contract from
below median restrictiveness to above median restrictiveness significantly increases the
likelihood of a covenant violation by 11-17%.
19 When covenant cushion is used directly, negative cushion is treated the same as zero cushion, because the negative raw number means the covenant is restrictive to the extent that no cushion is given to the borrower. 20 Loan purposes are collected from Dealscan and include: debt repayment, working capital, other corporate purposes, commercial paper backup, debtor-in-possession, acquisition, takeover, LBO, spinoff, capital expenditures, project finance, stock buyback, exit financing, recapitalization and other purposes.
26
One possible reason to include covenants with a tightening schedule is that, the
underlying covenant variables are expected to improve, so the borrowers are willing to commit
to higher requirements for the covenant variables over time. Therefore, covenants with a
tightening schedule are likely to serve as a signal of improvement as suggested by Demiroglu
and James (2010). However, Column (3) shows that the existence of covenants with a tightening
schedule significantly increases the probability of violations by 13%. As such, the time variant
covenant requirements do not necessarily mean that positive information about the borrowers has
been signaled through contract design. Instead, they seem to enable creditors to intervene when
borrowers cannot keep up with the gradually tightened covenant requirements.
With respect to other variables in the models, the existence of a credit rating is negatively
associated with the likelihood of future violations. Borrowers with a credit rating are about 17%
less likely to experience any covenant violations during the life of the contract. However, other
loan characteristics do not seem to impact the probability of covenant violations.
4.2.2 Covenant renegotiations
Panel B of Table 4 reports estimates of the Probit models for covenant renegotiations. I
find strong evidence supporting the predictions of Garleanu and Zwiebel (2009). Specifically,
covenants with a higher level of restrictiveness are followed by a higher likelihood of covenant
renegotiations in the future. To see the economic significance more clearly using the measures
of covenant cushion and estimated probability of violation, Columns (4) and (5) indicate that
moving the most restrictive covenant in a credit contract from below median restrictiveness to
above median restrictiveness significantly increases the likelihood of a covenant renegotiation by
over 20%. Considering that the unconditional likelihood of a covenant renegotiation is 49%, the
27
impact of covenant restrictiveness at the time of loan origination on the occurrence of future
covenant renegotiation is economically significant. Results from Column (3) suggest that the
existence of covenants with a tightening schedule significantly increases the probability of any
covenant renegotiation by 26%. Thus, such a schedule appears to allocate more bargaining
power to creditors in future renegotiations rather than to convey positive information about the
future performance of the covenant variables.
The existence of a credit rating remains a strong factor in predicting the likelihood of
covenant renegotiations as for covenant violations. Higher borrower credit risk measured by the
absence of a credit rating is associated with a higher probability of covenant renegotiations.
Furthermore, unlike the results for covenant violations, loan characteristics appear to impact the
occurrence of covenant renegotiations. Specifically, loans with longer maturities are more likely
to experience covenant renegotiations.
Therefore, besides the strong association between covenant restrictiveness and covenant
violations, consistent with Garleanu and Zwiebel (2009), covenant restrictiveness in the original
covenant is positively and significantly associated with the likelihood of covenant renegotiations.
Roberts and Sufi (2009b) do not find evidence that the existence of certain covenants increases
the probability of future renegotiations. In comparison, my results suggest that the level of
covenant restrictiveness, rather than the simple existence of certain covenants, serves the role to
facilitate future renegotiations.
Although I conduct the above exercises for covenant violations and renegotiations
separately, when I use the occurrence of any control transfer, either renegotiations or violations,
as my dependent variable, the results are qualitatively similar. I also estimate all the above
regressions with the exclusion of contracts that appear to violate a covenant (with negative
28
covenant cushion) in the first quarter after loan initiation, yielding qualitatively similar estimates.
However, I do not present those results here for brevity.
4.3 Covenant restrictiveness and loan outcomes controlling for ex post changes in firm
characteristics
Existing studies of incomplete contract theory model the transfer of control rights to
creditors as a response to the ex post realization of information (e.g., Aghion and Bolton 1992,
Von Thadden 1995, Hart and Moore 1998). Prior literature on covenant violations and
renegotiations provides consistent evidence with this view. For example, previous studies show
that covenant violations are an indication that borrowers are falling in financial difficulty, and
therefore, borrowers’ post-violation behavior is largely constrained (Chava and Roberts 2008,
Roberts and Sufi 2009a, Nini, Smith and Sufi 2012). Prior empirical investigations have also
provided some evidence that the ex post changes in borrower characteristics impact the
occurrence of debt contract renegotiations (Roberts and Sufi 2009b, Denis and Wang 2013).
Therefore, one remaining question is whether the design of covenant restrictiveness influences
future control transfers beyond the general changes that occur to the borrower itself.
To answer this question, I take identical modeling approaches as in the previous
subsection but with one change – the inclusion of changes in firm characteristics during the life
of the contract which are measured from loan initiation to loan expiration or August 2011,
whichever is sooner. The changes in firm characteristics are proxies for realized information
after loan initiation. Table 5 reports the estimation results for the likelihood of covenant
violations and renegotiations. Even with the inclusion of the ex post changes in firm
characteristics, the initial covenant restrictiveness still significantly predicts the occurrence of
29
covenant violations and renegotiations. Moreover, both the marginal effects and the statistical
significance of the covenant restrictiveness variables are similar to the results reported in Table 4
where the ex post changes in firm characteristics are not included. Therefore, the association
between the covenant restrictiveness and the loan outcomes are not likely to be driven by the
changes in borrower characteristics.
Besides the level of covenant restrictiveness, the evolutions of some firm characteristics
do appear to influence the occurrence of covenant violations and renegotiations. In addition,
covenant violations and renegotiations seem to respond to different types of information. If the
borrowers have experienced increased book leverage and increased volatility in profitability
since loan origination, they are more likely to be intervened by creditors through covenant
violations, everything else equals. However, decreases in borrowers’ assets increase the
probability of creditor control though covenant renegotiations. This result confirms Benmelech
and Bergman’s (2008) finding that decreased liquidation value improves the borrowers’ chance
of a successful renegotiation.
4.4 Are the most restrictive covenants renegotiated?
My previous results are consistent with Garleanu and Zwiebel’s (2009) prediction that
covenants are designed to be tight with the consideration of future renegotiations. Therefore, if
stricter covenants are imposed as trip wires to facilitate future reassessment of optimal contracts,
it should precisely be the one that is renegotiated. If that is the case, it strongly indicates that
writing very restrictive covenants which can later be modified is an important consideration in
covenant design.
30
To further establish the link between covenant design and creditor control rights, I
investigate to what extent the most restrictive covenant is actually the renegotiated item if any
renegotiation occurs. In table 6, for the 491 contracts with at least one covenant renegotiation
before maturity, I find that over two-thirds of the most restrictive covenants in the original
contracts are renegotiated before the loan actually matures, using any of the three restrictiveness
measures. That is, the majority of the most restrictive covenants in the contracts are not carried
through. Instead, they are modified before the contracts reach maturity. The large proportion of
renegotiated covenants among the most restrictive covenants suggests that the most restrictive
covenant in a contract is an important channel for the creditors to exercise their control rights.
Furthermore, the large fraction of the most restrictive covenants that are renegotiated implies that
such renegotiations are likely to be expected, and therefore, are an important factor that
influences the initial design of debt contracts.
I also estimate the association between the most restrictive covenant in the contract and
the modified item in future covenant renegotiations using the following Probit model:
Pr (Renegotiation il) = α+ β Most restrictive covenant il + γ ×X + εi (2)
The dependent variable is 1 when at least one renegotiation occurs to change covenant l during
the life of the contract i and 0 otherwise. The “most restrictive dummy” indicates whether
covenant l is the most restrictive covenant in contract i. Other control variables are the same as
in the previous subsection.
The results are presented in Table 7. Across all three groups of covenants and
conditional on the existence of at least one covenant renegotiation, the likelihood of any
renegotiation of a certain covenant (or covenant group) is significantly higher when the most
31
restrictive covenant is that specific covenant (or is in that specific covenant group). Selecting a
certain covenant (or covenant group) as the most restrictive one increases the likelihood of
renegotiating that covenant (or covenant group) by 13-45%, if any covenant renegotiation
occurs, all else equal.
The strong association between the most restrictive covenant and the future renegotiation
of that covenant is strong support to the prediction of Garleanu and Zwiebel (2009). They argue
that tightly written covenants serve as a built-in mechanism to incentivize future renegotiations.
My evidence indicate that by imposing stricter requirement than the other covenants in the same
contract, the most restrictive covenant serves as a trigger for future evaluation of the optimal
contract. By directly linking later control rights shifts with the more restrictive covenants, this
test mitigates the concern that the most restrictive covenant is correlated with some uncontrolled
firm or loan characteristics which are likely to trigger creditor control through covenant
renegotiations.
5. Does the Type of the Most Restrictive Covenant Incrementally Influence Loan Outcome?
The previous section establishes that tighter covenants are indeed followed by more
creditor interventions. Such interventions are exercised through two equally important channels:
covenant violations and covenant renegotiations. The strong association between the design of
covenants and the exercise of creditor control rights suggests that the likely outcome of the loan
should be an important factor that influences the design of the initial contract. To further explore
the impact of the original design of debt contract on the ex post outcome of the loan, in this
section, I study another important aspect in debt contract design—the specific type of the most
32
restrictive covenant. The purpose is to assess whether the type of the most restrictive covenant
incrementally influences the outcome of the loan.
Recall that in my discussion of the association between covenant types and loan
outcomes, I hypothesize that contracts with capital expenditure restrictions (income statement
covenants) as the most restrictive covenants in the contracts will be more likely to trigger
creditor intervention through covenant renegotiations (violations). However, contracts with
balance sheet covenants as the most restrictive covenants will have a lower probability of both
covenant renegotiations and violations. To test the above hypotheses, I estimate the following
Probit model:
Pr (Outcome i) = α+ β Most restrictive covenant il + γ Covenant restrictiveness i + δ ×X + εi (3)
The dependent variable is the existence of covenant renegotiations or violations during the life of
the contract. The main variables of interest are indicator variables of whether a certain type of
covenant is the most restrictive one in the contract. In all the regressions, I control for covenant
restrictiveness. Other independent variables are the same as in Equation (1).
I report some evidence that, controlling for the initial level of covenant restrictiveness,
the type of the most restrictive covenant in the contract is associated with the outcome of the
loan. Panel A of Table 8 presents the regression results for covenant renegotiations. Consistent
with my hypotheses, I find that when a capital expenditure restriction is designed as the most
restrictive covenant in a contract, the probability of future renegotiations is significantly
increased by 17-22%, a similar economic magnitude as increasing covenant restrictiveness from
below the median to above the median. When covenant restrictiveness is measured by covenant
cushion, a balance sheet covenant as the most restrictive covenant in a contract significantly
reduces the likelihood that a covenant renegotiation will occur in the future. Apart from that, the
33
selection of an income statement covenant or a balance sheet covenant to be the most restrictive
covenant in a contract, on average, does not seem to impact the probability of future covenant
renegotiations. In addition, the inclusion of the type of the most restrictive covenant does not
seem to erode the impact of the other variables in the model. In all the regressions, the measure
of covenant restrictiveness remains a strong predictor for covenant renegotiations and its
economic significance remains the same as previous reported.
Panel B of Table 8 presents the regression results for covenant violations. With respect
to income statement covenants, except for the case when covenant restrictiveness is measured by
estimated probability of violation, an income statement covenant as the most restrictive covenant
in a contract is positively associated with the probability of future covenant violations. An
interesting finding is that, when income statement covenants are written with a tightening
schedule, the positive association between the existence of a tightening schedule and future
covenant violations disappears. That is, although Table 1 shows that balance sheet covenants are
equally (if not more) likely to follow a tightening schedule, the strong association between
covenants with a tightening schedule and covenant violations is dominated by income statement
covenants when they are designed with such a schedule. This result further implies that the
purpose of designing income statement covenants with tightened requirements over time is not to
convey positive information of future performance, but to allocate stronger decision rights to
creditors. With respect to balance sheet covenants, except for one case where covenant
restrictiveness is measure by estimated probability of violation, a balance sheet covenants as the
most restrictive covenant in a contract significantly reduces the probability of future covenant
violations by over 10%. Consistent with Christensen and Nikolaev’s (2012) argument, balance
34
sheet covenants align shareholder-creditor interest ex ante, so that the need for ex post creditor
intervention is largely reduced.
6. Conclusion
For 1,000 credit contracts, I use three methods to measure the restrictiveness of financial
covenants in the original contracts. I follow the evolution of covenant restrictiveness during the
life of the contracts and track the outcomes of the loans. I provide robust evidence that writing
highly restrictive covenants in the original contracts is associated with a higher likelihood of
future control rights transfer from shareholders to creditors through two equally important
channels: covenant violations and covenant renegotiations. The strong association between
covenant restrictiveness and loan outcomes supports the view that covenants are designed to be
tighter in order to transfer control rights more frequently when contractual limits are approached
(Garleanu and Zwiebel 2009, Murfin 2012). Although Demiroglu and James (2010) provide
some evidence that good borrowers use tight covenants to signal the expected improvements in
the underlying covenant variables, the signaling motivation of good borrowers is difficult to
reconcile with the large proportion of computed covenant violations among tighter covenants
documented in this study and is unlikely to be the dominant consideration in selecting stricter
covenants.
My findings with respect to covenant renegotiations are consistent with the predictions of
Garleanu and Zwiebel (2009). They argue that in face of asymmetric information about future
transfer of wealth, covenants should be designed to be more restrictive than those under
symmetric information. In the future, these very restrictive covenants are likely to be
renegotiated when more information is learned. I find that (i) the majority of the highly

35
restrictive covenants are actually renegotiated instead of being carried through, and (ii) the most
restrictive covenant in a contract is likely to be the one that is modified in future renegotiations.
This evidence suggests that highly restrictive covenants indeed serve as a built-in mechanism in
the original contracts as suggested by Garleanu and Zwiebel (2009) to assist future reassessment
of optimal contracts.
In addition, I find that the actual outcome of the loan is also influenced by the type of the
covenant that is designed to set the most restrictive requirement in a contract. From another
respect in the design of covenant restrictiveness, this finding reinforces the notion that the ex
ante debt contract design and the ex post outcome of the loan are closely related.
An interesting byproduct of my findings is that there is significantly variation in covenant
restrictiveness within the same contract. In the process of designing a contract, how do
contracting parties decide the level of restrictiveness for each covenant in the contract? What
factors influence the dispersion of covenant restrictiveness within the same contract? I expect
future work to answer these questions.
36
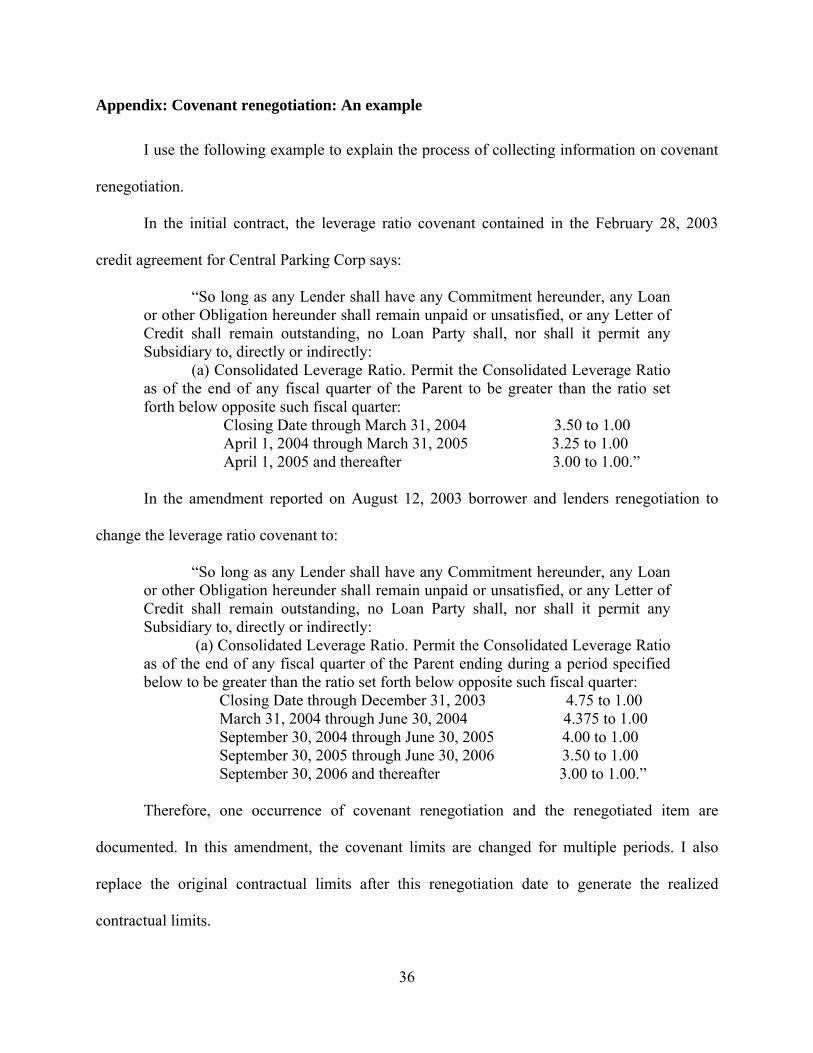
Appendix: Covenant renegotiation: An example
I use the following example to explain the process of collecting information on covenant
renegotiation.
In the initial contract, the leverage ratio covenant contained in the February 28, 2003
credit agreement for Central Parking Corp says:
“So long as any Lender shall have any Commitment hereunder, any Loan or other Obligation hereunder shall remain unpaid or unsatisfied, or any Letter of Credit shall remain outstanding, no Loan Party shall, nor shall it permit any Subsidiary to, directly or indirectly:
(a) Consolidated Leverage Ratio. Permit the Consolidated Leverage Ratio as of the end of any fiscal quarter of the Parent to be greater than the ratio set forth below opposite such fiscal quarter:
Closing Date through March 31, 2004 3.50 to 1.00 April 1, 2004 through March 31, 2005 3.25 to 1.00 April 1, 2005 and thereafter 3.00 to 1.00.”
In the amendment reported on August 12, 2003 borrower and lenders renegotiation to
change the leverage ratio covenant to:
“So long as any Lender shall have any Commitment hereunder, any Loan or other Obligation hereunder shall remain unpaid or unsatisfied, or any Letter of Credit shall remain outstanding, no Loan Party shall, nor shall it permit any Subsidiary to, directly or indirectly:
(a) Consolidated Leverage Ratio. Permit the Consolidated Leverage Ratio as of the end of any fiscal quarter of the Parent ending during a period specified below to be greater than the ratio set forth below opposite such fiscal quarter:
Closing Date through December 31, 2003 4.75 to 1.00 March 31, 2004 through June 30, 2004 4.375 to 1.00 September 30, 2004 through June 30, 2005 4.00 to 1.00 September 30, 2005 through June 30, 2006 3.50 to 1.00 September 30, 2006 and thereafter 3.00 to 1.00.”
Therefore, one occurrence of covenant renegotiation and the renegotiated item are
documented. In this amendment, the covenant limits are changed for multiple periods. I also
replace the original contractual limits after this renegotiation date to generate the realized
contractual limits.
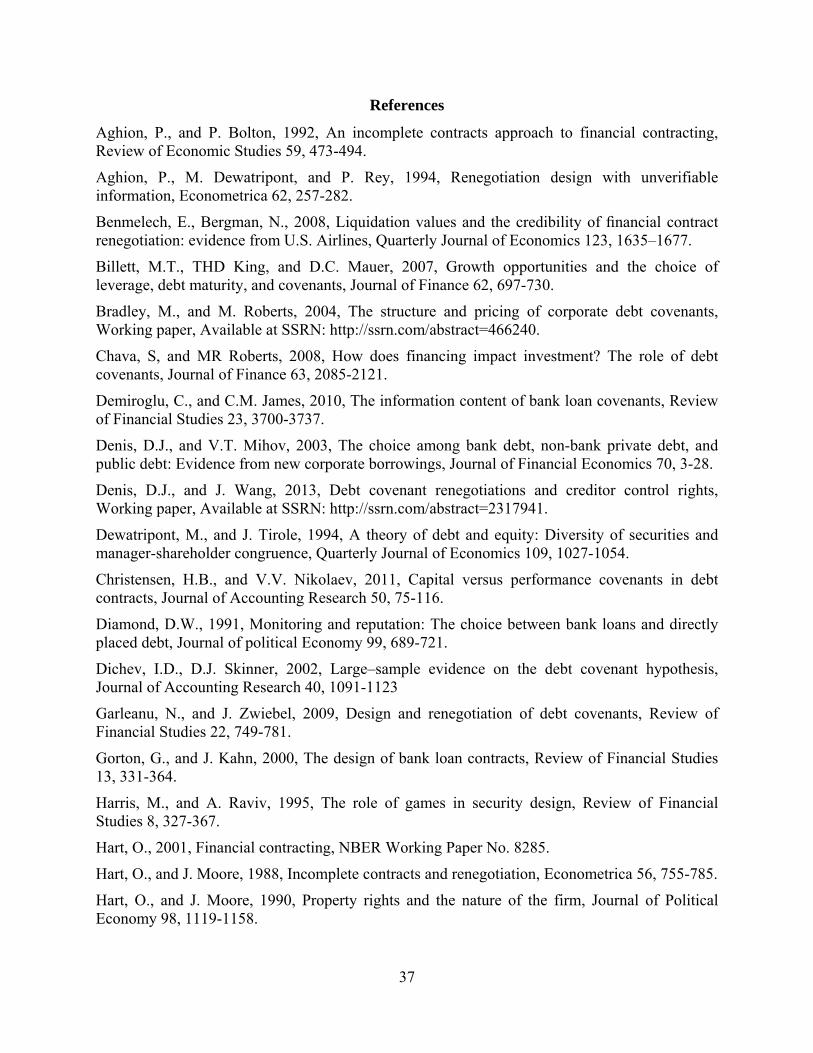
37
References
Aghion, P., and P. Bolton, 1992, An incomplete contracts approach to financial contracting, Review of Economic Studies 59, 473-494.
Aghion, P., M. Dewatripont, and P. Rey, 1994, Renegotiation design with unverifiable information, Econometrica 62, 257-282.
Benmelech, E., Bergman, N., 2008, Liquidation values and the credibility of financial contract renegotiation: evidence from U.S. Airlines, Quarterly Journal of Economics 123, 1635–1677.
Billett, M.T., THD King, and D.C. Mauer, 2007, Growth opportunities and the choice of leverage, debt maturity, and covenants, Journal of Finance 62, 697-730.
Bradley, M., and M. Roberts, 2004, The structure and pricing of corporate debt covenants, Working paper, Available at SSRN: http://ssrn.com/abstract=466240.
Chava, S, and MR Roberts, 2008, How does financing impact investment? The role of debt covenants, Journal of Finance 63, 2085-2121.
Demiroglu, C., and C.M. James, 2010, The information content of bank loan covenants, Review of Financial Studies 23, 3700-3737.
Denis, D.J., and V.T. Mihov, 2003, The choice among bank debt, non-bank private debt, and public debt: Evidence from new corporate borrowings, Journal of Financial Economics 70, 3-28.
Denis, D.J., and J. Wang, 2013, Debt covenant renegotiations and creditor control rights, Working paper, Available at SSRN: http://ssrn.com/abstract=2317941.
Dewatripont, M., and J. Tirole, 1994, A theory of debt and equity: Diversity of securities and manager-shareholder congruence, Quarterly Journal of Economics 109, 1027-1054.
Christensen, H.B., and V.V. Nikolaev, 2011, Capital versus performance covenants in debt contracts, Journal of Accounting Research 50, 75-116.
Diamond, D.W., 1991, Monitoring and reputation: The choice between bank loans and directly placed debt, Journal of political Economy 99, 689-721.
Dichev, I.D., D.J. Skinner, 2002, Large–sample evidence on the debt covenant hypothesis, Journal of Accounting Research 40, 1091-1123
Garleanu, N., and J. Zwiebel, 2009, Design and renegotiation of debt covenants, Review of Financial Studies 22, 749-781.
Gorton, G., and J. Kahn, 2000, The design of bank loan contracts, Review of Financial Studies 13, 331-364.
Harris, M., and A. Raviv, 1995, The role of games in security design, Review of Financial Studies 8, 327-367.
Hart, O., 2001, Financial contracting, NBER Working Paper No. 8285.
Hart, O., and J. Moore, 1988, Incomplete contracts and renegotiation, Econometrica 56, 755-785.
Hart, O., and J. Moore, 1990, Property rights and the nature of the firm, Journal of Political Economy 98, 1119-1158.
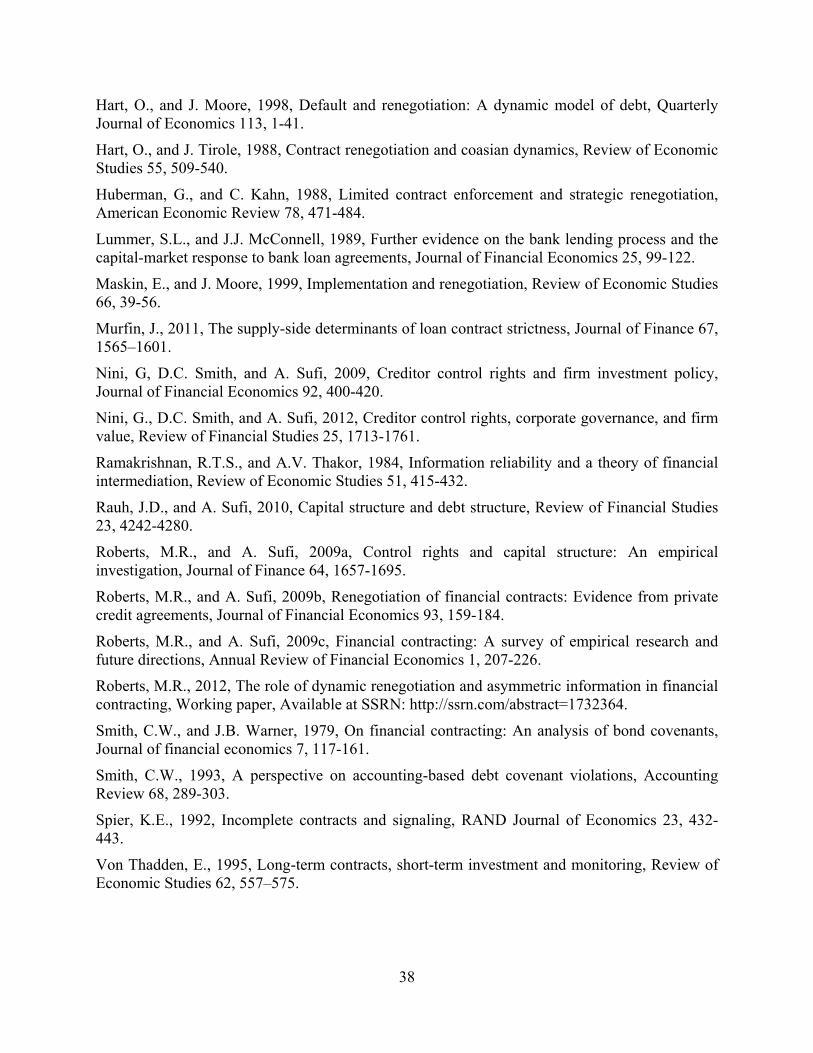
38
Hart, O., and J. Moore, 1998, Default and renegotiation: A dynamic model of debt, Quarterly Journal of Economics 113, 1-41.
Hart, O., and J. Tirole, 1988, Contract renegotiation and coasian dynamics, Review of Economic Studies 55, 509-540.
Huberman, G., and C. Kahn, 1988, Limited contract enforcement and strategic renegotiation, American Economic Review 78, 471-484.
Lummer, S.L., and J.J. McConnell, 1989, Further evidence on the bank lending process and the capital-market response to bank loan agreements, Journal of Financial Economics 25, 99-122.
Maskin, E., and J. Moore, 1999, Implementation and renegotiation, Review of Economic Studies 66, 39-56.
Murfin, J., 2011, The supply-side determinants of loan contract strictness, Journal of Finance 67, 1565–1601.
Nini, G, D.C. Smith, and A. Sufi, 2009, Creditor control rights and firm investment policy, Journal of Financial Economics 92, 400-420.
Nini, G., D.C. Smith, and A. Sufi, 2012, Creditor control rights, corporate governance, and firm value, Review of Financial Studies 25, 1713-1761.
Ramakrishnan, R.T.S., and A.V. Thakor, 1984, Information reliability and a theory of financial intermediation, Review of Economic Studies 51, 415-432.
Rauh, J.D., and A. Sufi, 2010, Capital structure and debt structure, Review of Financial Studies 23, 4242-4280.
Roberts, M.R., and A. Sufi, 2009a, Control rights and capital structure: An empirical investigation, Journal of Finance 64, 1657-1695.
Roberts, M.R., and A. Sufi, 2009b, Renegotiation of financial contracts: Evidence from private credit agreements, Journal of Financial Economics 93, 159-184.
Roberts, M.R., and A. Sufi, 2009c, Financial contracting: A survey of empirical research and future directions, Annual Review of Financial Economics 1, 207-226.
Roberts, M.R., 2012, The role of dynamic renegotiation and asymmetric information in financial contracting, Working paper, Available at SSRN: http://ssrn.com/abstract=1732364.
Smith, C.W., and J.B. Warner, 1979, On financial contracting: An analysis of bond covenants, Journal of financial economics 7, 117-161.
Smith, C.W., 1993, A perspective on accounting-based debt covenant violations, Accounting Review 68, 289-303.
Spier, K.E., 1992, Incomplete contracts and signaling, RAND Journal of Economics 23, 432-443.
Von Thadden, E., 1995, Long-term contracts, short-term investment and monitoring, Review of Economic Studies 62, 557–575.
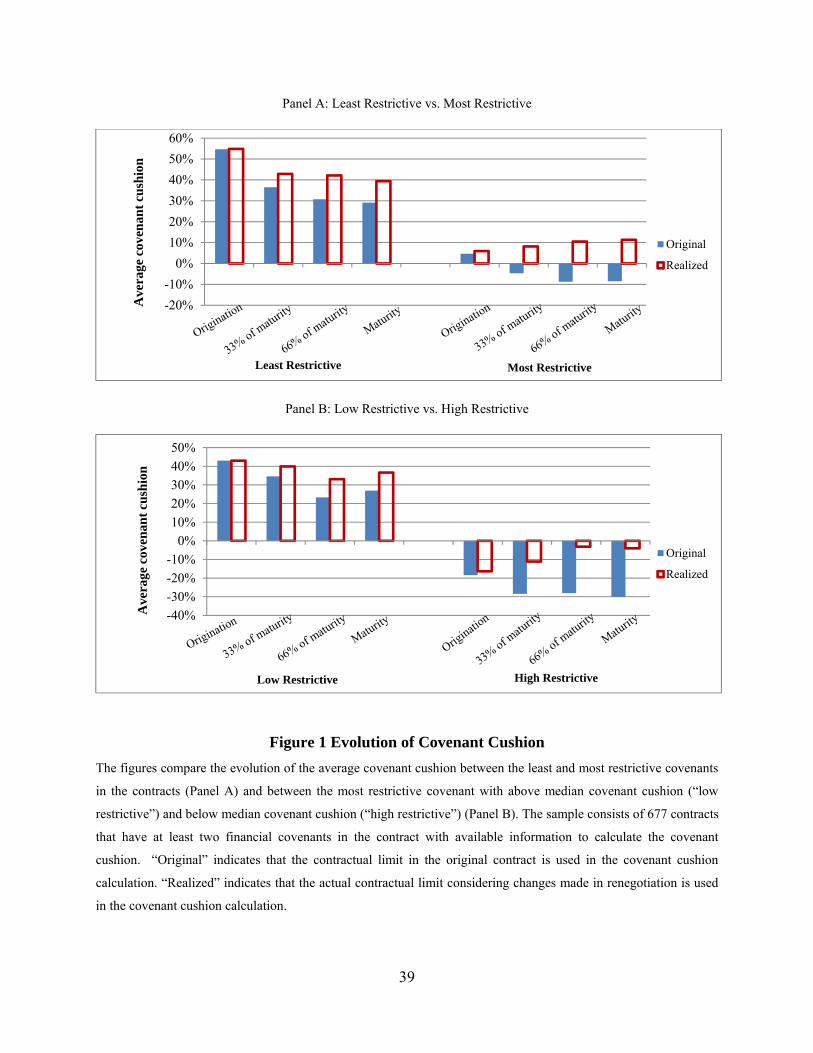
39
Panel A: Least Restrictive vs. Most Restrictive
Panel B: Low Restrictive vs. High Restrictive
Figure 1 Evolution of Covenant Cushion
The figures compare the evolution of the average covenant cushion between the least and most restrictive covenants
in the contracts (Panel A) and between the most restrictive covenant with above median covenant cushion (“low
restrictive”) and below median covenant cushion (“high restrictive”) (Panel B). The sample consists of 677 contracts
that have at least two financial covenants in the contract with available information to calculate the covenant
cushion. “Original” indicates that the contractual limit in the original contract is used in the covenant cushion
calculation. “Realized” indicates that the actual contractual limit considering changes made in renegotiation is used
in the covenant cushion calculation.
-20%
-10%
0%
10%
20%
30%
40%
50%
60%
Original
Realized
Ave
rage
cov
enan
t cu
shio
n
Least Restrictive Most Restrictive
-40%
-30%
-20%
-10%
0%
10%
20%
30%
40%
50%
Original
Realized
Ave
rage
cov
enan
tcu
shio
n
Low Restrictive High Restrictive
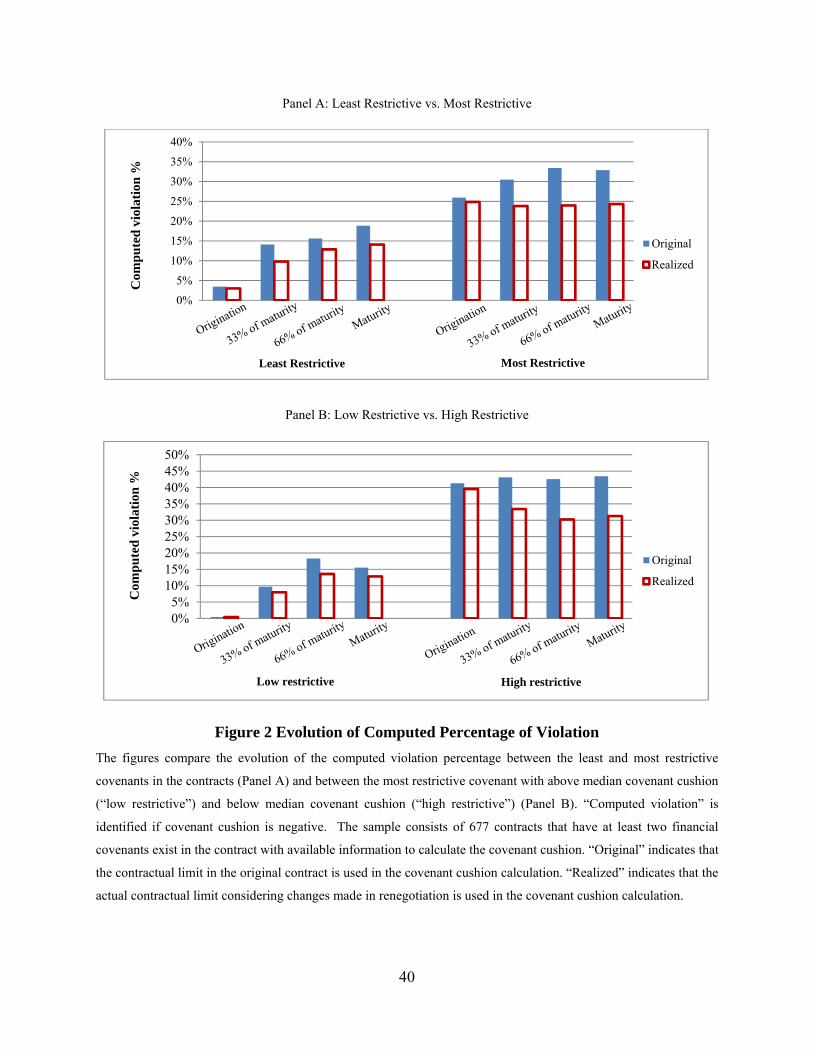
40
Panel A: Least Restrictive vs. Most Restrictive
Panel B: Low Restrictive vs. High Restrictive
Figure 2 Evolution of Computed Percentage of Violation
The figures compare the evolution of the computed violation percentage between the least and most restrictive
covenants in the contracts (Panel A) and between the most restrictive covenant with above median covenant cushion
(“low restrictive”) and below median covenant cushion (“high restrictive”) (Panel B). “Computed violation” is
identified if covenant cushion is negative. The sample consists of 677 contracts that have at least two financial
covenants exist in the contract with available information to calculate the covenant cushion. “Original” indicates that
the contractual limit in the original contract is used in the covenant cushion calculation. “Realized” indicates that the
actual contractual limit considering changes made in renegotiation is used in the covenant cushion calculation.
0%
5%
10%
15%
20%
25%
30%
35%
40%
Original
Realized
Least Restrictive Most Restrictive
Com
pu
ted
vio
lati
on %
0%5%
10%15%20%25%30%35%40%45%50%
Original
Realized
Com
pu
ted
vio
lati
on %
Low restrictive High restrictive
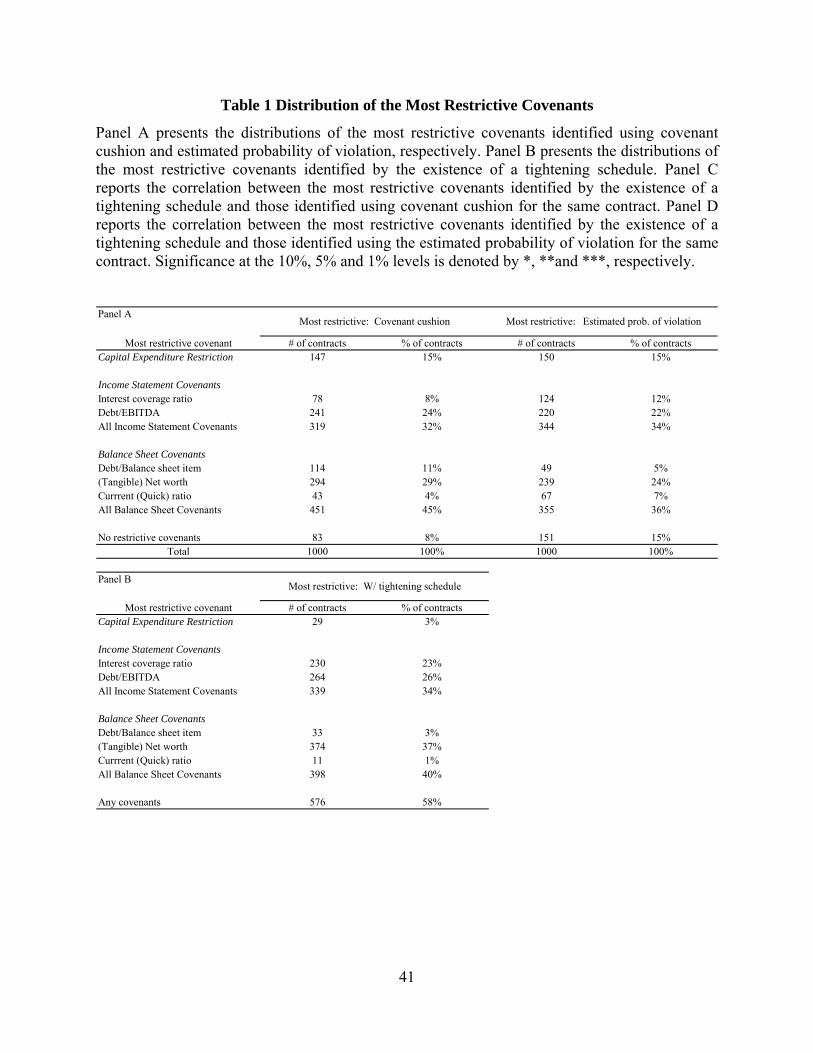
41
Table 1 Distribution of the Most Restrictive Covenants
Panel A presents the distributions of the most restrictive covenants identified using covenant cushion and estimated probability of violation, respectively. Panel B presents the distributions of the most restrictive covenants identified by the existence of a tightening schedule. Panel C reports the correlation between the most restrictive covenants identified by the existence of a tightening schedule and those identified using covenant cushion for the same contract. Panel D reports the correlation between the most restrictive covenants identified by the existence of a tightening schedule and those identified using the estimated probability of violation for the same contract. Significance at the 10%, 5% and 1% levels is denoted by *, **and ***, respectively.
Panel A
Most restrictive covenant # of contracts % of contracts # of contracts % of contractsCapital Expenditure Restriction 147 15% 150 15%
Income Statement CovenantsInterest coverage ratio 78 8% 124 12%Debt/EBITDA 241 24% 220 22%All Income Statement Covenants 319 32% 344 34%
Balance Sheet CovenantsDebt/Balance sheet item 114 11% 49 5%(Tangible) Net worth 294 29% 239 24%Currrent (Quick) ratio 43 4% 67 7%All Balance Sheet Covenants 451 45% 355 36%
No restrictive covenants 83 8% 151 15%Total 1000 100% 1000 100%
Panel B
Most restrictive covenant # of contracts % of contractsCapital Expenditure Restriction 29 3%
Income Statement CovenantsInterest coverage ratio 230 23%Debt/EBITDA 264 26%All Income Statement Covenants 339 34%
Balance Sheet CovenantsDebt/Balance sheet item 33 3%(Tangible) Net worth 374 37%Currrent (Quick) ratio 11 1%All Balance Sheet Covenants 398 40%
Any covenants 576 58%
Most restrictive: Covenant cushion Most restrictive: Estimated prob. of violation
Most restrictive: W/ tightening schedule
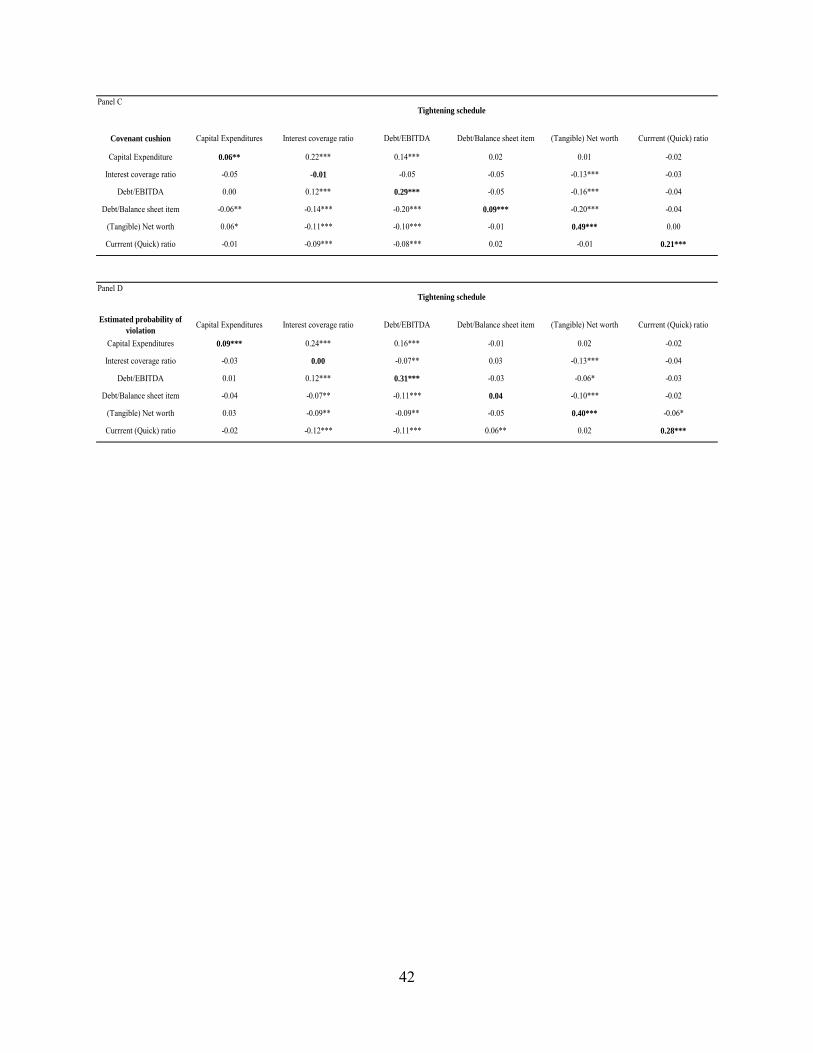
42
Panel C
Covenant cushion Capital Expenditures Interest coverage ratio Debt/EBITDA Debt/Balance sheet item (Tangible) Net worth Currrent (Quick) ratio
Capital Expenditure 0.06** 0.22*** 0.14*** 0.02 0.01 -0.02
Interest coverage ratio -0.05 -0.01 -0.05 -0.05 -0.13*** -0.03
Debt/EBITDA 0.00 0.12*** 0.29*** -0.05 -0.16*** -0.04
Debt/Balance sheet item -0.06** -0.14*** -0.20*** 0.09*** -0.20*** -0.04
(Tangible) Net worth 0.06* -0.11*** -0.10*** -0.01 0.49*** 0.00
Currrent (Quick) ratio -0.01 -0.09*** -0.08*** 0.02 -0.01 0.21***
Panel D
Estimated probability of violation
Capital Expenditures Interest coverage ratio Debt/EBITDA Debt/Balance sheet item (Tangible) Net worth Currrent (Quick) ratio
Capital Expenditures 0.09*** 0.24*** 0.16*** -0.01 0.02 -0.02
Interest coverage ratio -0.03 0.00 -0.07** 0.03 -0.13*** -0.04
Debt/EBITDA 0.01 0.12*** 0.31*** -0.03 -0.06* -0.03
Debt/Balance sheet item -0.04 -0.07** -0.11*** 0.04 -0.10*** -0.02
(Tangible) Net worth 0.03 -0.09** -0.09** -0.05 0.40*** -0.06*
Currrent (Quick) ratio -0.02 -0.12*** -0.11*** 0.06** 0.02 0.28***
Tightening schedule
Tightening schedule
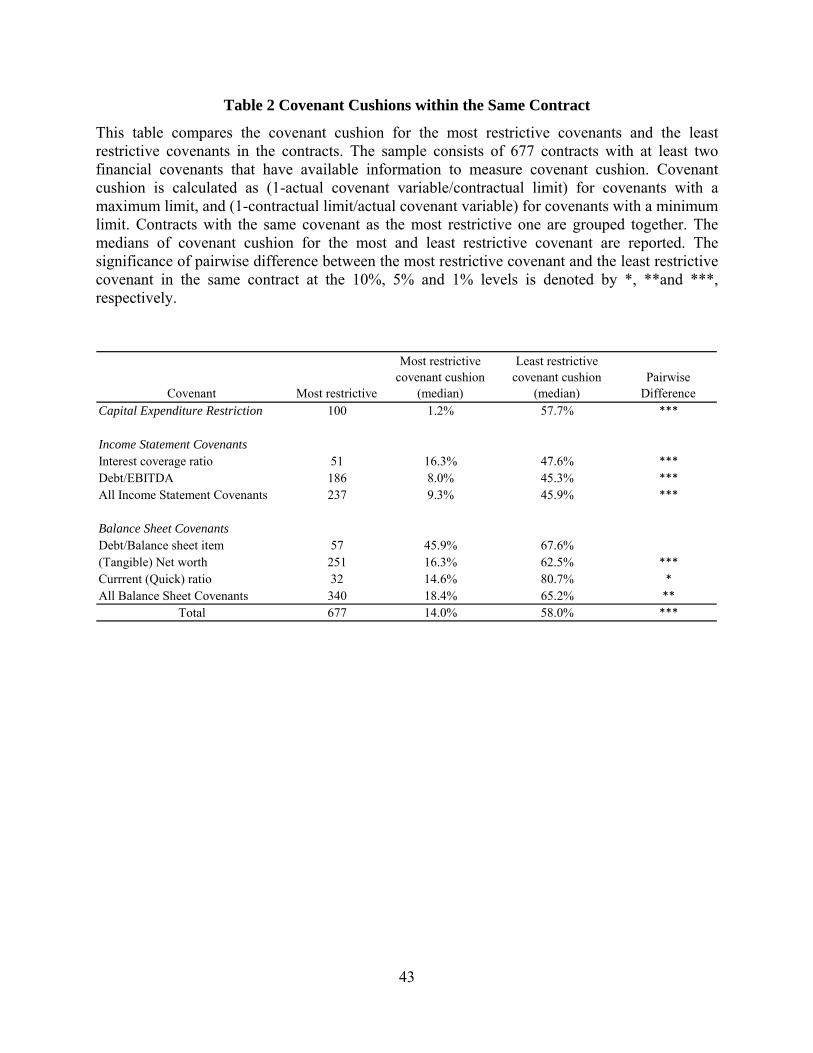
43
Table 2 Covenant Cushions within the Same Contract
This table compares the covenant cushion for the most restrictive covenants and the least restrictive covenants in the contracts. The sample consists of 677 contracts with at least two financial covenants that have available information to measure covenant cushion. Covenant cushion is calculated as (1-actual covenant variable/contractual limit) for covenants with a maximum limit, and (1-contractual limit/actual covenant variable) for covenants with a minimum limit. Contracts with the same covenant as the most restrictive one are grouped together. The medians of covenant cushion for the most and least restrictive covenant are reported. The significance of pairwise difference between the most restrictive covenant and the least restrictive covenant in the same contract at the 10%, 5% and 1% levels is denoted by *, **and ***, respectively.
Covenant Most restrictive
Most restrictive covenant cushion
(median)
Least restrictive covenant cushion
(median) Pairwise
DifferenceCapital Expenditure Restriction 100 1.2% 57.7% ***
Income Statement CovenantsInterest coverage ratio 51 16.3% 47.6% ***
Debt/EBITDA 186 8.0% 45.3% ***
All Income Statement Covenants 237 9.3% 45.9% ***
Balance Sheet CovenantsDebt/Balance sheet item 57 45.9% 67.6%(Tangible) Net worth 251 16.3% 62.5% ***
Currrent (Quick) ratio 32 14.6% 80.7% *
All Balance Sheet Covenants 340 18.4% 65.2% **
Total 677 14.0% 58.0% ***
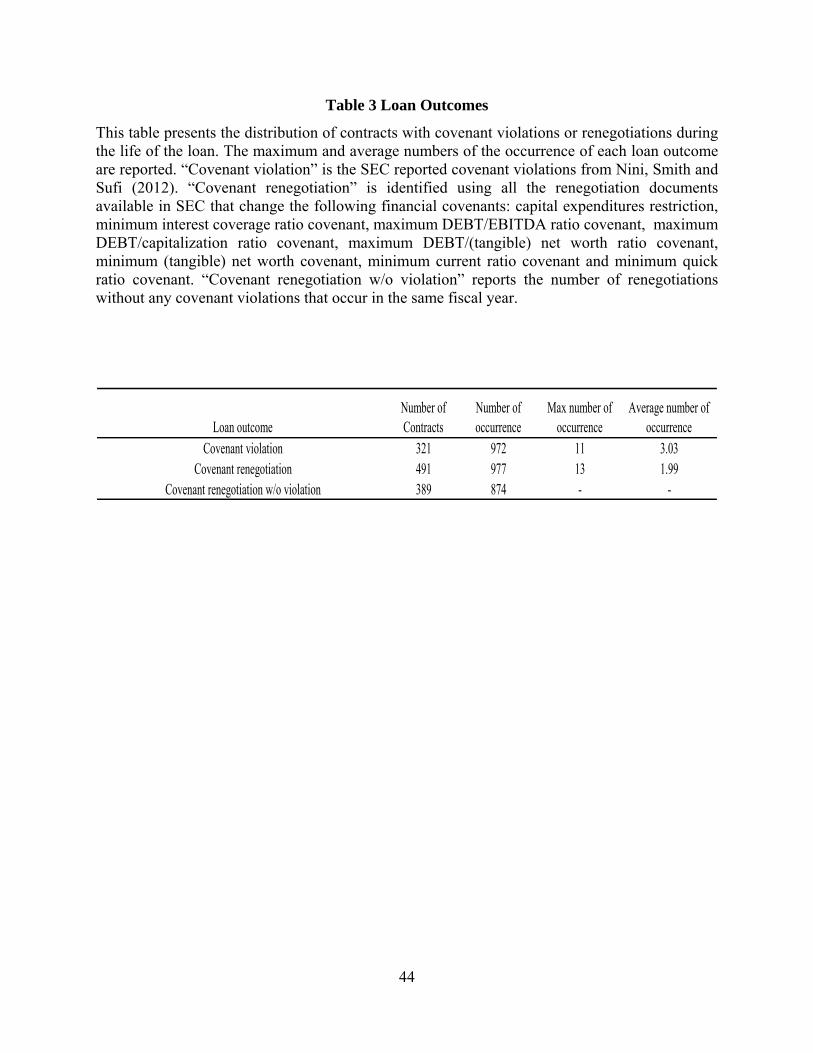
44
Table 3 Loan Outcomes
This table presents the distribution of contracts with covenant violations or renegotiations during the life of the loan. The maximum and average numbers of the occurrence of each loan outcome are reported. “Covenant violation” is the SEC reported covenant violations from Nini, Smith and Sufi (2012). “Covenant renegotiation” is identified using all the renegotiation documents available in SEC that change the following financial covenants: capital expenditures restriction, minimum interest coverage ratio covenant, maximum DEBT/EBITDA ratio covenant, maximum DEBT/capitalization ratio covenant, maximum DEBT/(tangible) net worth ratio covenant, minimum (tangible) net worth covenant, minimum current ratio covenant and minimum quick ratio covenant. “Covenant renegotiation w/o violation” reports the number of renegotiations without any covenant violations that occur in the same fiscal year.
Loan outcomeNumber of Contracts
Number of occurrence
Max number of occurrence
Average number of occurrence
Covenant violation 321 972 11 3.03Covenant renegotiation 491 977 13 1.99
Covenant renegotiation w/o violation 389 874 - -
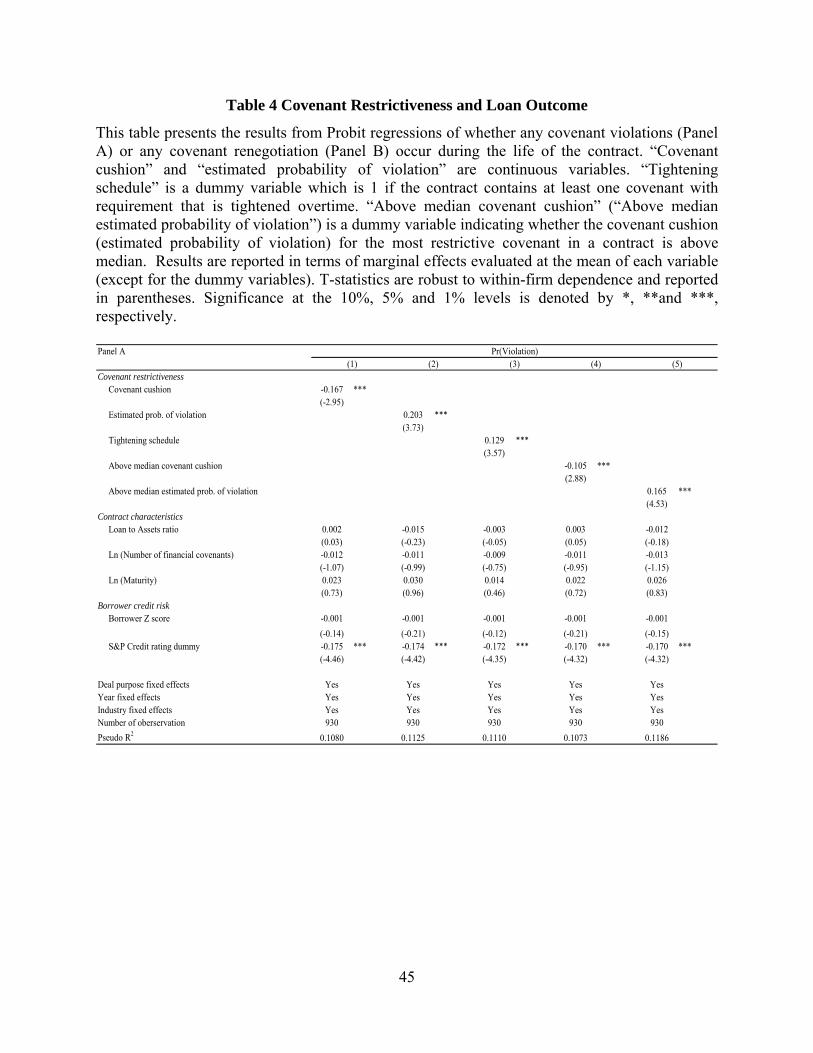
45
Table 4 Covenant Restrictiveness and Loan Outcome
This table presents the results from Probit regressions of whether any covenant violations (Panel A) or any covenant renegotiation (Panel B) occur during the life of the contract. “Covenant cushion” and “estimated probability of violation” are continuous variables. “Tightening schedule” is a dummy variable which is 1 if the contract contains at least one covenant with requirement that is tightened overtime. “Above median covenant cushion” (“Above median estimated probability of violation”) is a dummy variable indicating whether the covenant cushion (estimated probability of violation) for the most restrictive covenant in a contract is above median. Results are reported in terms of marginal effects evaluated at the mean of each variable (except for the dummy variables). T-statistics are robust to within-firm dependence and reported in parentheses. Significance at the 10%, 5% and 1% levels is denoted by *, **and ***, respectively.
Panel A
Covenant restrictiveness Covenant cushion -0.167 ***
(-2.95) Estimated prob. of violation 0.203 ***
(3.73) Tightening schedule 0.129 ***
(3.57) Above median covenant cushion -0.105 ***
(2.88) Above median estimated prob. of violation 0.165 ***
(4.53)Contract characteristics Loan to Assets ratio 0.002 -0.015 -0.003 0.003 -0.012
(0.03) (-0.23) (-0.05) (0.05) (-0.18) Ln (Number of financial covenants) -0.012 -0.011 -0.009 -0.011 -0.013
(-1.07) (-0.99) (-0.75) (-0.95) (-1.15) Ln (Maturity) 0.023 0.030 0.014 0.022 0.026
(0.73) (0.96) (0.46) (0.72) (0.83)Borrower credit risk Borrower Z score -0.001 -0.001 -0.001 -0.001 -0.001
(-0.14) (-0.21) (-0.12) (-0.21) (-0.15) S&P Credit rating dummy -0.175 *** -0.174 *** -0.172 *** -0.170 *** -0.170 ***
(-4.46) (-4.42) (-4.35) (-4.32) (-4.32)
Deal purpose fixed effects Yes Yes Yes Yes YesYear fixed effects Yes Yes Yes Yes YesIndustry fixed effects Yes Yes Yes Yes YesNumber of oberservation 930 930 930 930 930
Pseudo R2 0.1080 0.1125 0.1110 0.1073 0.1186
(3)(1) (2)Pr(Violation)
(4) (5)
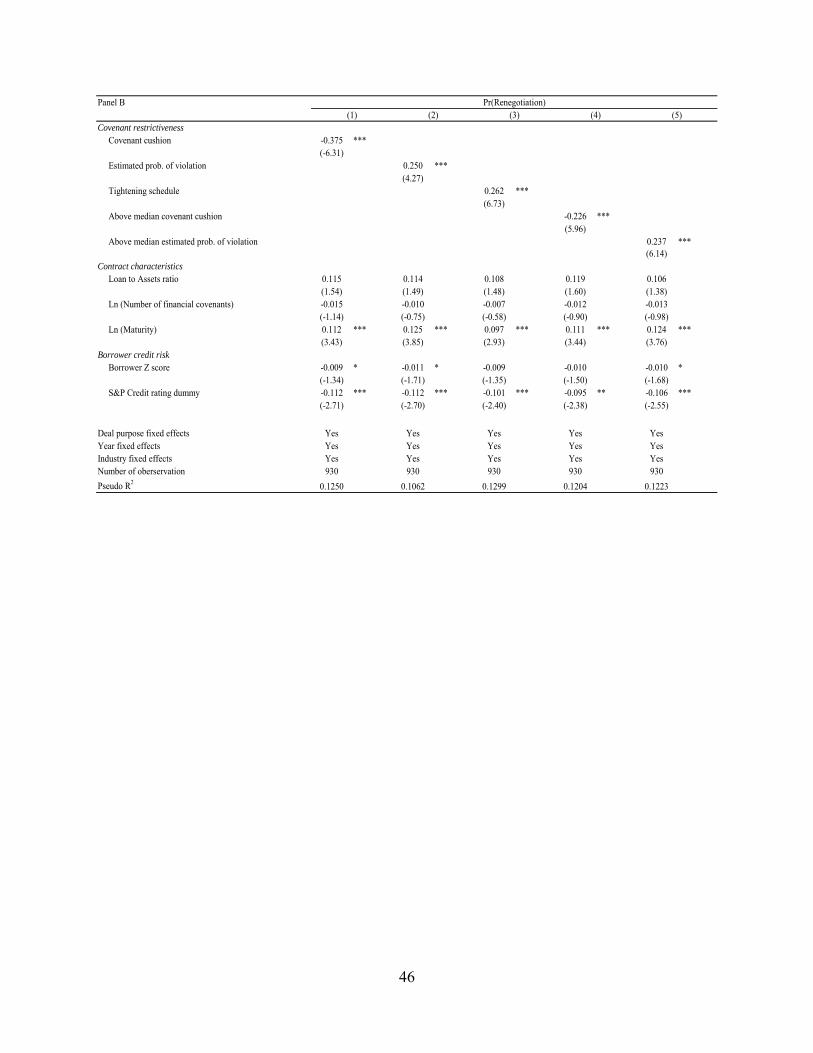
46
Panel B
Covenant restrictiveness Covenant cushion -0.375 ***
(-6.31) Estimated prob. of violation 0.250 ***
(4.27) Tightening schedule 0.262 ***
(6.73) Above median covenant cushion -0.226 ***
(5.96) Above median estimated prob. of violation 0.237 ***
(6.14)Contract characteristics Loan to Assets ratio 0.115 0.114 0.108 0.119 0.106
(1.54) (1.49) (1.48) (1.60) (1.38) Ln (Number of financial covenants) -0.015 -0.010 -0.007 -0.012 -0.013
(-1.14) (-0.75) (-0.58) (-0.90) (-0.98) Ln (Maturity) 0.112 *** 0.125 *** 0.097 *** 0.111 *** 0.124 ***
(3.43) (3.85) (2.93) (3.44) (3.76)Borrower credit risk Borrower Z score -0.009 * -0.011 * -0.009 -0.010 -0.010 *
(-1.34) (-1.71) (-1.35) (-1.50) (-1.68) S&P Credit rating dummy -0.112 *** -0.112 *** -0.101 *** -0.095 ** -0.106 ***
(-2.71) (-2.70) (-2.40) (-2.38) (-2.55)
Deal purpose fixed effects Yes Yes Yes Yes YesYear fixed effects Yes Yes Yes Yes YesIndustry fixed effects Yes Yes Yes Yes YesNumber of oberservation 930 930 930 930 930
Pseudo R2 0.1250 0.1062 0.1299 0.1204 0.1223
(4) (5)(1) (2) (3)Pr(Renegotiation)
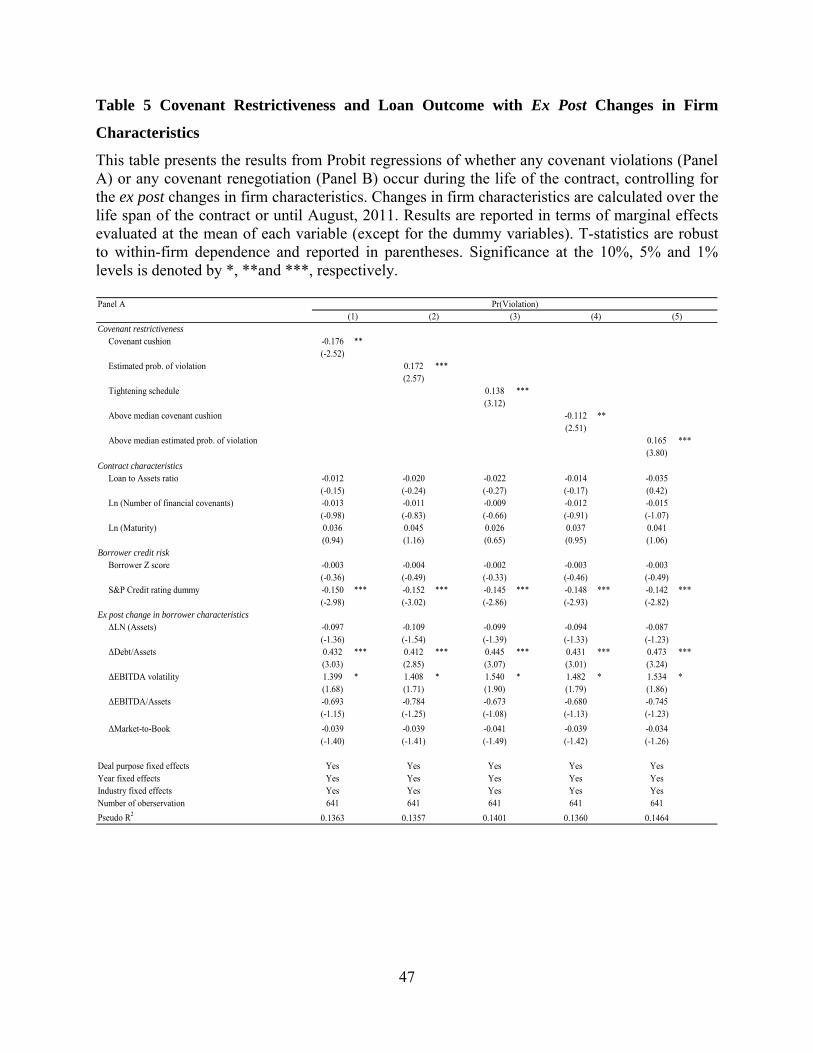
47
Table 5 Covenant Restrictiveness and Loan Outcome with Ex Post Changes in Firm
Characteristics
This table presents the results from Probit regressions of whether any covenant violations (Panel A) or any covenant renegotiation (Panel B) occur during the life of the contract, controlling for the ex post changes in firm characteristics. Changes in firm characteristics are calculated over the life span of the contract or until August, 2011. Results are reported in terms of marginal effects evaluated at the mean of each variable (except for the dummy variables). T-statistics are robust to within-firm dependence and reported in parentheses. Significance at the 10%, 5% and 1% levels is denoted by *, **and ***, respectively.
Panel A
Covenant restrictiveness Covenant cushion -0.176 **
(-2.52) Estimated prob. of violation 0.172 ***
(2.57) Tightening schedule 0.138 ***
(3.12) Above median covenant cushion -0.112 **
(2.51) Above median estimated prob. of violation 0.165 ***
(3.80)Contract characteristics Loan to Assets ratio -0.012 -0.020 -0.022 -0.014 -0.035
(-0.15) (-0.24) (-0.27) (-0.17) (0.42) Ln (Number of financial covenants) -0.013 -0.011 -0.009 -0.012 -0.015
(-0.98) (-0.83) (-0.66) (-0.91) (-1.07) Ln (Maturity) 0.036 0.045 0.026 0.037 0.041
(0.94) (1.16) (0.65) (0.95) (1.06)Borrower credit risk Borrower Z score -0.003 -0.004 -0.002 -0.003 -0.003
(-0.36) (-0.49) (-0.33) (-0.46) (-0.49) S&P Credit rating dummy -0.150 *** -0.152 *** -0.145 *** -0.148 *** -0.142 ***
(-2.98) (-3.02) (-2.86) (-2.93) (-2.82)Ex post change in borrower characteristics ΔLN (Assets) -0.097 -0.109 -0.099 -0.094 -0.087
(-1.36) (-1.54) (-1.39) (-1.33) (-1.23) ΔDebt/Assets 0.432 *** 0.412 *** 0.445 *** 0.431 *** 0.473 ***
(3.03) (2.85) (3.07) (3.01) (3.24) ΔEBITDA volatility 1.399 * 1.408 * 1.540 * 1.482 * 1.534 *
(1.68) (1.71) (1.90) (1.79) (1.86) ΔEBITDA/Assets -0.693 -0.784 -0.673 -0.680 -0.745
(-1.15) (-1.25) (-1.08) (-1.13) (-1.23)
ΔMarket-to-Book -0.039 -0.039 -0.041 -0.039 -0.034(-1.40) (-1.41) (-1.49) (-1.42) (-1.26)
Deal purpose fixed effects Yes Yes Yes Yes YesYear fixed effects Yes Yes Yes Yes YesIndustry fixed effects Yes Yes Yes Yes YesNumber of oberservation 641 641 641 641 641
Pseudo R2 0.1363 0.1357 0.1401 0.1360 0.1464
Pr(Violation)(3)(1) (2) (4) (5)
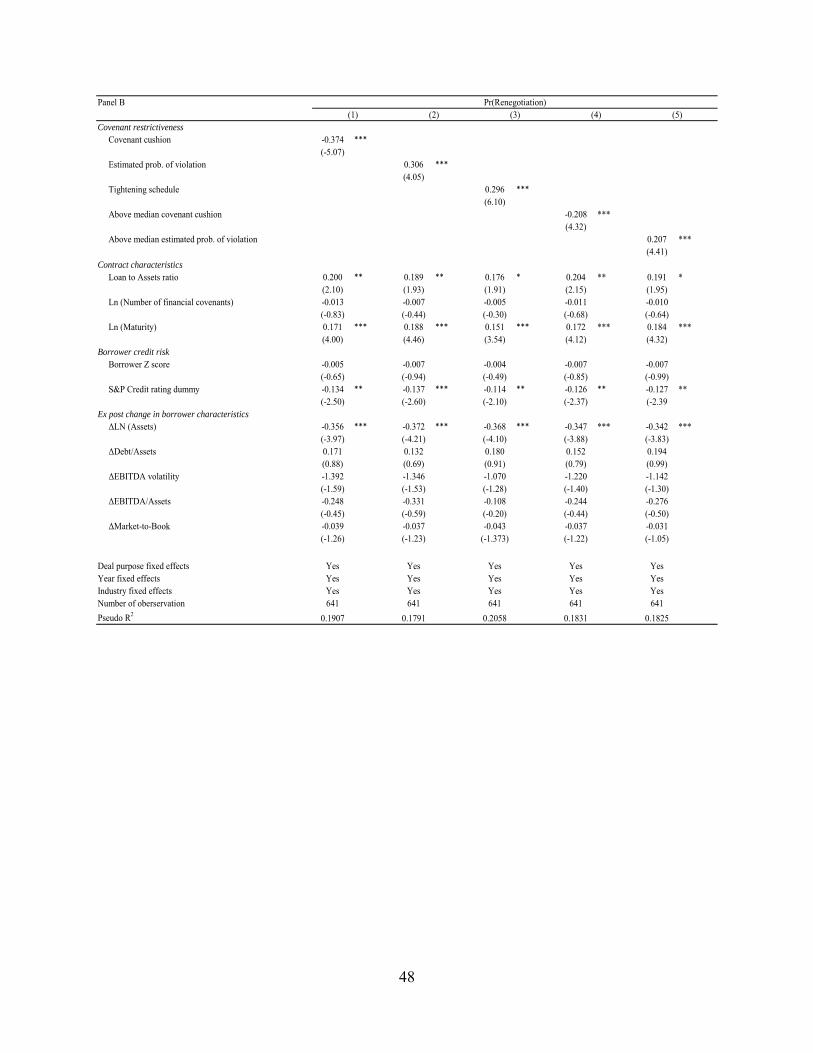
48
Panel B
Covenant restrictiveness Covenant cushion -0.374 ***
(-5.07) Estimated prob. of violation 0.306 ***
(4.05) Tightening schedule 0.296 ***
(6.10) Above median covenant cushion -0.208 ***
(4.32) Above median estimated prob. of violation 0.207 ***
(4.41)Contract characteristics Loan to Assets ratio 0.200 ** 0.189 ** 0.176 * 0.204 ** 0.191 *
(2.10) (1.93) (1.91) (2.15) (1.95) Ln (Number of financial covenants) -0.013 -0.007 -0.005 -0.011 -0.010
(-0.83) (-0.44) (-0.30) (-0.68) (-0.64) Ln (Maturity) 0.171 *** 0.188 *** 0.151 *** 0.172 *** 0.184 ***
(4.00) (4.46) (3.54) (4.12) (4.32)Borrower credit risk Borrower Z score -0.005 -0.007 -0.004 -0.007 -0.007
(-0.65) (-0.94) (-0.49) (-0.85) (-0.99) S&P Credit rating dummy -0.134 ** -0.137 *** -0.114 ** -0.126 ** -0.127 **
(-2.50) (-2.60) (-2.10) (-2.37) (-2.39Ex post change in borrower characteristics ΔLN (Assets) -0.356 *** -0.372 *** -0.368 *** -0.347 *** -0.342 ***
(-3.97) (-4.21) (-4.10) (-3.88) (-3.83) ΔDebt/Assets 0.171 0.132 0.180 0.152 0.194
(0.88) (0.69) (0.91) (0.79) (0.99) ΔEBITDA volatility -1.392 -1.346 -1.070 -1.220 -1.142
(-1.59) (-1.53) (-1.28) (-1.40) (-1.30) ΔEBITDA/Assets -0.248 -0.331 -0.108 -0.244 -0.276
(-0.45) (-0.59) (-0.20) (-0.44) (-0.50) ΔMarket-to-Book -0.039 -0.037 -0.043 -0.037 -0.031
(-1.26) (-1.23) (-1.373) (-1.22) (-1.05)
Deal purpose fixed effects Yes Yes Yes Yes YesYear fixed effects Yes Yes Yes Yes YesIndustry fixed effects Yes Yes Yes Yes YesNumber of oberservation 641 641 641 641 641
Pseudo R2 0.1907 0.1791 0.2058 0.1831 0.1825
Pr(Renegotiation)(1) (2) (3) (4) (5)
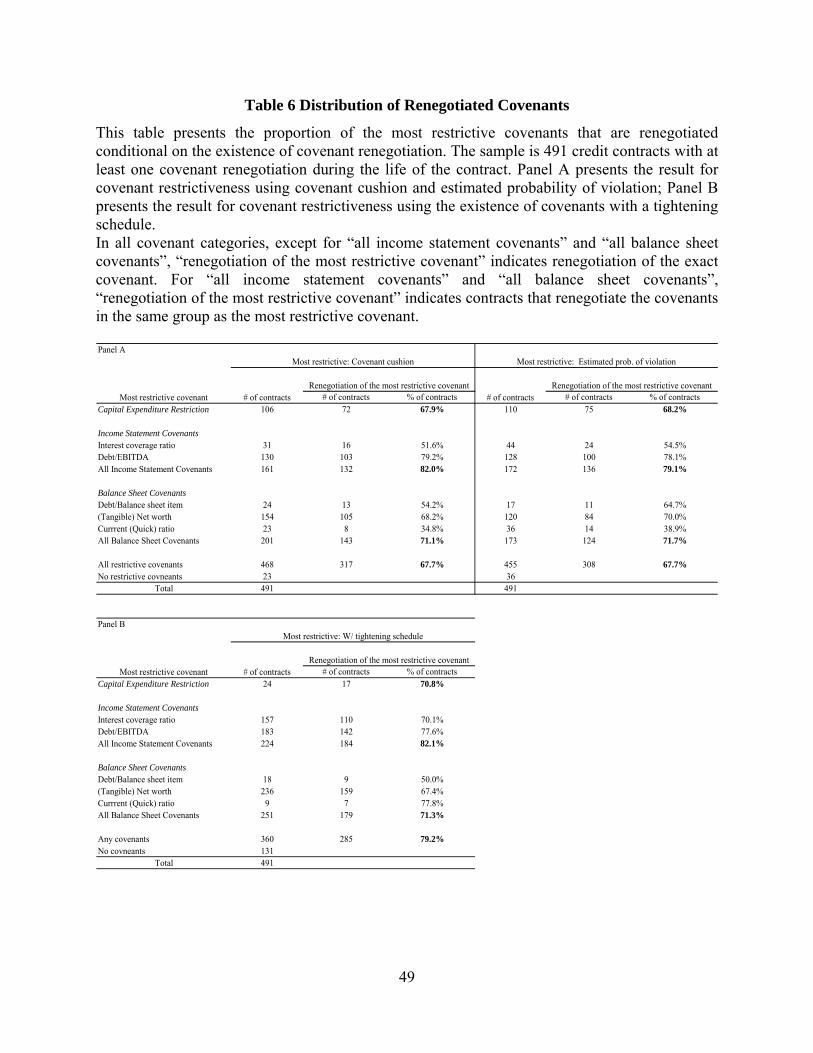
49
Table 6 Distribution of Renegotiated Covenants
This table presents the proportion of the most restrictive covenants that are renegotiated conditional on the existence of covenant renegotiation. The sample is 491 credit contracts with at least one covenant renegotiation during the life of the contract. Panel A presents the result for covenant restrictiveness using covenant cushion and estimated probability of violation; Panel B presents the result for covenant restrictiveness using the existence of covenants with a tightening schedule. In all covenant categories, except for “all income statement covenants” and “all balance sheet covenants”, “renegotiation of the most restrictive covenant” indicates renegotiation of the exact covenant. For “all income statement covenants” and “all balance sheet covenants”, “renegotiation of the most restrictive covenant” indicates contracts that renegotiate the covenants in the same group as the most restrictive covenant.
Panel A
# of contracts % of contracts # of contracts % of contracts Capital Expenditure Restriction 106 72 67.9% 110 75 68.2%
Income Statement CovenantsInterest coverage ratio 31 16 51.6% 44 24 54.5%Debt/EBITDA 130 103 79.2% 128 100 78.1%All Income Statement Covenants 161 132 82.0% 172 136 79.1%
Balance Sheet CovenantsDebt/Balance sheet item 24 13 54.2% 17 11 64.7%(Tangible) Net worth 154 105 68.2% 120 84 70.0%Currrent (Quick) ratio 23 8 34.8% 36 14 38.9%All Balance Sheet Covenants 201 143 71.1% 173 124 71.7%
All restrictive covenants 468 317 67.7% 455 308 67.7%No restrictive covneants 23 36
Total 491 491
Panel B
# of contracts % of contracts Capital Expenditure Restriction 24 17 70.8%
Income Statement CovenantsInterest coverage ratio 157 110 70.1%Debt/EBITDA 183 142 77.6%All Income Statement Covenants 224 184 82.1%
Balance Sheet CovenantsDebt/Balance sheet item 18 9 50.0%(Tangible) Net worth 236 159 67.4%Currrent (Quick) ratio 9 7 77.8%All Balance Sheet Covenants 251 179 71.3%
Any covenants 360 285 79.2%No covneants 131
Total 491
Most restrictive: Covenant cushion Most restrictive: Estimated prob. of violation
Most restrictive: W/ tightening schedule
Renegotiation of the most restrictive covenant Renegotiation of the most restrictive covenant
Renegotiation of the most restrictive covenant
Most restrictive covenant
Most restrictive covenant
# of contracts # of contracts
# of contracts
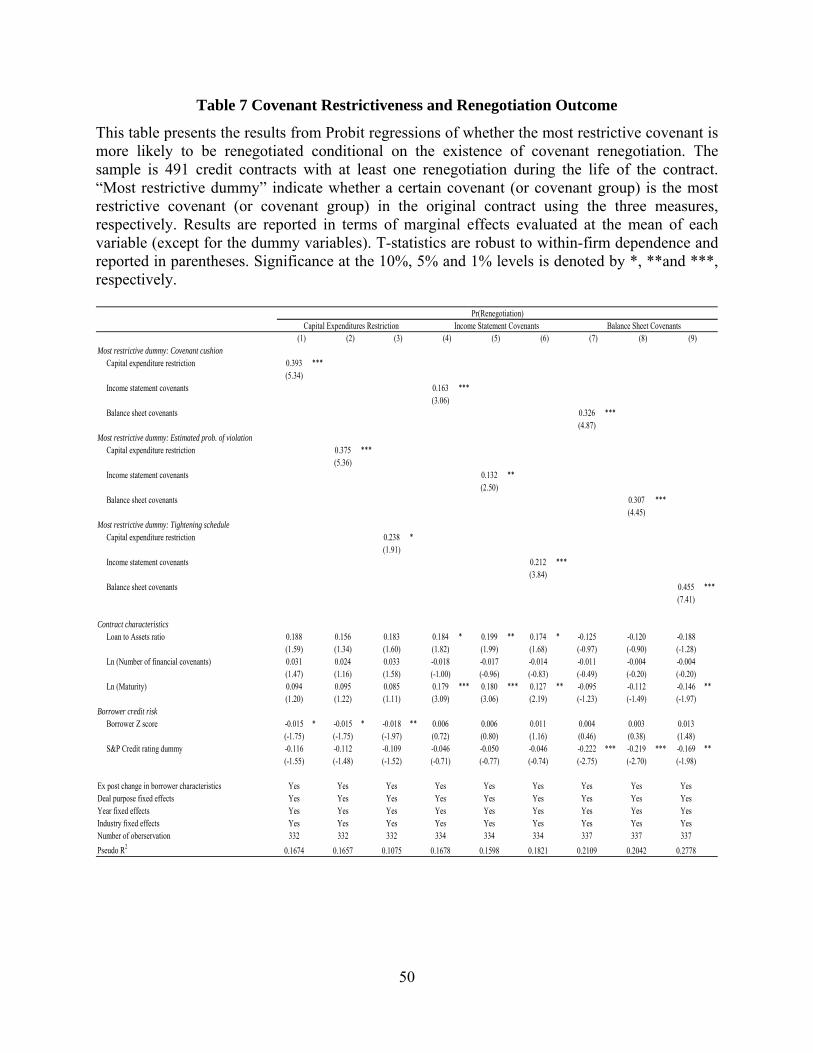
50
Table 7 Covenant Restrictiveness and Renegotiation Outcome
This table presents the results from Probit regressions of whether the most restrictive covenant is more likely to be renegotiated conditional on the existence of covenant renegotiation. The sample is 491 credit contracts with at least one renegotiation during the life of the contract. “Most restrictive dummy” indicate whether a certain covenant (or covenant group) is the most restrictive covenant (or covenant group) in the original contract using the three measures, respectively. Results are reported in terms of marginal effects evaluated at the mean of each variable (except for the dummy variables). T-statistics are robust to within-firm dependence and reported in parentheses. Significance at the 10%, 5% and 1% levels is denoted by *, **and ***, respectively.
Most restrictive dummy: Covenant cushion Capital expenditure restriction 0.393 ***
(5.34) Income statement covenants 0.163 ***
(3.06) Balance sheet covenants 0.326 ***
(4.87)Most restrictive dummy: Estimated prob. of violation Capital expenditure restriction 0.375 ***
(5.36) Income statement covenants 0.132 **
(2.50) Balance sheet covenants 0.307 ***
(4.45)Most restrictive dummy: Tightening schedule Capital expenditure restriction 0.238 *
(1.91) Income statement covenants 0.212 ***
(3.84) Balance sheet covenants 0.455 ***
(7.41)
Contract characteristics Loan to Assets ratio 0.188 0.156 0.183 0.184 * 0.199 ** 0.174 * -0.125 -0.120 -0.188
(1.59) (1.34) (1.60) (1.82) (1.99) (1.68) (-0.97) (-0.90) (-1.28) Ln (Number of financial covenants) 0.031 0.024 0.033 -0.018 -0.017 -0.014 -0.011 -0.004 -0.004
(1.47) (1.16) (1.58) (-1.00) (-0.96) (-0.83) (-0.49) (-0.20) (-0.20) Ln (Maturity) 0.094 0.095 0.085 0.179 *** 0.180 *** 0.127 ** -0.095 -0.112 -0.146 **
(1.20) (1.22) (1.11) (3.09) (3.06) (2.19) (-1.23) (-1.49) (-1.97)Borrower credit risk Borrower Z score -0.015 * -0.015 * -0.018 ** 0.006 0.006 0.011 0.004 0.003 0.013
(-1.75) (-1.75) (-1.97) (0.72) (0.80) (1.16) (0.46) (0.38) (1.48) S&P Credit rating dummy -0.116 -0.112 -0.109 -0.046 -0.050 -0.046 -0.222 *** -0.219 *** -0.169 **
(-1.55) (-1.48) (-1.52) (-0.71) (-0.77) (-0.74) (-2.75) (-2.70) (-1.98)
Ex post change in borrower characteristics Yes Yes Yes Yes Yes Yes Yes Yes YesDeal purpose fixed effects Yes Yes Yes Yes Yes Yes Yes Yes YesYear fixed effects Yes Yes Yes Yes Yes Yes Yes Yes YesIndustry fixed effects Yes Yes Yes Yes Yes Yes Yes Yes YesNumber of oberservation 332 332 332 334 334 334 337 337 337
Pseudo R2 0.1674 0.1657 0.1075 0.1678 0.1598 0.1821 0.2109 0.2042 0.2778
(9)
Pr(Renegotiation) Capital Expenditures Restriction Income Statement Covenants Balance Sheet Covenants
(1) (2) (4) (5) (7) (8) (6) (3)
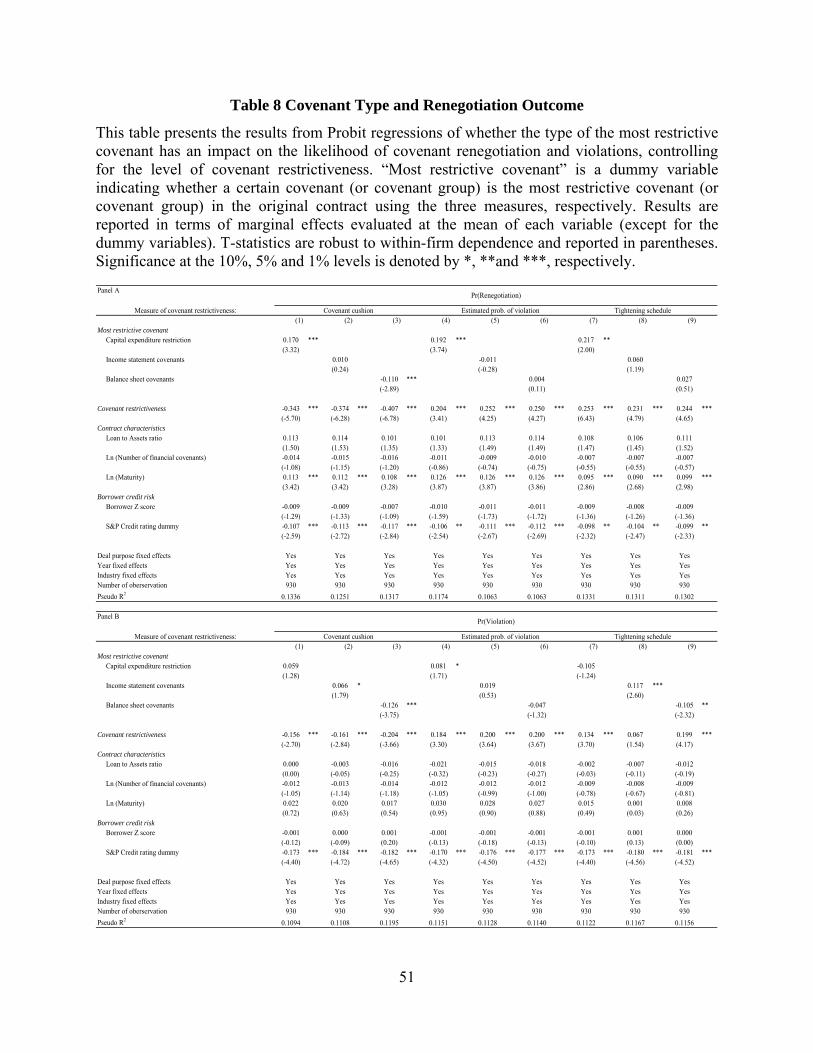
51
Table 8 Covenant Type and Renegotiation Outcome
This table presents the results from Probit regressions of whether the type of the most restrictive covenant has an impact on the likelihood of covenant renegotiation and violations, controlling for the level of covenant restrictiveness. “Most restrictive covenant” is a dummy variable indicating whether a certain covenant (or covenant group) is the most restrictive covenant (or covenant group) in the original contract using the three measures, respectively. Results are reported in terms of marginal effects evaluated at the mean of each variable (except for the dummy variables). T-statistics are robust to within-firm dependence and reported in parentheses. Significance at the 10%, 5% and 1% levels is denoted by *, **and ***, respectively.
Panel A
Measure of covenant restrictiveness:
Most restrictive covenant Capital expenditure restriction 0.170 *** 0.192 *** 0.217 **
(3.32) (3.74) (2.00) Income statement covenants 0.010 -0.011 0.060
(0.24) (-0.28) (1.19) Balance sheet covenants -0.110 *** 0.004 0.027
(-2.89) (0.11) (0.51)
Covenant restrictiveness -0.343 *** -0.374 *** -0.407 *** 0.204 *** 0.252 *** 0.250 *** 0.253 *** 0.231 *** 0.244 ***
(-5.70) (-6.28) (-6.78) (3.41) (4.25) (4.27) (6.43) (4.79) (4.65)Contract characteristics Loan to Assets ratio 0.113 0.114 0.101 0.101 0.113 0.114 0.108 0.106 0.111
(1.50) (1.53) (1.35) (1.33) (1.49) (1.49) (1.47) (1.45) (1.52) Ln (Number of financial covenants) -0.014 -0.015 -0.016 -0.011 -0.009 -0.010 -0.007 -0.007 -0.007
(-1.08) (-1.15) (-1.20) (-0.86) (-0.74) (-0.75) (-0.55) (-0.55) (-0.57) Ln (Maturity) 0.113 *** 0.112 *** 0.108 *** 0.126 *** 0.126 *** 0.126 *** 0.095 *** 0.090 *** 0.099 ***
(3.42) (3.42) (3.28) (3.87) (3.87) (3.86) (2.86) (2.68) (2.98)Borrower credit risk Borrower Z score -0.009 -0.009 -0.007 -0.010 -0.011 -0.011 -0.009 -0.008 -0.009
(-1.29) (-1.33) (-1.09) (-1.59) (-1.73) (-1.72) (-1.36) (-1.26) (-1.36) S&P Credit rating dummy -0.107 *** -0.113 *** -0.117 *** -0.106 ** -0.111 *** -0.112 *** -0.098 ** -0.104 ** -0.099 **
(-2.59) (-2.72) (-2.84) (-2.54) (-2.67) (-2.69) (-2.32) (-2.47) (-2.33)
Deal purpose fixed effects Yes Yes Yes Yes Yes Yes Yes Yes YesYear fixed effects Yes Yes Yes Yes Yes Yes Yes Yes YesIndustry fixed effects Yes Yes Yes Yes Yes Yes Yes Yes YesNumber of oberservation 930 930 930 930 930 930 930 930 930
Pseudo R2 0.1336 0.1251 0.1317 0.1174 0.1063 0.1063 0.1331 0.1311 0.1302
Panel B
Measure of covenant restrictiveness:
Most restrictive covenant Capital expenditure restriction 0.059 0.081 * -0.105
(1.28) (1.71) (-1.24) Income statement covenants 0.066 * 0.019 0.117 ***
(1.79) (0.53) (2.60) Balance sheet covenants -0.126 *** -0.047 -0.105 **
(-3.75) (-1.32) (-2.32)
Covenant restrictiveness -0.156 *** -0.161 *** -0.204 *** 0.184 *** 0.200 *** 0.200 *** 0.134 *** 0.067 0.199 ***
(-2.70) (-2.84) (-3.66) (3.30) (3.64) (3.67) (3.70) (1.54) (4.17)Contract characteristics Loan to Assets ratio 0.000 -0.003 -0.016 -0.021 -0.015 -0.018 -0.002 -0.007 -0.012
(0.00) (-0.05) (-0.25) (-0.32) (-0.23) (-0.27) (-0.03) (-0.11) (-0.19) Ln (Number of financial covenants) -0.012 -0.013 -0.014 -0.012 -0.012 -0.012 -0.009 -0.008 -0.009
(-1.05) (-1.14) (-1.18) (-1.05) (-0.99) (-1.00) (-0.78) (-0.67) (-0.81) Ln (Maturity) 0.022 0.020 0.017 0.030 0.028 0.027 0.015 0.001 0.008
(0.72) (0.63) (0.54) (0.95) (0.90) (0.88) (0.49) (0.03) (0.26)Borrower credit risk Borrower Z score -0.001 0.000 0.001 -0.001 -0.001 -0.001 -0.001 0.001 0.000
(-0.12) (-0.09) (0.20) (-0.13) (-0.18) (-0.13) (-0.10) (0.13) (0.00) S&P Credit rating dummy -0.173 *** -0.184 *** -0.182 *** -0.170 *** -0.176 *** -0.177 *** -0.173 *** -0.180 *** -0.181 ***
(-4.40) (-4.72) (-4.65) (-4.32) (-4.50) (-4.52) (-4.40) (-4.56) (-4.52)
Deal purpose fixed effects Yes Yes Yes Yes Yes Yes Yes Yes YesYear fixed effects Yes Yes Yes Yes Yes Yes Yes Yes YesIndustry fixed effects Yes Yes Yes Yes Yes Yes Yes Yes YesNumber of oberservation 930 930 930 930 930 930 930 930 930
Pseudo R2 0.1094 0.1108 0.1195 0.1151 0.1128 0.1140 0.1122 0.1167 0.1156
Pr(Renegotiation)
Covenant cushion Estimated prob. of violation Tightening schedule (1) (2) (3) (4) (5) (6) (7) (8) (9)
Pr(Violation)
Covenant cushion Estimated prob. of violation Tightening schedule (7) (8) (9) (1) (2) (3) (4) (5) (6)