Embed Size (px)
DESCRIPTION
http://www.sjostadsverket.se/download/18.488d9cec137bbdebf94800055129/Jingjing+Lic.pdf
Citation preview
TRITA-LWR LIC 2065
ISSN 1650-8629
ISRN KTH/LWR/LIC 2065-SE
ISBN 978-91-7501-384-8
CONTROLLING AND MONITORING OF
DEAMMONIFICATION PROCESS IN MOVING
BED BIOFILM REACTOR
Jingjing Yang
May 2012
Jingjing Yang TRITA LWR LIC 2065
ii
© Jingjing Yang 2012
Licentiate thesis
Water and Sewage Technology
Department of Land and Water Resources Engineering
Royal Institute of Technology (KTH)
SE-100 44 STOCKHOLM, Sweden
Reference should be written as: Yang, J (2012) “Controlling and monitoring of deammonification process in moving bed biofilm reactor” TRITA LWR LIC 2065.
Controlling and Monitoring of Deammonification Process in Moving Bed Biofilm Reactor
iii
SUMMARY
It is considered that partial nitrification combined with anammox, named deammonification, is more environmental friendly compared with conventional nitrification/denitrification due to decrease energy requirement, low emission of CO2 and N2O. Dissolved oxygen (DO) is a significant parameter influencing the nitrogen removal rate and activity of different microorganisms. A proper level of DO concentration is needed to allow ammonium oxidizing bacteria (AOB) to produce a sufficient amount of NO2
--N for anammox reaction. Too high NO2--N
levels should be avoided as they cause inhibition effects on anammox bacteria or increase growth of nitrite oxidizing bacteria (NOB). In this study, investigations have been carried out, both in laboratory and pilot scales to evaluate the influence of different aeration strategies (characterized by dissolved oxygen concentration - DO and the ratio between non-aerated and aerated phase duration – R) on the deammonification process applied in the moving bed biofilm reactor (MBBR).
Three series of batch tests were conducted in laboratory scale with different DO concentrations (2, 3, 4 mg/l) and R values (0 - continuous aeration; 1/3, 1, 3 – intermittent aeration), the same initial ammonium concentration, volume of the reject water and temperature. It was found that the impact of DO on deammonification was dependent on the R value. At R=0 and R=1/3, an increase of DO caused a significant increase in nitrogen removal rate, whereas for R=1 and R=3 similar rates of the process were observed irrespectively of the DO. The highest nitrogen removal rate of 3.33 gN/m2·d was obtained at R=1/3 and DO=4 mg/l. Significantly lower nitrogen removal rates (1.17 - 1.58 gN/m2·d) were observed at R=1 and R=3 for each examined DO. It was a consequence of reduced aerated phase duration times and lower amounts of residual nitrite in non - aerated phases as compared to R=1/3.
Pilot scale experiments were carried out in a MBBR with a working volume of 200 L. The pilot plant has been operated for 1.5 years to remove nitrogen from reject water after dewatering of digested sludge. The activity of different groups of microorganisms in the biofilm was measured by specific anammox activity (SAA), oxygen uptake rate (OUR) and nitrate utilization rate (NUR) tests. The whole operation was divided into seven periods according to different nitrogen loads and different aeration strategies. The highest nitrogen removal rate and efficiency was obtained when DO was 3.5 mg/l and R equaled to 1/3. Activity tests showed that anammox bacteria and AOB play the dominating roles in the biofilm. The average and maximum values of specific anammox activity (SAA) were 3.01 gN/m2·d and 4.3 gN/m2·d, respectively. An average value of 4.0 gO2/m2·d and the maximum value of 5.1 gO2/m2·d was obtained in the oxygen uptake rate for AOB activity tests.
Study results showed that application of an appropriate selected aeration strategy reduced energy consumption without any negative impacts on the process. Introduction of anaerobic phases and high nitrogen load enhanced the activity of anammox bacteria and NOB activity was limited.

Jingjing Yang TRITA LWR LIC 2065
iv
Controlling and Monitoring of Deammonification Process in Moving Bed Biofilm Reactor
v
SAMMANFATTNING
Partiell nitrifikation i kombination med anammoxprocess, som kallas för deammonifikationprocess, anses vara mer miljövänlig jämfört med konventionell nitrifikation/denitrifikation pga minskat energibehov samt låga utsläpp av CO2 och N2O. Löst syre (DO) är en viktig parameter som påverkar hastigheten för kväverening och aktiviteten hos olika mikroorganismer. DO koncentrationer bör vara på en viss nivå för att ammoniumoxiderande bakterier (AOB) skall producera en tillräcklig mängd NO2-N för anammoxreaktionen, men inte heller för hög då hög NO2-N nivå ger en anammoxhämmande effekt eller ökad tillväxt av nitritoxiderande bakterier (NOB). I denna studie har undersökningar utförts både i laboratorie- och pilotskala för att utvärdera inverkan av olika luftningsstrategier, (som kännetecknas av koncentrationen av löst syre - DO och förhållandet (R) mellan tider för icke luftade och luftade faser), på deammonifikationprocessen i en MBBR (Moving Bed Biofilm Reactor).
Tre serier av satsvisa försök utfördes i laboratorieskala med olika syre koncentrationer (2, 3, 4 mg/l) och R värden (0 - kontinuerlig luftning; 1/3, 1, 3 - intermittent luftning), men med samma initiala ammonium-koncentration, volym av den rörliga bädden och temperatur. Man fann att effekten av löst syre (DO) på deammonifikationen var beroende på R-värde. Vid R = 0 och R = 1/3, gav en ökning av löst syre (DO) en signifikant ökning i kvävereningshastigheten, medan för R = 1 och R = 3 observerades samma hastighet i processen oberoende av löst syrehalt
(DO). Den högsta hastigheten för kväveavskiljning 3,33 gN/m2d (avskiljningsgraden var lika med 69,5%) erhölls vid R=1/3 och DO=4
mg/l. Betydligt lägre värden (från 1,17 till 1,58 gN/m2d) observerades vid R=1 och R=3 för varje undersökt halt av löst syre (DO). Det var en följd av minskad varaktighet av luftad fas och mindre mängd av kvarvarande nitrit i icke luftade faser jämfört med R= 1/3.
Pilotskaleförsök utfördes i en MBBR med en arbetsvolym på 200 L. Pilotanläggningen har drivits i 1,5 år med att avlägsna kväve från rejektvatten från avvattning av rötslam. Aktiviteten hos olika grupper av mikroorganismer i biofilmen mättes genom tester av specifik anammoxaktivitet (SAA), syreupptagningshastighet (OUR) och nitratutnyttjandegrad (NUR). Driften var uppdelat i 7 perioder med olika kvävebelastning och luftningsstrategier. Den högsta hastigheten och grad av kväveavskiljning erhölls då DO var 3,5 mg/l och R uppgick till 1/3.
Aktivitetstester visade att anammoxbakterier och AOB spelade dominerande roller i biofilmen. De genomsnittliga och maximala värden
för specifika anammoxaktiviteten (SAA) var 3,01 gO2/m2d och 4,3
gO2/m2d, respektive. 4,0 gO2/m2d som medelvärde och högsta värde
på 5,1 gO2/m2d erhölls för syreupptagningen för AOB aktivitetstester.
Studien visade att användning av en lämpligt vald luftningsstrategi minskar energiförbrukningen utan några negativa effekter på processen. Införande av anaeroba faser och hög kvävetillförseln ökar aktiviteten för anammoxbakterier och NOB-aktiviteten begränsades.

Jingjing Yang TRITA LWR LIC 2065
vi
Controlling and Monitoring of Deammonification Process in Moving Bed Biofilm Reactor
vii
ACKNOWLEDGEMENTS
The research presented in the thesis is part of the co-operation project between Royal Institute of Technology (KTH) and Swedish Environmental Research Institute (IVL). The experimental work was carried out at Hammarby Sjöstadsverk (Center for innovative municipal wastewater purification), Stockholm, Sweden. Financial support from
Lars Erik Lundbergs Foundation (scholarship for Jingjing Yang), Swedish Water Development (SVU), Swedish Institute and ITT are greatly appreciated.
I would like to express my gratitude and appreciation to my supervisors Professor Elzbieta Plaza, Dr. Jozef Trela and Professor emeritus Bengt Hultman for guiding me into the research field and offering many advices during the studies. I also want to thank the staff working at Hammarby Sjöstadsverket. Assistance from Lars Bengtsson, Christian Baresel, Mila Harding, Rune Bergström and Anders Björk are really appreciated.
I would not be able to finish the work if I did not have any help from Master students who worked with me: Sandra Marinez, Zaira Hernando, Andrea Bertino, Olle Trollberg and Weronika Wojcik. Thank you all for assistance.
Special thanks to Monika Zubrowska-Sudol, Mari Winkler, Isaac Fernandez, Andriy Malovanny for valuable ideas and discussions. Last but not the least; thanks go to all the staff at Department of Land and Water Resources Engineering, especially PhD friends: Sihong Wu, Ting Liu, Razia Sultana and Zhihong Zhao.
Finally, I would like to thank my parents for love and supporting.

Jingjing Yang TRITA LWR LIC 2065
viii
Controlling and Monitoring of Deammonification Process in Moving Bed Biofilm Reactor
ix
TABLE OF CONTENTS
Summary iii Sammanfattning v Acknowledgements vii Table of Contents ix List of papers xi Acronyms and Symbols xiii List of Tables xv List of Figures xvii Abstract 1 1. Introduction 1 2. Biological nitrogen removal 2
2.1. Nitrification and denitrification 2
2.2. Anammox reaction 3
2.3. Deammonification process 4
2.4. Factors influencing the process 5 2.4.1. Dissolved oxygen 5 2.4.2. Temperature 6 2.4.3. pH value and alkalinity 7 2.4.4. Organic matter 7
2.5. Controlling and monitoring of the process 8 3. Objectives of the thesis 8 4. Material and methods 9
4.1. Laboratory scale study 9
4.2. Description of pilot scale MBBR 10
4.3. Influent characteristics 10
4.4. Methods of chemical analysis 11
4.5. Activity tests for different microorganisms 11 4.5.1. Specific Anammox Activity test (SAA) 11 4.5.2. Oxygen Uptake Rate tests (OUR) 11 4.5.3. Nitrate Utilisation Rate test (NUR) 13
5. Results and Discussion 13
5.1. Process performance and efficiency 13 5.1.1. Parameters monitoring the process 13 5.1.2. Assessment of nitrogen conversion 16 5.1.3. Process performance evaluation 17
5.2. Identification and activity of microorganisms 20 5.2.1. Bacterial identification by FISH tests 20 5.2.2. Evaluation of anammox and denitrifrying bacteria activity 20 5.2.3. Assessment of the role of nitrifiers and heterotrophic bacteria 21
6. Conclusions 22 7. Further research work 23 8. References 23

Jingjing Yang TRITA LWR LIC 2065
x
Controlling and Monitoring of Deammonification Process in Moving Bed Biofilm Reactor
xi
LIST OF PAPERS
This thesis is based on results presented in the following papers, which are appended at the end of the thesis:
I. Zubrowska-Sudol, M., Yang, J., Trela, J., Plaza, E. 2010. Evaluation of deammonification process performance at different aeration strategies. Water Science& Technology. 63 (6), 1168-1176.
II. Yang, J., Zubrowska-Sudol, M., Trela, J., Plaza, E. 2011. Influence of aeration conditions on nitrogen removal rate in one-stage partial nitrification/anammox process. In: Proceedings of the IWA Specialized Conference “Nutrient Recovery and Management 2011”, 9-12 January 2011, Miami, Florida. 1307-1320.
III. Yang, J., Trela, J., Plaza, E. 2011. Activity of different groups of microorganisms in moving-bed biofilm reactor with one stage deammonification process. In: Proceedings of the IWA Specialized Conference “Biofilm 2011”, 27-30 October 2011, Shanghai, China. 113-124.
Other papers which are not appended in the thesis:
Winkler, M., Kleerebezem, R.,Gijs Kuenen, J., Yang, J., van Loosdrecht, M. C.M. 2011. Segregation of biomass in aerobic granular sludge allows the enrichment of Anaerobic Ammonium Oxidizing Bacteria at low temperatures. Environmental Science & Technology. 45, 7330–7337.
Winkler, M., Yang, J., Kleerebezem, R., Plaza, E., Trela, J., Hultman, B., van Loosdrecht, M. C. M. 2012. Nitrate reduction by organotrophic anammox bacteria in a partial nitrifying granular sludge and a moving bed biofilm reactor. Bioresource Technology. 114, 217-223.
Yang, J., Trela, J., Plaza, E. 2011. Influence of aeration strategy on behaviour of different microorganisms in deammonification process. In: Proceedings of the international conference “Environmental Biotechnology”, 7-9 September 2011, Gdansk, Poland. Paper 10.

Jingjing Yang TRITA LWR LIC 2065
xii
Controlling and Monitoring of Deammonification Process in Moving Bed Biofilm Reactor
xiii
ACRONYMS AND SYMBOLS
AOB - Ammonium Oxidizing Bacteria
Anammox - Anaerobic Ammonium Oxidation
COD - Chemical Oxygen Demand (mg O2/l)
DO - Dissolved Oxygen
FA - Free Ammonia
FISH - Fluorescent In Situ Hybridization
FNA - Free Nitrous Acid
HRT -Hydraulic Retention Time
HPLC – High Performance Liquid Chromatography
MBBR - Moving Bed Biofilm Reactor
NOB - Nitrite Oxidizing Bacteria
NRBC -Non-woven Rotating Biological Contactor
NUR - Nitrate Utilization Rate
OUR - Oxygen Uptake Rate
PID - Proportional–Integral–Derivative
RBC – Rotating Biological Reactor
SAA - Specific Anammox Activity
SBR - Sequencing Batch Contactor
SNAD- Simultaneous partial Nitrification, Anammox and Denitrification
TKN - Total Kjeldahl Nitrogen
TSS -Total Suspended Solids
UASB -Upflow Anaerobic Sludge Blanket
VFA -Volatile Fatty Acid
VSS - Volatile Suspended Solids
WWTP - Wastewater Treatment Plant

Jingjing Yang TRITA LWR LIC 2065
xiv
Controlling and Monitoring of Deammonification Process in Moving Bed Biofilm Reactor
xv
LIST OF TABLES
Table 1. Requirements for WWTP discharges to the Baltic Sea.
Table 2. Operational periods for the pilot scale MBBR.
Table 3. Characteristics of influent supernatant.
Table 4. Average values of pH value, redox potential and conductivity inside reactor.
Table 5. Nitrogen removal from MBBR with deammonification process.

Jingjing Yang TRITA LWR LIC 2065
xvi
Controlling and Monitoring of Deammonification Process in Moving Bed Biofilm Reactor
xvii
LIST OF FIGURES
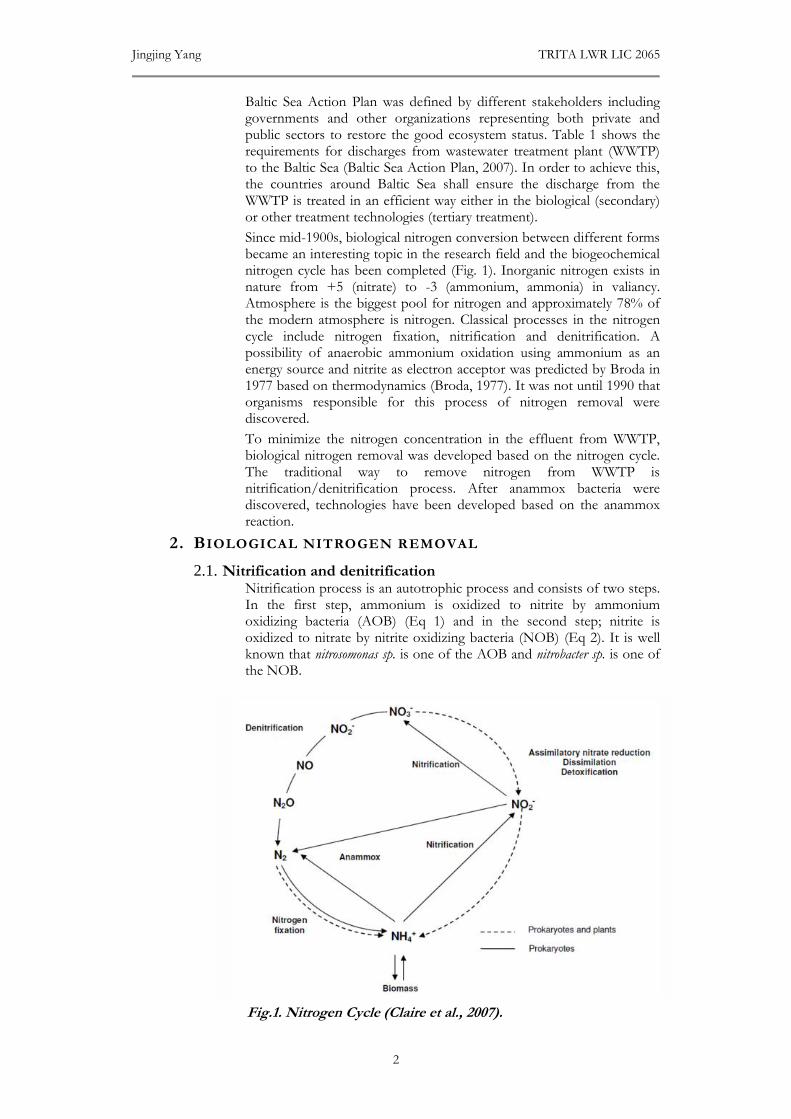
Fig. 1. Nitrogen Cycle.
Fig. 2. Layer structure of nitrification/anammox biofilm.
Fig. 3. Competition between different microorganisms in one stage deammonification process.
Fig. 4. Different aeration strategies and sampling time applied in laboratory scale study.
Fig. 5. Pilot scale deammonification process in moving bed biofilm reactor.
Fig. 6. Variation of physical parameters at DO 3 mg/l in the laboratory scale study.
Fig. 7. Variation of conductivity value with different R value at DO 4 mg/l in laboratory scale study.
Fig. 8. Correlation between conductivity and ammonium concentration in laboratory scale study.
Fig. 9. Daily average value of on-line physical parameters measurement in pilot scale study in period III.
Fig. 10. Variation of nitrite concentration with different value of R at DO 4 mg/l in laboratory scale study.
Fig. 11. Variation of nitrate concentration with R=1/3 at DO 2, 3, 4 mg/l in laboratory scale study.
Fig. 12. Concentrations of different nitrogen compounds in influent and
effluent.
Fig. 13. Concentrations of COD and alkalinity in the influent and effluent of pilot scale MBBR.
Fig. 14. Nitrogen loads and removal rate in the pilot scale study.
Fig. 15. FISH images of biofilm samples from MBBR.
Fig. 16. Activities of anammox bacteria and heterotrophic denitrifiers in each operation period.
Fig. 17. Average activities of heterotrophic bacteria, ammonium oxidizers and nitrite oxidizer during each operation period.

Jingjing Yang TRITA LWR LIC 2065
xviii
Controlling and Monitoring of Deammonfiication Process in Moving Bed Biofilm Reactor
1
ABSTRACT
In partial nitrification/anammox process, which is called deammonification process, dissolved oxygen (DO) is a crucial parameter not only for the process performance but also for the behavior of microorganisms. The aim of this study was to investigate the influence of aeration strategies on the process performance and efficiency both in laboratory and pilot scales. Activity of different microorganisms was investigated in pilot scale research by Specific Anammox Activity (SAA), Oxygen Uptake Rate (OUR) and Nitrate Utilization Rate (NUR) tests. The results showed that intermittent aeration (R), the ratio of the duration of aerated phase and non-aerated phase in each hour, and dissolved oxygen concentration (DO) were the main factors influencing the system. The highest nitrogen removal rate were obtained at R=1/3 and DO= 4 mg/l in laboratory scale study while R = 1/3 and DO = 3.5 mg/l in pilot scale study. A proper choice of aeration strategy can reduce energy consumption without any loss of the process performance. Activity results showed that anammox bacteria activity can be enhanced by offering non-aerated phase and high nitrogen load. Activity of heterotrophic bacteria was successfully limited in the operation and AOB got the highest value of activity among all the oxygen consumers.
Key words: Activity tests; aeration strategies; anammox; deammonification process.
1. INTRODUCTION
Nitrogen and phosphorus are the essential elements for life. However a great amount of nitrogen released in the natural water system can cause eutrophication problem. Eutrophication means that high input of nitrogen or phosphorus to water system leads to an increase of the ecosystem’s primary productivity and further results in a shortage of oxygen and serious reductions in water quality (OECD, 1982). The sources of nitrogen entering to natural ecological system are domestic wastewater, industrial production and agriculture fertilization (Gao et al., 2002; Jin et al., 2006; Le et al., 2010). Wastewater from different sources has various nitrogen concentrations. For instance, municipal sewage contains approximately 20-50 mg NH4
+-N/l (Ho et al., 1992; Ma et al., 2012), while reject water from dewatering of digested sludge reaches 1000 mg NH4
+-N/l (Plaza et al., 2011). Wastewater from piggery industry has TKN concentration around 2000 mg/l (Estrada et al., 2002). Nitrogen concentration in landfill leachate used in Parkes (2007) studies had approximately 3500 mg NH4
+-N/l.
Due to the severe problem of water pollution and clean water shortage, new legislations are developed to improve the quality of water discharge into nature system. In order to prevent eutrophication in the Baltic Sea,
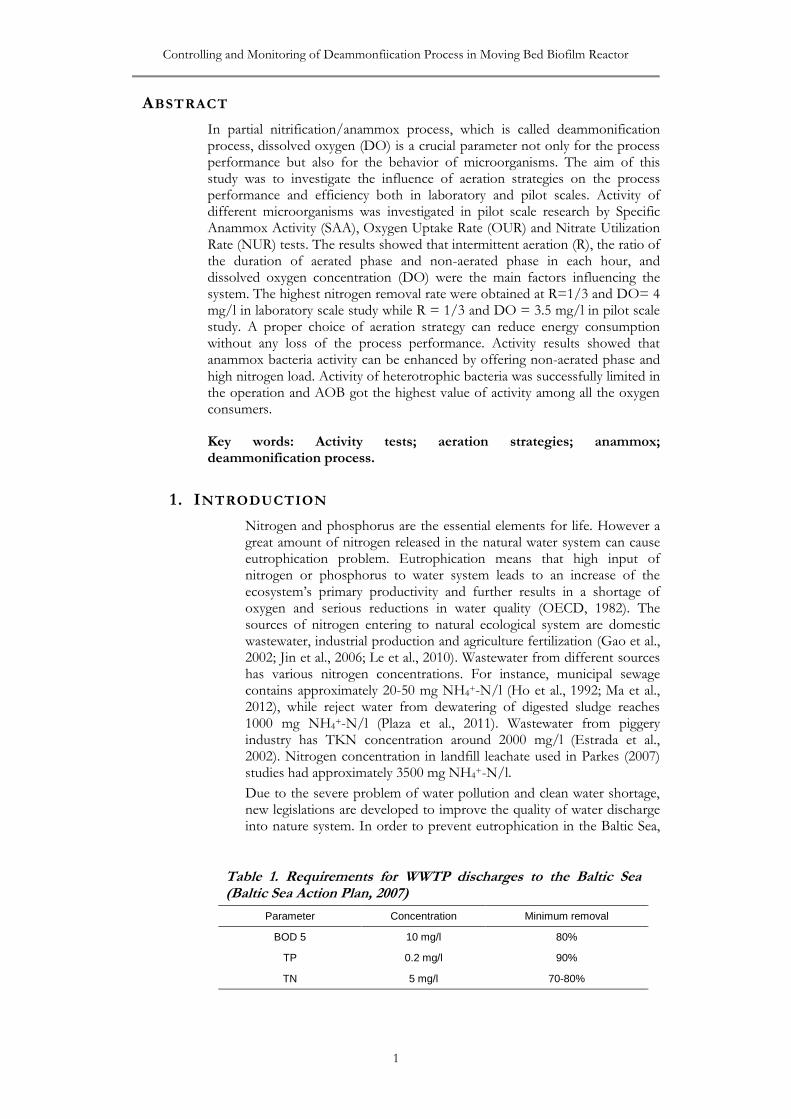
Table 1. Requirements for WWTP discharges to the Baltic Sea (Baltic Sea Action Plan, 2007)
Parameter Concentration Minimum removal
BOD 5 10 mg/l 80%
TP 0.2 mg/l 90%
TN 5 mg/l 70-80%
Jingjing Yang TRITA LWR LIC 2065
2
Baltic Sea Action Plan was defined by different stakeholders including governments and other organizations representing both private and public sectors to restore the good ecosystem status. Table 1 shows the requirements for discharges from wastewater treatment plant (WWTP) to the Baltic Sea (Baltic Sea Action Plan, 2007). In order to achieve this, the countries around Baltic Sea shall ensure the discharge from the WWTP is treated in an efficient way either in the biological (secondary) or other treatment technologies (tertiary treatment).
Since mid-1900s, biological nitrogen conversion between different forms became an interesting topic in the research field and the biogeochemical nitrogen cycle has been completed (Fig. 1). Inorganic nitrogen exists in nature from +5 (nitrate) to -3 (ammonium, ammonia) in valiancy. Atmosphere is the biggest pool for nitrogen and approximately 78% of the modern atmosphere is nitrogen. Classical processes in the nitrogen cycle include nitrogen fixation, nitrification and denitrification. A possibility of anaerobic ammonium oxidation using ammonium as an energy source and nitrite as electron acceptor was predicted by Broda in 1977 based on thermodynamics (Broda, 1977). It was not until 1990 that organisms responsible for this process of nitrogen removal were discovered.
To minimize the nitrogen concentration in the effluent from WWTP, biological nitrogen removal was developed based on the nitrogen cycle. The traditional way to remove nitrogen from WWTP is nitrification/denitrification process. After anammox bacteria were discovered, technologies have been developed based on the anammox reaction.
2. BIOLOGICAL NITROGEN REMOVAL
2.1. Nitrification and denitrification Nitrification process is an autotrophic process and consists of two steps. In the first step, ammonium is oxidized to nitrite by ammonium oxidizing bacteria (AOB) (Eq 1) and in the second step; nitrite is oxidized to nitrate by nitrite oxidizing bacteria (NOB) (Eq 2). It is well known that nitrosomonas sp. is one of the AOB and nitrobacter sp. is one of the NOB.
Fig.1. Nitrogen Cycle (Claire et al., 2007).
Controlling and Monitoring of Deammonfiication Process in Moving Bed Biofilm Reactor
3
The stoichiometry reactions are shown below:
NH4++1.382O2+1.982HCO3
-→0.018C5H7O2N+ 0.982NO2-+ 2.927H2O
+ 1.891CO2 (Eq 1)
NO2-+0.003NH4
++0.488O2+0.010H2CO3+0.003HCO3-
→0.003C5H7O2N + NO3- + 0.008H2O (Eq 2)
If only considering the nitrogen conversion, simple ways to write the reactions are presented below:
NH4++1.5O2NO2
-+2H++H2O (Eq 3)
NO2-+0.5O2NO3
- (Eq 4)
Denitrification is carried out by heterotrophic bacteria under anoxic condition converting nitrite / nitrate produced in nitrification process to nitrogen gas while using organic matter (illustrated by methanol in equation 5) as a source of carbon and energy.
6NO3-+5CH3OH→2N2+5CO2+7H2O+6OH- (Eq 5)
It can be seen from equation 5 that biodegradable organic matter is needed for the denitrification process. If there is no available organic matter present in the wastewater, addition of external carbon source is required. Methanol is commonly used to add into the denitrification process in WWTP due to the low cost. For reduction of 1 g NO3
--N during denitrification 2.85 g COD is required (Bernet et al., 1996).
2.2. Anammox reaction
The anammox reaction, which means ANaerobic AMMonium OXidation, use ammonium as an energy source and nitrite as an electron acceptor, was first described by Broda in 1977 based on thermodynamics (Broda, 1977). He pointed out that one group of lithotrophic bacteria have not yet been detected which can oxidize ammonia to nitrogen with O2, nitrite or nitrate. The anammox reaction was first observed in the Gist Brocades Fermentation Company in the Netherlands in 1986. Although "missing" nitrogen was measured from practical experiences, it was not until 1990 that organisms responsible for the nitrogen removal were described (Mulder et al., 1995). The presence of anammox bacteria has been later reported in the Black Sea (Kuyper et al., 2003), Golfo Dulce, Costa Rica (Dalsgaard et al., 2003), and the Baltic Sea (Gebhard et al., 2004; Engström et al., 2005). Today, it is recognized that anammox reaction plays a significant role in the marine system and 30-50% of the N2 produced from the oceans is from anammox reaction (Dalsgaard et al., 2005).
The stoichiometry of the process was described by Strous et al. (1998):
NH4++1.32NO2
-+0.066HCO3-+H+1.02N2+0.26NO3
-
+0.066CH2O0.5N0.15+2H2O (Eq 6)
According to equation 6, removal of 1 mole of NH4+-N by anammox
bacteria 1.32 mole of NO2--N is needed and 0.26 mole of NO3
--N is produced. Since nitrogen present in the wastewater is in the form of ammonium, about half of the ammonium is needed to be oxidized to nitrite before anammox reaction. The theoretical maximum nitrogen removal efficiency is 88.8%. Hydrogen carbonate is used in the reaction as carbon source, which decrease the alkalinity in the system. Biomass yield is 0.066 mole C/mole NH4
+-N. The Gibbs free energy calculated by Strous (2000) is 357 kJ/mole NH4
+-N.
Van de Graaf et al. (1997) found that the intermediates for anammox reaction was hydrazine and hydroxylamine. It was confirmed by Schalk et al. (1998) that hydrazine was an intermediate of the anammox process.
Jingjing Yang TRITA LWR LIC 2065
4
Important enzymes are hydroxylamine oxidoreductase (HAO) which was purified by Schalk et al. (2000) and hydrazine oxidase (HZO) which was purified by Shimamura et al. (2007). The mechanism of anammox reaction was proposed by Schalk et al. (1998) that ammonium and hydroxylamine which was converted from nitrite would be combined into hydrazine, and then be oxidized to the form of nitrogen gas.
Moreover, it was found that anammox bacteria (species of Candidatus “ Brocadia fulgida” and “Candidatus Anammoxoglobus propionicus”) have another reaction route to oxidize volatile fatty acids with nitrate as electron acceptor, while forming ammonium with nitrite as intermediate (Guven et al., 2005; Kartal et al., 2008). Anammox bacteria do not to incorporate fatty acids into biomass, but completely oxidize it into CO2 thereby maintaining a low biomass yield (Kartal et al., 2007a, b).
Anammox bacteria “Brocadia”,” Kuenenia”, “Candidatus Scalindua brodae”, “Candidatus Scalindua wagneri”, “Candidatus Anammoxoglobus propionicu” were found in wastewater. “Candidatus Scalindua sorokinii”, “Candidatus Scalindua Arobica” were discovered in the seawater.
2.3. Deammonification process Partial nitrification/anammox, which is also called deammonification was introduced by University of Hanover and was applied to remove nitrogen from leachate (Hippen et al., 2001). This term is used more commonly later in biofilm processes (Seyfried et al., 2002, Rosenwinkel et al., 2005; Plaza et al., 2011).
Deammonification is a two-step process which includes partial nitrification and anammox reaction. It can be performed either in one reactor or two reactors. Firstly, part of ammonium is oxidized to nitrite (Eq 3) and secondly, anammox bacteria use ammonium and nitrite as substrates and produce nitrogen gas, which should proceed under anaerobic conditions (Eq 6).
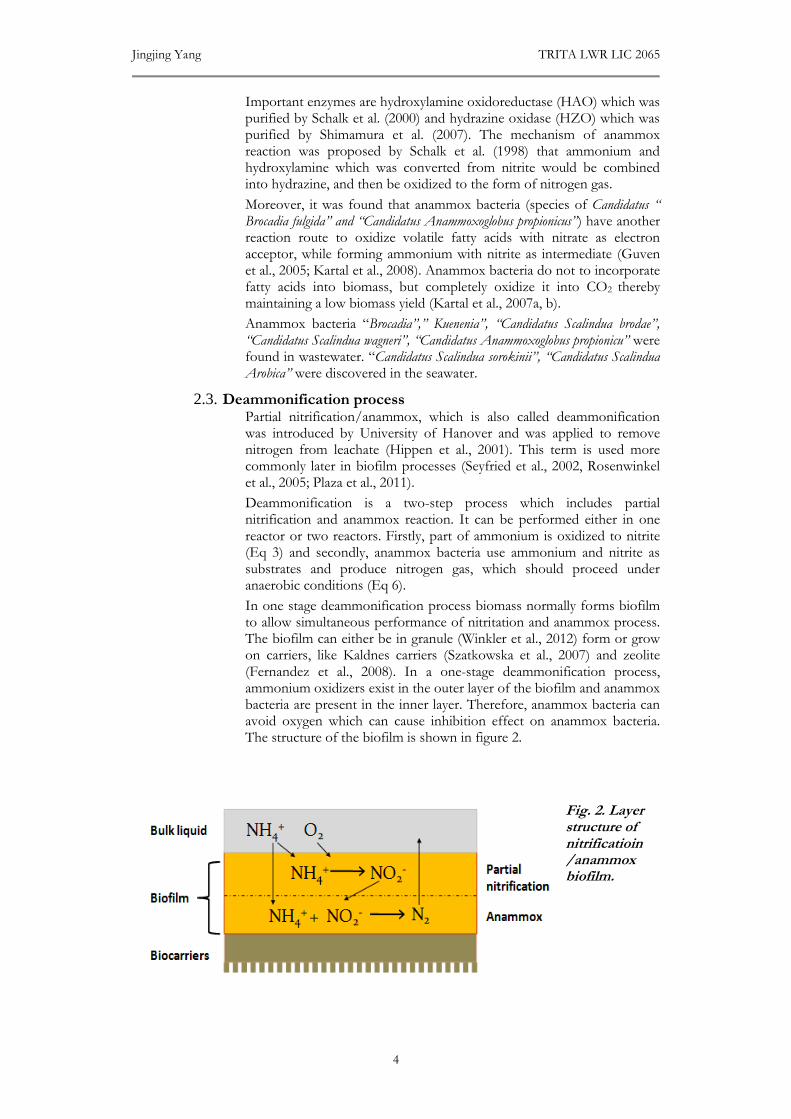
In one stage deammonification process biomass normally forms biofilm to allow simultaneous performance of nitritation and anammox process. The biofilm can either be in granule (Winkler et al., 2012) form or grow on carriers, like Kaldnes carriers (Szatkowska et al., 2007) and zeolite (Fernandez et al., 2008). In a one-stage deammonification process, ammonium oxidizers exist in the outer layer of the biofilm and anammox bacteria are present in the inner layer. Therefore, anammox bacteria can avoid oxygen which can cause inhibition effect on anammox bacteria. The structure of the biofilm is shown in figure 2.
Fig. 2. Layer structure of nitrificatioin /anammox biofilm.
Controlling and Monitoring of Deammonfiication Process in Moving Bed Biofilm Reactor
5
One stage deammonification process with different reactor configurations has been studied by many research groups as granular sludge applied in SBR (Mulder et al., 1995), biofilm on Kaldnes carriers used in MBBR (Rosenwinkel et al., 2005) and on Rotating Biological Contactor (RBC) (Cema et al., 2007).
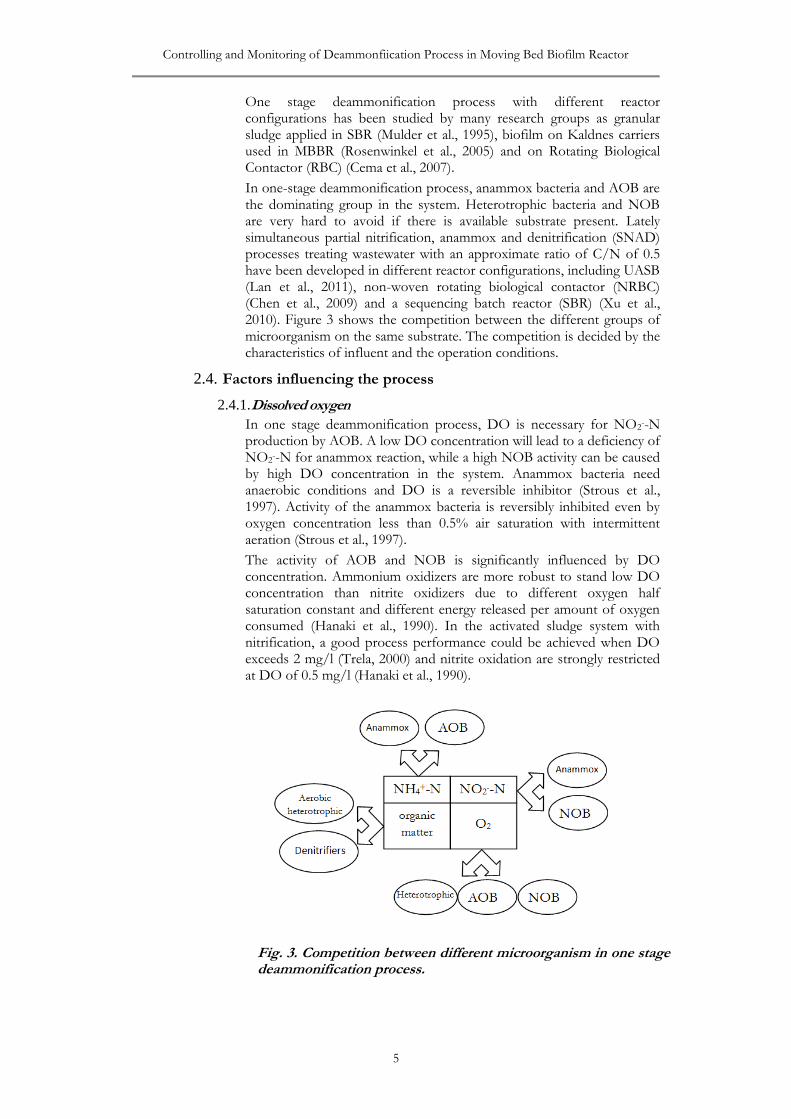
In one-stage deammonification process, anammox bacteria and AOB are the dominating group in the system. Heterotrophic bacteria and NOB are very hard to avoid if there is available substrate present. Lately simultaneous partial nitrification, anammox and denitrification (SNAD) processes treating wastewater with an approximate ratio of C/N of 0.5 have been developed in different reactor configurations, including UASB (Lan et al., 2011), non-woven rotating biological contactor (NRBC) (Chen et al., 2009) and a sequencing batch reactor (SBR) (Xu et al., 2010). Figure 3 shows the competition between the different groups of microorganism on the same substrate. The competition is decided by the characteristics of influent and the operation conditions.
2.4. Factors influencing the process
2.4.1. Dissolved oxygen
In one stage deammonification process, DO is necessary for NO2--N
production by AOB. A low DO concentration will lead to a deficiency of NO2
--N for anammox reaction, while a high NOB activity can be caused by high DO concentration in the system. Anammox bacteria need anaerobic conditions and DO is a reversible inhibitor (Strous et al., 1997). Activity of the anammox bacteria is reversibly inhibited even by oxygen concentration less than 0.5% air saturation with intermittent aeration (Strous et al., 1997).
The activity of AOB and NOB is significantly influenced by DO concentration. Ammonium oxidizers are more robust to stand low DO concentration than nitrite oxidizers due to different oxygen half saturation constant and different energy released per amount of oxygen consumed (Hanaki et al., 1990). In the activated sludge system with nitrification, a good process performance could be achieved when DO exceeds 2 mg/l (Trela, 2000) and nitrite oxidation are strongly restricted at DO of 0.5 mg/l (Hanaki et al., 1990).
Fig. 3. Competition between different microorganism in one stage deammonification process.
Jingjing Yang TRITA LWR LIC 2065
6
Hyungseok et al. (1999) showed that nitrate formation can be prevented efficiently in one stage partial nitrification and denitrification process by frequent switching between aerobic and anoxic phases. The aeration should switch off before approximately half of the ammonium oxidizes to nitrite and convert further to nitrate. Wantawin et al. (2008) studied different oxygen supply modes including continuous aeration, intermittent aeration and different HRT in sequencing batch biofilm reactors for nitrogen removal from synthetic wastewater. Results showed that different aeration modes influenced mostly NH4
+-N and NO3--N
concentrations in the effluent, which are the parameters indicating the system efficiency.
2.4.2. Temperature
Microorganism growth rate, mass transfer (oxygen transfer characteristics of the system) and chemical equilibrium (Collins et al., 1978; Van Hulle et al., 2010) are influenced by temperature.
Pure cultures of nitrosomonas sp. and nitrobacter sp. were used in Grunditz et al. (2000) and results showed that the optimum temperature was 35 °C and 38°C respectively. It is possible to compete out effectively the NOB at temperature above 25°C with low solids retention time (SRT) due to a faster increase of the specific growth rate of AOB than NOB (Hellinga et al., 1998; Jetten et al., 1999). Partial nitritation was successfully performed at a temperature between 15°C and 30°C. However, the efficiency of nitritation process decreases dramatically when temperature is below 15°C (Yamamoto et al., 2006).
Many studies showed that the optimum temperature for operation of anammox process was between 35°C and 40°C (Szatkowska et al., 2006; Yang et al., 2006). Egli et al. (2001) demonstrated that the highest anammox activity was observed at 37°C. No anammox activity was observed at 45°C and anammox activity at 11°C was approximately 24% of that at 37°C. Strous (2000) observed that the optimum temperature for the anammox biomass was 40 ± 3°C. The activity changed according to the Arrhenius law between 20 °C and 37 °C. Dalsgaard et al. (2002) and Rysgaard (2004) reported that anammox bacteria showed activity at a temperature of 15ºC and 12ºC, respectively.
Studies on partial nitritation / anammox process were mostly carried out at temperature 20 - 30°C (Szatkowska et al., 2006; de Graaff et al., 2010; Liang et al., 2011; Yang et al., 2011). Cema et al. (2007) proved that partial nitritation/ anammox process would be successfully operated in a rotating biological contactor at 20°C. Similar results were reported by Isaka et al. (2007) and the process could be operated at temperature 20-22°C. Dosta et al. (2008) have tested short and long term effects of temperature on the anammox process. Study results showed that anammox bacteria reached the maximum activity at 35 – 45°C in the short term batch tests and a laboratory scale SBR with granule sludge were successfully operated at 18°C. The SBR lost its stability when temperature decreased to 15°C. Hao et al. (2002) have done a model based evaluation of temperature on a partial nitrification and anammox biofilm process. The simulation was done at a temperature range from 15 to 40 ºC. The results showed that if temperature decreased, the activities of the involved organisms decrease, which means that thicker biofilms are needed or nitrogen load should be decreased to maintain high nitrogen removal at lower temperature.
Controlling and Monitoring of Deammonfiication Process in Moving Bed Biofilm Reactor
7
2.4.3. pH value and alkalinity
The level of pH value influences the free ammonia and nitrous acid concentration (Anthonisen et al., 1976). An increase of free ammonia will be observed with a rise of pH value when there are constant temperature and concentrations of ammonium. A decrease of pH value leads to rise of nitrous acid concentration. Anthonisen et al. (1976) showed that ammonium oxidizers are inhibited at NH3 concentration of 120 mg/L and nitrous acid concentration of 2.8 mg/l. Malovanyy et al. (2009) stated that the most favorable value of FA/FNA ratio for anammox process lies in the range from 0.1 to 1.
The pH value is usually kept in the range of 7.5 to 8.5 in partial nitrification process (van Hulle et al., 2010). The optimum pH value was 8.1 for nitrosomonas sp. and 7.9 for nitrobacter sp. (Grunditz et al., 2000). Strous et al. (1999) observed anammox activity between pH value of 6.7 and 8.3 with an optimum pH value of 8. There is activity of anammox bacteria at pH values below 9 (Eli et al., 2001).
For nitrification and anammox process, HCO3- is the carbon source for
the reaction and building new bacteria cells. Alkalinity drops down during the nitrification process. Each mole of NH4
+ oxidized will consume 2 moles of HCO3
- (Trela, 2000). Synthesis of new bacteria cells and decomposition of organic nitrogen will influence the alkalinity value. Bagchi et al. (2010) showed that alkalinity could be used as a controlling parameter in a single stage partial nitritation and anammox reactor. Tokutomiet al. (2010) indicated that nitrite and nitrate accumulation could be controlled by the addition of different alkalinity sources (NaHCO3 or NaOH, respectively).
2.4.4. Organic matter
Anammox reaction is autotrophic. Wastewater containing low concentration of organic matter and high content of nitrogen is favorable for anammox process. It was reported that with the presence of a certain level of organic matter anammox bacteria cannot compete with denitrifiers due to slower growth rate (Strous et al., 1999). Many studies lately showed that with the ratio of C/N less than 0.5 in the influent anammox bacteria can maintain in the system and also outcompete heterotrophic bacteria (Winkler et al., 2011). Ahn et al. (2004) successfully treated piggery waste in an UASB anammox reactor and competition between anammox and denitrification was reported. Tang et al. (2010) concluded that biodegradable COD:N cannot be higher than 2.9 if anammox is required to be the dominating way of nitrogen removal.
It is reported that some small organic chemical compounds have irreversible inhibition effect on anammox bacteria, such as methanol and ethanol (Isaka et al., 2008; Guven et al., 2005). Van de Graaf et al. (2006) showed that acetate and glucose as organic matter had positive effects on anammox activity. Lately it was found out that anammox bacteria have the capacity to use small molecular organic matter with nitrate as electron acceptor, while forming ammonium with nitrite as intermediate (Guven et al., 2005; Kartal et al., 2008). Anammox bacteria do not incorporate the organic matter into biomass, but completely oxidize it into CO2 thereby maintaining a low biomass yield (Winkler et al., 2012).
Jingjing Yang TRITA LWR LIC 2065
8
2.5. Controlling and monitoring of the process One stage deammonification process is becoming a promising nitrogen removal method applied in the side stream in WWTP. With more applications going on, proper control strategies are necessary for a successful operation. Various control strategies are developed based on the different reactor configurations and forms of biomass. Wett (2007) proposed a pH value based aeration control combined with continuous feeding. pH value was the monitoring factor to decide the volume of oxygen supply. Joss et al. (2009) developed a control strategy based on the on-line measurement of ammonium, nitrate and oxygen and applied cycle feeding. Szatkowska (2007) suggested that conductivity can be used as a monitoring parameter to evaluate the system. Redox potential using a monitoring parameter was also under consideration (Lackner et al., 2011).
For one stage deammonification process, oxygen supply together with DO and nitrogen loads are the control parameters and other available on-line measurement, for instance ammonium, nitrate, nitrite, pH value, conductivity and redox potential value, are monitoring parameters. In order to supply a proper volume of oxygen in the system which could have different nitrogen loads, monitoring parameters are used to help adjusting the oxygen supply. Control strategy can be simplified to looking for a reliable monitoring parameter which can give integrated information of all the possible chemical, physical processes in the treatment system. The monitoring parameter is also expected to be durable, low cost and easy to use. Therefore, the physical parameter control is more popular due to its price and convenience.
Based on the experience from the different aeration control strategies, redox potential can be a promising monitoring tool for the process. Redox potential has been widely studied to monitor nitrification/denitrification and anaerobic digestion (Martinez et al., 2007; Tanwar et al., 2008), and it can provide more information which other parameters cannot reveal, such as the shift between aerobic, anoxic and anaerobic condition (Lackner, 2011). An in-depth investigation using redox potential value as monitoring parameter for one stage deammonification process is needed.
3. OBJECTIVES OF THE THESIS
Nitrogen removal from ammonium rich wastewater by one stage deammonification process was studied. The main objective of this research was to obtain more knowledge to understand, develop, design, optimize and control one stage deammonification process. Wise control strategies can improve the process performance and efficiency and lead to cost reduction. The main objectives of the research are:
To investigate the possibility for controlling and monitoring of the deammonification process in moving bed biofilm reactor.
To evaluate the influence of different control strategies on the process performance and efficiency
To better understand the mechanism of the nitrogen removal by different on-line monitoring parameters.
The aims regarding to controlling one stage deammonification process in the licentiate thesis are:
To determine the importance of dissolved oxygen (DO) on controlling one stage deammonification process.
Controlling and Monitoring of Deammonfiication Process in Moving Bed Biofilm Reactor
9
To develop a control strategy of one stage deammonification process based on different aeration methods.
To assess the influence of aeration strategies (described by both DO concentration and the ratio between duration of non-aerated and aerated phases - R) on deammonification process performance and efficiency.
The goals concerning the monitoring one stage deammonification process in the licentiate thesis are:
To evaluate the process performance and efficiency by using the on-line measurement of pH value, conductivity and redox potential.
To monitor the anammox bacteria activity by Specific Anammox Activity (SAA) tests based on gas production.
To measure the activity of denitrifying bacteria by Nitrate Utilisation Rate (NUR) tests.
To determine the nitrifiers and heterotrophic bacteria’s activity by Oxygen Uptake Rate (OUR) tests.
4. MATERIAL AND METHODS
Most of the experimental research was carried out at Hammarby Sjöstadsverk research facility, which is located in the south of Stockholm, Sweden. The facility was built to develop the knowledge and technologies in wastewater treatment, and it is now also a place for testing and demonstration new solutions and equipments in the wastewater treatment field.
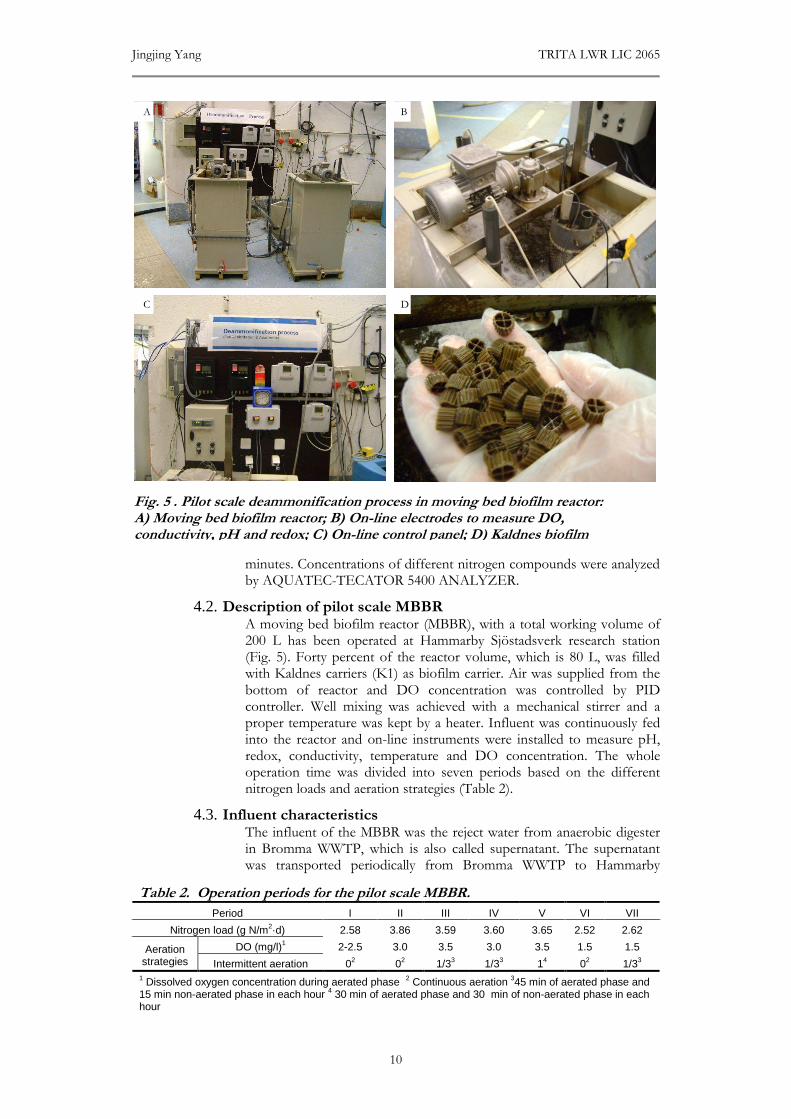
4.1. Laboratory scale study Three series of batch tests were carried out in laboratory scale experiments based on different DO concentrations (2, 3 and 4 mg/l). Four tests had been done for each series of tests with different R (0, 1/3, 1 and 3). R means the ratio of duration between the non-aerated phase and aerated phase in 1 hour. Each batch test was operated in cycle of 4 hours and distributed according to the scheme described in figure 4 (Zubrowska-Sudol et al., 2010).
The laboratory scale experiment was carried out in a 1 liter vessel. Forty percent of the reactor volume was filled with Kaldnes carriers (see description in 4.2). The tests were conducted at temperature 25 °C. The feeding medium for the batch tests was diluted reject water (see description in 4.3) with initial NH4
+-N concentration of 150 mg/l. Oxygen was supplied based on the planned DO and R. Liquid samples were taken from the vessel at each end of aeration phase or no aeration phase. For continuous aeration batch tests, samples were taken every 30
Fig. 4. Different aeration strategies and sampling time applied in laboratory scale study.
Jingjing Yang TRITA LWR LIC 2065
10
minutes. Concentrations of different nitrogen compounds were analyzed by AQUATEC-TECATOR 5400 ANALYZER.
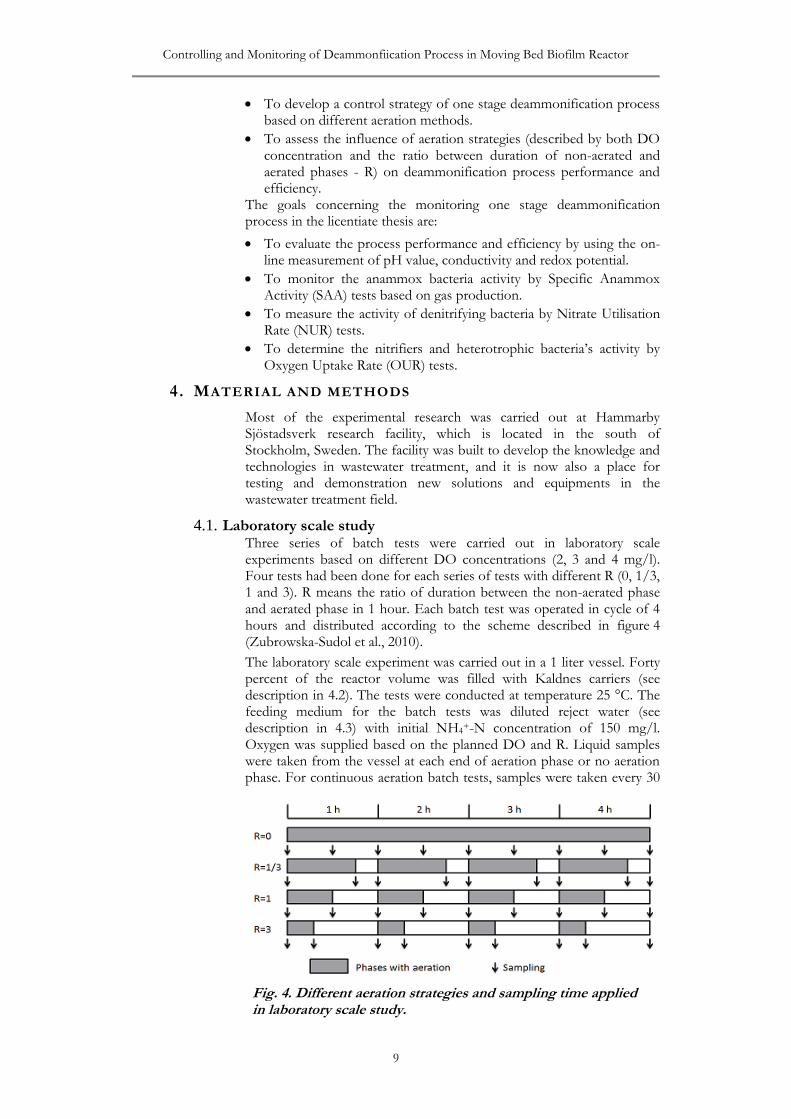
4.2. Description of pilot scale MBBR A moving bed biofilm reactor (MBBR), with a total working volume of 200 L has been operated at Hammarby Sjöstadsverk research station (Fig. 5). Forty percent of the reactor volume, which is 80 L, was filled with Kaldnes carriers (K1) as biofilm carrier. Air was supplied from the bottom of reactor and DO concentration was controlled by PID controller. Well mixing was achieved with a mechanical stirrer and a proper temperature was kept by a heater. Influent was continuously fed into the reactor and on-line instruments were installed to measure pH, redox, conductivity, temperature and DO concentration. The whole operation time was divided into seven periods based on the different nitrogen loads and aeration strategies (Table 2).
4.3. Influent characteristics The influent of the MBBR was the reject water from anaerobic digester in Bromma WWTP, which is also called supernatant. The supernatant was transported periodically from Bromma WWTP to Hammarby
Table 2. Operation periods for the pilot scale MBBR.
Period I II III IV V VI VII
Nitrogen load (g N/m2·d) 2.58 3.86 3.59 3.60 3.65 2.52 2.62
Aeration strategies
DO (mg/l)1 2-2.5 3.0 3.5 3.0 3.5 1.5 1.5
Intermittent aeration 02 0
2 1/3
3 1/3
3 1
4 0
2 1/3
3
1 Dissolved oxygen concentration during aerated phase
2 Continuous aeration
345 min of aerated phase and
15 min non-aerated phase in each hour 4 30 min of aerated phase and 30 min of non-aerated phase in each
hour
A B
Fig. 5 . Pilot scale deammonification process in moving bed biofilm reactor: A) Moving bed biofilm reactor; B) On-line electrodes to measure DO, conductivity, pH and redox; C) On-line control panel; D) Kaldnes biofilm carriers.
A B
C D
Controlling and Monitoring of Deammonfiication Process in Moving Bed Biofilm Reactor
11
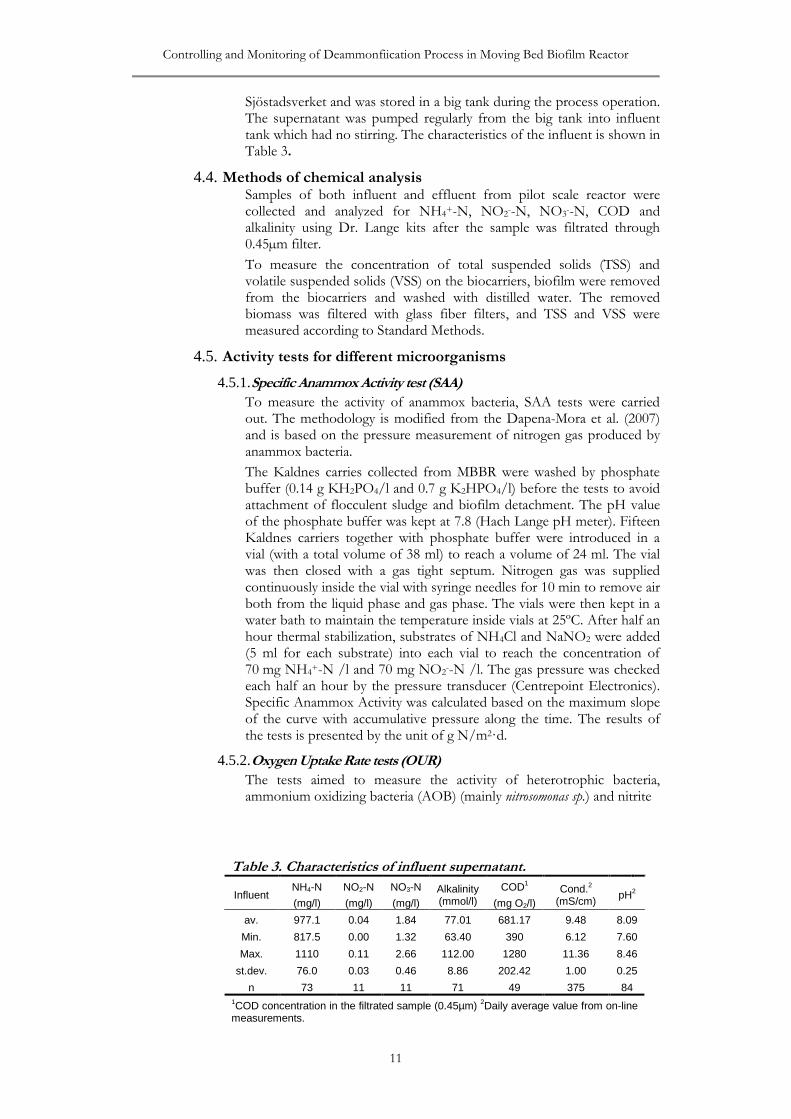
Sjöstadsverket and was stored in a big tank during the process operation. The supernatant was pumped regularly from the big tank into influent tank which had no stirring. The characteristics of the influent is shown in Table 3.
4.4. Methods of chemical analysis Samples of both influent and effluent from pilot scale reactor were collected and analyzed for NH4
+-N, NO2--N, NO3
--N, COD and alkalinity using Dr. Lange kits after the sample was filtrated through 0.45µm filter.
To measure the concentration of total suspended solids (TSS) and volatile suspended solids (VSS) on the biocarriers, biofilm were removed from the biocarriers and washed with distilled water. The removed biomass was filtered with glass fiber filters, and TSS and VSS were measured according to Standard Methods.
4.5. Activity tests for different microorganisms
4.5.1. Specific Anammox Activity test (SAA)
To measure the activity of anammox bacteria, SAA tests were carried out. The methodology is modified from the Dapena-Mora et al. (2007) and is based on the pressure measurement of nitrogen gas produced by anammox bacteria.
The Kaldnes carries collected from MBBR were washed by phosphate buffer (0.14 g KH2PO4/l and 0.7 g K2HPO4/l) before the tests to avoid attachment of flocculent sludge and biofilm detachment. The pH value of the phosphate buffer was kept at 7.8 (Hach Lange pH meter). Fifteen Kaldnes carriers together with phosphate buffer were introduced in a vial (with a total volume of 38 ml) to reach a volume of 24 ml. The vial was then closed with a gas tight septum. Nitrogen gas was supplied continuously inside the vial with syringe needles for 10 min to remove air both from the liquid phase and gas phase. The vials were then kept in a water bath to maintain the temperature inside vials at 25ºC. After half an hour thermal stabilization, substrates of NH4Cl and NaNO2 were added (5 ml for each substrate) into each vial to reach the concentration of 70 mg NH4
+-N /l and 70 mg NO2--N /l. The gas pressure was checked
each half an hour by the pressure transducer (Centrepoint Electronics). Specific Anammox Activity was calculated based on the maximum slope of the curve with accumulative pressure along the time. The results of the tests is presented by the unit of g N/m2·d.
4.5.2. Oxygen Uptake Rate tests (OUR)
The tests aimed to measure the activity of heterotrophic bacteria, ammonium oxidizing bacteria (AOB) (mainly nitrosomonas sp.) and nitrite
Table 3. Characteristics of influent supernatant.
Influent NH4-N
(mg/l)
NO2-N
(mg/l)
NO3-N
(mg/l)
Alkalinity (mmol/l)
COD1
(mg O2/l)
Cond.2
(mS/cm) pH
2
av. 977.1 0.04 1.84 77.01 681.17 9.48 8.09
Min. 817.5 0.00 1.32 63.40 390 6.12 7.60
Max. 1110 0.11 2.66 112.00 1280 11.36 8.46
st.dev. 76.0 0.03 0.46 8.86 202.42 1.00 0.25
n 73 11 11 71 49 375 84
1COD concentration in the filtrated sample (0.45µm)
2Daily average value from on-line
measurements.
Jingjing Yang TRITA LWR LIC 2065
12
oxidizing bacteria (NOB) (mainly nitrobacter sp.) based on measurements of the oxidation rate of NH4
+-N, organic matter content and NO2--N
(produced in the test) by subsequently addition of selective inhibitors of nitrobacter sp. and nitrosomonas sp., which were NaClO3 and ATU (allylthiourea) in testing sample (Surmacz-Gorska et al., 1996).
A volume of 100ml of Kaldnes biofilm carriers were gently washed by distilled water to wash away the attached particles and flocculent sludge before the test. The reject water from digester (the same as influent for the MBBR) was diluted 10 times by distilled water to reach NH4
+-N concentration of 100 mg/l and COD concentration of 70 mgO2/l. Diluted reject water was placed for half an hour until the particles were settled. Only upper part of the diluted reject water was used in the test to avoid influence from flocculent sludge and particles. pH value in the diluted reject water was 7.5 (WTW pH meter). A volume of 1.56 liter 3-neck round bottle was filled by diluted reject water to reach 80% of the volume. The bottle was placed on a magnetic stirrer and kept in a water bath to maintain a temperature of 25ºC. Temperature inside the bottle stabilized after half an hour and the air was supplied by a sparger to allow dissolved oxygen concentration inside the bottle higher than 6 mg/l. A volume of 100ml of Kaldnes biofilm carriers was inoculated, and more diluted reject water was filled inside the bottle until no space was left. Two necks on the side of the bottle were closed with rubber septum and DO electrode was installed in the middle neck of the bottle (Hach Lange DO meter). 17 mM of NaClO3 and 12 mg/l of ATU were added subsequently at 5-7 min and 10-12 min. The whole test took around 15-20 min. Activity of heterotrophic bacteria, AOB and NOB were calculated according to the maximum slope of oxygen consumption rate along the time. The results of the tests were described with unit g O2/ m2·d.
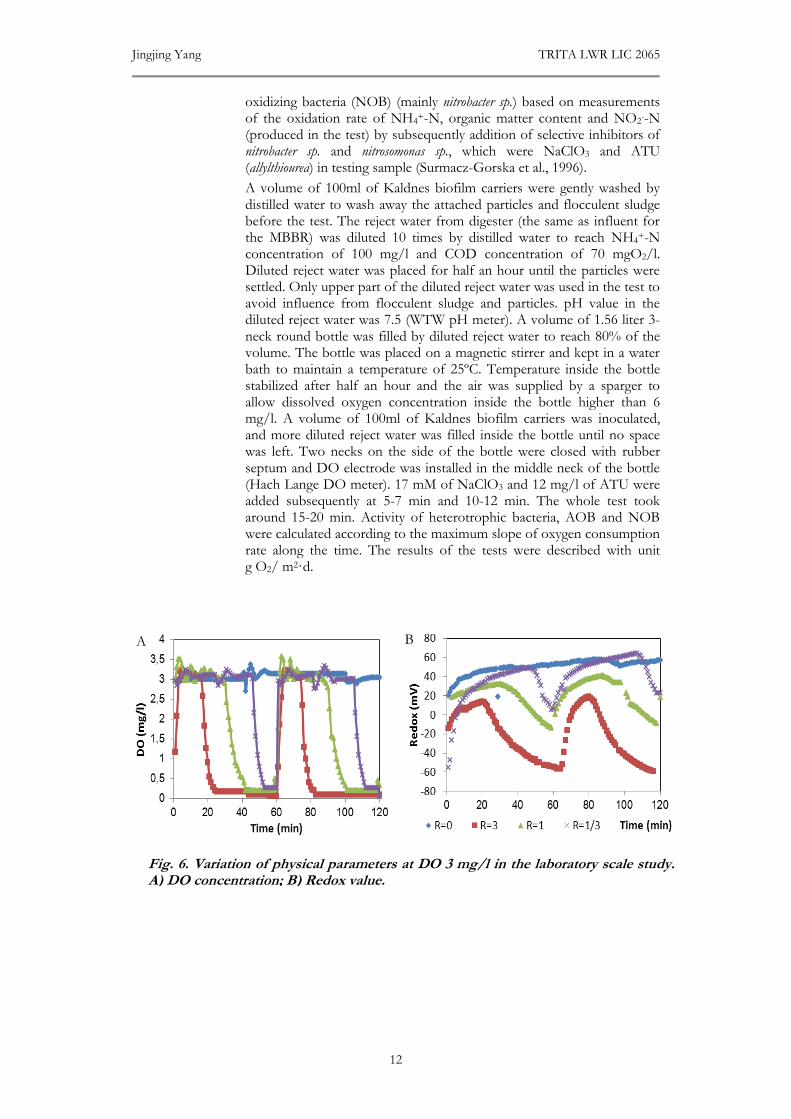
A B
Fig. 6. Variation of physical parameters at DO 3 mg/l in the laboratory scale study. A) DO concentration; B) Redox value.
Controlling and Monitoring of Deammonfiication Process in Moving Bed Biofilm Reactor
13
4.5.3. Nitrate Utilisation Rate test (NUR)
The test was to evaluate the heterotrophic denitrifiers activity by measurement of maximum nitrate utilization rate in 4 hours. Reject water (the same as influent) was diluted 2 times by distilled water to derive COD concentration of 350 mgO2/l. pH value in the diluted reject water was around 8. The reject water contained alkalinity concentration of 4 g CaCO3/l and the pH value almost did not change during the test. One liter of diluted reject water was filled into a volume of 1.5 L plastic beaker. The beaker was placed on a magnetic stirrer in a water bath to keep the temperature at 25°C. Nitrogen gas was supplied continuously into the diluted reject water to remove oxygen from the liquid phase. A volume of 400ml Kaldnes biofilm carriers, which had been gently washed as described in OUR tests, were introduced into the container after DO concentration less than 0.5 mg/l and temperature stabilized. Addition of NaNO3 solution achieved NO3
--N concentration of 100 mg/l. After that, paraffin is to cover the beaker and to avoid oxygen diffusion into the liquid phase, there was nitrogen gas supplied on the water surface during the test. Liquid samples were taken each hour and concentration of NO3
--N was analyzed by Dr Lange tests (LCK340). Activity of the denitrifiers was calculated based on the nitrate consumption rate as a function of the time.
5. RESULTS AND DISCUSSION
5.1. Process performance and efficiency
5.1.1. Parameters monitoring the process
Conductivity, pH value and redox potential were used to monitor the processes both in laboratory and pilot scale study.
Laboratory scale study
An example of the variation of DO concentrations and redox potential values in two hours experiment in laboratory study is shown in figure 6. When air supply started, DO concentration in the reactor increased to the set point in one minute while depleted immediately after aeration stopped. During anoxic phase, DO concentration was less than 0.5 mg/l. Redox potential value, which is a measurement of system oxidization capacity, had a similar changing pattern. A high redox potential value
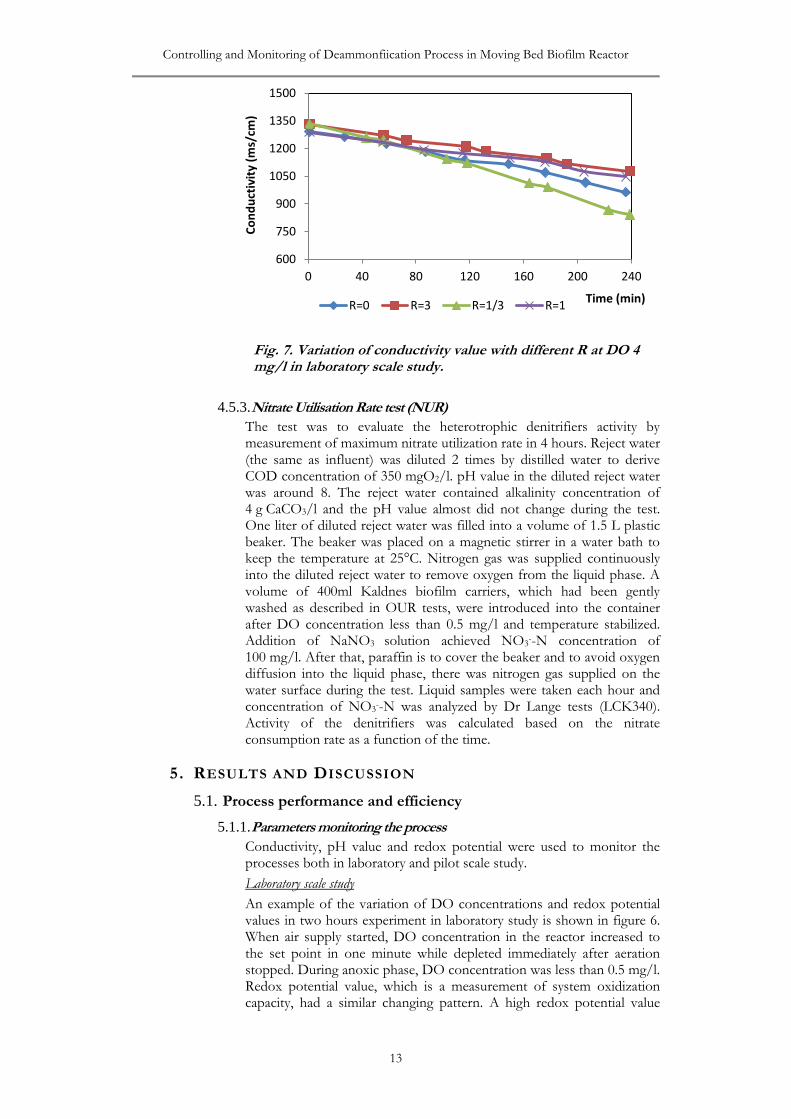
Fig. 7. Variation of conductivity value with different R at DO 4 mg/l in laboratory scale study.
600
750
900
1050
1200
1350
1500
0 40 80 120 160 200 240
Co
nd
uct
ivit
y (m
s/cm
)
Time (min) R=0 R=3 R=1/3 R=1
Jingjing Yang TRITA LWR LIC 2065
14
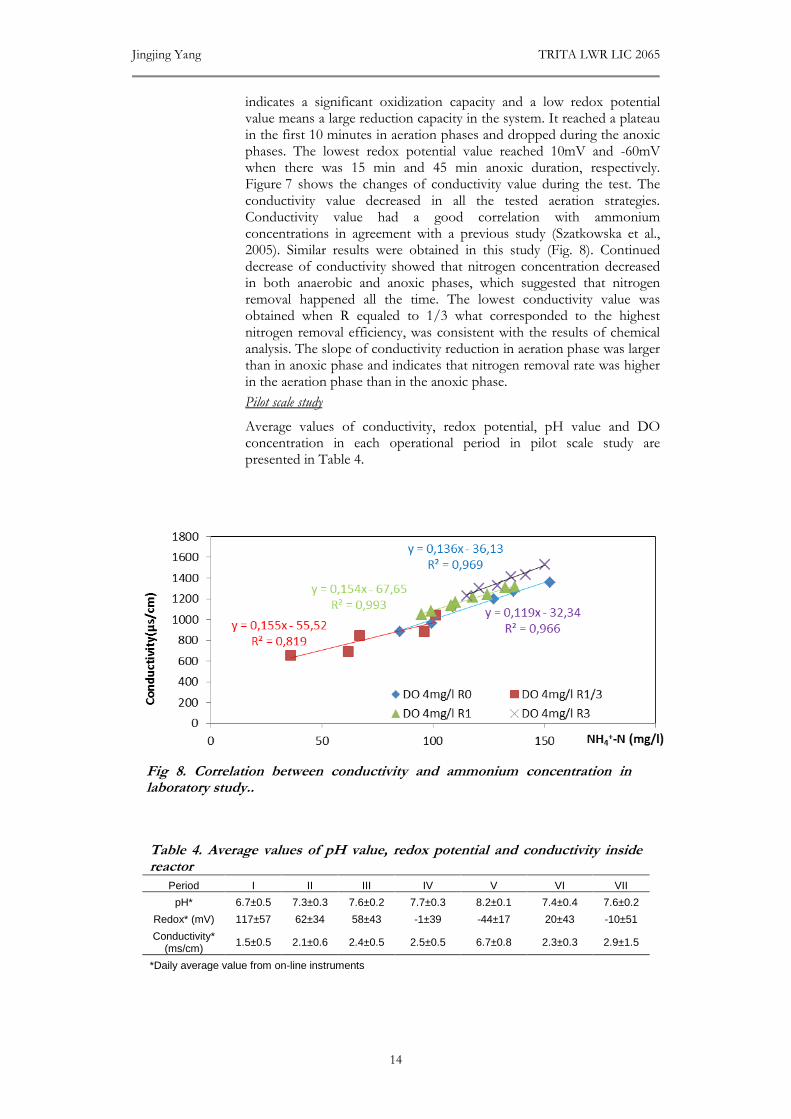
indicates a significant oxidization capacity and a low redox potential value means a large reduction capacity in the system. It reached a plateau in the first 10 minutes in aeration phases and dropped during the anoxic phases. The lowest redox potential value reached 10mV and -60mV when there was 15 min and 45 min anoxic duration, respectively. Figure 7 shows the changes of conductivity value during the test. The conductivity value decreased in all the tested aeration strategies. Conductivity value had a good correlation with ammonium concentrations in agreement with a previous study (Szatkowska et al., 2005). Similar results were obtained in this study (Fig. 8). Continued decrease of conductivity showed that nitrogen concentration decreased in both anaerobic and anoxic phases, which suggested that nitrogen removal happened all the time. The lowest conductivity value was obtained when R equaled to 1/3 what corresponded to the highest nitrogen removal efficiency, was consistent with the results of chemical analysis. The slope of conductivity reduction in aeration phase was larger than in anoxic phase and indicates that nitrogen removal rate was higher in the aeration phase than in the anoxic phase.
Pilot scale study
Average values of conductivity, redox potential, pH value and DO concentration in each operational period in pilot scale study are presented in Table 4.
Table 4. Average values of pH value, redox potential and conductivity inside reactor
Period I II III IV V VI VII
pH* 6.7±0.5 7.3±0.3 7.6±0.2 7.7±0.3 8.2±0.1 7.4±0.4 7.6±0.2
Redox* (mV) 117±57 62±34 58±43 -1±39 -44±17 20±43 -10±51
Conductivity* (ms/cm)
1.5±0.5 2.1±0.6 2.4±0.5 2.5±0.5 6.7±0.8 2.3±0.3 2.9±1.5
*Daily average value from on-line instruments
Fig 8. Correlation between conductivity and ammonium concentration in laboratory study..
Controlling and Monitoring of Deammonfiication Process in Moving Bed Biofilm Reactor
15
The changes of pH value in one stage deammonification process were caused by nitrification and anammox. Denitrification reaction is also needed to be considered in this study because there was available biodegradable organic matter present in the influent. A drop of pH value is expected in nitrification process due to production of H+ in the reaction while a possible increase of pH value will happen if there are only anammox and denitrification reactions occurring under low acid capacity situation.
In the first period (the adaptation period for the biomass), a high concentration of DO (2.5 mg/l) led to an increase of redox potential value to 117 mV and decreased the pH value from 8.02 to 6.7. Conductivity value was 1.5 mS/cm during this period, and a low concentration of NH4
+-N in the effluent was observed. Most of the NH4
+-N was oxidized to NO2--N or NO3
--N. From period II to V, oxygen supply was decreased gradually under the same nitrogen load condition which resulted in a reduction of the redox potential value. The observation of increased conductivity value gave information of an increased concentration of NH4
+-N in effluent. In the last two periods, a lower nitrogen load was applied compared with the former experiment. With intermittent aeration and less oxygen supplied, pH value and conductivity increased while redox potential value decreased.
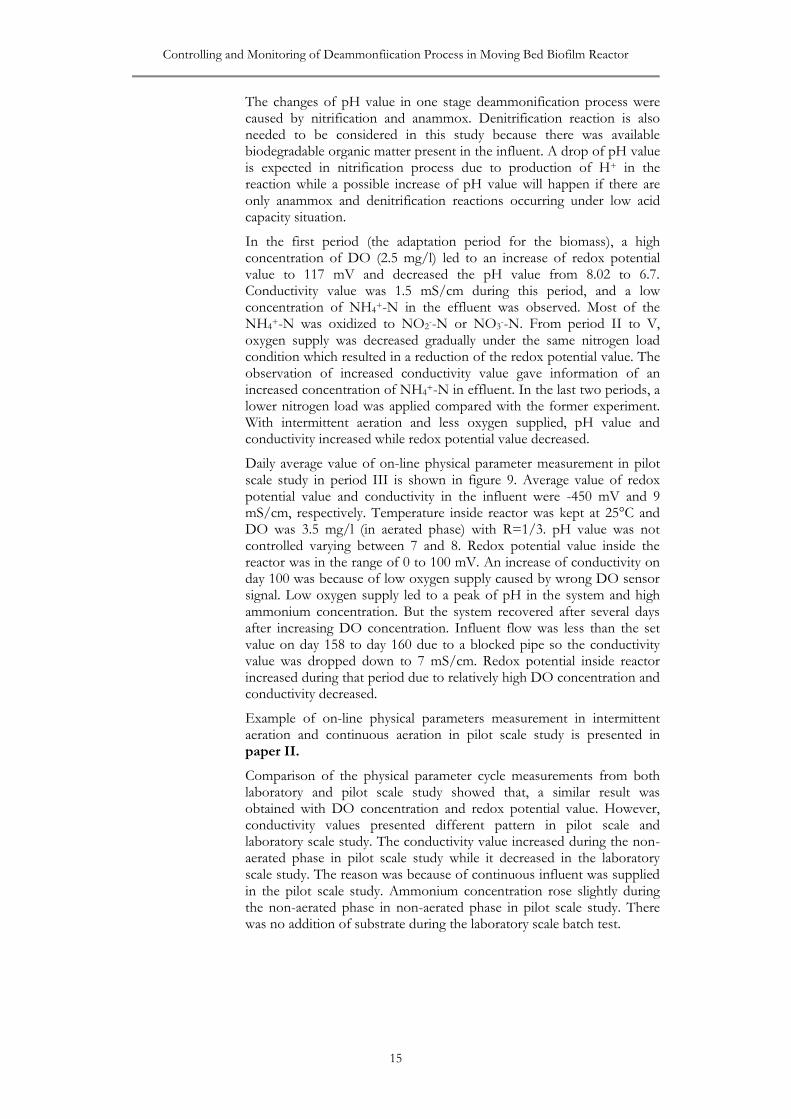
Daily average value of on-line physical parameter measurement in pilot scale study in period III is shown in figure 9. Average value of redox potential value and conductivity in the influent were -450 mV and 9 mS/cm, respectively. Temperature inside reactor was kept at 25°C and DO was 3.5 mg/l (in aerated phase) with R=1/3. pH value was not controlled varying between 7 and 8. Redox potential value inside the reactor was in the range of 0 to 100 mV. An increase of conductivity on day 100 was because of low oxygen supply caused by wrong DO sensor signal. Low oxygen supply led to a peak of pH in the system and high ammonium concentration. But the system recovered after several days after increasing DO concentration. Influent flow was less than the set value on day 158 to day 160 due to a blocked pipe so the conductivity value was dropped down to 7 mS/cm. Redox potential inside reactor increased during that period due to relatively high DO concentration and conductivity decreased.
Example of on-line physical parameters measurement in intermittent aeration and continuous aeration in pilot scale study is presented in paper II.
Comparison of the physical parameter cycle measurements from both laboratory and pilot scale study showed that, a similar result was obtained with DO concentration and redox potential value. However, conductivity values presented different pattern in pilot scale and laboratory scale study. The conductivity value increased during the non-aerated phase in pilot scale study while it decreased in the laboratory scale study. The reason was because of continuous influent was supplied in the pilot scale study. Ammonium concentration rose slightly during the non-aerated phase in non-aerated phase in pilot scale study. There was no addition of substrate during the laboratory scale batch test.
Jingjing Yang TRITA LWR LIC 2065
16
5.1.2. Assessment of nitrogen conversion
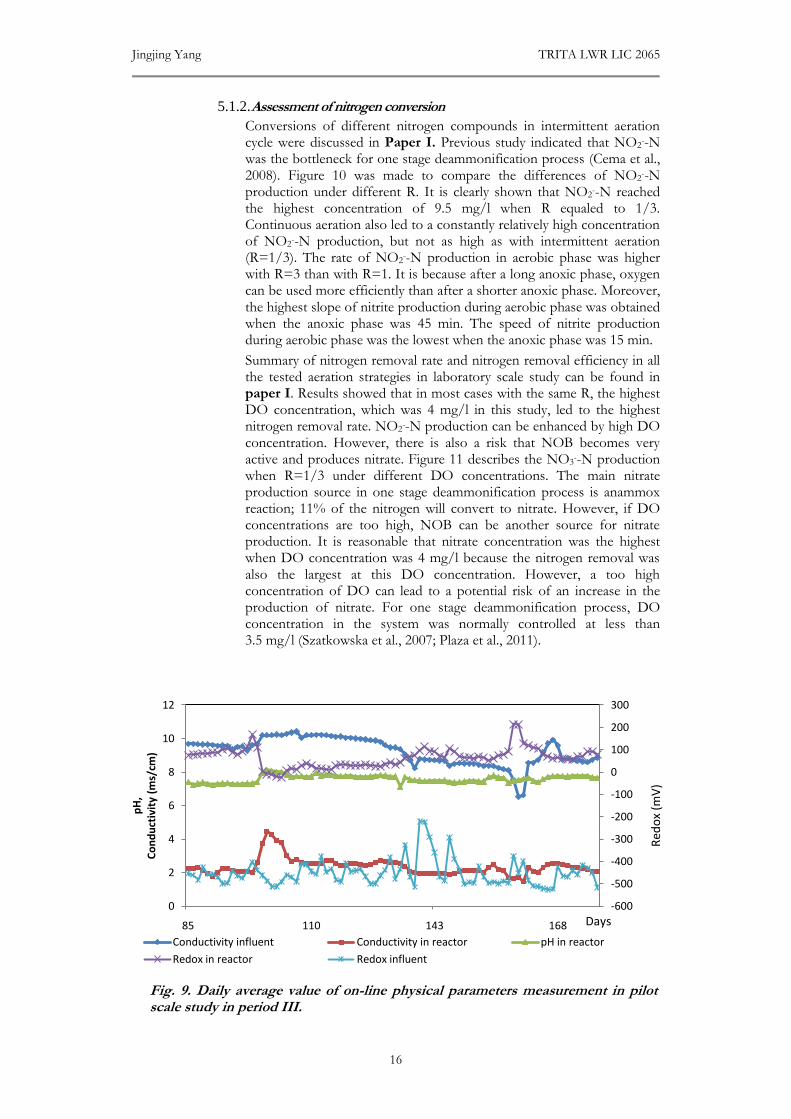
Conversions of different nitrogen compounds in intermittent aeration cycle were discussed in Paper I. Previous study indicated that NO2
--N was the bottleneck for one stage deammonification process (Cema et al., 2008). Figure 10 was made to compare the differences of NO2
--N production under different R. It is clearly shown that NO2
--N reached the highest concentration of 9.5 mg/l when R equaled to 1/3. Continuous aeration also led to a constantly relatively high concentration of NO2
--N production, but not as high as with intermittent aeration (R=1/3). The rate of NO2
--N production in aerobic phase was higher with R=3 than with R=1. It is because after a long anoxic phase, oxygen can be used more efficiently than after a shorter anoxic phase. Moreover, the highest slope of nitrite production during aerobic phase was obtained when the anoxic phase was 45 min. The speed of nitrite production during aerobic phase was the lowest when the anoxic phase was 15 min.
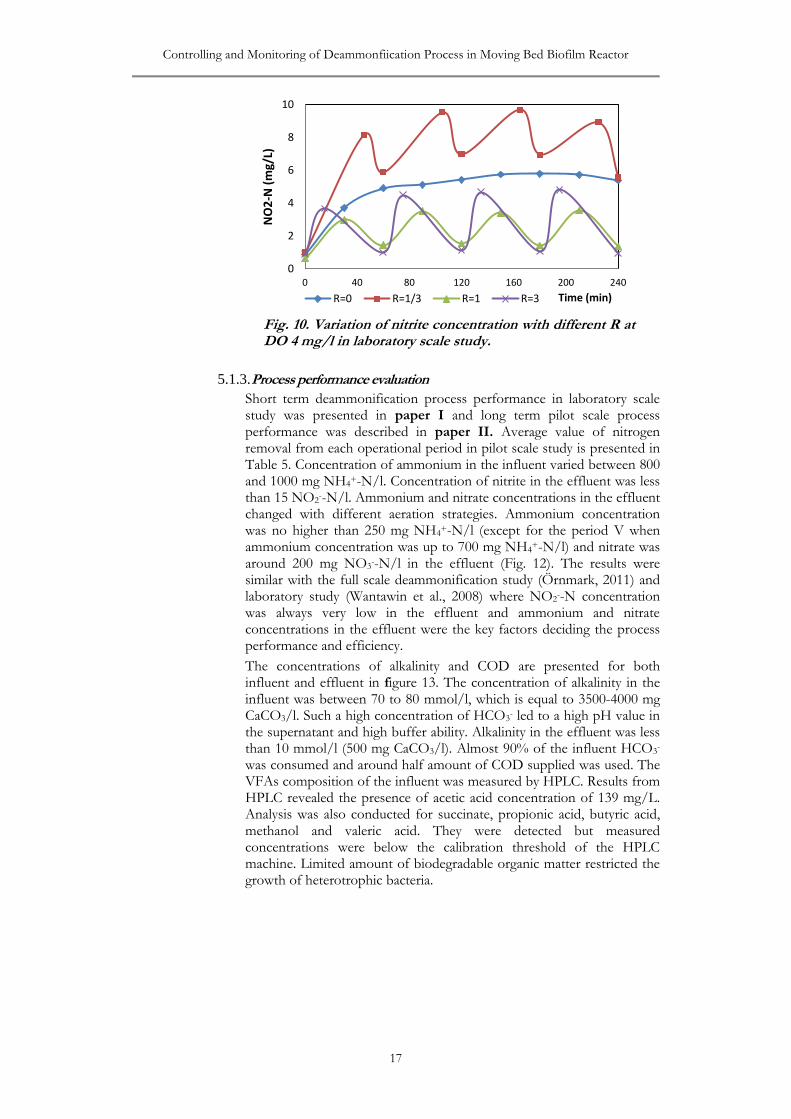
Summary of nitrogen removal rate and nitrogen removal efficiency in all the tested aeration strategies in laboratory scale study can be found in paper I. Results showed that in most cases with the same R, the highest DO concentration, which was 4 mg/l in this study, led to the highest nitrogen removal rate. NO2
--N production can be enhanced by high DO concentration. However, there is also a risk that NOB becomes very active and produces nitrate. Figure 11 describes the NO3
--N production when R=1/3 under different DO concentrations. The main nitrate production source in one stage deammonification process is anammox reaction; 11% of the nitrogen will convert to nitrate. However, if DO concentrations are too high, NOB can be another source for nitrate production. It is reasonable that nitrate concentration was the highest when DO concentration was 4 mg/l because the nitrogen removal was also the largest at this DO concentration. However, a too high concentration of DO can lead to a potential risk of an increase in the production of nitrate. For one stage deammonification process, DO concentration in the system was normally controlled at less than 3.5 mg/l (Szatkowska et al., 2007; Plaza et al., 2011).
Fig. 9. Daily average value of on-line physical parameters measurement in pilot scale study in period III.
-600
-500
-400
-300
-200
-100
0
100
200
300
0
2
4
6
8
10
12
85 110 143 168
Red
ox
(mV
)
pH
, C
on
du
ctiv
ity
(ms/
cm)
Days
Conductivity influent Conductivity in reactor pH in reactor
Redox in reactor Redox influent
Controlling and Monitoring of Deammonfiication Process in Moving Bed Biofilm Reactor
17
5.1.3. Process performance evaluation
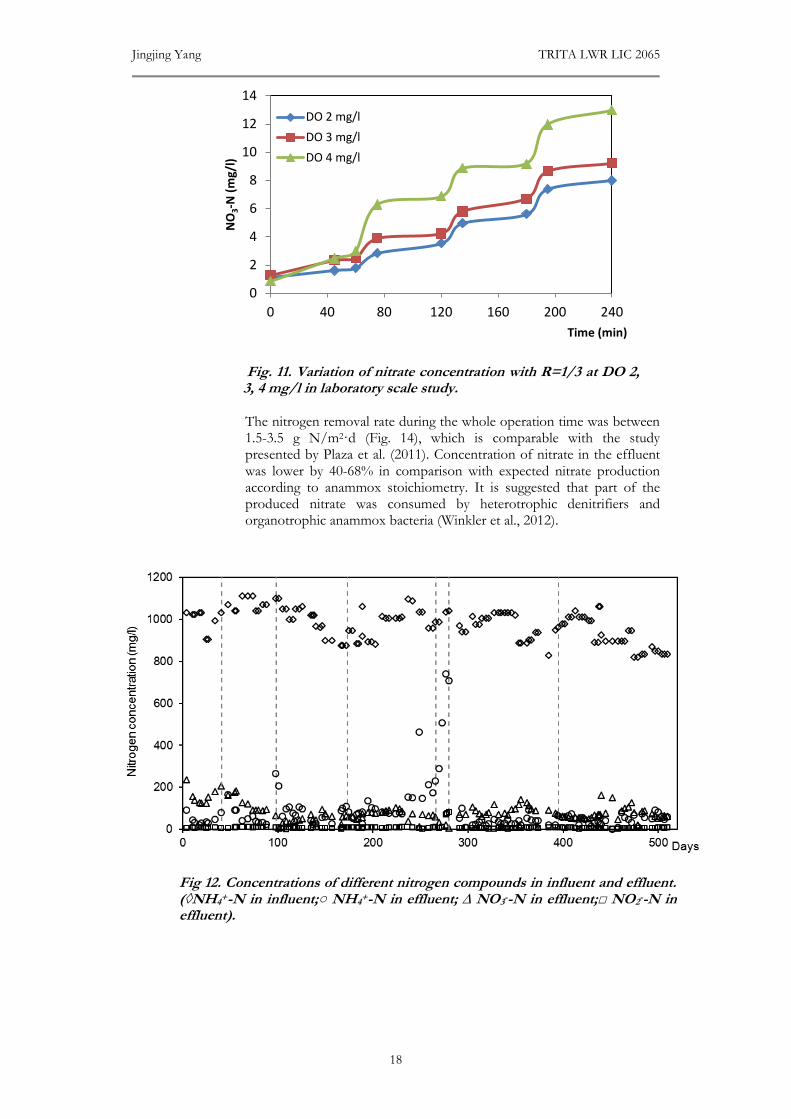
Short term deammonification process performance in laboratory scale study was presented in paper I and long term pilot scale process performance was described in paper II. Average value of nitrogen removal from each operational period in pilot scale study is presented in Table 5. Concentration of ammonium in the influent varied between 800 and 1000 mg NH4
+-N/l. Concentration of nitrite in the effluent was less than 15 NO2
--N/l. Ammonium and nitrate concentrations in the effluent changed with different aeration strategies. Ammonium concentration was no higher than 250 mg NH4
+-N/l (except for the period V when ammonium concentration was up to 700 mg NH4
+-N/l) and nitrate was around 200 mg NO3
--N/l in the effluent (Fig. 12). The results were similar with the full scale deammonification study (Örnmark, 2011) and laboratory study (Wantawin et al., 2008) where NO2
--N concentration was always very low in the effluent and ammonium and nitrate concentrations in the effluent were the key factors deciding the process performance and efficiency.
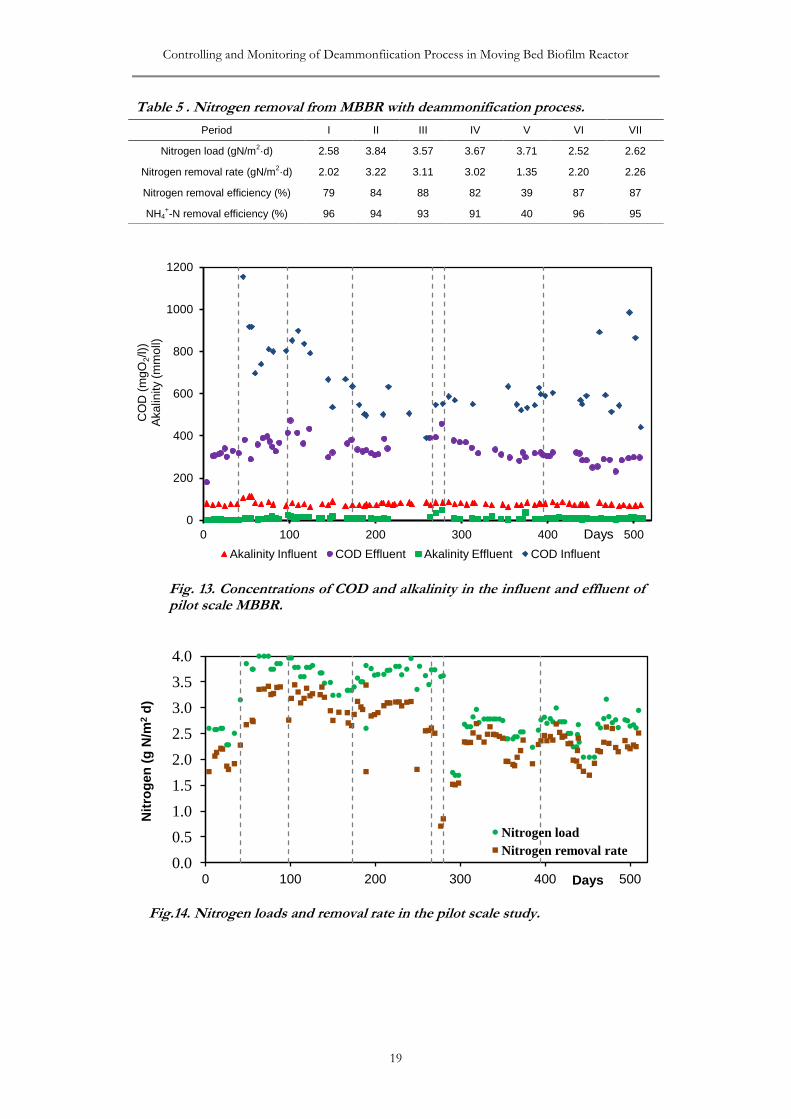
The concentrations of alkalinity and COD are presented for both influent and effluent in figure 13. The concentration of alkalinity in the influent was between 70 to 80 mmol/l, which is equal to 3500-4000 mg CaCO3/l. Such a high concentration of HCO3
- led to a high pH value in the supernatant and high buffer ability. Alkalinity in the effluent was less than 10 mmol/l (500 mg CaCO3/l). Almost 90% of the influent HCO3
- was consumed and around half amount of COD supplied was used. The VFAs composition of the influent was measured by HPLC. Results from HPLC revealed the presence of acetic acid concentration of 139 mg/L. Analysis was also conducted for succinate, propionic acid, butyric acid, methanol and valeric acid. They were detected but measured concentrations were below the calibration threshold of the HPLC machine. Limited amount of biodegradable organic matter restricted the growth of heterotrophic bacteria.
Fig. 10. Variation of nitrite concentration with different R at DO 4 mg/l in laboratory scale study.
0
2
4
6
8
10
0 40 80 120 160 200 240
NO
2-N
(m
g/L)
Time (min) R=0 R=1/3 R=1 R=3
Jingjing Yang TRITA LWR LIC 2065
18
The nitrogen removal rate during the whole operation time was between 1.5-3.5 g N/m2·d (Fig. 14), which is comparable with the study presented by Plaza et al. (2011). Concentration of nitrate in the effluent was lower by 40-68% in comparison with expected nitrate production according to anammox stoichiometry. It is suggested that part of the produced nitrate was consumed by heterotrophic denitrifiers and organotrophic anammox bacteria (Winkler et al., 2012).
Fig 12. Concentrations of different nitrogen compounds in influent and effluent. (◊NH4
+-N in influent;○ NH4+-N in effluent; ∆ NO3
--N in effluent;□ NO2--N in
effluent).
Fig. 11. Variation of nitrate concentration with R=1/3 at DO 2, 3, 4 mg/l in laboratory scale study.
0
2
4
6
8
10
12
14
0 40 80 120 160 200 240
NO
3-N
(m
g/l)
Time (min)
DO 2 mg/l
DO 3 mg/l
DO 4 mg/l
Controlling and Monitoring of Deammonfiication Process in Moving Bed Biofilm Reactor
19
Table 5 . Nitrogen removal from MBBR with deammonification process.
Period I II III IV V VI VII
Nitrogen load (gN/m2·d) 2.58 3.84 3.57 3.67 3.71 2.52 2.62
Nitrogen removal rate (gN/m2·d) 2.02 3.22 3.11 3.02 1.35 2.20 2.26
Nitrogen removal efficiency (%) 79 84 88 82 39 87 87
NH4+-N removal efficiency (%) 96 94 93 91 40 96 95
Fig. 13. Concentrations of COD and alkalinity in the influent and effluent of pilot scale MBBR.
0.0
0.5
1.0
1.5
2.0
2.5
3.0
3.5
4.0
0 100 200 300 400 500
Nit
rog
en
(g
N/m
2 d
)
Days
Nitrogen load
Nitrogen removal rate
Fig.14. Nitrogen loads and removal rate in the pilot scale study.
0
200
400
600
800
1000
1200
0 100 200 300 400 500
CO
D (
mg
O2/l))
A
ka
linity (
mm
oll)
Days
Akalinity Influent COD Effluent Akalinity Effluent COD Influent
Jingjing Yang TRITA LWR LIC 2065
20
5.2. Identification and activity of microorganisms
5.2.1. Bacterial identification by FISH tests
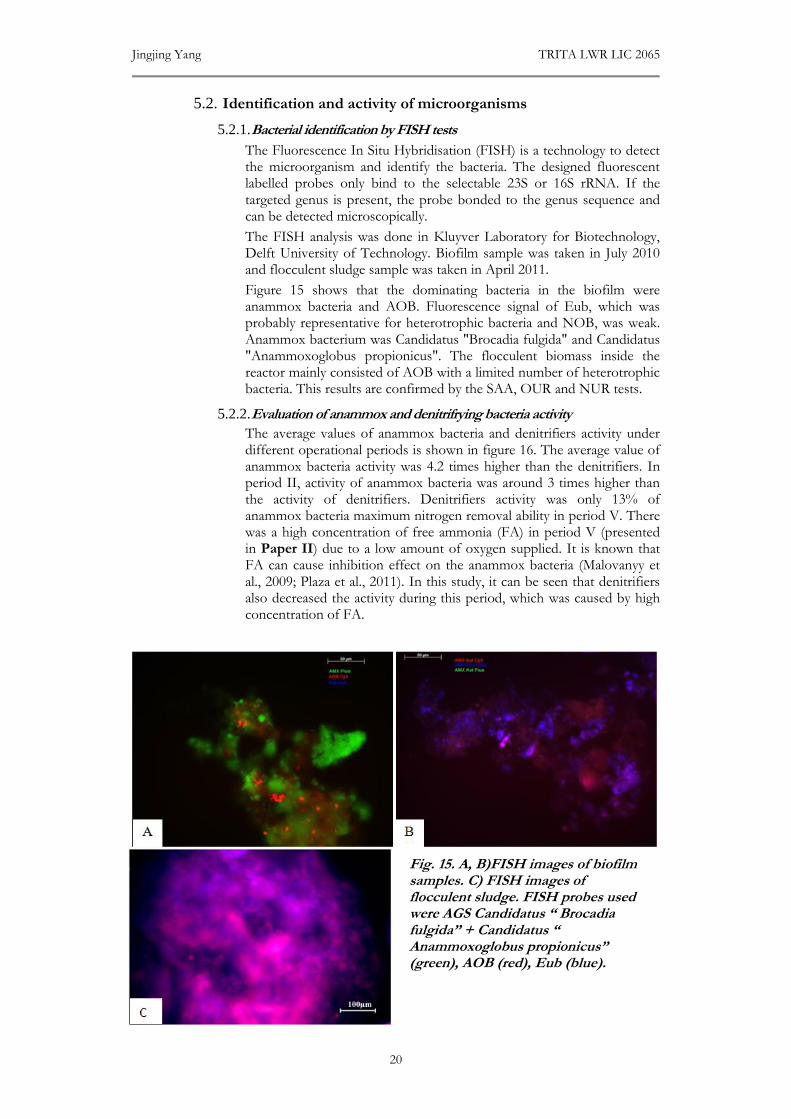
The Fluorescence In Situ Hybridisation (FISH) is a technology to detect the microorganism and identify the bacteria. The designed fluorescent labelled probes only bind to the selectable 23S or 16S rRNA. If the targeted genus is present, the probe bonded to the genus sequence and can be detected microscopically.
The FISH analysis was done in Kluyver Laboratory for Biotechnology, Delft University of Technology. Biofilm sample was taken in July 2010 and flocculent sludge sample was taken in April 2011.
Figure 15 shows that the dominating bacteria in the biofilm were anammox bacteria and AOB. Fluorescence signal of Eub, which was probably representative for heterotrophic bacteria and NOB, was weak. Anammox bacterium was Candidatus "Brocadia fulgida" and Candidatus "Anammoxoglobus propionicus". The flocculent biomass inside the reactor mainly consisted of AOB with a limited number of heterotrophic bacteria. This results are confirmed by the SAA, OUR and NUR tests.
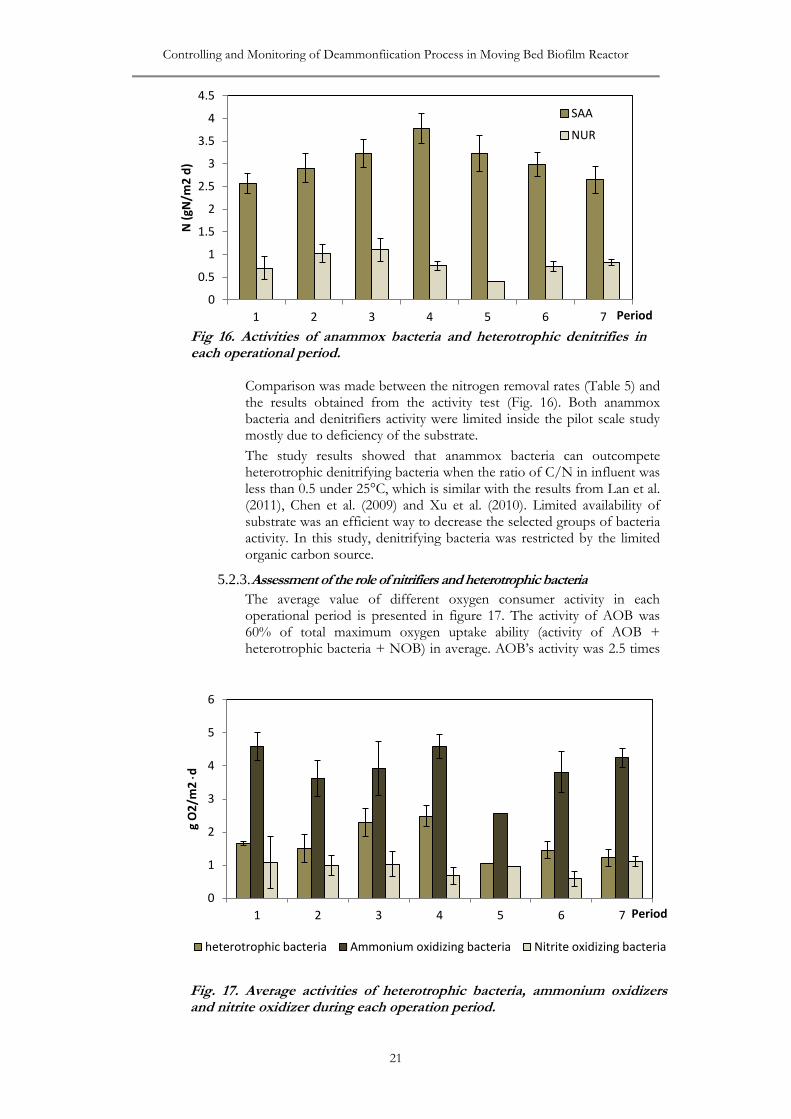
5.2.2. Evaluation of anammox and denitrifrying bacteria activity
The average values of anammox bacteria and denitrifiers activity under different operational periods is shown in figure 16. The average value of anammox bacteria activity was 4.2 times higher than the denitrifiers. In period II, activity of anammox bacteria was around 3 times higher than the activity of denitrifiers. Denitrifiers activity was only 13% of anammox bacteria maximum nitrogen removal ability in period V. There was a high concentration of free ammonia (FA) in period V (presented in Paper II) due to a low amount of oxygen supplied. It is known that FA can cause inhibition effect on the anammox bacteria (Malovanyy et al., 2009; Plaza et al., 2011). In this study, it can be seen that denitrifiers also decreased the activity during this period, which was caused by high concentration of FA.
Fig. 15. A, B)FISH images of biofilm samples. C) FISH images of flocculent sludge. FISH probes used were AGS Candidatus “ Brocadia fulgida” + Candidatus “ Anammoxoglobus propionicus” (green), AOB (red), Eub (blue).
Controlling and Monitoring of Deammonfiication Process in Moving Bed Biofilm Reactor
21
Comparison was made between the nitrogen removal rates (Table 5) and the results obtained from the activity test (Fig. 16). Both anammox bacteria and denitrifiers activity were limited inside the pilot scale study mostly due to deficiency of the substrate.
The study results showed that anammox bacteria can outcompete heterotrophic denitrifying bacteria when the ratio of C/N in influent was less than 0.5 under 25°C, which is similar with the results from Lan et al. (2011), Chen et al. (2009) and Xu et al. (2010). Limited availability of substrate was an efficient way to decrease the selected groups of bacteria activity. In this study, denitrifying bacteria was restricted by the limited organic carbon source.
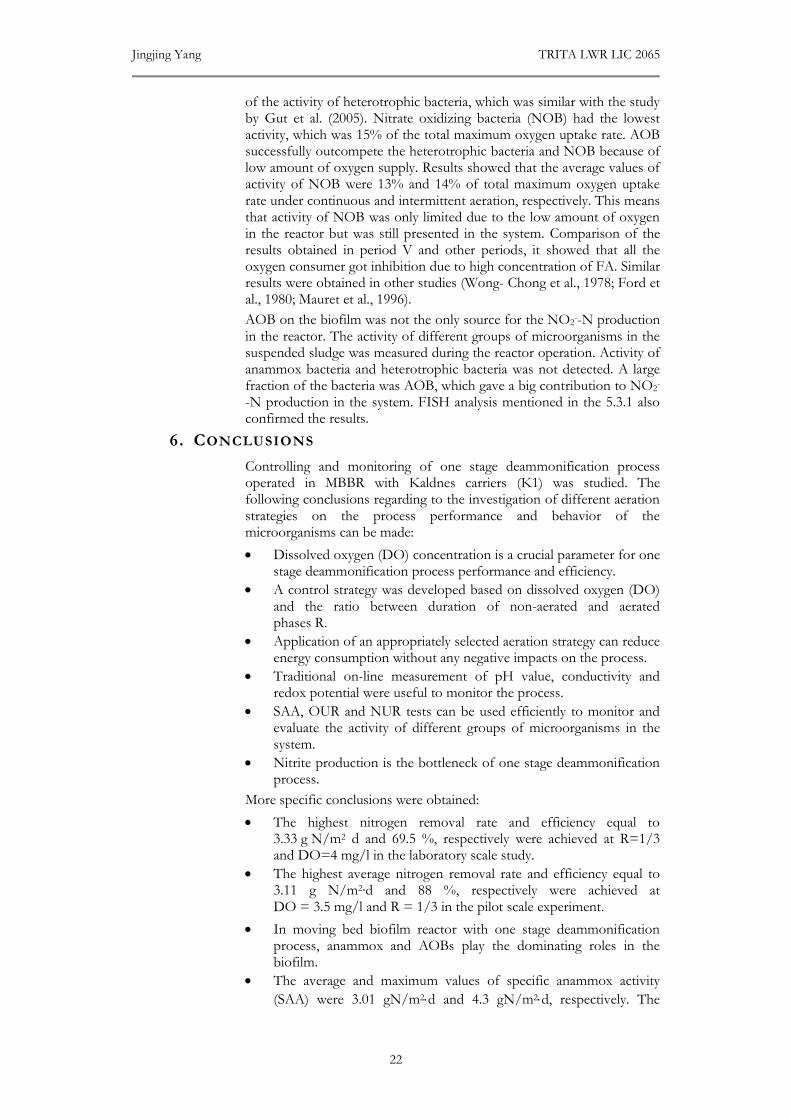
5.2.3. Assessment of the role of nitrifiers and heterotrophic bacteria
The average value of different oxygen consumer activity in each operational period is presented in figure 17. The activity of AOB was 60% of total maximum oxygen uptake ability (activity of AOB + heterotrophic bacteria + NOB) in average. AOB’s activity was 2.5 times
0
0.5
1
1.5
2
2.5
3
3.5
4
4.5
1 2 3 4 5 6 7
N (
gN/m
2 d
)
Period
SAA
NUR
Fig 16. Activities of anammox bacteria and heterotrophic denitrifies in each operational period.
Fig. 17. Average activities of heterotrophic bacteria, ammonium oxidizers and nitrite oxidizer during each operation period.
0
1
2
3
4
5
6
1 2 3 4 5 6 7
g O
2/m
2
d
Period
heterotrophic bacteria Ammonium oxidizing bacteria Nitrite oxidizing bacteria
Jingjing Yang TRITA LWR LIC 2065
22
of the activity of heterotrophic bacteria, which was similar with the study by Gut et al. (2005). Nitrate oxidizing bacteria (NOB) had the lowest activity, which was 15% of the total maximum oxygen uptake rate. AOB successfully outcompete the heterotrophic bacteria and NOB because of low amount of oxygen supply. Results showed that the average values of activity of NOB were 13% and 14% of total maximum oxygen uptake rate under continuous and intermittent aeration, respectively. This means that activity of NOB was only limited due to the low amount of oxygen in the reactor but was still presented in the system. Comparison of the results obtained in period V and other periods, it showed that all the oxygen consumer got inhibition due to high concentration of FA. Similar results were obtained in other studies (Wong- Chong et al., 1978; Ford et al., 1980; Mauret et al., 1996).
AOB on the biofilm was not the only source for the NO2--N production
in the reactor. The activity of different groups of microorganisms in the suspended sludge was measured during the reactor operation. Activity of anammox bacteria and heterotrophic bacteria was not detected. A large fraction of the bacteria was AOB, which gave a big contribution to NO2
-
-N production in the system. FISH analysis mentioned in the 5.3.1 also confirmed the results.
6. CONCLUSIONS
Controlling and monitoring of one stage deammonification process operated in MBBR with Kaldnes carriers (K1) was studied. The following conclusions regarding to the investigation of different aeration strategies on the process performance and behavior of the microorganisms can be made:
Dissolved oxygen (DO) concentration is a crucial parameter for one stage deammonification process performance and efficiency.
A control strategy was developed based on dissolved oxygen (DO) and the ratio between duration of non-aerated and aerated phases R.
Application of an appropriately selected aeration strategy can reduce energy consumption without any negative impacts on the process.
Traditional on-line measurement of pH value, conductivity and redox potential were useful to monitor the process.
SAA, OUR and NUR tests can be used efficiently to monitor and evaluate the activity of different groups of microorganisms in the system.
Nitrite production is the bottleneck of one stage deammonification process.
More specific conclusions were obtained:
The highest nitrogen removal rate and efficiency equal to 3.33 g N/m2 d and 69.5 %, respectively were achieved at R=1/3 and DO=4 mg/l in the laboratory scale study.
The highest average nitrogen removal rate and efficiency equal to 3.11 g N/m2∙d and 88 %, respectively were achieved at DO = 3.5 mg/l and R = 1/3 in the pilot scale experiment.
In moving bed biofilm reactor with one stage deammonification process, anammox and AOBs play the dominating roles in the biofilm.
The average and maximum values of specific anammox activity
(SAA) were 3.01 gN/m2d and 4.3 gN/m2d, respectively. The
Controlling and Monitoring of Deammonfiication Process in Moving Bed Biofilm Reactor
23
Oxygen uptake rate for AOBs was 4.0 gO2/m2d as the average
value and with a maximum value of 5.1 gO2/m2d.
Heterotrophic bacteria activity was low because only a limited amount of biodegradable organic carbon was available.
Introduction of anaerobic phases and high nitrogen load could enhance the activity of anammox bacteria.
Oxygen concentration in the bulk liquid in the reactor influenced the activity of AOB. It is possible to limit the NOB activity in deammonification process with providing interval anaerobic phases.
7. FURTHER RESEARCH WORK
Based on the performed studies, following research is recommended:
To evaluate the evolution of bacteria behaviour under different temperatures (from 25°C to 16°C). Up to now, most studies have been treating reject water by deammonification process under high nitrogen load and high temperature (above 25°C) (Szatkowska et al., 2007). Study results showed that the deammonification process could achieve a high nitrogen removal rate at temperatures above 25°C. However, there are very few studies about deammonification process at low temperature.
To investigate the possibility using redox as a controlling parameter for deammonification process. Several research groups have developed deammonification operation strategies: a pH based aeration control by Wett (2007) and strategy depended on online measurements of ammonium, nitrate and oxygen (Joss et al., 2009). However, all these systems do not get rid of the unexpected disturbances which could seriously affect the process. Redox control has been widely used in nitrification / denitrification process and it is considered as a more reliable parameter for process control compared to pH or DO due to it provides more information of the system. The potential of using redox as controlling parameter for deammonification process has not been investigated.
To minimize N2O emission from deammonification process by different aeration strategies. Deammonification is considered to release less N2O compared with the tradition nitrification / denitrification process. Anammox reaction does not produce N2O (Chandran, 2010). The source of N2O production in deammonification process is mainly partial nitrification. A wise aeration strategy can reduce the N2O production in partial nitritation step.
Optimization of the deammonification process operation is based on the understanding of relation between on-line measurements and concentrations of different compounds. Multivariate data analysis is a good tool to find the relation and optimize the process operation.
8. REFERENCES
Ahn, Y. H., Hwang, I. S., Min, K. S. (2004). ANAMMOX and partial denitrification in anaerobic nitrogen removal from piggery waste. Water Science & Technology, 49 (5-6), 145-153.
Anthonisen, A. C., Loehr, R. C., Prakasam, T. B. S., Srinath, E. G. (1976). Inhibition of nitrification by ammonia and nitrous acid. J. WPCF, 48 (5), 835-852.
Jingjing Yang TRITA LWR LIC 2065
24
Bagchi, S., Biswas, R., Nandy, T. (2010). Alkalinity and dissolved oxygen as controlling parameters for ammonia removal through partial nitritation and anammox in a single stage bioreactor. J. of Industrial Microbiology and Biotechnology, 37, 871-876.
Baltic Sea Action Plan. (2007). Proceeding of HELCOM Ministerial Meeting. Krakow, Poland, 15th November 2007.
Bernet, N., Habouzit, F., Moletta, R. (1996).Use of an industrial effluent as a carbon source for denitrification of a high-strength wastewater. Appl. Microbiol. Biotechnol., 46, 92-97.
Broda, E. (1977). Two kinds of lithotrophs missing in nature. Zeitschrift für Allgemeine Mikrobiologie, 17 (6), 63-70.
Cema, G., Wiszniowski, J., Zabczynski, S., Zablocka-Godlewska, E., Raszka, A., Surmacz-Gуorska, J. (2007). Biological nitrogen removal from landfill leachate by deammonification assisted by heterotrophic denitrification in a rotating biological contactor (RBC). Water Science & Technology, 55 (8-9), 35–41.
Cema, G., Plaza, E., Trela, J., Surmacz- Gorska, J. (2008). Dissolved oxygen as a factor influencing nitrogen removal rates in a one-stage system with partial nitritation and Anammox process. In: Proceeding of the IWA biofilm technologies conference, Singapore.
Chen, H. H., Liu, S. T., Yang, F. L., Xue, Y., Wang, T. (2009). The development of simultaneous partial nitrification, ANAMMOX and denitrification (SNAD) process in a single reactor for nitrogen removal. Bioresource Technol., 100, 1548-1554.
Claire, H.-D., Adam, C. M. (2007).News about nitrogen. Science, 320, 757-758.
Collins, C. E., Incropera, F. P. (1978). The effect of temperature control on biological wastewater treatment processes. Water Research, 12, 547-554.
Dalsgaard, T., Thamdrup, B. (2002). Factors controlling anaerobic ammonium oxidation with nitrite in marine sediments. Applied and Environmental Microbiology, 68 (8), 3802-3808.
Dalsgaard, T., Canfield, D. E., Petersen, J., Thamdrup, B., Acuna Gonzalez, J. (2003). N2 production by the anammox reaction in the anoxic water column of Golfo Dulce, Costa Rica. Nature, 422, 606-608.
Dalsgaard, T., Thamdrup, B., Canfield, D. E. (2005).Anaerobic ammonium oxidation (anammox) in the marine environment. Research in Microbiology, 156 (4), 457-464.
Dapena-Mora, A., Fernandez, I., Campos, J. L., Mosquera-Corral, A., Mendez, R., Jetten, M. S. M. (2007).Evaluation of activity and inhibition effects on Anammox process by batch tests based on the nitrogen gas production. Enzyme and Microbial Technology, 40, 859-865.
de Graaff, M. S., Zeeman, G., Temmink, H., van Loosdrecht, M. C. M. (2010). Long term partial nitritation of anaerobically treated black water and the emission of nitrous oxide. Water Research, 44, 2171-2178.
Dosta, J., Fernandez, I., Vazquez-Padin, J. R., Mosquera-Corral, A., Campos, J. L., Mata-Alvarez, J., Mendez, R. (2008). Short- and long-term effects of temperature on the Anammox process. J. of Hazardous Materials, 154, 688-693.
Controlling and Monitoring of Deammonfiication Process in Moving Bed Biofilm Reactor
25
Egli, K., Fanger, U., Alvarez, P., Siegrist, H., van derMeer, J., Zehnder, A. (2001). Enrichment and characterization of an anammox bacterium from a rotating biological contactor treating ammonium-rich leachate. Archives of Microbiology, 175, 198-207.
Engström, P., Dalsgaard, T., Hulth, S., Aller, R. C. (2005). Anaerobic ammonium oxidation by nitrite (anammox): Implications for N-2 production in coastal marine sediments. Geochimicaet Cosmochimica Acta, 69 (8), 2057-2065.
Estrada, V. E. E., Hernandez, D. E. A. (2002). Treatment of piggery wastes in waste stabilization ponds. Water Science & Technology, 45 (1), 55–60.
Fernandez I., Vazquez-Padin J.R., Mosquera-Corral A., Campos J.L. Mendez R. (2008). Biofilm and granular systems to improve Anammox biomass retention. Biochemical Engineering J., 42, 308-313.
Ford, D. L., Churchwell, R. L., Kachtick, J. W. (1980). Comprehensive analysis of nitrication of chemical processing wastewater. J. WPCF, 52 (11), 2726-2746.
Gao, C., Zhu, J.G., Dou, Y. J. (2002). Contribution of agricultural non-point source pollution to water quality deterioration in Tai lake watershed: recent trends and research priorities. Resources and Environment in the Yangtze Basin, 11 (3), 260–263.
Gebhardt, S., Walter, S., Nausch, G., Bange, H. W. (2004). Hydroxylamine (NH2OH) in the Baltic Sea. Biogeosciences Discussions, 1, 709-724.
Grunditz, C., Dalhammar, G. (2000). Development of nitrification inhibition assays using pure cultures of nitrosomonas and nitrobacter. Water Research, 35 (2), 433-440.
Gut, G., E. Plaza, and B. Hultman. (2005). Oxygen Uptake Rate (OUR) tests for assessment of nitrifying activities in the deammonification system. In: Integration and optimisation of urban sanitation system: Joint Polish-Swedish Reports, No 12. Royal Institute of Technology, Stockholm, 2005, TRITA-AMI.REPORT.
Guven, D., Dapena, A., Kartal, B., Schmid, M. C., Maas, B., van de Pas-Schoonen, K., Sozen, S., Mendez, R., Op den Camp, H. J. M., Jetten, M. S. M., Strous, M., Schmidt, I. (2005). Propionate oxidation by and methanol inhibition of anaerobic ammonium oxidizing bacteria. Applied and Environmental Microbiology, 71, 1066-1071.
Hanaki, K., Wantawin, C., Ohgaki, S. (1990). Nitrification at low levels of dissolved oxygen with and without organic loading in a suspended growth reactor. Water Research, 24 (3), 297-302.
Hao, X., Heijnen, J. J., van Loosdrecht, M. C. M. (2002). Model based evaluation of temperature and inflow variations on a partial nitrification-ANAMMOX biofilm process. Water Research, 36, 4839-4849.
Hellinga, C., Schellen, A., Mulder, J. W. van Loosdrecht, M. C. M., Heijnen, J. J. (1998). The SHARON process: an innovative method for nitrogen removal from ammonium-rich wastewater. Water Science & Technology, 37, 135–142.
Hippen, A, Helmer, C, Kunst, S, Rosenwinkel, K. H., Seyfried C.F., (2001). Six years’ practical experience with aerobic/anoxic deammonification in biofilm systems. Water Science & Technology, 44, 39–48.
Jingjing Yang TRITA LWR LIC 2065
26
Ho, G., Kuruvilla, M., Roars, A., Gibbs, O. (1992). Nitrogen and phosphorus removal from sewage effluent in amended sand columns. Water Research, 26 (3), 295-300.
Hyungseok, Y., Kyu-Hong, A., Kwang-Hwan, L., Youn-Ung, K., Kyung-Guen, S. (1999). Nitrogen removal from synthetic wastewater by simultaneous nitrification and denitrification (SND) via nitrite in an intermittently aerated reactor. Water Research, 33, 145-154.
Isaka, K., Sumino, T., Tsuneda, S. (2007). High nitrogen removal performance at moderately low temperature utilizing anaerobic ammonium oxidation reactions. J. of Bioscience and bioengineering, 103 (5), 486-490.
Isaka, K., Suwa, Y. Kimura, Y., Yamagishi, Y., Sumino, T., Tsuneda, S. (2008). Anaerobic ammonium oxidation irreversibly inhibited by methanol. Biotechnology, 81, 379-385.
Jetten, M., Strous, M., van de Pas-Schoonen, K. T., Schalk, J., van Dongen, U., van de Graaf, A., Logemann, S., Muyzer, G., van Loosdrecht, M. (1999). The anaerobic oxidation of ammonium. FEMS Microbiology reviews, 22, 421-437.
Jin, X. L, Gao, J. F, Zhao, G. J. (2006). Impacts of 20-year socio-economic development on the trend of aquatic environment of the Taihu basin. Resources and Environment in the Yangtze Basin, 15 (3), 298–302.
Joss, A., Salzgeber, D., Eugster, J., Konig, R., Rottermann, K., Burger, S., Fabijan, P., Leumann, S., Mohn, J., Siegrist, H. (2009). Full-scale nitrogen removal from digester liquid with partial nitritation and anammox in one SBR. Environmental Science and Technology, 43 (14), 5301–5306.
Kartal, B., Kuypers, M., Lavik, G., Schalk, J., den Camp, H., Jetten, M. S. M., Strous, M. (2007a). Anammox bacteria disguised as denitrifiers: nitrate reduction to dinitrogen gas via nitrite and ammonium: Environ. Microbiol., 9, 635-642.
Kartal, B., Rattray, J., van Niftrik, L. A., van de Vossenberg, J., Schmid, M. C., Webb, R. I., Schouten, S., Fuerst, J. A., Damste, J. S. S., Jetten, M. S. M., Strous, M. (2007b). Candidatus "Anammoxoglobus propionicus" a new propionate oxidizing species of anaerobic ammonium oxidizing bacteria. Syst. Appl. Microbiol., 30, 39-49.
Kartal, B., van Niftrik, L., Rattray, J., de Vossenberg, J., Schmid, M. C., Damste, J. S. S., Jetten, M. S. M., Strous, M. (2008). Candidatus 'Brocadia fulgida': an autofluorescent anaerobic ammonium oxidizing bacterium. FEMS Microbiol. Ecol., 63, 46-55.
Kuypers, M. M. M., Slikers, A. O., Lavik, G., Schmid, M., Jorgensen, B. B., Kuenen, J. G., Simminghe Damste, J. S., Strous, M., Jetten, M. S. M. (2003). Anaerobic ammonium oxidation by anammox bacteria in the Black Sea. Nature, 422, 608-611.
Lackner, S., Horn, H. (2011). Evaluating operation strategies and process stability of a single stage nitritation-anammox SBR by use of the oxidation- reduction potential (ORP). Bioresource Technology. In press
Lan, C. J., Kumar, M., Wang, C. C., Lin, J. G. (2011). Development of simultaneous partial nitrification, anammox and denitrification (SNAD) process in a sequential batch reactor: Bioresource Technol., 102, 5514-5519.
Controlling and Monitoring of Deammonfiication Process in Moving Bed Biofilm Reactor
27
Le, C., Zha, Y., Li, Y., Sun, D., Lu, H., Yin, B. (2010). Eutrophication of lake waters in China. Cost, Causes and Control. Environmental Management. 45, 662-668.
Liang, Z., Han, Z., Yang, S., Liang, X., Du, P., Liu, G., Yang, Y. (2011). A control strategy of partial nitritation in a fixed bed biofilm reactor. Bioresource Technology, 102 (2), 710-715.
Ma, B., Zhang, S., Zhang, L., Yi, P., Wang, J., Wang, S., Peng, Y. (2011).The feasibility of using a two-stage autotrophic nitrogen removal process to treat sewage. Bioresource Technology, 102, 8331–8334.
Malovanyy, A., Plaza, E., Trela J. (2009). Evaluation of the factors influencing the specific Anammox activity using surface modeling. In: Research and application of new technologies in wastewater treatment and municipal solid waste disposal in Ukraine, Sweden and Poland, Joint Polish-Swedish Reports, No. 16. TRITA-LWR.REPORT 3026, Stockholm, Sept. 23-25, Sweden.35-45.
Martinez, E. (2007). Extremum-seeking control of redox processes in wastewater chemical treatment plants. 17th European Symposium on Computer Aided Process Engineering-ESCAPE 17.
Mauret, M., Paul, E., Puech-Costes, E., Maurette, M. T., Baptiste P. (1996). Application of experimental research methodology to the study of nitrification in mixed culture. Water Science & Technology, 34 (1-2), 245-252.
Mulder, A., van de Graaf, A. A., Robertson, L. A., Kuenen, J. G. (1995). Anaerobic ammonium oxidation discovered in a denitrifying fluidized-bed reactor. FEMS Microbiology Ecology, 16 (3), 177-183.
OECD (1982). Eutrophication of waters: monitoring, assessment and control. Final Report. OECD Cooperative Program on Monitoring of Inland Waters (Eutrophication Control, Environment Directorate), OECD, Paris
Parkes, S. D., Jolley, D. F., Wilson, S. R. (2007). Inorganic nitrogen transformations in the treatment of landfill leachate with a high ammonium load: A case study. Environmental Monitoring and Assessment, 124, 51-61.
Plaza, E., Stridh, S., Örnmark, J., Kanders, L., Trela, J. (2011). Swedish experience of the deammonification process in a biofilm system. Proc. of the IWA Specialized conference “Nutrient recovery and management 2011”. 9-12 January 2011, Miami, Florida, USA, 1333-1345.
Rosenwinkel K-H., Cornelius A., Thöle, D. (2005). Full-scale application of the deammonification process for treatment of sludge water. In: Proceeding of the IWA Specialized conference: Nutrient Management in Wastewater Treatment, Processes and Recycle Streams, 19 – 21 September 2005, Krakow, Poland, 483 – 491.
Rysgaard, S. (2004). Denitrification and anammox activity in arctic marine sediments. Limnology and Oceanology, 49 (5), 1493-1502.
Schalk, J., Oustad, H., Kuenen, J. G., Jetten, M. S. M. (1998). The anaerobic oxidation of hydrazine: a novel reaction in microbial nitrogen metabolism. FEMS Microbiol. Lett., 158 (1), 61-67.
Schalk, J., De Vries, S., Kuenen, J. G., Jetten, M. S. M. (2000). Involvement of a novel hydroxylamine oxidoreductase in anaerobic ammonium oxidation. Biochemistry, 39 (18), 5405-5412.
Seyfried, C. F., Rosenwinkel, K. H., Hippen, A. (2002). Deammonification: a cost-effective treatment process for nitrogen-rich wastewaters. WEFTEC 2002 Proceedings 75th Annual Conference and
Jingjing Yang TRITA LWR LIC 2065
28
Exposition.McCormick Place, Chicago, Illinois, USA, September 28-October 2, 2002.
Shimamura, M., Nishiyama, T., Shigetomo, H., Toyomoto, T., Kawahara, Y., Furukawa, K., Fujii, T. (2007). Isolation of a multiheme protein with features of a hydrazine-oxidizing enzyme from an anaerobic ammonium-oxidizing enrichment culture. Applied Environmental and Microbiology, 73 (4) 1065-1072.
Strous, M., van Gerven, E., Kuenen, J. G., Jetten, M. S. M. (1997). Effects of aerobic and microaerobic conditions on anaerobic ammonium-oxidizing (Anammox) sludge. Applied Environmental and Microbiology, 63, 2446–2448.
Strous, M., Heinen, J. J., Kuenen, J. G., Jetten, M. S. M. (1998). The sequencing batch reactor as a powerful tool for the study of slowly growing anaerobic ammonium oxidizing microorganisms. Applied Microbiology and Biotechnology, 50, 589-596.
Strous, M, Kuenen J. G., Jetten, M. (1999). Key physical parameters of anaerobic ammonium oxidation. Applied Microbiology and Biotechnology, 65, 3248–3250.
Strous, M. (2000). Microbiology of anaerobic ammonium oxidation. PhD thesis, Technical University of Delft, The Netherlands.
Surmacz-Gorska, J., Gernaey, K., Demuynck, C., Vanrolleghem, P., Verstraete, W. (1996). Nitrification monitoring in activated sludge by oxygen uptake rate (OUR) measurements. Water Research, 30, 1228-1236.
Szatkowska, B.; Plaza, E.; Trela, J.; Bosander, J.; Hultman, B. (2005). Application of conductivity measurements for monitoring of nitrogen removal in the partial nitrification /anammox process. In: Preprints of the IWA specialized conference “Nutrient management in wastewater treatment, Processes and recycle stream” Krakow, Poland, 19-21 September 2005, 717-371.
Szatkowska, B., Plaza, E. (2006). Temperature as a factor influencing the Anammox process performance. Waste and Environmental Management Series, 12, 51-58.
Szatkowska, B., Plaza, E., Trela, J., Hultman, B. and Bosander, J. (2007). Combined partial nitritation and Anammox biofilm system as a sustainable solution for supernatant treatment. Water Practice and Technology, 55 (8-9), 19-26.
Tanwar, P., Nandy, T., Ukey, P., Manekar, P. (2008). Correlating on-line monitoring parameters, pH, DO and ORP with nutrient removal in an intermittent cyclic process bioreactor system. Bioresource Technology, 99, 7630-7635.
Tang, C., Zheng, P., Wang, C., Mahmood, Q. (2010). Suppression of anaerobic ammonium oxidizers under high organic content in high-rate Anammox UASB reactor. Bioresource Technology, 101, 1762–1768.
Tokutomi, T., Shibayama, C., Soda, S., Ike, M. (2010). A novel control method for nitritation: The domination of ammonia-oxidizing bacteria by high concentrations of inorganic carbon in an airlift fluidized bed reactor. Water Research, 44, 4195-4203.
Trela, J. (2000) Intensification of biological nitrogen removal in a two-phase activated sludge process with pre-denitrification. Report No 8. TRITA-AMI REPORT 3081, ISSN 1400-1306, ISRN KTH/AMI/REPORT 3081-SE, ISBN 91-7283-020-4.
Controlling and Monitoring of Deammonfiication Process in Moving Bed Biofilm Reactor
29
Van de Graaf, A. A., De Bruijn, P., Robertson, L. A., Jetten, M. S. M., Kuenen, J. G. (1997). Metabolic pathway of anaerobic ammonium oxidation on the basis of 15N studies in a fluidized bed reactor. Microbiology, 143 (7), 2415-2421.
van Hulle, S. W. H., Vandeweyer, H. J. P., Meesschaert, B. D., Vanrolleghem, P. A., Dejans, P., Dumoulin A. (2010). Engineering aspects and practical application of autotrophic nitrogen removal from nitrogen rich streams. Chemical Engineering J., 162, 1-20.
Wantawin, C., Juateea, J., Noophan, P. L., Munakata-Marr, J. (2008). Autotrophic nitrogen removal in sequencing batch biofilm reactors at different oxygen supply modes. Water Science & Technology, 58 (10), 1889-1894.
Wett, B. (2007). Development and implementation of a robust deammonification process. Water Science & Technology, 56 (7), 81–88.
Wong-Chong, G. M., Loehr, R. C. (1978). Kinetics of microbial nitrication: nitrite and nitrogen oxidation. Water Research, 12, 605-609.
Winkler, M. K. H., Kleerebezem, R., van Loosdrecht, M. C. M. (2012). Integration of anammox into the aerobic granular sludge process for main stream wastewater treatment at ambient temperatures. Water Research, 46, 136-144.
Xu, Z.-Y., Zeng, G.-M., Yang, Z.-H., Xiao, Y., Cao, M., Sun, H.-S., Ji, L.-L., Chen, Y. (2010). Biological treatment of landfill leachate with the integration of partial nitrification, anaerobic ammonium oxidation and heterotrophic denitrification. Bioresource Technol., 101, 79-86.
Yamamoto, T., Takaki, K., Koyama, T., Furukawa, K. (2006). Novel partial nitritation treatment for anaerobic digestion liquor of swine wastewater using swim bed technology. J. of Bioscience and Bioengineering, 102 (6), 497-503.
Yang, Y., Zuo, J. E., Shen, P., Gu, X. S. (2006). Influence of temperature, pH value and organic substance on activity of ANAMMOX sludge. Huan Jing Ke Xue, 27 (4), 691–695 (in Chinese).
Yang, J., Zubrowska-Sudol, M., Trela, J., Plaza, E. (2011a). Influence of aeration conditions on nitrogen removal rate in one-stage partial nitrification/anammox process. In: Proceedings of the IWA Specialized Conference “Nutrient recovery and management 2011”, 9-12 January 2011, Miami, Florida, 1307-1320.
Yang, J., Trela, J., Plaza, E. (2011b). Activity of different groups of microorganisms in moving-bed biofilm reactor with one stage deammonification process. In: Proceedings of the IWA Specialized Conference “Biofilm 2011”, 27-30 October 2011, Shanghai, China, 113-124.
Zubrowska-Sudol, M., Yang, J.; Trela, J.; Plaza, E. (2010). Evaluation of deammonification process performance at different aeration strategies. Water Science& Technology, 63 (6), 1168-1176.
Örnmark, J. (2011). Swedish Experience of the deammonification process in a full scale one-stage biofilm system. In: Proceeding of the 12th Nordic/ NORDIWA wastewater conference.14-16, November 2011, Marina Congress center, Finland. 212-219.