Embed Size (px)
Citation preview
JIT-Compilation for Interactive Scientific Visualization
J. S. Mueller-RoemerFraunhofer IGD, TU Darmstadt
Fraunhoferstr. 5Germany 64283, Darmstadt, Hessen
C. AltenhofenFraunhofer IGD, TU Darmstadt
Fraunhoferstr. 5Germany 64283, Darmstadt, Hessen
ABSTRACTDue to the proliferation of mobile devices and cloud computing, remote simulation and visualization have becomeincreasingly important. In order to reduce bandwidth and (de)serialization costs, and to improve mobile batterylife, we examine the performance and bandwidth benefits of using an optimizing query compiler for remote post-processing of interactive and in-situ simulations. We conduct a detailed analysis of streaming performance forinteractive simulations. By evaluating pre-compiled expressions and only sending one calculated field insteadof the raw simulation results, we reduce the amount of data transmitted over the network by up to 2/3 for ourtest cases. A CPU and a GPU version of the query compiler are implemented and evaluated. The latter is usedto additionally reduce PCIe bus bandwidth costs and provides an improvement of over 70% relative to the CPUimplementation when using a GPU-based simulation back-end.
KeywordsScientific Visualization, Network graphics, Mobile Computing, Compilers, LLVM, JIT
1 INTRODUCTION
In modern computer-aided engineering (CAE), com-pute-intensive simulations are more and more often runon remote cloud or high-performance computing (HPC)infrastructures. To avoid downloading large simulationresults to a local client machine, solutions for remote vi-sualization and remote post-processing are needed. Al-though the option of using a standard visualization toolvia a video streaming system such as Virtual NetworkComputing (VNC) [Ric+98] is attractive, it is desirableto keep latencies to a minimum to increase usability[TAS06]. By transferring (partial) floating point simula-tion data instead, operations such as probing or changesin color mapping can be performed locally with min-imal latency. Similarly, by transferring geometry orpoint data in 3D, smooth camera interaction becomespossible [Alt+16].
In particular, we aim to answer the following questions:
1. Can compiler technologies be used to decrease vi-sualization latencies in a remote scientific visualiza-tion system?
Permission to make digital or hard copies of all or part ofthis work for personal or classroom use is granted withoutfee provided that copies are not made or distributed for profitor commercial advantage and that copies bear this notice andthe full citation on the first page. To copy otherwise, or re-publish, to post on servers or to redistribute to lists, requiresprior specific permission and/or a fee.
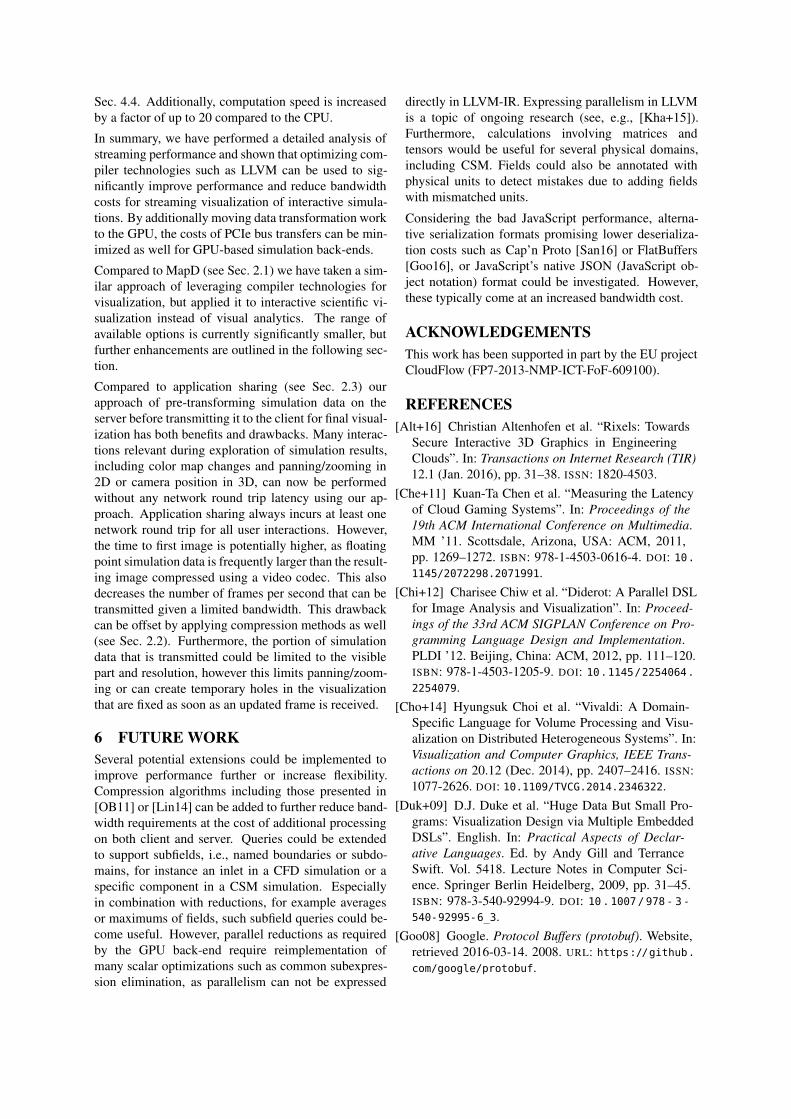
Figure 1: Network, bus and memory bandwidths rel-evant to streaming a GPU-based simulation. The twomost limiting factors are the network bandwidth and thePCIe bus bandwidth.
2. Can GPU-based simulations running at interactiverates profit from GPU-based query compilation?
When individual result fields of a simulation are visu-alized, data can simply be streamed from the serverrunning the simulation. When viewing derived valuesthat depend on multiple fields such as the total energydensity v2
2 + gz+ pρ
in an Eulerian computational fluiddynamics (CFD) simulation, a different solution is re-quired, as transferring all data would be prohibitive, es-pecially when considering comparatively slow mobileconnections (see Fig. 1) and mobile power consump-tion.
A simulation service could provide a fixed set of de-rived values. However, the derived values a user wantsto visualize often depend not only on the physics do-main, but also on the application domain. Therefore,compiling such a fixed set requires domain knowledgeand is very likely to be incomplete and insufficient forthe user to perform his or her work. For stationary sim-ulations, a server-side interpreter for user queries is en-
tirely sufficient, as each query only has to be processedonce. For interactive simulations, i.e., time-dependentsimulations running at several frames per second, or thein-situ visualization of a long-running solver, however,this approach becomes costly due to the repeated inter-pretation overhead.
To avoid these costs, we examine the performanceand bandwidth benefits of using optimizing compilertechnologies for remote, in-situ post-processing andvisualization of simulations running at interactive rates.The implemented query compiler has a native CPUback-end (x86 and x86-64) as well as a GPU back-end(NVIDIA PTX). The latter is used to extend thebandwidth savings to the PCIe (Peripheral ComponentInterconnect Express) bus in addition to the networkinterface, further improving performance when usingGPU-based simulation algorithms. Our approach iseasily extended to all platforms supported by LLVM[LA04].
2 RELATED WORKThis section describes existing methods that are relatedto our approach and briefly shows their benefits anddrawbacks.
2.1 Compiler Technologies for Visualiza-tion
Previous applications of compilers and domain-specificlanguages (DSLs) to scientific visualization mostlycenter on volume visualization and rendering itself[Chi+12; Cho+14; Rau+14]. These systems thereforerepresent the entire visualization pipeline. In thestreaming architecture presented in this paper, data istransformed on the server and rendered on the client.Therefore, the aforementioned systems are not directlyapplicable. This split corresponds to the two stages“Data Management” and “Picture Synthesis” in the sys-tem architecture used by [Duk+09]. However, they usean embedded DSL (eDSL) based on Haskell [Pey03].As client code must be considered untrusted by theserver, a general-purpose language and any eDSLbased on such a language pose a great security risk.In the area of visual analytics, MapD Technologies[Map16] have recently used LLVM/NVVM [NVI16]and GPU computing with great success [MS15]. Incontrast, we aim to bring the advantages of using com-piler technologies to the field of scientific visualization,with a focus on interactively changing datasets fromeither in-situ or interactive simulations.
2.2 CompressionAnother approach to reduce bandwidth requirements isto apply floating-point data compression. For struc-tured data, lossy methods such as the one presented in[Lin14] achieve good results. Structured data occurs in
a significant subset of simulation domains and such amethod would be widely applicable. However, lossycompression before calculation of desired derived val-ues can lead to larger errors in the compounded result.For general data, a method such as the one presented in[OB11] could be used. Their method is a lossless com-pression method and implemented on the GPU, mak-ing it applicable to reducing network as well as PCIebus bandwidths and to arbitrary simulation domains.As compression is orthogonal to the method presentedin this paper, any suitable compression algorithm canbe chosen and combined with our approach. However,all compression methods incur an additional computa-tion cost. A good overview of existing compressiontechniques for floating-point data is given in [RKB06],showing compression ratios as well as compression anddecompression times.
2.3 Application SharingAlthough we present a method to reduce the amountof data transferred when the client performs part of thenecessary calculations to reduce perceived latency, it isworth mentioning that transmitting the content of singleapplications or the entire desktop as an image or videostream is still a common way to visualize server appli-cations on (thin) client machines across a local networkor the Internet. Microsoft’s Remote Desktop Proto-col (RDP) [Mic16] or the platform-independent VirtualNetwork Computing (VNC) [Ric+98] are two popularimplementations of this concept. Good results have alsobeen achieved in the area of video streaming for games[Che+11]. However, mobile networks, especially 3Gnetworks, can add several hundreds of milliseconds oflatency [Gri13].
As shown in this section, many approaches for remotevisualization exist in the context of scientific visualiza-tion and visual analytics. However, the potential ofcompiler technology in the field of remote visualiza-tion of interactive simulations has not been discussedyet. Especially in modern high performance comput-ing (HPC) or cloud environments, these techniques cangreatly improve usability by optimizing data transmis-sion and increasing update rates on the clients, whileminimizing server overhead and latency. Existing com-pression algorithms can be applied independently to de-crease the required bandwidth even further. However,the resulting increase in encoding and decoding timehas to be kept in mind.
3 CONCEPT AND IMPLEMENTATIONIn this section, we present our prototype visualizationsystem, which consists of:
1. an interactive simulation back-end running on theserver
2. a visualization front-end running on the client
3. an application-specific streaming protocol
4. the query expression compiler
Using the streaming protocol, simulation data is trans-mitted at interactive rates from the server to the client.By transmitting data instead of images, many interac-tions, for example color map changes, become possi-ble on the client without incurring network round tripand transmission latency. When the user wants to vi-sualize values that are not a direct output of the simu-lation back-end, the query expression compiler is usedto efficiently transform data on the server, reducing net-work bandwidth requirements. The prototype is basedon a CFD simulation back-end, however, the methodis directly applicable to other physical domains such ascomputational solid mechanics (CSM), computationalaero-acoustics or computational electrodynamics. Foreasy reuse with other simulation back-ends, the querycompiler is designed as a shared library with a simpleinterface.
In the following, we briefly outline the simulation back-end as well as the visualization front-end and detail thestreaming protocol as well as the query compiler.
3.1 Simulation Back-EndOur query-based streaming prototype is based on an in-teractive, Eulerian 2D/3D-CFD code for staggered reg-ular grids using a multigrid solver based on the one pre-sented in [Web+15]. All computational kernels are im-plemented in CUDA [Nic+08]. Therefore, GPU-CPUtransfers are only required for data that is sent to theclient.
3.2 Visualization Front-EndTwo streaming clients have been implemented:
1. A graphical client running on a desktop machineshown in Figure 2.
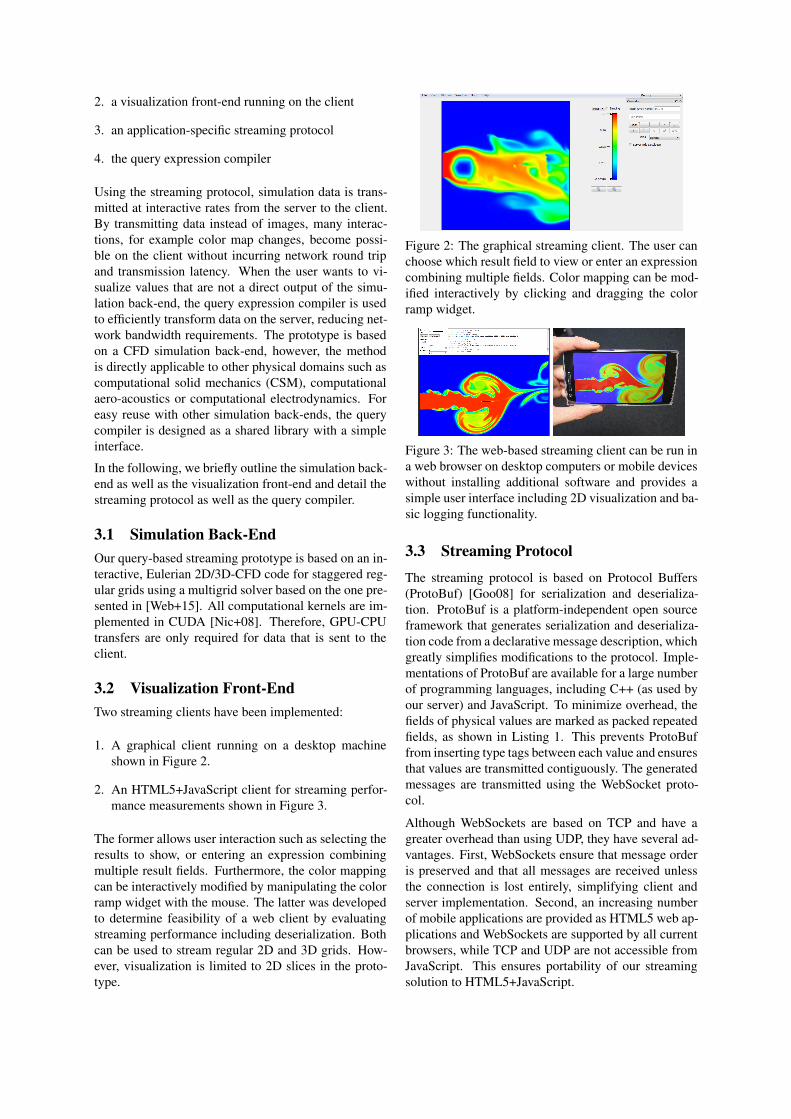
2. An HTML5+JavaScript client for streaming perfor-mance measurements shown in Figure 3.
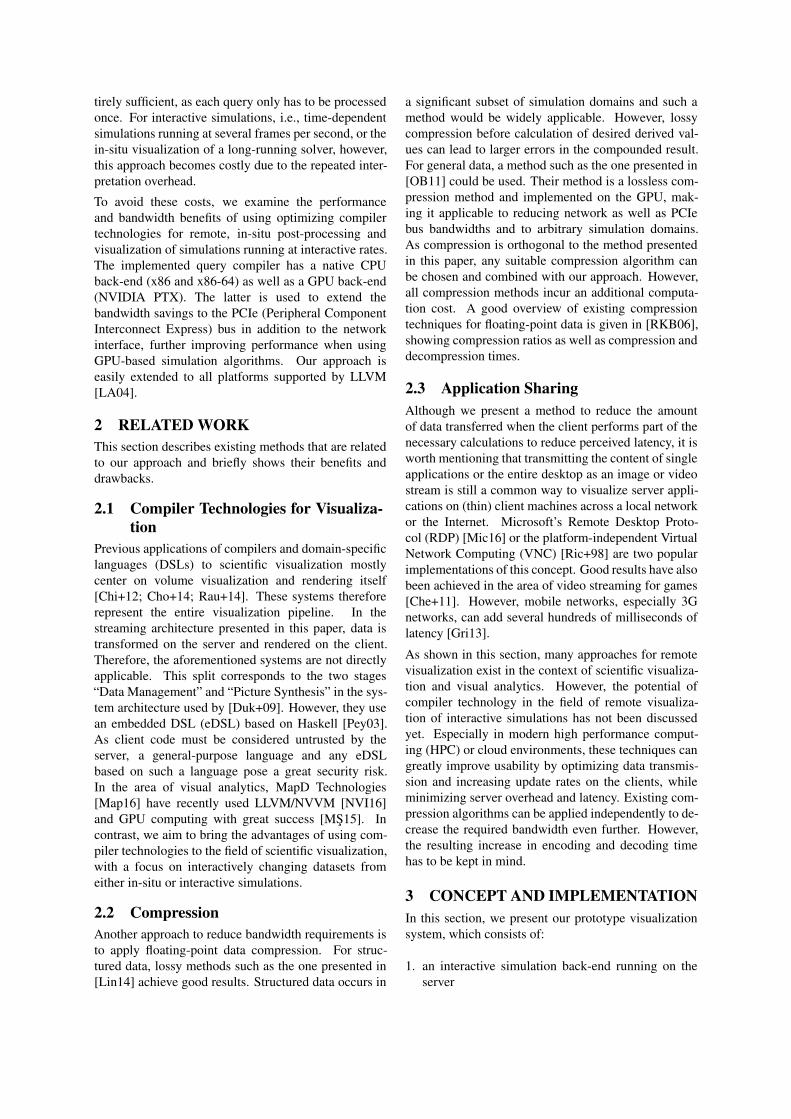
The former allows user interaction such as selecting theresults to show, or entering an expression combiningmultiple result fields. Furthermore, the color mappingcan be interactively modified by manipulating the colorramp widget with the mouse. The latter was developedto determine feasibility of a web client by evaluatingstreaming performance including deserialization. Bothcan be used to stream regular 2D and 3D grids. How-ever, visualization is limited to 2D slices in the proto-type.
Figure 2: The graphical streaming client. The user canchoose which result field to view or enter an expressioncombining multiple fields. Color mapping can be mod-ified interactively by clicking and dragging the colorramp widget.
Figure 3: The web-based streaming client can be run ina web browser on desktop computers or mobile deviceswithout installing additional software and provides asimple user interface including 2D visualization and ba-sic logging functionality.
3.3 Streaming ProtocolThe streaming protocol is based on Protocol Buffers(ProtoBuf) [Goo08] for serialization and deserializa-tion. ProtoBuf is a platform-independent open sourceframework that generates serialization and deserializa-tion code from a declarative message description, whichgreatly simplifies modifications to the protocol. Imple-mentations of ProtoBuf are available for a large numberof programming languages, including C++ (as used byour server) and JavaScript. To minimize overhead, thefields of physical values are marked as packed repeatedfields, as shown in Listing 1. This prevents ProtoBuffrom inserting type tags between each value and ensuresthat values are transmitted contiguously. The generatedmessages are transmitted using the WebSocket proto-col.
Although WebSockets are based on TCP and have agreater overhead than using UDP, they have several ad-vantages. First, WebSockets ensure that message orderis preserved and that all messages are received unlessthe connection is lost entirely, simplifying client andserver implementation. Second, an increasing numberof mobile applications are provided as HTML5 web ap-plications and WebSockets are supported by all currentbrowsers, while TCP and UDP are not accessible fromJavaScript. This ensures portability of our streamingsolution to HTML5+JavaScript.
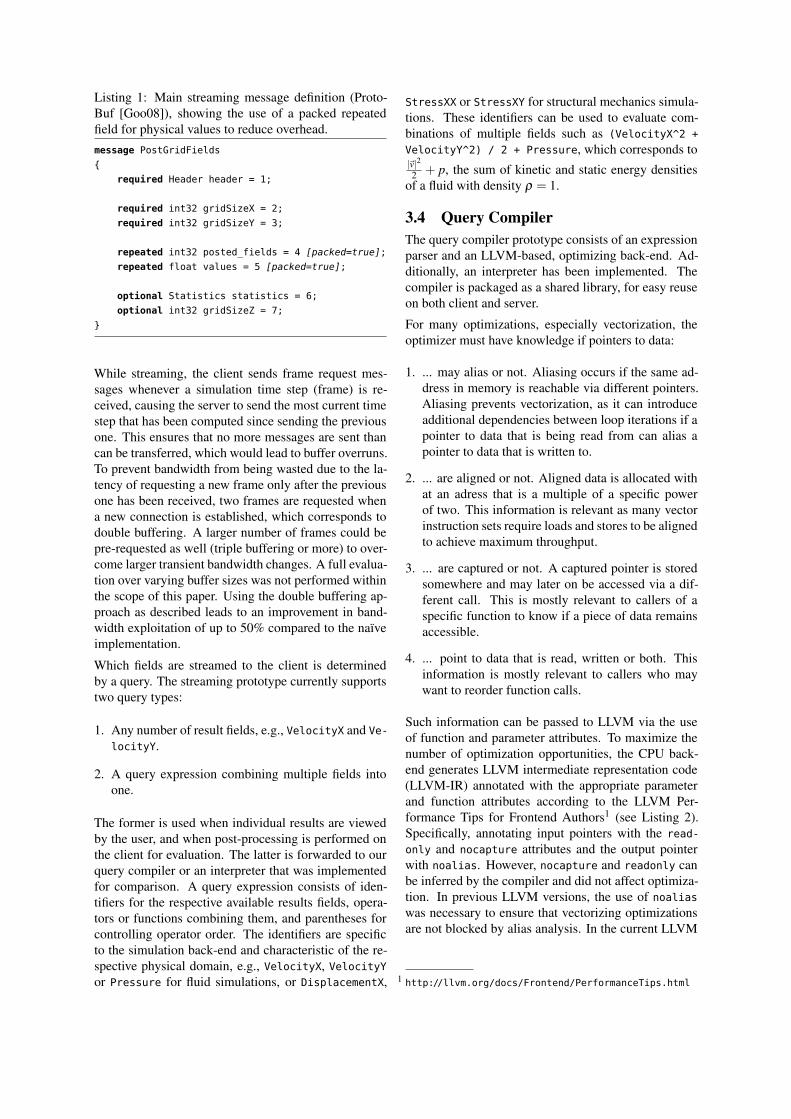
Listing 1: Main streaming message definition (Proto-Buf [Goo08]), showing the use of a packed repeatedfield for physical values to reduce overhead.
message PostGridFields{
required Header header = 1;
required int32 gridSizeX = 2;required int32 gridSizeY = 3;
repeated int32 posted_fields = 4 [packed=true];repeated float values = 5 [packed=true];
optional Statistics statistics = 6;optional int32 gridSizeZ = 7;
}
While streaming, the client sends frame request mes-sages whenever a simulation time step (frame) is re-ceived, causing the server to send the most current timestep that has been computed since sending the previousone. This ensures that no more messages are sent thancan be transferred, which would lead to buffer overruns.To prevent bandwidth from being wasted due to the la-tency of requesting a new frame only after the previousone has been received, two frames are requested whena new connection is established, which corresponds todouble buffering. A larger number of frames could bepre-requested as well (triple buffering or more) to over-come larger transient bandwidth changes. A full evalua-tion over varying buffer sizes was not performed withinthe scope of this paper. Using the double buffering ap-proach as described leads to an improvement in band-width exploitation of up to 50% compared to the naïveimplementation.
Which fields are streamed to the client is determinedby a query. The streaming prototype currently supportstwo query types:
1. Any number of result fields, e.g., VelocityX and Ve-locityY.
2. A query expression combining multiple fields intoone.
The former is used when individual results are viewedby the user, and when post-processing is performed onthe client for evaluation. The latter is forwarded to ourquery compiler or an interpreter that was implementedfor comparison. A query expression consists of iden-tifiers for the respective available results fields, opera-tors or functions combining them, and parentheses forcontrolling operator order. The identifiers are specificto the simulation back-end and characteristic of the re-spective physical domain, e.g., VelocityX, VelocityYor Pressure for fluid simulations, or DisplacementX,
StressXX or StressXY for structural mechanics simula-tions. These identifiers can be used to evaluate com-binations of multiple fields such as (VelocityX^2 +VelocityY^2) / 2 + Pressure, which corresponds to|~v|22 + p, the sum of kinetic and static energy densities
of a fluid with density ρ = 1.
3.4 Query CompilerThe query compiler prototype consists of an expressionparser and an LLVM-based, optimizing back-end. Ad-ditionally, an interpreter has been implemented. Thecompiler is packaged as a shared library, for easy reuseon both client and server.
For many optimizations, especially vectorization, theoptimizer must have knowledge if pointers to data:
1. ... may alias or not. Aliasing occurs if the same ad-dress in memory is reachable via different pointers.Aliasing prevents vectorization, as it can introduceadditional dependencies between loop iterations if apointer to data that is being read from can alias apointer to data that is written to.
2. ... are aligned or not. Aligned data is allocated withat an adress that is a multiple of a specific powerof two. This information is relevant as many vectorinstruction sets require loads and stores to be alignedto achieve maximum throughput.
3. ... are captured or not. A captured pointer is storedsomewhere and may later on be accessed via a dif-ferent call. This is mostly relevant to callers of aspecific function to know if a piece of data remainsaccessible.
4. ... point to data that is read, written or both. Thisinformation is mostly relevant to callers who maywant to reorder function calls.
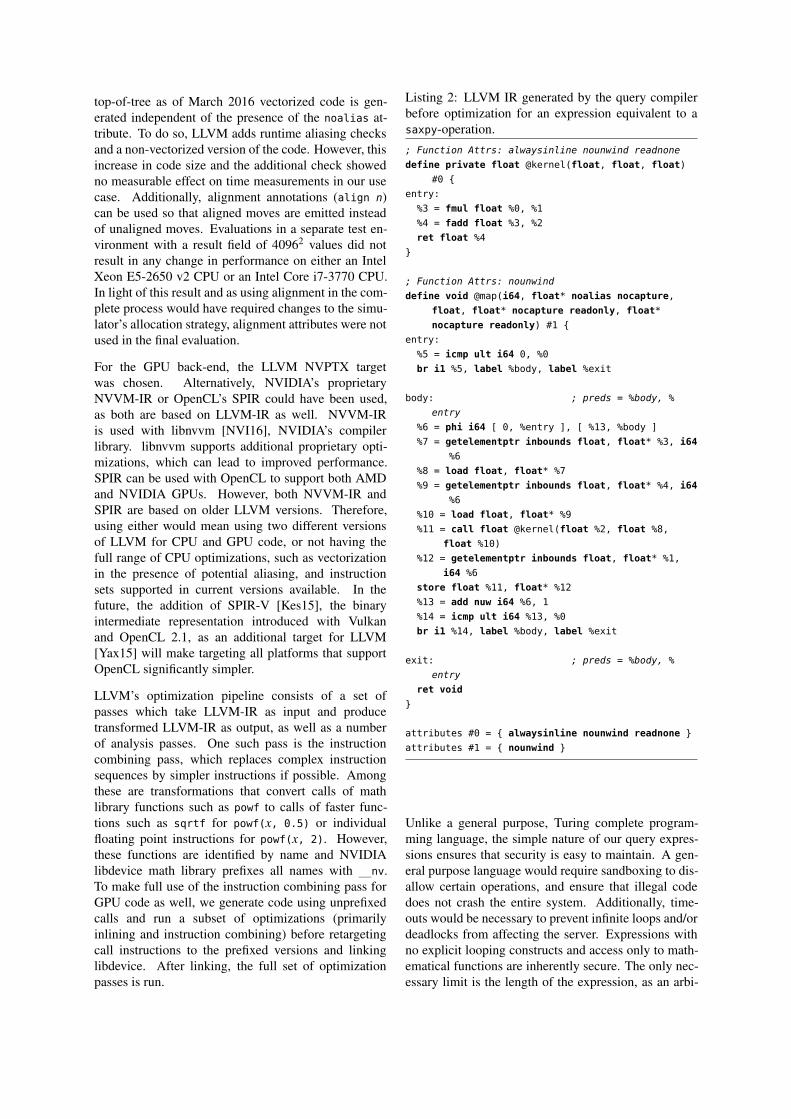
Such information can be passed to LLVM via the useof function and parameter attributes. To maximize thenumber of optimization opportunities, the CPU back-end generates LLVM intermediate representation code(LLVM-IR) annotated with the appropriate parameterand function attributes according to the LLVM Per-formance Tips for Frontend Authors1 (see Listing 2).Specifically, annotating input pointers with the read-only and nocapture attributes and the output pointerwith noalias. However, nocapture and readonly canbe inferred by the compiler and did not affect optimiza-tion. In previous LLVM versions, the use of noaliaswas necessary to ensure that vectorizing optimizationsare not blocked by alias analysis. In the current LLVM
1 http://llvm.org/docs/Frontend/PerformanceTips.html
top-of-tree as of March 2016 vectorized code is gen-erated independent of the presence of the noalias at-tribute. To do so, LLVM adds runtime aliasing checksand a non-vectorized version of the code. However, thisincrease in code size and the additional check showedno measurable effect on time measurements in our usecase. Additionally, alignment annotations (align n)can be used so that aligned moves are emitted insteadof unaligned moves. Evaluations in a separate test en-vironment with a result field of 40962 values did notresult in any change in performance on either an IntelXeon E5-2650 v2 CPU or an Intel Core i7-3770 CPU.In light of this result and as using alignment in the com-plete process would have required changes to the simu-lator’s allocation strategy, alignment attributes were notused in the final evaluation.
For the GPU back-end, the LLVM NVPTX targetwas chosen. Alternatively, NVIDIA’s proprietaryNVVM-IR or OpenCL’s SPIR could have been used,as both are based on LLVM-IR as well. NVVM-IRis used with libnvvm [NVI16], NVIDIA’s compilerlibrary. libnvvm supports additional proprietary opti-mizations, which can lead to improved performance.SPIR can be used with OpenCL to support both AMDand NVIDIA GPUs. However, both NVVM-IR andSPIR are based on older LLVM versions. Therefore,using either would mean using two different versionsof LLVM for CPU and GPU code, or not having thefull range of CPU optimizations, such as vectorizationin the presence of potential aliasing, and instructionsets supported in current versions available. In thefuture, the addition of SPIR-V [Kes15], the binaryintermediate representation introduced with Vulkanand OpenCL 2.1, as an additional target for LLVM[Yax15] will make targeting all platforms that supportOpenCL significantly simpler.
LLVM’s optimization pipeline consists of a set ofpasses which take LLVM-IR as input and producetransformed LLVM-IR as output, as well as a numberof analysis passes. One such pass is the instructioncombining pass, which replaces complex instructionsequences by simpler instructions if possible. Amongthese are transformations that convert calls of mathlibrary functions such as powf to calls of faster func-tions such as sqrtf for powf(x, 0.5) or individualfloating point instructions for powf(x, 2). However,these functions are identified by name and NVIDIAlibdevice math library prefixes all names with __nv.To make full use of the instruction combining pass forGPU code as well, we generate code using unprefixedcalls and run a subset of optimizations (primarilyinlining and instruction combining) before retargetingcall instructions to the prefixed versions and linkinglibdevice. After linking, the full set of optimizationpasses is run.
Listing 2: LLVM IR generated by the query compilerbefore optimization for an expression equivalent to asaxpy-operation.
; Function Attrs: alwaysinline nounwind readnonedefine private float @kernel(float, float, float)
#0 {entry:%3 = fmul float %0, %1%4 = fadd float %3, %2ret float %4
}
; Function Attrs: nounwinddefine void @map(i64, float* noalias nocapture,
float, float* nocapture readonly, float*nocapture readonly) #1 {
entry:%5 = icmp ult i64 0, %0br i1 %5, label %body, label %exit
body: ; preds = %body, %entry
%6 = phi i64 [ 0, %entry ], [ %13, %body ]%7 = getelementptr inbounds float, float* %3, i64
%6%8 = load float, float* %7%9 = getelementptr inbounds float, float* %4, i64
%6%10 = load float, float* %9%11 = call float @kernel(float %2, float %8,
float %10)%12 = getelementptr inbounds float, float* %1,
i64 %6store float %11, float* %12%13 = add nuw i64 %6, 1%14 = icmp ult i64 %13, %0br i1 %14, label %body, label %exit
exit: ; preds = %body, %entry
ret void}
attributes #0 = { alwaysinline nounwind readnone }attributes #1 = { nounwind }
Unlike a general purpose, Turing complete program-ming language, the simple nature of our query expres-sions ensures that security is easy to maintain. A gen-eral purpose language would require sandboxing to dis-allow certain operations, and ensure that illegal codedoes not crash the entire system. Additionally, time-outs would be necessary to prevent infinite loops and/ordeadlocks from affecting the server. Expressions withno explicit looping constructs and access only to math-ematical functions are inherently secure. The only nec-essary limit is the length of the expression, as an arbi-
trarily long expression can result in an arbitrarily largeamount of work.
4 RESULTSIn this section, we analyze the performance of ourstreaming protocol and our query compiler.
4.1 Hardware SetupFor the evaluation, the simulation server was set up ona dual Intel Xeon E5-2650v2 server (two octa-core pro-cessors running at 2.66 GHz) with two NVIDIA GRIDK2 graphics cards (4 GPUs total) and 64 GiB RAMrunning Ubuntu Linux 13.10. The graphical client wasinstalled on an Intel Core i7-2600 (quad-core proces-sor running at 3.4 GHz) desktop workstation with anNVIDIA Geforce GTX 580 GPU and 16 GiB RAMrunning Windows 7. For the HTML5 client, tests wereadditionally performed on a OnePlus One smartphonewith a Qualcomm Snapdragon 801 CPU (quad-coreprocessor running at up to 2.5 GHz) and 3 GiB RAMrunning Cyanogen OS 12.1 (based on Android 5.11).To cover both major mobile platforms, tests were alsoperformed on an Apple iPhone 6S with an Apple A9CPU (dual-core processor running at up to 1.85 GHz)and 2 GiB RAM running iOS 9.2.
4.2 Network Performance and BandwidthLimitations
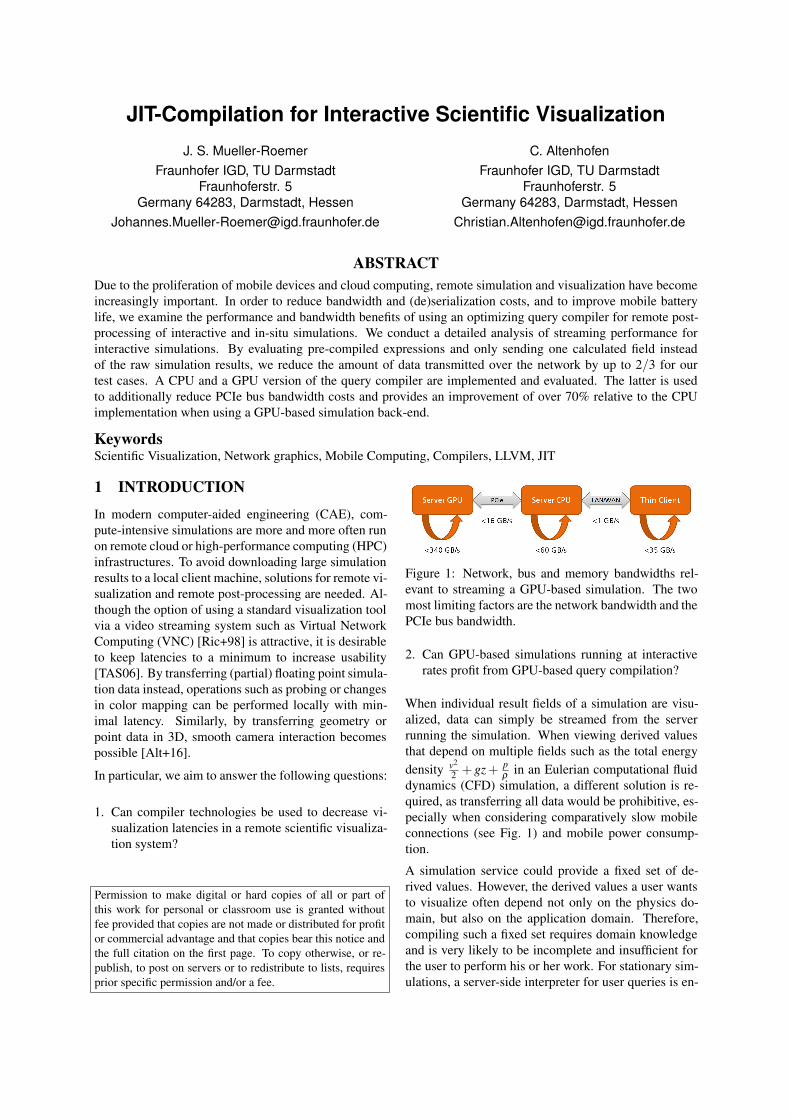
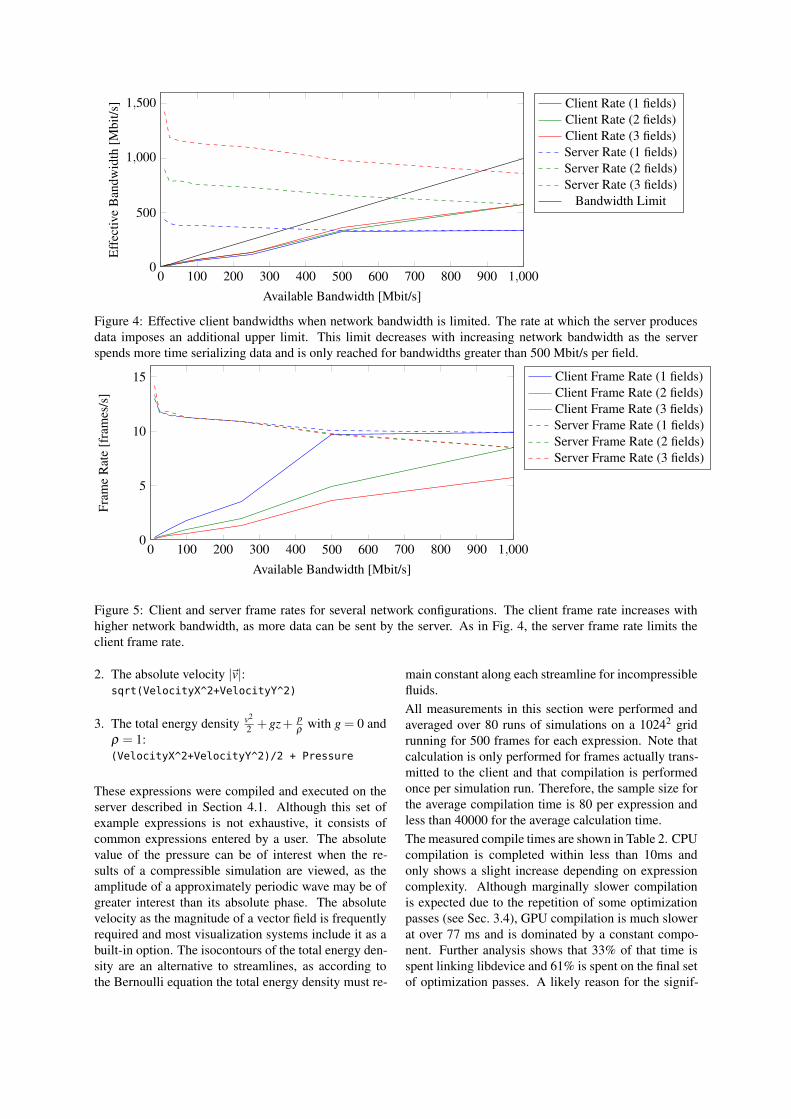
Figures 4 and 5 show the system’s performance in termsof data throughput and frames per second when trans-mitting one, two or three fields with different networkbandwidths. In this particular example, these fieldswere Pressure, VelocityX and VelocityY with a sizeof 10242 floating point values each. Bandwidth limit-ing was realized on the server side using Linux TrafficControl tc. Only outgoing bandwidth is limited, but themessages sent by the client are only tens of bytes in sizeand should therefore not affect the results.
Increasing the available network bandwidth alsoincreases the client’s data throughput as well as theachievable frames per seconds, as more data can betransmitted across the network. At the same time,the server’s throughput and frame rate drop slightly,because more time is spent serializing messagesinstead of calculating new results. This decrease couldbe compensated by implementing double bufferingand performing simulation and serialization asyn-chronously. However, this would lead to increasedmemory requirements. In all cases, the server’sperformance is a natural upper limit for the client thatcannot be exceeded. When transmitting more than onefield, this limit only becomes relevant for client-serverconfigurations in a LAN setup with more than 1 Gbit/s.For a single field, 500 Mbit/s are sufficient to reach fullperformance. The fixed bandwidth limit itself is never
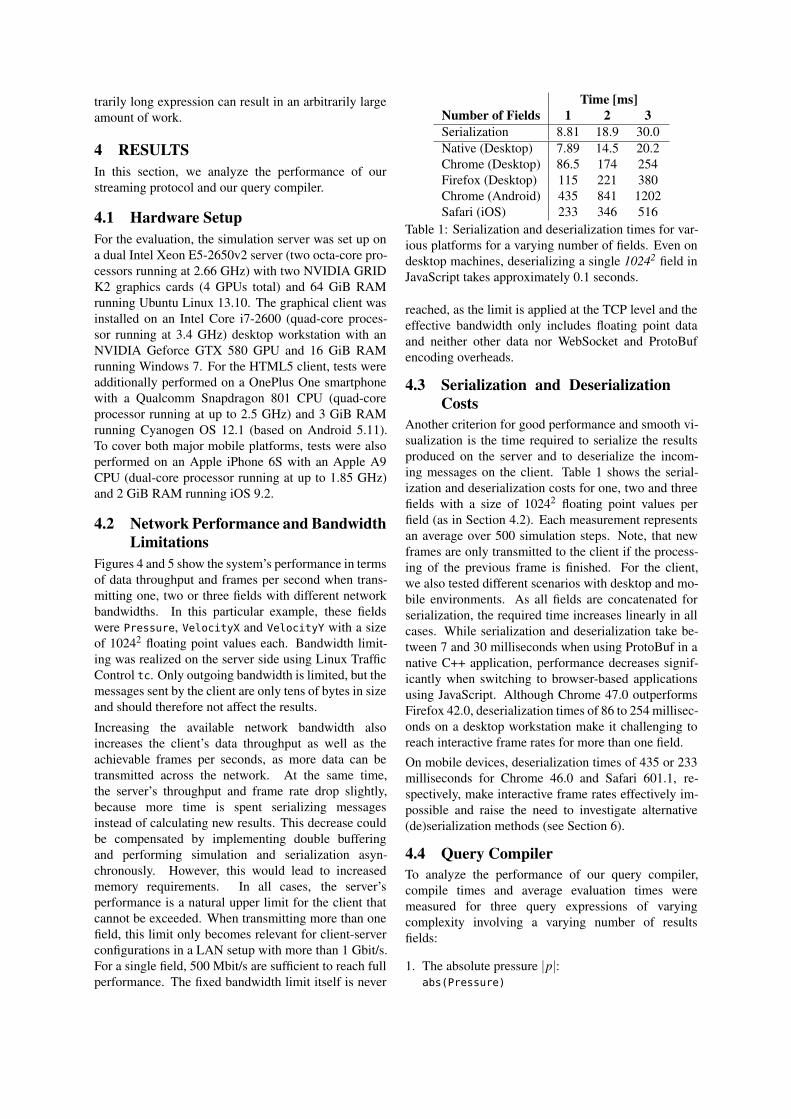
Time [ms]Number of Fields 1 2 3Serialization 8.81 18.9 30.0Native (Desktop) 7.89 14.5 20.2Chrome (Desktop) 86.5 174 254Firefox (Desktop) 115 221 380Chrome (Android) 435 841 1202Safari (iOS) 233 346 516
Table 1: Serialization and deserialization times for var-ious platforms for a varying number of fields. Even ondesktop machines, deserializing a single 10242 field inJavaScript takes approximately 0.1 seconds.
reached, as the limit is applied at the TCP level and theeffective bandwidth only includes floating point dataand neither other data nor WebSocket and ProtoBufencoding overheads.
4.3 Serialization and DeserializationCosts
Another criterion for good performance and smooth vi-sualization is the time required to serialize the resultsproduced on the server and to deserialize the incom-ing messages on the client. Table 1 shows the serial-ization and deserialization costs for one, two and threefields with a size of 10242 floating point values perfield (as in Section 4.2). Each measurement representsan average over 500 simulation steps. Note, that newframes are only transmitted to the client if the process-ing of the previous frame is finished. For the client,we also tested different scenarios with desktop and mo-bile environments. As all fields are concatenated forserialization, the required time increases linearly in allcases. While serialization and deserialization take be-tween 7 and 30 milliseconds when using ProtoBuf in anative C++ application, performance decreases signif-icantly when switching to browser-based applicationsusing JavaScript. Although Chrome 47.0 outperformsFirefox 42.0, deserialization times of 86 to 254 millisec-onds on a desktop workstation make it challenging toreach interactive frame rates for more than one field.On mobile devices, deserialization times of 435 or 233milliseconds for Chrome 46.0 and Safari 601.1, re-spectively, make interactive frame rates effectively im-possible and raise the need to investigate alternative(de)serialization methods (see Section 6).
4.4 Query CompilerTo analyze the performance of our query compiler,compile times and average evaluation times weremeasured for three query expressions of varyingcomplexity involving a varying number of resultsfields:
1. The absolute pressure |p|:abs(Pressure)
0 100 200 300 400 500 600 700 800 900 1,0000
500
1,000
1,500
Available Bandwidth [Mbit/s]
Eff
ectiv
eB
andw
idth
[Mbi
t/s] Client Rate (1 fields)
Client Rate (2 fields)Client Rate (3 fields)Server Rate (1 fields)Server Rate (2 fields)Server Rate (3 fields)
Bandwidth Limit
Figure 4: Effective client bandwidths when network bandwidth is limited. The rate at which the server producesdata imposes an additional upper limit. This limit decreases with increasing network bandwidth as the serverspends more time serializing data and is only reached for bandwidths greater than 500 Mbit/s per field.
0 100 200 300 400 500 600 700 800 900 1,0000
5
10
15
Available Bandwidth [Mbit/s]
Fram
eR
ate
[fra
mes
/s]
Client Frame Rate (1 fields)Client Frame Rate (2 fields)Client Frame Rate (3 fields)Server Frame Rate (1 fields)Server Frame Rate (2 fields)Server Frame Rate (3 fields)
Figure 5: Client and server frame rates for several network configurations. The client frame rate increases withhigher network bandwidth, as more data can be sent by the server. As in Fig. 4, the server frame rate limits theclient frame rate.
2. The absolute velocity |~v|:sqrt(VelocityX^2+VelocityY^2)
3. The total energy density v2
2 +gz+ pρ
with g = 0 andρ = 1:(VelocityX^2+VelocityY^2)/2 + Pressure
These expressions were compiled and executed on theserver described in Section 4.1. Although this set ofexample expressions is not exhaustive, it consists ofcommon expressions entered by a user. The absolutevalue of the pressure can be of interest when the re-sults of a compressible simulation are viewed, as theamplitude of a approximately periodic wave may be ofgreater interest than its absolute phase. The absolutevelocity as the magnitude of a vector field is frequentlyrequired and most visualization systems include it as abuilt-in option. The isocontours of the total energy den-sity are an alternative to streamlines, as according tothe Bernoulli equation the total energy density must re-
main constant along each streamline for incompressiblefluids.All measurements in this section were performed andaveraged over 80 runs of simulations on a 10242 gridrunning for 500 frames for each expression. Note thatcalculation is only performed for frames actually trans-mitted to the client and that compilation is performedonce per simulation run. Therefore, the sample size forthe average compilation time is 80 per expression andless than 40000 for the average calculation time.The measured compile times are shown in Table 2. CPUcompilation is completed within less than 10ms andonly shows a slight increase depending on expressioncomplexity. Although marginally slower compilationis expected due to the repetition of some optimizationpasses (see Sec. 3.4), GPU compilation is much slowerat over 77 ms and is dominated by a constant compo-nent. Further analysis shows that 33% of that time isspent linking libdevice and 61% is spent on the final setof optimization passes. A likely reason for the signif-
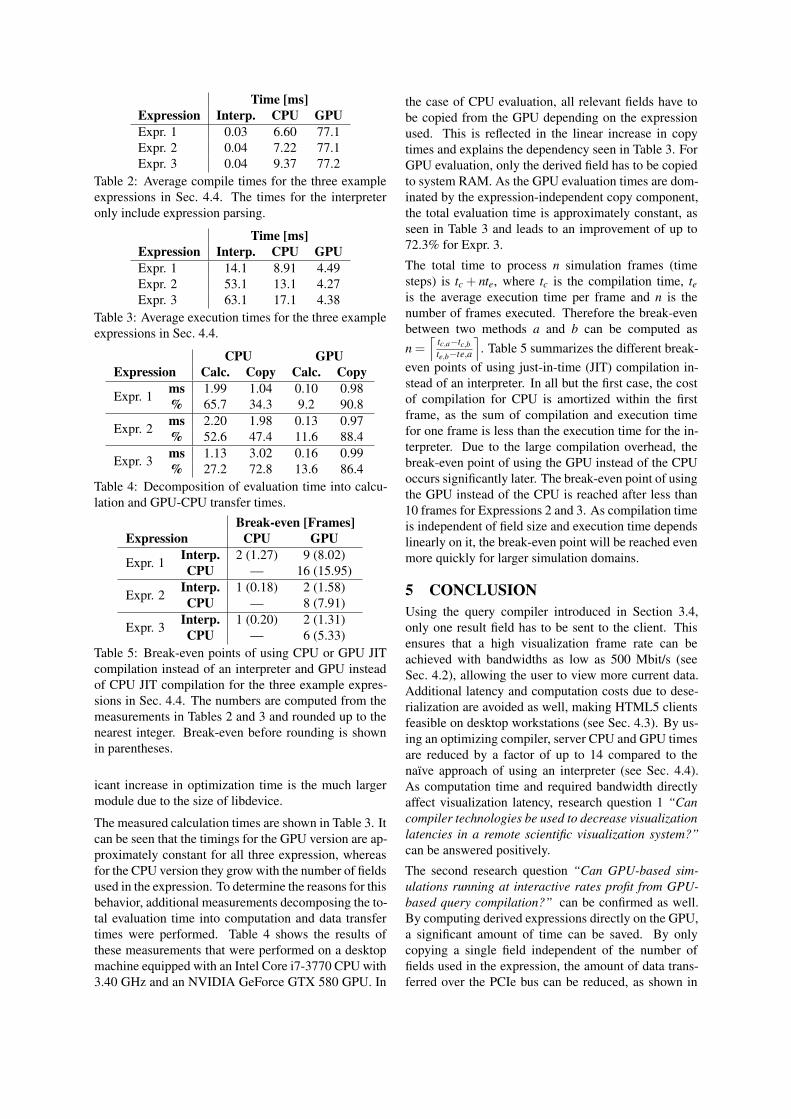
Time [ms]Expression Interp. CPU GPUExpr. 1 0.03 6.60 77.1Expr. 2 0.04 7.22 77.1Expr. 3 0.04 9.37 77.2
Table 2: Average compile times for the three exampleexpressions in Sec. 4.4. The times for the interpreteronly include expression parsing.
Time [ms]Expression Interp. CPU GPUExpr. 1 14.1 8.91 4.49Expr. 2 53.1 13.1 4.27Expr. 3 63.1 17.1 4.38
Table 3: Average execution times for the three exampleexpressions in Sec. 4.4.
CPU GPUExpression Calc. Copy Calc. Copy
Expr. 1 ms 1.99 1.04 0.10 0.98% 65.7 34.3 9.2 90.8
Expr. 2 ms 2.20 1.98 0.13 0.97% 52.6 47.4 11.6 88.4
Expr. 3 ms 1.13 3.02 0.16 0.99% 27.2 72.8 13.6 86.4
Table 4: Decomposition of evaluation time into calcu-lation and GPU-CPU transfer times.
Break-even [Frames]Expression CPU GPU
Expr. 1 Interp. 2 (1.27) 9 (8.02)CPU — 16 (15.95)
Expr. 2 Interp. 1 (0.18) 2 (1.58)CPU — 8 (7.91)
Expr. 3 Interp. 1 (0.20) 2 (1.31)CPU — 6 (5.33)
Table 5: Break-even points of using CPU or GPU JITcompilation instead of an interpreter and GPU insteadof CPU JIT compilation for the three example expres-sions in Sec. 4.4. The numbers are computed from themeasurements in Tables 2 and 3 and rounded up to thenearest integer. Break-even before rounding is shownin parentheses.
icant increase in optimization time is the much largermodule due to the size of libdevice.
The measured calculation times are shown in Table 3. Itcan be seen that the timings for the GPU version are ap-proximately constant for all three expression, whereasfor the CPU version they grow with the number of fieldsused in the expression. To determine the reasons for thisbehavior, additional measurements decomposing the to-tal evaluation time into computation and data transfertimes were performed. Table 4 shows the results ofthese measurements that were performed on a desktopmachine equipped with an Intel Core i7-3770 CPU with3.40 GHz and an NVIDIA GeForce GTX 580 GPU. In
the case of CPU evaluation, all relevant fields have tobe copied from the GPU depending on the expressionused. This is reflected in the linear increase in copytimes and explains the dependency seen in Table 3. ForGPU evaluation, only the derived field has to be copiedto system RAM. As the GPU evaluation times are dom-inated by the expression-independent copy component,the total evaluation time is approximately constant, asseen in Table 3 and leads to an improvement of up to72.3% for Expr. 3.
The total time to process n simulation frames (timesteps) is tc + nte, where tc is the compilation time, teis the average execution time per frame and n is thenumber of frames executed. Therefore the break-evenbetween two methods a and b can be computed asn =
⌈tc,a−tc,bte,b−te,a
⌉. Table 5 summarizes the different break-
even points of using just-in-time (JIT) compilation in-stead of an interpreter. In all but the first case, the costof compilation for CPU is amortized within the firstframe, as the sum of compilation and execution timefor one frame is less than the execution time for the in-terpreter. Due to the large compilation overhead, thebreak-even point of using the GPU instead of the CPUoccurs significantly later. The break-even point of usingthe GPU instead of the CPU is reached after less than10 frames for Expressions 2 and 3. As compilation timeis independent of field size and execution time dependslinearly on it, the break-even point will be reached evenmore quickly for larger simulation domains.
5 CONCLUSIONUsing the query compiler introduced in Section 3.4,only one result field has to be sent to the client. Thisensures that a high visualization frame rate can beachieved with bandwidths as low as 500 Mbit/s (seeSec. 4.2), allowing the user to view more current data.Additional latency and computation costs due to dese-rialization are avoided as well, making HTML5 clientsfeasible on desktop workstations (see Sec. 4.3). By us-ing an optimizing compiler, server CPU and GPU timesare reduced by a factor of up to 14 compared to thenaïve approach of using an interpreter (see Sec. 4.4).As computation time and required bandwidth directlyaffect visualization latency, research question 1 “Cancompiler technologies be used to decrease visualizationlatencies in a remote scientific visualization system?”can be answered positively.
The second research question “Can GPU-based sim-ulations running at interactive rates profit from GPU-based query compilation?” can be confirmed as well.By computing derived expressions directly on the GPU,a significant amount of time can be saved. By onlycopying a single field independent of the number offields used in the expression, the amount of data trans-ferred over the PCIe bus can be reduced, as shown in
Sec. 4.4. Additionally, computation speed is increasedby a factor of up to 20 compared to the CPU.
In summary, we have performed a detailed analysis ofstreaming performance and shown that optimizing com-piler technologies such as LLVM can be used to sig-nificantly improve performance and reduce bandwidthcosts for streaming visualization of interactive simula-tions. By additionally moving data transformation workto the GPU, the costs of PCIe bus transfers can be min-imized as well for GPU-based simulation back-ends.
Compared to MapD (see Sec. 2.1) we have taken a sim-ilar approach of leveraging compiler technologies forvisualization, but applied it to interactive scientific vi-sualization instead of visual analytics. The range ofavailable options is currently significantly smaller, butfurther enhancements are outlined in the following sec-tion.
Compared to application sharing (see Sec. 2.3) ourapproach of pre-transforming simulation data on theserver before transmitting it to the client for final visual-ization has both benefits and drawbacks. Many interac-tions relevant during exploration of simulation results,including color map changes and panning/zooming in2D or camera position in 3D, can now be performedwithout any network round trip latency using our ap-proach. Application sharing always incurs at least onenetwork round trip for all user interactions. However,the time to first image is potentially higher, as floatingpoint simulation data is frequently larger than the result-ing image compressed using a video codec. This alsodecreases the number of frames per second that can betransmitted given a limited bandwidth. This drawbackcan be offset by applying compression methods as well(see Sec. 2.2). Furthermore, the portion of simulationdata that is transmitted could be limited to the visiblepart and resolution, however this limits panning/zoom-ing or can create temporary holes in the visualizationthat are fixed as soon as an updated frame is received.
6 FUTURE WORKSeveral potential extensions could be implemented toimprove performance further or increase flexibility.Compression algorithms including those presented in[OB11] or [Lin14] can be added to further reduce band-width requirements at the cost of additional processingon both client and server. Queries could be extendedto support subfields, i.e., named boundaries or subdo-mains, for instance an inlet in a CFD simulation or aspecific component in a CSM simulation. Especiallyin combination with reductions, for example averagesor maximums of fields, such subfield queries could be-come useful. However, parallel reductions as requiredby the GPU back-end require reimplementation ofmany scalar optimizations such as common subexpres-sion elimination, as parallelism can not be expressed
directly in LLVM-IR. Expressing parallelism in LLVMis a topic of ongoing research (see, e.g., [Kha+15]).Furthermore, calculations involving matrices andtensors would be useful for several physical domains,including CSM. Fields could also be annotated withphysical units to detect mistakes due to adding fieldswith mismatched units.
Considering the bad JavaScript performance, alterna-tive serialization formats promising lower deserializa-tion costs such as Cap’n Proto [San16] or FlatBuffers[Goo16], or JavaScript’s native JSON (JavaScript ob-ject notation) format could be investigated. However,these typically come at an increased bandwidth cost.
ACKNOWLEDGEMENTSThis work has been supported in part by the EU projectCloudFlow (FP7-2013-NMP-ICT-FoF-609100).
REFERENCES[Alt+16] Christian Altenhofen et al. “Rixels: Towards
Secure Interactive 3D Graphics in EngineeringClouds”. In: Transactions on Internet Research (TIR)12.1 (Jan. 2016), pp. 31–38. ISSN: 1820-4503.
[Che+11] Kuan-Ta Chen et al. “Measuring the Latencyof Cloud Gaming Systems”. In: Proceedings of the19th ACM International Conference on Multimedia.MM ’11. Scottsdale, Arizona, USA: ACM, 2011,pp. 1269–1272. ISBN: 978-1-4503-0616-4. DOI: 10.1145/2072298.2071991.
[Chi+12] Charisee Chiw et al. “Diderot: A Parallel DSLfor Image Analysis and Visualization”. In: Proceed-ings of the 33rd ACM SIGPLAN Conference on Pro-gramming Language Design and Implementation.PLDI ’12. Beijing, China: ACM, 2012, pp. 111–120.ISBN: 978-1-4503-1205-9. DOI: 10.1145/2254064.2254079.
[Cho+14] Hyungsuk Choi et al. “Vivaldi: A Domain-Specific Language for Volume Processing and Visu-alization on Distributed Heterogeneous Systems”. In:Visualization and Computer Graphics, IEEE Trans-actions on 20.12 (Dec. 2014), pp. 2407–2416. ISSN:1077-2626. DOI: 10.1109/TVCG.2014.2346322.
[Duk+09] D.J. Duke et al. “Huge Data But Small Pro-grams: Visualization Design via Multiple EmbeddedDSLs”. English. In: Practical Aspects of Declar-ative Languages. Ed. by Andy Gill and TerranceSwift. Vol. 5418. Lecture Notes in Computer Sci-ence. Springer Berlin Heidelberg, 2009, pp. 31–45.ISBN: 978-3-540-92994-9. DOI: 10.1007/978- 3-540-92995-6_3.
[Goo08] Google. Protocol Buffers (protobuf). Website,retrieved 2016-03-14. 2008. URL: https://github.com/google/protobuf.
[Goo16] Google. Flatbuffers. Website, retrieved 2016-03-14. 2016. URL: https://github.com/google/flatbuffers.
[Gri13] Ilya Grigorik. High Performance Browser Net-working. O’Reilly Media, 2013. ISBN: 978-1-4493-4476-4.
[Kes15] John Kessenich, ed. SPIR-V Specification. Ver-sion 1.00, Rev. 2. Khronos Group, Nov. 2015. URL:https://www.khronos.org/registry/spir- v/specs/1.0/SPIRV.pdf.
[Kha+15] Dounia Khaldi et al. “LLVM Parallel Inter-mediate Representation: Design and Evaluation usingOpenSHMEM Communications”. In: Proceedings ofthe Second Workshop on the LLVM Compiler Infras-tructure in HPC. LLVM ’15. ACM, Nov. 2015, 2:1–2:8. DOI: 10.1145/2833157.2833158.
[LA04] Chris Lattner and Vikram Adve. “LLVM: ACompilation Framework for Lifelong Program Anal-ysis and Transformation”. In: Code Generation andOptimization, 2004. CGO 2004. International Sympo-sium on. Mar. 2004, pp. 75–88. DOI: 10.1109/CGO.2004.1281665.
[Lin14] P. Lindstrom. “Fixed-Rate CompressedFloating-Point Arrays”. In: Visualization and Com-puter Graphics, IEEE Transactions on 20.12 (Dec.2014), pp. 2674–2683. ISSN: 1077-2626. DOI:10.1109/TVCG.2014.2346458.
[Map16] MapD Technologies, Inc. MapD. Website, re-trieved 2016-03-14. 2016. URL: http://www.mapd.com/.
[Mic16] Microsoft. Remote Desktop Protocol. Website,retrieved 2016-03-14. 2016. URL: https://msdn.microsoft.com/en-us/library/aa383015(VS.85).aspx.
[MS15] Todd Mostak and Alex Suhan. MapD: MassiveThroughput Database Queries with LLVM on GPUs.Website, retrieved 2016-03-14. June 2015. URL:https://devblogs.nvidia.com/parallelforall/mapd- massive- throughput- database- queries-llvm-gpus.
[Nic+08] John Nickolls et al. “Scalable Parallel Pro-gramming with CUDA”. In: ACM Queue 6.2 (Mar.2008), pp. 40–53. ISSN: 1542-7730. DOI: 10.1145/1365490.1365500.
[NVI16] NVIDIA. CUDA LLVM Compiler. Website, re-trieved 2016-03-14. 2016. URL: https://developer.nvidia.com/cuda-llvm-compiler.
[OB11] Molly A. O’Neil and Martin Burtscher.“Floating-point Data Compression at 75 Gb/s on aGPU”. In: Proceedings of the Fourth Workshop onGeneral Purpose Processing on Graphics ProcessingUnits. GPGPU-4. Newport Beach, California, USA:ACM, 2011, 7:1–7:7. ISBN: 978-1-4503-0569-3. DOI:10.1145/1964179.1964189.
[Pey03] Simon Peyton Jones, ed. Haskell 98 Languageand Libraries: The Revised Report. Cambridge Uni-versity Press, 2003. ISBN: 978-0-521-82614-3.
[Rau+14] P. Rautek et al. “ViSlang: A System forInterpreted Domain-Specific Languages for Scien-tific Visualization”. In: Visualization and ComputerGraphics, IEEE Transactions on 20.12 (Dec. 2014),pp. 2388–2396. ISSN: 1077-2626. DOI: 10.1109/TVCG.2014.2346318.
[Ric+98] Tristan Richardson et al. “Virtual network com-puting”. In: IEEE Internet Computing 2.1 (Jan. 1998),pp. 33–38. DOI: 10.1109/4236.656066.
[RKB06] Paruj Ratanaworabhan, Jian Ke, and MartinBurtscher. “Fast lossless compression of scientificfloating-point data”. In: Proceedings of the Data Com-pression Conference. DCC ’06. 2006, pp. 133–142.DOI: 10.1109/DCC.2006.35.
[San16] Sandstorm.io. Cap’n Proto. Website, retrieved2016-03-14. 2016. URL: https://capnproto.org/.
[TAS06] N. Tolia, D.G. Andersen, and M. Satya-narayanan. “Quantifying interactive user experienceon thin clients”. In: Computer 39.3 (Mar. 2006),pp. 46–52. ISSN: 0018-9162. DOI: 10.1109/MC.2006.101.
[Web+15] Daniel Weber et al. “A Cut-Cell GeometricMultigrid Poisson Solver for Fluid Simulation”. In:Computer Graphics Forum 34.2 (May 2015), pp. 481–491. ISSN: 0167-7055. DOI: 10.1111/cgf.12577.
[Yax15] Liu Yaxun. [RFC] Proposal for Adding SPIRVTarget. Website, retrieved 2016-03-14. June 2015.URL: http://lists.llvm.org/pipermail/llvm-dev/2015-June/086848.html.