Embed Size (px)
Citation preview

KMRC Conference 2001
181
M O D E L L I N G A N D S I M U L A T I O N O F T H E G R I N D I N G C I R C U I T A T ‘ E L P I L O N ’ M I N E
Juan Luis Reyes-Bahena
Abstract
The grinding operation in a ball mill is widely used in comminution. This process is extremely capital and energy intensive process and at the same time it is notoriously inefficient. Therefore, simulation can be used as a convenient tool in studying the behaviour and performance of grinding circuits by facilitating the evaluation of various scenarios and identification of optimum operating conditions. This paper presents how these modern simulation techniques are applicable to a grinding circuit using JKSimMet computer package.
A grinding model developed at ‘El Pilon’ mine using JKSimMet (Version 4) was used to simulate three different milling designs. The objective of these simulations was to investigate a new design of the grinding circuit with an additional ball mill to increase both grinding throughput and fineness. The simulation results highlight that two closed grinding circuits in series are more appropriate to achieve these targets. Surveying the implemented grinding circuit validated the JKSimMet simulation results. An increase of grinding throughput from 600 tpd to 800 tpd was achieved in the grinding circuit in serie as well as an increase of the grinding fineness from 57% to 75% passing 75 µm.
This case study shows that JKSimMet can be used to design grinding circuit accuracy and highlights that this computer simulator is a powerful tool in the optimisation of comminution circuits.
Key words: Grinding circuit; milling in serie; modelling; optimisation; simulation
INTRODUCTION
The grinding operation in a ball mill is widely used in comminution. However, this process is extremely capital and energy intensive process and at the same time it is notoriously inefficient. Therefore, accurate designing of both circuit and operating parameters are important to optimise the power consumption, which can lead to substantial economic benefit. Simulation can be used as a convenient tool in studying the behaviour and performance of grinding circuits by facilitating the evaluation of various scenarios and identification of optimum operating conditions. Currently, the development of simulators for mineral

Modelling and Simulation of the Grinding Circuit at ‘El Pilon’ Mine
JKMRC Conference 2001
182
processing units has considerably increased in last decade; e.g. typical software packages are USIM PAC (Broussand et al, 1988), JKSimMet (JKTech, 1989), MODSIM (Herbst et al, 1989), and SIMBAL (CANMET, 1989).
JKSimMet (Version 4) computer package is used in this study to model and simulate the ‘El Pilon’ grinding and classification stages. This simulator was used to assist in the design of a new grinding circuit with the addition of a new ball mill in order to increase both grinding throughput and fineness. Thus, simulation results are implemented in the plant which were validated with a new sampling campaign.
‘EL PILON’ MINE
‘El Pilon’ mine mill is located in the town of San Martin de Bolaños, approximately 500 km east of the Guadalajara State in Northern Mexico. The concentrator processes a sulphide orebody consisting of 1.64% Pb, 0.10% Cu, 5.31% Fe and 2.64% Zn. Silver content ranges from 270 to 320 g/ton and gold from 0.20 to 0.34 g/ton. The ore is leached with cyanide to obtain the doré (i.e. Ag-Au alloy). Current milling rates are approximately 600 ton/day (tpd).
Ore is delivered to the mill by trucks and sent directly to the primary crusher. The ore is crushed in a primary jaw crusher and transported by conveyor to the secondary and tertiary crushing circuit. The crushing circuit product contains material approximately 96% passing 9.53 mm (3/8 inches). This material is conveyed via belt feeders to the 2.59-m by 3.67-m (8 ft ½ inches in diameter by 12.0 ft in length) 300 HP Marcy ball mill. The ball mill, with 40% of mill filling and 70% of its critical speed, is fitted with steel liners. It uses steel balls in a ratio of 70% of 76.2 mm (3 inches) and 30% of 50.8 mm (2 inches) as grinding media. The pulp density in the ball mill is maintained at 76% solids, and lime and cyanide are added to the mill feed. Lime addition increases the circuit pH to reduce volatilization of cyanide and to increase the settling of material in the thickener downstream. Cyanide is used to leach silver/gold bearing particles throughout the circuit.
The grinding circuit uses a two-stage cyclone process to classify mill discharge. The classification circuit consists of two 0.508-m (20 inches) diameter cyclone. Only one cyclone is operating at a time while the other is on stand-by. Discharge from the ball mill flows to a pump box where it is diluted to a density approximately 48% solids before being sent to the cyclone, for classification, by means of a 0.20 m by 0.15 m (DRL 8 inches by 6 inches) pump at 870 rpm. Underflow from the cyclone is fed back to the ball mill while the overflow material (19% to 22% solid) with 58% passing 75 µm (200 mesh) is directed to a 19.81 m (65 foot) diameter thickener located outside the east wall of the mill complex. Underflow of the thickener, having a pulp density from 50 to 60% solids, is sent to the leaching process. The leached pulp and its silver/gold bearing solution are treated using the Merrill Crowe process to obtain the doré.

Modelling and Simulation of the Grinding Circuit at ‘El Pilon’ Mine
JKMRC Conference 2001
183
GRINDING CIRCUIT SIMULATOR
JKSimMet is a powerful tool for analysis and simulation of mineral processing plant data. It gives
engineers the ability to design and optimise any crushing or grinding circuit including stages of
classification. It allows engineers to:
• Design a circuit on the graphics monitor,
• Enter model and plant data,
• Simulate the circuit, and
• Graph and print the results.
JKSimMet performs steady state simulation of a range of comminution and classification operations. The
principal application of JKSimMet is to carry out process analysis and optimisation of existing circuits and
also extremely useful for conducting conceptual design studies, where the purpose is to assess the
suitability of different flowsheets to achieve a desired performance objective, as presented in this paper.
Mathematical Models
Process models of the two main units at ‘El Pilon’ grinding circuit are presented:
• Ball mill, and
• Hydrocyclone
Ball Mill
The perfect mixed model (Whiten, 1976) is quite similar to the general population balance model. This model assumes a perfectly mixed mill which removes most of the complexities in the general population balance model. The perfect mixed model start with the same population balance, i.e.
out Breakageout oductPrin Breakage in Feed +=+ (1)
However, two factors control the breakage of particles inside the mill as follows:
• Selection function which defines the breakage probability of particles,
iii sdp = (2)
where, di, is the discharge function in the mill, thus
out) (breakage srselection ii= (3)
Modelling and Simulation of the Grinding Circuit at ‘El Pilon’ Mine
JKMRC Conference 2001
184
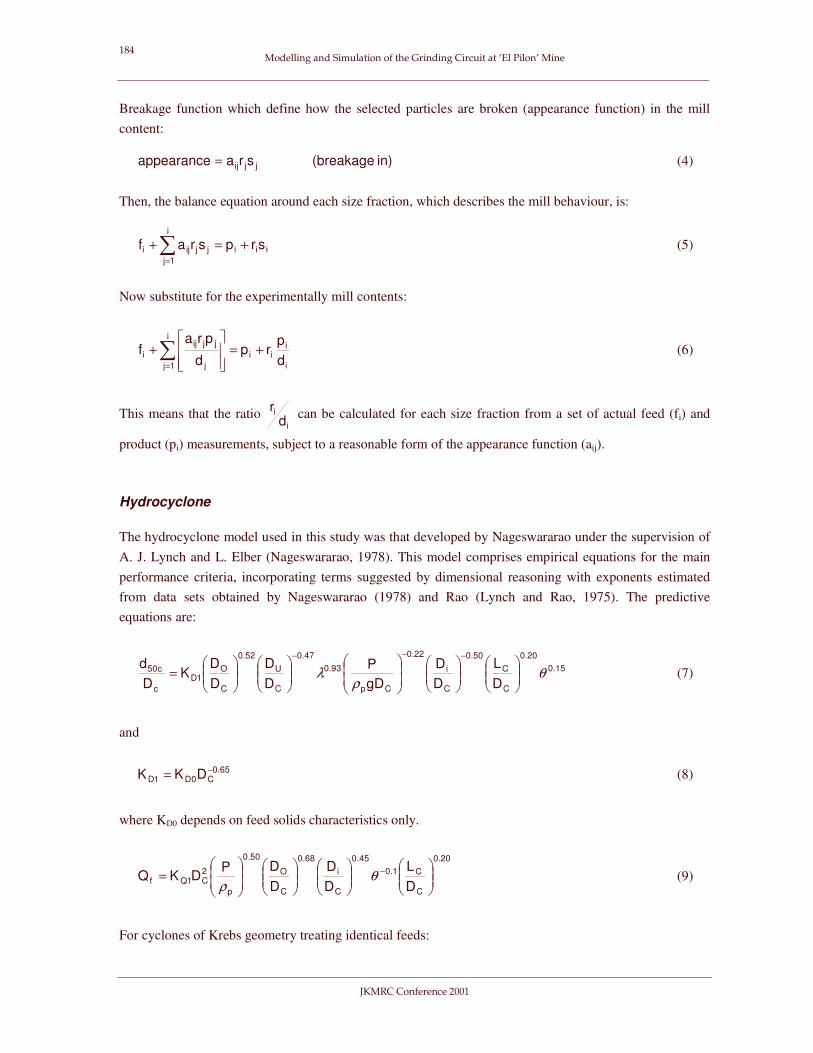
Breakage function which define how the selected particles are broken (appearance function) in the mill content:
in) (breakage sraappearance jjij= (4)
Then, the balance equation around each size fraction, which describes the mill behaviour, is:
iii
i
1jjjiji srpsraf +=+�
=
(5)
Now substitute for the experimentally mill contents:
i
iii
i
1j j
jjiji d
prp
d
praf +=
���
�
���
�+�
=
(6)
This means that the ratio i
id
r can be calculated for each size fraction from a set of actual feed (fi) and
product (pi) measurements, subject to a reasonable form of the appearance function (aij).
Hydrocyclone
The hydrocyclone model used in this study was that developed by Nageswararao under the supervision of A. J. Lynch and L. Elber (Nageswararao, 1978). This model comprises empirical equations for the main performance criteria, incorporating terms suggested by dimensional reasoning with exponents estimated from data sets obtained by Nageswararao (1978) and Rao (Lynch and Rao, 1975). The predictive equations are:
15.020.0
C
C50.0
C
i
22.0
Cp
93.047.0
C
U52.0
C
O1D
c
c50
DL
DD
gDP
DD
DD
KDd θ
ρλ ��
���
��
���
��
��
�
��
���
��
���
=
−−−
(7)
and
65.0C0D1D DKK −= (8)
where KD0 depends on feed solids characteristics only.
20.0
C
C1.045.0
C
i68.0
C
O
50.0
p
2C1Qf D
LDD
DDP
DKQ ��
���
��
���
��
���
��
��
�
= −θ
ρ (9)
For cyclones of Krebs geometry treating identical feeds:

Modelling and Simulation of the Grinding Circuit at ‘El Pilon’ Mine
JKMRC Conference 2001
185
10.0C0Q1Q DKK −= (10)
where KQ0 depends on feed solids characteristics only.
22.0
C
C24.050.0
C
i27.0
53.0
Cp
40.2
C
U19.1
C
O1Wf D
LDD
gDP
DD
DD
KR ��
���
��
���
��
��
�
��
���
��
���
= −
−−−
θλρ
(11)
22.0
C
C24.025.0
C
i
31.0
Cp
83.1
C
U94.0
C
O1Vv D
LDD
gDP
DD
DD
KR ��
���
��
���
��
��
�
��
���
��
���
= −
−−−
θρ
(12)
where Di is inlet diameter (diameter of circle of some area as cyclone inlet), m DO is overflow (vortex finder) diameter, m DU is underflow (apex) diameter, m DC is cyclone cylinder diameter, m LC is length of cylindrical section, m θ is cone full angle, degrees P is feed pressure at inlet, kPa ρp is feed slurry density, t/m3 g is acceleration due to gravity, 9.81 m/s2 Qf is flowrate, m3/h Rf is recovery of water to underflow, % Rv is volumetric recovery of feed slurry to underflow, % K is constant to be estimated from data
λ is hindered settling correction term, ( )3v
Cv1C
−
Cv is volumetric fraction of solid in feed slurry
The d50c predicted by Equation 7 is inserted in the Whiten function to determine the corrected efficiency curve for the cyclone:
( ) ( )( )( ) ( ) �
�
���
�
−+−+=
2expxexp1expx1
CE*
*
oa ααβαββ
(13)
where α is an efficiency parameter β is a fish-hook factor C is recovery of water to overflow, (C = 100-Rf), %

Modelling and Simulation of the Grinding Circuit at ‘El Pilon’ Mine
JKMRC Conference 2001
186
EXPERIMENTAL WORK
Metallurgical Sampling
In August 1998, two metallurgical sampling were conducted at ‘El Pilon’ grinding circuit (Figure 1) assuring steady state at least two hours prior surveys. The surveys were conducted under normal operations.
As illustrated in Figure 1, the sampling points in each survey were:
• New circuit feed,
• Ball mill discharge,
• Cyclone underflow, and
• Cyclone overflow.
CIRCUIT: CURRENT CIRCUIT WINDOWS: Top - TPH Solids Bottom - % Solids
1 Help 2 Operatn 3 Error 4 Test 5 Unit 6 DrawCot 7 Stream 8 9 UntFeed 0 RunSIM
CYCLONED20
MARCY BALL MILL8´5”x12´
FEED
TO LEACHINGPROCESS
F
P
SAMPLING POINTS�
�
�
�
�
Figure 1 – Current grinding circuit at ‘El Pilon’ mine
Samples were cut at each of these sampling point every 15 minutes for two hours and then combined into an overall sample for sieve analysis and solid content measurements. The tonnage in the new feed stream was also recorded during each survey. Samples were weighed, dried and weighed again to calculate the percent of solids. The percent of solid was then calculated by:
100WtWt
solid% s ∗= (14)
where Wts is the weight of solids, and Wt is the weight of slurry.

Modelling and Simulation of the Grinding Circuit at ‘El Pilon’ Mine
JKMRC Conference 2001
187
All the samples from the survey where then sized at ‘El Pilon’ Chemical Laboratory. Each sample was wet sieved at 45µm to remove any ultrafine particles. The +45mm material was then dry screened at 12500µm, 9520µm, 2000µm, 1700µm, 250µm, 180µm, 150µm, 106µm, 75µm, and 45µm.
RESULTS AND DISCUSSION
The results are presented and discussed into four parts (a) mass balancing, (b) model fitting, (c) simulation and (d) validation and operation of the new grinding circuit at ‘El Pilon’ mine.
Mass Balancing
Mass balancing is the most useful method of data assessment. JKSimMet mass balancing sub-system is used to assess data efficiently. The balancing process produces best-fit estimates of flowrates and a set of adjusted size which is consistent with those flowrates. Overall, JKSimMet mass balancing technique minimises the sum of weighed squared errors (JKTech 1989), that is:
�� �= = =
��
���
−+
��
��
�
−=
N
1j
L
1i
L
1i i
ii
ij
ijij aAxXSSQ
σσ (15)
where N is the number of measurements, L is the number of streams, X is a measurement, x is the adjusted measurement, A is the measured flow, a is the adjusted flow, and σij and σi are the weights or standard deviations for the measurements and flows respectively.
Based on experimental results and personal judgement, the standard deviations are assigned to the data as follows:
• For fractions greater than 10%, a standard deviation of 1.0% is assumed.
• For fractions less than 1%, a standard deviation of 0.1% is assumed.
• For fractions between 1% and 10%, a standard deviation of 0.1% plus one tenth of the fraction is assumed.
To mass balance the grinding circuit data, the new circuit feed is assumed to be accurate (i.e. contain zero error). It should be noted that the mass balancing program tells how the experimental data (including both the stream data and sizing data) meet the mass conservation criterion. It does not tell which data are accurate or inaccurate. Neither can it give the true values. The accuracy of the experimental data depends entirely on the experimental design and handling.

Modelling and Simulation of the Grinding Circuit at ‘El Pilon’ Mine
JKMRC Conference 2001
188
Based on the criterion described above, the adjusted data were very similar to the experimental values. The mass balancing results are presented in Figure 2 and the grinding performance is summarised in Table 1.
During the survey, the milling operation was observed to have a very poor performance. Under the conditions of the survey, a large recycle load in the mill 697.4% is found and also the volume percent solids in the ball mill discharge too high 52.7%. These numbers confirm the observation why a large amount or coarse particles were rejected at the end of the mill. Using the Bond power model (Eq. 16), the power draw for the mill is calculated to be 281.24 HP under the conditions of the survey. It should be noted that the power draw is 6.3% lower than the installed maximum (300 HP) while a reasonable safety margin for normal plant fluctuations may be 10%.
tph8080
rate feed MillF10
P10
WiPower ⋅��
��
�
−⋅= (16)
0
1020
3040
50
6070
8090
100
0.01 0.10 1.00 10.00 100.00
Particle Size, mm
Cum
ulat
ive
% P
assi
ng
Feed BM Discharge Cyc U/F Cyc O/F
marks ~ Experimental Datalines ~ Adjusted Data
Figure 2 – Mass balancing of the grinding circuit at ‘El Pilon’ mine
Table 1 – Grinding circuit performance at ‘El Pilon’ mine (August 1998)
Stream Solids Water SG Pulp V Flowrate % Passing 75µm
New Circuit Feed 24.95 96.5 0.91 2.63 9.81 3.50
Ball Mill Discharge 173.99 75.6 56.16 1.95 118.30 11.09
Cyclone Underflow 149.04 73.7 53.19 1.90 106.42 3.40
Cyclone Overflow 24.95 19.0 106.36 1.14 115.27 57.00
Units [ton/h] [%] [ton/h] [ton/m3] [m3/h] [%]

Modelling and Simulation of the Grinding Circuit at ‘El Pilon’ Mine
JKMRC Conference 2001
189
Model Fitting
The mass balanced data were used to calibrate the mathematical models of ball mill and cyclone included in the JKSimMet (Version 4) simulator. It is important to know the structure of the models and what parameters have to be fitted. These subjects are presented in details in the JKSimMet manual (JKTech, 1989). The ore parameters should be determined from ore characterisation tests of representative samples. Because the main objective of this study is simulation and the ore characterisation tests was not available, the standard appearance function was chosen. Thus, the machine parameters (e.g. breakage rates) are calculated from survey data.
No significant differences were found in the calibration of ‘El Pilon’ models. Thus, the ball mill and cyclone parameters are assumed to represent the grinding circuit within a 30% error. Once the models have been calibrated to ‘El Pilon’ grinding circuit, the behaviour of the circuit over a wide range of operational conditions and designs can be predicted.
Simulation
The calibrated models were used to simulate three different flowsheets by addition of a new ball mill 9x9 ft, as described below. The new ball mill operating data are not available; however, it can be assumed that the 8.5x12-ft mill parameters can be used in the new ball mill because of the same ore treated. Overall, the simulations described below were performed at two new feed rates 700 tpd (29.2 tph) and 800 tpd (33.3 tph) and large circulating loads keeping constant the percent solid (19.0%) in the final grinding product as required by the metallurgical staff of ‘El Pilon’ mine. Therefore, the ball mill and cyclone design parameters (e.g. %solids, vortex, apex, etc.) were adjusted to achieve the objectives of this study - an increase in grinding throughput and fineness. Because ball mills are of the overflow discharge type, each simulation was performed considering the volume percent solid not exceed 52% to avoid the slurry transport problems.
Grinding Circuit in Parallel
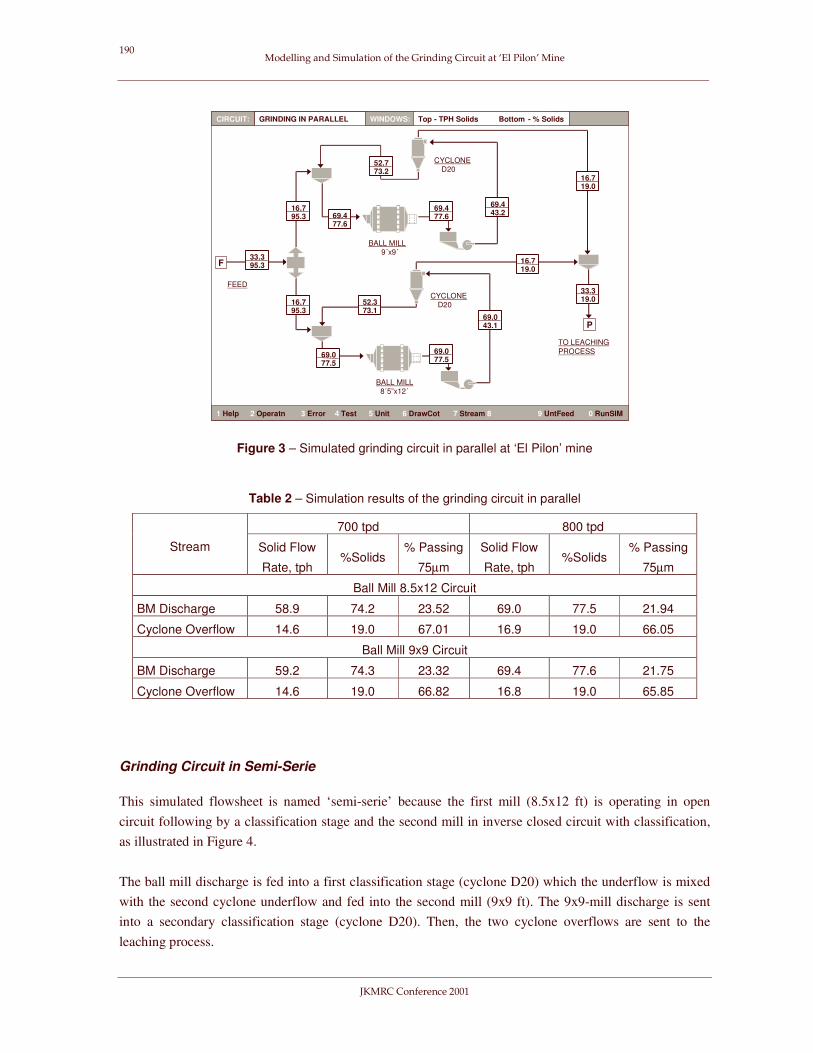
Figure 3 shows the simulated circuit in which the two mills are operating in parallel each one with a classification stage in closed circuit.
The simulation results are presented in Table 2 which highlight that this design in parallel increases the grinding throughput. However, the particle size in the final product (% passing 75µm) increases only 8% and it decreases 1% as increasing the grinding throughput from 700 tpd to 800 tpd.
Modelling and Simulation of the Grinding Circuit at ‘El Pilon’ Mine
JKMRC Conference 2001
190
1 Help 2 Operatn 3 Error 4 Test 5 Unit 6 DrawCot 7 Stream 8 9 UntFeed 0 RunSIM
CIRCUIT: GRINDING IN PARALLEL WINDOWS: Top - TPH Solids Bottom - % Solids
TO LEACHINGPROCESS
FEED
F
BALL MILL9´x9´
BALL MILL8´5”x12´
CYCLONED20
33.395.3
16.795.3
69.077.5
69.077.5
52.373.1
69.043.1
16.795.3 69.4
77.6
52.773.2
69.443.269.4
77.6
16.719.0
16.719.0
33.319.0CYCLONE
D20
P
Figure 3 – Simulated grinding circuit in parallel at ‘El Pilon’ mine
Table 2 – Simulation results of the grinding circuit in parallel
700 tpd 800 tpd
Stream Solid Flow
Rate, tph %Solids
% Passing
75µm
Solid Flow
Rate, tph %Solids
% Passing
75µm
Ball Mill 8.5x12 Circuit
BM Discharge 58.9 74.2 23.52 69.0 77.5 21.94
Cyclone Overflow 14.6 19.0 67.01 16.9 19.0 66.05
Ball Mill 9x9 Circuit
BM Discharge 59.2 74.3 23.32 69.4 77.6 21.75
Cyclone Overflow 14.6 19.0 66.82 16.8 19.0 65.85
Grinding Circuit in Semi-Serie
This simulated flowsheet is named ‘semi-serie’ because the first mill (8.5x12 ft) is operating in open circuit following by a classification stage and the second mill in inverse closed circuit with classification, as illustrated in Figure 4.
The ball mill discharge is fed into a first classification stage (cyclone D20) which the underflow is mixed with the second cyclone underflow and fed into the second mill (9x9 ft). The 9x9-mill discharge is sent into a secondary classification stage (cyclone D20). Then, the two cyclone overflows are sent to the leaching process.

Modelling and Simulation of the Grinding Circuit at ‘El Pilon’ Mine
JKMRC Conference 2001
191
1 Help 2 Operatn 3 Error 4 Test 5 Unit 6 DrawCot 7 Stream 8 9 UntFeed 0 RunSIM
CIRCUIT: GRINDING IN SEMI-SERIE WINDOWS: Top - TPH Solids Bottom - % Solids
F 33.395.3
33.379.7
33.379.7
CYCLONESD20
BALL MILL8´5”x12´
BALL MILL9´x9´
142.70.3
23.351.3
142.70.3
118.75.9
142.50.633.7
34.1
10.0.19.0
23.319.0
33.319.0
142.70.3
TO LEACHINGPROCESS
FEED
P
Figure 4 – Simulated grinding circuit in semi-serie at ‘El Pilon’ mine
Simulation results of this design are presented in Table 3. As may be seen, the solid flow rate in the first cyclone overflow is too low. The simulator predicts a very low operating pressure in this cyclone 5.34 kPa at 700 tpd and 6.57 kPa at 800 tpd. Under these conditions, the first cyclone is operating as a simple splitter increasing the final particle size in the cyclone overflow.
Table 3 – Simulation results of the grinding circuit in semi-serie
700 tpd 800 tpd
Stream Solid Flow
Rate, tph %Solids
% Passing
75µm
Solid Flow
Rate, tph %Solids
% Passing
75µm
Ball Mill 8.5x12 Circuit
BM Discharge 29.2 79.7 38.92 33.3 79.7 36.63
Cyclone Overflow 8.7 19.0 76.94 10.0 19.0 76.41
Ball Mill 9x9 Circuit
BM Discharge 109.0 63.3 20.25 142.0 70.3 13.85
Cyclone Overflow 20.5 19.0 66.64 23.3 19.0 56.55
However, the particle size in the second cyclone overflow is coarse 66.6% passing 75µm at 700 tpd and 56.6% at 800 tpd. Overall, the particle size in the final grinding product is affected by the performance of the second cyclone. These results were achieved using a top ball size of 70% at 76.2mm and 30% at 50.8 mm in both mills. Subsequent simulations were conducted by decreasing the top ball size (100% at 50.8 mm) in the second mill however 4.7 tph (112.8 tpd) of 2mm particles (> 2000µm) remains without being breakage.

Modelling and Simulation of the Grinding Circuit at ‘El Pilon’ Mine
JKMRC Conference 2001
192
Grinding Circuit in Serie
In this design the first mill (8.5x12 ft) is operating in closed circuit with a classification stage and the second mill (9x9 ft) is in inverse closed circuit with classification (Figure 5). As showed in Figure 5, the first cyclone overflow is combined with the second mill discharge and fed into a second classification stage to avoid overgrinding. Then, the second cyclone overflow is sent to the leaching process.
CIRCUIT: GRINDING IN SERIE WINDOWS: Top - TPH Solids Bottom - % Solids
1 Help 2 Operatn 3 Error 4 Test 5 Unit 6 DrawCot 7 Stream 8 9 UntFeed 0 RunSIM
F 33.395.6
183.79.8
114.41.3
183.79.8
183.54.5
150.77.0
33.323.7
114.41.3
80.280.0
80.281.4
33.319.0
P
CYCLONED20 CYCLONE
D20
MARCY BALL MILL8´5”x12´
BALL MILL9´x9´
TO LEACHINGPROCESS
FEED
Figure 5 – Simulated grinding circuit in serie at ‘El Pilon’ mine
The simulations in this flowsheet were conducted using the following relationship in ball size: (1) first mill (8.5x12 ft), 70% at 76.2 mm and 30% at 50.8mm, and (2) second mill (9x9 ft), 100% at 50.8mm. The simulated results are presented in Table 4. As observed in this table, this simulated design achieves the objectives of ‘El Pilon’ mine. However, under the conditions of 19.0% of solids in the first cyclone overflow, the recycle load represents a physical limitation for a stable operation in the first mill and reduces the amount of solids in the regrinding circuit. Although, this simulation was conducted at 24% of solid in the first cyclone overflow, is strongly suggested to increase the pulp density in the first cyclone feed up to 68% of solids. Unfortunately, high pulp density in the cyclone feed may increase the maintenance costs and this is a subject that needs to be evaluated.

Modelling and Simulation of the Grinding Circuit at ‘El Pilon’ Mine
JKMRC Conference 2001
193
Table 4 – Simulation results of the grinding circuit in serie
700 tpd 800 tpd
Stream Solid Flow
Rate, tph %Solids
% Passing
75µm
Solid Flow
Rate, tph %Solids
% Passing
75µm
Ball Mill 8.5x12 Circuit
BM Discharge 182.0 79.7 13.0 216.0 80.0 11.4
Cyclone Overflow 29.2 19.0 56.6 33.3 19.0 53.9
Ball Mill 9x9 Circuit
BM Discharge 63.8 76.1 20.6 82.5 79.9 17.8
Cyclone Overflow 29.2 19.0 76.0 33.3 19.0 74.3
Selection of the New Grinding Design
The grinding circuit in serie showed the best performance as presented in Table 5. The proposed flowsheet achieves the objectives of ‘El Pilon’ mine by increasing both grinding throughput and fineness. This flowsheet increases the grinding throughput from 600 tpd to 700 tpd and increases the particle size in the final product from 57% to 75% passing 75µm.
Table 5 – Evaluation of the simulated flowsheets at ‘El Pilon’ mine
Objectives of ‘El Pilon’ mine Simulated Flowsheets
Grinding Throughput % Passing 75µm
Grinding in Serie
Grinding in Semi-Serie
Grinding in Parallel Without change
The grinding circuit in serie shows the following advantages compared with the other two simulated flowsheets:
• It is possible to increase the grinding throughput without affecting the particle size in the final product,
• The second mill can be operated with small ball size, which increase the fineness of the overall grinding circuit at ‘El Pilon’ mine.

Modelling and Simulation of the Grinding Circuit at ‘El Pilon’ Mine
JKMRC Conference 2001
194
GRINDING CIRCUIT IN SERIE – ITS VALIDATION AND OPERATION
Based on the analysis of the simulated flowsheets, the grinding circuit in serie was implemented in the plant. New survey was conducted in the grinding circuit which was used to validate the simulation results. The new sampling showed that this circuit is milling 800 tpd and the particle size in the final product is 76% passing 75µm.
Figure 6 shows the predicted particle size distribution using the JKSimMet computer package and the real particle size distribution based on the survey data of the grinding circuit in operation. The new particle size distribution in the circuit feed is similar with that distribution used in the simulations.
Particle Size, mm
Cum
ulat
ive
% P
assi
ng
40
50
60
70
80
90
100
0.01 0.1 1.0 10.0 100.0
Size Distribution of Final Grinding Product
Survey: 809 tpd, 20.1% Solids
Simulation: 800 tpd, 19.0% Solids
Figure 6 – Comparison of the particle size distribution of the final product in the grinding circuit in serie at
‘El Pilon’ mine
The real operation (survey data) and the simulated values are in 10% of confidentially. Therefore, the JKSimMet computer simulator proves a valuable tool in the design of new grinding circuit.
Optimisation
Optimal parameters were optimised to maintain a more stable operation in the implemented grinding circuit using the JKSimMet computer simulator. The effects investigated in the optimisation exercise were; (1) ball size in the second ball mill, (2) maximum grinding throughput in the grinding circuit in serie, and (3) optimal dimensions of vortex and apex in cyclones.
The simulation results shows that the following ball size should be used in mills; 100% at 76.2mm in the first mill (8.5x12 ft) and 100% at 38.1mm in the second mill (9x9 ft). Additional simulations were conducted by changing the ball size in the second mill as presented in Figure 7.

Modelling and Simulation of the Grinding Circuit at ‘El Pilon’ Mine
JKMRC Conference 2001
195
New Feed Flowrate, tph
% P
assi
ng 2
00 m
esh
(75
µµ µµm)
Cyc
lone
1 U
nder
flow
, tph
80
100
120
140
160
180
200
60
65
70
75
80
85
800 850 900 950 1000
Ball Size Effect in Regrind BallMill (9x9 ft)
2” (50.8 mm)
1 1/2” (38.1 mm)
33.3 35.4 37.5 39.6 41.7
New Feed Flowrate, tpd
Figure 7 – Effect of ball size in the second mill of the grinding circuit in serie
As you may see in Figure 7, the ball size in the second mill has control of the particle size in the final grinding product. As expected, by increasing the grinding throughput a decrease in the particle size is observed. However, the first cyclone underflow flowrate increases as increase the grinding throughput. Again, this could be a limitation in the first ball mill performance. To avoid this effect, a large percent of solid in the cyclone feed and vortex diameter would be used instead.
By decreasing the ball size in the second mill from 50.8 mm to 38.1mm an increase of 4.0% is observed. The result highlights that the grinding circuit would be able to operate up to 1000 tpd keeping the particle size in the final product as desired. However, the maximum percent of solids in the first cyclone and the pump capacity should be investigated.
CONCLUSIONS
A grinding model developed at ‘El Pilon’ mine using JKSimMet (Version 4) was used to simulate three different milling designs. Simulation shows that the grinding circuit in serie has better advantages in terms of milling performance than the grinding circuit in parallel or the grinding circuit in semi-serie. An increase of grinding throughput from 600 tpd to 800 tpd was achieved by implementing a grinding circuit in serie as well as an increase of the grinding fineness from 57% to 75% passing 75µm.
This case study shows how JKSimMet can be used to design grinding circuit accuracy and highlights that this computer simulator is a powerful tool in the optimisation of comminution circuits.

Modelling and Simulation of the Grinding Circuit at ‘El Pilon’ Mine
JKMRC Conference 2001
196
ACKNOWLEDGEMENTS
The author would like to express his appreciation to the following parties for their help and support to make this research work possible:
• Mr. Hector Davila-Santos, Mr. Armando Ibarra-Amaya and Mr. Sergio Oliva-Rangel for their helpfulness in making ‘El Pilon’ visits possible
• Prof. Alban J Lynch and Prof. Alejandro Lopez-Valdivieso for their supervision
• Ing. Armando Guerrero and laboratory staff for invaluable assistance in performing the testwork
• Consejo Nacional de Ciencia y Tecnologia (CONACyT) of Mexico for Juan L. Reyes-Bahena’s scholarship Grant No. 66764/137256.
REFERENCES
Broussand, A., Connil, P., and Fourniguet, G., 1988, “USIM: An easy to use industrial simulator for mineral
processing plants”, Computer Applications in the Mineral Industry, ISBN 906191 7603, Balkema Rotterdam,
137-145.
CANMET, 1989. SIMBAL Brochure, CANMET, 552 Booth Street, Ottawa, Ontario, Canada, K1A-0G1.
Herbst, J.A., Schena, G.D. and Fu, L.S., 1989. “Incorporating state of the art models into a mineral processing plant
simulator”, Trans. Instn. Min. Metall., 98, C1-C11.
JKTech., 1989. JKSimMet User Manual and Supplementary Information Manual (Version 4, Release 1), JKTech,
Indooroopilly, Qld., Australia.
Lynch A.J. and Morrell S. 1992. The understanding of comminution and classification and its practical application in
plant design and optimisation. Comminution: Theory and Practice, Ed. Kawatra, 405-426 (AIME).
Lynch, A.J. and Rao, T.C., 1975. “Modelling and scale-up of hydrocyclone classifiers”. In Proceedings XI Int Min
Proc Congress, Cagliari, Paper 9.
Nageswararao K. 1978. Further developments in the modelling and scale up of industrial hydrociclones. PhD Thesis,
University of Queensland (JKMRC).
Whiten, W.J., 1976. “Ball mill simulation using small calculators”. In Proceedings AusIMM, 258, 47-53.


![Intermediate-Scale Full State Quantum Circuit Simulation ...people.cs.uchicago.edu/~xinchuan/WU_APS_talk.pdf · Block [3] Compressed ... Project Number: 17-SC-20-SC, a collaborative](https://img.pdfslide.net/doc/110x75/5f79e0771659035dd6179eb5/intermediate-scale-full-state-quantum-circuit-simulation-xinchuanwuapstalkpdf.jpg)