Embed Size (px)
Citation preview

3 1 1
JN8/J M*. 3 8 ^ "
RETAIL CROWDING: IMPACT OF
MERCHANDISE DENSITY ON
STORE IMAGE
DISSERTATION
Presented to the Graduate Council of the
University of North Texas in Partial
Fulfillment of the Requirements
For the Degree of
DOCTOR OF PHILOSOPHY
By
Nita L. Paden, B.S., M.B.A
Denton, Texas
December, 1993

Paden, Nita L., Retail Crowding; Impact of Merchandise
Density on Store Image. Doctor of Philosophy (Marketing),
December, 1993, 127 pp., 8 tables, 3 illustrations,
bibliography, 82 titles.
Store image research has attempted to identify factors
contributing to formation of positive or negative
perceptions of stores by consumers. These factors include
tangible and intangible elements. Of the tangible factors,
store atmosphere (including store layout and congestion
level) is often identified as contributing to store image.
Intangible factors influencing store image include
emotional or psychological reactions that consumers have in
response to various tangible store factors. One of these
emotional responses is retail crowding. Retail crowding is
a state of psychological stress occurring in consumers in
response to perceived high density levels in stores.
Crowding literature suggests that environmental cues,
including layout and density level, contribute to this
stress level.
The overall purpose of this study was to expand on
current research by incorporating the concept of retail
crowding with store image research. This research focused
on the need to understand the influence of specific
environmental cues on crowding and the resulting store image

by empirically testing the importance of merchandise density
on retail crowding. A second purpose of the study was to
explore the importance of retail crowding in the formation
of store image by testing the proposition that perceived
crowding has considerable impact on store image.
Subjects were shown a series of slides depicting
various merchandise density levels in store settings, and
measurements of crowding and store image were recorded.
ANOVA, adjusted for repeated measures on each subject, was
used to analyze the data relating merchandise density and
retail crowding, and merchandise density and store image.
ANCOVA adjusted for repeated measures was used to analyze
the data relating retail crowding and store image.
The findings support the hypothesized relationships and
suggest that perceived crowding is different at different
levels of merchandise density, and store image is impacted
by experienced crowding. These findings have implications
for store management in terms of merchandise layout and
creation of store image, and contribute to store image and
retail crowding theory by confirming the proposed
relationship.

ACKNOWLEDGMENTS
Many people contributed to the successful completion of
this study. I would like to thank my committee members who
were very supportive and offered encouragement and hope
throughout my program. Specifically my appreciation goes
to: Dr. Barbara Coe for efficient guidance and sincere
support; Dr. Janice Gygi and Dr. Ray McAlister for providing
insight and for helping me to keep things in perspective;
Dr. Ken Thompson for analytical and technical support and
encouragement. Thanks also go to Dr. Ellen Flottman and Dr.
Susan Eve for serving as University committee members.
My gratitude also goes to James Yarbrough, UNT
Computing Center, for his friendship and for unselfishly
providing many hours of assistance during data analysis. I
am also grateful to the managers of JCPenney, Dillard's,
Foley's, Pier One and K-Mart for allowing me access to their
stores.
This endeavor would not have been possible without the
encouragement of my mother who continuously provides me with
love and support regardless of what I attempt. I am also
indebted to my dear friends and family, especially Donna,
Roxanne and Larry, for giving me the inspiration and courage
to face this challenge in the first place.
111

TABLE OF CONTENTS
Page
ACKNOWLEDGMENTS iii
LIST OF TABLES vi
LIST OF FIGURES vii
Chapter
I. INTRODUCTION 1
The general problem area Purpose of the study-Research questions Significance of the study Expected results Limitations of the study-Organization of the dissertation
II. THEORETICAL BACKGROUND 17
Model of the store image formation process Theoretical background - store image Theoretical background - retail crowding The extended model of retail crowding
III. METHODOLOGY 32
Introduction Hypotheses A model of crowding and store image formation Environmental cues Interpretation of cues Perceived and affective density-Experienced retail crowding Outcome Image formation Image modification Reinforcement Adaptive strategies The research design
The sample Questionnaire development Slide selection Pre-tests
iv

The experiment Statistical analysis
IV. RESULTS OF THE EXPERIMENT 65
Introduction Within subjects design/repeated measures Tests of assumptions Results - hypothesis 1 Repeated measures analysis of covariance Tests of assumptions Results - hypothesis 2 Results - hypothesis 3 Summary
V. DISCUSSION AND IMPLICATIONS 82
Introduction Merchandise density/retail crowding Relationship Retail crowding/store image relationship Merchandise density/store image relationship Managerial implications
Merchandise arrangement and layout Research implications and suggestions for Future research
APPENDIX
A. SLIDE SORTING FORM 108
B. SLIDE MEANS AND STANDARD DEVIATIONS 110
C. IMAGE PRETEST 1 112
D. IMAGE PRETEST 2 114
E. QUESTIONNAIRE 116
REFERENCES 121
v

LIST OF TABLES
Table Page
I. Descriptive statistics - crowding 68
II. K.S. - Lilliefors scores - crowding 69
III. ANOVA source table - hypothesis 1 72
IV. Cell means 73
V. Descriptive statistics - store image 76
VI. K.S. - Lilliefors scores - store image 76
VII. ANCOVA source table 78
VIII. ANOVA source table - hypothesis 3 79
V I

LIST OF FIGURES
Figure Page
1. Model of the store image formation process 18
2. An extended model of retail crowding 30
3• A model of retail crowding and store image formation 36
VI1

CHAPTER ONE
INTRODUCTION
The General Problem Area
The store environment that surrounds a retail shopper
is not neutral (Marfcin, et al. 1976). Rather, elements of
the store environment produce positive or negative
perceptions in the consumer and may manifest themselves in
an image formation about the store, as well as in possible
changes in buying behavior. If the perception of the
environment is positive, i.e. the shopping experience is
pleasant, then that aspect of the store projects a positive
or high image in the mind of the consumer. Conversely, if
the environment is perceived in a negative light, the
resulting image of the store is likely to be negative or
low. The high or low images that are formed may result in
either continuation of current shopping behavior or in a
change in that behavior.
Researchers focusing on store image research have
attempted to define the concept of store image and, in doing
so, have identified many factors in the store environment
that contribute to the formation of positive or negative
perceptions by consumers. These factors have included both
tangible and intangible characteristics that a consumer
1

2
perceives to be present in the store (Jenkins and Forsythe
1980) .
One tangible factor that has been repeatedly identified
as contributing to store image is store atmosphere
(Lindquist 1980). In a study of department store image
components, store atmosphere was identified as one of the
most important components contributing to store image (Berry
1969) . Store atmosphere typically includes physical store
layout and congestion levels created by architectural
dimensions including ceiling height, partitions and walls,
as well as more flexible elements such as fixturing,
displays and merchandise arrangement. Retailers design and
arrange these elements of store environment and that
arrangement of space in turn affects and shapes consumer
behavior (Markin, et al. 1976).
Because consumers respond to them, the tangible
elements in the store environment are often referred to as
environmental cues. Mazursky and Jacoby (1986) examined the
role of environmental cues in store image formation. Their
study proposed that the consumer is exposed to realities
(environmental cues) that are partly controlled by the
retailer. Retailers manipulate cues in an attempt to
enhance sales and create an atmosphere that supports an
image. From these cues or realities, perceptions and
beliefs about the store are formed and image formation is
initialized.

3
Intangible elements have also been identified as
contributing to store image as perceived by the consumer.
This type of psychological or emotional response has
typically included such elements as a sense of belonging,
friendliness of the store, and other subjectively judged
perceptions of the store (Mazursky and Jacoby 1986). Store
image has also been referred to as being "in the mind" of
the consumer as opposed to being a property of the store
(Villanova, et al. 1990). One emotional response to store
environments that has been identified is retail crowding
(Harrell, et al. 19130) . Research on crowding has suggested
that tangible environmental cues contribute to a "state of
psychological stress" to which consumers respond. Like
store image research, retail crowding research has suggested
that environmental factors or cues, including layout and
congestion, contribute to an emotional response and result
in some sort of outcome including postpurchase evaluation of
the store or behavior modification (Eroglu and Harrell
1986) . Situational factors, including physical
surroundings, have been shown to play a role in the response
and behavior of consumers (Belk 1975). Response may take
the form of a positive or negative evaluation of the store
or satisfaction/dissatisfaction with the shopping experience
and a corresponding general perception of the store. These
responses may be moderated by a number of factors including
the predisposition or mood of the consumer (Herrington and

4
Capella 1991), time constraints or the consumers shopping
motives (Eroglu 1985).
The condition of crowding has been investigated in the
psychology discipline, usually in relation to high density
population conditions or in terms of physical space
requirements. Crowding often occurs in response to the
negative perception of high density (Rapoport 1976; Stokals
1972; Stokals, et al. 1973). That is, when individuals
perceive themselves to be in a dense environment, this
feeling of stress, called crowding, may occur. In retail
stores, crowding may be related to density in terms of
numbers of people, or may be in response to other, more
controllable, tangible elements in the store setting such as
density of fixturing and merchandise arrangement.
There are two major types of density. First, perceived
density is the subjective estimate of the space available
and its organization. Most prior research has been in the
area of social psychology and has investigated density in
terms of the number of people in the available space. The
second type of density, affective density, is the evaluation
of perceived density against subjective standards and
against desired levels of information and interaction
(Rapoport 1976). Individuals observe the environment and
evaluate the environment in terms of density levels that
they judge to be acceptable. Thus, affective density is the
subjective determination of whether perceived density

5
facilitates or inhibits the attainment of goals (Eroglu and
Harrell 1986).
The level of perceived and subsequent affective density-
may be influenced by various characteristics in the physical
environment. Considerable research on density levels has
been conducted in the environmental psychology field. Moos
(1986) suggested that the extent that an individual feels a
space is inadequate is moderated by the interaction of
physical elements with social and personal factors. Many
studies on density levels investigate relationships between
objects, people and available space, and suggest that these
relationships influence the behavior of individuals
(Rapoport 1976; Saegert, et al. 1976; Moos 1986). In retail
stores, the level of perceived and affective density may be
a function of various in-store objects/space relationships
such as aisle width, number of fixtures, and compactness of
merchandise, as well as a function of numbers of people in
that space. Certainly it is possible for the consumer to
make a judgment about density level based on merchandise
arrangement whether or not other consumers are a part of
that density. The issue is whether merchandise arrangement
facilitates or inhibits the attainment of the individual's
shopping goals. If the consumer's response to the density
level is negative and that consumer feels constrained,
stress, i.e. crowding, occurs.

6
As described, both image formation and crowding appear
to be in response to environmental cues. Further, both
research areas describe emotional or psychological responses
to physical conditions in the store environment. And, both
store image and retail crowding research have investigated
factors that moderate consumer responses to physical
conditions in the store. But despite the apparent linkage
between these two streams of research, literature has not
described how store image and retail crowding relate to each
other. There is a need for a delineation of this
relationship. Further, because both responses are
attributed to environmental cues, additional investigation
of the impact of specific cues and their influence on
crowding and image formation is needed.
Purpose of the Study
The first purpose of the research focused on the need
to better understand the influence of specific environmental
cues on perceived retail crowding and the resulting store
image. Because merchandise arrangement is so basic to all
types of retailers, consumers' response to merchandise
density seemed to be an important environmental cue for
initial investigation. Previous studies on crowding have
predominantly addressed density in terms of numbers of
people in a space (Eroglu and Machleit 1990). However, the
concept of density, the amount and organization of space.

7
may be applied to the amount of merchandise and its
arrangement relative to the amount of space available. The
first purpose of the research, then, was to explore and
empirically test th€i importance of one environmental cue--
merchandise density--on retail crowding.
A second purpose of the study was to explore the
importance of retail crowding in the formation of retail
store image. Therefore, a goal of this study was to expand
on current research by incorporating the concept of retail
store crowding with the store image research. Both retail
crowding research and store image research address the
importance of physical and psychological cues as a
determinant of some sort of outcome, such as image
formation, or of consumer behavior modification. What is
unclear from earlier research is how retail crowding, as an
emotional response to environmental cues, may influence
store image formation and change. In support of this
exploration, a third purpose for the study was to test
empirically the proposition that perceived crowding has
considerable impact on store image as perceived by the
consumer.
Research Questions
The described goals suggest two questions that were
addressed by the study. The first question was: Do
different merchandise levels contribute to differences in

8
perceived crowding? This question may be explored by
measuring consumers' reaction to different merchandise
density levels and addresses the first purpose of the study:
to improve the understanding of how specific environmental
cues influence retail crowding and resulting store image.
A second research question involved the relationship of
crowding and store image perceptions: Does the experienced
crowding that results from merchandise density influence the
consumers' perceived store image? Investigation into this
question helped to accomplish the second goal of the study
which was to explore the relationship of retail crowding and
store image. Hypotheses developed from these two major
research questions are presented in Chapter Three.
Significance of the Study
The retailing industry is faced with numerous external
environmental factors that make survival difficult and
failure rates high. These factors include a slow growth
economy, intense competition, as well as changing consumer
tastes and attitudes.
Given these conditions and the changing competitive
structure in the retailing industry, retailers are
increasingly concerned with the image they are conveying and
with consumers' response to that image. The combination of
these factorsf plus the lack of differentiation in products
are mandating the demise of those retailers who are not
9
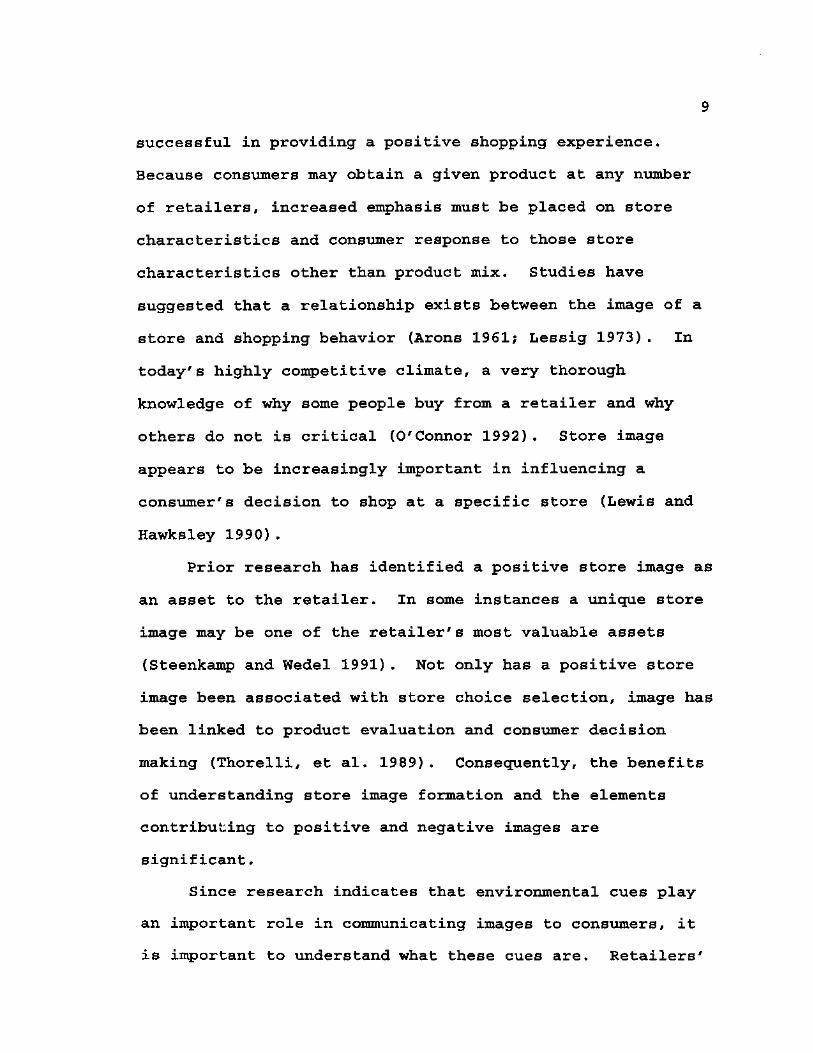
successful in providing a positive shopping experience.
Because consumers mciy obtain a given product at any number
of retailers, increased emphasis must be placed on store
characteristics and consumer response to those store
characteristics other than product mix. Studies have
suggested that a relationship exists between the image of a
store and shopping behavior (Arons 1961; Lessig 1973) . In
today's highly competitive climate, a very thorough
knowledge of why some people buy from a retailer and why
others do not is critical (O'Connor 1992). Store image
appears to be increasingly important in influencing a
consumer's decision to shop at a specific store (Lewis and
Hawksley 1990).
Prior research has identified a positive store image as
an asset to the retailer. In some instances a unique store
image may be one of the retailer's most valuable assets
(Steenkamp and Wedel 1991). Not only has a positive store
image been associated with store choice selection, image has
been linked to product evaluation and consumer decision
making (Thorelli, et al. 1989). Consequently, the benefits
of understanding store image formation and the elements
contributing to positive and negative images are
significant.
Since research indicates that environmental cues play
an important role in communicating images to consumers, it
is important to understand what these cues are. Retailers'

10
marketing strategies require understanding the attributes or
store features that are most critical in affecting patronage
behaviors (Bearden 1977). Because the consumer is exposed
to a myriad of cues, understanding will require examining
the cues individually. Many of the cues are controlled by
the retailer. For example, the retailer determines
arrangement of fixturing, displays, aisle width, lighting
levels and arrangement and density of the merchandise. This
manipulation of cues in the store environment is done in an
attempt by the retailer to enhance sales and support or
change their image. Every established retailer has a store
that attracts the existing clientele, but can be manipulated
through its physical and psychological store characteristics
(Lewis and Hawksley 1990) to attract additional targeted
groups. So if the retailer wants to change image, as stores
such as JCPenney and K-Mart have attempted, or if some other
strategic action is to be attempted, it would be useful to
know what elements within the control of the retailer could
be manipulated that would result in image change. This is
particularly important since creating or changing an image
is often a prerequisite to motivating consumers to change
their existing shopping behavior (Nevin and Houston 1980).
The extent that the consumer is loyal to the store also
plays a role in ease of image change by further complicating
the image change process. Additionally, an image change

11
strategy presents a great risk for the retailer, since image
change occurs very slowly and is often unsuccessful.
Understanding which of the controllable elements are
resulting in negative responses by the customer has very
significant implications for retailing strategies. While
non-controllable variables, including elements of the
competitive environment, impact the retailer's ability to
manage successfully, the controllable elements provide a
means for the retailer to affect consumer shopping behavior.
Store-induced pleasure has been shown to be an important
determinant of approach-avoidance behaviors within a store,
including spending behavior (Donovan and Rossiter 1982).
That is, if retailers can create pleasurable experiences by
manipulating various combinations of store elements,
consumers may be more inclined to have positive attitudes
toward that store. In addition, elements of the store's
environment may lead to positive assessments of other store
attributes like overall service. It is, therefore,
important to understand the specific store attributes that
contribute to positive store images.
Expected Results
Based on the review of earlier studies and initial
information gathering, there were two major expected
results. First, results were expected to support a
relationship between various levels of merchandise density

12
in retail stores and the degree of perceived crowding felt
by the consumer. While most of the crowding literature has
been examined in terms of numbers of people in a space, the
image literature suggests that the physical layout and
arrangement of merchandise contributes to positive and
negative perceptions about the store. If those perceptions
are negative, retail crowding is likely to occur.
Second, results were expected to support a relationship
between the degree that retail crowding is perceived and the
image level the consumer associates with that store.
Informal interviews suggested that most people associate
crowded stores with unpleasant shopping experiences. Some
people interviewed said they refused to enter a store that
looked crowded or congested. It would seem, then, that
crowded stores would evoke negative images in the minds of
the consumer.
Limitations of the Study
There are four limitations associated with the proposed
study. First, response to retail crowding may vary by store
type. Cardoza (1974) found that store images differ across
store type and product class. The present study exposed the
respondent to merchandise density levels in two distinct
store types: a national discount store and a regional
department store. Because this was an exploratory
examination of the store environment, it was decided to
13
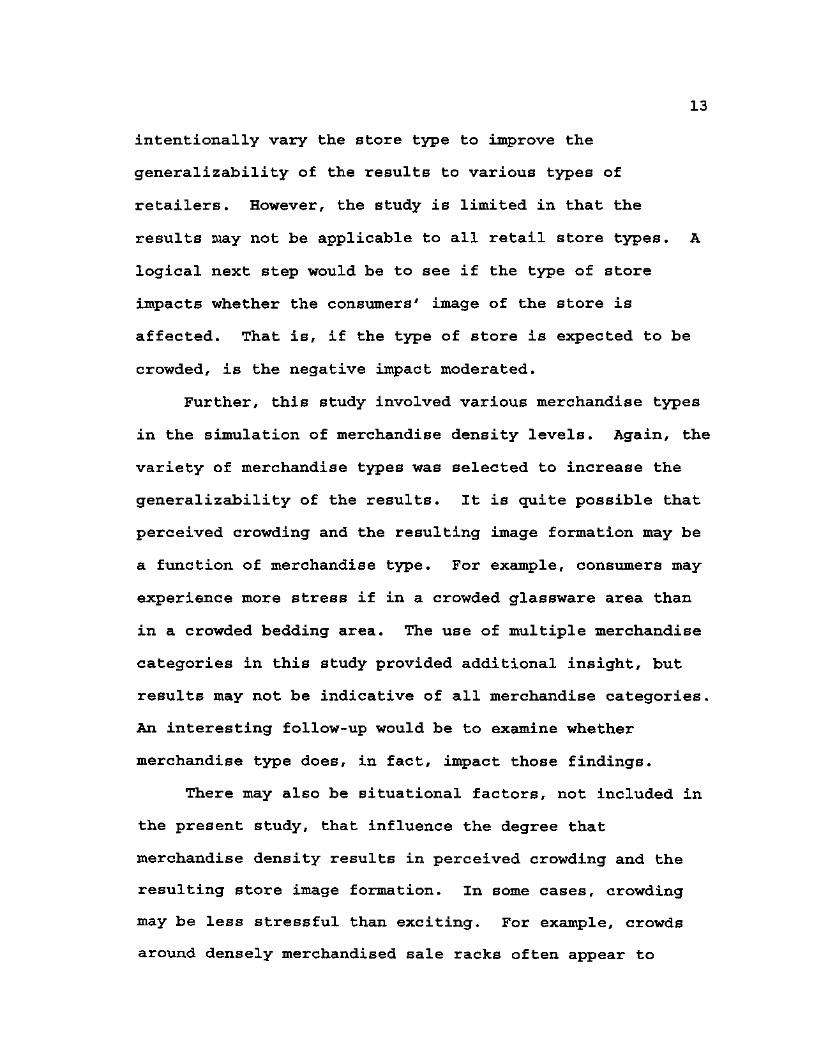
intentionally vary the store type to improve the
generalizability of the results to various types of
retailers. However, the study is limited in that the
results laay not be applicable to all retail store types. A
logical next step would be to see if the type of store
impacts whether the consumers' image of the store is
affected. That is, if the type of store is expected to be
crowded, is the negative impact moderated.
Further, this study involved various merchandise types
in the simulation of merchandise density levels. Again, the
variety of merchandise types was selected to increase the
generalizability of the results. It is quite possible that
perceived crowding and the resulting image formation may be
a function of merchandise type. For example, consumers may
experience more stress if in a crowded glassware area than
in a crowded bedding area. The use of multiple merchandise
categories in this study provided additional insight, but
results may not be indicative of all merchandise categories.
An interesting follow-up would be to examine whether
merchandise type does, in fact, impact those findings.
There may also be situational factors, not included in
the present study, that influence the degree that
merchandise density results in perceived crowding and the
resulting store image formation. In some cases, crowding
may be less stressful than exciting. For example, crowds
around densely merchandised sale racks often appear to
14
stimulate consumers to join the crowd. Additionally crowded
conditions at special events, while typically dense
settings, may be considered to be part of the attraction or
excitement of the event.
Another interesting aspect of the retail crowding/store
image relationship is the cultural differences perspective.
In countries or areas of countries where personal space has
been reduced because of dense populations and close living
conditions, consumers may perceive a lesser degree of
retail crowding because they are more accustomed to dense
spaces. Because this study was conducted using domestic
firms, the results may not be generalizable to retailers
operating in foreign countries.
Finally, by the nature of the design of this study,
only one environmental cue, merchandise density, was
investigated. While this limits this study, individual
investigation of the specific cues that create responses in
retail consumers is necessary to gain understanding of this
store environment/behavioral response relationship.
Organization of the Dissertation
The following chapters will present a review of the
research foundation for the study, a proposed model linking
the retail crowding and store image research streams, the
proposed experiment and analysis, and recommendations.

15
Chapter two will present a review of supporting
literature in the areas of store image and retail crowding.
Different views and definitions of store image will be
presented, as well as previously examined store image
components. From the retail crowding literature, a
description of relevant research from psychology and
definitions of both density and crowding will be included.
Two key models from earlier studies will be described
and serve as the basis for the proposed model. Mazursky and
Jacoby's (1986) "Model of the Store Image Formation Process"
is offered as a key contribution to the present study. The
second model, Eroglu and Harrell's (1986) "Extended Model of
Retail Crowding," seen as fundamental to the present study,
is described in detail in chapter two.
In chapter three, the objectives and resulting research
hypotheses for the study are presented. In addition, a
"Model of Retail Crowding and Store Image Formation" is
presented, including a description of each of the components
of the model. A third section outlines the research design,
including sample selection, questionnaire development, the
slide selection process, pretests and the proposed
experiment. Finally, the planned statistical analysis,
including the proposed technique and potential problems, are
described in the conclusion of chapter three.
Chapter four will present the results of the
experiment, and the conclusions, recommendations and

16
suggestions for future research will be offered in chapter
five.

CHAPTER TWO
THEORETICAL BACKGROUND
Two models, the "Extended Model of Retail Crowding"
(Eroglu and Harrell 1986) and Mazursky and Jacoby's (1986)
"Model of the Store Image Formation Process," provide the
foundation for the present study. This chapter will provide
descriptions of these two models, and additional supportive
literature in the store image and retail crowding areas.
Model of the Store Image Formation Process
The process of store image formation is described in a
model developed by Mazursky and Jacoby (1986) . The model is
based on the authors' definition which describes store image
as "a cognition and/or affect which is inferred either from
a set of ongoing perceptions and/or memory inputs attaching
to a phenomenon and which represents what that phenomenon
signifies to the individual." This definition suggests that
store image is internal to the customer, either
psychologically or emotionally as a response to some
stimuli. The phenomenon referred to in the definition is a
part of the model called objective reality [see figure 1].
The objective reality of the store includes those features
and characteristics of the store which stimulate the
17

18
-H ft.
W I H
won HMO
rt fi n
Sz>z Z H W H
0)
So 0) H
U Q M OS H j N a Bl O H < a* u w u.
„ 09 O «a * wh • ~ O O W Ofi • u 9 m *J N oQ u H 3 * o H < p u 5 a. o w u. w
H
u h bl

19
consumer to respond. These characteristics will include
store specific attributes such as location, appearance, and
merchandise, as well as details of the store such as the
price of a category of merchandise, its arrangement and
appearance, and sizes available.
The response to these cues or stimuli in the store is
depicted in the model as subjective reality, and may be in
the form of cognitions, affect or both. According to the
model, as information based on perceptions of the elements
in the objective reality are considered and interpreted,
inferencing about the store occurs and an overall store
image is formed in the mind of the consumer.
Theoretical Background - Store Image
Literature appears to support the idea of image as a
subjective response to objective stimuli. Attention was
initially drawn to store image when Martineau (1958)
described a force other than functional factors, i.e.
location, price and merchandise assortment, that contributes
to the selection of one store over another. This force is
described as a personality or image that is formed partly by
functional characteristics and partly by the consumer's
sense of the store's psychological attributes. Image was
viewed as the consumer's response to attributes of the
store. Early studies, while alluding to an intangible

20
aspect of store image, focused mainly on the tangible
elements that contribute to the formation of store image.
Subsequent research expanded the view of image to
include the concept of intangible and tangible factors as
contributors to store image formation. Studies describe the
store in terms of complex meanings and a total
conceptualization that a person associates with a store
(Arons 1961; Kunkel and Berry 1968). The idea of store
image consisting of tangible elements (functional
attributes) and intangible elements (psychological elements)
is supported in many definitions. For example, image has
been described as a combination of tangible and intangible
stimuli emanating from various personal and impersonal
communication sources associated with a store (Cox 1974).
Oxenfeldt (1974-1975) defined store image as a "synergistic
phenomenon representing interaction among characteristics"
and as a combination of factual and emotional elements.
While the tangible elements such as location and merchandise
play an unquestionable role in the image of the store,
intangible factors and the psychological and emotional
responses to both types of elements make a significant
contribution to overall store image.
The consensus in the literature is that store image is
formed both in response to tangibles, such as products, and
by a psychological process that combines attitudes, opinions
and symbolic meanings to the intangible elements of the

21
store (Dornoff and Tatham 1972; Jenkins and Forsythe 1980;
Villanova, et al. 1990). People develop images of stores by
relating opinions and attitudes about tangible and symbolic
characteristics of the store (Dickson and MacLachlan 1990).
O'Connor (1992) described retail image as having two
components. The first component is based on factual
experience. The other element is attitudinal which may or
may not have a relation to the facts. This attitudinal or
emotional part of store image is the hardest to affect.
Further, the attitudinal element may be different for the
retailer, the consumer and even the store's personnel.
The literature also describes store image in terms of
reinforcement of prior beliefs and experiences with the
store. For example, Kunkel and Berry (1968) said store
image is a conceptualized reinforcement that the consumer
associates with shopping at a particular store. Consumers
perceive the image of the store as a result of reinforcement
of previous experiences. If the experience is positive, a
positive image results and tendency toward store loyalty may
increase. If the experience is negative, avoidance of the
store may occur (Berry 1969).
The reinforcement may also come in the form of
congruence with the customers self image. In a study on
imageries of department stores, Rich and Portis (1964) noted
that many customers select stores whose overall image best
fits the image they hold of themselves. This finding is

22
supportive of Arons (1961) who showed that people associate
certain types of consumers with certain types of stores.
In some studies, the response to the dimensions of the
store is described as attitude formation (Doyle and Fenwick
1974-1975). Using Fishbein's multiattribute attitude model,
Doyle and Fenwick (1974-1975) describe image as an
evaluation by the consumer of all "salient aspects of the
store as individually perceived and weighted. Likewise,
James, et al. (1976) identified store image as a set of
attitudes based on the store attributes that the consumer
decides are important. Since attitudes are learned, the
experiences within the store should strongly influence the
image that is formed in the mind of the consumer (James, et
al. 1976).
Throughout prior research, attempts have been made to
identify the specific attributes or characteristics of a
store that create these responses in consumers. Both
functional or tangible elements and psychological or
intangible elements are included in most investigations of
store image. One of the characteristics consistently
associated with consumer responses to the store is the
arrangement of merchandise and fixtures. Martineau (1958)
suggested that layout and store architecture, as well as
symbols and colors, advertising and sales personnel, help to
create the personality of the store. Merchandise, price
appeal and shopping convenience have also been identified as

23
store image attributes (Rich and Portis 1964). In the Rich
and Portis study, shopping convenience included efficient
store layout and display.
One of the first "lists" of store image components was
developed by Kunkel and Berry (1968). This list consists of
twelve tangible and intangible elements. In a test of the
appropriateness of the list, store atmosphere was identified
as one of the most important image components for the
overall population. Store atmosphere was defined to include
the layout of the store, external and internal decor,
merchandise display, congestion level and the prestige of
the merchandise and overall store. Subsequent
investigations of store image have typically included and
confirmed that store atmosphere is significant as a
contributor to image formation (Bearden 1977; Berry 1969) .
Because of the many studies conducted on factors
contributing to store image development, several
combinations of store image attribute lists have been
compiled. A framework arranged around nine image/attitude
attributes separated store atmosphere from physical
facilities (Lindquist 1974-1975). Under this framework,
physical facilities included store layout, aisle placement
and width, carpeting and architecture. Store atmosphere was
described as the customer's feeling of warmth, acceptance or
ease while in the store environment. This division of
atmosphere from the physical aspects of the store is in

24
keeping with the concept of tangible versus intangible
elements and in keeping with the concept of image formation
as an emotional response to store attributes.
Mazursky and Jacoby's (1986) definition of store image
and subsequent model of image formation presented a
significant contribution by building on earlier research and
offering an explanation of the image formation process.
However, their explanation focuses on the information
processing aspect of image formation. Certainly, this type
of cognitive response is a part of how store images are
formed. Stores and store design project a tremendous amount
of information to the consumer (Markin, et al. 1976). But
their explanation may be expanded upon through investigation
of psychological and emotional responses to phenomenon in
the store environment. One such response is retail
crowding.
Theoretical Background - Retail Crowding
One response to environmental elements that has been
identified in the literature is crowding. Crowding is a
subjective state of psychological stress that occurs when a
person's demand for space exceeds the supply (Stokals 1972).
The condition of crowding has been investigated in the
psychology discipline, usually in relation to high density
population conditions or in terms of physical space
requirements. Crowding often occurs in response to the

25
negative perception of high density (Rapoport 1976; Stokals
1972; Stokals, et al. 1973). That is, when individuals
perceive themselves to be in a dense environment, this
feeling of stress, called crowding, may occur. In retail
stores the crowding may relate to density in terms of
numbers of people, but may also be in response to other
factors in the store.
Crowding is generally investigated in terms of density
which has been operationalized by increasing the number of
people holding space constant (Stokals 1972; Rapoport 1976),
or by decreasing space holding the number of people constant
(Lawrence 1974).
There are two major types of density. First, perceived
density is the subjective estimate of the number of people,
the space available and its organization. The second type
of density, affective density, is the evaluation of
perceived density against subjective standards and against
desired levels of information and interaction (Rapoport
1976) . Individuals observe the environment and evaluate the
environment in terms of density levels that they judge to be
acceptable. Thus, affective density is the subjective
determination of whether perceived density facilitates or
inhibits the attainment of goals (Eroglu and Harrell 1986).
Density may be viewed as an antecedent for the experience of
crowding (Stokals 1972). This type of density has been
investigated to a lesser degree than has perceived density.

26
In early studies other environmental elements were not
considered in determining density levels. Crowding is a
specific case of affective density where the individual's
response is negative and results in a level of stress.
Crowding may be conceptualized at the same psychological
status as other emotions (Worchel and Teddlie 1976) . The
individual may then attempt to alleviate that stress through
various behaviors.
Attempts have been made to understand when density
conditions result in the experience of crowding. The extent
that the individual believes they have control over the
situation is one element associated with levels of perceived
crowding. In a study using an elevator for a setting, for
example, people standing in front of the "control" panel
felt less crowded than those individuals not able to reach
the panel (Rodin, et al. 1978). Langer and Saegert (1977)
incorporated control in a study on crowding by providing the
respondents with increased information about the effects of
crowding. Results confirmed that increased control over the
situation reduced the level of perceived crowding. Crowding
has been shown to be a response to loss of control (Schmidt
and Keating 1979). Also, information overload often occurs
under high perceived density resulting from a feeling of
lack of control (Milgram 1970). Individuals are likely to
attempt to regain some control and strive to reduce the
negative response. A more recent study investigated control

27
as a mediator of a consumer's emotional and behavioral
response to the physical environment in a service setting
and confirmed that both density and control play a role in
the pleasantness of the experience and the consumer's
approach-avoidance response to the setting (Hui and Bateson
1991).
The number of people in a space is not the only factor
that increases or decreases the level of perceived density.
Density goes beyond the number of people per unit to
relationships among people and objects (Rapoport 1976) .
Architectural design variables influence psychological
processes as well. Considerable support exists for the
notion that manipulation of environmental space impacts the
individual's perception of density and a corresponding
crowding level. Architectural design has been investigated
as a contributor to crowding. Architectural features such
as partitions, walls, openings in walls and partitions, as
well as use of lighting and sound modifying equipment or
insulation have been shown to impact the level of crowding
in individuals (Desor 1972). Studies have also shown that
when supply of space is reduced and/or limited, people feel
confined, restricted and believe the room to be smaller and
more uncomfortable (Stokals, et al. 1973). Also, the colors
used in a setting and the complexity of architectural
features have an influence on people (Baum and Valin 1977) .

28
A number of studies, based on behavioral constraint
theory suggest that psychological crowding results from a
belief that task performance is being restricted (Stokals
1972; Harrell et al. 1980). The individual may attempt to
alleviate the stress from that crowding through various
behaviors. If a reduction of space is perceived to make an
area cramped, disrupting behavior and arousing stress, the
individual may attempt to cope by withdrawing from the
setting (Baum and Valin 1977). If the stress level is
considered to be unpleasant enough, avoidance behavior may
occur. Stokals (1972) described crowding as a motivational
state directed toward minimization of the unpleasant
consequences of perceived constraints.
As can be seen from the above review of literature, the
vast majority of research on the topic of density and
crowding has occurred in the psychology discipline. Harrell
and Hutt (1976) provided one of the first applications of
crowding theory to consumer behavior. Early research on
retail crowding focused on postpurchase satisfaction and
repatronage intentions, however, without regard to the
environmental factors within the store and the possible
impact on perceived density. A model expanding on Harrell
and Hutt's research was developed by Eroglu and Harrell
(1986) . This model describes the factors that lead to
crowding and proposes likely consequences of retail
crowdingv "The Extended Model of Retail Crowding" (Eroglu

29
and Harrell 1986) provides the framework for the small
amount of research that has been conducted on this topic.
The next section provides an explanation of this framework.
The Extended Model of Retail Crowding
The crowding research developed in the environmental
psychology discipline has been applied to the retailing
field. "The Extended Model of Retail Crowding" (Eroglu and
Harrell 1986) describes relationships between various
antecedents and consequences of perceived density and
crowding [see figure 2]. The antecedents describe possible
causes of perceived density and crowding including
environmental cues, shopping motives, constraints and
expectations. These antecedents lead to cue utilization
which is the selection and interpretation of the cues (Olson
1972) . The way the cues are interpreted affects the level
of perceived density and crowding that the consumer
experiences. This is in keeping with studies on density and
crowding as influenced by architectural design. The last
part of the model depicts various consequences of perceived
density and crowding. One consequence described by the
model is that the consumer engages in adaptive strategies in
an attempt to alleviate the feelings of crowding. For
example, an adaptive strategy could be a reduction in
shopping time. Another consequence shown in the model is

e
tt
30
a o •H «
o
H
0)
ts u V ra
H « o
•H
X o • A H
Ol e
0 M U
•H « .U «
•
W CO O*
fO H V£> H w • I U t-U 1< « co W
Q J
o w
M •0 U>
• 6 CO <*4
r-J
3 «* iH 4J (31 ® 0 « U M «M
O
• « 8G 3 0 _ oa
31
the outcome. Three outcomes of retail crowding, as depicted
in the model are level of satisfaction with the store, level
of confidence in having obtained the best value, and
revision of shopping patterns.
The next chapter will present the proposed model
linking the previously discussed retail crowding and store
image streams of research. Hypotheses based on the research
questions addressed are offered, and the experiment is
described.

CHAPTER THREE
METHODOLOGY
Introduction
Following Eroglu (1985) and Mcclelland and Auslander
(1978), this study incorporated the use of color slides to
simulate a retail store setting. The validity of using
slides as a simulation of retail settings was established
recently by Bateson and Hui (1992). In a service setting,
their results suggested that slides "evoked the same
psychological and behavioral phenomena" as the actual
setting. ANOVAs and an ANCOVA were used to analyze the
effects of the independent variables in 2x2x2 factorial
designs. The following sections provide a detailed
description of the hypotheses, the experimental procedure
and analysis.
Hypotheses
The investigation of previous literature on store image
and retail crowding demonstrates a noticeable correspondence
in the suggested determinants of the two concepts. Each of
these streams of research has identified antecedents of the
phenomena and many of these antecedents, like environmental
cues, overlap. There appears to be a relationship between
32

33
store image and the retail crowding concept that has not
been addressed. One of the objectives of this study was to
bring together these two streams of research and present a
conceptual model describing the relationship. The research
questions presented in chapter one address the relationships
described by the proposed model. From these two questions,
several hypotheses emerge.
The first research question focused on the
understanding of specific environmental cues as they impact
retail crowding and store image. Many environmental cues
have been identified as contributing to both store image and
retail crowding. The importance of these cues lies in how
consumers are affected and how they interpret and respond to
those cues.
According to the Mazursky and Jacoby (1986) "Model of
Image Formation" described earlier, an overall image of the
store is formed once inferencing based on the interpretation
of the cues occurs. According to the proposed model, the
interpretation of cues in the form of merchandise density
levels, will result in a level of experienced crowding.
Image formation or change is described as one of the
outcomes of that retail crowding. So at a preliminary
level, the model suggests that differences in merchandise
density levels will result in differences in perceived
crowding levels. One of the goals of the study was to
explore and test empirically the effect of one environmental

34
cue, merchandise density, on the perception of crowding. On
this basis, and in keeping with the first research question,
the study examined the following hypothesis:
HI: Consumers' perception of retail crowding differs
when faced with high and low levels of merchandise
density.
Based on the level of crowding perceived by the
consumer, several outcomes may occur in respect to image
formation. One consequence of crowding, according to the
original model is referred to as outcomes. Outcomes include
an emotional evaluation of the shopping experience,
consumers' confidence in the value obtained, and possible
revision of shopping habits.
This description of outcomes clearly coincides with the
image formation literature. However, the role of
experienced crowding on image formation is not addressed.
There is some evidence that crowding does have an impact on
the image consumers have of retail stores. The stress from
crowding creates a strain or dissonance as a reaction to the
store. This dissonance creates negative attitudes or images
because they are negative enforcers (Markin et al. 1976) .
Based on the store image and retail crowding
literature, a relationship is likely. Addressing the second
research question, given this background, the study examined

35
the impact of this perceived crowding on the formation of
store image. Given the foundation literature, two
additional hypotheses tested were:
H2: The image level associated with a store will
differ when the consumer experiences high or low
levels of crowding.
H3: The image level associated with a store will
differ when the consumer is faced with high or low
merchandise density levels.
These hypotheses are intended to illustrate the
potential impact of environmental cues on image formation by
understanding the relationship of retail crowding to store
image. By investigating one cue, merchandise density, under
the rubric of the store image and retail crowding
frameworks, perhaps better understanding of these important
retailing concepts has been accomplished.
A Model of Crowding and Store Image Formation
Figure 3 is a conceptual model that describes two major
relationships involved in the process of store image
formation and change. These interactions are grounded by
the two conceptualizations of store image and retail
crowding described earlier. The first of these
relationships is the effect of environmental cues on

36
II
1

37
perceived density and retail crowding. The second
interaction described by the model is the influence that
retail crowding has on the consumers image of the store and
resulting behavior modifications. Each construct of the
model will be described in the following sections.
Environmental Cues
Knowing the overall store image provides insight for
the retailer, but in order to undertake strategic action,
the retailer must understand consumer evaluations of
specific store attributes (Bearden 1977) . Both the crowding
literature and the store image literature have identified
environmental cues as stimuli that create responses and
adaptive behavior in individuals. Cues are defined as a
dimension, external to the person that can be encoded and
used to categorize a stimulus object (Schellinck 1982).
They are those elements that are used by the consumer when
perceiving the environment. Any environment offers cues
whereby people judge its nature and the behavior appropriate
to that environment (Rapoport 1972). We perceive our
environment and describe it either verbally or through
imagery (Parsons 1974). Environmental cues may promote the
perception of high density resulting in perceived crowding,
or the cues may contribute to reduction or low levels of
perceived crowding. Eroglu and Harrell (1986) described
density cues as those environmental stimuli that may cause

38
feelings of crowding. Virtually any element within the
retail environment may serve as a cue to the consumer. In
evaluating which stores to patronize, consumers consider
many elements sometimes referred to as evaluative criteria.
Various cues may be included in these criteria, both
internal and external to the environment. The retail
environment may be viewed as multifaceted or consisting of
many cues, some of which are controllable by the retailer
and some which are not (Herrington and Capella 1991). Some
examples of cues that are within the control of the retailer
are aisle width, degree of concentration of merchandise on
racks, noise levels, arrangement of racks and displays,
lighting levels and temperature levels. Each of these cues
is discretionary. That is, the management of the firm have
the ability to vary these elements as needed to improve
consumer response to the store. As such, these elements are
potentially very important to the retailer.
Different physical and architectural features have been
shown to influence individuals' judgments about the density
of an environment (Baum, et al. 1974). Many studies have
suggested that some architectural cues, like walls,
partitions and other obstructions, may create a perception
of separation and ultimately result in crowding (Baum et
al. 1976; Desor 1972). So the way the physical structure is
designed may create varied responses in the consumer. For
example, the sheer size of hypermarkets is intended to say

39
something about the retailer. In addition to investigation
of the structure itself, considerable effort has been given
to determining the specific elements that contribute to
various levels of crowding, particularly in the psychology
literature. The environmental psychology research conducted
on architectural elements' influence on crowding suggests
that the physical features of an environment do mediate the
experience of crowding. Desor's (1972) study on crowding
suggested that changing architectural features in a setting
significantly altered perceptions of room size and available
space. Visual complexity and color also have been shown to
influence the level of crowding experienced (Baum and Davis
1976) . Parsons (1974) suggested that physical elements may
either constrain or permit behavior, i.e. movement.
Additionally, Baum and Davis (1976) investigated the impact
of various colors of rooms and architectural changes such as
adding partitions, walls and windows to a setting.
In the marketing literature, retail crowding has been
described, but little attempt has been made to identify
specific cues in the store environment that result in high
and low perceptions of crowding. Eroglu and Machleit (1990)
note that the impact of environmental factors on retail
shopping behavior is just emerging as a research avenue. In
an attempt to initiate research on the impact of specific
antecedents of crowding and image formation, this model
considers only one environmental cue: merchandise density.

40
This is not to suggest that merchandise density is the only-
cue influencing image formation. However, studies have
implied that manipulation of merchandise has more impact on
consumers' store image than manipulation of store policy and
service levels (Mazursky and Jacoby 1986) . Also, in a study
on store preference. Rich and Portis (1964) showed that
efficient store layout and display provided a reason for
store preference for three different categories of stores.
Clearly, the level of merchandise density does play an
important role in the creation of perceptions and images in
the mind of the consumer.
In a retail store, the most frequently manipulated
element of the store is the merchandise itself. And the
merchandise assortment dimension of a store has been shown
to strongly influence a consumer's level of liking of
shopping areas (Nevin and Houston 1980) . Considerable
effort goes into the planning of layout and merchandise
arrangement. However, the intensity and rapid pace of the
retailing business often results in the overshadowing of
those plans by a need to get the merchandise on the sales
floor and accessible to the consumers. Typically, retailers
are concerned with space considerations about merchandise
arrangement in terms of sales per square foot or
productivity ratios (Markin, et al. 1976) . Aisle width may
be reduced as additional racks are placed on the sales floor
to accommodate more merchandise. This increase in

41
merchandise density may inadvertently create obstructions
that limit the visual range of the consumer and create
difficulty of movement throughout the area. When conditions
restrict or interfere with activities of an individual
within a setting, these conditions may be perceived as
crowded (Schmidt and Keating 1979). An environment produces
negative affect and is perceived as crowded when physical
factors reduce the amount of perceived freedom and control
(Schmidt and Keating 1979). So individuals in retail stores
who have difficulty moving around or feel restricted due to
merchandise density may experience a feeling of
constriction, become frustrated and ultimately experience
crowding.
Interpretation of Cues
The interpretation or utilization of the cues in the
retail environment precede perceived density in the proposed
model. The consumer may or may not place an interpretation
on the cue due to selective perception. However, if
perception occurs and the cues are observed, an
interpretation is applied to that cue. Eroglu and Harrell
(1986) noted that the quantity of environmental cues, as
well as environmental constraints and shopping motives may
play a role in what interpretation is applied to that cue.
In situations of high density, the consumer may feel too
high a level of stimulation, become less comfortable and may

42
withdraw from the setting (Baum and Valin 1977). In the
case of merchandise density, the visual impact of the
merchandise arrangement will cause the consumer to perceive
a level of space availability. The physical design may
influence the experience of density by creating a perception
of more or less space and influence the level of crowding
stress (Baum and Valin 1977).
The interpretation of cues is included in the
subjective reality portion of the Mazursky and Jacoby (1986)
image formation process. This is consistent with the cue
utilization described in the Eroglu and Harrell (1986) model
and as incorporated into the present model.
Perceived and Affective Density
Consistent with the Eroglu and Harrell (1986) model,
cue utilization by the consumer leads to perceived and
affective density as defined earlier. The aspect of
perceived density relating to environmental cues is spatial
density. Spatial density refers to the physical qualities
of the perceived environment (Eroglu and Harrell 1986) such
as the density of merchandise, aisle width or the number of
customers in a space. Changes in the physical
characteristics of the setting can influence the way the
setting is experienced and influence the experience of
crowding (Baum and Davis 1976). It would follow, then that
the arrangement of merchandise within the store setting

43
could impact the crowding level experienced by the consumer.
Spatial inadequacy has been described as the experience
of feeling cramped and is believed to result in arousal and
a response relative to the space (Baum and Koman 1976).
This feeling and response is due to affective density which
involves a judgement of perceived density by the consumer
against a standard set by the consumer.
The described process of cue interpretation leading to
perceived and then affective density is very much like the
process described in Mazursky and Jacoby's image formation
model. Both processes involve the consumer interpreting
physical cues in the store environment. In the image
formation model, environmental cues, i.e. details of store
X, appear in the objective reality. Information from these
cues are interpreted, evaluated and integrated and
inferences are made about the store. Cues that convey
information about density levels will result in perceived
and affective density interpretations. Based on the level
of affective density, the stress related to crowding will
occur.
Experienced Retail Crowding
Crowding is typically viewed as a negative perception
of excessive density, a subjective experience (Rapoport
1976) . That is, when density levels restrict or interfere
with the individuals' activities within that setting.

44
crowding is experienced (Schmidt and Keating 1979).
Crowding is a specific case of affective density. It is an
unpleasant feeling that is experienced by an individual (Hui
and Bateson 1991).
The proposed model describes the experienced crowding
as an antecedent of image formation or change. This
positioning of the concept does not dispute either the
Mazursky and Jacoby image formation model or the Eroglu and
Harrell crowding model, but rather integrates the two
processes.
From the perspective of the image formation process
model, experienced crowding would occur in the subjective
reality between interpretation and evaluation and the
inferencing process. For example, a consumer in a high
merchandise density situation may evaluate the level of
density subjectively (affective density), may feel closed
in, experience crowding, infer that they can't find what
they want there, and form an image of the store based on
that experience.
From the perspective of the Eroglu and Harrell retail
crowding model, again the proposed placement of experienced
crowding as an antecedent of image formation supports and
expands the original model. Image formation may be viewed
as one of the outcomes described by the Eroglu and Harrell
model.

45
Outcome
According to the Extended Model of Retail Crowding, two
consequences occur as a result of the stress from perceived
retail crowding: adaptive strategies and outcomes.
Adaptive strategies, according to the Eroglu and Harrell
crowding model, describe how the consumer will cope in
response to the level of crowding experienced. Outcomes in
the Eroglu and Harrell model include the consumer's
emotional evaluation of the shopping experience, confidence
in their store choice, and revision of shopping habits.
Given our knowledge of store image processes, the
description provided by the Eroglu and Harrell model
warrants some adjustment and expansion. Based on the image
literature, the emotional evaluation of the store and
resulting image formation/modification may occur as a result
of the level of crowding perceived. Image formation has
consistently been shown as a response to both
physical/tangible stimuli and emotional/intangible stimuli.
The level of experienced crowding could have a significant
impact on the psychological and emotional evaluations of a
shopping experience and resulting image. The proposed model
describes three image processes that may occur as a result
of experienced crowding: image formation, image
modification, and image reinforcement.

46
Image Formation
If the consumer has no prior experience with or
knowledge of the store, the exposure to the store
environment will result in the initial formation of a store
image. This situation may occur if the consumer is new to
the market area, or if the store is new to the consumer's
current trade area.
If a negative reaction to the density level in the
store results in a high level of experienced crowding, the
consumer may form a negative image of the store. If the
consumer wishes to alleviate that stress, cognitive or
behavioral adjustments may be directed toward dissonance
reduction or restoration of cognitive consistency (Lawrence
1974) . If little or no crowding is perceived and the store
environment is thus perceived as non-hostile and
comfortable, the individual will be inclined to perceive the
activities that transpire in that environment as also
positive (Markin, et al. 1976). The overall image about
that store will then tend to be positive.
Image Modification
If the consumer already has some knowledge of the
store, some evaluation of the store has been made and a
store image formed. Each time the consumer is in the store
environment, there is potential for the held image to be
modified or reinforced.

47
The consumer develops an image of the store based on
the totality of experiences and the form that it takes,
positive or negative, depends on the relative importance the
consumer places on various store attributes (Kunkel and
Berry 1968). These values may differ by store type. For
example, in service settings, the absence of tangible
product characteristics may make the intangible factors
relatively more important to the consumer (Grove and Fisk
1983) . In stores where the consumer expects a "bargain-
basement" type environment, intangibles like ambience may be
less important. What is important is that the image
conveyed to the consumer via store characteristics is
congruent with the image that the consumer finds acceptable
for that store. Physical cues should reflect the image
desired by the store (Grove and Fisk 1983). There should be
a good "fit between the store image and the consumer's store
choice evaluative criteria (Rosenbloom 1983).
So, if the consumer's prior image of the store is
positive, and crowding is experienced in the store, a
dissonance occurs and the store image may be modified
negatively. In contrast, if the store is perceived to have
a negative image, and the shopping experience is positive,
again dissonance occurs, but the modification is positive.

48
Reinforcement
A third image outcome will occur if the preconceived
notions about the store are reinforced. In this situation,
positive experiences are congruent with previously held
positive images and no change in image occurs. Likewise,
negative shopping experiences reinforce prior negative
images of the store and again, no change in image occurs.
Adaptive strategies
Once the image is formed, the consumer may respond by
engaging in appropriate adaptive behavior. As mentioned
earlier, one of the two consequences of retail crowding
described by Eroglu and Harrell is that the consumer will
engage in adaptive strategies. The original model of retail
crowding suggests that various consequences of the stress of
crowding could occur. First, adaptive strategies describes
ways consumers might cope with the high density situations.
For example, consumers may reduce shopping time in an
attempt to avoid the crowded situation. In the proposed
model, this adaptive behavior will result in response to the
store image held by the consumer based on the shopping
experience and level of crowding.
One explanation of how the consumer responds to the
shopping experience suggests that consumers will engage in
either approach or avoidance behavior. Donovan and Rossiter
(1982) showed how the Mehrabian-Russell environmental

49
psychology model could be used to measure consumers'
psychological responses to various in-store variables. The
Mehrabian-Russell model suggests that individuals' responses
to an environment may be classified as approach or avoidance
behaviors. Donovan and Rossiter expanded this theory to
apply to the store environment. Describing the store
atmosphere in terms of the combination of in-store
variables, the study proposes that atmosphere manifests
itself as either pleasure or arousal and that these two
emotional states are mediators of shopping behavior.
Adaptation may take the form of adjustments of time spent in
the shopping environment (Harrell et al. 1980) or an
avoidance of the store entirely.
Milgram (1970) described situations where individuals
engage in behavioral adaptation when the rate of
environmental stimuli exceeded the individual's capacity to
cope. If this overload occurs, the consumer may engage in
one of several simplifying strategies such as physically
removing the source of distraction or move himself to a more
peaceful locale (Wright 1974). Harrell, et al. (1980)
provided evidence that crowding in retail environments may
have a predictable effect on shopping behavior. Clearly,
this has significant implications for store loyalty and
consumer shopping habits.
Although most of the investigations of crowding
describe it negatively, in some situations the response to
50
crowding may be positive. For example, a crowd around a
sale table seems to draw consumers toward that fixture.
Likewise, at flea markets, fairs and special events, crowds
may contribute to the excitement and be viewed positively by
the consumer. In any case, the level of crowding creates a
response and a corresponding behavior in the consumer.
Retailers may be able to improve control over store image
and the resulting buying behavior by addressing the elements
in the store that are contributing to crowding.
This research was designed to test two of the
relationships described in the model.
The Research Design
The Sample
Respondents were selected on a non-probability sampling
basis. The sample groups were selected such that they
represented equivalent groups as nearly as possible. To
accomplish this end, respondents were recruited from the
faculty of public school systems. This provided a somewhat
homogeneous group in terms of education level, income level
and age range. A homogeneous sample reduces the possibility
that differences in the results of the experiment are
influenced by differences in the characteristics of the
respondents. The sample was defined, then, to be
individuals, age 22 to 65, who hold faculty positions in
51
public schools, and who shop in one of the two designated
store types at least once a year.
Questionnaire Development
The questionnaire combined the use of a semantic
differential scale and a Likert-type scale [see Appendix E].
To measure the crowding construct, eight adjective pairs
were included based on instruments developed by Eroglu
(1985) and Harrell, et al. (1980). These original
instruments were designed to measure crowding due to numbers
of people. Consequently, replacement of some items specific
to people was necessary. For example, Eroglu's
questionnaire used "too many/too few shoppers" as a measure.
Since this study deals with crowding due to merchandise
density, that type of item was replaced by more generic
crowding measures such as "cramped/not cramped" which could
refer to crowding due to any environmental condition.
The image measurement section of the questionnaire
includes a semantic differential portion and a Likert scale.
Subjects were asked to respond to seven adjective pairs or
phrases reflecting various attributes of a store. The
attributes are based on a literature search. Many
researchers have attempted to identify attributes that
contribute to store image formation. The adjectives
selected for this questionnaire were selected from prior

52
lists of attributes and screened based on relevance to the
present study.
A second portion of the image measurement asked
subjects to respond to statements about a store setting by-
indicating the degree that they agree or disagree with given
statements. The statements included references to type of
shoppers associated with the store, and asked the extent
that the store is more like Dillard's or K-Mart. These
stores were selected to represent high and low image stores.
The selection process is described in the pre-test section
to follow.
For each of the sections of the questionnaire,
respondents were asked to circle one of seven points on the
scale. For the semantic differential portions, the polarity
of the scale is alternated to reduce response bias.
The questionnaire was in booklet form and required that
the respondent fill out these questions for each of the
eight slides depicting store settings. After completion of
the eight sets, respondents were asked about shopping
frequency at various stores. Determination of shopping
frequency may help to identify relationships between
patronage behavior and experienced crowding or image
formation. Finally, the questionnaire includes a
demographics portion.
The development, purification, and reliability and
validity checks of the instrument were conducted following

53
Churchill's (1979) procedure for questionnaire development.
The questionnaire was tested during the pre-test procedures
described in the following sections.
Slide Selection
The initial question to be resolved in the slide
selection process was which stores should be included.
Previous experiments using slides as simulation have
included a variety of settings. McClelland and Auslander
(1978) used a wide variety of environments including
restaurants, offices, libraries, retail stores and sporting
events. Eroglu (1985) used slides of a mall under crowded
and uncrowded conditions in a test of the EH model. And
slides of a ticket office at a railroad station were used to
simulate crowded and uncrowded conditions in a service
setting (Bateson and Hui 1992).
Each of these experiments involved crowding in terms of
numbers of people in a given amount space. The focus of the
present study was not on numbers of people, but rather on
the amount and arrangement of merchandise within a retail
environment. Consequently, the slides needed to reflect
various merchandise density levels within stores. In order
to obtain a wide variation in merchandise density levels, a
decision was made to include two store types and two
merchandise categories.

54
The slides were taken in a regional department store
and a national discount store. Slides depicting high to low
merchandise density levels in both merchandise categories
were taken for each store type. Similar representations
from both store types were needed to reduce potential
violations of internal validity that could be caused by
various confounding elements. It should be noted that the
stores did not necessarily reflect the stereotypical layout
of that type of store. That is, the discount store was not
necessarily the most crowded layout and the department store
was not necessarily the most spacious. This fact should
reduce bias that could result from preconceived images of
store type.
Categories of merchandise depicted in the slides
include mens and women's apparel and home furnishings.
Again, similar representations from the two store types were
included to reduce potential threats to internal validity.
Given this study's results suggesting a relationship between
various levels of merchandise density in general and
crowding, future studies can further test whether different
types of merchandise result in differences in perceived
density levels.
Initially, 345 slides were taken and developed using a
35mm camera and available light. The photography sessions
all took place before store opening. This timing was
intended to insure that people were not included in the

55
shots. Because the study is examining merchandise density,
the inclusion of customers and/or salespeople in the scenes
could confound the results, since it is known from previous
research that the number of people in a space does influence
experienced crowding.
After randomly numbering the slides to avoid store
identification, the technically unusable slides were
eliminated. This group of eliminated slides included
unfocused, dark and otherwise unclear shots. Next, judges
were used to eliminate those slides that appeared to be
extremely similar to other slides. This process in effect
eliminated duplicate slides. The judges further eliminated
any slides that "identified" the store. For example, slides
showing identifiable signing or exclusive merchandise were
discarded. A determination was made that, as much as
possible, the store should not be recognized by the
respondent.
The next step involved judges sorting pictures into
five piles representing least cluttered to most cluttered.
The judges were nine adults between the ages of 35 and 55.
The sorting was accomplished by placing the slides on a
large viewfinder and allowing them to arrange the slides as
they wished. Five containers labeled one to five and least
cluttered to most cluttered were provided. Once the judges
had made a decision they placed the slides in the
containers. After all the slides were sorted, the judges

56
were asked to go back through the piles and make adjustments
if they were necessary. Then, the numbers off the slides
were recorded on a judging form based on Eroglu's (1985)
study [see Appendix A].
The mean and standard deviation were calculated for the
combined ratings of the judges. Based on these numbers, a
subset of slides was selected that reflected three distinct
levels of merchandise density (means nearest to 1, 3 and 5)
and the smallest standard deviation among the ratings. From
the subset of slides, the final group of slides was selected
such that each of the levels of density represented each of
the store types and similar merchandise categories. In some
cases, slides were selected that had relatively high or low
means for the level. This situation occurred as a result of
balancing store types and merchandise categories. Following
the pre-test, a decision was made to include only high and
low density levels. Based on comments from and observation
of respondents suggesting fatigue during the experiment, an
attempt was made to shorten the length of the experiment.
Fatigue has been identified as a threat to internal
validity. Consequently, elimination of a mid-range of
merchandise density was justified. The final group of
slides used, along with their mean and standard deviation,
are shown in Appendix B.

57
Pre-tests
A number of exploratory investigations on the crowding
and store image constructs were conducted in anticipation of
this study. In trying to gain better understanding of the
general crowding/store image relationship, informal
interviews were conducted to assess response to the idea of
crowded conditions in retail stores. Fifteen individuals
were interviewed. They included both professional and
retired persons, academic and non-academic, with ages
ranging from twenty years to seventy-seven years. These
individuals were simply asked what their reaction is to
stores that are crowded. Without exception responses were
negative, i.e. they do not like to shop in crowded stores,
suggesting that crowded conditions may result in higher
levels of crowding stress. Some respondents suggested that
they typically avoid or have quit patronizing particular
stores because they are crowded. One individual said that
he would not enter a store if the store looked congested
when he looked through the glass storefront. On several
occasions, people gave an example of local stores that they
perceived as being crowded and indicated that they "had gone
downhill". This type of response provided some suggestion
that store image is related to the perception of crowding.
Two pre-tests in the area of store image were conducted
prior to the experiment. Both tests were designed to
determine what specific stores were regarded as having high
58
and low images. Previous studies have used store names to
manipulate high and low store image perceptions (Thorelli,
et al. 1989) .
The first test was an open-ended format asking
respondents to name four stores that they considered to be
high image retailers and four stores that they considered to
be low image retailers. In order to give the respondents a
frame of reference, the introductory statement asked them to
list stores that they "would (low image) or would not (high
image) be embarrassed for their friends to know they had
purchased their birthday gifts there" [see Appendix C].
This test resulted in a wide range of responses, with the
most frequently named stores for high image being Dillard's
and Foley's. Dillard's and Foley's are both regional
department stores in the southwestern United States. The
most frequently named low image stores were K-Mart and
Sears. The results for the low image stores were not
surprising. However, it was somewhat surprising that the
test for high image stores placed Neiman Marcus as a
somewhat distant third in frequency of response.
Considering that the responses may have been a result of the
way the question was asked, a supplementary test was
conducted.
The second image pre-test asked respondents to rank
stores in terms of their image. This time the top five
named high image stores and the top five named low image

59
stores from the earlier test were listed and the respondents
rank ordered them [see Appendix D] . This time Neiman Marcus
was named as the highest image store with Dillard's being
second. For low image, K-Mart was again named as having the
lowest image.
Because some subjects in the study were recruited from
areas some distance from a Neiman Marcus, there was reason
to be concerned that some respondents may lack familiarity
with that store and thus not be able to respond to the
question. Consequently, a decision was made to use
Dillard's as the representative store for high image.
A pilot study was conducted to assess the reliability
of the questionnaire and the appropriateness of the
experiment procedures. The study was conducted using 120
undergraduate students from four different classes. Several
small classes were selected rather than one large section to
approximate the conditions of the actual experiment. It was
anticipated that the study would be administered to small
groups of people given the sample selection process
described earlier. Students were told that they would be
shown a series of twelve slides of retail settings and that
their responses on the questionnaire should reflect their
feelings about each setting. The tests took from twenty-
seven to thirty-six minutes to conduct using twelve slides.
Respondents were allowed as much time as they needed to
complete each section of the questionnaire. Time required

60
for each slide ranged from 1 minute to 4 minutes. Slide
time required reduced as the experiment progressed and the
respondents became accustomed to the questionnaire format.
As mentioned previously, fatigue proved to be an issue in
the experiment and a decision was made to reduce the number
of slides to eight.
Using the data from this pilot test, principal
components factor analysis and varimax rotation were used to
determine if the variables loaded on two distinct factors,
image and crowding. The crowding items loaded strongly on
one factor. Loadings were high ranging from .68 to .89.
The loadings of the image variables identified items that
were poor measures of the image component. Seven items were
subsequently dropped from the questionnaire as inappropriate
to the study. The eliminated items either had very low
loadings or loaded on more than one factor. This
elimination reduced the questionnaire to eight measures of
the crowding construct and eight measures of the image
construct [see Appendix E]. Internal consistency reliability
of the items was measured by coefficient alpha and interitem
correlations.
The Experiment
Because the experiment was conducted using small groups
of respondents, the research setting varied slightly due to
the need to access the respondents. The specific rooms

61
selected for each administration of the experiment were as
close to the same as possible given the variety of locales.
Each room contained desks and/or tables for the respondents.
A slide projector and slide screen were set up in the room
prior to the experiment time. Once the respondents were
seated, the questionnaire booklets were passed out. The
researcher began each session by saying:
Hello. My name is Nita Paden. I will be showing you a
series of eight slides that show settings in retail
stores. For each slide you will be answering two pages
of questions. The questions are identical for each of
the slides. As each slide appears on the screen, I
want you to consider that setting as you answer the
questions for that slide. You will have as long as you
need to answer the questions. Please follow along as I
read the instructions at the top of the first page.
After answering any questions, the slides began
appearing on the screen. For each session, the slides were
counterbalanced such that the order of the slides was
randomized. After three minutes, the respondents were asked
if they needed more time. Additional time was given as
needed. If no additional time was necessary, the
respondents were shown the next slide. This process
continued until all eight sets of questions had been
62
completed. Respondents were then asked to complete the last
two pages of the questionnaire which covered shopping
frequencies and demographic information.
When all respondents were finished, questionnaires were
collected. Debriefing followed and questions were answered.
Finally the respondents were thanked for participating and
dismissed.
Statistical Analysis
In order to determine if differences exist in perceived
crowding levels under varying merchandise density levels, it
was necessary to examine the variance. Analysis of variance
(ANOVA) provides an adequate means of investigating these
differences. The null hypotheses tested was that the group
means are equal. That is, there is no difference in
perceived crowding at high and low levels of merchandise
density; and there is no difference in perceived store image
at high and low levels of perceived crowding.
Two relationships were investigated. First, the
analysis examined whether there is a significant effect on
the perception of crowding due to high and low levels of
merchandise density. The different levels of merchandise
density were manipulated through the use of the slides
simulating these conditions. The factors included two store
types, two merchandise categories and the two levels of
merchandise density. The dependent variable, crowding, was

63
measured on ordinal scales as described in the questionnaire
development section.
The second relationship investigated was whether there
is a significant effect on the perception of store image due
to high and low crowding levels. Crowding and store image
levels were measured by the responses on the questionnaire.
For this analysis, the factors included two store types, two
merchandise categories and two levels of crowding. Again,
the dependent variable, store image, was measured on ordinal
scales as described in the questionnaire development
section.
Typically, ANOVA is applied to studies using
independent samples. That is, each treatment or level would
have different subjects assigned to that treatment. In the
present study, the same subjects responded to each of the
levels in an attempt to control subject heterogeneity
between the groups. That way the variance observed between
levels is less likely to be the result of differences in the
respondents. This is referred to as a design using repeated
measures (Keppel 1973). Certainly, other factors were
expected to be contributing to differences among the
treatments. Distractions, fatigue, boredom, etc. will all
contribute to the observed variance. However, the error
components should be smaller using the same subjects than if
independent groups are used.

64
One of the problems of repeated measures is that a
carry-over effect may occur. That is, the response to one
treatment may be influenced by earlier treatments. In the
present study, this could mean that the respondents' answers
for the third slide could be effected by the content of
slides one and two. For example, judgments may be made in
comparison to other slides rather than just on the setting
being shown. This problem was handled by counterbalancing
the treatments (Keppel 1973) as described earlier. This
process requires that the sequence of slides be rotated to
ensure that the effect of prior testing is minimized.

CHAPTER 4
RESULTS OF THE EXPERIMENT
Introduction
The hypotheses of the study were analyzed using two
different procedures. The first hypothesis, which examined
crowding as the dependent variable, was tested using
repeated measures ANOVA. The second hypothesis focused on
store image as influenced by experienced crowding and was
tested using a repeated measures ANCOVA. The third
hypothesis examined the effect of merchandise density on
store image and was analyzed similarly to the first
hypothesis using repeated measures ANOVA. The following
sections describe the procedures and provide justification
for their use. Included is discussion of the tests of the
assumptions associated with the procedures. The chapter
concludes with a description of the results of the tests.
Within Subjects Design/Repeated Measures
When the respondents in an experiment are exposed to
multiple treatments, the design is referred to as a repeated
measures design. Analysis of Variance (ANOVA), adjusted for
repeated measures on each subject, was used to analyze data
from the first and third experiments.
65

66
Repeated measures designs are sometimes referred to as
within subjects designs. The "within subjects" term refers
to the fact that each respondent is exposed to multiple
treatments rather than having different subjects exposed to
different treatments. Thus, the measured effect is the
result of variations within the same person rather than
between groups of people. That is, differences in responses
are less likely to be the result of differences in
individuals (Kidder and Judd 1986).
The main purpose of a repeated measures design is to
provide control over individual differences in respondents
(Winer 1962) . Repeated measures designs also are efficient,
requiring fewer numbers of subjects to achieve the same
level of statistical power. The procedure generally is more
sensitive to the effects of independent variables because
there is more control over individual differences or subject
heterogeneity (Keppel 1973).
The biggest disadvantage of a repeated measures design
is the possible threat to internal validity that comes from
carry-over or sequence effects (Winer 1962; Cook and
Campbell 1979; Keppel 1973). For example, in the present
study, responses to one slide may be influenced by the
viewing of previous slides. The typical solution to the
problem of carry-over effects is to use counterbalancing
(Keppel 1973). This procedure involves randomizing the
order in which the treatments are administered. In this

67
study, the experiment was administered in eight different
sessions. The slide order was randomized for each session
in an attempt to overcome this potential problem.
Another potential threat to internal validity in this
type of experiment is fatigue. Because the respondents were
asked to complete questionnaires for each of eight slides,
responses to the latter slides had the potential of being
influenced by loss of interest or boredom. This issue was
addressed during the pre-test stage by reducing the number
of slides from twelve to eight. With repeated measures
designs, a situation often arises where non-independence, or
violation of the assumption of independence occurs.
Typically non-independence occurs when the data is grouped
or when it is sequential (Judd and McClelland 1989) . In
the present experiment, the observations came from the same
individual so the data is grouped within individuals.
Because multiple measures are recorded for each respondent
in a repeated measures design, adjustments have to be made
to account for the dependencies between measures taken on
each subject (Norusis 1990). To accommodate for this lack
of independent responses, the regression model is modified.
If these adjustments are not made, the test of treatment
differences will be biased. The modification or adjustment
involves combining the data from each individual into
summary dependent variables which can be analyzed
separately. This creates independent data since only one
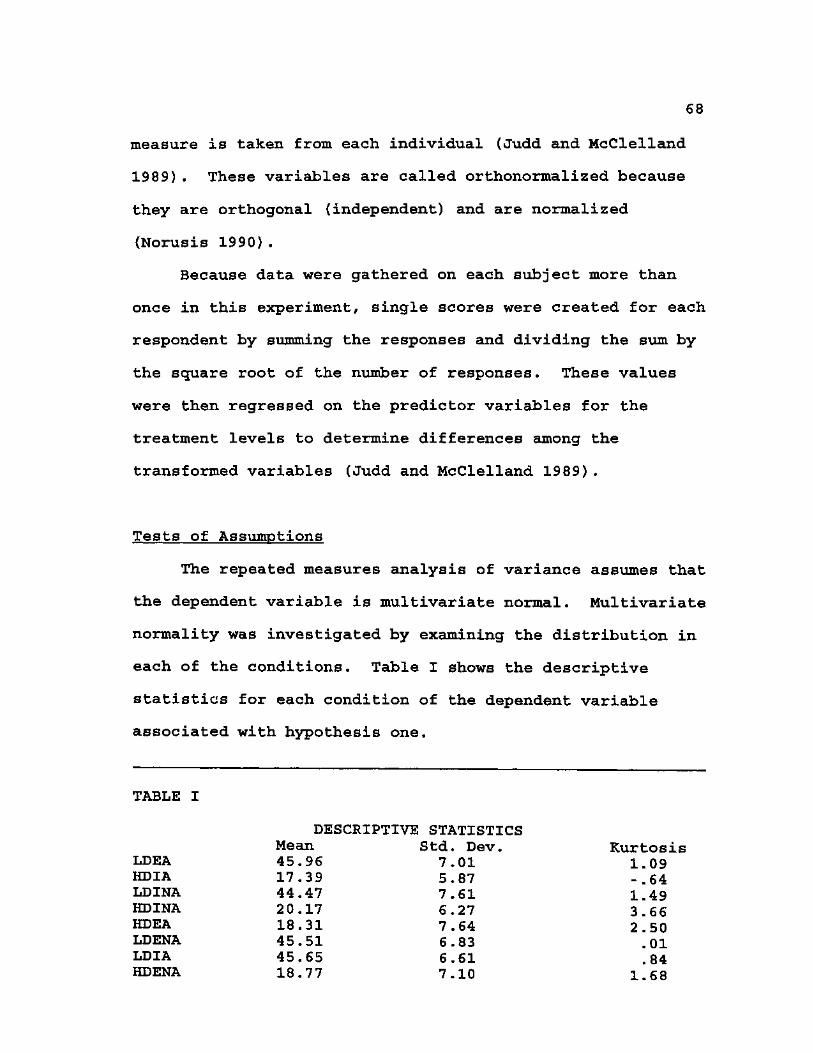
68
measure is taken from each individual (Judd and McClelland
1989) . These variables are called orthonormalized because
they are orthogonal (independent) and are normalized
(Norusis 1990).
Because data were gathered on each subject more than
once in this experiment, single scores were created for each
respondent by summing the responses and dividing the sum by
the square root of the number of responses. These values
were then regressed on the predictor variables for the
treatment levels to determine differences among the
transformed variables (Judd and McClelland 1989) .
Tests of Assumptions
The repeated measures analysis of variance assumes that
the dependent variable is multivariate normal. Multivariate
normality was investigated by examining the distribution in
each of the conditions. Table I shows the descriptive
statistics for each condition of the dependent variable
associated with hypothesis one.
TABLE I
DESCRIPTIVE STATISTICS Mean Std. Dev. Kurtosis
LDEA 45.9(5 7.01 1.09 HDIA 17.39 5.87 -.64 LDINA 44.47 7.61 1.49 HDINA 20.17 6.27 3.66 HDEA 18.31 7.64 2.50 LDENA 45.51 6.83 .01 LDIA 45.65 6.61 .84 HDENA 18.77 7.10 1.68

69
Note: LDEA (low density/department store/apparel; HDIA (high density/discount store/apparel); LDINA (low density, discount store, non-apparel); etc.
Normality was investigated by visual inspection of both
stem and leaf plots and normal probability plots. Such
examination suggested that the assumption of normality was
violated. The Lilliefors test of the hypothesis that the
data are from a normal distribution was also conducted.
This test is a modification of the Kolmogorov-Smirnov test.
The results of the K-S Lilliefors test for each condition is
included in Table II and further confirms that the normalcy
of distribution assumption is violated.
TABLE II
K.S.-LILLIEFORS SCORES (crowding variables)
RAW RECIP SQRT LG10
LDEA .022 .000 .003 .001
HDIA .005 .000 .020 .012
LDINA .092 .000 .008 .001
HDINA .031 .000 .065 .033
HDEA .001 .025 .056 .058
LDENA >.200 .000 .037 .007
LDIA >. 200 .000 .040 .004
HDENA .003 .000 >.200 .079

70
When the assumption of multivariate normal distribution
is violated, transformations of the data may be performed in
an attempt to correct the situation (Keppel 1973).
Transformations conducted on the data included reciprocal,
square root, natural logarithm, and base ten logarithm.
None of the transformations significantly improved the data
(see Table II), and a decision was made to use the original
data set. In this analysis, violations of the assumption of
normality of distribution were not of extreme concern since
the F test is robust in regard to this assumption (Keppel
1973; Hair, et al. 1987).
Results - Hypothesis 1
The first hypothesis stated that there would be a
difference in perceived crowding at high and low merchandise
density levels. Store type and merchandise type were
included in the design to determine if these within subjects
factors influence the effect of density on perceived
crowding. Merchandise density, store type and apparel type
are the within subjects factors because all respondents are
exposed to all combinations of treatments.
This design involved setting up eight experimental
conditions which were displayed to the respondents through
the use of slides. As mentioned in chapter three, the
validity of using slides to simulate retail settings has
been established by Bateson and Hui (1992). The conditions

71
created via the slides were: (1) low density/department
store/apparel (LDEA); (2) high density/ discount
store/apparel (HDIA); (3) low density/discount store/non-
apparel (LDINA); (4) high density/discount store/non-apparel
(HDINA); (5) high density/department store/apparel (HDEA);
(6) low density/department store/non-apparel (LDENA); (7)
low density/discount store/apparel (LDIA)? (8) high
density/department store/non-apparel (HDENA). As previously
discussed, in a repeated measures design, these conditions
become contrasts, or transformed variables to be used in the
analysis as the dependent variables.
The ANOVA results for the first experiment are
presented in Table III. The analysis shows significant main
effects for merchandise density, but not for store type or
apparel type. This suggests that, as hypothesized,
merchandise density does influence the level of experienced
crowding in the respondents. An Eta2 of .92 for the density
effect further supports the hypothesized relationship.
Store type effect was not statistically significant
suggesting that store type alone does not affect an
individual's perception of crowding. Likewise, the
merchandise type effect was not significant. The
significant density by merchandise type interaction effect
indicates that the effect of merchandise density on
experienced crowding is different under apparel and non-
apparel conditions. Additionally, the density by store by

72
merchandise type effect was significant. This finding
suggests that both merchandise type and store type, when
viewed in combination, influence the effect of merchandise
density on the experienced crowding.
TABLE III ANOVA SOURCE TABLE
Source of Variation SS df MS F Sig.F eta2
Within Subiects Density 233005 1 233005 1657.83 .000 .91 Error 27768 162 140.55
Store type 14.82 1 14.82 .42 .520 .00 Error 5760.56 162 35.56
Merchandise 52.24 1 52.24 1.71 .193 .01 Error 4944.63 162 30.52
Density by Store 69.48 1 69.48 2.76 .098 .02 Error 4073.90 162 25.15
Density x Mer. 482.25 1 482.25 14.65 .000 .08 Error 5331.63 162 32.91
Store by Merch. 50.65 1 50.65 1.60 .207 .01 Error 5117.72 162 31.59
Density by Store by Merch. 189.42 1 189.42 5.15 .025 .03
Error 5956.95 162 36.77
Cell means are displayed in Table IV, and show that
merchandise density conditions did elicit a difference in
responses to perceived crowding and was in the direction
expected. That is, the low density conditions generated
lower crowding ratings than did high density conditions.
[Note: Subjects' ratings of perceived crowding were coded

73
such that higher ratings correspond to low crowding
ratings.]
Cell means also provided additional information about
the significant interaction between merchandise density and
merchandise type. In the high density condition, average
responses to crowding were lower under the non-apparel
condition than the apparel condition. But in the low
density condition, crowding responses were slightly higher
under the apparel condition than the non-apparel condition.
Interaction also occurred among the density, store type
and merchandise type variables. For the high
density/discount store condition, the average crowding
response was lower for non-apparel than apparel. But for
the high density/department store condition, there was
virtually no difference in the average crowding response
under apparel and non-apparel conditions. This relationship
was similar under the low density conditions. That is, for
the low density/discount store condition, the average
crowding response was lower for the apparel condition than
the non-apparel condition. And for the low
density/department store condition, the crowding responses
were virtually the same under the two merchandise type
conditions.
TABLE IV CELL MEANS
LDEA 45.96 LDINA 44.467 LDENA 45.509

74
LDIA 45.650 HDIA 17.399 HDINA 20.17 HDEA 18.306 HDENA 18.767
Repeated Measures Analysis of Covariance
The second hypothesis investigated whether the store
image perceived by the respondent was different under
different levels of experienced crowding. Based on
previously discussed pre-tests, it seemed conceivable that
individuals perceive that a store has a high or positive
image when experienced crowding is low. To test this
hypothesis, a repeated measures analysis of covariance
(ANCOVA) was used.
With repeated measures ANCOVA, continuously measured
predictors (covariates) are included in the model in
conjunction with the manipulated variables. There are
basically two reasons for including the continuously
measured predictor in the model. First, the statistical
tests may increase in power if there is a relationship
between the covariate and the dependent variable (Judd and
McClelland 1989).
The second reason for including the continuously
measured predictor is to ascertain the relationship between
the covariate and the dependent variables in the repeated
measures design (Judd and McClelland 1989). In the present
study, the justification for using ANCOVA lies in the

75
relationship that exists between crowding, the continuously
measured predictor variable and the dependent store image
variables created by the repeated measure design.
Test of assumptions
Because the procedure used to analyze the second
hypothesis is an extension of the repeated measures ANOVA
procedure, the tests for assumption of normality were
repeated using store image as the dependent variable. Table
V shows the descriptive statistics for the store image
variables: ILDEA (low density/department store/apparel);
IHDIA (high density/discount store/apparel); ILDINA (low
density/discount store/non-apparel); IHDINA (high
density/discount store/non-apparel); IHDEA (high
density/department store/apparel); ILDENA (low density/
department store/non-apparel); ILDIA (low density/discount
store/apparel); IHDENA (high density/department store/non-
apparel) .
TABLE V
DESCRIPTIVE STATISTICS (Store Image Variables)
MEAN STD. DEV. KURTOSIS
ILDEA 21.30 8.37 -.122 ILDENA 20.01 7.67 -.215 ILDIA 21.96 7.29 .174 ILDINA 25.83 9.00 .670 IHDEA 38.49 9.43 6.78 IHDENA 35.55 10.21 2.53 IHDIA 39.36 9.27 5.64 IHDINA 38.46 9.39 3.17

76
Once again, the assumption of normality of distribution
of the dependent variables appears to be violated. This
time, however, four of the variables (ILDEA, ILDENA, ILDIA,
ILDINA), were improved by both the square root
transformation and the natural log transformation. Table VI
displays the Lilliefors scores for the various attempted
transformations.
TABLE VI
K.S. - LILLIEFORS SCORES (Store Image Variables)
RAW RECIP SQRT LN
ILDEA .015 .000 >.200 >.200 ILDENA .001 .000 .066 >.200 ILDIA .001 .000 .054 >.200 ILDINA .019 .000 >.200 >.200 IHDEA .005 .000 .000 .000 IHDENA .041 .000 .000 .000 IHDIA >.200 .000 .001 .000 IHDINA .048 .000 .001 .000
As can be seen, non-significance is apparent for the
first four variables using the square root and the natural
log transformations. However, none of the transformations
resulted in a uniform improvement. A decision was made to
use the raw data for the analysis since no single
transformation provided improvements across all variables.
Additionally, the F- test is robust in regard to violations
of the assumption of normality.

77
Results - Hypothesis 2
The second hypothesis stated that store image would be
different at different levels of experienced crowding. Once
again merchandise density, store type and apparel type were
included as within subjects factors.
The ANCOVA results are displayed in Table VII. The
analysis resulted in significant main effects for the
covariate, experienced crowding in every instance. These
findings strongly suggest that experienced crowding had a
dramatic effect on the store image perceived by the
respondents, and supports hypothesis 2. The negative slope
for the covariate suggests a negative relationship between
store image and crowding and provides further support of the
importance of crowding in influencing store image.
Further review of the ANCOVA table revealed other
interesting findings. In addition to the significant main
effect of crowding, significant main effects were found for
store type, density by merchandise interaction, and store by
merchandise interaction. Given the results of pretests
discussed in chapter three, one would expect store type to
have an influence on store images. And given the
significant density by merchandise type and store by
merchandise type effects, it appears that merchandise type
is an important factor in effecting store image when
combined with the other two factors.

78
TABLE VII
Source b
Crowding -.68 Density Error
Crowding -.40 Store Error
Crowding -.44 Merchandise Error
Crowding -.38 Density by
Store Error
Crowding -.51 Density by Merch.
Error
Crowding -.43 Store by Merch.
Error
Crowding -.27 Density by Store by Merch.
Error
SS
10365.40 159.80
18084.99
942.76 1999.41
11555.19
1001.14 6.36
7594.74
ANCOVA SOURCE
df MS P
1 1 161
1 1 161
1 1 161
591.06 1
81.29 8237.82
1 161
1380.52 1
289.39 6310.42
1 161
943.74 1
1250.67 7962.47
1 161
435.96 1
TABLE
Sig. of F
10365.40 92. 159.80 1. 112.33
942.76 13. 1999.41 27.
71.77
1001.14 21. 6.36
47.17
591.06 11.
81.29 1. 51.17
1380.52 35.
289.39 7. 39.20
28 42
14 86
22 13
55
59
22
38
943.74 19.08
1250.67 25.29 49.46
435.96 11.12
. 0 0 0
.235
.000
.000
. 000
.714
.001
.209
. 000
.007
. 000
. 000
.000
eta
.36
. 08
.12
.07
18
.11
.07
103.16 1 103.16 2.63 .107 6314.29 161 39.22
Results - Hypothesis 3
The third hypothesis expanded on the investigation of
the store image variables by examining the influence of
merchandise density on store image formation. The

79
hypothesis was analyzed in the same manner as hypothesis one
using procedure ANOVA in a repeated measures design.
The ANOVA results for hypothesis three are shown in
Table VIII. Significant main effects were found for
merchandise density, store type, density by merchandise type
interaction, store type by merchandise type interaction, and
the density by store type by merchandise type interaction.
Additionally, the size of the effect reflected by eta2
suggests the influence of merchandise density on store image
is important. Thus, hypothesis three is supported.
TABLE VIII
Source SS df MS Density 80270 .98 1 80270 .98 Error 28450 .39 162 175 .62
Store 2146 .42 1 2146 .42 Error 12497 .96 162 77 .15
Merch.. 33. 50 1 33 .50 Error 8595 .88 162 53 .06
Density by Store 150 .50 1 150 .50
Error 8828
00 00 • 162 54 .50
Density by Merck. 837 .44 1 837 .44 Error 7690 .93 162 47 .47
Store by Merch. 1055 .16 1 1055 .16 Error 8906 .21 162 54 .98
Density by Store by Merch. 197 .12 1 197 .12 Error 6750 .25 162 41 .67
ANOVA SOURCE TABLE F Sig. of P 457.07 .000
27.82
63
2.76
17.64
19.19
000
.428
.098
. 000
000
eta .74
.15
. 0 0
02
.10
.11
4.73 .031 03

80
Other findings of the analysis are meaningful as well.
Just as in the analysis of hypothesis two, store type
appears to play a significant part in influencing store
image. Merchandise type effect alone does not appear to
influence the formation of store image significantly,
although this factor does appear to influence the effect of
merchandise density on store image and the effect of store
type on store image. In addition, interaction occurred
among merchandise density, store type and merchandise type.
A review of the cell means offered some additional
insight. Mean responses are shown in Table IX.
TABLE IX CELL MEANS - STORE IMAGE
ILDEA 21.30 ILDENA 20.01 ILDIA 21.97
ILDINA 25.83 IHDEA 38.49
IHDENA 35.55 IHDIA 39.96
IHDINA 38.46
The highest store image response was for ILDENA (low
merchandise density/department store/non-apparel). The
lowest store image response was for IHDIA (high merchandise
density/discount store/apparel). These means are in the
direction expected and further support the hypothesis that
merchandise density influences store image.

81
Cell means also provided information about the
interaction effects. Under the low density/discount store
condition, image responses were lower for the non-apparel
condition than the apparel condition. But for the low
density/department store condition, image responses were
closer with lower responses for apparel than non-apparel.
Under the high density/discount store condition, image
responses were lower for apparel than non-apparel
conditions. But under the high density/department store
condition, image responses were considerably lower for the
apparel conditions than for the non-apparel condition.
Summary
Each of the three hypotheses was supported.
Merchandise density appears to be a significant influence on
experienced crowding, as well as on store image formation.
Additionally, experienced crowding appears to have a
dramatic influence on perceived store image. Chapter five
will address the significance of these findings, discuss the
managerial implications suggested by the findings, and offer
suggestions for expanding on these results through future
research.

CHAPTER 5
DISCUSSION AND IMPLICATIONS
Introduction
Both store image and the concept of perceived crowding
have been described in terms of responses to environmental
cues. However, previous literature has not described how
these two variables relate to each other. The development
of the present model and the results of the present study
provide an initial step in describing this relationship.
Perceived crowding due to merchandise density was shown by
the study to be an influence on store image. One of the
questions addressed by this study is whether or not
perceived crowding, once experienced, influences the image
an individual associates with the store. The results of
this study suggest that different levels of crowding
influence an individual's image of the store. These
findings advance our knowledge of the store image/crowding
relationship and contributes to our understanding of these
two concepts.
In addition to investigation of this image/crowding
relationship, the study addressed the impact of
environmental cues on crowding. Previous research suggested
that elements in the retail setting influence customer
82

83
behavior and attitudes. Both the store image literature and
the retail crowding literature identified environmental cues
or stimuli in the store setting as contributing to the
phenomena. The proposed model and resulting analysis
suggest that retail crowding (an emotional and/or
psychological response to store stimuli, i.e. merchandise
density) contributes to the phenomena of perceived store
image. The results of this study also contribute to the
research stream by suggesting an influence on perceived
crowding and store image due to a clearly defined
environmental cue--merchandise density. Although prior
research has suggested that both store image and experienced
crowding are in response to various environmental cues,
little research has been conducted investigating specific
environmental cues in relation to these two variables. This
study has focused on one environmental cue, merchandise
density, and its significance in affecting perceived
crowding. The concept of density, in terms of merchandise
and its arrangement, has not been previously addressed, and
this study suggests that the density of merchandise in
department and discount stores does influence crowding and
the perceived image of the store. The importance of
studying merchandise density is in how consumers respond to
environmental cues in the retail setting. This study
addressed this issue and showed that merchandise density
84
influences the level of experienced crowding and the store
image perceived.
The following sections discuss the findings in detail
and describe the contribution to retail crowding and store
image theories provided by this study.
Merchandise Density/Retail Crowding Relationship
Two research questions formed the foundation of this
study. The first question asked whether different
merchandise density levels in retail settings contribute to
differences in perceived crowding. Previous literature
suggested that environmental cues are a part of
communicating various images and emotions to consumers.
Studies have shown that physical features in the environment
influence individuals' judgments about their environment
(Rapoport 1972; Baum et al. 1974; Eroglu and Machleit 1990).
Research conducted by Markin, et al. (1976) suggested that
the arrangement of space affects and shapes consumer
behavior. The present study expands on this stream of
research by showing that the arrangement of space in terms
of merchandise and its density affects the emotional
response of consumers via retail crowding. The findings of
this study also support prior research that suggested that
consumers experience crowding as a result of various
elements in the environment of the retail setting. The
importance of this finding is that it advances our

85
understanding of consumer behavior in retail settings
because we have identified and studied specific factors that
contribute to consumer responses to store environments.
The significant ANOVA results described in chapter four
suggest that perceived crowding is indeed different at
different levels of merchandise density. A significant main
effect was found for merchandise density, and an interaction
effect was found between merchandise density and merchandise
type as well as among the merchandise density, merchandise
type and store type variables. This difference due to
merchandise density was anticipated and supports the
informal pretests conducted at the initial stages of the
study. The pretests asked individuals if they are bothered
by "close quarters" in retail stores. All respondents
indicated that they dislike shopping in stores that they
feel are too crowded. This study supports the proposed
theory by suggesting that individuals have an emotional
response, i.e. crowding, to the density and arrangement of a
store's merchandise. These findings are also in support of
the influence of environmental cues described by Groglu and
Harrell (1986) . In the present study, merchandise density
(an environmental cue) appeared to influence the level of
crowding experienced, as well as, the level of store image
associated with that environment. This further supports the
Eroglu and Harrell (1986) Model of Retail Crowding by
showing that one environmental cue, merchandise density, is

86
in fact an antecedent of experienced crowding.
Environmental cues were identified as contributing factors,
but were not delineated in the retail crowding model. The
present study expands on the retail crowding literature and
specifically the Extended Model of Retail (Eroglu and
Harrell 1986) by analyzing merchandise density in terms of
its contribution to experienced crowding as well as to store
image formation. The results indicating that there is a
difference in perceived crowding at different merchandise
levels are important findings given the importance of
merchandise arrangement in retail strategy. It expands
studies that suggest that physical design influences the
experience of crowding (Baum and Valin 1977) by showing
that the physical arrangement of merchandise influences
perceived crowding.
An interaction between merchandise density and
merchandise type occurred for perceived crowding. This
finding suggests that the crowding response may be different
at different merchandise density levels when merchandise
type is considered. This is an important discovery because
it shows that the application of retail crowding theory, in
terms of response to merchandise density, will vary
depending on the merchandise mix of the retailer. In this
study the two types of merchandise treatments were apparel
and non-apparel. A review of the cell means of this
interaction showed much higher means (lower crowding

87
ratings) at low density levels than high density levels, and
the means were in the direction expected. This supports the
significant main effect for density and the theorized
influence of merchandise density on experienced crowding.
A significant three-way interaction occurred for
merchandise density by store type by merchandise type. This
finding suggests that experienced crowding was different
under the various conditions. That is, both merchandise
type and store type, when viewed in combination, influence
the effect of merchandise density on experienced crowding.
The results of this study also delineate crowding in
response to an environmental cue from previous studies that
focused on density due to numbers of people in a given
space. Affective density was defined in earlier research as
the evaluation of perceived density against subjective
standards and desired levels (Rapoport 1976). Certainly,
this experiment required respondents to make a subjective
estimate of the arrangement of merchandise in retail
settings as depicted in the slides. The present study
advanced knowledge of affective density in terms of a
response to merchandise arrangement as suggested by the
varying responses to different merchandise density levels.
Earlier studies on density and crowding found that increased
numbers of people in a given space created increased levels
of experienced crowding (Stokals, et al. 1973). The
findings of the present study add to this research stream by

88
showing that affective density and experienced crowding are
a function of merchandise density as well as a function of
numbers of people.
Retail Crowding/Store Image Relationship
A second research question addressed by this study was
once perceived crowding occurs, does that crowding influence
the image that the consumer associates with the store.
Previous literature suggested that a relationship exists
between the image of a store and shopping behavior, consumer
decision-making and store selection (Arons 1961; Thorelli,
et al. 1989; Lewis and Hawksley 1990). Research has also
suggested that physical layout and arrangement of
merchandise contributes to positive and negative perceptions
about a store. Previous research theorized that physical
and psychological cues are very important as a determinant
of outcomes such as image formation. Outcome as depicted in
the Extended Model of Retail Crowding includes an emotional
evaluation of the shopping experience. The results of this
study add to this theory by showing that the emotional
evaluation may be perceived store image.
The study showed that the store environment produces
various perceptions, not only about the appeal of the
shopping experxence, but also about the store's image.
Specifically, the findings are in support of the influence
of "objective realities" described in the Mazursky and
89
Jacoby model (1986). Objective realities include the
characteristics of the store (environmental cues) that
stimulate the consumer to respond (Mazursky and Jacoby
1986) . The present study adds to the theory and model
describing store image presented by Mazursky and Jacoby
(1986) through the identification of specific cues, i.e.
retail crowding (intangible) and merchandise density
(tangible), that affect how the consumer perceives the
store. The proposed model includes these specified cues and
thus serves as an expansion to the store image and retail
crowding models. The findings of this study help to further
define the concept of store image by providing better
understanding of the factors in the store environment that
are contributing to that image--merchandise density and
retail crowding. The study showed that merchandise density
is one of the physical cues and experienced crowding is one
of the psychological cues that influence store image. This
provides additional support to the crowding and image
theories and to the proposed relationship between the two
theories.
The results of the study suggest that different image
levels are associated with a store at high and low levels of
perceived crowding. Mazursky and Jacoby's (1986) defined
store image as "a cognition or affect which is inferred
...from a set of cognitions and perceptions... and which
represents what that phenomenon signifies to the

90
individual". The findings of the present study showed that
one set of perceptions influencing store image is
experienced crowding--perceptions about the merchandise
density levels resulting in affective density. This
supports the theory of store image as internal to the
customer--a psychological or emotional response to the
stimuli. Objective reality in the Mazursky and Jacoby
(1986) store image model includes the features and
characteristics of the store which stimulate the consumer to
respond. Based on the findings of this study, merchandise
density and retail crowding may be included in the model as
identified stimuli.
In addition to the significance of the covariate,
crowding, a significant main effect was found for store
type. This result suggests that differences in the image
response occurred for different store types. A review of
the cell means showed that higher image responses occurred
for the department store condition than for the discount
store condition. Given previous research on store image,
this result is not surprising. Mazursky and Jacoby's
definition said that store image was "a cognition ...
inferred either from a set of ongoing perceptions and/or
memory inputs...". One would expect that consumers have
some preconceived ideas relating store image to store type.
One of the image measures used in other image research has
been to identify, through pre-test, stores that signify high

91
and low image stores and then ask if the treatment store is
more like one or the other. For this study K-Mart, a
national discount chain, and Dillards, a regional department
store, were identified as high and low image stores. Low
image responses, then correspond to a discount store (K-
Mart) and high image to a department store (Dillards). The
results of this study showing varying image responses to the
two store types provides additional support for the Mazursky
and Jacoby definition of store image and the subsequent
store image model. In the model's objective reality, the
details of "store x" provided the stimuli for the subjective
reality or inferencing that resulted in a store image. The
"details" provided by the discount chain and the department
store in this study, then, appear to have resulted in
differences in store images perceived.
Significant two-way interactions occurred between
merchandise type and both density and store type. Further,
the covariate, crowding, appears to be an important
influence on store image perceptions. A review of the cell
means for these interactions provided some insight. Under
high density conditions, higher image ratings occurred for
non-apparel than for apparel for both department and
discount stores. However, under low crowding conditions,
responses to store image were higher for non-apparel
conditions in department stores and lower for non-apparel
conditions in discount stores. These results could have

92
been influenced by the merchandise depicted in the slides.
However, it is possible that the response is related to
expectations of the individuals. In a study of crowding
related to numbers of people, Baum and Greenberg (1975)
showed that subjects anticipating crowding experienced
increased crowding. In discount stores attempts may have
been made to reduce the density in the apparel areas.
Consumers may expect apparel to be crowded, and when those
expectations are not met they may have more favorable
impressions of the store's image.
The two way interaction identified by the analysis
between merchandise type and store type further supports
this notion. In the department store condition, higher
image ratings occurred for non-apparel than apparel (ILDENA
20.01/ILDEA 21.30; IHDENA 35.55/IHDEA 38.49). But in the
discount store condition, higher image ratings occurred for
apparel than for non-apparel (ILDIA 21.96/ILDINA 25.83;
IHDIA 39.36/IHDINA 38.46). This is an interesting finding
since apparel lines often provide higher margins for
retailers than do non-apparel lines, and much of the focus
of image-building advertising for department stores centers
on the apparel lines. One explanation for the discount
store condition response is that typically discount stores
have attempted to upgrade the apparel lines, not only in
terms of product quality, but in merchandise arrangement as
well. Merchandise arrangement of apparel in discount stores

93
is often more like department stores than is the arrangement
of non-apparel lines. That is, arrangement of the apparel
lines in both store types usually follows a boutique-type
arrangement, i.e. circle racks and item racks in a random
arrangement. However, for non-apparel lines, discount
stores often use a grid layout (straight aisles), while
department stores more often arrange non-apparel in boutique
arrangements or shop concepts.
Merchandise Densitv/Store Image Relationship
Based on the results of the ANOVA, this study offers
some insight into how image is influenced by a specific and
very controllable cue in the retail environment--the density
of the merchandise. Because the results of the first two
experiments suggest support for the hypothesized
relationships between density and crowding, and between
crowding and store image, it is not surprising that the
results of an analysis of store image and merchandise
density provided significant main effects. Store type also
produced a significant main effect, but merchandise type did
not. Previous research suggests that store type influences
store image as discussed earlier. There was a three-way
interaction between merchandise density, store type and
merchandise type, and interactions were observed between
merchandise type and each of the other factors*

94
Cell means of the interactions were again informative.
As in the previous analysis, apparel condition received
higher image ratings than non-apparel for the discount store
condition, while non-apparel received higher image ratings
than apparel in the department store condition. Again, this
may be explained by differences in general layout of the
non-apparel categories of merchandise. That is, discount
stores typically display non-apparel merchandise in long
rows while department stores typically take more of a
boutique arrangement approach. Thus, respondents may have
associated the layout depicted in the slide with either
discount or department store and responded accordingly.
Apparel categories, in contrast, are arranged similarly in
discount and departments store and might not have elicited a
differentiating response.
Throughout the development of store image research,
definitions of image have included the influence of both
tangible and intangible elements. As mentioned earlier,
this conceptualization corresponds with and supports the
crowding literature, with tangible elements depicted as
environmental cues and intangible elements encompassing the
crowding response. This study expands on these
conceptualizations by showing that a specific tangible cue,
i.e. merchandise density, influences an intangible response,
i.e. crowding, which subsequently contributes to store
image.
95
Research has identified positive store image as a
factor in store choice selection, product evaluation and
consumer decision making. Research has also identified
environmental cues as important in communicating store
image. The findings of this study have advanced our
knowledge of store image by identifying merchandise density
and the resulting crowding response as important influences
on perceived store image.
Managerial Implications
Retailers are concerned with the image they project to
consumers. This is evidenced to some degree by the
increasing use of institutional advertising focused on
characteristics of the store other than the merchandise
assortment. Managers want to know what image the store is
conveying, and they attempt to insure that the image
projected is the image desired. This focus on image is
particularly important for the two types of stores included
in the present study, department stores and discount stores.
For these store types, products are often undifferentiated
and the shopping experience is critical in securing the
loyalty of consumers. Environmental cues are a part of
communicating emotions and images to consumers, so the
results of the study indicating differing responses to
merchandise density provide important information for retail
managers. Additionally, merchandise density is an element
96
that managers control. Knowing that density levels are
influencing consumer responses to the store, managers can
manipulate that element to create a positive shopping
experience. The following section offers recommendations
for managers of the two store types involved in the study
with a discussion of the implications of the
recommendations.
Merchandise Arrangement and Layout
In order to plan strategic actions, retail managers
need to have an under standing of how consumers are
evaluating store characteristics. Baum and Valin (1977)
showed that colors and architectural features have an
influence on individuals. Building on their results and the
results of this study, managers should consider whether
walls, partitions, close racks and tightly arranged
merchandise are negatively affecting consumers in stores by
increasing the density of the merchandise and increasing
perceived crowding. Previous studies on crowding suggest
that crowding may be a negative force on the shopping
behavior of the consumer. Because merchandise density
appears to be contributing to perceived crowding, retailers
should give serious consideration to layout planning.
Consideration should be given to whether the type of
arrangement is appropriate for the store. Perhaps different
layouts, i.e. grid, boutique, etc., are influencing

97
consumers differently and projecting different images. The
interaction among merchandise density, store type and
merchandise type and the corresponding cell means discussed
in chapter four suggest some variation in layout may be
appropriate. For the high density/discount store condition,
the crowding response was lower for non-apparel than for
apparel. But for the high density department store
condition, there was virtually no difference in crowding
responses under the apparel and non-apparel conditions.
This finding suggests that for discount stores, the effect
of merchandise density may be less for some types of
merchandise than for others. Perhaps the consumer has more
tolerance for crowded conditions in the discounters non-
apparel departments than in their apparel departments. In
that case, for apparel, boutique and free-form arrangements
that typically hold less merchandise may be viewed more
favorably by consumers than the grid arrangements often used
by discount stores. For discount stores that wish to
improve or change their image, some consideration of the
arrangement of non-apparel lines may be warranted given the
findings of this study. The lower image ratings on non-
apparel merchandise conditions under high and low crowding
and density conditions suggest that consumers are not
viewing different departments of the store with the same
image perspective. Perhaps the grid arrangement used by
most discounters for non-apparel suggests a lower

98
image/lower quality retailer. The development of boutique
type arrangements for non-apparel departments like bedding
and bath should be considered by discounters desiring image
improvement.
Maintenance of planned density levels should also be
considered by retail managers. Once layout and density of
merchandise is established at a level that is appropriate
for the retailer's customer group, care should be taken that
those levels are maintained to some degree. Often
merchandise density levels increase to accommodate increased
inventory levels or as a result of a lack of maintenance.
When this occurs, this study suggests that the crowding
levels and subsequent consumer response may be impacted as
well. To avoid this increasing density situation, managers
should consider periodic monitoring of merchandise density
in relation sales potential. A visual inspection in
conjunction with review of original layout plans could be
useful. This is an especially important issue from a
managerial perspective since retailers identify desired
image and go to great lengths to maintain those store
images. Because of lack of differentiation in products,
retailers, particularly discount and department stores,
often use store image to set themselves apart from their
many competitors. Given the results of the study, retailers
should consider the possible image ramifications of high

99
merchandise density and take steps to monitor and maintain
planned merchandise levels.
Despite the evidence that merchandise density is
impacting crowding and store image negatively, managers may
argue that maintaining high density levels increases sales
per square foot and is therefore desirable. What should be
remembered is that image strategies are long term efforts
and may positively influence long terms sales and
profitability. Managers should weigh the pros and cons of
developing creative ways of increasing merchandise density
even though it may temporarily increase sales per square
foot. They should resist the temptation to add racks of
merchandise that create overly dense merchandise
arrangement. The long term effect could be increased
experienced crowding for customers and possible negative
impact on store image.
The controllable elements of the store, like
merchandise density, provide the merchant a means of
influencing consumer behavior within the store setting, as
well as a means of establishing an overall image of the
store. The retailer may be able to use the density level
and subsequent crowding on a day to day basis to influence
images the store projects to the consumer. For example, for
a department store's wardrobe sale, where higher priced
career clothing is featured, an image could be created to
appeal to the target consumer by reducing the merchandise

100
density. This might be accomplished through the use of item
and four-way racks rather than circle racks, or by featuring
fewer duplicate garments and holding additional stock off
the sales floor. Additionally, the density level may be
manipulated to create different crowding perceptions in
conjunction with special events. For example, a retailer
with a low density/low crowding/high image may wish to
increase density levels temporarily to create increased
crowding that may add to the intensity of the promotion.
Although store type and merchandise type were not the
primary focus of the study, the inclusion of these variables
into the experiment did offer some additional insight,
particularly from a managerial perspective. The density by
merchandise interaction that occurred in the first
experiment suggests that the effect of density on
experienced crowding is different under apparel and non-
apparel conditions. If the store image projected under
various crowding levels varies by merchandise type as is
suggested by the results, then arrangement of each category
of merchandise should be considered individually. Possibly
higher densities and higher crowding levels are more
acceptable for some types of merchandise than for others.
This makes sense particularly in the context of merchandise
that is breakable or easily damaged. For example,
consumers may be more intimidated by crowding in a glassware
department than in the jeans department. Another

101
explanation for these results is that perhaps crowding
tolerance levels are higher in non-apparel than apparel.
Consumers may not mind that aisles are narrow, for example,
when shopping for towels, but may find shopping for clothing
in crowded conditions to be unpleasant.
The results indicating that higher images were
projected for non-ap>parel than apparel in department stores
suggests that some consideration should be given to the
focus of image building efforts. Cell means showed that
under both high and low density conditions, image responses
were higher under the non-apparel than the apparel
conditions. This could mean that non-apparel merchandise
reflects a positive store image better, or at least as well
as apparel merchandise. Often image building efforts focus
on apparel merchandise. For example, JCPenney designated
women's apparel as the first product line to be upgraded in
the initial stages of their re-positioning. The results of
this study suggest that non-apparel lines may have been more
effective in projecting a higher image department store.
Perhaps advertisements featuring the bedding and bath shop
are just as important in establishing an image as designer
dresses or sportswear.
The significance of the findings is that this crowding
and image response may influence the individual's shopping
behavior. From a managerial perspective, the findings
suggest that serious consideration should be given the
102
arrangement of merchandise and its density, whether it be in
terms of numbers of units displayed or aisle width and
direction. Many of the elements that determine the level of
density are within the control of the retail manager. For
example, fixture arrangement, aisle width, and number of
displays may contribute to the density level and are
determined by management. Understanding that merchandise
density is contributing to crowding levels allows the
merchant to adapt merchandise arrangement to a crowding
level that is acceptable to their target consumer.
Certainly this crowding level will not be the same from
store to store. In some types of retail situations, a high
level of crowding may simply add to the excitement of the
shopping experience. For example, densely arranged
merchandise may contribute to high levels of crowding during
a sales event, but may be perceived as "part of the fun" to
consumers. The important issue is a recognition that
varying density levels are contributing to different
crowding responses in the consumer, and that merchandise
arrangement may be facilitating or inhibiting the attainment
of shopping goals.
Research Implications and Suggestions for Future Research
This study supports the proposed model's description of
crowding as an antecedent of image formation and the
integration of the crowding literature and the store image
103
literature. The research examined two pieces of a
conceptual model linking the retail crowding concept with
store image. The integration of these two streams of
research contributes to the development of these streams and
provides many additional avenues of investigation. For
example, an important element of the combined crowding/store
image model is that the effect of crowding on store image
may result in formation of an image where none existed,
modification of a previously held image, or reinforcement of
the image currently held by the consumer. In the Eroglu and
Harrell (1986) model, one of the outcomes of experienced
crowding is an emotional evaluation of the shopping
experience. The results of the present study suggest that
the outcome may very well be store image. An informative
area of research would be to address the outcomes of image
formation, modification, and reinforcement as described in
the proposed model.
Another aspect of the model that warrants investigation
is the adaptive behavior that occurs as a result of the
image outcomes. The significance of confirming that
crowding is increased by high density levels and that image
perceptions are lower in high density/high crowding
conditions is that consumers may attempt to reduce
experienced crowding through various behaviors, i.e shopping
elsewhere. Research into what adaptive behaviors are likely

104
to correspond to various crowding conditions would provide
additional useful information.
Another area of interest suggested by the findings is
the influence of control on experienced crowding and/or
image formation. Since the results of the present study-
suggest that high density levels contribute to high
experienced crowding and lower store images, what factors
might moderate that response. Several previous studies have
investigated the control/crowding relationship (Langer and
Saegert 1977; Rodin et al 1978; Schmidt and Keating 1979;
Hui and Bateson 1991). These studies and the present study
could be expanded by examining moderating factors to
crowding in the retail environment. For example, does
signing within the store or available salespeople reduce the
negative effect of high density conditions.
One of the limitations of this study is that it only
addresses one environmental cue, merchandise density.
Certainly, many other environmental cues influence perceived
crowding. Lighting and noise levels, for example, have been
investigated in terms of density due to numbers of people,
but not in relation to store crowding (Desor 1972).
Investigation of other environmental cues within the retail
setting would provide additional insight into the concept.
Given the identification of merchandise density as a
contributor to perceived retail crowding, more thorough
investigation of how various store types and merchandise
105
types effect this relationship would be beneficial. In the
present study, only two store types and two merchandise
types were involved in the analysis. Results suggested that
store type and merchandise type do influence the level of
experienced crowding and store image. While these results
provided some additional information about the variables of
interest, they were not the focus of the study and therefore
did not provide a thorough understanding of how crowding's
impact on store image varies by store type and merchandise
type. An additional aspect of the crowding/image
relationship that warrants research is the influence of
situational factors. Some previous crowding studies have
looked at the circumstances under which store crowding
occurs, but it would be interesting to know under which of
these circumstances the outcome is a positive or negative
store image. For example, do the high density/high
crowding aspects of special events impact the general image
the store projects on a day to day basis? This question has
some significant implications for the way sales and
promotions are handled by retailers.
Because this study focused on merchandise density,
research has been advanced beyond prior crowding studies by
addressing a density created by something other than numbers
of people in a given space. Host crowding literature has
focused on numbers of people in a given space. This study
allows us to take the crowding stream a step farther by
106
adding that one environmental cue, merchandise density, also
contributes to retail crowding. Additionally, the study
contributed to the store crowding stream of research by
providing an empirical investigation of one environmental
cue, merchandise density, and its influence on perceived
crowding. As noted by Eroglu and Machleit (1990), the
impact of environmental factors on shopping behavior is just
emerging as an area of research. This study's results move
the discipline one step further in understanding this
phenomena.
Many retailers are expanding into the international
arena and the cultural differences among countries are
likely to create differences in how density influences
crowding and store image. In countries where personal space
is limited, higher density levels may be more acceptable and
create less experienced crowding than for American
consumers. This study only involved domestic firms and thus
does not address this issue. However, the issue is
significant in that merchandise layouts and even retail
facilities may need to be adapted to accommodate the
differences in consumers.
This study provided a conceptualization and initial
empirical investigation of the crowding/store image
relationship. However, generalizability is limited due to
the nature of the experimental design. While slides have
been shown to be effective in simulating retail settings,

107
generalizability would be enhanced by conducting experiments
within an actual retail setting. Exact duplicate levels of
density and merchandise types were not possible to attain
given the differing store types. However, variables in the
slides were controlled as much as possible to improve
internal validity of the current study.
Certainly, many more relationships remain to be
investigated before complete understanding of the
relationship is gained. However, the present research does
provide an initial empirical investigation of the
relationship between store crowding and store image.
Additionally, the research provided some insight into the
role of merchandise density in the crowding/image
relationship.

APPENDIX A
SLIDE SORTING FORM
108

109
SLIDE SORTING
INSTRUCTIONS:
This process is intended to provide comparative ratings of the scenes depicted in the slides. Please sort the slides into 5 sets ranging from least cluttered/most spacious (1) to most cluttered/least spacious (5) . By-sorting the slides you will be assessing the degree the picture reflects a crowded or cluttered feeling relative to other scenes. For example, by placing a slide in set 4 you are suggesting that the scene appears more crowded than slides in set 3, but appears less crowded than slides in set 5.
An easy approach is to initially pick some obvious extremes (slides belonging in sets 1 and 5)# and then compare other slides to these. Once you have sorted all slides, please review each set and rearrange any slides that look out of place.
Once you are satisfied with the sets, record the numbers on the slides under the appropriate column on the attached sheet.
Thank you very much for your help!
Name: Date:

APPENDIX B
MEANS AND STANDARD DEVIATIONS OF SELECTED SLIDES
110

Ill
MEANS AND STANDARD DEVIATIONS FOR SELECTED SLIDES
Standard Deviation Mean
Low 0 1.0 .8944 1.6 0 2 . 0 .5477 2.6
Medium .4472 2.8 .7071 3.0 .7071 3.0 1.0 3.2
High 0 5.0 .5477 4.6 .5477 4.6 .7071 4.0

APPENDIX C
IMAGE PRETEST 1
112

113
Instructions: Read the following statement and enter your responses on the lines provided. The order of your responses need not reflect rank order.
1. I consider the following stores to be high image retailers. I wouldn't be embarrassed for my friends to know I purchased their birthday gifts there.
2. I think the following four stores have a low image. I would prefer that my friends not know I purchased their birthday gifts at these stores.
APPENDIX D
IMAGE PRETEST 2
114

115
Instructions:
How do you think the following stores rank (1-5) in terms of having a high store image? Place a 1 by the store that you think has the highest image, 2 by the store with the second highest image, etc.
JCPenney Neiman Marcus Foley's Dillard's Macy's
How do you think the following stores rank (1-5) in terms of having a low store image? Place a 1 by the store that you think has the lowest store image, 2 by the store with the second lowest image, etc.
Target Montgomery Ward K-Mart Sears Walmart

APPENDIX E
QUESTIONNAIRE
116

117
Instructions Observe the store setting shown in the slide as you answer the following questions. Circle the number on the scale (from 1 to 7) which best reflects your feelings.
Slide 1
Using the following items , how would you describe this store?
confined spacious [1] [2] [33 [4] [5] [63 [73
allows free restricts movement [13 [2] [3] [43 [53 [6] [73 movement
crowded Cl] [2] [33 [4] [53 [63 [7] uncrowded
loose [1] [2] [33 [43 [53 [6] [7] packed
restraining [13 [2] [33 [43 [53 [63 [73 open
stuffy [13 [2] [33 [4] [5] [6] [7] not stuffy
cramped [l] [2] [3] [43 [53 [6] [73 not cramped
comfortable [l] [2] [3] [43 [5] [6] [7] not comfortable
Using the following items, describe the extent that you think the store in the slide has these characteristics.
high prices [13 [2] [3] [4] [53 [63 [7] low prices
trendy [13 [23 [33 [4] [5] [63 [73 not trendy
low quality merchandise [13 [23 [33 [4] [5] [63 [73
high quality merchandise
sophisticated customers [l] [23 [33 [43 [5] [63 [73
unsophist. customers
organized [13 [23 [33 [43 [5] [63 [73 unorganized
unfashionable [13 [2] [3] [4] [5] [6] [7] fashionable
CONTINUE TO THE NEXT PAGE

118
Indicate the degree that you agree or disagree with the following statements.
This store is more like Dillards than K-Mart.
Strongly Strongly Agree [1] [2] [3] [4] [5] [6] [7] Disagree
This store would probably appeal more to blue collar shoppers than to white collar, professional shoppers.
Strongly Strongly Agree [1] [2] [3] [4] [5] [6] [7] Disagree
STOP. WAIT FOR THE NEXT SLIDE.

119
Indicate the frequency that you shop in the following stores.
Foleys
K-Mart
Penneys
Pier 1
Walmart
Dillards
Target
Never Once a year or less 2 to 6 times a year 7 to 12 times a year 2 to 3 times a month Once a week or more
Never Once a year or less 2 to 6 times a year 7 to 12 times a year 2 to 3 times a month Once a week or more
Never Once a year or less 2 to 6 times a year 7 to 12 times a year 2 to 3 times a month Once a week or more
Never Once a year or less 2 to 6 times a year 7 to 12 times a year 2 to 3 times a month Once a week or more
Never Once a year or less 2 to 6 times a year 7 to 12 times a year 2 to 3 times a month Once a week or more
Never Once a year or less 2 to 6 times a year 7 to 12 times a year 2 to 3 times a month Once a week or more
Never Once a year or less 2 to 6 times a year 7 to 12 times a year 2 to 3 times a month Once a week or more

120
5. Finally, please give us the following information about yourself.
Your age
Sex:
Education:
Annual Income:
19 or less 20 to 29 30 to 39 40 to 49 50 to 64 65 or older
Female Male
Less than high school Some high school High school graduate Some college college graduate
Less than $10,000 $10,000 to $19,999 $20,000 to $29,999 $30,000 to $39,999 $40,000 to $49,999 $50,000 and above
THANK YOU VERY MUCH FOR YOUR HELP.

REFERENCES
Arons, Leon, (1961), "Does Television Viewing Influence Store Image and Shopping Frequency?," Journal of Retailing, 37, (Fall), 1-13.
Bateson, John E. G. and Michael K. Hui, (1992), "The Ecological Validity of Photographic Slides and Videotapes in Simulating the Service Setting," Journal of Consumer Research, 19 (September), 271-281.
Baum, Andrew and Glenn E. Davis, (1976), "Spatial and Social Aspects of Crowding Perception," Environment and Behavior, 8 (December), 527-544.
, Andrew, and Carl I. Greenberg, (1975), "Waiting for a Crowd:The Behavioral and Perceptual Effects of Anticipated Crowding," Journal of Personality and Social Psychology, 32,671-679.
, Andrew, R. Edward Harpin, and Stuart Valins, (1976), "The Role of Group Phenomenon in the Experience of Crowding," Crowding in Real Environments, 25, 59-72.
, Andrew and Stuart Koman, (1976), "Differential Response to Anticipated Crowding: Psychological Effects of Social and Spatial Density," Journal of Personality and Social Psychology, 34, 526-536.
/ Andrew, Marc Riess, and John O'Hara, (1974), "Architectural Variants of Reaction to Spatial Invasion," Environment and Behavior, 6 (March), 91-100.
# Andrew and S. Valin, (1977), "Residential Environments, Group Size and Crowding," Proceedings of the 81st Annual Convention of the American Psychology Association, 8, 211-212.
Bearden, William O., (1977), "Determinant Attributes of Store Patronage: Downtown Versus Outlying Shopping Centers," Journal of Retailing, 53 (Summer), 15-22.
Belk, Russell W., (1975), "Situational Variables and Consuer Behavior," Journal of Consumer Research, 2 (December), 157-164.
121

122
Berry, Leonard, (1969), "The Components of Department Store Image: A Theoretical and Empirical Analysis," Journal of Retailing, 45, (Spring), 3-20.
Cardoza Richard N., (1974-1975), "How Images Vary by Product Class," Journal of Retailing, 50, (Winter), 85-98.
Churchill, G. A., (1979), "A Paradigm for Developing Better Measures of Marketing Constructs," Journal of Marketing Research, 16, (February), 64-73.
Cook, Thomas D. and Donald T. Campbell, (1979), Quasi-Experimentation: Design and Analysis Issues for Field Settings, Houghton Mifflin Company, Boston.
Cox, Charles E., Jr., (1974), "An Analysis of Infrequent Shopper Attitudes Towards Department Store Appeals," Unpublished master's thesis. The University of Tennessee.
D'Atri, David A., (1976), "Psychophysiological Responses to Crowding," Crowding in Real Environments, 25, 111-126.
Desor, J. A., (1972), "Toward a Psychological Theory of Crowding, Journal of Personality and Social Psychology, 21, 69-83.
Dichter, Ernest, (1985), "What's in an Image?," Journal of Consumer Marketing, 2 (Winter), 75-81.
Dickson, John P. and Douglas L. MacLachlan, (1990), "Social Distance and Shopping Behavior," Journal of the Academy of Marketing Science, 18 (Spring), 153-161.
Donovan, Robert J. and John R. Rossiter, (1982), "Store Atmosphere: , An Environmental Psychology Approach," Journal of Retailing, 58 (Spring), 34-57.
Dornoff, Ronald J. and Ronald L. Tatham, (1972), "Congruence Between Personal Image and Store Image," Journal of the Market Research Society, 14 (January).
Doyle, Peter and Ian Fenwick, (1974-1975), "How Store Image Affects Shopping Habits in Grocery Chains," Journal of Retailing, 50 (Winter), 39-52.
Eroglu, Ayse Sevgin, (1985), Retail Crowding: An Investigation of Antecedents and Consequences. Doctoral Dissertation, Michigan State University.
Eroglu, Sevgin A. and Karen A. Machleit, (1990), "An Empirical Study of Retail Crowding" Journal of Retailing, 66 (Summer), 201-221.

123
Sevgin and Gilbert D. Harrell, (1986), "Retail Crowding: Theoretical and Strategic Implications," Journal of Retailing, 62 (Winter), 346-363.
Fisk, G. (191), "A Conceptual Model for Studying Customer Image," Journal of Retailing, 37 (Winter), 1-8, 54.
Grove, Stephen J. and Raymond P. Fisk, (1983), "The Dramaturgy of Services Exchange: An Analytical Framework for Services Marketing," AMA Services Conference, 45-49.
Hair, Joseph F. Jr., Ralph E. Anderson, and Ronald L. Tatham, (1987), Multivariate Data Analysis, Macmillan Publishing Company, New York.
Harrell, Gilbert D. and Michael D. Hutt, (1976), "Crowding in Retail Stores," MSU Business Topics, 24, 33-39.
Harrell, Gilbert D., Michael D. Hutt, and James C. Anderson, (1980), "Path Analysis of Buyer Behavior Under Conditions of Crowding," Journal of Marketing Research, 17 (February), 45-51.
Heller, Jack F., Bradford D. Groff, and Sheldon H. Soloman, (1977), "Toward an Understanding of Crowding: The Role of Physical Interaction," Journal of Personality and Social Psychology, 35, 183-190.
Herrington, J. Duncan and Louis M. Capella, (1991), "Affective Retail Environments: The Effects of Retail Environments on Shopper Mood, Shopping Time, and Product Deliberation," Advances in Marketing, Southwestern Marketing Association, (Spring), 132-138.
Hui, Michael K. and John E. G. Bateson, (1991), "Perceived Control and the Effects of Crowding and Consumer Choice on the Service Experience," Journal of Consumer Research, 18 (September), 174-184.
James, Don L., Richard M. Durand and Robert A. Dreves, (1976), "The Use of a Multi-Attribute Attitude Model in a Store Image Study," Journal of Retailing. 52 (Summer), 23-32 .
Jenkins, Roger L. and Sandra Monk Forsythe, (1980), "Retailing Image Research: State of the Art Review with Implications for Retailing Strategy," Developments in Marketing Science. 189-194.
Judd, Charles M. and Gary H. McClelland, (1989), Data Analysis: A Model-Comparison Approach. Harcourt Brace Jovanovich, San Diego.

124
Keppel, Geoffrey (1973), Design and Analysis: A Researcher's Handbook, Prentice-Hall, Inc., Englewood Cliffs, New Jersey.
Kidder, Louise H. and Charles M. Judd, (1986) Research Methods in Social Relations, Holt, Rinehart and Winston, Inc., Fort Worth, Texas.
Kotler, P., (1974), "Atmospherics As a Marketing Tool," Journal of Retailing, 41 (Winter), 48-64.
Kunkel, John and Leonard Berry, (1968), "A Behavioral Conception of Retail Image," Journal of Marketing, 32 (October), 21-27
Langer, Ellen J., and Susan Saegert, (1977), "Crowding and Cognitive Control," Journal of Personality and Social Psychology, 35, 175-182.
Lawrence, John E.S., (1974), "Science and Sentiment: Overview of Research on Crowding and Human Behavior," Psychological Bulletin, 81, 712-720.
Lessig, V. Parker, (1973), "Consumer Store Images and Store Loyalties," Journal of Marketing, (October), 72-74.
Lewis, Barbara R. and Angela Hawksley, (1990), "Gaining a Competitive Advantage in Fashion Retailing," International Journal of Retail and Distribution Management, 18, 21-32.
Lindquist, Jay, (1974-1975), "Meaning of Image," Journal of Retailing, 50, (Winter), 29-38.
Locke, E. A., (1969), "What Is Job Satisfaction?" Organizational Behavior and Human Performance, 4, 309-336.
Lozar, Charles C., (1974), "Measurement Techniques Towards a Measurement Technology," Man-Environment Interactions: Evaluations and Applications, Part II. 171-191.
Markin, Rom, Charles M. Lillis, and Chem L. Narayana, (1976), "Social-Psychological Significance of Store Space," Journal of Retailing, 52 (Spring), 43-54.
Martineau, Pierre, (1958), "The Personality of the Retail Store,"Harvard Business Review, (Jan.-Feb.), 47-55.
Mazursky, David and Jacob Jacoby, (1986), "Exploring the Development of Store Images," Journal of Retailing, 62 (Summer), 145-165.
125
McClelland, Lou and Nathan Auslander, (1978), "Perceptions of Crowding and Pleasantness in Public Settings," Environment and Behavior, 10 (December),
Mehrabian, A. and J. A. Russell (1974), An Approach to Environmental Psychology, MIT Press, Cambridge, MS.
Milgram, S., (1970), "The Experience of Living in Cities," Science, 167, 1461-1468.
Moos, Rudolf H., (1976), The Human Context; Environmental Determinants of Behavior, John Wiley and Sons, New York.
Nevin, John R. and Michael J. Houston, (1980), "Image as a Component of Attraction to Intraurban Shopping Areas," Journal of Retailing, 56 (Spring), 77-93.
Norusis, Marija J., (1990), SPSS/PC+ 4.0 Manual.
O'Connor, Michael J., (1992), "Image," Supermarket Business, (January), p.35-37? 68-69.
Olson, J., (1972), Cue Utilization in the Quality Perception Process; A Cognitive Model and An Empirical Test, Doctoral Dissertation, Purdue University.
Oxenfeldt, Alfred, (1974-1975), "Developing a Favorable Price-Quality Image," Journal of Retailing, 50, (Winter), 8-14.
Parsons, Henry M., (1974), "Why Human Factors Research in Environmental Design?" Man-Environment Interactions; Evaluations and Applications, Part II. 1-11.
Peterson, Robert A. and Roger A. Kerin, (1983), "Store Image Measurement in Patronage Research; Fact and Artifact," Patronage Behavior and Retail Management, ed. William R. Darden and Robert F. Lusch, 293-306.
Rapoport, Amos, (1976), "Toward a Redefinition of Density," Crowding in Real Environments. 25, 7-32.
Reich, J., J. M. Ferguson, and M. G. Weinberger, (1977), "An Information Integration Analysis of Retail Store Image," Journal of Applied Psychology. 62 (October), 609-614.
Rich, Stuart U. and Bernard D. Portis, (1964), "The 1Imageries' of Department Stores," Journal of Marketing, 28 (April), 10-15.

126
Rodin, Judith, Susan K. Solomon, and John Metcalf, (1978), "Role of Control in Mediating Perceptions of Density," Journal of Personality and Social Psychology, 36.9, 988-999.
Rosenbloom, Bert, (1983), "Store Image Development and the Question of Congruency," Patronage Behavior and Retail Management, ed. William R. Darden and Robert F. Lusch, 141-149.
Saegert, Susan, Elizabeth Mackintosh, and Sheree West, (1976), "Two Studies of Crowding in Urban Public Places," Crowding in Real Environments, 25, 33-58.
Schellinck, D.A., (1982), "Cue Choice as a Function of Time Pressure and Perceived Risk," in Advances in Consumer Research, X Ann Arbor, MI: Association for Consumer Research, 470-475.
Schiffman, Leon G., Joseph H. Dash, and William R. Dillon, (1977), "The Contribution of Store-Image Characteristics to Store-Type Choice," Journal of Retailing, 53 (Summer), 3-14,68.
Schmidt, Donald E., and John P. Keating, (1979), "Human Crowding and Personal Control: An Integration of the Research," Psychological Bulletin, 86, 680-700.
Sheth, Jagdish N., (1983), "An Integrative Theory of Patronage Preference and Behavior," Patronage Behavior and Retail Management, ed. William R. Darden and Robert F. Lusch, 9-28.
Sommer, R, and Becker, F.D., (1971), "Room Density and User Satisfaction," Environment and Behavior, 3, 412-417.
Steenkamp, Jan-Benedict E.M., and Michel Wedel, (1991), "Segmenting Retail Markets on Store Image Using a Consumer-based Methodology, " Journal of Retailing, 67 (Fall), 300-320.
Stokals, Daniel, (1972), "On the Distinction Between Density and Crowding: Some Implications for Future Research," Psychological Review, 79, 275-277.
Daniel, Marilyn Hall, Berna Pinner, and John Schopler, (1973), "Physical, Social, and Personal Determinants of the Perception of Crowding," Environment and Behavior. 5 (March), 87-115.
Tauber, Edward (1972), "Why Do People Shop?", Journal of Marketing, 36, 46-59.

127
Thorelli, Hans B., Jeen-Su Lim, and Jongsuk Ye, (1989), "Relative Importance of Country of Origin, Warranty, and Retail Store Image on Product Evaluations," International Marketing Review, 6.1, 35-46.
Villanova, Lisa, George Zinkhan, and Michael Hyman, (1990) , "On Defining and Measuring Store Image," Developments of Marketing Science, Academy of Marketing Science, 70.
Westbrook, R. A., (1981), "Sources of Consumer Satisfaction Within Retail Outlets," Journal of Retailing, 57 (Fall), 68-85.
Winer, B.J., (1971), Statistical Principles in Experimental Design, McGraw-Hill Book Company, New York, New York.
Worchel, Stephen and Charles Teddlie (1976), "The Experience of Crowding: A Two-Factor Theory," Journal of Personality and Social Psychology, 34, 30-40.
Wright, Peter, (1974), "The Harassed Decision Maker: Time Pressures, Distractions, and the Use Of Evidence," Journal of Applied Psychology, 59, 555-561.