Embed Size (px)
Citation preview
Title: The microstructure and magnetoelectric properties of multiferroic composites Author: Joanna Agnieszka Bartkowska, Dariusz Bochenek, Przemysław Niemiec
Citation style: Bartkowska Joanna Agnieszka, Bochenek Dariusz, Niemiec Przemysław. (2018). The microstructure and magnetoelectric properties of multiferroic composites. "Archives of Metallurgy and Materials" (T. 63, iss. 2 (2018), s. 853-858)
Arch. Metall. Mater. 63 (2018), 2, 853-858
J.A. BARTKOWSKA*#, D. BOCHENEK*, P. NIEMIEC*
THE MICROSTRUCTURE AND MAGNETOELECTRIC PROPERTIES OF MULTIFERROIC COMPOSITES
Multiferroic composites are very promising materials because of their applicability because the magnetoelectric effect oc-curs in them. The subject of the study were two multiferroic ceramic composites: leaded obtained from powder of the composition PbFe0.5Nb0.5O3 and ferrite powder of the composition Ni0.64Zn0.36Fe2O4 and unleaded which was obtained from the powder of the composition BaFe0.5Nb0.5O3 and the same ferrite powder Ni0.64Zn0.36Fe2O4. For the both multiferroic materials the following studies were conducted: SEM, BSE, EDS, XRD and the temperature dependence of dielectric constant ε (T ). Using the previously developed method of calculating the magnetoelectric coupling factor (g), based on dielectric measurements, the magnitude of the magnetoelectric effect in the multiferroic composites was determined.
Keywords: composites, dielectric constant, magnetoelectric coupling coefficient, multiferroics
1. Introduction
Multiferroic ceramic composites consist of two phases, namely the magnetic phase and the ferroelectric phase. The magnetic phase exhibits magnetostrictive properties, while the ferroelectric phase is the piezoelectric phase. The external magnetic field applied to the multiferroic composite, changes the shape of the magnetic phase. Changing the shape of magnetic phase has an influence on the piezoelectric phase. Namely, the piezoelectric phase changes its shape, resulting in polarization. In this way, the magnetic field can influence the polarization of the multiferroic composite material. Thus the stress is responsible for the magnetoelectric coupling. [1-10]. Multiferroic composites are very promising materials for application viewpoint, because they can find application as sensors, transducers, microwave devices, read/write devices [11-13].
The aim of this paper is to determine magnitude of the magnetoelectric effect in two kind of multiferroic ceramic composites, leaded (PFN-ferrite) and leaded-free (BFN-ferrite). The authors were demonstrated the relationship between the microstructure of the multiferroic composites and the magnitude of the magnetoelectric effect.
2. Experimental
The object of the study was two multiferroic ceramic com-posites: leaded PbFe0.5Nb0.5O3 material with Ni0.64Zn0.36Fe2O4 ferrite powder (PFN-ferrite) and leaded-free BaFe0.5Nb0.5O3
material with the same kind of Ni0.64Zn0.36Fe2O4 ferrite powder (BFN-ferrite). These composites are materials with ferroelec-tric and simultaneously ferrimagnetic properties which exhibit magnetoelectric coupling.
The PFN ceramic powder, which was the main component of the first multiferroic composite, was synthesized by free sintering method from the mixture of simple oxides in the solid phase at 900°C for 2 h. The ferrite powder was obtained by the calcination method at 1000°C for 4 h [14]. The BFN ceramic powder, which made the matrix of the second multiferroic com-posite, was synthesized by the calcination method at 1250°C for 4 h while the ferrimagnetic component of this composite, (Ni0.64Zn0.36Fe2O4 ferrite powder) has been synthesized by calcination method at 1100°C for 4 h [15]. The obtained PFN and BFN powders have been mixed in the weight ratio 9:1, with ferrite powder and synthesized at 1050°C for 2 h and at 1250°C for 4 h, respectively for PFN-ferrite and BFN-ferrite compos-ites. In this way two magnetoelectric composites were obtained [14,15].
Microscopic investigations were performed on the fracture of specimens, using the scanning electron microscopy (JEOL JSM-7100F TTL LV) and backscattered electron detector (BSE). The analysis of the chemical composition in microar-eas was performed by the standard method, using an energy dispersive spectrometer (EDS). Dielectric measurements were performed on the QuadTech1920 LCR meter for frequency range of 0.02 kHz to 20 kHz and for a cycle of heating (from 20 to 400oC). For dielectric testes silver electrodes were applied to the sample surfaces.
* UNIVERSITY OF SILESIA IN KATOWICE, FACULTY OF COMPUTER SCIENCE AND MATERIALS SCIENCE, INSTITUTE OF TECHNOLOGY AND MECHATRONICS, 12, ŻYTNIA STR., 41-200 SOSNOWIEC, POLAND
# Corresponding author: [email protected]
DOI: 10.24425/122414
854
3. Results and discussion
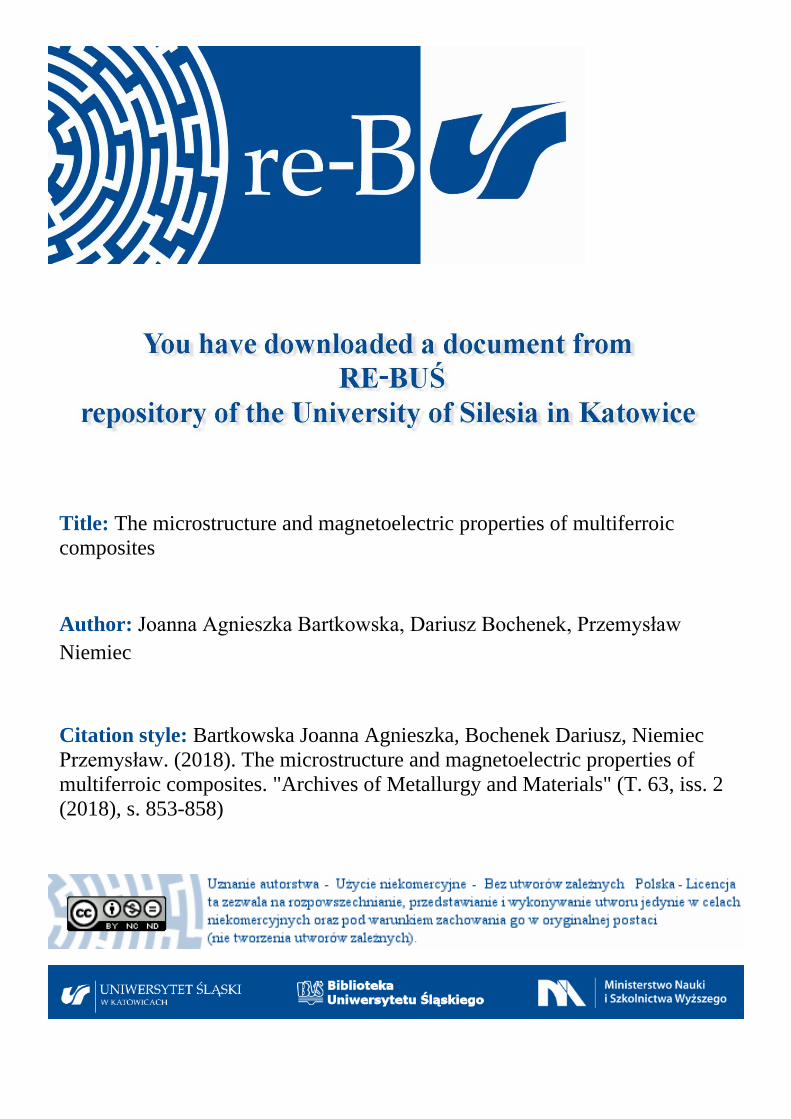
Results of studies of microstructure of fracture for the magnetoelectric PFN-ferrite composite have been presented in Fig. 1.
Fig. 1. SEM images of the microstructure of fracture of magnetoelectric PFN-ferrite composite
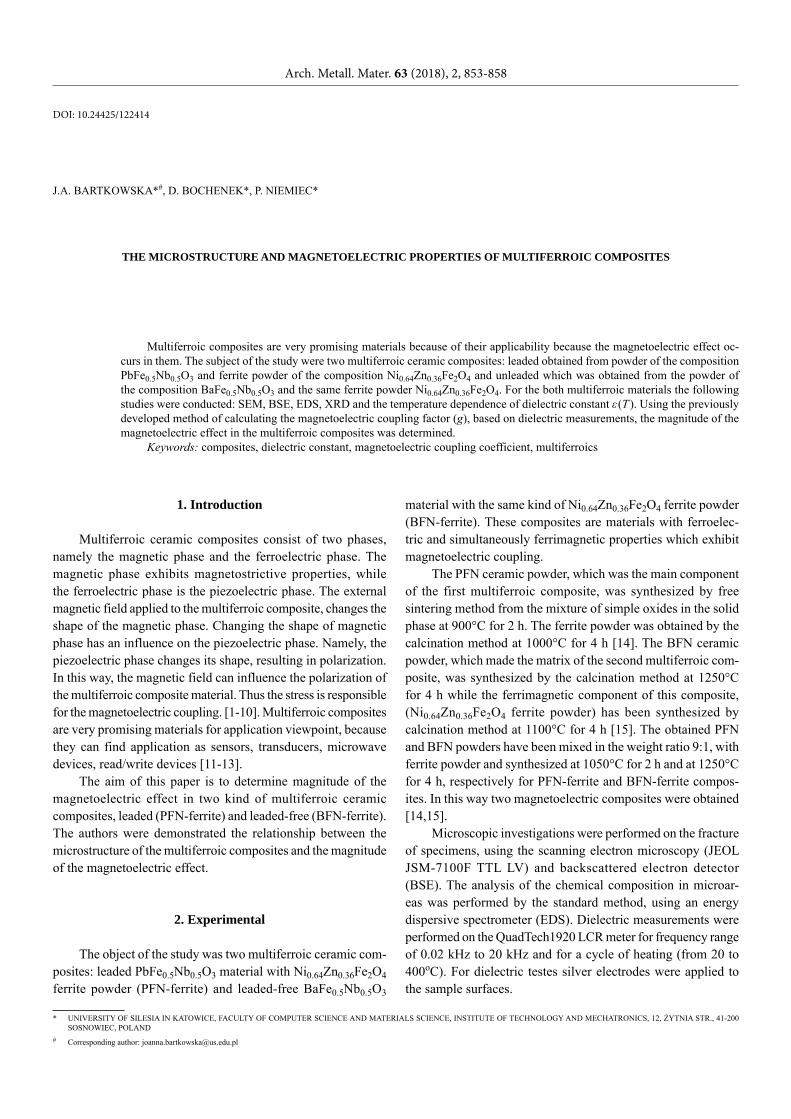
The SEM images show, that the microstructure of PFN-ferrite composite, is characterized by two types of grains, larger (matrix grains) and smaller (ferrite grains) ones. Small grains have more regular shape than large ones. The microstructure of this composite is characterized by visible grains boundaries too. The SEM images obtained for multiferroic composite BFN-ferrite, and presented in Fig. 2, show that the microstructure of this multiferroic composite is characterized by two kinds of grains. The larger grains reveal irregular grain boundaries while the smaller ones seem to have a more regular shape. The bound-ary layer between grains is imprecisely determined.
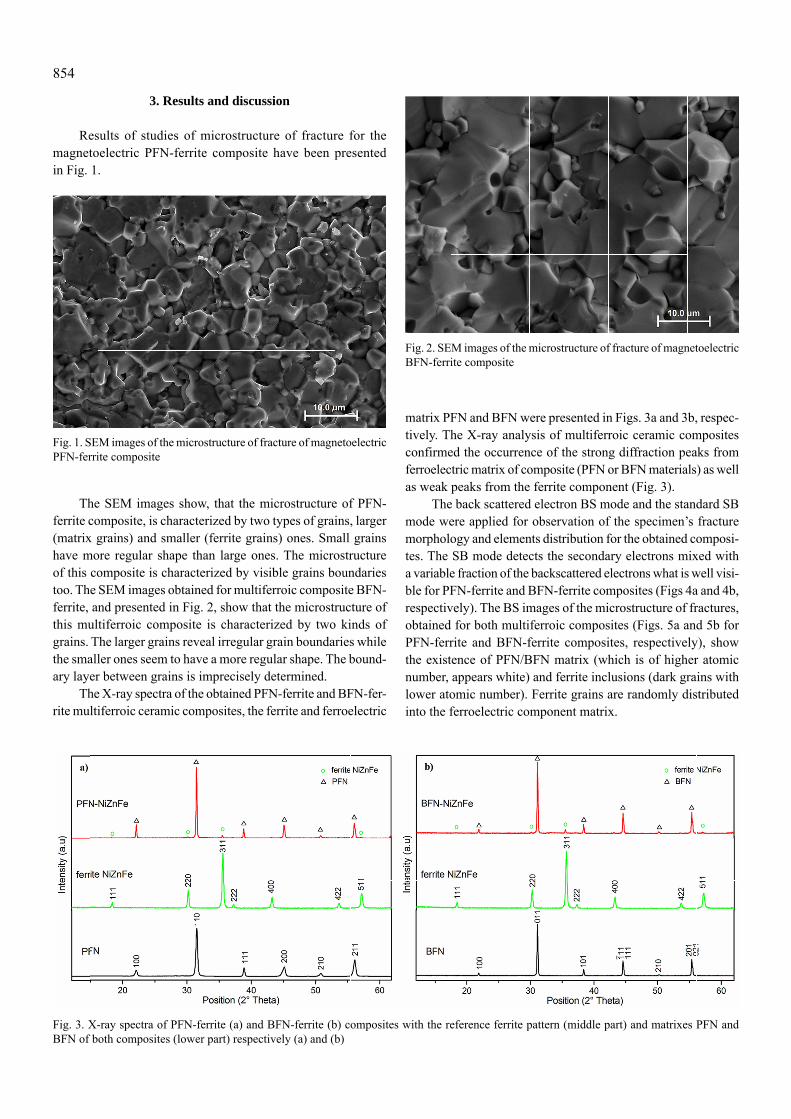
The X-ray spectra of the obtained PFN-ferrite and BFN-fer-rite multiferroic ceramic composites, the ferrite and ferroelectric
matrix PFN and BFN were presented in Figs. 3a and 3b, respec-tively. The X-ray analysis of multiferroic ceramic composites confirmed the occurrence of the strong diffraction peaks from ferroelectric matrix of composite (PFN or BFN materials) as well as weak peaks from the ferrite component (Fig. 3).
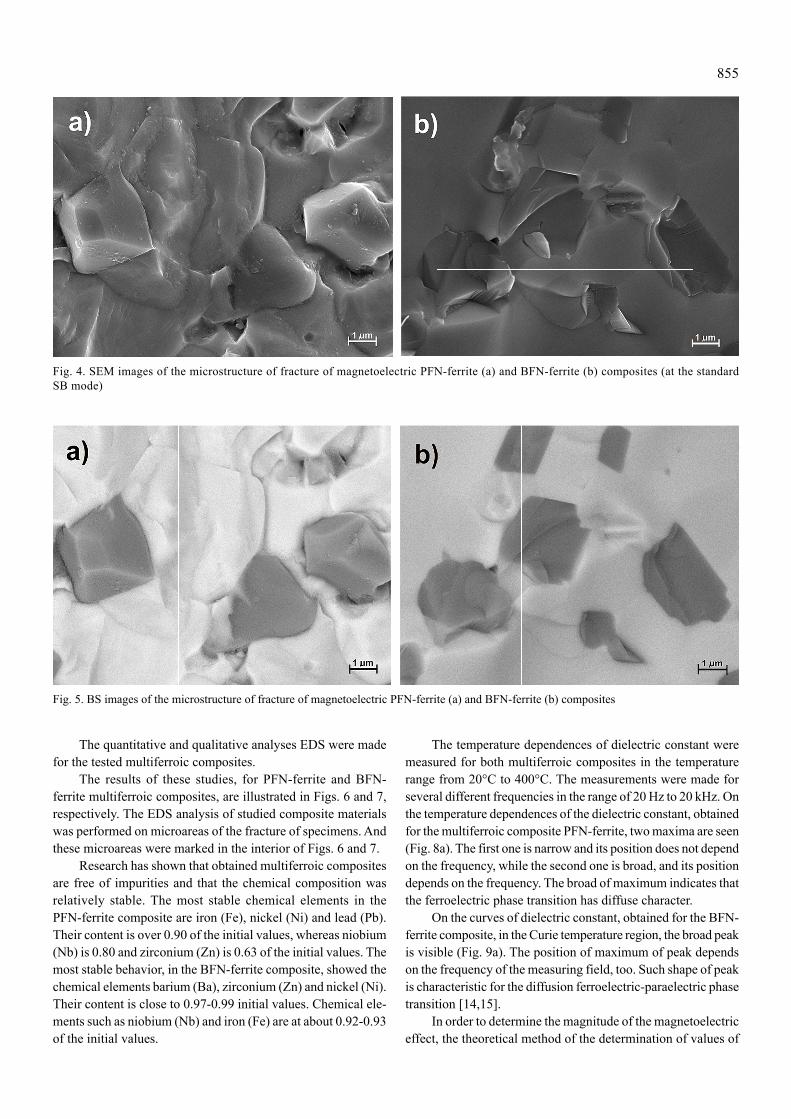
The back scattered electron BS mode and the standard SB mode were applied for observation of the specimen’s fracture morphology and elements distribution for the obtained composi-tes. The SB mode detects the secondary electrons mixed with a variable fraction of the backscattered electrons what is well visi-ble for PFN-ferrite and BFN-ferrite composites (Figs 4a and 4b, respectively). The BS images of the microstructure of fractures, obtained for both multiferroic composites (Figs. 5a and 5b for PFN-ferrite and BFN-ferrite composites, respectively), show the existence of PFN/BFN matrix (which is of higher atomic number, appears white) and ferrite inclusions (dark grains with lower atomic number). Ferrite grains are randomly distributed into the ferroelectric component matrix.
Fig. 3. X-ray spectra of PFN-ferrite (a) and BFN-ferrite (b) composites with the reference ferrite pattern (middle part) and matrixes PFN and BFN of both composites (lower part) respectively (a) and (b)
Fig. 2. SEM images of the microstructure of fracture of magnetoelectric BFN-ferrite composite
855
The quantitative and qualitative analyses EDS were made for the tested multiferroic composites.
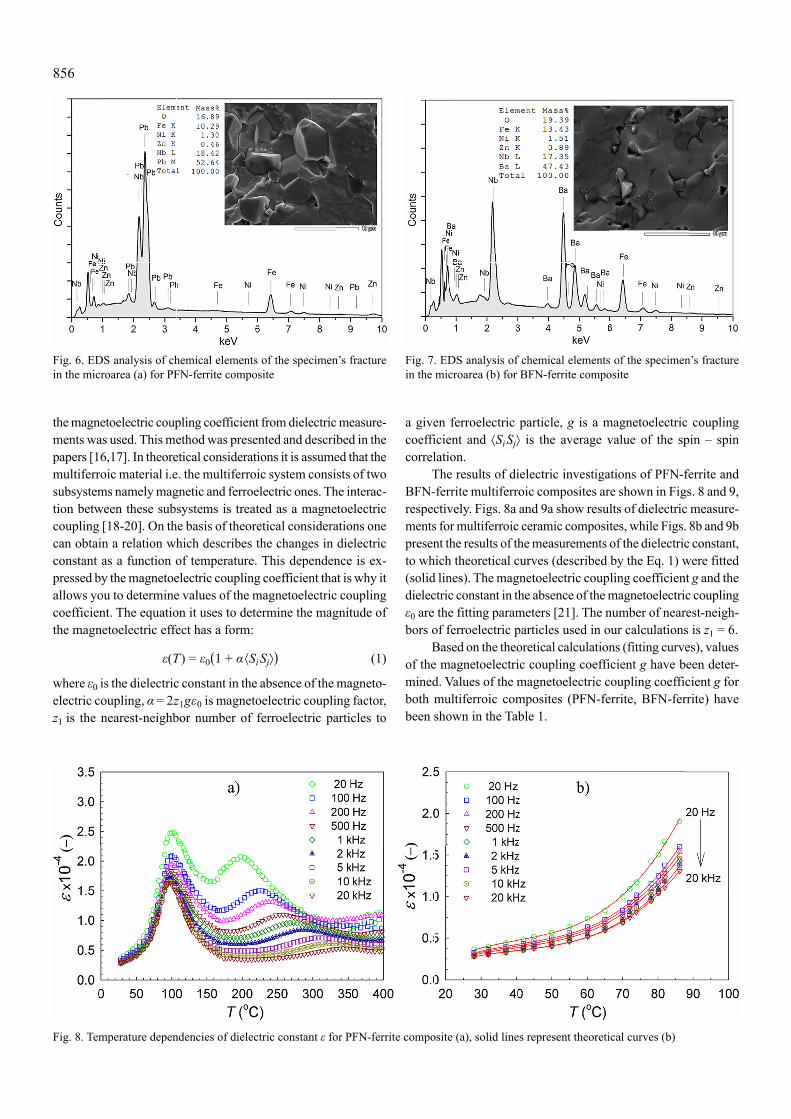
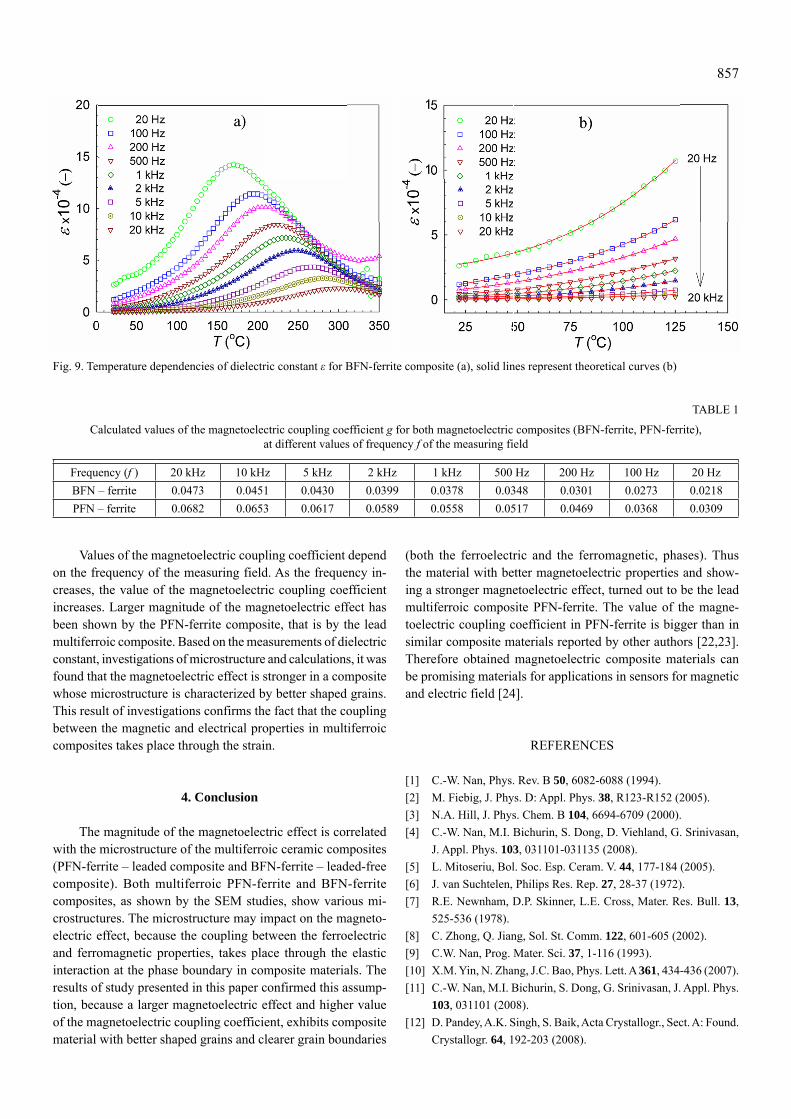
The results of these studies, for PFN-ferrite and BFN-ferrite multiferroic composites, are illustrated in Figs. 6 and 7, respectively. The EDS analysis of studied composite materials was performed on microareas of the fracture of specimens. And these microareas were marked in the interior of Figs. 6 and 7.
Research has shown that obtained multiferroic composites are free of impurities and that the chemical composition was relatively stable. The most stable chemical elements in the PFN-ferrite composite are iron (Fe), nickel (Ni) and lead (Pb). Their content is over 0.90 of the initial values, whereas niobium (Nb) is 0.80 and zirconium (Zn) is 0.63 of the initial values. The most stable behavior, in the BFN-ferrite composite, showed the chemical elements barium (Ba), zirconium (Zn) and nickel (Ni). Their content is close to 0.97-0.99 initial values. Chemical ele-ments such as niobium (Nb) and iron (Fe) are at about 0.92-0.93 of the initial values.
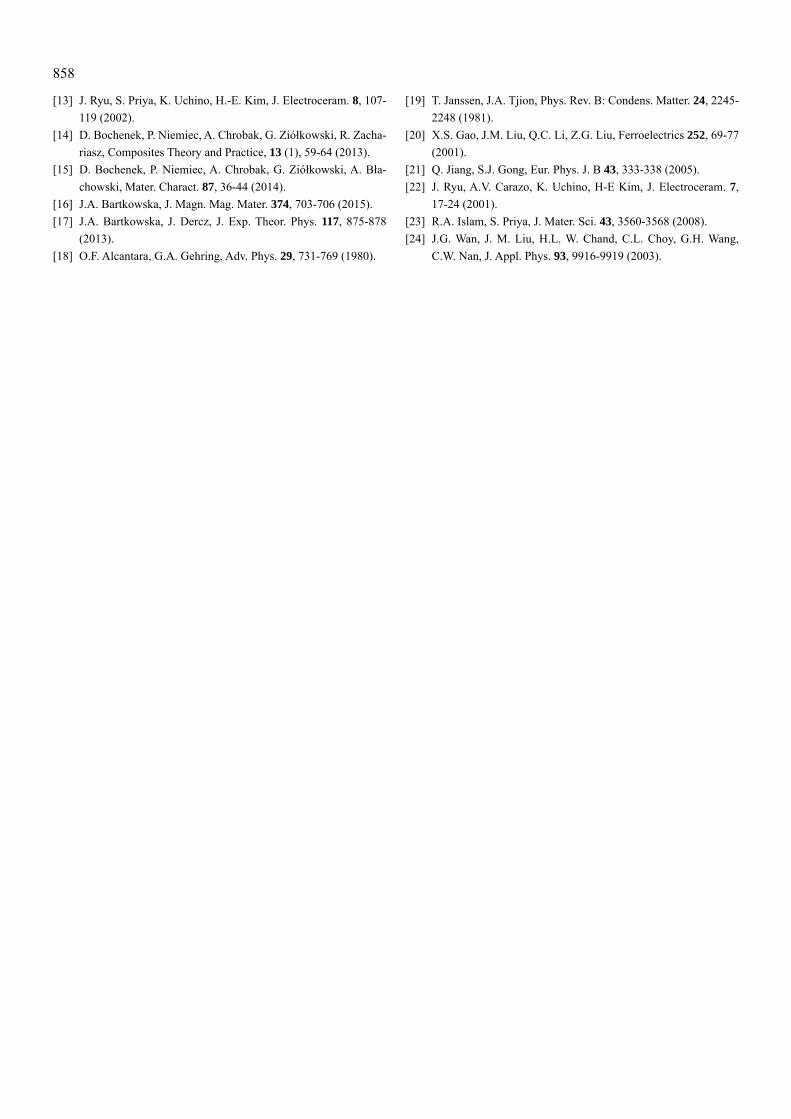
The temperature dependences of dielectric constant were measured for both multiferroic composites in the temperature range from 20°C to 400°C. The measurements were made for several different frequencies in the range of 20 Hz to 20 kHz. On the temperature dependences of the dielectric constant, obtained for the multiferroic composite PFN-ferrite, two maxima are seen (Fig. 8a). The first one is narrow and its position does not depend on the frequency, while the second one is broad, and its position depends on the frequency. The broad of maximum indicates that the ferroelectric phase transition has diffuse character.
On the curves of dielectric constant, obtained for the BFN-ferrite composite, in the Curie temperature region, the broad peak is visible (Fig. 9a). The position of maximum of peak depends on the frequency of the measuring field, too. Such shape of peak is characteristic for the diffusion ferroelectric-paraelectric phase transition [14,15].
In order to determine the magnitude of the magnetoelectric effect, the theoretical method of the determination of values of
Fig. 4. SEM images of the microstructure of fracture of magnetoelectric PFN-ferrite (a) and BFN-ferrite (b) composites (at the standard SB mode)
Fig. 5. BS images of the microstructure of fracture of magnetoelectric PFN-ferrite (a) and BFN-ferrite (b) composites
856
the magnetoelectric coupling coefficient from dielectric measure-ments was used. This method was presented and described in the papers [16,17]. In theoretical considerations it is assumed that the multiferroic material i.e. the multiferroic system consists of two subsystems namely magnetic and ferroelectric ones. The interac-tion between these subsystems is treated as a magnetoelectric coupling [18-20]. On the basis of theoretical considerations one can obtain a relation which describes the changes in dielectric constant as a function of temperature. This dependence is ex-pressed by the magnetoelectric coupling coefficient that is why it allows you to determine values of the magnetoelectric coupling coefficient. The equation it uses to determine the magnitude of the magnetoelectric effect has a form:
ε(T) = ε0(1 + α SiSj) (1)
where ε0 is the dielectric constant in the absence of the magneto-electric coupling, α = 2z1gε0 is magnetoelectric coupling factor, z1 is the nearest-neighbor number of ferroelectric particles to
a given ferroelectric particle, g is a magnetoelectric coupling coefficient and SiSj is the average value of the spin – spin correlation.
The results of dielectric investigations of PFN-ferrite and BFN-ferrite multiferroic composites are shown in Figs. 8 and 9, respectively. Figs. 8a and 9a show results of dielectric measure-ments for multiferroic ceramic composites, while Figs. 8b and 9b present the results of the measurements of the dielectric constant, to which theoretical curves (described by the Eq. 1) were fitted (solid lines). The magnetoelectric coupling coefficient g and the dielectric constant in the absence of the magnetoelectric coupling ε0 are the fitting parameters [21]. The number of nearest-neigh-bors of ferroelectric particles used in our calculations is z1 = 6.
Based on the theoretical calculations (fitting curves), values of the magnetoelectric coupling coefficient g have been deter-mined. Values of the magnetoelectric coupling coefficient g for both multiferroic composites (PFN-ferrite, BFN-ferrite) have been shown in the Table 1.
Fig. 6. EDS analysis of chemical elements of the specimen’s fracture in the microarea (a) for PFN-ferrite composite
Fig. 7. EDS analysis of chemical elements of the specimen’s fracture in the microarea (b) for BFN-ferrite composite
Fig. 8. Temperature dependencies of dielectric constant ε for PFN-ferrite composite (a), solid lines represent theoretical curves (b)
857
Values of the magnetoelectric coupling coefficient depend on the frequency of the measuring field. As the frequency in-creases, the value of the magnetoelectric coupling coefficient increases. Larger magnitude of the magnetoelectric effect has been shown by the PFN-ferrite composite, that is by the lead multiferroic composite. Based on the measurements of dielectric constant, investigations of microstructure and calculations, it was found that the magnetoelectric effect is stronger in a composite whose microstructure is characterized by better shaped grains. This result of investigations confirms the fact that the coupling between the magnetic and electrical properties in multiferroic composites takes place through the strain.
4. Conclusion
The magnitude of the magnetoelectric effect is correlated with the microstructure of the multiferroic ceramic composites (PFN-ferrite – leaded composite and BFN-ferrite – leaded-free composite). Both multiferroic PFN-ferrite and BFN-ferrite composites, as shown by the SEM studies, show various mi-crostructures. The microstructure may impact on the magneto-electric effect, because the coupling between the ferroelectric and ferromagnetic properties, takes place through the elastic interaction at the phase boundary in composite materials. The results of study presented in this paper confirmed this assump-tion, because a larger magnetoelectric effect and higher value of the magnetoelectric coupling coefficient, exhibits composite material with better shaped grains and clearer grain boundaries
(both the ferroelectric and the ferromagnetic, phases). Thus the material with better magnetoelectric properties and show-ing a stronger magnetoelectric effect, turned out to be the lead multiferroic composite PFN-ferrite. The value of the magne-toelectric coupling coefficient in PFN-ferrite is bigger than in similar composite materials reported by other authors [22,23]. Therefore obtained magnetoelectric composite materials can be promising materials for applications in sensors for magnetic and electric field [24].
REFERENCES
[1] C.-W. Nan, Phys. Rev. B 50, 6082-6088 (1994).[2] M. Fiebig, J. Phys. D: Appl. Phys. 38, R123-R152 (2005).[3] N.A. Hill, J. Phys. Chem. B 104, 6694-6709 (2000).[4] C.-W. Nan, M.I. Bichurin, S. Dong, D. Viehland, G. Srinivasan,
J. Appl. Phys. 103, 031101-031135 (2008). [5] L. Mitoseriu, Bol. Soc. Esp. Ceram. V. 44, 177-184 (2005).[6] J. van Suchtelen, Philips Res. Rep. 27, 28-37 (1972). [7] R.E. Newnham, D.P. Skinner, L.E. Cross, Mater. Res. Bull. 13,
525-536 (1978).[8] C. Zhong, Q. Jiang, Sol. St. Comm. 122, 601-605 (2002).[9] C.W. Nan, Prog. Mater. Sci. 37, 1-116 (1993).[10] X.M. Yin, N. Zhang, J.C. Bao, Phys. Lett. A 361, 434-436 (2007).[11] C.-W. Nan, M.I. Bichurin, S. Dong, G. Srinivasan, J. Appl. Phys.
103, 031101 (2008).[12] D. Pandey, A.K. Singh, S. Baik, Acta Crystallogr., Sect. A: Found.
Crystallogr. 64, 192-203 (2008).
Fig. 9. Temperature dependencies of dielectric constant ε for BFN-ferrite composite (a), solid lines represent theoretical curves (b)
TABLE 1
Calculated values of the magnetoelectric coupling coefficient g for both magnetoelectric composites (BFN-ferrite, PFN-ferrite), at different values of frequency f of the measuring field
Frequency (f ) 20 kHz 10 kHz 5 kHz 2 kHz 1 kHz 500 Hz 200 Hz 100 Hz 20 HzBFN – ferrite 0.0473 0.0451 0.0430 0.0399 0.0378 0.0348 0.0301 0.0273 0.0218PFN – ferrite 0.0682 0.0653 0.0617 0.0589 0.0558 0.0517 0.0469 0.0368 0.0309
858
[13] J. Ryu, S. Priya, K. Uchino, H.-E. Kim, J. Electroceram. 8, 107-119 (2002).
[14] D. Bochenek, P. Niemiec, A. Chrobak, G. Ziółkowski, R. Zacha-riasz, Composites Theory and Practice, 13 (1), 59-64 (2013).
[15] D. Bochenek, P. Niemiec, A. Chrobak, G. Ziółkowski, A. Bła-chowski, Mater. Charact. 87, 36-44 (2014).
[16] J.A. Bartkowska, J. Magn. Mag. Mater. 374, 703-706 (2015).[17] J.A. Bartkowska, J. Dercz, J. Exp. Theor. Phys. 117, 875-878
(2013). [18] O.F. Alcantara, G.A. Gehring, Adv. Phys. 29, 731-769 (1980).
[19] T. Janssen, J.A. Tjion, Phys. Rev. B: Condens. Matter. 24, 2245-2248 (1981).
[20] X.S. Gao, J.M. Liu, Q.C. Li, Z.G. Liu, Ferroelectrics 252, 69-77 (2001).
[21] Q. Jiang, S.J. Gong, Eur. Phys. J. B 43, 333-338 (2005).[22] J. Ryu, A.V. Carazo, K. Uchino, H-E Kim, J. Electroceram. 7,
17-24 (2001).[23] R.A. Islam, S. Priya, J. Mater. Sci. 43, 3560-3568 (2008).[24] J.G. Wan, J. M. Liu, H.L. W. Chand, C.L. Choy, G.H. Wang,
C.W. Nan, J. Appl. Phys. 93, 9916-9919 (2003).