Embed Size (px)
Citation preview

SHRM Survey Findings: Job Analysis Activities
In collaboration with and commissioned by ACT
December 11, 2014

• In this research, respondents were asked about activities related to the processes that occur to
examine and analyze the activities of a particular job or role within an organization. The analysis
can result in information that includes the tasks or competencies of the job/role; the knowledge,
skills and abilities required for successful performance in the job/role; and the conditions under
which the responsibilities are performed. These types of activities are often referred to as a job
analysis.
Job Analysis Activities ©SHRM 2014 2
Definitions

• What methods and tools did organizations use to conduct job analysis activities? The leading methods to conduct job analysis were interview (50%), observation (33%) and structured questionnaires (27%). Organizations with 25,000 or more employees were more likely than organizations with 1 to 99 employees to use structured questionnaires to conduct job analysis activities. Over two-fifths (44%) of organizations used tools that were specifically designed for their organization, and one-quarter (26%) used online job analysis tools.
• What types of information did organizations collect when conducting job analysis activities? The most common types of information organizations collected when conducting job analysis activities were knowledge (96%), skills (95%), abilities (92%) and task statements (90%).
• How did organizations use information collected through job analysis activities? Nearly three-quarters of organizations used the information collected through job analysis activities for recruitment (73%) and performance standards (72%). Other purposes included compensation (69%) and training (61%).
• For what job levels did organizations conduct job analysis activities? The majority of organizations conducted job analysis activities for management (87%), nonexempt (84%) and professional nonmanagement (80%) job levels. Furthermore, 60% of organizations conducted job analysis activities for executive-level positions.
Job Analysis Activities ©SHRM 2014 3
Key Findings

• What experience did HR professionals have with job analysis? Roughly one-half (51%) of HR
professionals have participated in at least one formal or informal job analysis-related activity, and
45% of HR professionals have used information from job analyses for purposes beyond identifying
what was required for a job/role, such as developing interview questions and performance appraisal
systems. Approximately two out of five HR professionals have conducted job analyses at their
current organization.
Job Analysis Activities ©SHRM 2014 4
Key Findings (continued)

• Considering that many HR professionals say they are having trouble finding qualified candidates for
open positions at the moment, an accurate job description becomes even more important as an
element of the recruiting process. Nearly three-fourths of respondents to this survey said they used
information collected through job analysis activities for recruiting.
• With proper analysis of jobs at all levels of organizations, HR professionals will also have a more
effective performance management process. Clearly knowing the responsibilities that come with
certain jobs allows for ease of measurement on annual evaluations, periodic reviews, goal
attainment and other forms of performance management.
• HR professionals need a comprehensive understanding of how jobs are performed at all levels of
their organizations to perform their own duties. The tasks of managing personnel, developing
training guidelines and fulfilling other responsibilities could be much more difficult for HR
professionals without an effective job analysis system.
Job Analysis Activities ©SHRM 2014 5
Implications for the HR Profession

Methods to Conduct Job Analysis Activities
Job Analysis Activities ©SHRM 2014 6
Note: n = 459. Percentages do not equal 100% due to multiple response options. Respondents who answered "don't know" were excluded from this
analysis.
50%
33%
27%
25%
25%
24%
19%
9%
7%
6%
3%
Interview
Observation
Structured questionnaire
Checklist
Open-ended questionnaire
Existing sources of information
Technical conference/focus group
Critical incident
Diary
None of the above
Other

Methods to Conduct Job Analysis Activities
Job Analysis Activities ©SHRM 2014 7
Note: Only statistically significant differences are shown.
Existing sources of information
Government (42%) > Publicly owned for-profit (17%)
Comparisons by organization sector
• Government organizations were more likely than publicly owned for-profit organizations to report existing sources of information as a method for identifying the knowledge, skills, abilities and competencies required for a job/role.

Methods to Conduct Job Analysis Activities
Job Analysis Activities ©SHRM 2014 8
Note: Only statistically significant differences are shown.
Checklists
25,000 or more employees (42%) > 500 to 2,499 employees (18%)
Comparisons by organization staff size
• Larger organizations were more likely than smaller organizations to report checklists, structured questionnaires and technical conference/focus groups as methods for identifying the knowledge, skills, abilities and competencies required for a job/role.
Structured questionnaires
25,000 or more employees (38%) > 1 to 99 employees (13%)
Technical conference/focus groups
25,000 or more employees (36%) > 1 to 99 employees (13%)

Tools for Conducting Job Analysis Activities
Job Analysis Activities ©SHRM 2014 9
Note: n = 388. Percentages do not equal 100% due to multiple response options. Respondents whose organizations do not use or were unsure about
methods associated with job analysis activities were not asked this question. Respondents who answered "don't know" were excluded from this
analysis.
44%
26%
16%
13%
8%
9%
Tools designed specifically for my organization
Online job analysis tools
Off-the-shelf questionnaires
Survey software
Human capital management (HCM) software
Other
Tools for Conducting Job Analysis Activities
Job Analysis Activities ©SHRM 2014 10
Note: Only statistically significant differences are shown.
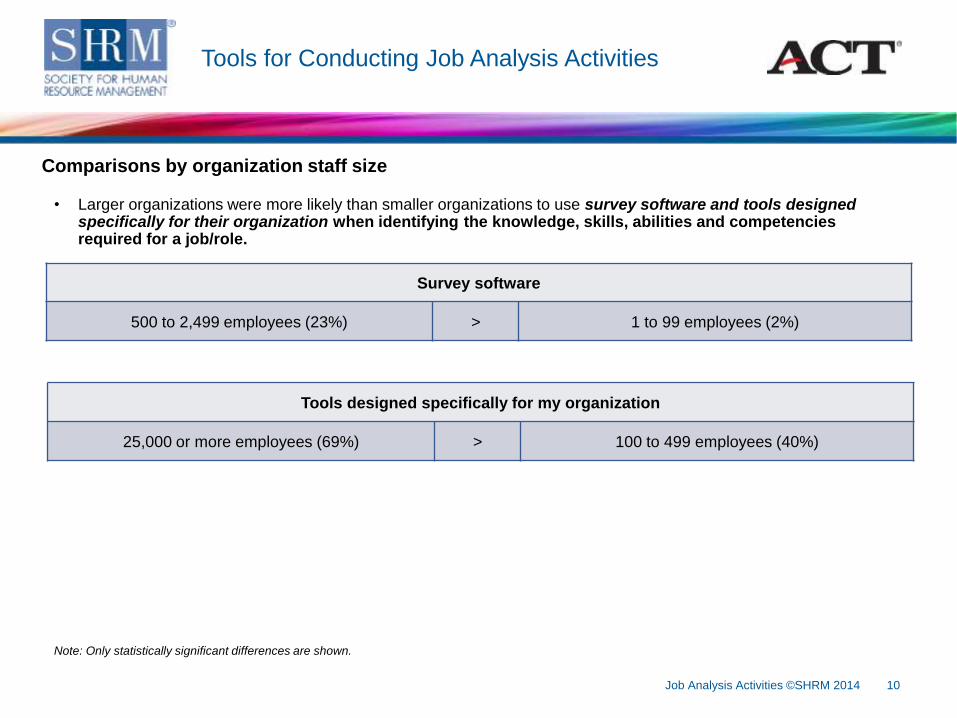
Survey software
500 to 2,499 employees (23%) > 1 to 99 employees (2%)
Comparisons by organization staff size
• Larger organizations were more likely than smaller organizations to use survey software and tools designed specifically for their organization when identifying the knowledge, skills, abilities and competencies required for a job/role.
Tools designed specifically for my organization
25,000 or more employees (69%) > 100 to 499 employees (40%)

Information Collected in Job Analysis Activities
Job Analysis Activities ©SHRM 2014 11
Note: n = 267-339. Percentages do not equal 100% due to multiple responses. Respondents whose organizations do not use or were unsure about
methods associated with job analysis activities were not asked this question. Responses for this question were as follows: yes, no and don’t know.
Respondents who answered "don't know" were excluded from this analysis. Only respondents who answered “yes” are shown.
Percentage
Knowledge (i.e., specific types of information people need to perform a job such
as an understanding HIPAA regulations)96%
Skills (i.e., practiced acts such as writing clearly or operating a crane) 95%
Abilities (i.e., stable capacity to engage in a specific behavior such as lifting
objects weighing up to 50 pounds or climbing ladders up to 25 feet) 92%
Task statements (i.e., list of activities performed on the job) 90%
The types of tools and technology that are used in the job 89%
Requirement/qualification of knowledge, skills and abilities at time of
appointment86%
Competencies (i.e., set of defined behaviors that are used to identify, evaluate
and develop employees) 84%
Job context (e.g., purpose of job within the organization or work environment) 80%
Ratings for knowledge, skills, abilities (e.g., importance, criticality, frequency) 64%
Performance criteria (e.g., standards for each performance level) 64%

Information Collected in Job Analysis Activities
(continued)
Job Analysis Activities ©SHRM 2014 12
Note: n = 267-339. Percentages do not equal 100% due to multiple responses. Respondents whose organizations do not use or were unsure about
methods associated with job analysis activities were not asked this question. Responses for this question were as follows: yes, no and don’t know.
Respondents who answered "don't know" were excluded from this analysis. Only respondents who answered “yes” are shown.
Percentage
Ratings for tasks (e.g., importance, criticality, frequency, difficulty) 61%
Ratings for competencies (e.g., importance, criticality, frequency) 58%
Other characteristics (e.g., personality, interests, work styles, values) 55%
Consequences of error 36%
Information Collected in Job Analysis Activities
Job Analysis Activities ©SHRM 2014 13
Note: Only statistically significant differences are shown.
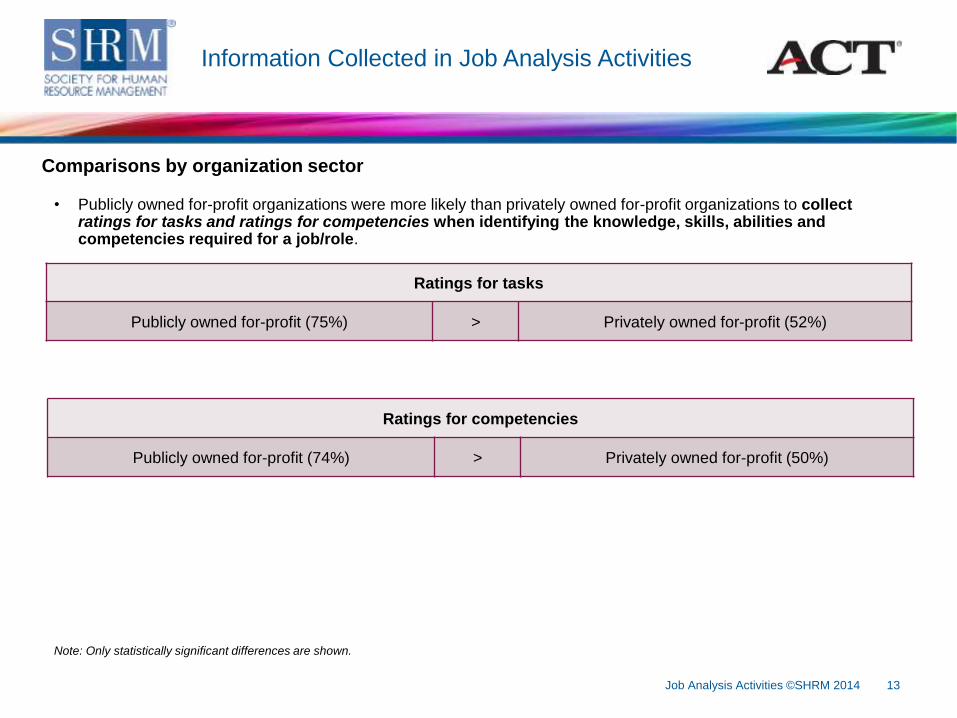
Ratings for tasks
Publicly owned for-profit (75%) > Privately owned for-profit (52%)
Comparisons by organization sector
• Publicly owned for-profit organizations were more likely than privately owned for-profit organizations to collect ratings for tasks and ratings for competencies when identifying the knowledge, skills, abilities and competencies required for a job/role.
Ratings for competencies
Publicly owned for-profit (74%) > Privately owned for-profit (50%)

Information Collected in Job Analysis Activities
Job Analysis Activities ©SHRM 2014 14
Note: Only statistically significant differences are shown.
Ratings for tasks
2,500 to 24,999 employees (75%) > 100 to 499 employees (48%)
Comparisons by organization staff size
• Organizations with 2,500 to 24,999 employees were more likely than organizations with 100 to 499 employees to collect ratings for tasks when identifying the knowledge, skills, abilities and competencies required for a job/role.
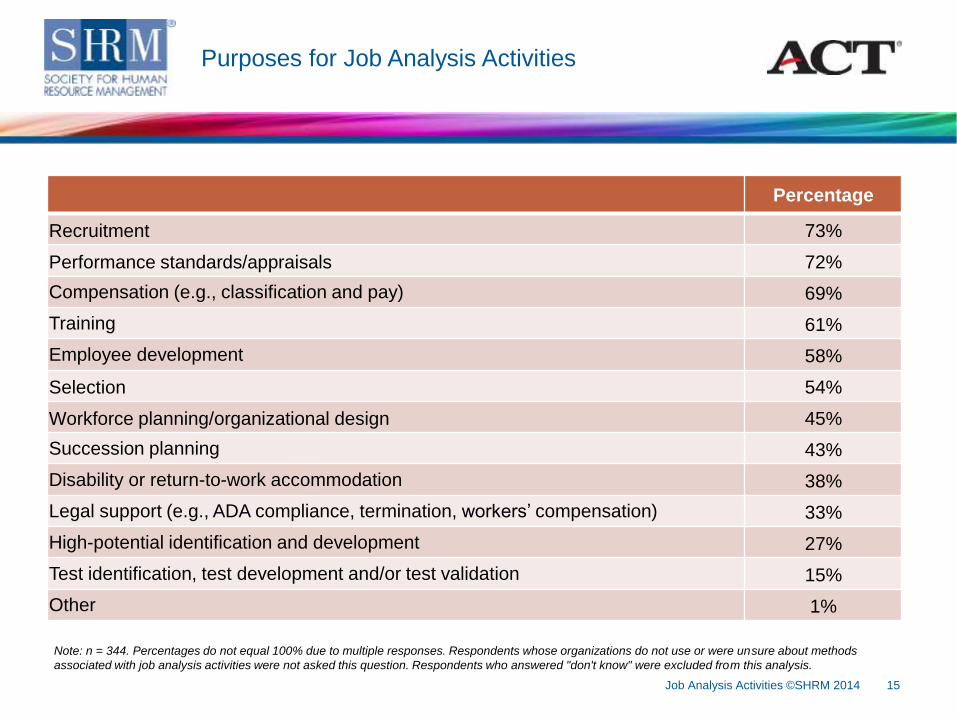
Purposes for Job Analysis Activities
Job Analysis Activities ©SHRM 2014 15
Note: n = 344. Percentages do not equal 100% due to multiple responses. Respondents whose organizations do not use or were unsure about methods
associated with job analysis activities were not asked this question. Respondents who answered "don't know" were excluded from this analysis.
Percentage
Recruitment 73%
Performance standards/appraisals 72%
Compensation (e.g., classification and pay) 69%
Training 61%
Employee development 58%
Selection 54%
Workforce planning/organizational design 45%
Succession planning 43%
Disability or return-to-work accommodation 38%
Legal support (e.g., ADA compliance, termination, workers’ compensation) 33%
High-potential identification and development 27%
Test identification, test development and/or test validation 15%
Other 1%

Purposes for Job Analysis Activities
Job Analysis Activities ©SHRM 2014 16
Note: Only statistically significant differences are shown.
Workforce planning
Publicly owned for-profit (62%) > Privately owned for-profit (36%)
Comparisons by organization sector
• Publicly owned for-profit organizations were more likely than privately owned for-profit organizations to use information identifying the knowledge, skills, abilities and competencies required for a job/role for workforce planning.
Succession planning
Publicly owned for-profit (64%) >Privately owned for-profit (39%)
Nonprofit (31%)
• Publicly owned for-profit organizations were more likely than privately owned for-profit and nonprofit organizations to use information identifying the knowledge, skills, abilities and competencies required for a job/role for succession planning.

Purposes for Job Analysis Activities
Job Analysis Activities ©SHRM 2014 17
Note: Only statistically significant differences are shown.
Compensation
Nonprofit (80%) > Privately owned for-profit (60%)
Comparisons by organization sector
• Nonprofit organizations were more likely than privately owned for-profit organizations to use information
identifying the knowledge, skills, abilities and competencies required for a job/role for compensation.

Job Levels Used for Job Analysis Activities
Job Analysis Activities ©SHRM 2014 18
Note: n = 344. Percentages do not equal 100% due to multiple responses. Respondents whose organizations do not use or were unsure about methods
associated with job analysis activities were not asked this question. Respondents who answered "don't know" were excluded from this analysis.
60%
87%
80%
84%
Executive level(e.g., CEO, CFO, VP)
Management(e.g., director, manager, supervisor)
Professional nonmanagement(e.g., analyst, nurse, engineer)
Nonexempt(e.g., assistant, coordinator, specialist)

Job Levels Used for Job Analysis Activities
Job Analysis Activities ©SHRM 2014 19
Note: Only statistically significant differences are shown.
Executive level
Nonprofit (78%) > Privately owned for-profit (51%)
Comparisons by organization sector
• Nonprofit organizations were more likely than privately owned for-profit organizations to identify the knowledge,
skills, abilities and competencies required for a job/role for executives and nonexempt job levels.
Professional nonmanagement level
Nonprofit (94%) >Publicly owned for-profit (74%)
Privately owned for-profit (71%)
Nonexempt level
Nonprofit (95%) > Privately owned for-profit (80%)
• Nonprofit organizations were more likely than publicly owned for-profit and privately owned for-profit organizations to identify the knowledge, skills, abilities and competencies required for a job/role for professional nonmanagement job levels.
Job Levels Used for Job Analysis Activities
Job Analysis Activities ©SHRM 2014 20
Note: Only statistically significant differences are shown.
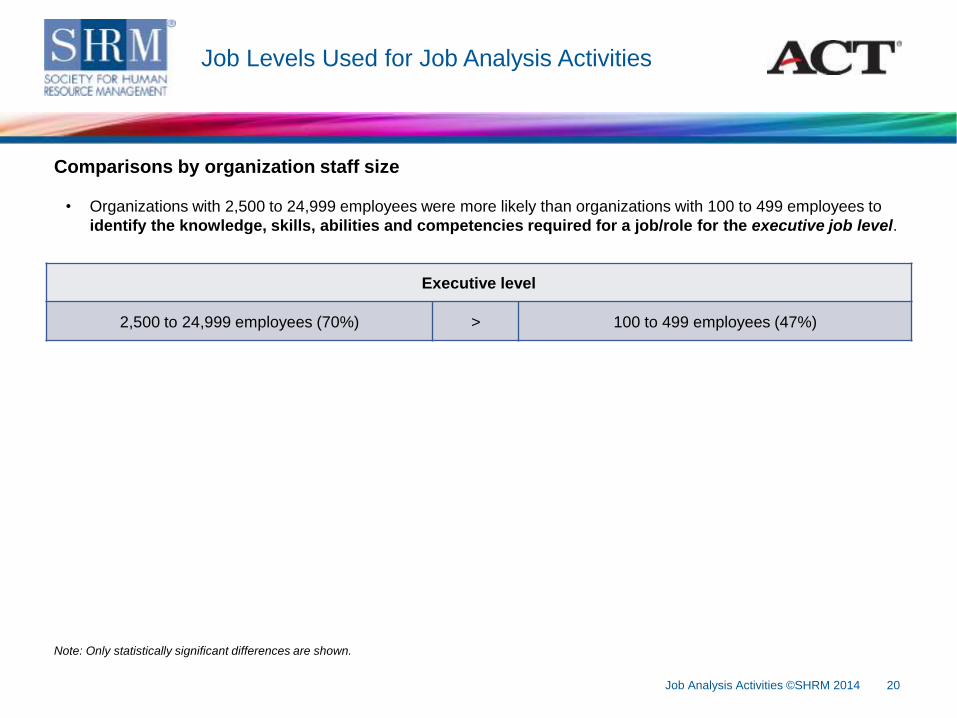
Executive level
2,500 to 24,999 employees (70%) > 100 to 499 employees (47%)
Comparisons by organization staff size
• Organizations with 2,500 to 24,999 employees were more likely than organizations with 100 to 499 employees to
identify the knowledge, skills, abilities and competencies required for a job/role for the executive job level.

Job Candidate Evaluation Methods
Job Analysis Activities ©SHRM 2014 21
Note: n = 344. Percentages do not equal 100% due to multiple responses. Respondents whose organizations do not use or were unsure about methods
associated with job analysis activities were not asked this question. Respondents who answered "don't know" were excluded from this analysis.
Percentage
Behavioral interviews: job specific and prepared in advance. 62%
Online, minimum qualifications screening questionnaires: questions that may
eliminate/disqualify candidates from the recruiting process.41%
Skills testing: assessing the level of a practiced activity such as writing, blueprint
reading and computer programming. 38%
Interviews with behaviorally anchored rating scales: answer keys used to
evaluate candidate responses and rating methods that produce a numeric score.26%
Situational judgment questionnaires: choosing a response when given a
scenario. 23%
Organizational fit questionnaires: questions that evaluate organization-relevant
factors such as team based, entrepreneurial and traditional.23%
Personality testing: assessing personality traits such as persuasiveness, detail
orientation, conscientiousness, rule following, optimism, goal orientation, data
rational and boredom proneness.22%
Aptitude testing: assessing the level of abilities in areas such as problem-solving
and critical reasoning.18%
Scorable job applications: numeric values placed on experience, skills, etc. 16%

Job Candidate Evaluation Methods (continued)
Job Analysis Activities ©SHRM 2014 22
Note: n = 344. Percentages do not equal 100% due to multiple responses. Respondents whose organizations do not use or were unsure about methods
associated with job analysis activities were not asked this question. Respondents who answered "don't know" were excluded from this analysis.
Percentage
Cognitive skills testing: assessing the level of abilities in areas such as reading
and mathematics. 16%
Online, realistic job preview (RJP): an overview of the job demands with
questions to confirm interest in continuing the application process.12%
Biodata questionnaires: standardized questions on verifiable school/work history,
reported in scales such as reliability, dependability and safety.7%
Simulations: interactive experience that models job demands. 7%
Assessment centers: formal observation under controlled conditions. 6%
Virtual job tryouts: completing online work samples. 2%
Other 2%

Job Candidate Evaluation Methods
Job Analysis Activities ©SHRM 2014 23
Note: Only statistically significant differences are shown.
Interviews with behaviorally anchored rating scales
Publicly owned for-profit (39%) > Privately owned for-profit (18%)
Comparisons by organization sector
• Publicly owned for-profit organizations were more likely than privately owned for-profit organizations to use or plan to use interview with behaviorally anchored rating scales, online minimum qualification screening questionnaires and biodata questionnaires within the next 12 months to evaluate job candidates for hiring.
Online, minimum qualifications screening questionnaires
Publicly owned for-profit (58%) > Privately owned for-profit (30%)
Biodata questionnaires
Publicly owned for-profit (14%) > Privately owned for-profit (3%)

Job Candidate Evaluation Methods
Job Analysis Activities ©SHRM 2014 24
Note: Only statistically significant differences are shown.
Online, realistic job previews
Publicly owned for-profit (24%) >Privately owned for-profit (8%)
Nonprofit (3%)
Comparisons by organization sector
• Publicly owned for-profit organizations were more likely than privately owned for-profit and nonprofit organizations to
use or plan to use online, realistic job previews within the next 12 months to evaluate job candidates for
hiring.
Personality testing
Publicly owned for-profit (27%)
Privately owned for-profit (26%)> Government (4%)
• Publicly owned for-profit and privately owned for-profit organizations were more likely than government organizations
to use or plan to use personality testing within the next 12 months to evaluate job candidates for hiring.

Job Candidate Evaluation Methods
Job Analysis Activities ©SHRM 2014 25
Note: Only statistically significant differences are shown.
Online minimum qualification screening questionnaires
2,500 to 24,999 employees (53%) > 100 to 499 employees (27%)
Comparisons by organization staff size
• Organizations with 2,500 to 24,999 employees were more likely than organizations with 100 to 499 employees to use or plan to use online minimum qualification screening questionnaires within the next 12 months to evaluate job candidates for hiring.

HR Professionals’ Experience with Job Analysis
Activities
Job Analysis Activities ©SHRM 2014 26
Note: n = 339. Percentages do not equal 100% due to multiple responses. Respondents whose organizations do not use or were unsure about methods
associated with job analysis activities were not asked this question.
Percentage
I have conducted job analyses at my current organization. 41%
I have conducted job analyses at a previous organization. 39%
I have used information from job analyses for purposes beyond identifying what
was required for a job/role such as developing interview questions and
performance appraisal systems.
45%
I have taken one or more courses that covered job analysis. 30%
I have a certification that covers job analysis. 15%
I have participated in at least one formal or informal activity associated with job
analysis.51%
I have no experience with any formal or informal activities associated with job
analysis.15%
Other 1%

Job Analysis Activities ©SHRM 2014 27
Demographics

Demographics: Organization Industry
Job Analysis Activities ©SHRM 2014 28
Note: n = 392. Percentages do not equal 100% due to multiple response options.
Percentage
Professional, scientific and technical services 18%
Health care and social assistance 15%
Manufacturing 15%
Government agencies 11%
Finance and insurance 9%
Educational services 8%
Transportation and warehousing 7%
Accommodation and food services 6%
Retail trade 6%
Administrative and support and waste management and remediation services 5%
Construction 5%

Demographics: Organization Industry (continued)
Job Analysis Activities ©SHRM 2014 29
Note: n = 392. Percentages do not equal 100% due to multiple response options.
Percentage
Utilities 5%
Information 4%
Wholesale trade 4%
Arts, entertainment, and recreation 3%
Real estate and rental and leasing 3%
Religious, grant-making, civic, professional and similar organizations 3%
Agriculture, forestry, fishing and hunting 2%
Mining, quarrying, and oil and gas extraction 2%
Repair and maintenance 2%
Personal and laundry services 1%
Other 2%

Demographics: Organization Sector
Job Analysis Activities ©SHRM 2014 30
n = 385
43%
23%
19%
14%
1%
Privately owned for-profit
Publicly owned for-profit
Nonprofit
Government
Other

Demographics: Organization Staff Size
Job Analysis Activities ©SHRM 2014 31
Note: n = 387. Percentages do not equal 100% due to rounding.
14%
24%
23%
25%
13%
1 to 99 employees
100 to 499 employees
500 to 2,499 employees
2,500 to 24,999 employees
25,000 or more employees

n = 394
Demographics: Other
Job Analysis Activities ©SHRM 2014 32
U.S.-based operations only 70%
Multinational operations 30%
Single-unit organization: An organization in
which the location and the organization are
one and the same.
26%
Multi-unit organization: An organization that
has more than one location.74%
Multi-unit headquarters determines HR
policies and practices47%
Each work location determines HR policies
and practices4%
A combination of both the work location and
the multi-unit headquarters determines HR
policies and practices
50%
Is your organization a single-unit organization or a
multi-unit organization?
For multi-unit organizations, are HR policies and practices
determined by the multi-unit headquarters, by each work
location or by both?
Does your organization have U.S.-based
operations (business units) only, or does it
operate multinationally?
n = 397
Note: n = 305. Percentages do not equal 100% due to rounding.
Corporate (companywide) 69%
Business unit/division 16%
Facility/location 14%
Note: n = 304. Percentages do not equal 100% due
to rounding.
What is the HR department/function for
which you responded throughout this
survey?

33
SHRM Survey Findings: Job Analysis Activities
• Response rate = 16%
• 459 HR professionals from a randomly selected sample of SHRM’s membership participated in
this survey
• Margin of error +/-5%
• Survey fielded September 11-October 15, 2014
In collaboration with and commissioned by ACT
Survey Methodology
Job Analysis Activities ©SHRM 2014

• Job Analysis Resource Page
• Performing Job Analysis Toolkit
• Job Analysis: Desk Audit Review Sample Form
• Resources for HR Educators: Job Analysis-Based Performance Appraisal
Job Analysis Activities ©SHRM 2014 34
Additional SHRM Resources

For more survey/poll findings, visit shrm.org/surveys
For more information about SHRM’s Customized Research Services, visit
shrm.org/customizedresearch
Follow us on Twitter @SHRM_Research
Job Analysis Activities ©SHRM 2014 35
About SHRM Research

Founded in 1948, the Society for Human Resource Management (SHRM) is the
world’s largest HR membership organization devoted to human resource management.
Representing more than 275,000 members in over 160 countries, the Society is the
leading provider of resources to serve the needs of HR professionals and advance the
professional practice of human resource management. SHRM has more than 575
affiliated chapters within the United States and subsidiary offices in China, India and
United Arab Emirates. Visit us at shrm.org.
Job Analysis Activities ©SHRM 2014 36
About SHRM
ACT is a mission-driven, nonprofit organization dedicated to helping people achieve
education and workplace success. Headquartered in Iowa City, Iowa, ACT is trusted as
the nation’s leader in college and career readiness, providing high-quality achievement
assessments grounded in more than 50 years of research and experience. ACT offers
a uniquely integrated set of solutions that help people succeed from elementary school
through career, providing insights that unlock potential. To learn more about ACT, go to
www.act.org.
Job Analysis Activities ©SHRM 2014 37
About ACT