Embed Size (px)
Citation preview

Socio-Economic Impact of IFC Financing in Jordan
– An Assessment of Employment and Value-added -
Final Report
November 2012
Ethan B. Kapstein
René Kim
Hedda Eggeling

1
Contents
Executive summary ............................................................................................... 2
1 Introduction, Objectives and Scope ....................................................................... 4
2 Jordan’s economy ............................................................................................... 4
2.1 Jordan’s Financial Structure ........................................................................... 6
3 IFC’s operations in Jordan .................................................................................... 7
4 Economic footprint of IFC Jordan .......................................................................... 8
4.1 Methodology description ............................................................................... 8
4.2 Strengths and Limitations of Input-Output Methodology .................................. 10
4.3 Economy-wide value-added of IFC Finance .................................................... 11
4.4 Economy-wide employment of IFC Finance .................................................... 16
4.5 Value-added and employment generation multipliers ...................................... 20
5. Overall impact of IFC non-FIs Clients ................................................................. 23
6. The combined impact of IFC and “participant” financing ....................................... 24
Appendix I Model description ................................................................................ 28
I.1 Modeling approach ...................................................................................... 28
I.2 Production Function .................................................................................... 28
I.3 Social Accounting Matrix .............................................................................. 29
I.4 Assumptions .............................................................................................. 30
Appendix II: Overview of sectors ........................................................................... 32
About the Authors - Steward Redqueen and Ethan B. Kapstein .................................. 34
Side Boxes:
Qualitative Impact of Advisory Services
Public-Private Partnership on Airport Development
Jordan Inspection Reform
Qualitative Impact of IFC Investment

2
Executive summary
In pursuing its goal of social and economic development by investing in the private sector,
the International Finance Corporation (IFC) seeks to understand how it can most
effectively contribute to job creation and poverty reduction. This socio-economic impact
assessment of IFC’s investments in Jordan models the economy-wide effects of IFC’s
financing to and private sector companies and Jordan-based banks on value-added and
job creation. This study is part of a pilot project which involves a companion assessment
conducted in Ghana along with two pro-forma analyses conducted for the IFC in Sri Lanka
and Tunisia.
The objective is to quantify IFC’s socio-economic impact in Jordan. As a lender to the
country’s financial and non-financial enterprises, the IFC is expected to influence Jordan’s
economy, but the size of its “multiplier effect” on such variables as job creation, GDP
contribution, and tax revenue cannot be estimated in the absence of formal modeling. On
the basis of the modeling approach adopted here, we find that, as of 30 June, 20111:
1. As of June 30, 2011 IFC had $297 million outstanding capital with Jordanian
financial institutions (FI) clients and private sector companies (non-FIs);
2. Owing to these lending activities, IFC in 2011 was directly and indirectly associated
with supporting2 at least 9,100 jobs (0.6% of the employed labor force)3;
3. Through this $297 million of outstanding financing the IFC contributes, directly and
indirectly, at least $212 million in value-added to the Jordanian economy. This is
equivalent to 0.8% of Jordan’s GDP;
Around half of $212 million in value-added is profit for companies
amounting to $94 million;
Private households benefit from at least $91 million of salaries and incomes
associated with IFC financing in Jordan;
The government benefits in the form of $28 million in tax revenues
generated as a result of IFC financing;
4. Besides these quantifiable impacts, the IFC is playing a significant developmental
role in the Jordanian economy by helping to mobilize international capital on behalf
of the nation’s growth; by boosting confidence in Jordan’s economic future through
long-term financing; and through its advisory services;
5. Generally, investing into FIs impacts the local economy to a larger extent in
absolute figures but financing non-FIs has the potential to raise productivity levels
relatively more.
1 The data generated in this report results “best estimated” based on the available macro-economic and firm-level information. 2 The term “supports” means that not all of the jobs or value-added would necessarily vanish if IFC had not invested in its clients, since other lenders may have provided the same level of financing. Please also notice the difference between “creation” and “support”; “creation” indicates a net or incremental change and “support” refers to an associated economic impact at a given point of time. 3 The term “associated with IFC financing” means that not all of the jobs or value-added would necessarily vanish if IFC had not invested in its clients. Other lenders may have provided the same level of financing.

3
6. Based on the methodology applied, we find that certain tensions may arise
between supporting absolute amounts of employment and the GDP contribution of
each of those jobs. In particular, there are trade-offs between lending to firms and
sectors which generate more employment but lower value-added per job (e.g.
agriculture) and lending to enterprises that generate fewer employment but greater
value-added per job (e.g. large-scale manufacturing).
7. Investing into capital abundant companies is likely to lead to relatively few
additional jobs in the short term, but those investments may have the greatest
potential to bring about long-term “transformational” effects.
8. Whereas the same tradeoffs as described above also apply to financing provided to
FIs, when comparing investments into non-FIs and FIs we generally find larger
multipliers for FIs investments. This can be explained by FIs having a wider spread
of companies in their portfolios while IFC supported non-FI companies tend to be
larger, more productive firms.
9. We recommend to IFC’s management that it is crucial to recognize the various
trade-offs that may exist when it comes to making investment decisions (e.g.
between short-run and long-run impacts, or between employment generation and
value-added creation). The IFC should therefore consider shaping a portfolio of
investments that helps advance its overall objectives in Jordan.
We stress that, while the underlying methodology used for this study, input-output
modeling, lets us quantify the wider socio-economic impact of IFC investments on various
sectors, it also has its limitations. Financing provided to individual sectors has been
translated into output, using a linear Leontief or fixed production function assuming
constant returns to input. But this might not always be the case. In particular any
“transformational” effects of IFC financing cannot be quantified this way. Moreover, the
study works with sectors’ average productivity and spending patterns. It does not take
into account differences between company sizes or the formal/informal sectors. Table 1
summarizes the main findings whereby we distinguish effects of IFC itself and the effects
for participants, other lenders than IFC that contributed as well.
Table 1: Outstanding Finance (30 June 2011) and associated impact findings
IFC
Client SegmentOutstanding Finance
in $ mlnAssociated Value Added
in $ mlnAssociated Employment
in ‘000 jobs
Direct/Indirect Induced Effect Direct/Indirect Induced Effect
NON-FIs 243.7 90.5 30% 3.4 45%
FIs 52.8 122.0 33% 5.6 40%
TOTAL 296.5 212.5 32% 9.1 42%
Participants
TOTAL 138.7 37.5 32% 3.2 21%
4
1 Introduction, Objectives and Scope
Employment creation is among the key contributions that the private sector can make to
poverty reduction. The specific policy interventions that are most likely to induce the
private sector to make investments in job creation, however, remain elusive. Even in the
industrial world these interventions remain a topic of ongoing debate, which of course has
been renewed in wake of the financial crisis of 2008-2009. In the developing world, where
economic growth has remained stronger in recent years, job creation has nonetheless
lagged in many economies. This is a particularly critical issue in those places where more
youth and women may be expected to enter the labor market in coming years, as in the
Middle East and North Africa (MENA). In light of these developments and challenges, the
IFC seeks to sharpen its understanding of the effects of its investment and advisory
activities on job creation and value-added (defined as corporate profits, household
incomes, and taxes).
The objectives of this study are to gain some general insights about the channels through
which the private sector contributes to job creation and poverty reduction, and more
specifically to quantify the impact that can be attributed to the IFC’s activities on job
creation in Jordan. Quantifying the impacts of a corporation on an economy can help
management decision-making by:
1. Anticipating the ex-ante estimate of potential effects by providing insights into the
scale of effects of various investments on the local economy designed to have
bolstering (positive) impacts;
2. Engaging IFC’s various stakeholders (including government agencies, non-
government organizations, and private sector managers and employees), in
discussions about how to improve IFC’s economic impacts, based on a realistic
interpretation of facts.
The economic impacts discussed in this report arise from IFC’s investments into non-FI
and FI clients in Jordan. Furthermore, the economic impacts of IFC’s advisory services,
and non-quantitative impacts of IFC’s investments are included as side boxes in a
qualitative manner. The report also contains some suggestions to IFC’s management.
2 Jordan’s economy
With a Gross Domestic Product (GDP) of about $37.4 billion (PPP terms) in 2011, or
$6,000 in terms of income per capita, Jordan’s economy is among the smallest in the
Middle East and North Africa (MENA) region. Given its limited supplies of domestic natural
resources Jordan must import such commodities as petroleum, while its major sources of
foreign exchange include tourism, the export of goods and services (such as textiles), and
foreign aid. As a consequence of this economic structure, the economy is highly vulnerable
to external shocks, such as occurred with the “Arab Spring” of 2011 and its continuing
aftermath in the region, which has led to a reduction in tourism, a disruption in oil imports
from Egypt, and a rise in unemployment and government spending. At the present time,
some of the major economic challenges facing the government include high rates of
poverty (about 14% of the population lives below the poverty line), unemployment (the
official rate is 12.5%), inflation (which ran at 6% in 2011), and a large debt burden equal
to more than 60% of GDP. While Jordan’s King Abdullah has engaged in significant
economic reforms since attaining the throne in 1999, such as seeking membership in the

5
World Trade Organization, reducing or eliminating some subsidies, privatizing state-owned
companies, and actively attracting foreign investment, and while these reforms helped
spur economic growth, there are continuing demands among some segments of Jordanian
society for deeper political reforms as well. Further, not all of the economic reforms have
been well received, especially in light of the country’s unemployment and poverty levels.
An influx of foreign aid, especially from Gulf countries, has helped to offset the nation’s
economic pressures to some extent, but action is still needed to deal with the
deteriorating fiscal situation. On the brighter side of the economic ledger, Jordan's
financial sector has been relatively isolated from the international financial crisis that have
caused global turmoil since 2008, in part because of its limited exposure to overseas
capital markets. Nonetheless, the country suffered a “credit crunch” in the wake of the
crisis, highlighting the importance of investment from organizations like the International
Finance Corporation. Table 2 summarizes some key economic indicators of Jordan.
Table 2: Key indicators of the Jordanian economy in 2011
Population (2011) 6.1 million
Labor force 1.6 million
Gross Domestic Product (PPP) $37.4 billion
GDP per capita (PPP$) $6000
Sector breakdown of GDP
Agriculture 3%
Industry 31%
Services 67%
Consumption breakdown of GDP
Private consumption 85%
Government expenditure 21%
Real investment 15%
Exports 45%
Imports 66%
Source: The World Bank database

6
Exhibit 1: Gross Capital Formation (GCF) and Foreign Direct Investment (FDI) as
percentage of GDP4
Exhibit 2: Growth of real Gross National Income (GNI) per capita5 in current $
2.1 Jordan’s Financial Structure
The Jordanian banking system comprises the Central Bank of Jordan and over 20 licensed
banks, including:
13 local, conventional banks (most of which have some foreign ownership
and all of which are traded on the Amman Stock Exchange);
2 local Islamic banks;
8 branches of foreign banks, 5 of which are from Arab countries.
While the five largest banks continue to dominate the market, their share of deposits and
assets has decreased in recent years with rising competition. The Jordanian banking sector
is relatively well-capitalized. It did not suffer a great deal directly from the financial crisis
4 Source: The World Bank database 5 World Bank data
0
5
10
15
20
25
30
35
40
2005 2006 2007 2008 2009 2010
Foreign direct investment, net inflows (% of GDP) Gross capital formation (% of GDP)
in %
-
1.000
2.000
3.000
4.000
5.000
6.000
7.000
2005 2006 2007 2008 2009 2010
GNI per capita, PPP (current international $) GNI per capita, Atlas method (current US$)

7
that began in 2008 owing to its limited international exposure, including to such relatively
proximate financial centers like Dubai. Returns on equity of nearly 14% also indicate the
continuing profitability of this sector. According to the International Monetary Fund,
however, the country did suffer a “credit crunch” during the crisis owing to tightened
credit conditions, highlighting the importance of international lenders like the International
Finance Corporation. Traditionally, the vast majority of banking activity has centered on
the capital city of Amman and other regions have been less well-banked. Financial activity,
however, is spreading and the banking system now has over several hundred branches
throughout the country. In terms of lending practices, the banks operating in the
Jordanian environment have traditionally been conservative. As a result, access to small
and medium-sized enterprises (SME) finance is, compared to other countries in the region,
particularly constrained in Jordan.
3 IFC’s operations in Jordan
The total amount of financing that IFC is investing into the Jordanian economy has in 2011
been about 13 times as much as in 2006 ($23 million). Historically interesting is that non-
FI investment has always been higher than FI investment, where from around 2008 the
gap between the two investment channels widens. IFC’s Jordan outstanding loan portfolio
is depicted in Exhibit 3.
Exhibit 3: IFC’s outstanding loan amount over time (in $ million)
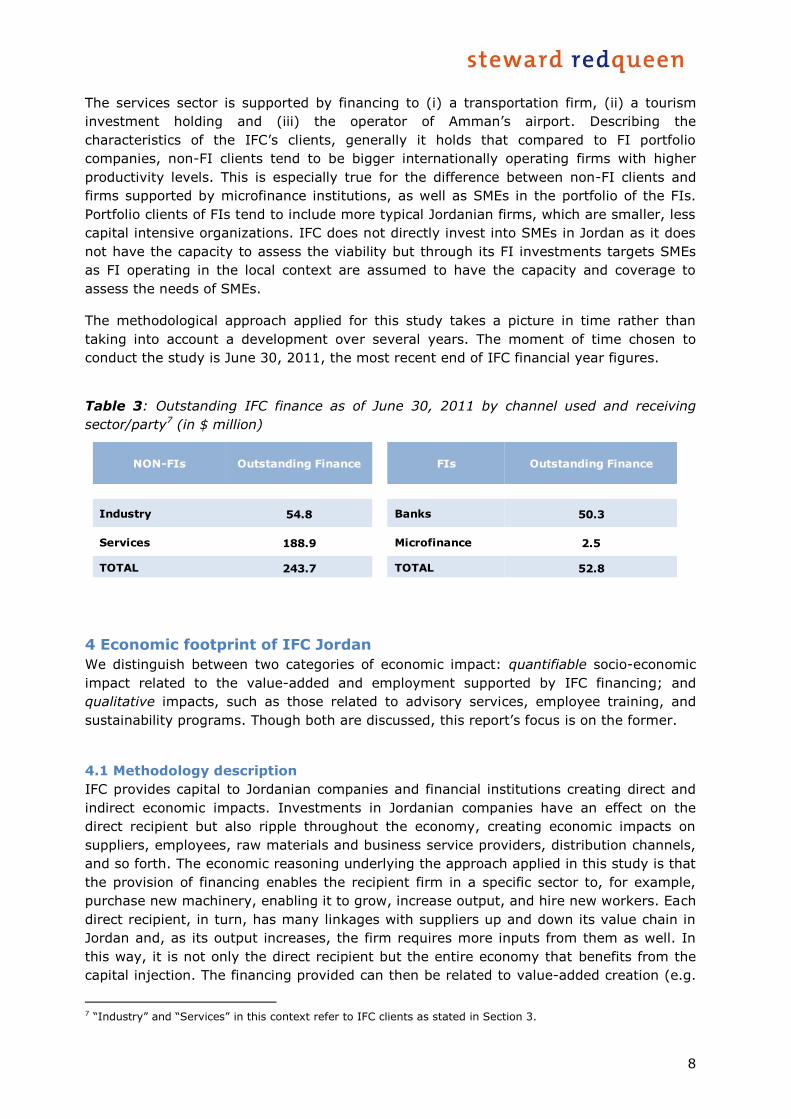
As of June 30, 2011 IFC had loans worth $2976 million outstanding with Jordanian clients.
Some of this money is invested directly into Jordanian companies (non-FIs) and some is
invested indirectly through financial institution (FIs). Table 3 provides an overview of
channels used. In addition to the outstanding loan amount, IFC has committed but not yet
disbursed capital accounting to $198 million. This amount has been excluded from the
study. At a more micro-level, the IFC supports local industry by providing financing to (i) a
pharmaceutical; (ii) phosphate and silica mines and (iii) a power distribution company.
6 Please note that $1.5 million outstanding in the Jordanian apparel industry have been excluded from the study
$ -
$ 50
$ 100
$ 150
$ 200
$ 250
$ 300
$ 350
2006 2007 2008 2009 2010 2011
Total IFC NON-FI FI
in mln
8
The services sector is supported by financing to (i) a transportation firm, (ii) a tourism
investment holding and (iii) the operator of Amman’s airport. Describing the
characteristics of the IFC’s clients, generally it holds that compared to FI portfolio
companies, non-FI clients tend to be bigger internationally operating firms with higher
productivity levels. This is especially true for the difference between non-FI clients and
firms supported by microfinance institutions, as well as SMEs in the portfolio of the FIs.
Portfolio clients of FIs tend to include more typical Jordanian firms, which are smaller, less
capital intensive organizations. IFC does not directly invest into SMEs in Jordan as it does
not have the capacity to assess the viability but through its FI investments targets SMEs
as FI operating in the local context are assumed to have the capacity and coverage to
assess the needs of SMEs.
The methodological approach applied for this study takes a picture in time rather than
taking into account a development over several years. The moment of time chosen to
conduct the study is June 30, 2011, the most recent end of IFC financial year figures.
Table 3: Outstanding IFC finance as of June 30, 2011 by channel used and receiving
sector/party7 (in $ million)
4 Economic footprint of IFC Jordan
We distinguish between two categories of economic impact: quantifiable socio-economic
impact related to the value-added and employment supported by IFC financing; and
qualitative impacts, such as those related to advisory services, employee training, and
sustainability programs. Though both are discussed, this report’s focus is on the former.
4.1 Methodology description
IFC provides capital to Jordanian companies and financial institutions creating direct and
indirect economic impacts. Investments in Jordanian companies have an effect on the
direct recipient but also ripple throughout the economy, creating economic impacts on
suppliers, employees, raw materials and business service providers, distribution channels,
and so forth. The economic reasoning underlying the approach applied in this study is that
the provision of financing enables the recipient firm in a specific sector to, for example,
purchase new machinery, enabling it to grow, increase output, and hire new workers. Each
direct recipient, in turn, has many linkages with suppliers up and down its value chain in
Jordan and, as its output increases, the firm requires more inputs from them as well. In
this way, it is not only the direct recipient but the entire economy that benefits from the
capital injection. The financing provided can then be related to value-added creation (e.g.
7 “Industry” and “Services” in this context refer to IFC clients as stated in Section 3.
NON-FIs Outstanding Finance FIs Outstanding Finance
Industry 54.8 Banks 50.3
Services 188.9 Microfinance 2.5
TOTAL 243.7 TOTAL 52.8
9
by transforming raw materials into finished products and thus corporate profits) and
employment generation throughout the Jordanian economy.
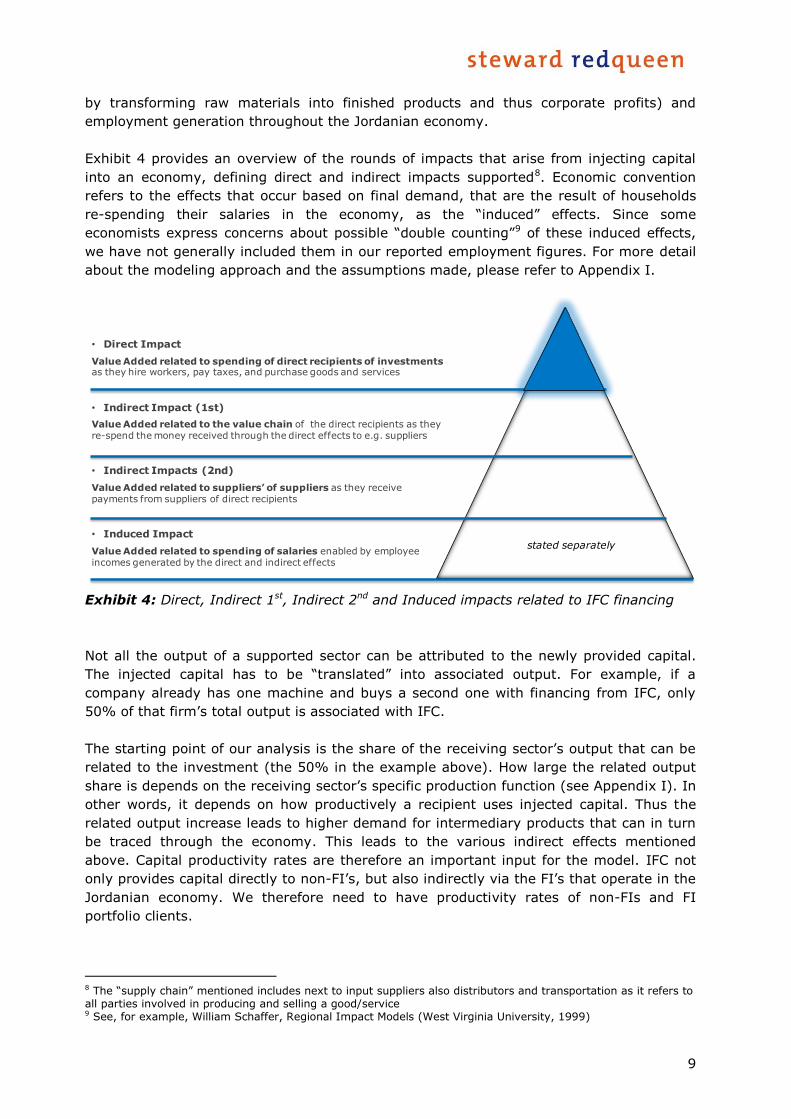
Exhibit 4 provides an overview of the rounds of impacts that arise from injecting capital
into an economy, defining direct and indirect impacts supported8. Economic convention
refers to the effects that occur based on final demand, that are the result of households
re-spending their salaries in the economy, as the “induced” effects. Since some
economists express concerns about possible “double counting”9 of these induced effects,
we have not generally included them in our reported employment figures. For more detail
about the modeling approach and the assumptions made, please refer to Appendix I.
Exhibit 4: Direct, Indirect 1st, Indirect 2nd and Induced impacts related to IFC financing
Not all the output of a supported sector can be attributed to the newly provided capital.
The injected capital has to be “translated” into associated output. For example, if a
company already has one machine and buys a second one with financing from IFC, only
50% of that firm’s total output is associated with IFC.
The starting point of our analysis is the share of the receiving sector’s output that can be
related to the investment (the 50% in the example above). How large the related output
share is depends on the receiving sector’s specific production function (see Appendix I). In
other words, it depends on how productively a recipient uses injected capital. Thus the
related output increase leads to higher demand for intermediary products that can in turn
be traced through the economy. This leads to the various indirect effects mentioned
above. Capital productivity rates are therefore an important input for the model. IFC not
only provides capital directly to non-FI’s, but also indirectly via the FI’s that operate in the
Jordanian economy. We therefore need to have productivity rates of non-FIs and FI
portfolio clients.
8 The “supply chain” mentioned includes next to input suppliers also distributors and transportation as it refers to all parties involved in producing and selling a good/service 9 See, for example, William Schaffer, Regional Impact Models (West Virginia University, 1999)
stated separately
• Direct Impact
Value Added related to spending of direct recipients of investments as they hire workers, pay taxes, and purchase goods and services
• Indirect Impact (1st)
Value Added related to the value chain of the direct recipients as they re-spend the money received through the direct effects to e.g. suppliers
• Indirect Impacts (2nd)
Value Added related to suppliers’ of suppliers as they receive payments from suppliers of direct recipients
• Induced Impact
Value Added related to spending of salaries enabled by employee incomes generated by the direct and indirect effects

10
For non-FIs (outstanding finance equal to $244 million) these can be obtained based on
the production functions of IFC clients for which balance sheet information is available
within the IFC’s system. This approach takes per company differences into account.
For FIs (outstanding finance equal to $53 million), balance sheet information for each of
the portfolio companies is not readily available. For FI’s productivity rates we hence adapt
an alternative approach to obtain those rates. Namely, we use production functions10 of
Jordan’s agricultural, industrial and services sectors in order to “translate” that investment
into output. We have assumed that the IFC’s capital has been spread equally over the
bank’s entire lending portfolio.
4.2 Strengths and Limitations of Input-Output Methodology
The major advantage of the methodology applied in this study is that it allows one to
quantify the wider (direct, indirect and induced) impacts of investing in various economic
sectors, both directly and through FIs, and both in terms of associated value-added (or
contribution to GDP growth) and jobs. It is a rigorous, widely-accepted academic method
(for which Leontief won the 1973 Nobel Prize).
However, it does have the following limitations (see Appendix I for details):
(i) Given that the analysis is conducted for a specific moment in time, it does not take
into account any structural changes of the economy (e.g. increased productivity);
(ii) Estimates are based on historical relations, that is, based on the most recent
(macro) economic data available;
(iii) Equity and debt are treated the same way;
(iv) No differentiation is made by size, and hence productivity, of firms within a sector;
(v) It does not take into account the effects of IFC’s advisory services (some examples
are therefore covered qualitatively in boxes);
(vi) IFC’s investments are treated as investments from any other lender and it has been
assumed that IFC’s financial support does not affect the relations of sectors within an
economy.
Structural changes could be triggered by increasing productivity (e.g. reducing
unnecessary or onerous business regulations, or improving power supply or transport
infrastructure, which allows many firms to be more productive). Structural changes could
also be brought about by increasing worker skill levels. So for example productivity in
IFC’s direct real-sector clients would be captured in this study, but productivity
improvements of their suppliers would not.
Where IFC works with client companies to strengthen local linkages this would not be
captured in this study. We have evidence from a more in-depth evaluation we conducted
for a mining project in Ghana (see Section 4.3), that IFC’s supply chain linkage program
and community development program contributed to significantly stronger effects on the
local economy than is usually seen in mining projects.
10 Output and credit facility figures per sector (2009) have been obtained from the Statistical Office of Jordan and the Central Bank of Jordan

11
The proportion of the firm’s revenues that can then be “attributed” to the outstanding
finance is equal to the share or proportion of newly provided financing out of the
borrower’s total capital. This means that the various types of financing provided to the
recipient (e.g. debt, equity or instruments such as guarantees) have been treated in the
same way in terms of their impact on the sector’s capital structure, and thus their ability
to generate more output11. This is likely to underestimate the impact of equity financing,
as this is generally assumed to allow companies to raise additional capital. This particular
limitation of input-output modeling will therefore mean results presented are somewhat
conservative. Similarly, the approach taken in this study does not allow differentiation
between long- and short-term finance provided.
As the model relies on sector average productivity rates, differentiating the impact of
investing in different sizes of company (e.g. large corporates, which are generally more
productive, compared with investing in smaller SMEs) cannot be addressed. The same
applies to direct financing versus indirect financing via FIs, where company size is one of
the factors explaining the different extent of related impacts.
IFC’s advisory services can help improve the investment climate, increase access to
finance and infrastructure, attract private investment into sectors previously often
dominated by the public sector, and strengthen the operations and local linkages of IFC
client companies. We have not tried to capture these effects quantitatively, but clearly
they can be significant and we provide some qualitative descriptions of such projects.
Finally, IFC’s investments are often “first-of-a-kind” investments (e.g. Queen Alia
International Airport and IFC’s investment in the Ghanaian oil industry). These can have
important demonstrative effects, leading to subsequent investments (e.g. further
development of an industry; similar “public-private partnerships” in other sectors; etc).
These effects were not quantitatively captured in this study, but could clearly be
significant. Therefore where IFC can bring about such “transformations”, either through
investments or advisory services, other assessment methods will be more appropriate.
4.3 Economy-wide value-added of IFC Finance
Table 4 shows how IFC’s investment relates to the output of recipient firms. The share of
total revenues of particular sectors and companies that can be associated with IFC is to a
large extent determined by the capital-output ratio12 of the sector’s or firm’s production
function; obviously, one unit of capital added to a capital intensive company or sector has
relatively little effect compared to one unit of capital provided to a relatively capital scarce
company or sector. The output-to-capital ratios presented below are the average ratios
but not the weighted average figures.
11 Assume a company has assets with a book value of $100, revenues of $200 and a loan from IFC of $15, this would mean that 15% of 200 = $30 in revenues are attributed to IFC. Technically this assumption implies that the asset turnover (sales/assets) of companies remain constant when the company grows. 12 Defined as the value of fixed production assets per unit of output

12
Table 4: “Translation” of IFC input (as of June 30 2011) into client output
Table 4a: non-FIs (in $ millions)
Table 4b: FIs (in $ millions)
Comparing the output per capital ratios for non-FI and FI companies, it becomes obvious
that FI portfolio clients are less productive. That means that in those companies relatively
more capital is needed to produce one unit of output. At the same time, it shows that
those companies are less capital intensive than non-FI clients. It appears to be related to
a possible IFC selection bias, choosing the large and productive companies.
Taking IFC related output presented in Table 4 as our starting point, Exhibit 5 provides an
overview of the direct, indirect and induced impacts related to IFC’s financing in Jordan.
This has been achieved by tracing the attributable output to the local economy.
Attributable Output
Client Segment Outstanding Finance Output per Capital Ratio Output Increase
NON-FIs & FIs 296.5 1.9 298.5
NON-FIs Attributable Output
Client Segment Outstanding Finance Output per Capital Ratio Output Increase
Agriculture - - -
Industry 54.8 0.7 38.5
Services 188.9 0.8 80.6
Households - - -
TOTAL 243.7 119.0
FIs Attributable Output
Client Segment Outstanding Finance Output per Capital Ratio Output Increase
Agriculture 5.4 5.3 28.6
Industry 16.9 6.2 105.0
Services 11.2 2.4 26.6
Households 19.3 - 19.3
TOTAL 52.8 179.4

13
Exhibit 5: Break down of value-added associated with IFC’s investments ($ millions)
The total value-added that is associated with IFC’s investments in Jordan sums up to at
least $212 million. Relative to Jordan’s GDP this is about 1.0% (see Table 2). The majority
of this value-added arises as profits to companies ($94 million), at least $91 million is
earned by employees, and the government benefits from the remaining $28 million (13%)
in form of taxes. Almost $120 million of the total value-added impact shown in Exhibit 5
arises directly at the non-FI receiving companies or at the portfolio companies of the FIs.
$47 million of value-added can be associated with the value chains (Indirect 1st) of the
direct recipients and $46 million is related to the suppliers of the direct recipients’
suppliers (Indirect 2nd).
In order to gain some insights into the sectors of the Jordanian economy that benefit from
IFC’s investment, Exhibit 6 provides an overview of the total value-added related to IFC’s
non-FI lending per sector. IFC’s classification distinguishes more sectors than the sectoral
division but has not been applied in this exercise. The capital and labor productivity rates
that would be required per sector are only available at a less detailed level. While the
GTAP database differentiates 57 sectors, macro-economic employment figures are only
collected for 14 sectors which not all correspond with GTAP sectors. Data on jobs per
economic sector is essential when determining, in conjunction with output figures, the
labor productivity per sector. This in turn determines the amount of supported
employment. Based on the lack of employment data it is hence not possible to break down
the sectors at a more detailed level even though this would be desirable. For non-FI
investment, where capital productivities are known at a firm level (see Section 4.1) the
impact can be distinguished for 14 sectors13. In principle the same limitation holds for FI
investment where however the impact of investments can only be differentiated for three
sectors (agriculture, industry, services). That is because of limited information on capital
productivity rates on sector level that takes into account productivity differences between
13 Here smaller sectors have been grouped together yielding a total of 9 sectors shown
Total
280.0
119.3
46.9
46.3
67.5
Tax income
36.7
16.7
9.0
Profits
122.4
54.9
20.0
19.0
28.6
Households income
120.8
47.8
20.5
22.6
29.9
Direct Impact
Indirect Impact 1st
Indirect Impact 2nd
Induced Impact
USD 212 million
USD 94 million
USD 91 million
USD 28 million

14
various firm sizes. That means that the direct effects from FI investing are bundled in the
three main sectors whereas in reality FI portfolios are broader spread.
Exhibit 6: Value-added per economic sector and channel ($ millions)14
Exhibit 6 also distinguishes the value-added related to non-FI financing compared to FI
financing where sectoral differences arise due to differences in lending portfolios and due
to value-added intensities of sectors. The total of $212 million corresponds to the total
value-added with IFC’s financing in Exhibit 5 ($281 million when considering induced
effects as well) whereby most value-added arises in the service and industry sectors.
IFC’s non-FI investments are diversified over various economic sectors in Jordan (see
Table 4). They include the pharmaceutical and the phosphor industry, tourism,
transportation and utilities. IFC has no direct investments into the agricultural sector in
Jordan, the majority of the value-added arising in that sector is caused by IFC’s
investment into FI-clients who in turn have agricultural businesses in their portfolios. Even
though IFC has not invested into agricultural directly, the fact that some IFC’s non-FI
clients have agricultural suppliers and arising third round impacts lead to some small
value-added effect ($0.7 million) of non-FI clients on agriculture. For multipliers per sector
please refer to Table 6. Exhibit 7 shows a somewhat different breakdown distinguishing
the round of impact.
14 For a full definition of sectors please refer to Appendix II
Mining
14.8
Trade
16.1
6.4
9.7
Agriculture
17.0
16.35.7
Business Services
37.9
30.4
7.5
Transport
46.9
10.4
36.5
Manufacturing
49.8
38.7
11.1
Public Services
Utilities Construction
12.6
9.0 8.3
6.92.7
7.7
12.36.4
Effect of Finance given to FIs
Effect of Finance given to NON-FIs
122
NON-FIs FIs
21291

15
Exhibit 7: Value-added per economic sector distinguishing the round of impact (in $
millions)
To the extent that investment decisions are made with the aim of strengthening local
supply chains, Exhibit 7 gives some indication on which sectors are more suitable than
others.
Impact of IFC’s Advisory Services:
Public-Private Partnership on Airport Development
The government of the Hashemite Kingdom of Jordan (GoJ) sought to invite private sector
participation in the expansion and rehabilitation of the Queen Alia International Airport (QAIA) in
Amman and appointed IFC as its lead advisor for structuring and implementing a balanced
transaction. The objective was to increase the terminal's capacity, develop it as a regional hub,
increase service-quality standards to align with international best practices, and ensure revenue
flows for the Government. As advisor to the GoJ, IFC was involved in a wide range of activities
among which the airport design, transaction structuring, being the intermediary of the
negotiations between the GoJ and potential investors to best allocate risks, and working with the
GoJ to implement the necessary changes in the legislative and regulatory frameworks for a timely
and successful project implementation.
IFC was able to implement the project in thirteen months, the fastest project implementation of
Public Private Partnerships with IFC engagement. The price achieved, 54.58% of gross revenue to
the Government on average, is the highest recorded arrangement of this kind in the world. The
project is estimated to create (i) concession income of over $2.5 billion for the Government (NPV,
10% discount rate: $800 million), (ii) mobilize over $1 billion in foreign direct investment over
the life of the project, which is the largest private sector transaction to date in Jordan, (iii) to free
$28 million per annum (over the life of the project) of the Government’s budget (NPV, 10%
discount: $285 million) and to (iv) create over 23,00015 jobs for the local economy.
Following the selection of the winning bidder, IFC also provided financing to the project in the
form of loans of US$120 million. In addition, IFC mobilized US$160 million in loans from
15 IFC Calculations taken from TAAS Completion 9/20/2007 Report, Project ID 24706
Business Services
37.9
19.2
Transport
46.9
29.5
9.7
7.8
Manufacturing
49.8
25.5
13.4
10.9
Agriculture Trade Mining Public Services
Utilities Construction
13.2
17.0
8.7
16.1
11.4
14.8
6.4
12.6
4.3
9.0
6.3
8.35.04.0
12.8
5.9
3.3
47 46
Direct Impact Indirect Impact 1st Indirect Impact 2nd
212119
Direct Impact
Indirect Impact 1st
Indirect Impact 2nd

16
international commercial banks.
This project provides an excellent example of the IFC’s “additionality” in the development finance
space. From a financial standpoint, the IFC was able to provide longer-tenor loans than are
generally available in Jordan, and its presence in this project also helped mobilize additional
capital from international banks, including in the form of Islamic financing. From a non-financial
standpoint, the IFC’s “stamp of approval” for the Airport project gave a confidence boost to
foreign investors, and it further signaled that the Government of Jordan was indeed serious about
pursing an ambitious privatization program.
4.4 Economy-wide employment of IFC Finance
The Jordanian Department of Statistics (DOS)16 publishes information on “Employees and
Enterprises by Economic Activity” that cover the size and allocation of the employed labor
force in Jordan. Based on the size of the employed labor force and output per sector
(2009) obtained from the DOS we determined the employment intensity for 11 sectors in
the Jordanian economy. As the DOS also collect data on the skill level and gender of
people employed, the results distinguish those indicators as well.
Employment associated with IFC’s investments in Jordan has been determined based on
these inputs, and the results shown in Exhibit 8. We emphasize that the total impact of
9,100 associated jobs17 (0.6 % of employed labor force) reported here excludes 3,800
jobs that are related to the induced effect of re-spending of household incomes.
Exhibit 8: Breakdown of employment associated with IFC’s investments per sector and
channel (in thousands)
16 http://www.dos.gov.jo/dos_home_e/main/index.htm 17
Jobs results are presented in terms of full time equivalent employment
Public Services
0.4
Transport
0.7
0.6
Agriculture
1.0
0.9
Business Services
1.1
0.9
0.2
Trade
2.2
0.9
1.3
Manufacturing
2.8
2.2
0.6
Utilities Construction Mining
0.40.3 0.2
0.30.20.3
0.2
Effect of Finance given to FIs
Effect of Finance given to NON-FIs
Effect of NON-FIs Effect of FIs
9.13.4 5.6

17
Most of the jobs associated with IFC’s finance arise, just as with the value-added, in the
service and industry sectors. This is due to the allocation of the portfolio and the specific
employment intensities per sector. The employment intensity indicates how much labor is
employed in order to produce one unit of output. In labor intensive sectors, like the
agricultural sector, one would expect a higher intensity. Keeping in mind the total
amounts invested into non-FIs ($244 million) in comparison to the amount invested into
FIs ($53 million) presented in Table 4, the number of jobs associated with one unit of
capital invested through the two different channels varies quite significantly. The
multipliers are discussed in more detail in Section 4.5.
Exhibit 9: Breakdown of employment per sector over various rounds associated with IFC’s
investments (in thousands)
In Exhibit 10 the related 9,100 jobs are broken down by skill level of employees and by
gender of the employee, where the female labor force seems to be relatively higher
educated. In general, male employees are dominating the Jordanian labor market.
Business Services
1.1
0.5
Trade
2.2
1.2
0.6
0.5
Manufacturing
2.8
1.4
0.8
0.6
Agriculture Transport Public Services
Utilities Construction Mining
0.8
1.0
0.4
0.70.3
0.4
0.2
0.4
0.2
0.3
0.2
0.2
0.2
0.2
0.2
Direct Impact Indirect Impact 1st Indirect Impact 2nd
9.15.0 2.1 1.9
Direct Impact
Indirect Impact 1st
Indirect Impact 2nd

18
Exhibit 10: Gender and skill breakdown of employment associated with IFC’s investments
(in thousands)
The absolute numbers presented in Exhibit 8 and 9 tell only one part of the job creation
story. A tradeoff occurs between the amount of employment and the type of employment.
High multipliers can also be an indicator of economic inefficiency, as relatively a lot of
labor is needed to produce a fixed amount of output and value-added. Hence, depending
on the sector where the employment is supported, not all the jobs are equally productive.
In order to reflect the different levels of productivity that characterize the Jordanian
economy, Exhibit 11 provides a view on the quality of employment by showing the value-
added per employee and sector. The surface area of the blocks indicate the total value-
added18 per jobs for each of the sectors.
Exhibit 11: Value-added per job associated with IFC financing in various sectors (in $)
18 Including arising induced effects
Legislators, Senior Officials & Managers, Clerks.
Service Workers & Shop & Market Sales Workers, Skilled Agricultural & Fishery Workers, Craft & Related Trades Workers. Plant & Machine Operators & Assemblers, Elementary Occupations.
Total
9.1
2.3
4.1
2.7
Female
0.7
0.10.4
Male
8.4
2.2
3.9
2.3
Low
Medium
High
5432 13121110
0
Value added per job(USD)
Number of Jobs (‘000)
9
Trade
7,328
Agriculture
17,320
Industry
20,871
30,682
10,000
65,645
40,000
20,000
30,000
50,000
1
60,000
70,000
876
32,701
Jordanian Average
ConstructionTransport Services

19
The difference in value-added per job is mostly related to the degree of efficiency and
productivity of the respective sectors in Jordan. The average GDP per worker in Jordan is
$17,75019. Not surprisingly, workers in the trade and agricultural sectors generally
contribute less to the Jordanian GPD than this figure. With the development of the Queen
Alia Airport in Amman, the Port of Aqaba and additional investment plans into the rail
system20, Jordan has reinforced its transit position of transportation between Europe, the
Middle East and the Gulf. The importance and competitiveness of the transport sector are
then also reflected in the higher value-added per job in that sector. The Jordanian figure is
then also higher than figures from other countries from that region. Keeping this in mind,
short-run employment creation can be achieved by investing into labor intensive sectors
as agriculture and trade. On the long-run however taking into account development goals,
investment into efficiency improvements (which could entail job losses in the short run)
can contribute to a more sustainable and long lasting growth of an economy.
Impact of IFC’s Advisory Services:
Jordan Inspection Reform
Inspections are governmental mechanisms to ensure compliance in key areas such as health, safety and the environment and are carried out through visits conducted by government- appointed officials to private sector facilities and premises. In many developing countries,
inspections can be a time-consuming and expensive burden, affecting business productivity and deterring owners from joining the formal economy if carried out poorly.
The IFC team supported the development of an inspection strategy covering the key pillars for inspection reforms such as planning, risk based targeting, human resources development, and process documentation and automation. IFC has also worked with the labor inspectorate as pilot inspectorate to implement leading practices. Reforms included the development of a quality
management system comprising inspection strategy and policy, an inspection organization structure, and a comprehensive operations manual with the needed standard operating procedures, forms and checklists. IFC has also delivered training courses to inspectors on newly developed procedures, inspection management, inspection skills, and communication skills to ensure the newly developed systems
is understood and properly implemented in a timely manner.
The project lead to increased efficiency of inspectorates and enhanced the transparency of
inspection operations and requirements through the implementation of improved regulations,
processes and procedures; and the adoption of risk-based inspection systems in addition to
awareness material to business owners. As a result of the rationalization of inspection processes,
the reforms are expected to result in $2 million21 in private sector savings per annum that will
increase the efficiency of businesses while at the same time ensuring high standards of labor and
working conditions.
19 GDP 2010 (27.6 bln USD)/ labor force 2010 (1.5 million) = 17.750 20 http://www.railwaygazette.com/nc/news/single-view/view/ambitious-strategy-ready-to-start.html 21 IFC Calculations ‘Jordan Inspection Reform: Lessons and Reflections’ by Wafa Aranki & Abeer Shalan

20
4.5 Value-added and employment generation multipliers
The results discussed in Sections 4.3 and 4.4 can be summarized by looking at how much
value-added and employment are associated with $1 million of financing (direct, indirect
and induced effects). In Tables 5 and 6 this has been done for the various channels and
economic sectors. The job multipliers in absolute figures presented below refer to direct
and indirect jobs supported per $1 million provided. Taking into account the induced
effects (presented as percentages of the direct/indirect multipliers) the total employment
and value-added multipliers per $1 million outstanding lending (direct + indirect +
induced) can be calculated. For non-FIs, the total job multiplier would hence be 14 +
(45% *14) = 20, meaning that on average 20 jobs are supported by providing $1 million
to the Jordanian economy when invested directly (non-FI client). The same multiplier
definition applies to the value-added and FI multipliers.
Table 5: Value-added and employment associated with $1 million financing
Table 6: Value-added and employment associated with $1 million financing
Table 5 shows that using indirect channels (FIs) to invest into companies leads to more
value-added and employment creation than investing through direct channels (non-FIs).
That is because the portfolios of financial institutions have a broader spread over the local
economy and are not focused on the largest, more capital intensive corporations. Direct
investment into non-FIs in Jordan is mostly focused on a few large, and mostly capital
intensive, companies. Adding one additional unit of capital here has only a marginal effect
on additional value-added and job creation. Similarly, Table 6 shows that the relatively
capital scarce agriculture sector has higher multipliers. Those higher marginal returns on
capital in the agricultural sector can be explained by the fact that it takes relatively little
capital to increase efficiency and productivity in the agricultural sector. Typically, the
agricultural sector encounters difficulties accessing finance as that sector is less formalized
than e.g. the industrial sector. IFC’s investment can overcome those obstacles and
contribute to value-added and employment creation to a large extent.
Channel
Economy-wide value added
related to $ 1 million
($ millions)
Economy-wide employment
related to $ 1 million
(number of jobs)
direct/indirect induced effect direct/indirect induced effect
NON-FIs 0.4 + 30% 14 + 45%
FIs 2.3 + 33% 107 + 40%
Weighted Average 0.7 + 32% 31 + 42%
Channel
Economy-wide value added
related to $ 1 million
($ millions)
Economy-wide employment
related to $ 1 million
(number of jobs)
direct/indirect induced effect direct/indirect induced effect
Agriculture 3.8 + 41% 207 + 42%
Industry 1.3 +32% 57 + 41%
Services 0.5 +30% 19 + 43%
Weighted Average 0.7 +32% 31 + 42%

21
If one was to differentiate the multipliers for non-FI and FI investments per sector, the
magnitude of the multipliers would still depend on productivity differences between
companies financed. As mentioned earlier, non-FI companies tend to be more capital
intensive where additional capital contributes relatively less, suggesting smaller multipliers
per sector for non-FIs compared to FIs.
As far as poverty reduction goals are involved, investment into agriculture offers a
possibility to create a relatively large number of jobs and therefore income to the low
skilled (given the low education levels required to work in agriculture). Similar effects can
be achieved by investing into other labor-intensive sectors like trade and distribution.
Reaching long-term development goals requires however raising levels of labor
productivity. This is more likely to be achieved by investments into larger non-FIs
companies operating in sectors that face international competition.
Compared to the results found in the socio-economic impact assessment conducted in
Ghana, the employment multipliers found for Jordan are considerably lower. This is for two
reasons. First, the IFC provides 60% of its financing in Ghana to FI clients compared to
40% provided to non-FI clients. This is different from Jordan where 80% of all outstanding
finance has been provided to non-FI clients. As described in Section 4.4, we find that
financing FIs generally supports more employment than investments in non-FI clients.
Second, higher multipliers in Ghana reflect the fact that producing in Jordan is relatively
less labor-intensive as the country is more capital abundant.
As pointed out earlier, the multiplier as presented above do not take into account any
“transformational” effects of IFC finance since those cannot be quantified using the
suggested approach. The World Bank Group’s Enterprise Surveys however offers another
way of looking at the impact that IFC investments into Jordan might have. Some 25% of
local firms identify access to finance as major constraint to doing business. Even though
this are relatively fewer firms than the 36% of total Sub-Saharan companies stating the
same, indicating that lack of financing is still an important issue in Jordan. Providing
finance can consequently be assumed to have substantial catalytic effects for the
development of the country. In addition, 24% of companies regard the supply of electricity
as a major constraint to growth. Investing into power plants, or power distribution
companies as the IFC is doing, hence can be thought of as being extremely relevant to
improve the playing field in which businesses operate contributing to value-added creation
relatively more than the multipliers in Table 7 suggest.
Table 7: Major business constraints as identified by Jordanian firms22
% of firm identifying as a major constraint: Jordan Middle East &
North Africa
Access to Finance 25.2 36.3
Electricity 23.7 47.7
Transportation 11.7 25.1
22 Source: World Bank Group Enterprise Surveys, Jordan, 2006

22
Presented with list of 15 business environment issues, managers (of 503 Jordanian firms)
got to choose the largest obstacles to their businesses. Exhibit 12 presents the results,
indicating areas in with IFC’s technical assistance programs can play an important role for
the progression of the Jordan.
Exhibit 12: Business obstacles in Jordan (percent of firms)23
Qualitative Impact of IFC Investment
Investing into client companies doesn’t only mean that the company benefits from additional
finance it receives, but the interaction with IFC also supports the companies in different ways.
As IFC requires some degree of professionalism, IFC clients progress during the interaction
process before reaching an agreement on the kind of collaboration and afterwards during the
investment period. So can the due diligence check required by IFC also be utilized for other (later)
purposes and might a company be required to write a new HR Manual, defining employee’s tasks
and positions. All of that contributes to a clients’ competitiveness in the global market.
In some cases, the IFC interaction next to contributing indirectly to society by investing into
companies, has a direct positive impact for Jordan’s citizens. IFC’s investment into an electricity
distribution company is an example for that where IFC’s finance has been used to build &
maintain a distribution network in remote areas of Jordan. Because of the high maintenance costs
and the few customers in that part of Jordan it is not very profitable to construct the network
there but with the support from IFC the company saw business opportunities there as well and
decided to serve those customers as well.
Having obtained an investment from IFC also serves as signal to potential clients or other
investors underlining the trustworthiness of the company. That way the company can distinguish
itself from competitors.
Whereas the sections above have focused on IFC’s contribution to impacts related to the
companies invested in, the two following sections focus on the overall economic impacts
associated with IFC clients and the contribution of third party finance that was mobilized
with the help of IFC.
23 Source: World Bank Group Enterprise Surveys, Jordan, 2006
4
6
6
6
8
9
9
9
11
25Business licenses and permits
Tax administration
Inadequately educated workforce
Access to land
Tax rates
Political instability
Corruption
Labor regulations
Practices of the informal sector
Access to finance

23
5. Overall impact of IFC non-FIs Clients
Irrespective of IFC’s financing, companies operating in the Jordanian economy impact their
local environment by purchasing local goods and services, paying taxes and employing
local employees. The impact that can be associated with the total operations of all non-FI
clients of IFC in Jordan is estimated in Exhibit 13. The starting point for this analysis is the
entire output of the companies and not, in comparison to the results presented in Exhibit 5
and 6, just the output share that can be related to IFC finance. In other words, the share
of IFC on the total IFC non-FI clients’ impact equals $94 million (Exhibit 6), whereas
Exhibit 13 depicts the entire impact of IFC’s non-FI clients. That means that IFC’s part of
the value-added related to the non-FI clients is on average some 7%, which is comparable
to IFC’s share of the total assets of those firms. The companies that IFC finances
indirectly, through FIs, also of course contribute to the Jordanian GDP and national
employment, but assessing their total output would require an investigation of each
portfolio company which is beyond the scope of this study.
Exhibit 13: Overall value-added of non-FIs supported by IFC (in $ million)
Total
1,736.1
836.6
210.9
306.2
382.4
Tax income
188.9
75.8
50.8
Profits
862.3
483.8
90.3
126.3
162.0
Households income
684.9
277.0
93.6
144.7
169.7
Direct Impact
Indirect Impact 1st
Indirect Impact 2nd
Induced Impact
USD 1,354 million= 6% of GDP
USD 700 million
USD 515 million
USD 138 million

24
Exhibit 14: Overall employment of non-FIs supported by IFC (in thousands)
Comparing the results of Exhibit 8 (non-FI results only) with the ones presented in Exhibit
14 indicates that the IFC’s contribution is equivalent to about 7% of the overall impact of
the companies on the Jordanian economy. That is in line with the share of IFC’s
outstanding loan amount as a percentage of the total assets of the clients (10%) and the
share of IFC related output to total output of the clients (7%).
6. The combined impact of IFC and “participant” financing
The IFC’s investments can have an “additionality” effect on its clients by mobilizing funds
from third party investors (so-called “participants”) to these companies. In Jordan, these
participants had $139 million (as of June 30 2011) of finance outstanding with IFC clients
in the mining and trade sectors. Taking these loans into account as well, Exhibit 15 shows
the impact that can be associated with IFC’s and the mobilized third party capital. As the
output share of the client companies that can be attributed to the IFC plus the participants
is naturally larger than the output share that can be related to the IFC alone, the values
presented in Exhibit 15 are larger than the ones presented in Exhibit 5.
10.7
10.8
4.6
10.2
2.8
7.4
4.5
22.9
Trade Transport Business Services
21.5
24.7
Total
67.7
Public Services
4.9
Construction
0.4
Utilities
4.0
Manu-facturing
15.5
4.7
3.6
3.5
3.7
Mining
9.0
Agriculture
1.78.7
2.7
Indirect Impact 1st
Induced Impact
Indirect Impact 2nd
Direct Impact
46,200 jobs = 5% of labor force
25
Exhibit 15: Value-added by IFC and Participant finance (in $ million)
The additional value-added arising from participants finance sums to at least $38 ($250 in
Exhibit 15 - $212 in Exhibit 5). Compared to IFC’s outstanding finance, the outstanding
lending from participants contributes relatively little to additional value-added creation.
That is because their loans have been provided to two large, highly efficiently operating
companies. To be clear, IFC’s financing provided to the same companies contributes
equally little. As IFC also provides financing to other, less productive companies its overall
value-added contribution is larger.
Exhibit 16: Employment by IFC and Participant finance (in thousands)
Total
329.3
141.2
55.1
53.7
79.3
Tax income
43.4
19.9
10.5
Profits
143.9
64.7
23.6
22.0
33.6
Households income
142.0
56.6
24.0
26.2
35.2
Direct Impact
Indirect Impact 1st
Indirect Impact 2nd
Induced Impact
USD 250 million
USD 110 million
USD 107 million
USD 33 million
0.4
0.4
Agriculture
0.2
Construction Trade Transport Business Services
Public Services
Total
0.0
0.3
0.3
3.1
4.8 0.4
0.7
0.5
0.5
2.2
1.1
Utilities
4.3
8.8
0.4
Manu-facturing
1.0
1.5
0.4
Mining
0.2
1.2
Direct Impact
Indirect Impact 1st
Indirect Impact 2nd
Induced Impact
6,600 jobs = 0.7% of labor force

26
7. Recommendations
As this report demonstrates, the IFC has had an impact on employment creation and
value-added in the Jordanian economy through a variety of channels, including direct
loans to industrial companies, indirect financing of firms through support to financial
institutions (which in turn provide lending), the mobilization of third party or participant
capital, and via the provision of advisory services that improve the business environment.
The IFC’s impact, of course, is not just a function of its own operations but also is
determined by the economy in which it operates. To the extent that labor markets, for
example, are failing to provide workers whose skills match the demands of potential
employers, companies may not be able to operate at full efficiency or capacity. Other
factors, like the tax regime, the ease of doing business, and the state of the country’s
infrastructure, will also influence the level of employment and value-added in the
economy. International economic relations add a further degree of complexity to the
economic structure, including the degree of openness to trade and investment and the
level of foreign aid and remittances received.
These points suggest that an organization like the International Finance Corporation
should interact at both the “micro” and “macro” levels in Jordan to ensure that its funding
of firms and financial institutions will have the greatest possible impact on the nation’s
economy. Specifically, the IFC should consider the following recommendations:
1. To the extent that the IFC is interested in deploying its capital to generate more
employment in Jordan, it needs to recognize the tension between raising labor
productivity, creating fewer jobs or pursuing pure employment creation goals.
Financing well-capitalized companies directly increases labor productivity, but
generates relatively few additional jobs. Financing the banking sector to provide
loans to capital-needy firms enables those firms to bolster output and create, on
average, more jobs throughout the economy. Even though the immediate effect of
financing provided to private companies directly is less, it has the potential to
increase productivity and lead to “transformational” effects in the long-run.
2. In particular, the IFC could play a more significant role in the agriculture sector,
which faces limited access to capital due in part to the banking sector’s
conservative lending practices. In addition, relatively high job multipliers in that
sector have the potential to contribute to IFC’s job creation aim even though the
quality of jobs created should be kept in mind;
3. Similarly, IFC's might want to consider to intensify its impact on the Jordan
economy by investing relatively more into labor intensive industries like agriculture
and trade, sectors with relatively higher multipliers. This would contribute to short-
term poverty reduction goals;
4. The IFC should analyze the extent to which its financing and advisory services
serve to promote the SME sector in Jordan. Based on the labor rather than capital
intensive nature of SMEs, IFC's investment can make a relatively large difference
for those companies;

27
5. Related, the IFC should continue to collaborate with the Government of Jordan in
promoting an environment that is conducive to entrepreneurship, innovation, and
business development that encourages business investment and risk-taking.

28
Appendix I Model description
I.1 Modeling approach
The approach developed for this study is based on the socio-economic impact assessment
(SEIA) models and combines outstanding IFC loan data with a so-called Social Accounting
Matrix (SAM) of the Jordanian economy and the allocation of the work force over the
various economic sectors. A SAM describes inter-industry linkages in an economy,
depicting how the output of one industry goes to another, where it serves as an input. It
therefore essentially makes one industry dependent on another, both as customer of
outputs and as supplier of inputs. Exhibit I.1 depicts an overview of the modeling
approach, including the information sources used to arrive at the two main model outputs.
Exhibit I.1: Overview of the modeling approach
I.2 Production Function
IFC’s outstanding financing has been “translated” into company output based on the firm
production function that is depending on the company capital structure. A production
function describes the firm’s economic output as a function of its inputs, namely capital
and labor: P = f(L,K). Although classic production functions are written in terms of
physical outputs we have used economic output in order to more easily incorporate
different firms. Labor (L) has been measured in terms of the Full Time Equivalents (FTEs)
and Capital (K) has been defined as Capital Employed (defined as total assets in $). For
example, assume a company has assets with a book value of $100, revenues of $200 and
a loan from IFC of $15, this would mean that 15% of 200 = $30 in revenues can be
attributed to IFC.
Due to data constraints we used the Leontief (Linear) or fixed Production Function, a
simpler model for which only current data is needed. The more accurate, but also more
Micro economic analysis Macro economic analysis
IFC Financing
FinancialIntermediary
Firm Capital Structure
Economic Output
Value Added
Employment
• Wages
• Taxes
• Profits
Procurement
• Domestic
• Imports
Direct effect
Indirect effect
Induced effect
1
2 2
3
2 2
1
3
2
Production function
Social Accounting Matrix
Employment intensities
These are described in more
detail in separate sections
Financial instrument

29
complex and data-intensive Cobb-Douglas Production Function, would have been an
alternative.
All expenditures necessary to produce the output share related to IFC can then be traced
through the Jordanian economy estimating the associated value-added and employment
created.
For FIs, IFC’s financing was allocated over different economic sectors according to the
lending portfolios of the FIs IFC invest in. For each sector an “economy-wide” production
function was used to determine the direct impact of IFC’s capital which was then treated
as output generated at non-FIs. We have not conducted any interviews with borrowers of
FIs. Value-added and employment effects supported by financing provided to FIs have
been quantified relying on macro-economic production functions per sector based on local
statistics. The additional output related to the IFC’s investments based on the production
functions has then been followed through the economy as intermediary products and
distribution services were necessary to produce/ship this additional output. The basis for
this exercise was the SAM as described under I.3.
Further, the size of the FI portfolio companies has not been taken into consideration. The
size of companies supported plays a role for productivity levels. Given data availability for
Jordan, this study is based on average productivity levels per sector.
I.3 Social Accounting Matrix
The key ingredient of the model is the Social Accounting Matrix (SAM). The SAM describes
the financial flows of all economic transactions that take place within the Jordanian
economy. It is a statistical and static24 representation of the economic and social structure
of Jordan. As shown in Exhibit I.2, in the SAM the number of columns and rows are equal
because all sectors or economic actors (industry sectors, households, government and the
foreign sector) are both buyers and sellers. Columns represent buyers (expenditures) and
rows represent sellers (receipts).
Of the four quadrants in the SAM, three are relevant here. Final consumption induces
production which leads to financial transfers between the various sectors which
subsequently generates incomes for households, governments (taxes) and profits
(dividends and savings). For Jordan, the most recent SAM dates back to 2004 and has
been taken from the GTAP25 database. Using data from the Jordan Statistical Office26, the
SAM has been updated for the year 2009.
24 SAMs are valid for a specific year. Economies are subject to change and SAMs must be updated periodically. 25 Global Trade Analysis Project (www.gtap.agecon.purdue.edu). 26 http://www.dos.gov.jo

30
Exhibit I.2: Social Accounting Matrix
The last step in constructing the SAM is to normalize it such that all columns add up to
one. Then spending of IFC clients can be traced in money terms throughout the economy.
In doing so, the economic effect related to the presence of IFC can be divided into three
effects:
1. Direct effects: effects arising directly at clients financed by IFC and directly at FI
portfolio companies (e.g. jobs and salaries paid by direct clients/portfolio
companies)
2. Indirect effects (1st tier trade partners): effects arising at suppliers of IFC
clients/portfolio companies that result from spending of direct beneficiaries to
produce the IFC related output.
3. Indirect effects (2nd tier trade partners): effects arising at suppliers’ of
suppliers directly cooperating with IFC’s clients/portfolio companies (e.g. jobs and
salaries provided by suppliers’ suppliers);
4. Induced effects: effects due to the increased expenditures of households enabled
by the increasing incomes generated by the direct and indirect effects.
I.4 Assumptions
1. Constant returns to scale, constant technology and constant capital & labor productivity
For all sectors, the Social Accounting Matrix (SAM) implicitly assumes Leontief (linear)
production functions in which the inputs increase proportionally with output. Across the
economy and over not too long a period, this assumption is possibly not overly restrictive,
as new technologies and business practices take time to translate into higher productivity.
Input-output modeling is not capable of reflecting transformative change such as comes
with, say, the introduction of cell phone or internet technology. For this reason, SAMs are
periodically (or sometimes sporadically) updated. Only by studying the change of SAMs
over time can one infer the effect of transformative technology of business practices. If
one were to update the SAMs every five years or so, and assume technology was constant
during the period, one would incorporate the transient change of technology in a quasi-
Value added(Incomes)
Transfers Finaldemand
Investm
ents
Export
Taxes
Household
Consum
ptio
n
Reta
il
Manufa
cturin
gAgric
ultu
re
...
...
...
Agriculture
Manufacturing
...
...
...
Retail
Taxes
Households
Imports
Dividends/savings
IFC financing results in additional output which leads to
Transfers of money between sectors which in turn generate
Incomes for households, companies & governments which
create
Additional final demand
IFC Financing per sector
...
...
IFC attributable output per sector
Production functions

31
steady way. This, however, would not quantify IFC’s contribution to this (transformative)
technology change. In input-output modeling, the marginal capital and labor productivities
are equal to overall capital and labor productivity. Although in reality one would expect
diminishing marginal returns to scale, the lack of skills and capital typically present in
emerging markets probably mean that this is a reasonable assumption. For firms with
good access to finance (possibly IFC clients), however, the assumption is more restrictive.
Using, as proposed, Cobb-Douglas production functions for these companies will improve
results but only in terms of the “direct” impacts.
2. Different products within one sector have identical cost structures
Although economies of scale and scope surely influence the production process within an
individual company, we assume that production processes are not too dissimilar across a
sector. This restrictive assumption could only be relaxed with more disaggregated data.
3. Demand is totally inelastic and input structures are fixed
In a SAM, the use of inputs does not depend on price but only on final demand.
Unreasonable as it may sound, this assumption may not be overly restrictive unless one
supposes that firms are price-makers instead of price-takers. More restrictive is that the
production function relies on a fixed proportion of inputs (i.e. no substitution takes place).
Again, this may not be problematic over a given time-horizon.
4. Supply of inputs is totally elastic
Supply of labor intensive products can be expected to be fairly elastic for unskilled labor.
For skilled labor this would be more problematic. Inputs from capital intensive industries
will typically violate this assumption, as capital is typically scarce in emerging economies
and economic impact would then be overestimated.
5. Time invariance
Input-output modeling yields a “snapshot in time”. In a sense, it is as if the effects of any
IFC intervention result in a new “steady state” immediately. In reality, of course, it would
take a substantial amount of time for these effects to percolate through the economy. In
other words, the methodology produces a snapshot of the economy and does not take the
date of a financing intervention into account. To model these kinds of time changes one
would need to apply Computational General Equilibrium (CGE) models. These models are
however much more data intensive and it is highly unlikely that one could apply them in
most emerging economies. Even if one could, inaccuracies in the data would probably
multiply to the point where any results would be highly questionable. In addition,
attribution of any changes to IFC become increasingly difficult as time proceeds, as a
growing number of exogenous and endogenous events will exert their influence.
Obviously, the results should be assessed accordingly.

32
Appendix II: Overview of sectors
The overview below provides an overview of the sub sectors included in each of the
sectors used in this report.
Agriculture
Paddy rice
Wheat
Cereal grains
Vegetables, fruit, nuts
Oil seeds
Sugar cane, sugar beet
Plant-based fibers
Crops
Bovine cattle, sheep and goats, horses
Animal products
Raw milk
Wool, silk-worm cocoons
Forestry
Fishing
Industry (Manufacturing/Mining/ Utilities/ Construction)27
Coal
Oil
Gas
Minerals
Bovine meat products
Meat products
Vegetable oils and fats
Dairy products
Processed rice
Sugar
Food products
Beverages and tobacco products
Textiles
Wearing apparel
Leather products
Wood products
Paper products, publishing
Petroleum, coal products
Chemical, rubber, plastic products
Mineral products
Ferrous metals
Metals
Metal products
Motor vehicles and parts
Transport equipment
27
Construction is sometimes shown separately throughout this study

33
Electronic equipment
Machinery and equipment
Manufacturing
Electricity
Gas manufacture, distribution
Water
Construction
Retail (Off-Trade)
All retail sales Repairs of motor vehicles and personal and household goods Retail sale of automotive fuel
Wholesale (Off-Trade)
Wholesale trade and commission trade
On-Trade
Hotels and Restaurants
Transport (Transport/Communication)
Transport
Water transport
Air transport
Communication
Services (Financial/ Public/ Social Services)
Insurance
Business services
Public Administration, Defense, Education, Health
Dwellings
Recreational and other services

34
About the Authors - Steward Redqueen and Ethan B. Kapstein
Company profile
Steward Redqueen is a strategy consultancy firm that aims to magnify the positive impact
of the private sector on society. It is represented in Amsterdam, Luxembourg, Barcelona
and New York and executes projects around the world. As specialists since 2000, Steward
Redqueen focuses on integrating sustainability, quantifying impact and facilitating change.
Clients appreciate our rigorous analysis, our ability to solve complex problems, and being
ahead of the curve. We work for (multinational) corporations, (development) financials
and public sector organizations. Since 2006 Steward Redqueen has completed more than
50 socio-economic impact studies for multinational mining companies, development
finance institutions, multinational food & beverage firms, banks and recreational
organisations, in Asia, Africa, Latin America and Europe.
More information, visit: www.stewardredqueen.com
Socio-economic impact assessments (SEIA)
Foreign direct investment (FDI) has been a source of controversy for many decades.
Supporters of FDI point to the benefits of adding foreign capital to domestic savings and to
the employment, technology transfer, and (in many cases) exports that are generated.
Detractors assert that FDI crowds out domestic firms and suppliers, while contributing
little to government tax revenues. Our Socio-Economic Impact Assessments go beyond
assertions in an effort to quantify the direct and indirect impacts of firms in the countries
in which they are active. On these projects we work together with Professor Ethan B.
Kapstein of Georgetown University (Washington, DC), who is an associate partner of
Steward Redqueen.
Ethan B. Kapstein
Ethan B. Kapstein, associate partner of Steward Redqueen, is currently Visiting Professor
of Global Strategy at Georgetown University (Washington, DC). Previously he held
positions at INSEAD, Harvard University, the University of Minnesota, and the
Organization for Economic Cooperation and Development. A former international banker
and naval officer, Prof. Kapstein serves as an economic and strategy consultant to
government agencies and many of the world’s leading multinational corporations. His
latest books are Economic Justice in an Unfair World and The Fate of Young Democracies.
René Kim
René Kim is founding partner of Steward Redqueen. He has worked with many
multinational companies and private equity funds in both developed and emerging
markets. Previously, he worked for the Boston Consulting Group in Amsterdam and as an
academic at the Massachusetts Institute of Technology. He has a PhD cum laude in
Hydrology and Meteorology and is the author of many academic articles. The authors were
assisted by Hedda Eggeling of Steward Redqueen.