Embed Size (px)
Citation preview

KYOUNG-OK PARK The Effects of Social Support at Work on Job Demands, Job Control, Depression,
Job Performance, and Absenteeism (Under the direction of Dr. MARK WILSON)
Depression is a growing issue in work stress research because work stressors are
closely related to depression and depression, in turn, affects organizational loss.
Considering such subsequent causal relationships within a work stress framework, some
powerful and comprehensive source to prevent work stress is needed for worksite health
promotion. It is well documented that social support at work has direct and indirect
beneficial effects on the work stress framework. However, there have been few studies
examining the comprehensive effects of social support on a work stress process and its
outcomes.
This study examined how social support affected workers’ depression and related
organizational outcomes. The participants were 240 workers employed in a public
hospital in Georgia. Self-administered questionnaires were distributed to employees with
their pay slips followed by eight reminders over a 20-day period. The response rate was
31%. The questionnaires asked about job demands, job control, social support at work,
depression, job performance, absenteeism, and demographics. The social support
construct was measured by who supported at work and what kinds of support were
provided. Statistical analyses were conducted using the structural equation modeling
approach in LISREL version 8.5.
Social support at work was directly related to high job control, low depression,
and high job performance. However, social support did not buffer the negative effects of
work factors on depression and related organizational outcomes. By source of support,

only organizational support was positively related to high job control. Organizational
support was more effective than supervisor and coworker support by source of support.
Any stressors and their outcomes were not different by what kinds of support they had at
work. This result indicated that job control was influenced more by who supported them
rather than what kinds of support they had at work and the most efficient source of
support was organization. In summary, social support at work had positive effects on job
control, depression, and job performance. Organizational support was a strong factor in
improving workers’ perceived controllability on the job.
INDEX WORDS: Hospital workers, Social support at work, Work stress, Depression,
Job performance, Absenteeism, Job demands, Job control,
The demand-control-support model, Source of support,
The framework of occupational stress, Function of support,
Main effect, Interaction effect, Structural equation modeling

i
THE EFFECTS OF SOCIAL SUPPORT AT WORK ON JOB DEMANDS, JOB
CONTROL, DEPRESSION, JOB PERFORMANCE, AND ABSENTEEISM
By
KYOUNG-OK PARK
B.S., The Ewha Womans University, South Korea, 1994
M.S., The Ewha Womans University, South Korea, 1996
A Dissertation Submitted to the Graduate Faculty
of The University of Georgia in Partial Fulfillment
of the Requirements for the Degree
DOCTOR OF PHILOSOPHY
ATHENS, GEORGIA
2002

i
2002
Kyoung-Ok Park
All Rights Reserved

i
THE EFFECTS OF SOCIAL SUPPORT AT WORK ON JOB DEMANDS, JOB
CONTROL, DEPRESSION, JOB PERFORMANCE, AND ABSENTEEISM
By
KYOUNG-OK PARK
Approved: Major Professor: Mark Wilson Committee: David DeJoy Rovert Vandenberg Pamela Orpinas Laura K. McCormick
Electronic Version Approved: Gordhan L. Patel Dean of the Graduate School The University of Georgia August 2002

iv
This dissertation is dedicated to
God in heaven, Jesus Christ, and the Holy spirit.
v
ACKNOWLEDGMENTS
This dissertation is my first work identifying that all things in the Holy Bible are
true and worthwhile to follow. I prayed to God to give me one phrase in the Bible as the
topic of my dissertation for three semesters. In the last semester of my doctoral course
work, he responded to my prayer. His response was the new testament that Jesus Christ
gave us in the 34th phrase of John, Chapter 13 in the Bible. Based on this phrase, I
examined how important a ‘loving and caring climate’ was for reducing stress in the
worksite. I deeply appreciate my Father in heaven for listening to my prayer, Jesus Christ
for praying for my dissertation project with me, and the Holy Spirit for allowing me to
realize that praying is the most important thing for this project. With God’s perfect
guidance, I successfully finished my dissertation from finding the topic to taking the final
oral defense. Substantially, my dissertation is not mine and all glory from my dissertation
should be for God.
God allowed me to meet a great number of people who helped with my
dissertation project and doctoral study. A special word of appreciation goes, first to Dr.
Mark Wilson who guided me with patience. Dr. Wilson taught me the meaning of a
patient advisor with his support for my study because I was and still am an international
student who typically takes a long time to adapt to a new climate. I also would like to
acknowledge my committee members – Drs. David Dejoy, Robert Vandenberg, Pamela
Orpinas, and Laura McCormick – for their academic encouragement, support, and advice.
I am specifically grateful to my friend, Karen Braxley working in the Learning
Center of the University of Georgia. She gave me generous and careful support for

vi
reading this entire dissertation. She was willing to take extra time for proof-reading of my
dissertation in need. She is my precious American friend to me. I also would like to thank
Dawn Satterfield for reading several chapters of this dissertation and providing good
correction.
A great number of Korean friends have prayed for my dissertation. I specially
want to thank the prayer meeting members: Deukhee Gong, Boram Yi, Minchi Kim, and
Juhee Hong. Without their endless prayers and encouragement, I could not have become
who I am. I also appreciate Pastor Shinchul Park who has sincerely prayed for me in
every step of my dissertation project. I can not forget the love I got from Chongwon Ham
and Sunhee Ham through my entire doctoral program. They showed me what it means to
serve others through their care-giving and patience for me.
Finally, I appreciate my parents and my siblings: Jaeju Park, Malyub Lee, Minok
Park, Yeiok Park, and Junhyuk Park. They consistently support and take care of me in
various ways. They always think of me although we are far from each other.
This dissertation is absolutely not the best academic piece but just a small
academic piece. However, I dare to dedicate this dissertation to God because this is my
first piece that I did my best in Jesus’ name. I sincerely hope this dissertation pleases my
God.
“A new command I give you: Love one another.
As I have loved you, so you must love one another”.
(John 13:34)

vii
TABLE OF CONTENTS
Page
ACKNOWLEDGEMENTS ................................................................................................ v
LIST OF TABLES ............................................................................................................. ix
LIST OF FIGURES............................................................................................................. x
CHAPTER
1 INTRODUCTION........................................................................................................ 1
Significance and Background ...................................................................................... 2
Problem Statement ....................................................................................................... 4
2 LITERATURE REVIEW............................................................................................. 6
Social Support at Work ................................................................................................ 6
Depression and Work................................................................................................... 9
Two Work Stress Models Related to Social Support................................................. 12
Relationships Between Job Demands, Job Control, Depression, Job Performance,
and Absenteeism ........................................................................................................ 18
Effects of Social Support on Job Demands, Job Control, Depression, Job
Performance, and Absenteeism.................................................................................. 24
The Work Stress Framework of This Study............................................................... 33
3 METHODS ................................................................................................................ 36
Purpose of the Study .................................................................................................. 36
Study Participants....................................................................................................... 36
Study Design .............................................................................................................. 37
Research Questions and Hypotheses.......................................................................... 37
Data Collection Procedures........................................................................................ 38
Measures .................................................................................................................... 40
Data Management and Statistical Analysis................................................................ 47

viii
4 RESULTS .................................................................................................................. 57
Validation of Measurement Models........................................................................... 57
Description of the Participants ................................................................................... 66
Main Effects of Social Support on Job Demands, Job Control, Depression, Job
Performance, and Absenteeism.................................................................................. 70
Interaction Effects of Social Support on the Proposed Work Stress Framework ...... 71
Sources of Social Support at Work Affecting Job Control, Depression, and Job
Performance ............................................................................................................... 76
Functions of Social Support at Work Affecting Job Control, Depression, and Job
Performance ............................................................................................................... 78
Summary .................................................................................................................... 79
5 CONCLUSION AND RECOMMENDATIONS....................................................... 81
Discussion and Conclusion ........................................................................................ 82
Study Limitations ....................................................................................................... 87
Recommendations ...................................................................................................... 89
REFERENCES.................................................................................................................. 92
APPENDICES
A SURVEY QUESTIONNAIRE ................................................................................ 102
B EFFECTS OF DEMOGRAPHIC VARIABLES AND STRESSFUL LIFE EVENTS
ON DEPRESSION: REGRESSION ANALYSIS ................................................... 109
C MEASUREMENT MODELS FOR HYPOTHESIS TESTS................................... 111

ix
LIST OF TABLES
Table Description Page
Chapter 3. Methodology
3.1 The time-line of the survey collection....................................................... 39
3.2 Description of measures ............................................................................ 40
Chapter 4. Results
4.1 Description of measures used in the survey and in the analysis ............... 58
4.2 Overall model fits of the four measurement models ................................. 59
4.3 Parameter estimates of the measurement model for Hypothesis 1............ 61
4.4 Parameter estimates of the measurement model for Hypothesis 2............ 63
4.5 Parameter estimates of the measurement model for Hypothesis 3............ 64
4.6 Parameter estimates of the measurement model for Hypothesis 4............ 65
4.7 Demographic characteristics of participants ............................................. 66
4.8 Occupational characteristics of participants.............................................. 68
4.9 Correlation between variables................................................................... 69
4.10 Interaction effects of social support at work on the work stress framework
................................................................................................................... 75

x
LIST OF FIGURE
Figure Description Page
Chapter 2. Literature Review
2.1 The Framework of Occupational Stress .................................................... 17
2.2 The work stress framework of this study .................................................. 34
Chapter 4. Results
4.1 The main effects of social support at work on job demands, job control,
depression, job performance, and absenteeism ......................................... 72
4.2 Comparison of the parameters between the high support group and the low
support group in the last step of multi-group analysis .............................. 74
4.3 The main effects of support at work on job control, depression, and job
performance by source .............................................................................. 77
4.4 The main effects of support at work on job control, depression, and job
performance by function ........................................................................... 80

1
CHAPTER 1
INTRODUCTION
It is well documented that social support at work has diverse beneficial effects on
reducing both causes and effects of work stress (Cohen, 1988; House, 1981).
Theoretically, beneficial effects of social support at work on work stress have been
emphasized in two representative work stress models: Karasek’s (1979) demand-control-
support model and House’s framework of occupational stress. These two work stress
models have also strongly been supported in empirical research in terms of their
predictability of work stress outcomes (Baker, Israel, & Schurman, 1996; Theorell &
Karasek, 1996).
In recent years, numerous intervention programs to reduce work stress have been
conducted because medical cost related to work stress is rapidly growing (Sauter,
Murphy, & Hurrell, 1990). In particular, depression, a psychological outcome of work
stress, is a leading cause of work disability and induces major organizational loss due to
high medical cost, high absenteeism, and poor job performance (Conti & Burton, 1994).
Accordingly, comprehensive stress prevention strategies should be developed to manage
the entire work stress process covering work stressors, strains, and diverse outcomes not
just some causes or outcomes. Thus, it is worthwhile to study the diverse effects and
characteristics of social support affecting work stress for the work stress prevention.
Significance and Background
Work stress comprises the main body of occupational health research because
recent studies have reported that work stress is related to organizational productivity loss

2
as well as to physical and psychological strains (Brook & Price, 1989; Goodwin, 1992;
Iverson, Olekalns, & Erwin, 1998). In relation to work stress, depression, absenteeism,
and job performance are the main sources of organizational productivity loss. These
stress outcomes are also correlated with each other (Dwyer & Ganster, 1991).
Depression is a serious and prevalent psychological outcome related to work
stress. The prevalence rate of major depression among workers in the United States is
approximately 9.5%, and adults’ experience of depression has tripled in the last thirty
years (Narrow, 1998). Furthermore, depression has higher rates of relapse to disability
status than any other common chronic medical conditions in the working population
(Conti & Burton, 1994).
Depression is a primary mental health problem itself and is also related to
organizational outcomes such as absenteeism and job performance (Conti & Burton,
1994). Greenberg, Kessler, Nells, Finkelstein, and Berndt (1996) reported that the annual
salary-equivalent cost of depression due to work loss and work cutback in the U.S. labor
force is over $40 billion per year. More than half of the depression cost arises from the
cost of increased absenteeism (Eaton, Anthony, Mandel, & Garrison, 1990; Kessler et al.,
1999). Depression also decreases job performance because depressed workers can not
fully concentrate on their job. Thus, depression not only increases medical cost and
absent days for the treatments but also decreases job performance. This indicates that
within a work stress process, psychological outcomes and organizational outcomes are
closely correlated with each other (Dwyer & Ganster, 1991; Hurrell & Murphy, 1996;
Iverson, Olekalns, & Erwin, 1998; Kristensen, 1991).
The demand-control-support model (Karasek, 1979) successfully explains what
the major drivers of work stress are and how much they affect mental and physical illness.
Karasek divided job contents into two components: job demands and job control.
Interaction of the extent to which workers are able to exert control over their work and
actual demands at work determines the level of work stress and the outcomes of work

3
stress in this model (Karasek & Theorell, 1990). Karasek regarded social support at work
as an important work environment factor modifying the negative effects of job demands
and job control on strains in the worksite. Karasek found that the interaction of those
three components affected depression more than any other psychological strains. The
effects of social support on stress have also been well documented in other organizational
studies (Schecher, Green, Olson, Druse, & Cargo, 1997). House (1981) proposed an
entire work stress framework for researchers conducting work stress prevention programs.
House’s framework shows a whole process of work stress and emphasizes the beneficial
role of social support at work on the work stress process. In both the demand-control-
support model and the House’s framework, social support at work not only directly
reduces work stressors, strains, and outcomes, but also buffers the effects of work stress
on outcomes.
Social support at work can be a powerful source of work stress intervention. One
of the greatest strengths of stress prevention using social support is that social support at
work has comprehensive beneficial effects on the entire work stress process and its
outcomes (Israel, Schurman, & House, 1989), whereas most other stress prevention
programs attempt to reduce or relieve strains through education in stress coping methods
or muscle therapy (Murphy, 1996). Social support at work can alleviate depression both
by increasing support itself, by strengthening perceived control, by providing solutions to
problems, and by increasing emotional attention from other people at work (Dwyer &
Ganster, 1991). Few studies, however, have comprehensively examined how social
support at work affects the relationship between the psychological work stress process
and organizational outcomes. Furthermore, few studies have examined what
characteristics of social support at work are more effective in reducing work stress and
negative organizational outcomes. Most work stress studies examined only part of how
social support affected the work stress process or how social support affected part of the
work stress process (Cahill & Landsbergis, 1996; Eisenberger, Cummings, Armeli, &

4
Lynch, 1997; Heaney, Israel, Schurman, Baker, House, & Hugentobler, 1993; Kline &
Snow, 1994; Terborg, Hibbard, & Glasgow, 1995). Moreover, studies examining the
effects of social support on organizational outcomes in relation to work stress are still
rare.
Accordingly, identifying the comprehensive effects of social support at work on
work stress is important in a work stress prevention perspective. If a study specifies
characteristics of social support affecting the work stress process, examines effects of
social support in a framework based on a theoretical model, and includes organizational
outcomes into the framework, this study will supply efficient information for developing
work stress prevention programs.
Problem Statement
The main purpose of the study was to identify the effects of social support at work
on job demands, job control, depression, job performance, and absenteeism. Specifically,
this study (1) examined how social support at work affects job demands, job control,
depression, job performance, and absenteeism, and (2) identified which characteristics of
social support at work affect perceived job demands, job control, depression, job
performance, and absenteeism.
Research questions and hypotheses were as follows.
Q1: How does social support at work affect job demands, job control, depression, job
performance, and absenteeism?
H1: Social support at work directly affects job demands, job control, depression,
job performance, and absenteeism (the main effect).
H2: Social support at work buffers the path between job demands, job control,
depression, job performance, and absenteeism (the interaction effect).

5
Q2: What characteristics of social support at work are closely related to job demands, job
control, depression, job performance, and absenteeism?
H3: Effects of support at work on job demands, job control, depression,
performance, and absenteeism are different by source of support.
H4: Effects of social support at work on job demands, job control, depression, job
performance, and absenteeism are different by function of support.

6
CHAPTER 2
LITERATURE REVIEW
This chapter indicates the general meanings of social support and depression and
reviews the relationships between work stress and social support at work based on
theoretical models and empirical research. Social Support at Work defines general
meanings of social support and describes two major characteristics of social support at
work. Depression and Work describes the general meaning of depression and the
significance of depression at work. Two Work Stress Models Related to Social Support
points out two representative work stress models: the demand-control-support model
(Karasek, 1979) and the framework of occupational stress (House, 1981). These two
models contributed to building the work stress framework for this study. Relationships
Between Work Stressors, Depression, Job Performance, and Absenteeism summarizes
findings of empirical research on work stressors, depression, job performance, and
absenteeism. Effects of Social Support at Work on Work Stressors, Depression, Job
Performance, and Absenteeism describes diverse effects of social support at work on
work stress.
Social Support at Work
Definition of Social Support
Caplan (1974) suggests that social support systems consist of “continuing social
aggregates that provide individuals with opportunities for feedback about themselves and
validations of their expectations of others.” Lin, Simeone, Ensel, and Kuo (1979)
identify social support with social networks or social environments. They define social
support as support accessible to an individual through social ties with other individuals,
groups, and the larger community. House (1981) defines social support as an
interpersonal transaction involving one or more of the following: (1) emotional concern

7
(liking, love, and empathy), (2) material aid (goods or services), (3) information (about
the environment), or (4) appraisal (information relevant to self-evaluation). Summarizing
the various definitions of social support, social support is perceived support from one’s
interpersonal networks in solving one’s problems or in improving one’s well-being.
It has been hypothesized that support has positive functions on stressors and
strain. Stressors and strains vary in the types of adaptational demands they make, and the
various characteristics of social support differ with respect to the type of adaptational
demands they can moderate. That is, definitions of social support have been based on the
assumption that social support is effective in minimizing the negative effects of stressors
and strains when there is congruence between adaptational demands of stress at work and
characteristics of social support (Wilcox & Vernberg, 1985). Thus, determining
characteristics of social support which are associated with stress can be a key point in
minimizing stress effects on health and productivity at work. Source and function are
primary characteristics of social support (House, 1981).
Source and Function of Social support at Work
Source of social support concerns who provides social support. House (1981)
indicates that sources of support include the major individuals and groups that might
provide support to the people in need. Supervisor support and coworker support have
frequently been measured as sources of social support at work (Israel, House, Schurman,
Heaney, & Mero, 1989). House also indicated that supervisors were a more effective
source of support than coworkers in reducing work stress and buffering the impact of
work stress on outcomes because cohesive interaction with coworkers was limited.
Limited interaction with coworkers is a common feature of many industrial jobs such as
assembly-line jobs and service jobs (Larocco, House, & French, 1980). Coworkers are in
similar working conditions to each other and have less power to solve their stressful
conditions than supervisors. Therefore, supervisors are more able to supply appropriate
support at the proper time.

8
House (1981) discusses that supervisor support is affected by what the
organization has, especially, management styles, advocate, value, and reward. Sustained
changes in supervisory or managerial behavior, including increased emphasis on social
support, are likely to occur only in the context of broad organizational participation in
support. Hutchison and Garstika (1996) also mention that employees view actions taken
by agents or supervisors of an organization as representative of actions of the
organization itself. They describe this process as personification of the organization. That
is, workers’ satisfaction with work support affects employees’ general feeling of how
much their organization takes care of them. The structures of the organization and the
jobs within it also have a strong influence on coworker support. In a study of factory
workers, coworker support had little influence on stress and health because of the highly
individuated structure of work in that factory (House & Wills, 1978). Factory workers
who work independently of others tend to report lower coworker support than other
workers. Thus, levels of coworker support are also limited by the type of work in addition
to the values and climates of the organization (Armeli, Eisenberger, Fasolo, & Lynch,
1998; Eisenberger, Cummings, Armeli, & Lynch, 1997; Hutchison, 1997).
Function of social support is one of the most frequently measured characteristics
of social support (Cohen & Wills, 1985). Function of social support means the kinds of
social support that people receive. House (1981) suggested that the main functions of
social support were emotional support, material support, informational support, and
appraisal support. He assumed that all four functions of support should be considered as
potential forms of support, and their different impacts on stress and stress outcomes
should be studied more.
Emotional support involves providing empathy, caring, love, and trust. The
impacts of emotional support on stress and health are relatively clearer than those of other
functions of support (Cohen & Hoberman, 1983; Schaefer, Coyne, & Lazarus, 1981;
Stansfeld, Bosma, Hemingway, & Marmot, 1998). Gottlieb (1978) found that individuals

9
thought mainly of emotional support when they thought of people being ‘supportive’
toward them and felt thankful for emotional support without feeling burdened by the need
to do something for the support that they received. Material support consists of aid in
money, labor, and time. Material support is more clearly distinguished from emotional
support than from other functions of support because instrumental helping behaviors
directly support something the person needs (House, 1981). However, material support
also has fundamental psychological consequences. For example, giving a person money
can be a sign of caring or a source of feedback. Informational support means providing a
person with information that the person can use in coping with personal and
environmental problems. It is difficult to clearly differentiate between appraisal support
and informational support because appraisal support and informational support involve
only transmission of information rather than affection involved in emotional support or
the practical aid involved in material support (Wilcox & Vernberg, 1985).
Depression and Work
Definition of Depression
Depression is described in terms of symptoms and types of depression.
Depressive symptoms consist of sad mood, loss of interest in activities that were once
enjoyed, change in appetite or weight, difficulty sleeping or oversleeping, physical
slowing or agitation, energy loss, feelings of worthlessness or inappropriate guilt,
difficulty thinking or concentrating, and recurrent thoughts of death or suicide (National
Institute of Mental Health, 2001). Although most psychological strains of sadness, loss,
or anger are temporary, depression is persistent and can interfere significantly with an
individual’s ability to function (Birmaher & Ryan, 1996).
There are three types of clinical depression: major depressive disorder, dysthymic
disorder, and bipolar disorder. These disorders have almost the same depressive
symptoms but the severity and the pattern are different from each other. A major
depressive disorder is diagnosed if a person has five or more of the depressive symptoms

10
almost every day during a two-week period. A dysthymic disorder is more chronic but
less severe than a major depressive disorder. People who have a dysthemic disorder
experience a depressed mood persisting for at least two years with at least two other
depressive symptoms. In a bipolar disorder, depression alternates with mania, which is
characterized by abnormally and persistently elevated mood or irritability. The symptoms
include overly-inflated self-esteem, decreased need for sleep, increased talkativeness,
racing thoughts, distractibility, physical agitation, and excessive risk taking (National
Institute of Mental Health, 2001). Generally, in this study, depression indicates
depressive symptoms not clinical depressive disorders diagnosed by doctors.
Significance of Depression at Work
The prevalence of major depression among workers in the United States is
approximately 9.5%. There are 18.8 million adults who have depressive disorders
(Narrow, 1998), and the nationwide prevalence ranges from 5 to 10% (Conti & Burton,
1994). By gender, the prevalence of depression among female workers (12%) is almost
twice that of male workers (7%) and many women experiencing depressive disorders
belong to the active working ages between the ages of 27 and 46 (Conti & Burton, 1994).
Depression becomes a significant health issue among working women.
Depression has higher rates of short-term disability and relapse to disability status
than any other common medical conditions in the working population (Conti & Burton,
1994). In a study of depression conducted in a large financial company, the disability
days for depression were greater than disability days for heart disease, lower back pain,
and diabetes mellitus. Furthermore, regarding 12-month recidivism of short-term
disability, depression showed 26% higher rates of relapse than diabetes mellitus.
Additionally, the relapse rate of short-term disability due to depression was higher than
the relapse rates of heart disease, back pain, and blood pressure (Conti & Burton, 1994).
Thus, depression not only produces longer disability periods than common chronic
medical conditions, but also shows a higher rate of relapse to disability status.

11
Absenteeism and job performance are major issues related to depression in the
workforce. Greenberg, Kessler, Nells, Finkelstein, and Berndt (1996) estimated that the
annual salary-equivalent cost of depression due to work loss and work cutback in the US
labor force is $44 billion per year. Of this $44 billion, $24.5 billion was caused by costs
of increased absenteeism (Kessler et al., 1999). Other factors in the total cost include
losses arising from decreased productivity due to increased work loss and medical costs
related to safety risks, accidents, and suicide. More than half of the total cost of
depression in an organization results from increased absenteeism (Eaton, Anthony,
Mandel, & Garrison, 1990). Cartwright, Cooper, and Murphy (1995) reported that 30 to
40 percent of all sickness absence from work was attributable to depressive symptoms.
Kessler and colleagues (1999) in a nationwide study reported that depressed workers had
between 1.5 and 3.2 more short-term disability days per month than those without
depression; these differences resulted in a salary equivalent productivity loss of $182 to
$395 per month. They found that the salary equivalent productivity loss due to absent
days was at least half of the total cost of depression to organizations. They also suggested
that between 45% and 98% of the total cost of depression for the US workforce would be
offset by increased work productivity associated with symptom remission.
Depression also affects job performance although unlike absenteeism, the cost of
depression due to decreased job performance has little been reported. However,
depressive symptoms decrease personal performance at work because motivation to work
is decreased and depressed workers do not fully concentrate on their work (Grunberg,
Anderson-Connolly, & Greenberg, 2000). Thus, in terms of absenteeism and job
performance, depression induces not only visible but also invisible organizational
problems at work. There are many empirical studies reporting significant relationships
between depression and job performance. This relationship is discussed in detail in the
next literature review section.

12
The reason why work and life might cause depression is stress. Brown and Harris
(1978) identify stress as the discrepancy between the demands of life situations and the
capacity of the individual or group to deal with them comfortably (Eaton, Anthony,
Mandel, & Garrison, 1990). Continuous exposure to stressors at work and stressful life
events are major triggers of clinical depression in susceptible individuals (National
Institute of Mental Health, 2001). Karasek (1979) found that job demands and job control
were the most significant work contents affecting depression in a nation-wide study. Job
demands and job control in Karasek’s study included most negative aspects of daily work
life. Job demands included workload, job complexity, job conflict, and job ambiguity,
role clarity, and interpersonal relationships at work. Job control was comprised of
decision making latitude, task variety, job autonomy, and work schedule (Karasek &
Theorell, 1990). Maciejewski, Prigerson, and Mazure (2000), using data from the
longitudinal ‘Americans’ Changing Lives Study,’ found that serious life events
significantly increased adults’ depressive symptoms. The stressful life events affecting
depressive symptoms consisted of the death of a child, death of a spouse, death of a
parent, death of a close friend or relative, divorce, move to a new residence, loss of job, a
serious financial problem, physical attack, and life-threatening illness or injury. These
stressful events both in work and life are major determinants of depression.
Two Work Stress Models Related to Social Support
There are two work stress models that have predominantly been applied to work
stress research: Karasek’s demand-control-support model (Karasek, 1979) and the
framework of occupational stress (House, 1981). These two models have greatly
contributed to predicting the relationship between work stress and social support.
The Demand-Control-Support Model (Karasek, 1979)
Karasek (1979) developed the job demands and control model from depression
data of 911 employees in the U.S. Department of Labor’s Quality of Employment Survey
(QES) in 1969, 1972, and 1977. He found that depressive symptoms had a specific

13
patterned distribution with the interaction effects between job demands and job control.
Findings of depression were the most prominent and basic empirical evidence of the job
demands and control model because the job demands and control model predicted
workers’ depressive symptoms better than other strains in the nationwide study.
The job demands and control model primarily deals with the work content as a
major source of stress. Karasek (1979) divided job content into two components in terms
of what I should do (job demands) and what I can do for the demands (job control) at
work (Theorell, 1998). He also conceptualized that the two constructs interacted each
other affecting workers’ mental and physical health. From the QES research, Karasek
recognized the beneficial role of social support on the interaction of job demands and job
control as well as on health outcomes. Karasek accepted that social interaction was
obviously a major component of health and behavioral reactions. He expanded the
original job demands and control model to the demand-control-support model including
social support as a third construct affecting health outcomes. Accordingly, the demand-
control-support model (Karasek, 1979) is the modified version of the job demands and
control model. It is clear that changes in social relations between workers and changes in
decision latitude are almost inseparable strategies when the job demands and control
model is applied to job redesign (Karasek & Theorell, 1990). This linkage has led House
(1981) to refer to “participatory work design processes” as a combination of job control
and social support changes, implying that social support at work can enlarge the latitude
of job control and beneficially affect psychological strain in the same direction as job
control.
Job demands are the demands that are required when carrying out a job. Job
demands are natural at work, but job demands become stressors if they exceed workers'

14
control over them. Karasek (1979) operationalizes job demands in the sense of
psychological stressors at work such as requirements for working fast and hard, heavy
workload, not having enough time, and having conflicting demands. The concept of job
control has been discussed in organizational research broadly in terms of participation in
decision-making and job design (Spector, 1986). Karasek (1979) defines job control as
the working individual’s potential control over his tasks and his conduct during the
working days. He regards job control as workers' latitude to control diverse job demands.
Karasek calls job control “decision latitude.”
The job demands and control model has a major hypothesis, which is that four
distinctly different kinds of psychological work experience are generated by the
interactions of job demands and job control. The four psychological work experiences are
high strain jobs (high demands and low control), low strain jobs (low demands and high
control), active jobs (high demands and high control), and passive jobs (low demands and
low control). The main hypothesis is that the lowest levels of psychological well-being
and the highest level of symptoms and diseases are to be found in the high strain group
(Kristensen, 1991). Karasek hypothesized that job demands were not in themselves
harmful, but when combined with low employee control, these demands could lead to the
development of psychological strain. Accordingly, active jobs raise just average level of
strain because much of the energy arisen by many stressors of the active jobs is translated
into action through effective problem solving, so there is little residual strain to cause
disturbance, and psychological strain from active jobs is similar to that from passive jobs
(Karasek & Theorell, 1990). Thus, Karasek implies that job control is a primary construct
in handling demands at work and stress outcomes.
In some ways, the job demands and control model was a narrowing and
specification of environmental demands and worker’s abilities in the person-environment
fit theory (Koslowsky, 1998). According to the person-environment fit theory (Edwards,
Caplan, & Harrison, 1998), stress arises from the misfit between the person and his or her

15
working environments. The discrepancies between workers and working environments
yield strains which affect workers’ health and organizational outcomes (Caplan, 1987;
Caplan & Harrison, 1993).
The demand-control-support model (Karasek, 1979) has another hypothesis to the
job demands and control model. The hypothesis is that active participation in social life is
related to low job strains. According to the extended model, the highest risk of strain is to
be expected in the “iso-strain” group with high demands, low control, and low social
support (Kristensen, 1991). In a national study using depression measures, high social
support was associated with dramatically lower levels of depression. There was a clear
demand-control association within each level of social support in the data. These three
dimensions of work content—job demands, control, and social support—were capable of
predicting much of the range of total variation of depressive symptoms in the
representative working population, from a 6 % to a 41 % likelihood (Karasek & Theorell,
1990).
The Framework of Occupational Stress (House, 1981)
The framework of occupational stress (House, 1981) structures comprehensive
path relationships dealing with work stressors, strains, enduring outcomes, and modifying
variables in a framework. Each path relationship within the framework has been
sufficiently confirmed by empirical research with few theoretical conflicts. The
framework of occupational stress has been examined and modified mainly by French,
Larocco, and House and, subsequently by Israel and other colleagues in the University of
Michigan (Baker, Israel, & Schurman, 1996; House, Wills, Landerman, McMichael, &
Kaplan, 1979; Israel, House, Schurman, Heaney, & Mero, 1989; Larocco, House, &
French, 1980). This model deals with most hypotheses of occupational stress concerning
the relationship between work stressors, strains, and health outcomes.

16
The framework of occupational stress is based on a core definition, that is, stress
is a process including the environmental sources of stress and the individual’s perception
of them as well as short-term and long-term physiological, psychological, and behavioral
responses, and a number of modifying factors that influence the relationships among
variables in the stress process (Israel, Schurman, & House, 1989). The framework of
occupational stress also has the assumption that stress arises from the misfit between the
person and the working environments and that work stressors are determined by
individuals’ perception (Edwards, Caplan, & Harrison, 1998) just as in the demand-
control-support model (Karasek, 1979). Thus, work stressors in House’s (1981) model
are not work stressors objectively estimated but work stressors subjectively perceived by
individual workers.
In the framework of occupational stress, work stressors induce strains through
perceived stress, which in turn affects short-term responses (strains) and negative
enduring outcomes. A number of modifying variables directly and indirectly affect the
process of work stressors, perceived stress, strain, and enduring outcomes. House focused
on the role of modifying variables to the occupational stress process. In particular, he
regarded social support at work as an important modifying variable affecting
occupational stress, which is consistent with the role of social support in Cohen’s (1988)
stress-buffering model.
Social support is a modifying variable affecting work stress. Figure 2.1 illustrates
how social support affects work stress. Social support can directly reduce perceived work
stressors, strains and negative enduring outcomes because social support meets important
needs for security, social contact, approval, belonging, and affection (Cohen &
Hoberman, 1983). These effects of social support are called main effects. Another effect
of social support is illustrated in the dotted lines in Figure 2.1. This effect is the potential
of social support to mitigate or buffer the impact of work stressors on strains and the

17
impact of strains on enduring outcomes. This effect is called an interaction effect. The
meaning of interaction is central in most of the major writing on social support, and some
authors have gone so far as to suggest that interaction is virtually a minor way in which
support affects enduring outcomes (Cohen & Wills, 1985; House, 1981).
Social support has greater beneficial effects on strain and enduring outcomes
among persons with high work stress. The beneficial interaction effects of social support
on strains and outcomes become increasingly apparent as work stress increases. In
contrast, the main effect of social support on enduring outcomes is not affected by levels
of support, indicating independent from the interaction effect. Thus, the need to
distinguish main versus interaction effects arises when considering how stress and social
support may combine to affect enduring outcomes (Cohen, 1988; House, 1981).
Figure 2.1. The Framework of Occupational Stress (Adapted from House, 1981)
Work stressors
Strains (Physiological, psychological, and behavioral)
Enduring outcomes (Physiological, psychological, and behavioral)
Modifying factors (Social, personal, and physiological)
Perceived stress

18
Summary
The demand-control-support model successfully points out key work contents
affecting the work stress process and describes the interaction between job demands and
job control affecting psychological and physical health outcomes. In this stress arousal
process, social support takes an important moderating role. However, the demand-
control-support model is too simple to explain comprehensive relationships between
work stressors, strains, and diverse outcomes including psychological, physical, and
organizational outcomes within a framework although this model clearly organizes the
relationship between the three job components and stress outcomes.
House’s (1981) framework of occupational stress successfully explains the entire
work stress process and the comprehensive effects of social support on the process.
However, there is a problem in applying the framework of occupational stress to
empirical research because this model was developed to show the general work stress
process for stress intervention studies. Accordingly, not all constructs within this model
are specific enough to be used directly. In particular, House’s model little specifies work
stressors and interaction between work stressors.
Relationships Between Job Demands, Job Control, Depression,
Job Performance, and Absenteeism
Perceived work stressors increase depressive symptoms and organizational loss.
Recent studies have reported that absenteeism and job performance are major
organizational outcomes related to depression (Kristensen, 1991; Marmot, 1994; Michie,
1996; Sheffield, Dobbie, & Carroll, 1994; Unden, 1996). Work stressors not only directly
affect depression, absenteeism, and job performance, but also indirectly affect
absenteeism and job performance through depression as a mediating variable. Goodwin
(1992) indicated that absenteeism was related to other enduring outcomes such as

19
physical and mental illnesses, accidents, and medical cost. He reported that 35% of
absenteeism resulted from stress-related illness.
Work stressors directly affect workers’ depressive symptoms. Kandel, Davies,
and Raveis (1985) examined the effect of role stress on depressive symptoms among 197
working women in New York. Occupational, household, marital, and parental roles were
measured. The occupational role was a significant stressor inducing depressive
symptoms. Depressive symptoms were more severe when the occupational role was
combined with the household role. How much workers control their job at work and at
home was a significant stress related factor influencing working women’s depression.
Cahill and Landsbergis (1996) examined job strain among 4,018 post office mail-
handlers in the US using the job demands and control model. They measured job
demands, job control, supervisor support, and psychological strain through a self-
administered questionnaire survey. Heavy job demands, low job control, and low
supervisor support were strongly related to psychological strain. Mausner-Dorsch and
Eaton (2000) studied the effects of psychological work environments on depression using
the job demands and control model among 905 full-time workers in the Baltimore area.
Psychological work environments (job demands and job control) were measured by
Karasek’s (1979) Job Content Questionnaire (JCQ) and depression data were collected by
the National Institute of Mental Health Diagnostic Interview Schedule (DIS). Low
decision authority was significantly related to a high number of depressive symptoms.
Heavy job demands tended to increase depressive symptoms; however, this relationship
was not significant.
A prominent organizational outcome related to work stressors and depression is
absenteeism. Brooke and Price (1989) developed a causal model determining work
absenteeism. Self-administered questionnaires were distributed to full-time employees
(n=425) of a medical center located in the upper Midwest twice, with a three-month
interval in between. The self-administered questionnaire consisted of various work

20
stressors, job satisfaction, health status, alcohol involvement, job involvement, and
absenteeism. The two items for absenteeism were absence days and reasons for absence
during the past three months. Psychosocial work climate was closely related to
absenteeism. High routinization, low work involvement, high centralization, high role
ambiguity, and low job satisfaction explained 22% of the variance of absenteeism.
Marmot (1994) reported the effect of working conditions on white-collar workers’ health
status in the Whitehall II study. The Whitehall II study was a longitudinal intervention
study to reduce incidence of cardiovascular disease through behavioral changes. This
study was conducted with 3,000 civil servants in England. Having long spells of absence
was associated with lack of control over work. The study showed that low job control at
work and financial problems out of work were important stressors inducing absenteeism.
Iverson, Olekalns, and Erwin (1998) conducted a cross-sectional study to 487 staff of a
public hospital in Australia to establish the relationship between work stressors, burnout,
affectivity, and organizational outcomes based on a causal model. Organizational
outcomes consisted of job satisfaction and absenteeism. Absenteeism was measured by
the frequency of absences during a period of six months and was collected from
respondents’ personnel records. Path analysis showed that task demands (autonomy and
workload) significantly affected absenteeism. That is, low autonomy and heavy workload
were related to high absenteeism.
Dwyer and Ganster (1991) conducted a survey of 90 manufacturing employees of
a large Midwestern company to examine the effects of job demands and job control on
employee withdrawal. Employee withdrawal was estimated by absenteeism and tardiness
for one year. Absenteeism was measured by the number of days each employee was
absent from work, which was compiled from company records. Job demands and job
control were significant factors affecting sick days. Effects of heavy workload and low
work control explained 20% of the absenteeism variance in the study. Another study
examined the effects of job demands and work control on sickness absence among

21
Danish slaughterhouse workers (Kristensen, 1991). A total of 4,828 workers employed in
147 companies participated in the self-administered survey. The questionnaire included
job demands, job control, psycho-somatic symptoms, and absenteeism. Absenteeism was
measured by inquiring about sickness absence days over the previous 12 months. The
study reported that high job demands and low job control were related to increased
absenteeism. Monotonous work and heavy workload were significant work stressors
related to a large number of absence days.
In addition to absenteeism, job performance is another major organizational
outcome related to work stressors and depression. Grunberg, Anderson-Connolly, and
Greenberg (2000) examined how conducting layoffs and other work factors affected
organizational commitment and job performance item in a study with 2,279 employees in
a large manufacturing company. They compared individual job performance with sick
leave hours and work effort. Company records provided sick leave hours for the last 30
months. Bad health status was the primary indicator of sick hours. Layoff contact was
closely related to sick leave. This study indicated that work content and job security
affected absenteeism. Job challenge and skill discretion were significant factors affecting
work effort. Stewart and Barling (1996) examined whether work stressors and depressive
mood affected interpersonal job performance of 71 physicians, nurses, and technicians
participated in the study. Interpersonal job performance was measured by a performance
questionnaire consisting of 20 items. Work stressors were measured by four factors:
overload, role conflict, role ambiguity, and social support. Role conflict was a significant
work stressor related to depressive mood. High mean score of four stressors and high
depression score were significantly related to a low score of interpersonal performance.
Parker and Kulik (1995) examined the effects of social support at work on
burnout and organizational outcomes. Seventy three full-time nurses in the San Diego
Veterans Affairs Medical Center participated in the survey. The questionnaire included
items on job stress factors, social support at work, burnout, job performance, and

22
absenteeism. Absenteeism was measured by a question asking about the number of
absent days during the past six months. Job performance was measured by self-rated
performance and supervisor-rated performance. Absenteeism was significantly related to
low work support and high job stress factor scores. Emotional exhaustion was associated
with job performance. High absenteeism due to mental health reasons was associated
with high job burnout, low job performance, and high intention to quit. Behrman and
Perreault (1984) conducted a mail survey of 196 industrial salesmen to examine work
factors affecting job performance. Job performance was measured by 31 performance
items. Work stressors were measured by role conflict, role ambiguity, working hours,
locus of control, and communication at work. Role ambiguity, role conflict, and working
hours explained 25% of the variance of job performance. Job demands and the level of
work control were important factors influencing salesmen’s performance. Work stressors
and depressive symptoms significantly decreased job performance.
Work stressors mediated by depression also indirectly affect absenteeism and job
performance. Unden (1996) reported that sickness absenteeism was related to some
functions of support at work. He conducted a survey of 133 civil servants performing
office work in Sweden. The questionnaire included physical and mental health status,
social support at work, job demands, and job control. Absenteeism was measured by
means of a question asking if the employee had ever been absent from work during the
last 12 months due to sickness. Causes of sickness absenteeism were described in two
ways. One cause of sickness absenteeism started from low social support at work. The
other cause was from work strain and quality of life. The latter cause, in particular,
explained that insufficient rest time (heavy workload) was perceived as a serious work
stressor and increased sickness absenteeism. Sheffield, Dobbie, and Carroll (1994)
administered a survey to 88 secondary school teachers to evaluate the relationship
between stress and social support. Main variables were job demands, job control,
perceived social support and satisfaction with support, psychological well-being, and

23
sickness absence. The authors reported that job responsibility and workload, among the
perceived work stressors, were significantly related to short-term absenteeism and long-
term absenteeism was related to health status. Psychological stress symptoms mediated
the relationship between workload and absenteeism.
Michie (1996) conducted a stress counseling intervention study with 92 hospital
staff in London, England. The intervention was designed to identify causes of work stress
and to increase workers’ coping skills. Workers’ problems treated in the counseling
intervention were work stressors (workload and perceived control), depression, and
relationship problems at work. A self-administered survey was conducted at three times:
before the intervention, right after the intervention, and 6-month follow-up. All variables
were included in the survey questionnaire except absence data. Absence data from six
months prior to the intervention were collected from hospital computer records. After the
intervention, both depression and absenteeism significantly decreased. The stress
intervention program had a beneficial effect in decreasing absenteeism and showed that
job demands and job control were key work factors affecting depression and absenteeism.
Abramis (1994) interviewed 281 workers living in the greater Detroit area to
identify a clear relationship between work stressors and job performance. Role ambiguity,
role conflict, and job insecurity were measured for work stressors. Strains were measured
by job dissatisfaction, anxiety, anger, and depression by the Hopkins Symptoms
Checklist. Job performance was measured by technical performance, social performance,
absenteeism, and tardiness. Depressive symptoms were significantly related to role
conflict, and absenteeism was related to role conflict, job insecurity, anxiety, and
depression. Technical performance was significantly associated with role conflict,
depression, and anger. This study showed not only that work stressors were directly
related to depressive symptoms and job performance but also that depression mediated
the relationship between work stressors and job performance.

24
Summary
A large amount of literature supported that depression was induced by stressors at
work, and was closely related to organizational loss in terms of absenteeism and job
performance. Job demands and job control are significant work characteristics increasing
depression and absenteeism. These two work factors directly and indirectly affect
workers’ depressive symptoms, absenteeism, and job performance.
Two mechanisms explain the association between work stressors, depressive
symptoms, absenteeism, and job performance. One mechanism concerns stress-inducing
illness (Kristensen, 1991; Marmot, 1994; Sheffield, Dobbie, & Carroll, 1994; Unden,
1996). Some work stressors stimulate psychological outcomes, in particular, depression.
Depression weakens employees’ general health status resulting in organizational loss
such as increased absenteeism and reduced job performance (Michie, 1996). The other
mechanism of stress and organizational loss concerns stress coping: workers perceive
some depressive symptoms as temporary psychological responses to stressors (Brook &
Price, 1989; Dwyer & Ganster, 1991; Iverson, Olekalns, & Erwin, 1998; Schechter,
Green, Olsen, Kruse, & Cargo, 1997). After that, they temporarily withdraw from their
work by absence. They also make less effort on their job due to low motivation (Unden,
1996). Depression-induced unstable supply of labor to the organization results in the
disruption of scheduled work processes and the loss of productivity (Brooke & Price,
1989).
Effects of Social Support at Work on Job Demands, Job Control, Depression,
Job Performance, and Absenteeism
Social support at work has two effects on the work stress framework including
work stressors, depression, job performance, and absenteeism: main effects and
interaction effects (Cohen & Wills, 1985; House, 1981). A large amount of work stress
research reported the two effects of social support on work stress.
25
Main Effects of Social Support at Work
The main effects of social support at work on work stressors, depression, job
performance, and absenteeism have been well documented. Social support at work is
significantly related to low work stressors, low depression, high job performance, and
low absenteeism.
Social support at work, primarily, has main effects on work stressors and
psychological outcomes throughout the literature. Significant work stressors are job
demands and job control and depression is the most frequently mentioned psychological
outcome related to social support. Sheffield, Dobbie and Carroll (1994) evaluated the
relationship between work stress, social support at work, and general well-being among
88 secondary school teachers in Scotland. The cross-sectional study used a self-
administered survey. Perceived work stressors, anxiety, somatic symptoms, sickness
absence, and social support at work were included in the survey questionnaire. Social
support at work was measured by two seven-item indices on availability and satisfaction
of general social support from coworkers and supervisors. Perceived work stressors were
measured by 15 items of job responsibility and workload. Social support at work had
significant main effects on job responsibility and workload. Social support at work also
had positive effects on somatic symptoms and absenteeism.
Dean and Ensel (1982) examined the relationship between social support, life
stress, and depression among 871 representative samples of adults in New York State.
Social support was measured by support functions and social ties. The more the social
support the lower the depressive symptoms. This showed that social support had a direct
effect on depression. Landsbergis (1988) conducted a mailing survey to identify the

26
effects of job demands, job control, and social support at work on depression based on
the demand-control-support model. The respondents were 771 clerical employees in two
hospitals and one nursing home in New Jersey. Job demands, job control, social support
at work, and depression were measured by the Job Content Questionnaire. Job demands,
job control, and social support at work had direct effects on depression. Heavy workload,
low job control, and low social support at work were related to severe depressive
symptoms.
To examine the relationships between work strain, social support at work, and
psychological distress, Vermeulen and Mustard (2000) conducted a survey of 7,484
employees in a Canadian national survey. Based on the demand-control-support model
(Karasek & Theorell, 1990), psychological demands and work control were employed as
work factors inducing psychological distress. Social support at work was a moderator
buffering psychological distress. Social support at work was measured by four items of
global perceived support from coworkers and supervisors. Social support at work had
greater effects on reducing psychological distress in women than in men. Low support at
work had clear main effects on psychological distress for both men and women. The iso-
strain condition with high job demands, low control, and low social support was
associated with high psychological distress.
Kline and Snow (1994) conducted a stress prevention program for 115 working
mothers in Connecticut. This program was designed to encourage workers to practice
adaptive stress coping strategies and to apply problem-solving techniques through
effective social support networks at work. Self-administered questionnaires were
distributed to participants three times: before the intervention, at the end of the
intervention, and 6 months after the intervention. Global functional support from both
work (coworker and supervisor) and non-work sources (spouse/partner, friend, and
relatives) was measured. Six months after the intervention, social support from work
sources was significantly related to decreased perceived role stressors and depressive

27
symptoms. This finding showed that there were significant main effects of social support
at work on employee role stress and depression. The intervention encouraged workers to
help each other to solve problems. As social support at work improved, depression
decreased. Bromet, Dew, Parkinson and Schulberg (1988) studied whether social support
had negative effects on work stressors and psychological strain among 325 non-
managerial employees of two nuclear power plants and two fossil-fuel plants in
Pennsylvania. A self-administered questionnaire was employed in the survey. Perceived
support from work (coworkers) and perceived support out of work (friends) were
assessed. Work stressors were measured by job demands and job control, and
psychological strain was major depression and behavioral strain (alcohol problems). High
job demands was significantly related to high depression. Coworker support was related
to a low level of work stressors and low depression although it was not statistically
significant.
Israel, Schurman, and House (1989) recognized that organizational support was
powerful in reducing work stressors, psychological strain, and health outcomes. They
conducted an intervention study to reduce work stress in which the intervention was
based on problem-solving methods through improved interrelationships and active
participation at work. The subjects were 630 workers in a manufacturing plant of a major
corporation located in a medium-sized urban area in Michigan. The survey questionnaire
consisted of interpersonal relationships at work (coworker support, supervisor support,
and negative relationships at work), 16 items of work stressors, perceived control
(participation and influence), coping methods, job satisfaction, negative feelings of work,
and depression. Interpersonal relationships at work had significant main effects on work
stressors and psychological strains. Social relationships at work had clear main effects on
work stressors and depression. The interpersonal relationships explained 16% of the
variance of work stressors. Depression was significantly associated with low perceived
control, poor interpersonal relationships, and high perceived work stressors.

28
Grosch and Murphy (1998) examined occupational differences in depression and
global health with the National Medical Expenditure Survey data. The study was
conducted by both self-administered questionnaire and interviews. Items of global health,
depression, and health habits were included in the questionnaire. The participants of the
survey were 9,218 American adult workers. Sharing feelings with others were the best
predictor of depression, showing that emotional support at work was significantly related
to reduced depressive symptoms. Depression exhibited .43 correlation with global health.
Firth-Cozens (1998) also reported organizational predictors of depression in 131 general
practitioners. The relationship with senior doctors was the most stressful work factor for
general practitioners. Conflict of career with personal life (r= .40) and home-work
interface (r= .42) were strongly correlated with depression. The results implied that social
network at work and controllability of work and life were meaningful work factors
affecting workers' depression.
Recent studies examined organizational outcomes affected by work stress and
also identified the extended effects of social support at work on organizational outcomes
not limited on mental health outcomes. Beehr, Jex, Stacy, and Murray (2000) examined
effects of work stressors and social support on psychological strain and job performance
among 198 door-to-door salesmen. Job performance was measured by total units sold and
demonstrations (the number of home presentations of the product). Psychological strain
was measured by depression. Social support at work was measured by coworker support
(Caplan, Cobb, French, Harrison & Pinneau, 1975). Global functional support from
coworkers, positive communication with coworkers, and negative communication with
coworkers explained 29% of depression variance. Support from coworkers was
significantly related to both job performance measures: units sold and demonstrations.
Schaubroeck and Fink (1998) examined the effects of job control and social support on
physical well-being and organizational outcomes: physical symptoms, absenteeism, and
job performance. They conducted a self-administered questionnaire survey in two offices

29
of a large insurance company. A total of 214 employees successfully completed the
survey. Job performance and absenteeism were measured by supervisors. Social support
was measured by supervisor and coworker support. High job control was significantly
related to high overall job performance, but job control was not significantly related to
absenteeism. The relationship between organizational outcomes and physical well-being
were not examined. Nelson and Quick (1991) conducted a mail survey of 91
professional-level employees in a large university, an oil field service company, and an
electronics manufacturer. Nelson and Quick examined whether social support at work
affected newcomers’ job satisfaction, job performance, and psychological stress. Social
support was measured by the availability and helpfulness of resources at work (from
supervisor and coworker). Work stressors were measured by job demands, role conflict,
workload, and career progress. Outcome measures were psychological distress, job
satisfaction, and supervisor-rated performance. High availability of coworker and
supervisor support, active interaction with coworker, and frequently interaction with
other newcomers were significantly related to high job performance. High supervisor
support and frequent interaction with other newcomers were also significantly associated
with low psychological strain. Job satisfaction was negatively related to psychological
strain.
Interaction Effects of Social Support at Work
Interaction effects of social support on work stress have been less documented
than the main effects. Theoretically, social support at work reduces or buffers the
negative influence of work stressors on depression, job performance, and absenteeism.
Although interaction effects are not consistent and weak, research on social support at
work still reports the evidence of the interaction effects of social support at work.
LaRocco, House, and French (1980) analyzed data from 6,360 male workers of 23
occupational groups in a number of different organizations. Four functional supports and
three sources of support (supervisor, coworkers, and wife/family/friend) were measured.
30
Dependent variables included perceived stress (job satisfaction) and health-related
outcomes (somatic complaints, depression, and anxiety). Regression analyses indicated
that support from wife, coworkers, and supervisor significantly buffered the effects of
work stressors on depressive symptoms. Coworker support had a significant interaction
effect on the relationship between role conflict and job satisfaction as well as the
relationship between role conflict and depression. Coworker and supervisor support
buffered the negative effect of heavy workload on psychological stress symptoms (the
combination of depression, anxiety, and irritation). The results showed work-related
sources of support to be more important for depression than family support.
Stansfeld, Bosma, Hemingway, & Marmot (1998) conducted three surveys of
9,302 civil servants in 20 London-based branches during a five-year period. They used
the demand-control-support model, and the survey included job demands, decision
latitude, and social support at work. Social support measures included emotional support,
practical support, negative aspects of close relationships, and networks of social support.
Social support at work had a significant interaction effect with perceived work control on
quality of life. The three-way interaction of low decision latitude, high job demands, and
low social support at work was significantly related to psychological disorders and
absenteeism. Unden (1996) examined whether health status and social support affected
absenteeism of 133 civil servants performing office work in Sweden. The survey
questionnaire included social support at work and out of work, job demands, decision
latitude, perceived health status, and psychosomatic symptoms. Social support was
significantly associated with high psychosomatic symptoms, poor perceived health, and
high absenteeism. Low belonging support, low instrumental support, and low social
integration had a negative relationship with high job demands and low decision latitude.
There was an interaction effect of job demands and perceived control on depressive
symptoms. Results of the multivariate analysis showed .25 correlation between work
stressors and depressive symptoms, and .32 correlation between depressive symptoms

31
and quality of life. Johnson, Thomas, and Riordan (1994) conducted a case-control study
with 211 fishermen as the cases and 99 land-based workers as the control cases
comparing their work stressors and stress symptoms. The study assumed that lack of
social ties affected work stress, and that fishermen were a group lacking social ties. The
self-administered survey consisted of depression, somatic symptoms, ten work stressors
including carrier stress, overload, control, hazards, and conflict. Social support was
measured by 15 items of perceived quality of social relationships. The relationships were
with friends, relatives, wife, supervisors, and coworkers. They found that fishermen had
greater work stressors, depression, and somatic symptoms than land-based workers. This
indicated that social ties were directly related to work stressors and depression. Under
low support conditions, work stressors were more closely related to depression than
under high support conditions, which means that there was the interaction effect of social
support on the relationship between work stressors and depression.
Iverson, Olekalns, and Erwin (1998) examined the relationship between work
stressors, burnout, and absenteeism. A self-administered survey was conducted of 487
staff of a public hospital in Australia. Based on the demand-control-support model, job
demands and job control were considered major work stressors, and social support was
measured by supervisor support, coworker support, and peer support. High supervisor
support and high coworker support had beneficial effects in reducing absenteeism. In
their own model, social support at work and task demands had indirect effects on
absenteeism as mediated by psychological strain: depressive symptoms, emotional
exhaustion, and depersonalization. Bromet, Dew, Parkinson and Schulberg (1988)
conducted a cross-sectional study for 325 non-managerial employees of two nuclear
power plants and two fossil-fuel plants in Pennsylvania. There were significant
interaction effects of social support on job demands, perceived control, and psycho-
behavioral strains (depression and alcohol problems). Coworker support had a clear
interaction effect on the relationship between job demands and depression.

32
Mausner-Dorsch and Eaton (2000) studied psychological work environment and
depression. The subjects were 905 full-time workers in the Baltimore area and the data
were collected by individual interviews. Job control was the best predictor of depression
and the interaction of high psychological job demands and low control were related to
high depressive symptoms. Calnan, Wainwright, Forsyth, Wall, and Almond (2001)
examined mental distress of workers in 81 hospitals in southern England. They used the
demand-control-support model to find the relationship between work stressors and
depressive symptoms. The interaction of high job demands, low job control, and low
social support was significantly related to high depressive symptoms. In the study, under
high support conditions, the interaction effect between job demands and job control on
mental distress was clearer than in low support situations.
Schaubroeck and Fink (1998) examined the effects of job control and social
support on organizational outcomes: absenteeism, physical symptoms, and job
performance, based on the demand-control-support model. A total of 214 employees
completed the survey in two offices of a large insurance company. Job performance and
absenteeism were rated by supervisors. Social support was measured by supervisor and
coworker support. Supervisor support had a significant interaction effect with low job
control on low job performance. Supervisor support, job control, and skill
underutilization had a three-way interaction on job performance. That is, high supervisor
support mitigated the effect of low job control and under-skillfulness on low job
performance. High coworker support also had an interaction effect with low job control
and heavy workload on low job performance.
Summary
It has been well documented that social support at work has beneficial main
effects on low perceived work stressors, low depression, high job performance, low
absenteeism. Job demands and perceived control are significant work factors affecting

33
depressive symptoms. The studies support that supervisor support and coworker support
are associated with low depression, high job performance, and low absenteeism.
The interaction effect of social support were also supported by the literature even
if the effects seemed to be less clear and the effect was lower than the main effect.
Overall, a large portion of social support studies examined and reported main effects
only, and the significance of the interaction effect on work stressors and their outcomes
was marginal or lower than main effects. Dwyer and Ganster (1991) mentioned that
because of the low interaction effects of social support on the stress process, many
studies less focused on the interaction effects of social support on the work stress process,
although their original purposes were to examine the interaction effect of social support
on the stress process.
From a statistical perspective, the statistical power for interaction effects
decreases because product terms are involved in the interaction effects than in the main
effects (Cohen & Cohen, 1983). Thus, larger sample size and more careful consideration
of other confounding effects should be provided to properly detect the interaction effect
of social support at work on the stress process.
The Work Stress Framework of this Study
Based on the strengths and weaknesses of those two representative work stress
models, and on empirical research on work stress, this study established a work stress
framework describing the comprehensive effects of social support on the relationship
between work stressors, psychological outcomes and organizational outcomes: job
demands, job control, depression, absenteeism, and job performance. The general path
structure of work stress process was employed from the framework of occupational stress
(House, 1981). To clarify stressful work factors in the framework of occupational stress,
this study employed job demands and job control as major stressors from the demand-
control-support model (Karasek, 1979). This study also focused on organizational
outcomes in relation to work stressors and depression. Recent empirical studies raised

34
two issues related to psychological and organizational outcomes of work stress. One was
that work stressors affected organizational outcomes as well as psychological outcomes.
The other suggested that there were also substantial relationships between these two
outcomes. Short-term responses of work stressors were omitted from this study because
empirical research using the two work stress models sufficiently supported the direct
relationship between work stressors and their outcomes (Figure 2.2).
Figure 2.2. The work stress framework of this study
Main and interaction effects were considered at the same time. Social support at
work was operationalized to identify what characteristics of social support affect the
work stress framework, specifically which function and source of support. In other words,
the question was about what functions of support among emotion, material, information,
and appraisal were more effective and what sources of support among organization,
supervisor, and coworker were more effective on the work stress framework. The
Social support at work By source: Organization, supervisor, and coworker By function: Emotion, information, material, and appraisal
Job demands
Job control
Depression
Job performance
Absenteeism

35
findings of the present study would help to build better stress prevention programs using
social support at work.

36
CHAPTER 3
METHODS
In this chapter, the purpose of the study is followed by explanation of the methods
used to conduct the research. The discussion of methodology includes a description of
study participants, study design, research questions and hypotheses, data collection,
measures, and data management and statistical analyses.
Purpose of the Study
The main purpose of the study was to identify the effects of social support at work
on job demands, job control, depression, job performance, and absenteeism. Specifically,
this study (1) examined how social support at work affects job demands, job control,
depression, job performance, and absenteeism, and (2) identified the characteristics of
social support at work that affect perceived job demands, job control, depression, job
performance, and absenteeism.
Study Participants
This study was conducted in collaboration with a non-profit organization, the
Georgia Regional Hospital in Atlanta, Georgia. All 863 employees in September 2001
were eligible to participate in the study. Initially, 267 employees completed the survey
and the response rate was 30.9%. Among the 267 cases, 240 cases were used in analyses
because 27 cases were discarded due to problematic missing and patterned responses.
Because this sample size did not reach the desired number of respondents (340) for
statistical analyses, a missing data imputation technique was employed to efficiently save
more data in statistical analyses.

37
The Georgia Regional Hospital provides general medical services for low-income
individuals and their families, and also houses juvenile vagrants who have health
problems. The hospital consists of 20 buildings including a children’s unit, a central unit
for adult’s health, a mental health unit, a dental health unit, and a forensics unit.
Study Design
This study used a cross-sectional design. A self-administered survey was
conducted among employees in the Georgia Regional Hospital, which satisfied the
following requirements to avoid some crucial threats to validity: 1) all full-time and part-
time employees at the time of the survey were eligible to participate in the survey, and 2)
the hospital had not worked with other organizational research projects since 2000.
It was important that the survey be offered to all employees in this study and
administered to as many willing participants as possible in order to decrease the selection
bias of the study findings. Recent participation in other organizational intervention or
surveys could have threatened the reliability of the survey results, particularly if other
studies about organizational climate, job design, social support at work, or psychological
status had been conducted or were ongoing. Fortunately, there was no involvement of
employees in other organizational attitude-related studies in recent years. The
Institutional Review Board of the University of Georgia (IRB) approved this study
protocol on August 27, 2001, granting it a project number of H2001-10601-0.
Research Questions and Hypotheses
Research questions and hypotheses are as follows.
Q1: How does social support at work affect job demands, job control, depression, job
performance, and absenteeism?
H1: Social support at work directly affects job demands, job control, depression,
job performance, and absenteeism (main effects).
H2: Social support at work buffers the path between job demands, job control,
depression, job performance, and absenteeism (interaction effects).

38
Q2: What characteristics of social support at work are closely related to job demands, job
control, depression, job performance, and absenteeism?
H3: Effects of support at work on job demands, job control, depression,
performance, and absenteeism are different by source of support.
H4: Effects of social support at work on job demands, job control, depression, job
performance, and absenteeism are different by function of support.
Data Collection Procedures
Data collection was conducted by means of a self-administered survey (See
Appendix A) distributed to all employees through the pay slip delivery system. In this
hospital, pay slips are distributed to employees on the 15th and 30th of every month. The
survey began on September 14 and data collection was completed on October 2, 2001.
On September 14, 2001, 863 questionnaires and envelopes with pay slips were
delivered to program assistants in all buildings who distributed the survey to all
employees working in their buildings. Ten survey return boxes were located in the main
lobbies of the ten buildings: children’s building, central building, administration building,
developmental and learning center, forensics I building, forensics II building, skilled
nursing building, cafeteria, housekeeping, and engineering and maintenance building.
The first page of the survey explained the purpose of the survey, confidentiality
assurances, and the voluntary nature of invited participation in the survey, as well as the
participation procedure and the location of survey boxes to which the surveys should be
returned.
To encourage employees to participate in the survey, a letter of endorsement from
the Chief Executive Officer asking employees to participate was attached to the front of
the survey. A memo encouraging survey participation was also delivered to supervisors
of all units on the first day of the survey. No incentives were used in the survey. The
hospital-wide voice intercom system was used for the follow-up of the data collection.
The follow-up reminder and announcement were started after three business days from

39
the first day of the survey, lasting for eight business days. The survey announcement was
made twice a day during the first four days to reach all employees on different shifts, and
was made once a day during the last four days. The announcement encouraged of survey
participation, and indicated the absolute confidentiality of the survey, the survey
collection period, and the location of the survey boxes. The survey boxes were emptied
three times during the data collection period: September 19, September 25, and October 2,
2001. Each time, the survey investigator accompanied a staff of the Human Resource
Department and emptied the boxes in front of the staff member to ensure the security of
the survey. The number of surveys collected was 152, 85, and 30, respectively. Table 3.1
shows a timeline describing the overall flow of the survey distribution, follow-up
announcements, and survey collection.
Table 3.1
The time-line of the survey collection
Day / Date Follow-up (frequency) Survey collection
9
10
14 15 16 17 18 19 20 21 22 23 24 25 26 27 28 29 30 1 2
/Mon
/Mon
/Mon
Survey starts
Survey ends
By memo (1)
By intercom (2) By intercom (2)
By intercom (2) By intercom (2) By intercom (1) By intercom (1) By intercom (1) By intercom (1)
The 1st collection
The 2nd collection
The 3rd collection

40
Measures
The survey questionnaire was organized to examine six main constructs: social
support at work, job demands, job control, depression, job performance, and absenteeism.
Table 3.2 shows the main variables of the study, number of items, and sources of
measures. All variables were estimated by self-administered questionnaires (Appendix
A).
Table 3.2
Description of measures
Variables Contents No Sources of scales
Social support at Work
Organizational support Supervisor support Coworker support
9 7 7
Eisenberger et al. (1997) Heaney (1991) Heaney (1991)
Work stressor
Job demands (workload, work-pace, job complexity, job conflict, and interpersonal relationships at work) Job control (decision making latitude, task variety, work schedule, job autonomy)
9
22
Karasek et al. (1998) Dwyer & Ganster (1991)
Stressor Non-
work stressor
Stressful life events out of work
7
Maciejewski et al. (2000) Tausig (1982)
Depression Depressive symptoms (CES-D) 12 Santor & Coyne (1997)
Job performance Self-rated performance, supervisor-rated performance Wilson, et al. (2002)
Absenteeism
Number of absent days during the past three months
1
Sheffield et al. (1994)
Demographics
Age, gender, marital status, duration of the present work, job title, and job status
6
Wilson et al. (2002)
Total 82

41
Social support at work was measured by three sources of support: organizational
support, supervisor support, and coworker support. Items for each source of support
concern four functions of support: material, emotion, information, appraisal, and
undermining. To estimate the clear effect of work stressors on outcomes, stressors
including both work stressors and non-work stressors were measured. Work stressors
were mainly used in the analyses and consisted of two job characteristics: job demands
and job control. Non-work stressors were measured with nine stressful life events, and
the effects of non-work stressors were controlled in the analyses to exactly estimate the
effects of work stressors on depression. Depression was measured as a representative
psychological strain with self-reported depressive symptoms. Absenteeism was measured
by self-reported absent days. Job performance was measured by self-rated performance
and supervisor-rated performance.
Social Support at Work
Social support at work was measured by source and function of support. Sources
of support consisted of organizational support, supervisor support, and coworker support.
Each source of support consists of five functions of support in the survey.
Organizational Support.
Organizational support was measured by perceived support from the organization
using a nine-item scale. The original scale with 22 items was developed by Eisenberger,
Cummings, Armeli, and Lynch (1997) and was revised by Wilson, DeJoy, Vandenberg,
Richardson, and McGrath (2002). The nine items were scored in a five-point Likert scale
from 1 ‘strongly disagree’ to 5 ‘strongly agree.’ The greater the score reflected the
greater amount of perceived organizational support. Eisenberger, Cummings, Armeli, and
Lynch reported that the internal consistency of the scores of the scale was .90. Armeli,
Eisenberger, Fasolo, and Lynch (1998) reported an internal consistency of .75 for the
scores of the scale. Wilson, DeJoy, Vandenberg, Richardson, and McGrath refined the
measurement structure of this scale using confirmatory factor analysis. They reported a

42
value of 0.92 internal consistency for the scores of the refined scale. The scale of
organizational support was not clearly divided by specific functions of support, but was
developed based on perceived functional support at work.
Supervisor and Coworker Support.
Scales for supervisor support and coworker support were employed from
Heaney’s (1991) items of social support at work. The supervisor support and coworker
support scales consisted of seven items each. Items of supervisor and coworker support
consisted of five functional support items: material support, emotional support,
informational support, appraisal support (praise and feedback), and undermining as a
negative support. All fourteen items of supervisor support and coworker support were
scored in the five-point Likert scale from designated 1 as ‘not at all’ to 5 as ‘a great deal.’
Generally speaking, the greater the score the higher the social support from the supervisor
and coworker.
Heaney (1991) reported .89 internal consistency for the scores of the supervisor
support items and .87 internal consistency for the scores of the coworker support items.
Heaney and colleagues (1993) reported a value of .76 for internal consistency for the
scores of the supervisor support items.
Stressors
Scales of stressors consisted of work stressors and non-work stressors. Work
stressors were measured by perceived job demands and job control. Non-work stressors
were measured by seven items representing stressful life events. The effects of non-work
stressors were controlled in a statistical analysis to discriminate accurate effects of work
stressors from non-work stressors on depression, job performance, and absenteeism.
Work Stressors.
Work stressors were measured by job control and job demands. Karasek (1979)
operationalized job demands in the sense of psychological stressors at work such as
requirements for working fast and hard, heavy workload, not having enough time, and

43
having conflicting demands. He modified the conception of job demands to include job
complexity and interpersonal relations at work (Karasek et al., 1998). Dwyer and Ganster
(1991) pointed that the workload, job complexity, job conflict, and job ambiguity
involved in carrying out a job as the main components conceptualizing job demands. The
main components comprising job demands of this study were workload, time-pressure,
job complexity, job conflict, and interpersonal relationships.
Job demands was measured by the psychological demands scale revised by
Karasek and colleagues (1998). They added four items to the original five items of job
demands, and verified the reliability and validity of the revised scale. The refined scale
included workload, time-pressure, job complexity, job conflict, and interpersonal
relationships at work. Internal consistency of the scores of the nine items was .72 in the
male population and .71 in the female population (Karasek et al., 1998). All nine job
demands items were scored by a five-point Likert scale designated from 1 as ‘rarely’ to 5
as ‘very often.’ The greater the mean score, the heavier the perceived job demands were
expected to be.
The concept of job control was discussed in organizational research in terms of
participation in decision-making and job design (Spector, 1986). Karasek (1979) defined
job control as the working individual’s potential control over his tasks and his conduct
during the working days. He indicated that job control was conceptualized by two
components: a worker’s authority to make decisions on his job and the variety of skills
that the worker used on the job. Ganster (1989) defined control as the ability to exert
some influence over one’s environment so that the environment became more rewarding
or less threatening. He mentioned that participation in decision-making and job autonomy
was the main components conceptualizing job control. From Karasek and Ganster’s
perspectives, the main components of job control of this study were decision-making
latitude, task variety, work schedule, and job autonomy.

44
Job control was estimated by Dwyer and Ganster’s (1991) scale in this study. The
job control scale has been confirmed in many organizational studies (Kristensen, 1991;
Schecheter, Green, Olsen, Kruse, & Cargo, 1997; Schaubroeck & Merritt, 1997). The job
control scale was similar to the ‘decision latitude’ scale of Karasek’s (1979) Job Content
Questionnaire (JCQ). Schaubroeck and Merritt (1995) discussed that job demands items
of JCQ problematically overlapped with job complexity. Spector (1986) also reported
that Karasek’s decision latitude scale seemed to create colinearity problems with job
satisfaction scales. The job control scale by Dwyer and Ganster consisted of decision
making latitude, task variety, work schedule, and job autonomy. Dwyer and Ganster
reported .87 internal consistency for the scores of the scale. Schaubroeck and Merritt
reported .83 internal consistency value for the scores of the job control scale. All twenty-
two items of job control were scored by a five-point Likert scale designated from 1 as
‘not at all’ to 5 as ‘a great deal.’ The greater the mean score the more controllable the job
is believed to be.
Non-work Stressors.
Non-work stressors were assessed to control for the effects of non-work stressors
on depression and to keep only the effects of work stressors on depression. Non-work
stressors were measured by major seven stressful life events items selected from the
scales used in two large studies (Maciejewski, Prigerson, & Mazure, 2000; Tausig, 1982).
Maciejewski, Prigerson, and Mazure conducted Americans’ Changing Lives study (ACL)
to predict the onset of depression by stressful life events. Ten events were found to be
related to depression: death of a child, death of a spouse, death of a partner, death of a
close friend or relative, divorce, move to a new residence, loss of job, a serious financial
problem, physical attack, and life-threatening illness or injury. Tausig used the Recent
Life Changes Questionnaire (RLCQ) consisting of 118 items to predict depression of
1,091 adult residents in New York. He categorized six significant life events related to
high CES-D scores: home, love, family, health, work, and legal problems.

45
From the significant life events in identified by Maciejewski, Prigerson, and
Mazure (2000) study and Tausig’s (1982) study, seven life events were selected for this
study. The seven stressful life events were perceived stress from spouse or partner
(conflict, disease, death, and so on), family (conflict, disease, death, and so on with a
parent, child, or relatives), friends (conflict, disease, death, and so on), financial problems,
health problems, legal problems, and traumatic experiences (robbery, mugging, physical
attack, threat, and so on) during the last six months. The seven stressful life events were
scored by a five-point Likert scale from 1 designated as ‘not at all’ to 5 designated as ‘a
great deal.’
Depression
Depression in this study refers to depressive symptoms as a psychological strain
induced by stressors. Depressive symptoms were measured with a short version of the
Center for Epidemiologic Studies for Depression (CES-D) scale (Santor & Coyne, 1997).
The CES-D scale was developed to identify the epidemiology of depressive
symptomatology in the general population. Internal reliability of the scores of the original
20 CES-D items in the general population was .85 and even higher in patient population
(= .90) (Radloff, 1977). Radloff reported that CES-D items had acceptable test-retest
stability (r= .55) and excellent concurrent validity by clinical and self-report criteria.
Santor and Coyne (1997) indicated that CES-D was less sensitive to healthy
people than to patients or the elderly. They identified twelve effective items from the
original items in the Michigan depression project with 1,928 primary care patients by
comparing scores of CES-D with the clinical criteria. The twelve items correlated .93
with the original CES-D items. Sensitivity and specificity of the revised items were
greater than those of the original items. Internal consistency of the scores of the revised
items was .84. Accordingly, the revised items of depression symptoms during the week
before the survey were scored by a four-point Likert scale from 1 ‘rarely or none of the
time’ to 4 ‘most or all of the time.’ People with a high mean score can be interpreted to

46
be "at risk" of depression or in need of treatment (Radloff, 1977). Radloff confirmed that
the scale was suitable for use in Black and White English-speaking American adults of
both genders in the study of depressive symptoms.
Absenteeism
Absenteeism was measured with one item modified from Sheffield, Dobbie, and
Carroll’s (1994) study. Absenteeism was assessed by the extent of total absent days
during the past three months. A three month-period has been the most frequently used
period for self-report absenteeism in organizational studies, and the period is appropriate
in terms of the accuracy of respondents’ recall (Brooke & Price, 1989).
Job Performance
Job performance was measured by two items of self-rated performance and
supervisor-rated performance. Scales of self-rating performance and supervisor-rating
performance were employed from the items used in a large study of healthy work
organization (Wilson, DeJoy, Vandenberg, Richardson, & McGrath, 2002). The two
performance items are scaled by a five-point Likert scale ranging from 1 ranked as
‘unsatisfactory’ to 5 ranked as ‘outstanding,’ with a 6 provided for ‘don’t know/unsure
responses.
Demographics
Age, gender, and marital status were included in the demographics and the effects
of the three demographic characteristics on depression were controlled. It has been well
documented that there are significant differences in depressive symptoms by age, gender,
and marital status. Hurrell (1985) reported female workers had significantly higher stress
symptoms than male workers among 2,803 postal workers in the US. Hellerstedt and
Jeffery (1997) reported that stress at work was significantly different by gender in a
health behavior intervention study. The participants of the study were 3,843 workers in
32 profit-organizations. In a literature review study, Pohorecky (1991) indicated that age
and gender were significant moderators affecting the relationship between stress
47
symptoms and behavioral strain (drug abuse). Cohen, Schwartz, Bromet, and Parkinson
(1991) regarded age as a significant factor confounding the effect of stressors on health
status. They controlled the effect of age in their study on the relationship between mental
health and stressors. Vermeulen and Mustard (2000) also examined the gender difference
between perceived social support, work stress, and psychological strain. They found that
women had more perceived social support, high work stress, and psychological strain
than men.
Luoto, Roikolainen, and Uutela (1998) found that stress symptoms were
significantly different by gender (women) and marital status (single) in an annual survey
by the National Public Health Institute in Finland. Burvill (1995) also noted that age,
gender, and marital status were significant demographics affecting depression prevalence
in a literature review study. Johnson, Thomas, and Riordan (1994) used age and marital
status as covariates affecting depression and work stressors.
Data Management and Statistical Analyses
Data Management
Collected data were entered into a computerized database using the Statistical
Package for the Social Sciences (SPSS) version 10.1 (Norusis, 1997). Data entry
accuracy was validated in two ways. First, 20% of the data were randomly selected from
the original data and reentered on another worksheet. Then, the original data and the 20%
sample data were compared with each other to inspect discrepant values. Second, all
values were checked to determine if they fell within a possible response range.
A missing data imputation technique was used to effectively handle missing data.
It is common practice to use list-wise deletion to deal with missing data. With this
practice a large portion of data may be easily dismissed because all cases that have any

48
one or more missing responses should be eliminated. Roth (1994) reported that at least
18.3% of the total cases were easily lost in the analysis when 2% of the data were missing
randomly and entire cases with any missing data were deleted. Furthermore, missing data
can bias correlation coefficients downward because high or low scores tend to be lost and
the lost data attenuate the correlation between underlying constructs (Little & Rubin,
1987; Roth, 1994). Accordingly, a missing data imputation technique can prevent the
large loss of data and minimize bias in parameter estimation (Chan, Gilman, & Dunn,
1976). Seventy usable cases should have been eliminated from analyses under list-wise
deletion practice in this study. However, 47 cases among the 70 cases were saved using
missing data imputation technique. The present study has 1.4% missing responses among
the total number of responses.
Missing data imputation was applied through the following three steps. The first
step was to select the measures, excluding objective measures or single-item measures
since these cannot be used in imputation (Roth, 1994). Thus, all demographic questions,
absenteeism, and performance measures were excluded from missing data imputation.
The second step was to select the cases that had acceptable because missing data
imputation is only available for random missing responses not for systematic missing
responses (Wilson, DeJoy, Vandenberg, Richardson, & McGrath, 2002). However, there
is no clear rule to discriminate between the two patterns. The alternative method is to find
how many items should have missing values to define the cases that have systematic
missing patterns. Roth, Switzer, and Switzer (1999) highly recommend a conservative
two thirds rule. That is, cases can be considered missing at random if the cases have more

49
than two thirds valid responses of the items in a scale. In this study, 240 cases fell into the
imputation possible category.
The final step was to apply an imputation method to handle the missing values.
Missing data imputation is available both in multiple regression and structural equation
modeling. Multiple imputation in structural equation modeling approach obtains greater
maximum likelihood of imputation than regression imputation because the multiple
imputation technique is strong in a small sample population (Arbuckle, 1996). Thus, the
expected maximization algorithm in multiple imputation was applied to impute the
missing values. The expected maximization algorithm starts imputation with the mean
vectors and covariance matrices of the cases, which have no missing values. Then, the
mean vectors and the covariance matrices of the cases with missing values are repeatedly
adjusted compared with those of the cases with no missing values until the two sets of
data have the same mean vectors and the same covariance matrices. The multiple
imputation for this data was conducted using LISREL Version 8.5 (Du Toit & Du Toit,
2001).
Tests of the Measurement Models
Before hypothesis tests, measurement models should be tested to ensure that
scales behaved as intended because overall model fit in structural equation modeling is
sensitive to the measurement model as well as the structural model (Bollen, 1989).
Measurement models of this study were adjusted using confirmatory factor analysis in
LISREL version 8.5 (Du Toit & Du Toit, 2001). The most primary purpose of
confirmatory factor analysis was to make sure that scale items reflect their intended
underlying constructs (Lance & Vandenberg, 2002).
50
First of all, it was tested whether all manifest (observed) variables were loaded to
the intended latent variables (underlying constructs). Each latent variable in a specified
model is usually defined by several manifest variables (Bollen, 1989). The 68 items that
were intended to represent social support at work, job demands, job control, depression,
and job performance were tested. The parameter estimate and the error variance of an
observed variable for each latent variable were fixed to 1 and 0 as a reference indicator.
Fourteen items of demographics, life stress, and absenteeism were excluded from factor
analysis because factor analysis is not available for objective measures or single-item
measures. Based on standardized residuals between manifest variables and parameter
estimates, the least reliable items were screened. In this procedure, the items that were
not loaded well on any latent variables were excluded.
In terms of four overall fit indices and standardized parameter estimates, the
measurement models were ensured with the screened observed items using confirmatory
factor analysis. The four overall fit indices and standardized parameter estimates used in
this study will be described in detail in the ‘hypothesis test’ section. The closer the
standardized estimate to 1.00 the closer the relationship between the manifest variable
and the latent variable (Bollen, 1989). T-value is a significance indicator of each estimate
and greater than 1.96 t-value equals to less than .05 p-value.
Four measurement models were tested to ensure that scales behaved as intended
in the four hypothesis tests with the screened items. Absenteeism and job performance
were not included in the tests of measurement models because they were measured with
one manifest variable each. Three measurement models were confirmed with item-unit
data, and the measurement model for the test of interaction effects was tested with parcel-

51
unit data. Ideally, the best approach to model testing is to use item-unit data. However,
using parcel-unit data is a popular alternative in relation to the power issue when the
sample size is small and the number of parameters to be identified is large (Bandalos &
Finney, 2001). A parcel consists of a set of several items. The items within a parcel are
significantly correlated with each other. The average score of the items within a parcel
takes the same role the score of an item in the analysis. The test identifying the
interaction effects of social support requires dividing the samples into two groups (the
high support group and low support group) in multi-group analysis (Jorëskog & Sörbom,
1996). Accordingly, the sample size is reduced to half but the numbers of parameters
which should be identified are not reduced in model testing per group. In this case, the
power issue could be a serious problem because so many estimates must identified with a
small sample. Thus, the sample size needs to be enlarged or the number of parameter
needs to be decreased to maintain eligible power. Using parceled data is useful to reduce
the number of parameters which must identified, when the sample size can not be
changed.
The first measurement model was for the hypothesis test of main effects of social
support at work. The first measurement model has a type of higher-order latent variable
structure for social support at work. Higher order constructs have been used in situations
where the meaning of a conceptual entity cannot be captured through its individual
components, but must be captured through common forces underlying those components
(James, James, & Ashe, 1990). In the second-order latent variable approach, the second
order latent variables are defined by the first order latent variables, and the first order
latent variables are operationalized by several manifest variables (MacCallum, Browne,
52
& Sugawara, 1996). The first measurement model consisted of six first-order latent
variables and one second-order latent variable. The first-order latent variables were
organizational support, supervisor support, coworker support, job demands, job control,
and depression. Organizational support, supervisor support, and coworker support
comprised the second-order latent variable, social support at work.
Parceled data were used for the test of the second measurement model due to the
ratio of the sample size to parameters which should be identified. Based on standardized
residuals between items in confirmatory factor analysis, two or three parcels were created
in a latent variable. Then, the study population was divided to two groups: the high
support group and the low support group. The measurement models of the two samples
were examined both individually and collectively. The third and fourth measurement
models confirmed the measurement structure of social support at work by source and by
function. In the third measurement model, organizational support, supervisor support,
coworker support, job demands, job control, and depression were examined as latent
variables. In the fourth measurement model, social support at work was examined by
functions of support at work: organizational support, information from supervisor and
coworker, material from supervisor and coworker, emotion from supervisor and
coworker, appraisal support from supervisor and coworker, and undermining from
supervisor and coworker.
Hypothesis Tests
Descriptive statistics were analyzed using SPSS version 10.1 (Norusis, 1997). To
describe the basic response patterns of data by variables descriptive statistics (mean,
standard deviation, and percentage) were calculated. Simple correlations between all
53
latent variables and internal reliability values (Cronbach’s alpha) for the latent variables
were generated. Prior to the hypothesis test, the impact of demographic variables and
stressful life events on depression were examined using multiple regression analysis
because the variables could be controlled, if necessary, in the hypothesis tests to clearly
identify the effects of work stress on depression and its outcomes.
To test the four hypotheses, this study employed the structural equation modeling
using LISREL version 8.5 (Du Toit & Du Toit, 2001). The first hypothesis test was to
identify the main effect of social support at work on the proposed work stress framework
using the second-order latent variable approach. Eleven latent variables were analyzed in
the first-order level. Social support at work was analyzed at the second-order level. Job
performance and absenteeism had fixed parameter estimates and error variances because
these latent variables were estimated by single-item observed variables. Their parameter
estimates on the latent variables were the square root of the observed variables’ reliability.
As a rule of thumb, .60 has been used as the reliability value of a single-item variable.
Similarly, the 1st-order error variances of the observed variables were fixed one minus the
reliability times the variance of the measure (Vandenberg & Scarpello, 1990; Williams &
Hazer, 1986). The parameter estimates of job performance and absenteeism observed
variables on their latent variables were .775. Their error variances were .40 and .41.
The second hypothesis test was to identify the interaction effect of support on the
proposed work stress framework. Multi-group analysis in structural equation modeling
was applied to this hypothesis test. Multi-group analysis has been used to estimate
moderating effects of certain factors or treatments on path relations between variables
(Jorëskog & Sörbom, 1996). In the analysis, the entire sample was divided into two
groups by their support levels: high support group and low support group. The cut-off

54
point dividing the two groups was the median score of the summed support scores. The
median score has been frequently used in most cases to equal the statistical power of the
two groups if the median value was not far from the mean value. The median value was
appropriate in this study because the average of the total support scores was 59.0, which
was close to the median value of 60.0. Before the test of interaction effect, multi-group
analysis requires that the data satisfy the two basic assumptions: the equal measurement
structure and the equal factor loading between the two data sets. After that, the
hypothesized path relationships moderated by social support at work were examined one
by one through whole analysis steps. In each analysis step, one parameter of one data set
was set to be equal to the corresponding parameter of the other data set. There is
significant interaction effect on the constraint parameter if the model has significantly
increased chi-square values compared with the previous model. A total of six analysis
steps were conducted to the interaction effect test of social support at work.
The third and forth hypothesis tests were post-hoc tests of the first hypothesis test.
Based on the significant effects of social support at work on the proposed work stress
process, the third test identified which sources of support at work were significantly
related to the variables identified in the main effect test. The forth test followed exactly
the same analysis process as the third test and identified the functions of support at work
that were more related to the variables which were significantly related to social support
in the main effect test.
All hypothesis tests were interpreted in terms of the two aspects: overall model fit
and parameter estimates. Overall fit index generally indicates the degree of fit of the
hypothesized model to the data in terms of both the structural model and the
measurement model. However, the fit index does not specify the test of hypothesized
path relationships. The estimates for the parameters can answer whether hypothesized
relationships within the model were satisfied. Each parameter estimate was examined in

55
terms of two-tail test. Standardized estimates were generated and the greater the estimate
the stronger the relationship between the two latent variables. Thus, overall fit index and
parameter estimate accompany each other in output interpretation of hypothesis tests.
Various fit indices have been used in the structural equation modeling approach.
This study used four fit indices. The first index was the chi-square test of model fit.
Ideally, a statistically nonsignificant chi-square value should be observed to infer good fit.
However, inferring the fit between a theoretical model and data in chi-square test is
frequently ill advised because a statistically significant chi-square value of bad fit can be
obtained even when all of the other indices indicate that the specified model provides an
excellent fit to the data (Bollen, 1989; Hu & Bentler, 1993). This derives from the fact
that the chi-square test is very sensitive to even minor deviations between the observed
and reproduced data matrices, and is quite susceptible to sample size influences (Bollen
& Long, 1993; Marsh, Balla, & McDonald, 1988). That is, the chi-square test provides a
conservative dimension of the model fit if the misleading effect of the sample size is
considered as well. Thus, it is suggested calculating the chi-square to degrees-of-freedom
ratio as a supplement to chi-square test (Medsker, Williams, & Holahan, 1994). Carmines
and McIver (1981) indicated that ratios of five were viewed as a lower bound limit and
ratios of three or less are indicators of excellent fit.
The second fit index was the Tucker-Lewis index (TLI; Tucker & Lewis, 1973).
The TLI appropriately penalizes model complexity and appropriately rewards model
parsimony. TLI is relatively: (1) insensitive to sample size, (2) sensitive to model
misspecifications, (3) insensitive to violations of assumptions of multivariate normality,
and (4) relatively insensitive to estimation methods (Hu & Bentler, 1999). The third fit
index was the relative noncentrality index (RNI; McDonald & Marsh, 1990). The RNI is
recommended when research investigators put their credence in null models and do not
want to weight the badness-of-fit ratio with a parsimony ratio as does the TLI. Although
the value may fluctuate outside of this range under some situations, the TLI and RNI vary

56
between 0 and 1.0 with values above .90 indicative of good-fitting models. The fourth fit
index was the root mean square error of approximation (RMSEA; Steiger, 1990). Unlike
the other indices, the RMSEA does not require a null model in its calculation and does
not conflict with the requirements for parsimony. The definition of the RMSEA is based
on the property that the minimum value of the discrepancy function is close to the
systematic lack of fit of the model (Browne & Cudeck, 1993; Jorëskog & Sörbom, 1996).
Ideally, there should be no error, but realistically, values .08 or less represent reasonable
errors of approximation in the population (Wilson, DeJoy, Vandenberg, Richardson, &
McGrath, 2002).

57
CHAPTER 4
RESULTS
This chapter presents the results of the statistical analyses conducted for this study.
The first section addresses the validation of the measurement model, followed by the
participants’ demographic characteristics and occupational characteristics in the second
section. The third through the sixth sections present the results of the four hypothesis
tests. The third section presents the findings of social support at work in terms of the
main effects on the proposed work stress framework. The fourth section presents the
interaction effects of social support at work on the proposed work stress framework. The
last two sections present which sources of support and which functions of support were
closely related to the variables that showed significant relationships to social support at
work in the main effect test.
Validation of Measurement Models
Among 69 scaled items used in the survey (Appendix A), 50 items were selected
as valid items for hypothesis tests. Through factor analysis, 19 items were dropped (See
Table 4.1). Initially, 23 items of social support (nine items of organizational support,
seven items of supervisor support, and seven items of coworker support), nine items of
perceived job demands, 22 items of job control, 12 items of depression, and two items of
job performance were examined in the measurement model tests. Among them, two items
of supervisor social support (item numbers 15 and 16), two items of coworker support
(item numbers 20 and 21), two items of perceived job demands (item numbers 27 and 29),
nine items of job control (item numbers 33, 36, 38, 44, 47, 49, 51, 52, and 53), three

58
items of depression (item numbers 63, 64, and 65), and one item of job performance
(self-rated performance) did not appropriately explain the intended latent variables and
were excluded from hypothesis tests.
None of the demographic variables or stressful life events was used in the
hypothesis tests because these did not have significant effects on depression in multiple
regression analysis (Appendix B). With these 50 observed items, four measurement
models for four hypothesis tests were validated using confirmatory factor analysis.
Four measurement models were confirmed to ensure that the scales behaved as
intended in terms of overall model fit and parameter estimates. Overall model fit
indicates whether a measurement model has a generally acceptable factor loading pattern
Table 4.1
Description of measures used in the survey and in the analysis
Variables Numbers of items used in the survey
Numbers of items used in model tests
Organizational support Supervisor support Coworker support
9 7 7
9 5 5
Job demands Job control
9 22
7 13
Depression 12 9
Absenteeism
1 (Absent days during the
past three months)
1 (Absent days during the
past three months) Job performance
2 (Self-rated and supervisor-
rated performance)
1 (Supervisor-rated
performance) Stressful life events out of work 7 0
Demographics 6 0
Total 82 50
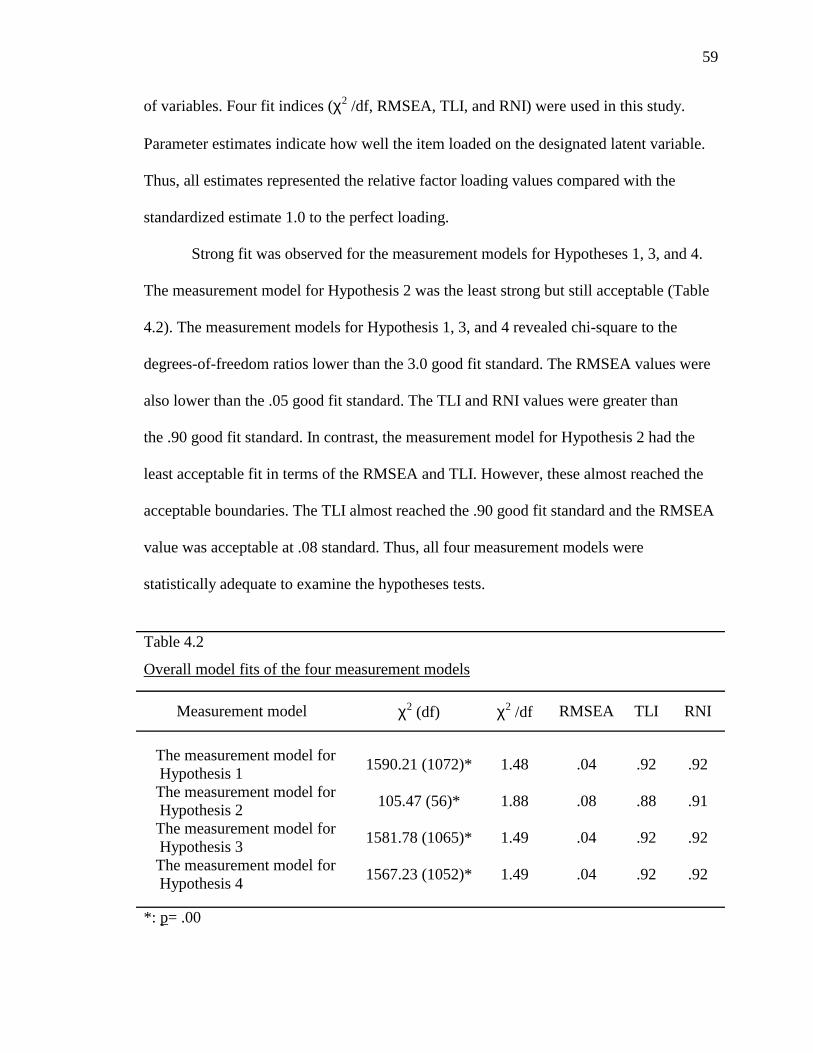
59
of variables. Four fit indices (χ2 /df, RMSEA, TLI, and RNI) were used in this study.
Parameter estimates indicate how well the item loaded on the designated latent variable.
Thus, all estimates represented the relative factor loading values compared with the
standardized estimate 1.0 to the perfect loading.
Strong fit was observed for the measurement models for Hypotheses 1, 3, and 4.
The measurement model for Hypothesis 2 was the least strong but still acceptable (Table
4.2). The measurement models for Hypothesis 1, 3, and 4 revealed chi-square to the
degrees-of-freedom ratios lower than the 3.0 good fit standard. The RMSEA values were
also lower than the .05 good fit standard. The TLI and RNI values were greater than
the .90 good fit standard. In contrast, the measurement model for Hypothesis 2 had the
least acceptable fit in terms of the RMSEA and TLI. However, these almost reached the
acceptable boundaries. The TLI almost reached the .90 good fit standard and the RMSEA
value was acceptable at .08 standard. Thus, all four measurement models were
statistically adequate to examine the hypotheses tests.
*: p= .00
Table 4.2
Overall model fits of the four measurement models
Measurement model χ2 (df) χ2 /df RMSEA TLI RNI
The measurement model for Hypothesis 1 The measurement model for Hypothesis 2 The measurement model for Hypothesis 3 The measurement model for Hypothesis 4
1590.21 (1072)*
105.47 (56)*
1581.78 (1065)*
1567.23 (1052)*
1.48
1.88
1.49
1.49
.04
.08
.04
.04
.92
.88
.92
.92
.92
.91
.92
.92

60
Appendices C.1 to C.4 show the measurement models including the
corresponding structure models of the hypotheses tests. The rectangular boxes represent
manifest variables and the capitalized variables designate latent variables. The bold lines
with arrows identify the measurement model analyzed in the confirmatory factor analysis.
Other dotted lines with arrows point out the structural model examined in hypothesis tests.
The first measurement model was for Hypothesis 1 (See Appendix C.1). All 50
observed variables behaved as intended in terms of their standardized estimates (Table
4.3). All estimates were significant at the .05 level. In the first-order level, organizational
support, supervisor support, and coworker support had strong measurement structures.
All standardized estimates of manifest variables for the three first-order latent variables
were over .70. Job control and depression also had good measurement structures. All
estimates for job control and depression reached to .50. Job demands had two items
whose estimates were less than .50; however, the two items were still acceptable.
This measurement model, which was built with a second-order latent variable of
social support, fit the data significantly better than the measurement model with simply
one latent variable of social support at work. This means that the first-order latent
variables (organizational support, supervisor support, and coworker support) have their
own unique factors as well as a common factor of overall social support at work.
Organizational support and supervisor support (first-order level) were strongly loaded on
the second-order social support at work but the estimate of coworker support was
relatively small.

61
Table 4.3
Parameter estimates of the measurement model for Hypothesis 1
Variables OS SS CS Job demands Job control Depression
Social support at
work 1st-order Item#1 Item#2 Item#3 Item#4 Item#5 Item#6 Item#7 Item#8 Item#9 Item#10 Item#11 Item#12 Item#13 Item#14 Item#17 Item#18 Item#19 Item#20 Item#21 Item#24 Item#25 Item#26 Item#28 Item#30 Item#31 Item#32 Item#34 Item#35 Item#37 Item#39 Item#40 Item#41 Item#42 Item#43 Item#45 Item#46 Item#48 Item#50 Item#54 Item#55 Item#56 Item#57 Item#58 Item#59 Item#60 Item#61 Item#62 Item#66
.85 (RI)
.91 (.05)
.90 (.05)
.92 (.05)
.81 (.06)
.91 (.05)
.89 (.05)
.85 (.05)
.76 (.06)
.87 (RI) .95 (.05) .89 (.06) .74 (.06) .85 (.06)
.81 (RI) .86 (.08) .91 (.07) .78 (.08) .77 (.08)
.77 (RI) .68 (.08) .58 (.10) .74 (.10) .36 (.09) .59 (.10) .41 (.11)
.62 (RI) .57 (.11) .50 (.11) .66 (.14) .59 (.13) .53 (.12) .52 (.11) .49 (.11) .73 (.12) .53 (.11) .67 (.11) .68 (.12) .68 (.11)
.51 (RI) .66 (.18) .59 (.16) .88 (.19) .50 (.17) .61 (.15) .49 (.16) .49 (.17) .78 (.18)
2nd-order OS SS CS
.88 (RI)
.76 (.09)
.33 (.06)
Note. OS = Organizational support, SS = Supervisor support, CS = Coworker support, All numbers are standardized estimates (standard errors). RI = Reference indicator (Standard error and significance are not estimated for reference indicators.)
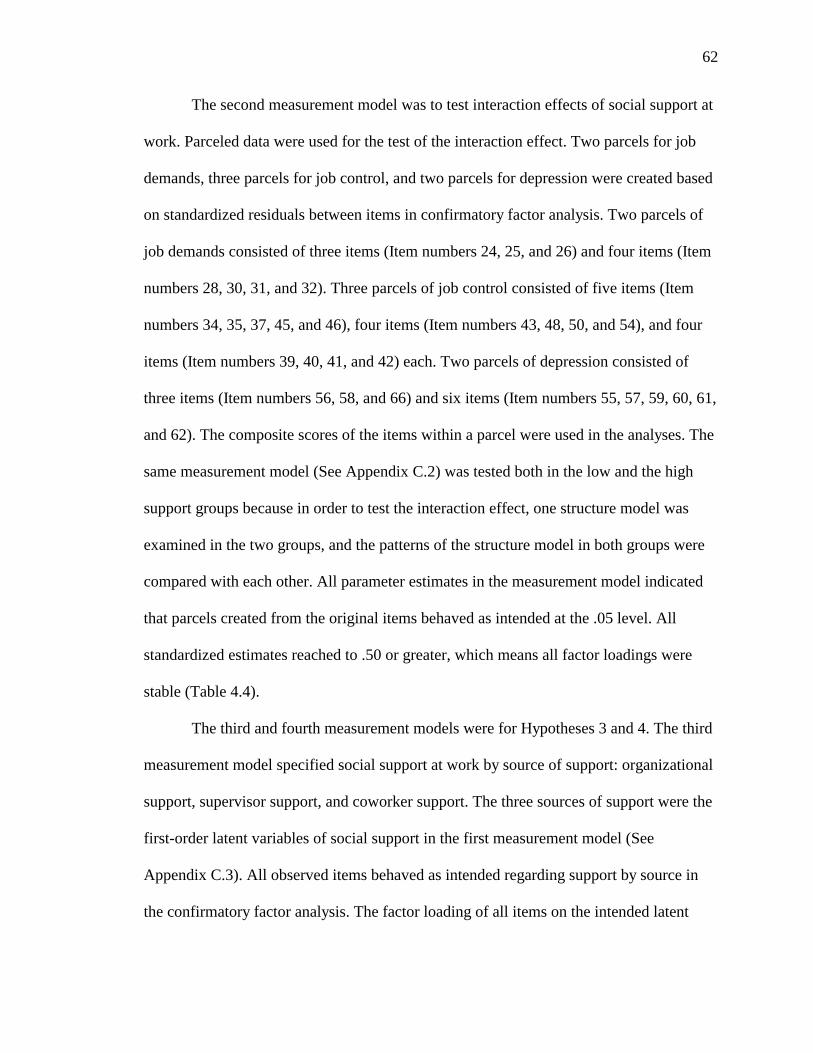
62
The second measurement model was to test interaction effects of social support at
work. Parceled data were used for the test of the interaction effect. Two parcels for job
demands, three parcels for job control, and two parcels for depression were created based
on standardized residuals between items in confirmatory factor analysis. Two parcels of
job demands consisted of three items (Item numbers 24, 25, and 26) and four items (Item
numbers 28, 30, 31, and 32). Three parcels of job control consisted of five items (Item
numbers 34, 35, 37, 45, and 46), four items (Item numbers 43, 48, 50, and 54), and four
items (Item numbers 39, 40, 41, and 42) each. Two parcels of depression consisted of
three items (Item numbers 56, 58, and 66) and six items (Item numbers 55, 57, 59, 60, 61,
and 62). The composite scores of the items within a parcel were used in the analyses. The
same measurement model (See Appendix C.2) was tested both in the low and the high
support groups because in order to test the interaction effect, one structure model was
examined in the two groups, and the patterns of the structure model in both groups were
compared with each other. All parameter estimates in the measurement model indicated
that parcels created from the original items behaved as intended at the .05 level. All
standardized estimates reached to .50 or greater, which means all factor loadings were
stable (Table 4.4).
The third and fourth measurement models were for Hypotheses 3 and 4. The third
measurement model specified social support at work by source of support: organizational
support, supervisor support, and coworker support. The three sources of support were the
first-order latent variables of social support in the first measurement model (See
Appendix C.3). All observed items behaved as intended regarding support by source in
the confirmatory factor analysis. The factor loading of all items on the intended latent

63
variables were significant at the .05 level. The standardized estimates were over .50
except two items of job demands. However, the two items were still acceptable (Table
4.5).
Note. RI=Reference indicator, All numbers are standardized estimates (standard errors).
The last measurement model was for Hypothesis 4. Initially, one organizational
support and four functions of support each from supervisor and coworker were entered in
confirmatory factor analysis. However, the factor structures of supervisor support and
coworker support changed. Information and material support were clustered to one
variable and emotional and appraisal support were clustered to another variable. These
factor loading patterns were the same in supervisor support and in coworker support.
Organizational support worked as intended (See Appendix C.4). All items were
significantly loaded to their latent variables at the .05 level. Their parameter estimates
also indicated that the latent variables within the model were excellently represented by
the selected manifest items (Table 4.6).
Table 4.4
Parameter estimates of the measurement model for Hypothesis 2
Low support group High support group Parcel Job
demands Job control Depression Job demands Job control Depression
Job demands 1
Job demands 2
Job control 1
Job control 2
Job control 3
Depression 1
Depression 2
1.00 (RI)
.61 (.09)
1.00 (RI)
.60 (.05)
.64 (.06)
1.00 (RI)
.70 (.10)
1.00 (RI)
.64 (.09)
1.00 (RI)
.59 (.07)
.49 (.08)
1.00 (RI)
.75 (.10)
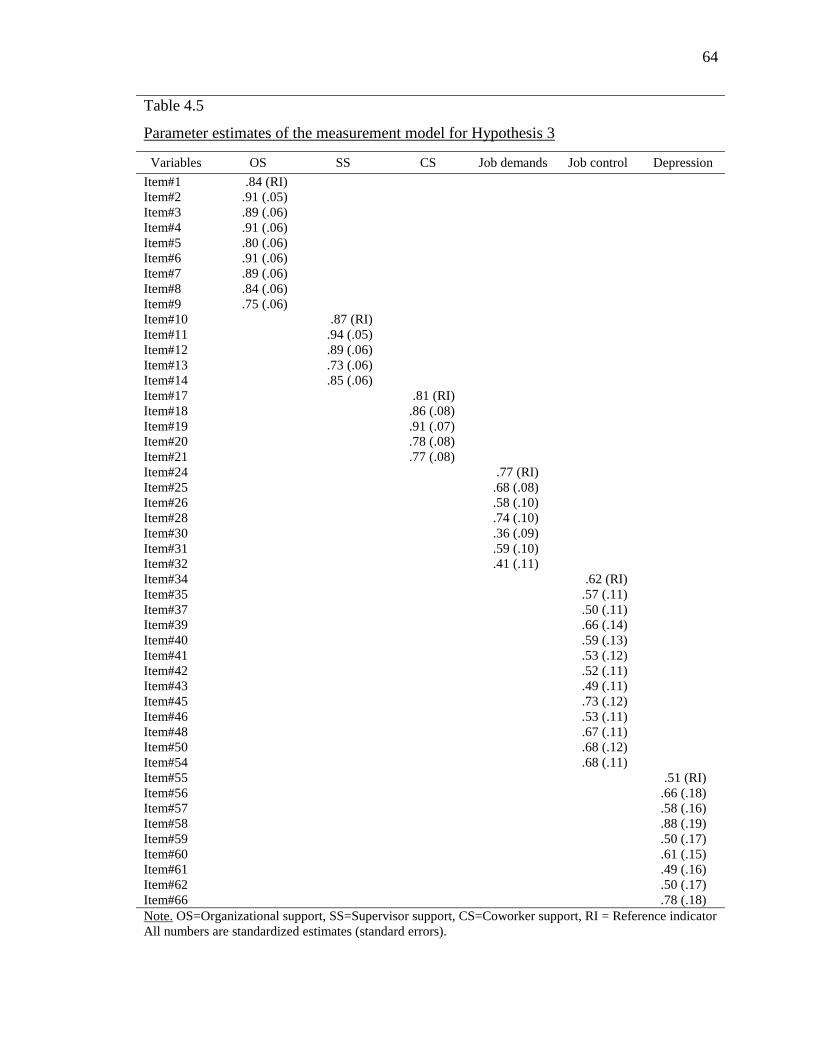
64
Table 4.5
Parameter estimates of the measurement model for Hypothesis 3
Variables OS SS CS Job demands Job control Depression Item#1 Item#2 Item#3 Item#4 Item#5 Item#6 Item#7 Item#8 Item#9 Item#10 Item#11 Item#12 Item#13 Item#14 Item#17 Item#18 Item#19 Item#20 Item#21 Item#24 Item#25 Item#26 Item#28 Item#30 Item#31 Item#32 Item#34 Item#35 Item#37 Item#39 Item#40 Item#41 Item#42 Item#43 Item#45 Item#46 Item#48 Item#50 Item#54 Item#55 Item#56 Item#57 Item#58 Item#59 Item#60 Item#61 Item#62 Item#66
.84 (RI) .91 (.05) .89 (.06) .91 (.06) .80 (.06) .91 (.06) .89 (.06) .84 (.06) .75 (.06)
.87 (RI) .94 (.05) .89 (.06) .73 (.06) .85 (.06)
.81 (RI) .86 (.08) .91 (.07) .78 (.08) .77 (.08)
.77 (RI) .68 (.08) .58 (.10) .74 (.10) .36 (.09) .59 (.10) .41 (.11)
.62 (RI) .57 (.11) .50 (.11) .66 (.14) .59 (.13) .53 (.12) .52 (.11) .49 (.11) .73 (.12) .53 (.11) .67 (.11) .68 (.12) .68 (.11)
.51 (RI) .66 (.18) .58 (.16) .88 (.19) .50 (.17) .61 (.15) .49 (.16) .50 (.17) .78 (.18)
Note. OS=Organizational support, SS=Supervisor support, CS=Coworker support, RI = Reference indicator All numbers are standardized estimates (standard errors).

65
Table 4.6
Parameter estimates of the measurement model for Hypothesis 4
Variables OS SS (I&M)
SS (E&A)
CS (I&M)
CS (E&A)
Job demands
Job control Depression
Item#1 Item#2 Item#3 Item#4 Item#5 Item#6 Item#7 Item#8 Item#9 Item#10 Item#11 Item#12 Item#13 Item#14 Item#17 Item#18 Item#19 Item#20 Item#21 Item#24 Item#25 Item#26 Item#28 Item#30 Item#31 Item#32 Item#34 Item#35 Item#37 Item#39 Item#40 Item#41 Item#42 Item#43 Item#45 Item#46 Item#48 Item#50 Item#54 Item#55 Item#56 Item#57 Item#58 Item#59 Item#60 Item#61 Item#62 Item#66
1.00 (RI) 1.05 (.05) 1.05 (.06) 1.07 (.06)
.95 (.06) 1.09 (.06) 1.09 (.06)
.92 (.06)
.88 (.06)
1.00 (RI)
1.09 (.06) .87 (.06)
1.00 (RI)
.89 (.04)
1.00 (RI)
1.25 (.07) 1.14 (.08)
1.00 (RI)
.94 (.06)
1.00 (RI) .76 (.08) .84 (.10)
1.05 (.10) .46 (.09) .80 (.10) .63 (.11)
1.00 (RI) .81 (.11) .75 (.11)
1.18 (.14) .97 (.13) .85 (.12) .76 (.11) .74 (.11)
1.12 (.12) .80 (.11) .97 (.11)
1.00 (.12) .98 (.11)
1.00 (RI) 1.25 (.18) 1.03 (.16) 1.55 (.19) 1.02 (.17) 1.03 (.15)
.95 (.16) 1.03 (.17) 1.40 (.18)
Note. All numbers are standardized estimates (standard errors). RI = Reference indicator, OS=Organizational support, SS (I&M)=Information and material support from supervisor, SS (E&A)=Emotion and appraisal support from supervisor, CS (I&M)=Information and material support from coworker, CS (E&A)=Emotion and appraisal support from coworker

66
Description of the Participants
A total of 240 cases were analyzed. Distributions of job demands, job control,
depression, and social support were conducted from the perfect 240 cases using multiple
imputation technique.
Demographic Characteristics
The ages of the participants ranged from 20 to 76 years of age. The majority of
them were in the 40s (30.3%) and the 50s (35.5%). The average age was 46.12 years old
(SD = 11.01). The majority of the participants were women (71.5%), and were married or
lived with partners (48.2%) (Table 4.7).
Table 4.7
Demographic characteristics of participants
Variable N %
Age (years) 20 – 29 30 – 39 40 – 49 50 – 59 60 or older Total
20 31 64 75 21
211
9.5 14.7 30.3 35.5 10.0
100.0
Gender Men Women Total
67 168 235
28.5 71.5
100.0
Marital status Never married/live alone Divorced/separated Married/live with partner Total
51 67
110 228
22.4 29.4 48.2
100.0

67
Occupational Characteristics
Duration of work for the present organization ranged from one month to 32 years.
More than half of participants had worked in the organization less than five years (n =
115). Medical technicians and support staff working in housekeeping, maintenance, or
food service comprised the largest job categories, whereas doctors and nurses were less
than 20% of total participants (Table 4.8).
The majority of participants were full-time employees. About 43% of the
participants answered that their job performance was rated as ‘excellent,’ or ‘very good’
by their supervisors on the most recent performance evaluation. The average absent days
during the past three months were approximately one day (M = .91, SD = 3.44) with
44.2% of participants who had never been absent from their offices during the three
months before the survey.
Means and standard deviations of variables included in hypothesis tests are
presented in Table 4.9. Correlation and internal reliability (Cronbach’s alpha) of the
scores of all latent level variables are also shown in the table. The numbers within
parentheses on the diagonal of correlation matrix are Cronbach’s alpha values of the
scores of the scales. Most scores showed Cronbach’s alpha values at .8 to .9, which
means they had strong internal reliability. Organizational support was lower than the
other kinds of support at work. Participants responded that their depressive symptoms
were at a mild level, close to ‘some or little of the day.’ Depression and job control
showed stronger correlation with social support at work than did other variables.

68
Table 4.8
Occupational characteristics of participants
Variable N %
Duration of work in the organization
Less than 1 year 1 year or more and less than 5 years 5 years or more and less than 10 years 10 years or more and less than 20 years 20 years or more and less than 30 years 30 years or more Total
35 80 37 36 29 8
225
15.6 35.6 16.4 16.0 12.9 3.6
100.0
Job category
Physician Nurse Technician Administration Program assistant Support staff Social worker or psychologist Others Total
6 33 60 32 28 40 17 17
233
2.6 14.2 25.8 13.7 12.0 17.2 7.3 7.3
100.0
Job status
Full-time employees Part-time employees Total
222 14
236
94.1 5.9
100.0
Job performance (Supervisor-rated)
Unsatisfactory Satisfactory Good Very good Excellent Total
5 50 83 72 30
240
2.1 20.8 34.6 30.0 12.5
100.0
Absenteeism (during the past 3 months)
None 1 – 2 days 3 – 4 days 5 days or more Total
106 80 25 29
240
44.2 33.3 10.4 12.1
100.0

Tabl
e 4.
9
Cor
rela
tions
bet
wee
n va
riabl
es
Var
iabl
es
Mea
n S.
D.
1 2
3 4
5 6
7 8
9 10
1. O
rgan
izat
iona
l sup
port
2. I
& M
supp
ort f
rom
supe
rvis
or
3. E
& A
supp
ort f
rom
supe
rvis
or
4. I
& M
supp
ort f
rom
cow
orke
r
5. E
& A
supp
ort f
rom
cow
orke
r
6. J
ob d
eman
ds
7. J
ob c
ontro
l
8. D
epre
ssio
n
9. J
ob p
erfo
rman
ce (r
ever
sed)
10. A
bsen
teei
sm
2.83
3.22
3.51
3.26
3.37
3.38
2.91
1.74
3.30
.91
1.21
1.26
1.00
1.24
1.10
.81
.81
.63
1.00
1.01
(.96)
.62**
.25**
.58**
.21**
-.10
.35**
-.18**
.17**
.02
(.88)
.30**
.83**
.21**
-.08
.25**
-.20**
.15*
-.03
(.89)
.32**
.81**
-.06
.08
-.19**
.04
-.01
(.87)
.27**
-.03
.25**
-.16*
.15*
-.01
(.82)
-.04
.05
-.21**
.04
-.04
(.79)
-.04
.09
.09
-.08
(.88)
-.01
.22**
-.02
(.84)
.04
.09
(NA
)
-.06
(NA
)
Not
e. N
= 2
40, * : p
< .0
5, **
: p<
.01,
I &
M =
Info
rmat
ion
and
mat
eria
l, E
& A
= E
mot
ion
and
appr
aisa
l, N
A =
Not
ava
ilabl
e A
ll C
onst
ruct
s wer
e sc
ored
bas
ed o
n a
five-
poin
t sca
le ra
ngin
g fr
om o
ne to
five
exc
ept d
epre
ssio
n an
d ab
sent
eeis
m. D
epre
ssio
n w
as
scor
ed in
a fo
ur-p
oint
scal
e ra
ngin
g fr
om o
ne to
four
and
abs
ente
eism
was
mea
sure
d w
ith re
spon
dent
s’ a
bsen
t day
s.

70
Main Effects of Social Support on Job Demands, Job Control, Depression,
Job Performance, and Absenteeism
The primary purpose of the study was to determine whether social support at
work had beneficial effects on the proposed work stress framework. The first hypothesis
test examined whether social support at work had main effects on job demands, job
control, depression, job performance, and absenteeism.
The first hypothesis test showed an excellent fit, which means the main effect
model was supported by the data. This strong overall model fit indicated that both the
measurement part and the structure part of the model generally fit the data. All four fit
indices suggested good fit for the model. The significance of chi-square statistic needs to
be checked with the chi-square to the degrees-of-freedom ratio because the chi-square
statistic is very sensitive to sample size and frequently rejects the null hypothesis. The
chi-square statistic was rejected (χ2 (1165) = 1689.58, p= .00); however, the chi-square to
the degrees-of-freedom ratio was 1.45, which was far lower than the excellent fit standard
of less than 3.0. RMSEA was .039, which was within the good fit standard of less
than .05. The TLI and RNI were .918 and .922 each, which were greater than the .90
standard to infer good fit.
Concerning parameter estimates, social support at work had significant
relationships with job control, depression, and job performance (Figure 4.1). Social
support at work had a strong positive relationship with job control, which means the
greater the social support at work, the greater the job control. One unit increase of social
support drove a .386 increase of job control in examining the unstandardized estimate and
the standardized coefficient was over .40. Social support at work had significant

71
relationships with both of the psychological outcome and the performance outcome.
Social support at work had an opposite relationship to depression, which means the
greater the social support, the lower the depressive symptoms. One unit increase of social
support at work was related to a .168 decrease of depression in examining an
unstandardized coefficient estimate. The standardized coefficient reached .30. Also,
social support at work was positively related to job performance and the standardized
estimate was over .30. The unstandardized coefficient estimate was a .348. One unit
increase of social support at work drove .348 increase of supervisor-rated job
performance. Social support affected the organizational outcome as well as the
psychological outcome.
The proposed work stress framework hypothesized that job demands and job
control affect depression and depression subsequently affects job performance and
absenteeism. There was no significant relationship between job demands, job control, job
performance, and absenteeism. In terms of overall model fit, significance in all path
relationships is not required to obtain good fit. Overall model fit indicates that generally
most parameters within a model fit the data well, although not all parameters do so at a
significance level.
Interaction Effects of Social Support on the Proposed Work Stress Framework
The second hypothesis test was conducted to identify whether social support at
work buffered the negative effects of work stressors on psychological and organizational
outcomes. This test examined the interaction effects of social support at work on the
proposed work stress process linking job demands, job control, depression, job
performance, and absenteeism. Four interaction effects of social support at work were

-
.117
.3
12*
.421
**
-.30
0*
.
018
.0
68
.1
35
.1
11
.14
7
Fi
gure
4.1
. The
mai
n ef
fect
s of s
ocia
l sup
port
at w
ork
on jo
b de
man
ds, j
ob c
ontro
l, de
pres
sion
, job
per
form
ance
, and
ab
sent
eeis
m
Not
e. N
umbe
rs o
n th
e lin
es =
Sta
ndar
dize
d pa
ram
eter
est
imat
es
*
: p <
.05
(t >
1.96
0), *
*: p
< .0
1 (t
> 2.
576)
Dep
ress
ion
Job
perf
orm
ance
Abs
ente
eism
Soci
al su
ppor
t at w
ork
Job
dem
ands
Job
cont
rol

73
examined for the relationships between job demands and depression, job control and
depression, depression and absenteeism, and depression and job performance.
Social support at work did not buffer the negative effects of work stressors on
their outcomes as Figure 4.2 shows standardized estimates in the high support group and
in the low support group when all parameters were set equal between groups in multi-
group analysis. No significant difference between in the high support group and in the
low support group was found over all parameters. This result was generated through six
analysis steps comparing the changes of chi-square tests at the changes of the degrees of
freedom between adjacent nested models shown in Table 4.10. There was no significant
increase of the chi-square statistic at one unit increase of the degree of freedom between
adjacent models, which means that there was no interaction effect of social support at
work on the four parameters linking job demands to depression, job control to depression,
depression to job performance, and depression to absenteeism.
The first two analyses were to confirm the basic assumptions of multi-group
analysis and the last four analyses were to examine interaction effects among the six
analysis steps. First, to confirm the first basic assumption, it was tested whether the two
groups had the equal measurement structures. The chi-square to the degrees of freedom
ratio and the RNI suggested excellent fit. The chi-square to the degrees-of-freedom ratio
was lower than the 3.0 standard and RNI was greater than the .90 good fit standard. The
RMSEA reached the .08 acceptable fit standard although somewhat greater than the .05
standard for good fit (Table 4.10). The TLI was slightly smaller than the .90 standard for
good fit. However, overall, the model for the equal measurement structure was still
within acceptable boundaries because three indices were excellent and the other index

74
almost reached the good fit criteria. The other basic assumption of multi-group analysis is
that measurement models of the two groups should be equal. That is, all factor loadings
of variables should be equal between groups. The change of the chi-square to the change
of the degrees-of-freedom from the first model to the second model was not significant,
which means the two groups had equal factor loadings. The second model was even more
impressive than the first model. The chi-square to the degrees-of-freedom ratio and TLI
indicated that the second model had better fit than the first model. The chi-square to the
degrees of freedom ratio and RNI strongly supported the acceptability of the second
model. Thus, the two basic assumptions required in the interaction effect test were
satisfied.
Note.and aanaly
High social support group
βH1= .08 βH3 = .12 βH2 = .12 βH4 = .07
Figur
suppo
Job demands
n
Absenteeism
Job performance
Job control
Low social support group
βL1 = .08 βL3 = .11 βL2 = .11 βL4 = .06
Job demands
n
Absenteeism
Job performance
Job control
Greek characters with subscripts ll numbers are standardized paramsis.
e 4.2. Comparison of the paramete
rt group in the last step of multi-g
Depressio
Depressio
on the arrow lines indicate the designated paths eter coefficients in the last step of multi-group
rs between the high support group and the low
roup analysis

Tabl
e 4.
10
Inte
ract
ion
effe
cts
of s
ocia
l sup
port
at w
ork
on th
e w
ork
stre
ss fr
amew
ork
Step
T
est
Nul
l hyp
othe
sis
χ2 (df)
χ2 /d
f R
MSE
A
TLI
RN
I
À
Equ
al fa
ctor
str
uctu
res
Mea
sure
men
t str
uctu
res
are
equa
l bet
wee
n gr
oups
. 10
5.47
(56)
* 1.
88
.08
.88
.91
À
vs.
Á
ã
χ2 / ã
df =
3.44
/ 4
(p=
.49)
Á
Equ
al fa
ctor
load
ings
M
easu
rem
ent m
odel
s ar
e eq
ual b
etw
een
grou
ps.
108.
91 (6
0)*
1.82
.0
8 .8
9 .9
1
Á
vs.
Â
ã
χ2 / ã
df =
1.26
/ 1
(p=
.26)
Â
Inte
ract
ion
of S
S on
the
rela
tions
hip
betw
een
job
dem
ands
and
dep
ress
ion
β H1
= β
L1
110.
17 (6
1)*
1.81
.0
8 .8
9 .9
1
Â
vs.
Ã
ã
χ2 / ã
df =
.43
/ 1 (p
= .5
1)
Ã
Inte
ract
ion
of S
S on
the
rela
tions
hip
betw
een
job
cont
rol a
nd d
epre
ssio
n β H
2 =
βL
2 11
0.60
(62)
* 1.
78
.08
.89
.91
Ã
vs.
Ä
ã
χ2 / ã
df =
.86
/ 1 (p
= .3
5)
Ä
Inte
ract
ion
of S
S on
the
rela
tions
hip
betw
een
depr
essi
on a
nd jo
b pe
rfor
man
ce
β H3
= β
L3
111.
46 (6
3)*
1.77
.0
8 .9
0 .9
1
Ä
vs.
Å
ã
χ2 / ã
df =
.10
/ 1 (p
= .7
5)
Å
Inte
ract
ion
of S
S on
the
rela
tions
hip
betw
een
depr
essi
on a
nd jo
b pe
rfor
man
ce
β H4
= β
L4
111.
56 (6
4)*
1.74
.0
7 .9
0 .9
1
Not
e. S
S=So
cial
sup
port
at w
ork.
All
Gre
ek c
hara
cter
s in
the
null
hypo
thes
is co
lum
n in
dica
te th
e co
rres
pond
ing
para
met
ers
in F
igur
e 4.
2. ã
χ2 / ã
df =
The
chan
ges
of C
hi-s
quar
e te
sts
at th
e ch
ange
s of
the
degr
ees
of fr
eedo
m b
etw
een
adja
cent
nes
ted
mod
els.
*:
p =
.00

76
Steps three through six tested the interaction effects of social support on the
proposed work stress process (Table 4.10). The third test step was to identify whether
there was a significant interaction effect of social support on the relationship between job
demands and depression. This analysis set the parameter estimate of job demands on
depression in the high support group equal to that in the low support group. The change
of chi-square to the change of the degrees-of-freedom was not significant (p= .26), which
meant that the relationship between job demands and depression did not differ by social
support level, and there was no interaction effect of social support between job demands
and depression.
In this way, one by one, the other three parameters were set to be equal between
the social support groups; however, no interaction effect of support at work was found.
The changes of the chi-square to the change of the degrees-of-freedom were .43 (p= .51)
for the parameter between job control and depression, .86 (p= .35) for the parameter
between depression and job performance, and .10 (p= .75) for the parameter between
depression and absenteeism. Although the degrees-of-freedom increased through analysis
steps, the chi-square to degrees-of-freedom ratio, RMSEA, and TLI changed toward the
better fit criteria, which indicated that the model without interaction effects of social
support fit the data well.
Sources of Social Support at Work Affecting Job Control,
Depression, and Job Performance
The third hypothesis test examined which sources of support at work drove the
effect of social support on job control, depression, and job performance as a post-hoc test
of the first hypothesis test. Social support at work was significantly related to job control,

77
depression, and job performance in the first hypothesis test. Organizational support,
supervisor support, and coworker support were examined as sources of support at work.
All four fit indices suggested the model by source of support (Figure 4.3) was
successful. The chi-square to the degrees of freedom was 1.46 (smaller than 3.0 fit
standard), although the chi-square statistic was rejected (χ2 (1155) = 1682.69, p = .00).
The RMSEA was .04 smaller than .05 good fit standard. The TLI and RNI also suggested
the excellent fit and the values were .92 each greater than the .90 good fit standard.
Note
grea
unst
Figu
perf
t
Organizational support. Numbers on the lines = Standa
Organizational support was s
ter the organizational support the
andardized parameter, one unit in
.16 .0 .34* -.13
re 4.3. The main effects of suppo
ormance by source
Job control
Job demands
Supervisor suppor
rdized estimates, **: p < .01 (
ignificantly related to job cont
better the job control. In term
crease of organizational supp
8 -.10 .13 -.0
rt at work on job control, dep
Depression
Coworker support
t > 2.576)
rol (Figure 4.3). The
s of the
ort was associated
4 -.13 -.01
ression, and job
Job performance
Absenteeism

78
with the .260 increase of job control. This suggested that organizational support
contributed more to the significant effect of overall social support at work on the
proposed work stress framework than supervisor support or coworker support. Supervisor
support and coworker support were not significantly associated with job control,
depression, and job performance. Thus, perceived high support from the organization had
a positive relationship with job control. In contrast, sources of support in the lower levels
such as supervisor or coworker were not significantly effective on job control, depression,
and job performance.
Functions of Social Support at Work Affecting Job Control,
Depression, and Job Performance
The fourth hypothesis test was to identify what functions of support had beneficial
effects on the proposed work stress framework. Social support at work was significantly
related to job control, depression, and job performance in the first hypothesis test. The
fourth hypothesis test examined what functions of support drove the significant effect of
social support on job control, depression, and job performance as a post-hoc test of the
first hypothesis test. Organizational support, material/information support and
emotional/appraisal support from supervisor, and material/informational support and
emotional/appraisal support from coworker comprised the functions of support.
The fourth model had a strong fit. The chi-square to the degrees of freedom was
1.46 smaller than the 3.0 fit standard although the chi-square statistic was rejected (χ2
(1138) = 1656.90, p = .00). The RMSEA was smaller .04 under the .05 good fit standard.
The TLI and RNI also suggested the good fit of this model. Their values were both .92,
which was greater than the .90 good fit standard.

79
Only organizational support was significantly related to job control by function of
support (Figure 4.4). The scale of organizational support was not eligible by function.
Examining the unstandardized estimate, one unit increase of organizational support drove
the .33 increase of job control. However, organizational support was not related to
depression and job performance. The other parameter estimates were not significant
although some estimates were greater than the estimate for the relationship between
organizational support and job control. This result was related to the large standard errors
of estimates. Significance of a parameter estimate is determined by the ratio of the
estimate to the standard error of the estimate. No functions of support from supervisor
and coworker affected job control, depression, or job performance consistent with the
results of the third hypothesis test.
Comparing the two models by source and function of support, the model by
source of support had more stable estimates and standard errors on parameters than the
model by function of support. This implied that the data was explained by source better
than by function of support.
Summary
In summary, high social support at work had positive main effects on high job
control, low depression, and high job performance. However, there was no interaction
effect of social support on any parameters in the proposed work stress framework. These
two results indicated that social support at work directly decreased both a psychological
outcome and an organizational outcome rather than buffered the links between them.
Examining main effects of social support by source and function in more detail, only
organizational support was related to job control both by source of support and by
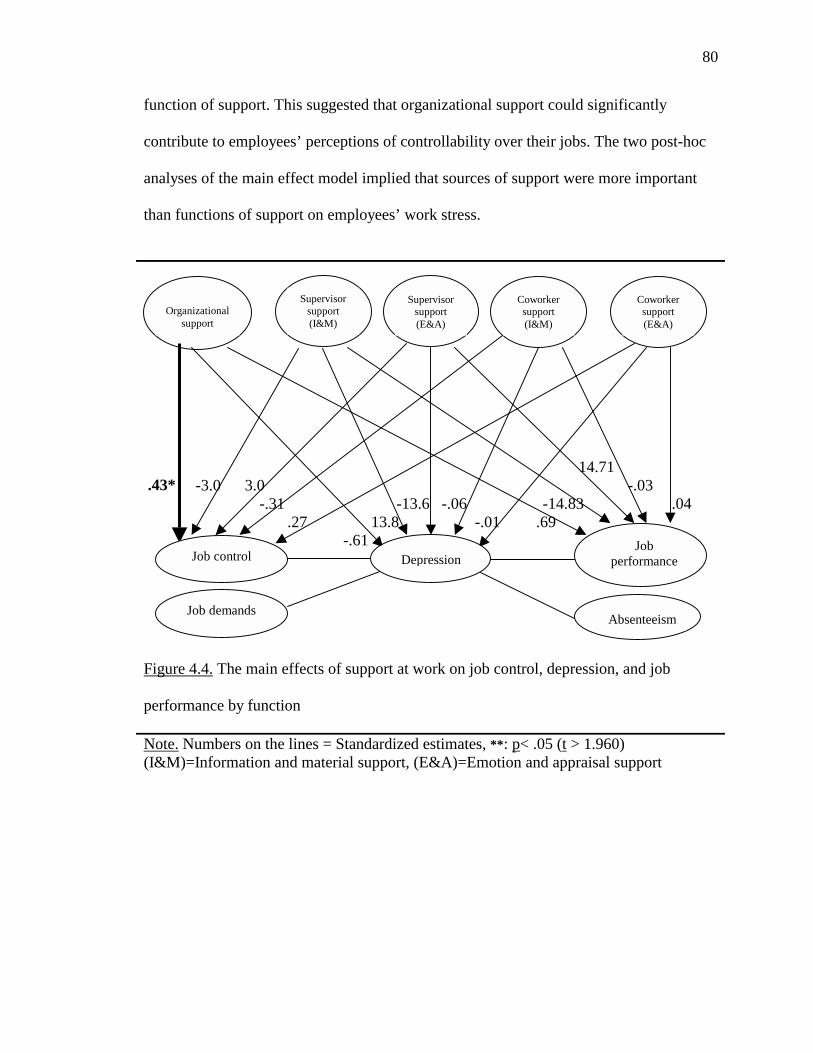
80
function of support. This suggested that organizational support could significantly
contribute to employees’ perceptions of controllability over their jobs. The two post-hoc
analyses of the main effect model implied that sources of support were more important
than functions of support on employees’ work stress.
Note. Numbers on the lines = Standardized estimates, **: p< .05 (t > 1.96(I&M)=Information and material support, (E&A)=Emotion and appraisa
14.71 .43* -3.0 3.0 -.03 -.31 -13.6 -.06 -14.83 .04 .27 13.8 -.01 .69 -.61 Figure 4.4. The main effects of support at work on job control, depressio
performance by function
Organizational support
Supervisor support (I&M)
Supervisor support (E&A)
Coworker support (I&M)
Coworker support (E&A)
Job control
n Job
performance
Absenteeism
Job demandsDepressio
0) l support
n, and job

81
CHAPTER 5
CONCLUSION AND RECOMMENDATIONS
This study examined how social support at work affected job demands, job
control, depression, job performance, and absenteeism. The first two hypotheses
addressed how social support at work affected the proposed work stress framework. The
main and interaction effects of social support were examined on the constructs of job
demands, job control, depression, job performance, and absenteeism. The other two
hypotheses examined which characteristics of social support had beneficial effects on the
proposed work stress framework.
Self-administered questionnaires were distributed to all employees in the Georgia
Regional Hospital through the pay slip delivery system. Voice reminders followed over
an 8-business day period through the hospital intercom system. The response rate was
31%. After data cleaning, 240 cases were used in statistical analyses. The questionnaires
asked about the constructs of job demands and job control as work stressors, social
support at work, depression as psychological strain, absenteeism and job performance as
organizational outcomes of work stress, and demographics. The social support construct
was operationalized in terms of source and function of support at work. This chapter
provides the conclusions and implications of this study, focusing on two major findings:
(1) how social support at work affects job demands, job control, depression, job
performance, and absenteeism and (2) which characteristics of social support are more

82
effective than others. Additionally, study limitations and recommendations are presented
for future work stress research and for interventions to reduce work stress.
Discussion and Conclusion
The Effects of Social Support at Work on Job Demands, Job Control, Depression, Job
Performance, and Absenteeism
Social support at work had significant main effects on the proposed work stress
framework; however, social support at work did not produce interaction effects. High
social support at work was related to high job control, low depression, and high job
performance. That is, social support at work affected not only the psychological
outcomes but also the organizational outcomes of stress. This finding suggested that
social support at work had a comprehensive and beneficial effect throughout the work
stress framework, rather than influencing the link from one variable to another variable in
the work stress framework.
Cohen and Wills (1985) help explain why this study did not find any interaction
effect of social support on work stress. They noted that the main effect was the primary
portion of the total effect of social support at work on stress and its outcomes. An
interaction effect comprises just an additional portion. House, Landis, and Umberson
(1988) reported that social support had general beneficial effects on strain and health, but
did not solely or even primarily have interaction effects at work. They also insisted that
social support at work had interaction effects on stress and its outcomes although the
interaction effect of social support was an additional portion of social support effects.
Israel, House, Schurman, Heaney, and Mero (1989) found that positive interpersonal
relationships at work were significantly related to low perceived work stressors, high job

83
satisfaction, low depression, and low illness symptoms; however, they did not mention
the interaction effect of social support although the hypothesized model of their study
included some interaction terms for social support. Their study implied that social
support at work had clear beneficial main effects on the whole work stress process.
LaRocco, House, and French (1980) found an interaction effect of social support at work
on the relationship between work stressors and general mental health, but failed to find
interaction effects on the relationship between work stressors and psychological strain. In
a literature review of community-based social support, Cohen and Wills (1985) also
mentioned that the main effect of social support on stress was clear but the interaction
effect was not clear.
The weak interaction effects of social support at work in the work stress
framework might be explained in terms of statistical power. The statistical test for an
interaction effect has less power than that for a main effect within a study. Product terms
for interaction effect tests require that the statistical power or the sample size be twice
that of the main effect tests (Cohen & Cohen, 1983). In other words, the statistical power
for the interaction effect test is half that of the power for the main effect test. The sample
size of the present study was sufficient for a main effect test but might have been too
small for an interaction effect test. Unequal power levels between main and interaction
effect tests may partially explain why the absence of interaction effect was found in the
present study.
In this study, social support at work had a stronger relationship with job control
than with depression and job performance. These results supported the theoretical
background of Karasek’s (1979) demand-control-support model and of House’s (1981)

84
framework of occupational stress. Karasek suggested that the pattern of social support
was correspondent to that of job control, which affects strains and their outcomes.
Karasek and Theorell (1990) noted that a change in social support and a change in job
control were almost inseparable when work stress was examined in relation to work
design. The relationship between social support and job control prompted stimulated
House to refer to “participatory work design processes” as a combination of job control
and social support changes, implying that social support at work can enlarge the latitude
of job control and beneficially affect psychological strain. Stansfeld, Bosma, Hemingway,
and Marmot (1998) detected a significant positive relationship between social support at
work and job control among 9,302 civil servants in London. Hemmingsson and Lundberg
(1998) also reported a significant relationship between the two factors.
According to House’s (1981) framework of occupational stress, social support
primarily strengthens workers’ perceived job control. The increased job control decreases
perceived stress such as negative feelings of job and job dissatisfaction before it
decreases psychological strain and its outcomes. This mechanism implies that job control
has an effect on cutting or decreasing the very beginning of strain in the work stress
process. The effects of job control on job dissatisfaction have also been strongly
supported by empirical research. Cahill and Landsbergis (1996) found that job control
and supervisor support had a succinct relationship with job dissatisfaction, stronger than
with psychological strain, sleeping problems, and muscle strain among 4,018 mail
handlers. Baker, Israel, and Schurman (1996) reported that job control had a stronger
relationship with negative feelings of job than with psychological strain. In accordance
with these studies, the strong relationship between social support and job control in this

85
study implies that job control increased by social support plays an important role in
decreasing strains through a work stress process.
This study found that there was a significant main effect of social support at work
on job performance. This finding reinforced the premise that organizational outcomes
should be considered in a theoretical framework of work stress. Recent organizational
health studies included organizational outcomes of work stress such as job performance,
turnover, and absenteeism (Beehr, Jex, Stacy, & Murray, 2000; Schaubroeck & Fink,
1998). However, few work stress theories or models consider organizational outcomes as
a function of work stress. Most work stress theories or models have considered
psychological strain and some health problems as primary outcomes of work stress. This
study, which included job performance and absenteeism as organizational outcomes in
the proposed work stress framework, found that high support at work was related to high
measures of job performance.
Characteristics of Social Support at Work Affecting Job Control, Depression, and Job
Performance
Organizational support had a clear beneficial main effect on job control. Strong
support from the employee’s organization increased employees’ perception of
controllability over their work. This result suggests that organizational support was a
more effective source of support on job control than supervisor support and coworker
support. House (1981) discussed the importance of organizational support. He reported
that most support at work was affected by what the organization, especially the higher
levels of management, advocate, value, and reward. Hutchison and Garstika (1996) have
also implied that employees view actions taken by agents or supervisors of the

86
organization as representative of actions of the organization itself. That is, general social
support at work is perceived by employees as dependent on how well their organization is
seen to take care of them. In this perspective, this study also supported the strong effect
of organizational support on work stress.
The influence of function of support on the work stress framework was minimal.
However, in the test of Hypothesis 3, job control was significantly affected by
organizational support in terms of source. Supervisor support also had the same
relationships with job control in the model as organizational support did although it was
not at a significant level. The other parameters also showed stable values of standard
errors. However, concerning function of support, most parameters had abnormally big
standard errors with the exception of organizational support. This means that the
variables in the model were poorly explained by function of support. In fact, no functions
of support by supervisor or coworker were related to work stress. This implies that the
effect of support was little influenced by the function of support. Other work stress and
social support studies reported similar findings to this study (Baker, Israel, & Schurman,
1996; Boxer & Wild, 1993; Havlovic & Keenan, 1991). Baker, Israel, and Schurman
(1996) found that psychological strains were different by source of support but not by
function of support. They found that supervisor support had beneficial effects on
psychological strain, but coworker support did not.
From a measurement perspective, House (1981) mentioned that it was not easy to
clearly conceptualize one support as distinct from another by function. Deeter-Schmelz
and Ramsey (1997) found some evidence of this point and discussed that validity of
social support instruments could be less stable by function than by source in an

87
evaluation study. House and Wills (1978) conducted a pioneering study of social support
instruments and many subsequent social support instruments in occupational health
research were developed or modified based on House and Will’s instrument. This current
study also failed to discriminate between the four functions. Emotion support and
appraisal support clustered in a factor, and information support and material support
creased another factor.
Relationships within the Proposed Work Stress Framework
Although the five work factors were employed in this study based on careful
literature review of work stress and social support, there was no relationship between job
demands, job control, depression, job performance, and absenteeism in the proposed
work stress framework. Some portion of this result could have resulted from insufficient
statistical power.
Study Limitations
This study has several limitations that should be considered. The primary
limitation was small sample size. The minimum preferred sample size to attain sufficient
statistical power in structural equation modeling should have been 340 but only 263
employees finished the survey and only 240 cases were used in the analysis. To minimize
the power problem created by such a small sample size, missing values were controlled
by a multiple imputation technique, allowing 47 cases to be saved. In relation to the
insufficient statistical power, no significant relationships between work stressors,
depression, job performance, and absenteeism were found in this study. Several variables
in the proposed work stress framework had significant relationships with each other in
correlation and regression analyses, but no relationship was found between them in

88
structural equation modeling. Job control revealed a significant correlation with job
performance in correlation statistics. Emotion/appraisal support from coworkers had a
significant relationship with depression in regression analysis although there was no
relationship between them in the structural equation modeling approach. In addition,
there were stronger the relationships between social support and work stress-related
variables in correlation statistics than in the structural equation modeling approach.
Another limitation was related to the measures of social support at work.
Measures of social support by source did not generate many problems. However, by
function, organizational support had some limitations and could not be divided by
function. The original instrument for organizational support was developed using general
rather than specific characteristics of support function. This was in contrast to the
instruments for supervisor support and coworker support which were developed by four
functions of support. Thus, the fourth hypothesis test was not fully examined because
organizational support by function was not available for analysis. Accordingly, it is
necessary to standardize instruments of social support by characteristics, and well-
organized instruments will be a key tool in identifying the characteristics of social
support at work that are important in preventing stress at work.
A final limitation was related to the absence of a pilot survey for this study. The
measurement model in structural equation modeling approach is very important because
the model fit indices are greatly influenced by the measurement model fit and the
measurement model could distort the structural model (Lance & Vandenberg, 2002).
Thus, a pilot survey is important to obtain a good fit of measurement models in structural
equation modeling. However, this study did not conduct a pilot survey because no survey

89
site was available and all instruments of the survey consisted of representative
instruments in each topic area. However, nineteen items (23%) of the total survey were
dropped through confirmatory factor analysis. This result serves as a reminder that survey
instruments need to be confirmed in terms of the fit of their factor loadings with the target
population, particularly in structural equation modeling. Instrument measurement factors,
problematic wordings, and unexpected problems can be detected and fixed through pilot
surveys.
Recommendations
Based on the experience and findings of this study, several recommendations
follow.
For Work Stress Research
Social support at work should be considered in studies examining causes and
effects of work stress. This study found that social support at work had main effects on
job control, depression, and job performance. This means that social support at work
comprehensively affects the entire work stress process and the accurate relationship of
causes and effects of work stress can be confounded by social support if the effect of
social support is not controlled, as noted earlier by House (1981), Karasek (1979), and
Cohen and McKay (1984). Thus, it is desirable to consider the effects of social support in
work stress research even though social support is not a major variable.
Research on organizational support measures should be encouraged in the work
stress area. This study examined three sources of support at work together and found that
organizational support was more predictive of work stress than supervisor and coworker
support. However, the comparison of social support by characteristics was not completely

90
examined in this study because the comparison of social support at work by source was
partially limited by function. Few studies have examined those three sources of support
together. In most cases, organizational support only or supervisor and coworker support
only were tested. No one instrument captures all three sources of support. Supervisor and
coworker support instruments have been developed and tested together for a long time in
health and social science areas, whereas organizational support instruments do not have
such a long history. Therefore, as a next research step in the development of a
comprehensive social support instrument, it is necessary to study organizational support,
not only because current organizational support instruments are more limited than other
support instruments, but also because organizational support was a more effective source
than supervisor and coworker in this study.
For Work Stress Intervention
This study found that organizational support had a greater effect on job control
than supervisor and coworker support. This means that high-level support is more
powerful for changing perceptions of job control in positive ways than low-level support.
Thus, organization-wide programs such as those designed to promote a supportive
climate at work are strongly recommended to work stress prevention. In this study, social
support at work affected the entire work stress framework including work stressors,
psychological strain, and job performance. This result enlarged the significance of
‘helping and supporting climates’ to promote psychological well-being in the worksite. In
worksite health promotion research, work stress has been a main body and organizational
productivity becomes a big issue in both research areas. Building ‘helping and supporting

91
climates’ may produce healthy network strengthening employees to reduce work stress
and to increase worksite health promotion both for and by themselves.
Work stress prevention programs need to be conducted and modified using a
broader worksite health promotion perspective. It is well documented that work stress is
related not only to employees’ health but also to organizational performance. This means
that work stress comprehensively affects organizational life. Accordingly, some
comprehensive intervention strategies should be supplied to reduce work stress and its
negative outcomes. In this study, social support at work affected the entire work stress
framework, including work stressors, psychological strain, and job performance. The
related literature and the findings of this study suggest that work stress negatively
influences the entire well-being of an organization and that social support
comprehensively decreases work stress and its effects (Baker, Israel, & Schurman, 1996;
Iverson, Olekans, & Erwin, 1998). That is, work stress and social support should be
essential components of worksite health promotion and work stress prevention programs.
However, most stress prevention programs in the worksite have been limited to
decreasing physical and psychological symptoms of stress using physical therapy,
education in coping strategies, or counseling for stress prevention. These methods work
only for strain release and can not treat all of the issues around work stress. Therefore,
work stress interventions using high-level support can not only contribute to stress
prevention but also help to promote employee well-being.

92
REFERENCES
Abramis, D. J. (1994). Relationship of job stressors to job performance: Linear or
an inverted-U? Psychological Reports, 75, 547-558.
Arbuckle, J. L. (1996). Full information estimation in the presence of incomplete data. In G.A.Marcoulides & R. E. Schumacker (Eds.), Advanced structural equation modeling: Issues and techniques (pp. 243-278). Mahwah, NJ: Lawrence Erlbaum Publishers.
Armeli, S., Eisenberger, R., Fasolo, P., & Lynch, P. (1998). Perceived organizational support and police performance: The moderating influence of socioemotional needs. Journal of Applied Psychology, 83, 288-297.
Baker, E., Israel, B., & Schurman, S. (1996). Role of control and support in occupational stress: An integrated model. Social Science and Medicine, 43, 1145-1159.
Bandalos, D. L. (1997). Assessing sources of error in structural equation models: The effects of sample size, reliability, and model misspecification. Structural Equation Modeling, 4, 177-192.
Beehr, T. A., Jex, S. M., Stacy, B. A., & Murray, M. A. (2000). Work stressors and coworker support as predictors of individual strain and job performance. Journal of Organizational Behavior, 21, 391-405.
Behrman, D. N. & Perreault, W. D. (1984). A role stress model of the performance and satisfaction of industrial salespersons. Journal of Marketing, 48, 9-21.
Birmaher, B. & Ryan N.D. (1996). Childhood and adolescent depression: A review of the past 10 years. Part 1. Journal of the American Academy of Child and Adolescent Psychiatry, 35, 1427-1439.
Bollen, K. A. (1989). Structural equations with latent variables. New York: Wiley.
Bollen, K. A. & Long, J. S. (1993). Testing Structural Equation Models. Newbury Park, CA: Sage.
Boxer, P. A. & Deanna, W. (1993). Psychological distress and alcohol use among fire fighters. Scandinavian Journal of Environmental Health, 19, 121-125.
Bromet, E. J., Dew, M. A., Parkinson, D. K., & Schulberg, H. C. (1988). Predictive effects of occupational and marital stress on the mental health of a male workforce. Journal of Organizational Behavior, 9, 1-13.

93
Brooke, P. P. & Price, J. L. (1989). The determinants of employee absenteeism: An empirical test of a causal model. Journal of Occupational Psychology, 82, 1-19.
Brown, G. W. & Harris, T. (1978). Social origins of depression: A study of psychiatric disorders in women. London, UK: Taristock.
Browne, M. W. & Cudeck, R. (1993). Alternative ways of assessing model fit. Sociological Methods and Research, 21, 230-258.
Burvill, P. W. (1995). Recent progress in the epidemiology of major depression. Epidemiologic Review, 17, 21-31.
Cahill, J. & Landsbergis, P. A. (1996). Job strain among post office mailhandlers. International Journal of Health Services, 26, 731-750.
Calnan, M., Wainwright, D., Forsyth, M., Wall, B., & Almond, S. (2001). Mental health and stress in the workplace: the case of general practice in the UK. Social Science and Medicine, 52, 499-507.
Caplan, G. (1974). Support systems and community mental health: Lectures on concept development. New York: Behavioral Publications.
Caplan, R. D., Cobb, S., French, J. R. P., Harrison, R. O., & Pinneau, S. R. (1975). Job demands and worker health. (Rep. No. NOISH Publication No. 75-160). Washington, DC: U.S. Government Printing Office.
Caplan, R. D. (1987). Person-Environment fit theory in organizations: Commensurate dimensions, time perspectives, and mechanisms. Journal of Vocational Behavior, 31, 248-267.
Caplan, R. D. & Harrison, R. V. (1993). Person-environment fit theory: Some history, recent developments and future directions. Journal of Social Issues., 49, 253-275.
Carmines, E. G. & McIver, J. P. (1981). Analyzing models with unobserved variables. In Social Measurement: Current Issues. Beverly Hills: Sage.
Cartwright, S., Cooper, C. L., & Murphy, L. R. (1995). Diagnosing a healthy organization: A proactive approach to stress in the workplace. In L.R. Murphy, J. J. Hurrell, & S. L. Sauter (Eds.), Job stress interventions (pp. 217-233). Washington, DC: American Journal of Association.
Chan, L. S., Gliman, J. A., & Dunn, O. J. (1976). Alternative approaches to missing values in discriminant analysis. Journal of the American Statistical Association, 71, 842-844.
Cohen, J. & Cohen, P. (1983). Applied multiple regression/correlation analysis for the behavioral sciences. (2 ed.) Hillsdale, NJ: Lawrence Erlbaum.

94
Cohen, S. & Hoberman, H. (1983). Positive events and social supports as buffers of life change stress. Journal of Applied Psychology, 13, 99-125.
Cohen, S. & McKay, G. (1984). Social support, stress, and the buffering hypothesis: A theoretical analysis. In A. Baum, S. E. Taylor, & J. E. Singer (Eds.), Handbook of psychology and health. (pp. 253-267). Hillsdale, NJ: Lawrence Erlbaum Associates, Inc.
Cohen, S. & Wills, T. A. (1985). Stress, social support, and the buffering hypothesis. Psychological Bulletin, 98, 310-357.
Cohen, S. (1988). Psychosocial models of the role of social support in the etiology of physical disease. Health Psychology, 7, 269-297.
Cohen, S., Schwartz, J. E., Bromet, E. J., & Parkinson, D. K. (1991). Mental health, stress, and poor health behaviors in two community samples. Preventive Medicine, 20, 306-315.
Conti, D. J. & Burton, W. N. (1994). The economic impact of depression in a workplace. Journal of Occupational Medicine, 36, 983-988.
Dean, A. & Ensel, W. M. (1982). Modeling social support, life events, competence, and depression in the context of age and sex. Journal of Community Psychology, 10, 392-407.
Deeter-Schmelz, D. R. & Ramsey, R. P. (1997). Considering sources and types of social support: A psychometric evaluation of the House and Wells (1978) instrument. Journal of Personal Selling & Sales Management, 17, 49-61.
Du Toit, M. & Du Toit, S. (2001). Interactive LISREL: User's guide. Lincolnwood, IL: Scientific Software International, Inc.
Dwyer, D. J. & Ganster, D. C. (1991). The effects of job demands and control on employee attendance and satisfaction. Journal of Organizational Behavior, 12, 595-608.
Eaton, W. W., Anthony, J. C., Mandel, W., & Garrison, R. (1990). Occupations and the prevalence of major depressive disorder. Journal of Occupational Medicine, 32, 1079-1087.
Edwards, J. R., Caplan, R. D., & Harrison, R. (1998). Person-Environment fit theory: conceptual foundation, empirical evidence, and directions for future research. In C.L. Cooper (Ed.), Theories of organizational stress. (pp. 28-67). New York: Oxford University Press.
Eisenberger, R., Cummings, J., Armeli, S., & Lynch, P. (1997). Perceived organizational support, discretionary treatment, and job satisfaction. Journal of Applied Psychology, 82, 812-820.

95
Firth-Cozens, J. (1998). Individual and organizational predictors of depression in general practitioners. British Journal of General Practice, 48, 1647-1651.
Ganster, D. C. (1989). Worker control and well-being: A review of research in the workplace. In S.L. Sauter, J. J. Hurrell, & C. L. Cooper (Eds.), Job control and worker health (pp. 3-23). New York: John Wiley & Sons.
Goodwin, R. (1992). Stress and sickness absence. Manchester, UK: Greater Manchester Industrial Mission (GMIM).
Gottlieb, B. H. (1978). The development and application of a classification scheme of informal helping behaviors. Canadian Journal of Behavioral Science, 10, 105-115.
Greenberg, P. E., Kessler, R. C., Nells, T. L., Finkelstein, S. N., & Berndt, E. R. (1996). Depression in the workplace: an economic perspective. In J.P. Feighner & W. F. Boyer (Eds.), Selective serotonin re-uptake inhibitors: Advances in basic research and clinical practice. (2 ed., pp. 327-363). New York: Wiley & Sons.
Grosch, J. W. & Murphy, L. R. (1998). Occupational differences in depression and global health: Results from a national sample of US workers. Journal of Occupational and Environmental Medicine, 40, 153-164.
Grunberg, L., Anderson-Connolly, R., & Greenberg, E. (2000). Surviving layoffs. Work and Occupations, 27, 7-31.
Havlovic, S. J. & Keenan, J. P. (1991). Coping with work stress: The influence of individual differences. Journal of Social Behavior and Personality, 6, 199-212.
Heaney, C. A. (1991). Enhancing social support at the workplace: Assessing the effects of the caregiver support program. Health Education Quarterly, 18, 477-494.
Heaney, C. A., Israel, B. A., Schurman, S. J., Baker, E. A., House, J. S., & Hugentobler, M. (1993). Industrial relations, worksite stress reduction, and employee well-being: A participatory action research investigation. Journal of Organizational Behavior, 14, 495-510.
Hellerstedt, W. L. & Jeffery, R. W. (1997). The association of job strain and health behaviours in men and women. International Journal of Epidemiology, 26, 575-583.
Hemmingsson, T. & Lundberg, I. (1998). Wok control, work demands, and work social support in relation to alcoholism among young men. Alcoholism: Clinical and Experimental Research, 22, 921-927.

96
House, J. S. & Wills, J. A. (1978). Occupational stress, social support, and health. In G. McLean, G. Black, & M. Colligan (Eds.), (pp. 8-29). DHEW (NIOSH) Publication.
House, J. S., Wills, J. A., Landerman, L. R., McMichael, A. J., & Kaplan, B. H. (1979). Occupational stress and health among factory workers. Journal of Health and Social Behavior, 20, 139-160.
House, J. S. (1981). Work stress and social support. Massachusetts: Addison-Wesley Publishing Company.
House, J. S., Landis, K. R., & Umberson, D. (1988). Social relationships and health. Science, 241, 540-544.
Hu, L. & Bentler, P. M. (1993). Evaluating model fit. In R.H. Hoyle (Ed.), Structural equation modeling: concepts, issues, and applications. ( Newbury Park, CA: Sage.
Hu, L. & Bentler, P. M. (1999). Cutoff criteria for fit indexes in covariance structure analysis: Conventional criteria versus new alternatives. Structural Equation Modeling, 6, 1-55.
Hurrell, J. J. (1985). Machine-paced work and the type A behavior pattern. Journal of Occupational Psychology, 58, 15-25.
Hurrell, J. J. & Murphy, L. R. (1996). Occupational stress intervention. American Journal of Industrial Medicine, 29, 338-341.
Hutchison, S. & Garstka, M. L. (1996). Sources of perceived organizational support: Goal setting and feedback. Journal of Applied Social Psychology, 26, 1351-1366.
Hutchison, S. (1997). A path model of perceived organizational support. Journal of Social Behavior and Personality, 12, 159-174.
Israel, B. A., House, J. S., Schurman, S. J., Heaney, C. A., & Mero, R. P. (1989). The relation of personal resources, participation, influence, interpersonal relationships and coping strategies to occupational stress, job strains and health: a multivariate analysis. Work & Stress, 3, 163-194.
Israel, B. A., Schurman, S. J., & House, J. S. (1989). Action research on occupational stress: Involving workers as researchers. International Journal of Health Services, 19, 135-155.
Iverson, R. D., Olekalns, M., & Erwin, P. J. (1998). Affectivity, organizational stressors, and absenteeism: A causal model of burnout and its consequences. Journal of Vocational Behavior, 52, 1-23.

97
James, L. R., James, L. A., & Ashe, D. K. (1990). The meaning of organizations: The role of cognitions and values. In B. Schneider (Ed.), Organizational climate and culture . San Francisco: Jossey-Bass.
Johnson, G. D., Thomas, J. S., & Riordan, C. A. (1994). Job stress, social support, and health amongst shrimp fishermen. Work & Stress, 8, 343-354.
Jorëskog, K. & Sörbom, D. (1996). LISREL 8: User's reference guide. Chicago: Scientific Software International.
Kandel, D. B., Davies, M., & Raveis, V. H. (1985). The stressfulness of daily social roles for women: Marital, occupational and household roles. Journal of Health and Social Behavior, 26, 64-78.
Karasek, R., Brisson, C., Kawakami, N., Houtman, I., Bongers, C., & Amick, B. (1998). The Job Content Questionnaire (JCQ): An instrument for internationally comparative assessments of psychosocial job characteristics. Journal of Occupational Health Psychology, 3, 322-355.
Karasek, R. A. (1979). Job demands, job decision latitude, and mental strain: Implications for job redesign. Administrative Science Quarterly, 24, 285-308.
Karasek, R. A. & Theorell, T. (1990). Healthy work: Stress, productivity and the reconstruction of working life. New York: John Wiley & Sons.
Kessler, R. C., Barber, C., Birnbaum, H. G., Frank, R. G., Greenberg, P. E., Rose, R. M., Simon, G. E., & Wang, P. (1999). Depression in the workplace: Effects on short-term disability. Health Affairs, 18, 163-171.
Kline, M. L. & Snow, D. L. (1994). Effects of a worksite coping skills intervention on the stress, social support, and health outcomes of working mothers. The Journal of Primary Prevention, 15, 105-121.
Koslowsky, M. (1998). Theories of organizational stress. In M. Koslowsky (Ed.), Modeling the stress-strain relationship in work settings. (pp. 8-29). New York: Routledge.
Kristensen, T. S. (1991). Sickness absence and work strain among Danish slaughterhouse workers: An analysis of absence from work regarded as coping behavior. Social Science and Medicine, 32, 15-27.
Lance, C. E. & Vandenberg, R. J. (2002). Confirmatory factor analysis. In F. Drasgow & N. Schmitt (Eds.), Measuring and analyzing behavior in organizations: Advances in measurement and data analysis (pp. 221-254). San Francisco: Jossey-Bass.
Landsbergis, P. A. (1988). Occupational stress among health care workers: A test of the job demands-control model. Journal of Organizational Behavior, 9, 217-239.

98
LaRocco, J. M., House, J. S., & French, J. R. P. (1980). Social support, occupational stress, and health. Journal of Health and Social Behavior, 21, 202-218.
Lin, N., Simeone, R. L., Ensel, W. M., & Kuo, W. (1979). Social support, stressful life events and illness: A model and an empirical test. Journal of Health and Social Behavior, 20, 108-119.
Little, R. J. A. & Rubin, D. B. (1987). Statistical analysis with missing data. New York: Wiley.
Luoto, R., Roikolainen, K., & Uutela, A. (1998). Unemployment, sociodemographic background and consumption of alcohol before and during the economic recession of the 1990s in Finland. International Journal of Epidemiology, 27, 623-629.
MacCallum, R. C., Browne, M. W., & Sugawara, H. M. (1996). Power analysis and determination of sample size for covariance structure modeling. Psychological Methods, 1, 130-149.
Maciejewski, P. K., Prigerson, H. G., & Mazure, C. M. (2000). Self-efficacy as a mediator between stressful life events and depressive symptoms. British Journal of Psychiatry, 176, 373-378.
Marmot, M. (1994). Work and other factors influencing coronary health and sickness absence. Work & Stress, 8, 191-201.
Marsh, H. W., Balla, J. R., & McDonald, R. P. (1988). Goodness-of-fit indices in confirmatory factor analysis: The effect of sample size. Psychological Bulletin, 102, 391-410.
Mausner-Dorsch, H. & Eaton, W. W. (2000). Psychosocial work environment and depression: Epidemiologic assessment of the demand-control model. American Journal of Public Health, 90, 1765-1770.
McDonald, R. P. & Marsh, H. W. (1990). Choosing a multivariate model: Noncentrality and goodness of fit. Psychological Bulletin, 107, 247-255.
Medsker, G. J., Williams, L. J., & Holahan, P. J. (1994). A review of current practices for evaluating causal models in organizational behavior and human resources management research. Journal of Management, 20, 439-464.
Michie, S. (1996). Reducing absenteeism by stress management: Valuation of a stress counseling service. Work & Stress, 10, 367-372.
Murphy, L. R. (1996). Stress management in work settings: A critical review of the health effects. American Journal of Health Promotion, 11, 112-135.

99
Narrow, W. E. (1998). One-year prevalence of depressive disorders among adults 18 and over in the U.S.: NIMH ECA prospective data. Population estimates based on U.S. Census estimated residential population age 18 and over. National Institute of Mental Health.
National Institute of Mental Health (2001). The invisible disease: Depression. (Rep. No. NIH Publication No.01-4591). Bethesda, MD: National Institute of Health. Retrieved August 8, 2001, from the World Wide Web: http://www.nimh.nih.gov/publicat/ invisible.cfm
Nelson, D. L. & Quick, J. C. (1991). Social support and newcomer adjustment in organizations: attachment theory at work? Journal of Organizational Behavior, 12, 543-554.
Norusis, M. J. (1997). SPSS Base 8.0 User's Guide. Chicago: SPSS.
Parker, P. A. & Kulik, J. A. (1995). Burnout, self- and supervisor-rated job performance, and absenteeism among nurses. Journal of Behavioral Medicine, 18, 581-599.
Pohorecky, L. A. (1991). Stress and alcohol interaction: An update of human research. Alcoholism: Clinical and Experimental Research, 15, 438-459.
Radloff, L. S. (1977). The CES-D scale: A self-report depression scale for research in the general population. Applied Psychological Measurement, 1, 385-401.
Roth, P. L. (1994). Missing data: A conceptual review for applied psychologists. Personnel Psychology, 47, 537-560.
Roth, P. L., Switzer III, F. S., & Switzer, D. M. (1999). Missing data in multiple item scales: A Monte Carlo analysis of missing data techniques. Organizational Research Methods, 2, 211-232.
Santor, D. A. & Coyne, J. C. (1997). Shortening the CES-D to improve its ability to detect cases of depression. Psychological Assessment, 9, 233-243.
Sauter, S. L., Murphy, L. R., & Hurrell, J. J. (1990). Prevention of work related psychological distress: A national strategy proposed by the National Institute of Occupational Safety and Health. American Psychologist, 45, 1146-1158.
Schaefer, C., Coyne, J. C., & Lazarus, R. S. (1981). The health-related functions of social support. Journal of Behavioral Medicine, 4, 381-406.
Schaubroeck, J. & Merritt, D. E. (1997). Divergent effects of job control on coping with work stressors: The key role of self-efficacy. Academy of Management Journal, 40, 738-754.

100
Schaubroeck, J. & Fink, L. S. (1998). Facilitating and inhibiting effects of job control and social support on stress outcomes and role behavior: a contingency model. Journal of Organizational Behavior, 19, 167-195.
Schechter, J., Green, L. W., Olsen, L., Kruse, K., & Cargo, M. (1997). Application of Karasek's demand/control model in a Canadian occupational setting including shift workers during a period of reorganization and downsizing. American Journal of Health Promotion, 11, 394-399.
Sheffield, D., Dobbie, D., & Carroll, D. (1994). Stress, social support, and psychological and physical well-being in secondary school teachers. Work & Stress, 8, 235-243.
Spector, P. E. (1986). Perceived control by employees: A meta-analysis of studies concerning autonomy and participation at work. Human Relations, 39, 1005-1016.
Stansfeld, S. A., Bosma, H., Hemingway, H., & Marmot, M. G. (1998). Psychosocial work characteristics and social support as predictors of SF-36 health functioning: The Whitehall II study. Psychosomatic Medicine, 60, 247-255.
Steiger, J. H. (1990). Structural model evaluation and modification: An interval estimation approach. Multivariate Behavioral Research, 25, 173-180.
Stewart, W. & Barling, J. (1996). Daily work stress, mood and interpersonal job performance: a mediational model. Work & Stress, 10, 336-351.
Tausig, M. (1982). Measuring life events. Journal of Health and Social Behavior, 23, 52-64.
Terborg, J. R., Hibbard, J., & Glasgow, R. E. (1995). Behavior change at the worksite: Does social support make a difference? American Journal of Health Promotion, 10, 125-131.
Theorell, T. & Karasek, R. (1996). Current issues relating to psychosocial job strain and cardiovascular disease research. Journal of Occupational Health Psychology, 1, 9-26.
Theorell, T. (1998). Job characteristics in a theoretical and practical health context. In C.L. Cooper (Ed.), Theories of organizational stress. (pp. 205-219). New York: Oxford University Press.
Tucker, L. & Lewis, C. (1973). A reliability coefficient for maximum likelihood factor analysis. Psychometrika, 38, 1-10.
Unden, A. (1996). Social support at work and its relationship to absenteeism. Work & Stress, 10, 46-61.

101
Vandenberg, R. J. & Scarpello, V. (1990). The matching model: An examination ofthe processes underlying realistic job previews. Journal of Applied Psychology, 75, 60-67.
Vermeulen, M. & Mustard, C. (2000). Gender differences in job strain, social support at work, and psychological distress. Journal of Occupational Health Psychology, 5, 428-440.
Wilcox, B. L. & Vernberg, E. M. (1985). Conceptual and theoretical dilemmas facing social support research. In I.G. Sarason & B. R. Sarason (Eds.), Social support: Theory, research, and applications. (pp. 3-20). Boston, MA: Martinus Nijhoff Publishers.
Williams, L. J. & Hazer, J. R. (1986). Antecedents and consequences of satisfaction and commitment in turnover models: A reanalysis using latent variable structural equation methods. Journal of Applied Psychology, 71, 219-231.
Wilson, M. G., Dejoy, D. M., Vandenberg, R. J., Richardson, H., & McGrath, A. L. Work characteristics and employee health and well-being: Test of a model of healthy work organization. Journal of Occupational Health Psychology (in press).

102
APPENDIX A
SURVEY QUESTIONNAIRE

103
September 10, 2001 Dear employees:
Georgia Regional Hospital continually strives to provide the best possible workplace for our employees. We have been given the opportunity to participate in a survey that will evaluate the work stress and social support of our workplace. The Workplace Health Group at the University of Georgia will administer the survey and tabulate the results. The objective of the survey is to explore work stress and social support at work.
What to Expect When Filling out the Survey
1. The survey will take approximately 10-15 minutes to complete. 2. This is an anonymous survey; nobody from Georgia Regional will ever see your survey
results. Georgia Regional will only be given results in summary form, and will not know who completed the survey.
3. After you complete the survey, place it in the return boxes located around the Nursery room or the Entry in Children’s Unit, Administration, Developmental Learning Center, Forensic I, Forensic II, Skilled Unit, Cafeteria, Housekeeping, and Engineering & Maintenance buildings.
4. The surveys will be sent directly to a data entry expert in the University of Georgia where the data will be entered and summarized.
Completion of this questionnaire is entirely voluntary and you can withdraw your consent at any time and have the results of this participation, to the extent that it can be identified as yours, removed from the research record, or destroyed.
No discomforts, stresses, or risks are foreseen, and completing or not completing this questionnaire will not affect your job standing. The results of this participation will be confidential and will not be released in any individually identifiable form without your prior consent, unless otherwise required by law. All records containing individual data pertinent to this research will be maintained at the University of Georgia.
The researchers will answer any further questions about the research, now or during the course of the project, and can be reached by telephone at (706) 583-0692.
Thank you for taking the time to share your most honest answers and views. Your input will
help Georgia Regional be the best employer possible and will help to create a better working environment.
Sincerely,
Kyoung-Ok Park Mark G. Wilson, HSD
Research Assistant Associate Professor
Research at the University of Georgia that involves human participants is overseen by the Institutional Review board. Questions or problems regarding your rights as a participant should be addressed to Chris A. Joseph, Ph.D., Institutional Review Board, Office of the Vice President for Research, University of Georgia, 606A Boyd Graduate Studies Research Center, Athens, Georgia 30602-7411; Telephone (706) 542-6514; E-Mail Address [email protected].

104
GENERAL INSTRUCTION: Please answer each question or statement by Circling ONE number of
THE RESPONSE which best represents your opinion. If none of the choices fits exactly, choose
the option that comes closest. Please answer all questions in each part of the survey. There are
no right or wrong answers, and it is very important that you answer each question as honestly as
possible. YOUR RESPONSES WILL BE KEPT STRICTLY CONFIDENTIAL.
-------------------------------------------------------------------------------------------------------------------------------- SAMPLE QUESTION:
1=Disagree strongly 2=Disagree 3=Neutral 4=Agree 5=Agree strongly
1. I can learn new things. 1 2 3 4 5
--------------------------------------------------------------------------------------------------------------------------------
Please respond to each statement in terms of how it applies to your organization.
1=Disagree strongly 2=Disagree 3=Neutral 4=Agree 5=Agree strongly
1. My organization values my contribution to its success. 1 2 3 4 5
2. My organization cares about my opinions. 1 2 3 4 5
3. My organization really cares about my well-being. 1 2 3 4 5
4. My organization definitely considers my goals and values. 1 2 3 4 5
5. Help is available from my organization when I have a problem at work. 1 2 3 4 5
6. My organization cares about my general satisfaction at work. 1 2 3 4 5
7. My organization takes pride in my accomplishments at work. 1 2 3 4 5
8. My organization tries to make my job as interesting as possible. 1 2 3 4 5
9. My organization is willing to help me if I need a special favor. 1 2 3 4 5
Please, respond to each statement in terms of how it applies to Your Immediate Supervisor and Coworkers during the last Four weeks. (Circle one number per item.)
1=Not at all 2=A little 3=Some 4=Quite a bit 5=A great deal
10. My supervisor gave me useful information. 1 2 3 4 5
11. My supervisor showed me care and concern. 1 2 3 4 5
12. My supervisor gave me help in thinking through a problem. 1 2 3 4 5 13. My supervisor gave me help in getting the materials, supplies, or services I needed to do my job well. 1 2 3 4 5
14. My supervisor gave me praise and showed appreciation toward me. 1 2 3 4 5
15. My supervisor gave me criticism that wasn't helpful. 1 2 3 4 5
16. My supervisor undermined or undercut my efforts. 1 2 3 4 5

105
1=Not at all 2=A little 3=Some 4=Quite a bit 5=A great deal
17. My coworkers gave me useful information. 1 2 3 4 5
18. My coworkers showed me care and concern. 1 2 3 4 5
19. My coworkers gave me help in thinking through a problem. 1 2 3 4 5 20. My coworkers gave me help in getting the materials, supplies, or services I needed to do my job well. 1 2 3 4 5
21. My coworkers gave me praise and showed appreciation toward me. 1 2 3 4 5
22. My coworkers gave me criticism that wasn't helpful. 1 2 3 4 5
23. My coworkers undermined or undercut my efforts. 1 2 3 4 5
Please respond to each statement in terms of what your job requires you to do.
1=Rarely 2=Occasionally 3=Sometimes 4=Fairly often 5=Very often
24. My job requires that I work fast. 1 2 3 4 5
25. My job requires that I work hard. 1 2 3 4 5
26. I have enough time to get the job done. 1 2 3 4 5
27. I am not asked to do an excessive amount of work. 1 2 3 4 5
28. My job is very hectic. 1 2 3 4 5
29. I am free from conflicting demands that others make. 1 2 3 4 5
30. I need to concentrate intensely on my job. 1 2 3 4 5
31. I have some tasks that are suddenly interrupted. 1 2 3 4 5
32. I often need to wait on others to finish a job I am working on. 1 2 3 4 5
Please respond to each statement in terms of How you control your job.
1=Not at all 2=A little 3=Some 4=Quite a bit 5=A great deal
33. I have control over the variety of methods I use in completing my work. 1 2 3 4 5
34. I can choose among a variety of tasks or projects to do. 1 2 3 4 5
35. I have control personally over the quality of my work. 1 2 3 4 5
36. I generally predict the amount of work I have to do on any given day. 1 2 3 4 5
37. I have control personally over how much work I get done. 1 2 3 4 5
38. I have control over how quickly or slowly I have to work. 1 2 3 4 5
39. I have control over the scheduling and duration of my rest breaks. 1 2 3 4 5
40. I have control over when I come to work and leave. 1 2 3 4 5
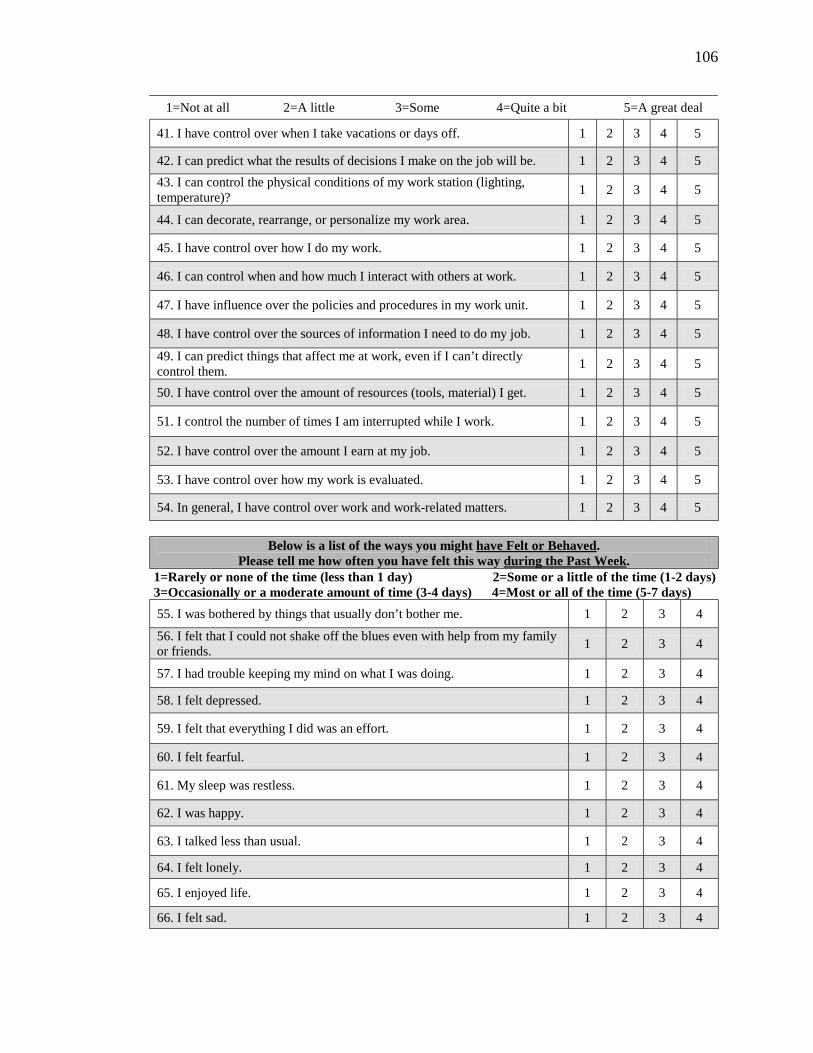
106
1=Not at all 2=A little 3=Some 4=Quite a bit 5=A great deal 41. I have control over when I take vacations or days off. 1 2 3 4 5
42. I can predict what the results of decisions I make on the job will be. 1 2 3 4 5 43. I can control the physical conditions of my work station (lighting, temperature)? 1 2 3 4 5
44. I can decorate, rearrange, or personalize my work area. 1 2 3 4 5
45. I have control over how I do my work. 1 2 3 4 5
46. I can control when and how much I interact with others at work. 1 2 3 4 5
47. I have influence over the policies and procedures in my work unit. 1 2 3 4 5
48. I have control over the sources of information I need to do my job. 1 2 3 4 5
49. I can predict things that affect me at work, even if I can’t directly control them. 1 2 3 4 5
50. I have control over the amount of resources (tools, material) I get. 1 2 3 4 5
51. I control the number of times I am interrupted while I work. 1 2 3 4 5
52. I have control over the amount I earn at my job. 1 2 3 4 5
53. I have control over how my work is evaluated. 1 2 3 4 5
54. In general, I have control over work and work-related matters. 1 2 3 4 5
Below is a list of the ways you might have Felt or Behaved. Please tell me how often you have felt this way during the Past Week.
1=Rarely or none of the time (less than 1 day) 2=Some or a little of the time (1-2 days) 3=Occasionally or a moderate amount of time (3-4 days) 4=Most or all of the time (5-7 days)
55. I was bothered by things that usually don’t bother me. 1 2 3 4
56. I felt that I could not shake off the blues even with help from my family or friends. 1 2 3 4
57. I had trouble keeping my mind on what I was doing. 1 2 3 4
58. I felt depressed. 1 2 3 4
59. I felt that everything I did was an effort. 1 2 3 4
60. I felt fearful. 1 2 3 4
61. My sleep was restless. 1 2 3 4
62. I was happy. 1 2 3 4
63. I talked less than usual. 1 2 3 4
64. I felt lonely. 1 2 3 4
65. I enjoyed life. 1 2 3 4
66. I felt sad. 1 2 3 4

107
The following questions ask you about your Background and demographic information. Please answer each question by circling according to how it applies to you personally.
67. How long have you worked for Georgia Regional Hospital? ( ) years ( ) months
68. What is your age? ( ) years old
69. What is your gender? !! Male !" Female
70. What is your marital status? !!Single (Never married) !"Divorced/Separated/Widowed !#Married/Living with partner
71. What is your Job position? !! Nursing (RN, LPN)
!" Support staff (for example: food service, housekeeping, maintenance)
!# Administration
!$ Technicians (for example: health service, forensic, pharmacy)
!% Physicians
!& Program assistants / associates
!' Other (please specify): ___________________________
72. What is your job status? !! Full-time !" Part-time
73. On your last performance evaluation, your supervisor rated your performance as: !! Outstanding !$ Satisfactory !" Very good !% Unsatisfactory !# Good !& Don’t know/unsure
74. How would you have rated your performance on your last performance appraisal? !! Outstanding !$ Satisfactory !" Very good !% Unsatisfactory !# Good !& Don’t know/unsure 75. What proportion of your working hours did you work to your full potential during the last TWO weeks? !! 90% or more/ nearly all the time !# 50-74%/ some of the time !" 75-89%/ most of the time !$ less then 50% /not much of the time 76. During the Past 3 months, how many days were you absent when you had been scheduled to work? (For example, one absence for three-day period equals three days.) ( ) days
77. Among your total absent days during the Past 3 months, how many days were you absent due to sickness when you had been scheduled to work? (For example, one absence for three-day period equals three days.) ( ) days

108
In each of the following areas, how much stress have you experienced in the Past Six Months?
1=Not at all 2=A little 3=Some 4=Quite a bit 5=A great deal
78. Spouse / Partner (divorce, separation, discord, disease, death, and so on) 1 2 3 4 5
79. Family (discord, disease, death, and so on with a parent, child, or relatives) 1 2 3 4 5
80. Friends (discord, disease, death, and so on) 1 2 3 4 5
81. Financial problems 1 2 3 4 5
82. Health problems 1 2 3 4 5
83. Legal problems 1 2 3 4 5
84. Traumatic experiences (robbery, mugging, physical attack, threat, and so on) 1 2 3 4 5
Thank you for taking the time to share your HONEST answers and views. ☺☺
Please, PUT the completed survey in an Envelope and PLACE it to the Secured Return Boxes (around Nursery room or Entry) in the Designated Buildings.
Location of Survey Boxes
Children’s Unit building
Administration Office building
Developmental Learning Center (DLC) building
Forensic I building
Forensic II building
Skilled Unit building
Cafeteria building
Housekeeping building
Engineering & Maintenance building
Georgia Regional creates ‘Healthy Work Environments’ for you with Your Strong Support like this. Thanks again!! ☺☺

109
APPENDIX B
EFFECTS OF DEMOGRAPHIC VARIABLES AND STRESSFUL LIFE EVENTS ON
DEPRESSION: REGRESSION ANALYSIS

110
The effects of demographics and stressful life events on depression
Variables B Beta (Standardized) t p
(Constant)
Duration of work
Age
Gender
Marital status
Stress1 (spouse)
Stress2 (family)
Stress3 (friends)
Stress4 (financial)
Stress5 (health)
Stress6 (legal)
Stress7 (Traumatic)
11.541
-.004
.003
1.431
.258
.169
-.080
.300
.103
.195
.350
.323
-.087
.007
.125
.040
.037
-.021
.062
.027
.045
.040
.056
4.707
-1.098
.088
1.679
.515
.446
-.233
.675
.302
.550
.479
.747
.000
.274
.930
.095
.607
.656
.816
.501
.763
.583
.632
.456
F(181,11) = .723, p = .715

111
APPENDIX C
MEASUREMENT MODELS FOR HYPOTHESIS TESTS

App
endi
x C
.1. T
he m
easu
rem
ent m
odel
for H
ypot
hesi
s 1
0
ε
2
ε
3 …
..
ε9
0
ε11
ε
12
ε
13
ε14
0
ε
16
ε17
ε1
8
ε
19
↓
↓
↓
↓
↓
↓
↓
↓
↓
↓
↓
↓
↓
↓
…
..
1
λ
2
λ
3…..
λ9
1
λ11
λ
12
λ13
λ14
1
λ16
λ1
7
λ18
λ
19
O
RG
AN
IZA
TIO
NA
SU
PPO
RT
SU
PER
VIS
OR
SU
PPO
RT
CO
WO
RK
ER S
UPP
OR
T
1
γ2
γ3
S
OC
IAL
SUPP
OR
T A
T W
OR
K
0
→
1
λ21
.
775
ε21
→
JO
B D
EMA
ND
S
JO
B P
ERFO
RM
AN
CE
←.4
0
ε22
→
λ
22
:
D
EPR
ESSI
ON
:
:
:
λ26
.7
75
:
:
JOB
CO
NTR
OL
..…
AB
SEN
TEEI
SM
←
.41
ε26
→
1
λ
28
λ29
λ
39
1
λ
41
λ42
λ48
..…
..…
…
..
↑
↑
↑
↑
↑
↑
↑
↑
0
ε28
ε29
…
..
ε39
0
ε4
1
ε
42
…..
ε4
8
Y1
Y2
Y3
Y9
Y10
Y11
Y12
Y13
Y14
Y15
Y16
Y17
Y18
Y19
Y20
Y21
Y22
Y26
Y27
Y28
Y29
Y39
Y40
Y41
Y42
Y48
Y49
Y50

App
endi
x C
.2. T
he m
easu
rem
ent m
odel
for H
ypot
hesi
s 2
Hig
h su
ppor
t gro
up
0
→
1
JO
B D
EMA
ND
S
.7
75
ε H
2 →
λ
H2
JO
B P
ERFO
RM
AN
CE
←.4
0
D
EPR
ESSI
ON
0 →
1
1
λ H
7
.
775
ε H4 →
J
OB
CO
NTR
OL
A
BSE
NTE
EISM
←.4
1
λ H
4
ε H
5 →
λ
H5
↑
↑
0
ε H
7
L
ow su
ppor
t gro
up
0
→
1
JO
B D
EMA
ND
S
.7
75
ε L
2 →
λ
L2
J
OB
PER
FOR
MA
NC
E
←
.40
DEP
RES
SIO
N
0
→
1
1
λ L7
.775
ε
L4 →
J
OB
CO
NTR
OL
A
BSE
NTE
EISM
←
.41
λ
L4
ε
L5 →
λ
L5
↑
↑
0
ε
L7
Y1
Y2
Y3
Y4
Y5
Y6
Y7
Y8
Y9
Y2
Y3
Y4
Y5
Y6
Y7
Y8
Y9
Y1

App
endi
x C
.3. T
he m
easu
rem
ent m
odel
for H
ypot
hesi
s 3
0
ε2
ε3
…..
ε
9
0
ε
11
ε12
ε13
ε1
4
0
ε16
ε1
7
ε18
ε19
↓
↓
↓
↓
↓
↓
↓
↓
↓
↓
↓
↓
↓
↓
…..
1
λ2
λ
3…..
λ9
1
λ11
λ1
2 λ
13
λ14
1
λ
16
λ17
λ
18
λ19
OR
GA
NIZ
ATI
ON
A S
UPP
OR
T
S
UPE
RV
ISO
R S
UPP
OR
T
C
OW
OR
KER
SU
PPO
RT
0 →
1
.77
5
ε21
→
JO
B D
EMA
ND
S
JO
B P
ERFO
RM
AN
CE
←.4
0
λ21
ε
22 →
λ22
:
DEP
RES
SIO
N
:
:
:
λ2
6
.775
:
:
JO
B C
ON
TRO
L
.
.…
A
BSE
NTE
EISM
←.4
1 ε
26 →
1
λ28
λ
29
λ39
1
λ41
λ
42
λ
48
..…
..…
…..
↑
↑
↑
↑
↑
↑
↑
↑
0
ε2
8
ε
29
…..
ε
39
0
ε41
ε42
…
..
ε48
Y1
Y2
Y3
Y9
Y10
Y11
Y12
Y13
Y14
Y15
Y16
Y17
Y18
Y19
Y20
Y21
Y22
Y26
Y27
Y28
Y29
Y39
Y40
Y41
Y42
Y48
Y49
Y50

App
endi
x C
.4. T
he m
easu
rem
ent m
odel
for H
ypot
hesi
s 4
Not
e. I&
M =
Info
rmat
ion
and
mat
eria
l sup
port,
E&
A =
Em
otio
n an
d ap
prai
sal s
uppo
rt
0
ε2
ε3
…..
ε
9
0
ε
11
ε12
0
ε
14
0
ε
16
ε17
0
ε
19
↓
↓
↓
↓
↓
↓
↓
↓
↓
↓
↓
↓
↓
↓
…
..
1
λ2
λ3…
..
λ9
1
λ11
λ1
2
1
λ
14
1
λ16
λ1
7
1
λ
19
OR
GA
NIZ
ATI
ON
A S
UPP
OR
T S
UPE
RV
ISO
R’S
I&M
SU
PER
VIS
OR
’S E
&A
CO
WO
RK
ER’S
I&M
CO
WO
RK
ER’S
E&
A
0 →
1
.77
5 ε
21 →
λ21
JO
B D
EMA
ND
S
JO
B P
ERFO
RM
AN
CE
←.4
0
ε22
→
λ
22
:
D
EPR
ESSI
ON
:
:
:
λ26
.7
75
:
:
JOB
CO
NTR
OL
..…
AB
SEN
TEEI
SM
←
.41
ε26
→
1
λ
28
λ29
λ
39
1
λ
41
λ42
λ48
..…
..…
…
..
↑
↑
↑
↑
↑
↑
↑
↑
0
ε28
ε29
…
..
ε39
0
ε4
1
ε
42
…..
ε4
8
Y1
Y2
Y3
Y9
Y10
Y11
Y12
Y13
Y14
Y15
Y16
Y17
Y18
Y19
Y20
Y21
Y22
Y26
Y27
Y28
Y29
Y39
Y40
Y41
Y42
Y48
Y49
Y50