Embed Size (px)
Citation preview

i
JOB SATISFACTION AND JOB PERFORMANCE DURING THE IMPLEMENTATION OF A
PERFORMANCE MANAGEMENT SYSTEM: THE CASE OF A NAMIBIAN MUNICIPALITY
by
FILLEMON NANGOLO HAMBUDA
The thesis submitted in fulfilment of the requirements for the degree
Master of Technology: Human Resource Management
in the Faculty of Business and Management Sciences
at the Cape Peninsula University of Technology
Supervisor: AA RUST
Cape Town campus
Date submitted 15 September 2017
CPUT Copyright information The thesis may not be published either in part (in scholarly, scientific or technical journals), or as a whole (as a monograph), unless permission has been obtained from the University

ii
DECLARATION I, Fillemon Nangolo Hambuda, declare that the contents of this thesis represent my own unaided work, and that the thesis has not previously been submitted for academic examination towards any qualification. Furthermore, it represents my own opinions and not necessarily those of the Cape Peninsula University of Technology.
Signed Date

iii
ABSTRACT
The primary objective of the current study was to conduct a survey on the job satisfaction of
line managers in the City of Windhoek (CoW) Municipality. The identifying of such variables
could empower the CoW Municipality to develop programmes and policies that are designed
to improve their job satisfaction levels.
The literature review confirmed the impact of motivation on the job satisfaction of employees,
and, in turn, its impact on employee productivity, and, ultimately, on organisational
performance. The level of job satisfaction experienced by an individual describes how content
he or she is with his or her job. The purpose of this study was to measure the job satisfaction
facets (supervision, relationship with co-workers, present pay notch, nature of work, and
opportunities for promotion) among line managers in the CoW, and how such facets affected
their overall job satisfaction.
The non-probability sampling technique was adopted to collect data from 102 respondents
from nine different departments by means of a structured questionnaire, resulting in a response
rate of (N = 76), 75%. The study was, however, limited to the line managers in the CoW
Municipality. Following on which the Cronbach’s alpha coefficient was used to determine the
internal consistency or average correlation of items in the survey instrument. The Spearman’s
rank correlation coefficient (Spearman’s rho) analysis was used to analyse the data with the
aid of the Statistical Package for the Social Sciences (SPSS), version 16. In addition, the
independent-samples t-test and the analysis of variance (ANOVA) were employed to
empirically test the relationships between the employees’ job satisfaction and their gender and
age.
The findings showed a significant linear relationship between the existing levels of job
satisfaction and job performance. Furthermore, the findings suggested that the employees
were significantly satisfied with certain aspects of their jobs (the nature of the work, and their
salary, supervision and co-workers), but not with the one aspect of their job (opportunity for
promotion). They were, however, significantly satisfied with their jobs in general, with there
being no significant difference between the male and female employees’ levels of job
satisfaction. The analysis showed that promotion has a modest and positive effect on job
satisfaction. The study concluded that the line managers were, in general, satisfied with their
jobs. Thus, the results cannot be generalised to other departments and Local Authorities. The
study needs to be replicated in other departments and Local Authorities, using the same
method.
iv
ACKNOWLEDGEMENTS
First and foremost, I would like to express my sincerest gratitude and appreciation to my creator and redeemer for bestowing His blessings on me, and for granting me the necessary courage, strength, good health, and perseverance to complete the study. Secondly, I wish to express my gratitude and appreciation to those mentioned below for their invaluable contribution and assistance. I want to thank my supervisor, Professor Braam Rust, for the guidance, support and encouragement that he has given me. Thank you for believing that I could complete my study within the prescribed period of time, despite the various challenges that I encountered along the road. A special word of appreciation goes to Mr Jan Johannes Swartz a lecturer from the Namibia University of Science and Technology for making statistical analysis seem so easy and worth all the effort involved. A special word of appreciation goes to Ms Henderson for editing my thesis and Dr Uys from Cape Peninsula University Technology for reviewing the statistical analysis of my data and giving final guidance. It was, indeed, a blessing that I met you at the time when I most needed an editor and input of a statistician. A word of gratitude goes to my employer for the opportunities that it affords its employees to develop their careers. I would also like to thank my colleagues at the CoW who took the time to participate in the study, as well as those who participated in the one-to-one interviews and in the required proofreading. Those who encouraged me to continue with the study, thank you very much. You all contributed towards the achievement of my goals. To my long-time friend and mentor Dr R Naanda and his wife, Irma for their encouragement and his coaching and mentoring, all my friends and family for their moral support. Last, but by no way least, a special word of appreciation goes to my children Marco, Selma, Irma, Sophia and Anne for their patience support, my wife, Anna Hambuda my dear wife and best friend for the endless support, encouragement, mentoring and love that she has bestowed on me throughout this journey, and, most of all, for always reminding me to put God first. May God bless you all.

v
DEDICATION
This thesis is dedicated to those who matter most in my life – my wife, our children and
grandchildren, as well as my relatives and close friends.

vi
KEY CONCEPTS
Affective job satisfaction: Affective job satisfaction is the extent of pleasurable emotional feelings that individuals have about their jobs overall.
Attitude: Attitudes are positive and/or negative personal judgments that are made by people with specific reference to objects, people or events (Robbins & Judge, 2011:106).
Hygiene factors: Hygiene factors, or maintenance factors, do not motivate employees, but they are essential to the maintenance of satisfaction. Such factors include a satisfactory salary and related employee benefits, human relations skills, and satisfactory working conditions. The absence of any hygiene factor is likely to cause employee dissatisfaction.
Job: A job is a paid position of regular employment.
Job satisfaction: Job satisfaction is a pleasurable or positive emotional state resulting from the appraisal of one’s job.
Job dissatisfaction: Job dissatisfaction is an employee’s response to their job, which can range from feelings of apathy to depression and despair, among others.
Motivation: Motivation consists of the processes that account for an individual’s intensity, direction, and persistence of effort exerted towards attaining a particular goal (Robbins et al., 2009; Robbins & Judge, 2011, 2014).
Motivators: Motivator factors are based on an individual's need for personal growth, and actively help to create a sense of job satisfaction. If they are effective, then they can motivate an individual to achieve above-average performance and effort.
Municipality: A municipality is a governing institution that has authority over a subnational territorially defined area. A municipality's authority springs from its elected basis, which is a factor that also results in considerable variation in the manifestation of such authority both between and within countries.
Performance: Job performance is seen as the execution of competencies to achieve the quality, quantity, cooperation, dependability, and creativity of employees.
Performance management (PM): PM is referred to as the set of interconnected practices that are designed to ensure that a person’s overall capabilities and potential are appraised. Such appraisal could result in relevant goals being set for work and development, based on the collection and review of the required data on work behaviour and performance.
Service delivery: Service delivery in the context of the municipality is the provision of basic services to satisfy ratepayers’ needs, including: water supply; sewage collection and disposal; refuse removal; electricity supply; roads, and storm water drainage; and municipal parks and recreation.

vii
GLOSSARY
Terms/Acronyms/Abbreviations Definition/Explanation ALAN ANOVA BCBC BGSU BSC BSF CEO CIPD CoW CPUT DMRGHRD ERG GJS HR HRM IBP IEP JDI JDI/JIGQ JDS JE JEP JIG JSS LA
Association for Local Authorities in Namibia Analysis of variance Bridgend County Borough Council Bowling Green State University Balanced scorecard Balanced scorecard framework Chief Executive Officer Chartered Institute of People Development City of Windhoek Cape Peninsula University of Technology Deputy Minister of Regional and Local Government, Housing and Rural Development in Namibia existence, relatedness and growth Global Job Satisfaction Human resource Human resource management Integrated Business Plan Internet Encyclopedia of Philosophy Job Descriptive Index Job Descriptive Index and Job In General Questionnaire Job Diagnostic Survey Job evaluation Job Evaluation Policy Job in general Job Satisfaction Survey Local Authority
viii
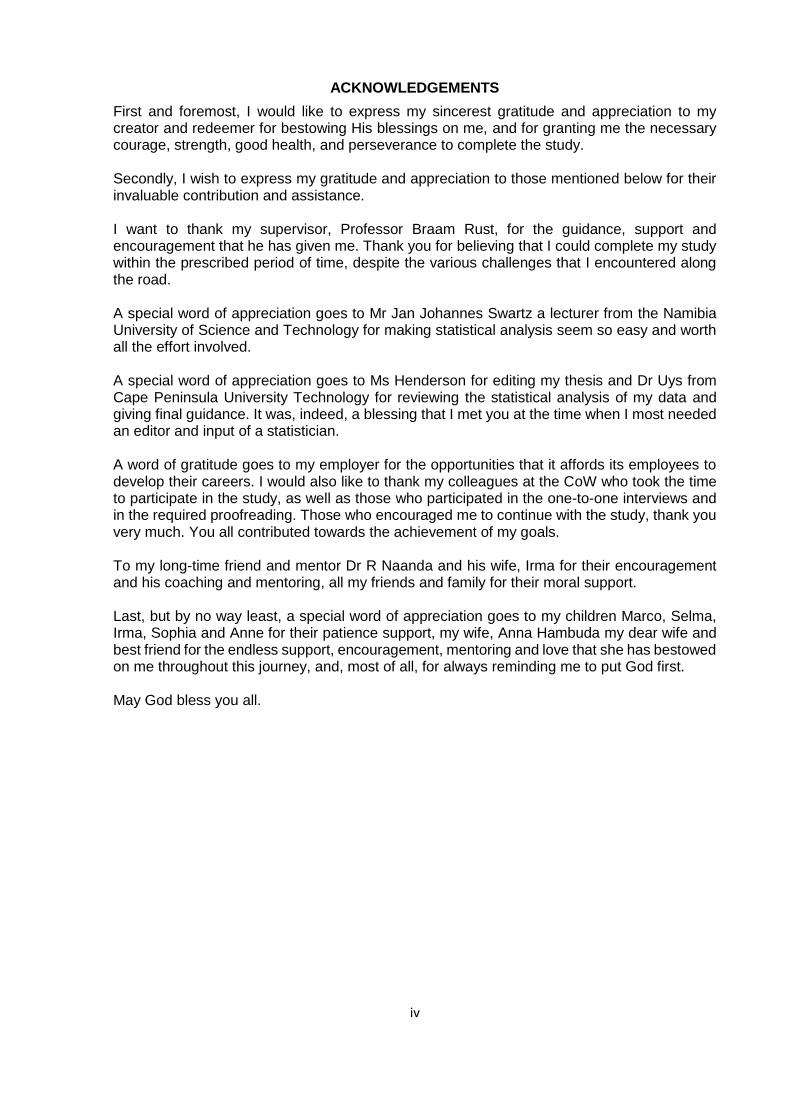
LAC MC MSQ MURD N-Ach N-Aff NALAO N-Pow N$ PA PAS PC PM PMDP PMF PMP PMS PMSPF PR RSP SHRM SEHRM SPSS TSP
Local Authority Council Management Committee Minnesota Satisfaction Questionnaire Ministry of Urban and Rural Development Need for achievement Need for affiliation Namibia Association of Local Authority Officers Need for power Namibian Dollars Performance appraisal Performance appraisal system Psychological contract Performance management Performance Management Development Project Performance management framework Performance management process Performance management system Performance Management System Principles and Framework Promotion relations Remuneration Strategy and Policy Society for Human Resource Management Strategic Executive: Human Resource Management Statistical Package for Social Sciences Transformational strategic plan

ix
TABLE OF CONTENTS
DECLARATION .................................................................................................................... ii ABSTRACT ......................................................................................................................... iii ACKNOWLEDGEMENTS.................................................................................................... iv DEDICATION ....................................................................................................................... v KEY CONCEPTS ................................................................................................................ vi GLOSSARY ....................................................................................................................... vii CHAPTER ONE .................................................................................................................... 1 BACKGROUND TO THE RESEARCH PROBLEM .............................................................. 1
1.1 Introduction ..................................................................................... 1
1.2 Background information ................................................................ 2
1.3 Statement of the research problem ............................................... 8
1.3.1 Main problem ............................................................................................... 8 1.3.2 Sub-problem ................................................................................................ 8 1.3.3 Explanation for the persistence of the problems concerned ......................... 9
1.4 Research objectives ....................................................................... 9
1.4.1 Main objective .............................................................................................. 9 1.4.2 Sub-objectives ........................................................................................... 10 1.4.3 Research questions ................................................................................... 10
1.5 Research hypotheses ................................................................... 11
1.6 Assumptions ................................................................................. 12
1.7 Theoretical framework .................................................................. 12
1.8 Research methodology ................................................................ 18
1.8.1 Research objectives................................................................................... 19 1.8.2 Research process ...................................................................................... 19 1.8.2.1 Research philosophy and approach ......................................................... 20 1.8.2.2 Research design / methodological choices ............................................... 20 1.8.2.3 Research strategy .................................................................................... 21 1.8.2.4 Time horizons ........................................................................................... 21 1.8.2.5 Techniques and procedures ..................................................................... 21 1.8.4 Research instruments (i.e. the questionnaire) ............................................ 24
1.9 Ethical considerations .................................................................. 24
1.10 Scope and limitation ..................................................................... 25
1.11 Significance of the study .............................................................. 26
1.12 Outline of the thesis ...................................................................... 27
1.12.1 Chapter One: Background to the research problem ................................... 28 1.12.2 Chapter Two: The literature review ............................................................ 28 1.12.3 Chapter Three: Overview of the Municipal sector in Namibia ..................... 29 1.12.4 Chapter Four: Research design and methodology ..................................... 29 1.12.5 Chapter Five: Data analysis and research findings .................................... 29 1.12.6 Chapter Six: Discussion of results.............................................................. 30 1.12.7 Chapter Seven: Conclusion and recommendations ................................... 30
1.13 Chapter summary.......................................................................... 30 CHAPTER TWO ................................................................................................................. 31 LITERATURE REVIEW ...................................................................................................... 31
2.1 Introduction ................................................................................... 31
2.2 Motivation in the workplace ......................................................... 32
2.2.1 The motivation process .............................................................................. 33 2.2.2 Definitions of motivation ............................................................................. 35 2.2.3 Theories of motivation ................................................................................ 35 2.2.4 Content theories of motivation ................................................................... 36

x
2.2.4.1 Maslow’s hierarchy of needs theory .......................................................... 38 2.2.4.2 Alderfer’s existence, relatedness and growth (ERG) needs theory ........... 39 2.2.4.3 Herzberg's two-factor theory of motivation (model) ................................... 41 2.2.4.4 McClelland’s acquired needs model ......................................................... 44
2.3 Attitudes and behaviour at work ................................................. 46
2.3.1 Definition of attitude ................................................................................... 47 2.3.2 Components of attitude .............................................................................. 47 2.3.3 Types of job attitudes ................................................................................. 49
2.4 Job satisfaction as a work attitude.............................................. 50
2.4.1 Definition of job satisfaction ....................................................................... 53
2.5 The measurement of job satisfaction .......................................... 54
2.5.1 Causes of job satisfaction .......................................................................... 58 2.5.1.1 The work itself facet .................................................................................. 59 2.5.1.2 The pay facet ............................................................................................ 60 2.5.1.3 The opportunity for promotion (career advancement opportunities) facet . 63 2.5.1.4 The supervision facet ............................................................................... 65 2.5.1.5 The co-workers facet ................................................................................ 67 2.5.1.6 The job in general facet ............................................................................ 68 2.5.2 The consequences of job dissatisfaction .................................................... 69
2.6 Performance management ........................................................... 71
2.6.1 Introduction ................................................................................................ 71 2.6.2 Definition of job performance ..................................................................... 72 2.6.3 Job performance and its relationship to job satisfaction ............................. 73 2.6.4 Managing organisational performance ....................................................... 75 2.6.4.1 The meaning of ‘performance management’ ............................................. 80 2.6.4.2 The meaning of ‘performance appraisal’ ................................................... 83 2.6.5 Teamwork performance ............................................................................. 86 2.6.6 Individual work performance ...................................................................... 87 2.6.7 The role of line managers in individual performance .................................. 92 2.6.8 Psychological contract and job performance .............................................. 95
2.7 Summary ........................................................................................ 99 CHAPTER THREE ........................................................................................................... 102 OVERVIEW OF THE CITY OF WINDHOEK MUNICIPALITY ........................................... 102
3.1 Introduction ................................................................................. 102
3.2 The municipal sector profile ...................................................... 103
3.3 Profile of the City of Windhoek .................................................. 104
3.3.1 CoW Municipality’s strategic intent ........................................................... 105 3.3.1.1 CoW Municipality’s vision ....................................................................... 105 3.3.1.2 CoW Municipality’s mission statement and core values .......................... 105 3.3.1.3 Core values ............................................................................................ 105
3.4 Management of staff ................................................................... 106
3.5 The PMS at CoW Municipality as an important element of local government modernisation ........................................................ 107
3.6 (Perceived) research problem experienced .............................. 109
3.7 Shortcomings of the performance appraisal in the CoW Municipality ................................................................................. 110
3.8 The decision to change to a new system .................................. 112
3.8.1 The Performance Management System Principles and Framework (PMSPF) ................................................................................................................ 114
3.8.2 Job evaluation (JE) policy ........................................................................ 115 3.8.3 Remuneration strategy and policy (RSP) ................................................. 115
3.9 The adopted performance management system (PMS) ........... 115
3.10 The way forward for the CoW Municipality since June 2017 .. 117

xi
3.11 Summary ...................................................................................... 117 CHAPTER FOUR ............................................................................................................. 119 RESEARCH METHODOLOGY ........................................................................................ 119
4.1 Introduction ................................................................................. 119
4.2 Research objectives ................................................................... 120
4.2.1 Main objective .......................................................................................... 120 4.2.2 Sub-objectives ......................................................................................... 120 4.2.3 Research questions ................................................................................. 121
4.3 Research process ....................................................................... 121
4.3.1 Research philosophy and approach ......................................................... 122 4.3.1.1 Positivism ............................................................................................... 123 4.3.1.2 Realism .................................................................................................. 124 4.3.1.3 Interpretivism .......................................................................................... 124 4.3.1.4 Pragmatism ............................................................................................ 124 4.3.1.5 Justification of the research philosophy .................................................. 125 4.3.2 Research approaches .............................................................................. 125 4.3.2.1 The deductive approach ......................................................................... 125 4.3.2.2 The inductive approach .......................................................................... 126 4.3.2.3 The abductive approach ......................................................................... 127
4.4 Research design ......................................................................... 128 4.4.1 Methodological choice (approaches) ........................................................ 130 4.4.1.1 Quantitative research ............................................................................. 130 4.4.1.2 Qualitative research ................................................................................ 130 4.4.1.3 Justification of the research design of the current study.......................... 132 4.4.2 Nature of the research design .................................................................. 133 4.4.2.1 Exploratory research .............................................................................. 133 4.4.2.2 Descriptive research ............................................................................... 133 4.4.2.3 Explanatory research .............................................................................. 133
4.5 Research strategy ....................................................................... 134
4.5.1 Justification of the research design used in the current study .................. 134
4.6 Time horizons .............................................................................. 134
4.6.1 Longitudinal analysis................................................................................ 135 4.6.2 Cross-sectional research ......................................................................... 135
4.7 Research techniques and procedures ...................................... 135
4.7.1 Research population ................................................................................ 135 4.7.2 Sampling .................................................................................................. 136 4.7.2.2 Non-probability sampling ........................................................................ 137 4.7.3 Data collection method ............................................................................ 137 4.7.3.1 The research instrument (JDI and JIG questionnaire) ............................. 138 4.7.3.2 The construction of the JDI and JIG questionnaire ................................. 139 4.7.3.3 The JDI and JIG questionnaire items ...................................................... 139 4.7.3.4 The pilot study ........................................................................................ 140 4.7.3.5 Administration of the JDI and JIG questionnaire ..................................... 140 4.7.3.6 Collection and compiling of the responses .............................................. 141 4.7.3.7 Eliminations of bias in the JDI and JIG questionnaire ............................. 141 4.7.3.8 Cronbach's alpha reliability coefficient scores for the JDI and JIG questionnaire........................................................................................................... 141 4.7.3.9 The internal consistency of Cronbach's alpha ......................................... 142
4.8 Data processing and analysis .................................................... 143
4.9 Validity and reliability ................................................................. 144
4.10 Limitations and delimitations of the study ............................... 145
4.11 Ethical considerations ................................................................ 145
4.11.1 Informed consent ..................................................................................... 146

xii
4.11.2 Voluntary participation ............................................................................. 147 4.11.3 Anonymity ................................................................................................ 147 4.11.4 Confidentiality .......................................................................................... 148 4.11.5 Avoidance of harm ................................................................................... 148
4.12 Summary ...................................................................................... 148 CHAPTER FIVE ............................................................................................................... 150 DATA ANALYSIS AND FINDINGS .................................................................................. 150
5.1 Introduction ................................................................................. 150
5.2 Descriptive statistics (i.e. the results) ....................................... 150
5.2.1 Univariate analysis of section A of the JDI and JIG questionnaire ............ 150 5.2.1.1 The distribution of demographic data ...................................................... 151
5.3 Result of the JDI and JIG questionnaire ................................... 155
5.3.1 Work on present job ................................................................................. 155 5.3.2 Pay .......................................................................................................... 156 5.3.3 Opportunities for promotion...................................................................... 157 5.3.4 Supervision .............................................................................................. 158 5.3.5 People on the present job (i.e. the co-workers) ........................................ 160 5.3.6 The JIG .................................................................................................... 161 5.3.7 Average scores of ‘yes’ and ‘no’ .............................................................. 163
5.4 Central tendency, dispersion and statistical reliability ........... 164
5.5 Correlations ................................................................................. 165
5.5.1 Work itself and pay .................................................................................. 166
5.5.2 Work itself and promotion .......................................................... 166
5.5.3 Work itself and supervision ...................................................................... 167 5.5.4 Work itself and the co-workers ................................................................. 167 5.5.5 Work itself and the JIG ............................................................................. 167 5.5.6 Pay and the opportunity for promotion ..................................................... 167 5.5.7 Pay and supervision ................................................................................ 168 5.5.8 Pay and the co-workers ........................................................................... 168 5.5.9 Pay and the JIG ....................................................................................... 168 5.5.10 Promotion and supervision....................................................................... 168 5.5.11 Promotion and the co-workers ................................................................. 169 5.5.12 Promotion and the JIG ............................................................................. 169 5.5.13 Supervision and the co-workers ............................................................... 169 5.5.14 Supervision and the JIG ........................................................................... 169 5.5.15 Co-workers and the JIG ........................................................................... 170
5.6 Comparative statistics ................................................................ 170
5.8 Summary ...................................................................................... 174 CHAPTER SIX .................................................................................................................. 176 DISCUSSION OF RESULTS ............................................................................................ 176
6.1 Introduction ................................................................................. 176
6.2 Descriptive statistics .................................................................. 176
6.2.1 Discussion of the univariate data elicited by section A of the JDI and JIG questionnaire ........................................................................................... 177
6.2.1.1 Distribution of the demographic data ...................................................... 177
6.3 Result of the JDI and JIG questionnaire ................................... 179
6.3.1 Perceptions of work in terms of the job itself ............................................ 179 6.3.2 Perceptions of pay in the current job ........................................................ 181 6.3.3 Perceptions of opportunities for promotion ............................................... 183 6.3.4 Perceptions of supervision given (question four) ...................................... 185 6.3.5 Perceptions of the respondents’ relationships with their co-workers (question
five) .......................................................................................................... 186 6.3.6 Perceptions on the JIG scale ................................................................... 188

xiii
6.4 Central tendency and dispersion............................................... 189
6.5 Bivariate correlation ................................................................... 190
6.5.1 Overall findings on correlations ................................................................ 192
6.6 Comparative statistics ................................................................ 192
6.6.1 Gender comparison ................................................................................. 192 6.6.2 Overall findings on gender comparison .................................................... 193 6.6.3 Age comparison ....................................................................................... 193 6.6.4 Overall findings on the age comparison ................................................... 193
6.7 Research hypothesis .................................................................. 194
6.7.1 Hypothesis 1: finding................................................................................ 194 6.7.2 Hypothesis 2: finding................................................................................ 195 6.7.3 Hypothesis 3: finding................................................................................ 196
6.8 Assumptions ............................................................................... 197
6.9 Validation of assumptions ......................................................... 197
6.10 The job satisfaction, hygiene and motivating factors relating to performance management (PM) ................................................ 198
6.10.1 Pay (hygiene factor) and job satisfaction.................................................. 198 6.10.2 Supervision (hygiene factor) and job satisfaction ..................................... 199 6.10.3 Work itself (motivating factor) and job satisfaction ................................... 199 6.10.4 The opportunity for promotion and job satisfaction (motivating factor) ...... 199 6.10.5 Co-workers (motivating factor) and job satisfaction .................................. 200
6.11 Summary ...................................................................................... 201 CHAPTER SEVEN ........................................................................................................... 204
7.1 Introduction ................................................................................. 204
7.2 Conclusions ................................................................................ 205
7.2.1 Conclusions relating to the literature findings ........................................... 205 7.2.2 Conclusions on the empirical findings ...................................................... 208
7.3 Recommendations ...................................................................... 210
7.3.1 The work itself.......................................................................................... 211 7.3.2 The pay.................................................................................................... 211 7.3.3 The opportunities for promotion ............................................................... 211 7.3.4 The employees’ relationship with their supervisor .................................... 212 7.3.5 The employee’s relationship with their co-workers ................................... 212 7.3.6 The job in general .................................................................................... 213 7.3.7 Further recommendations ........................................................................ 213 7.3.7.1 Policies and procedures of the organisation ........................................... 213 7.3.7.2 The autonomy to make decisions ........................................................... 214 7.3.7.3 The commitment to organisational goals ................................................ 214
7.4 Limitations of the study .............................................................. 214
7.5 Suggestions for future research ................................................ 215
7.6 Summary ...................................................................................... 215
8. References ................................................................................... 216 LIST OF FIGURES Figure 2.1: The motivation process ...................................................................................... 33
Figure 2.2: Maslow hierarchy of needs ................................................................................ 38
Figure 2.3: The ERG needs theory ...................................................................................... 40
Figure 2.4: Maslow’s hierarchy of needs with Alderfer’s ERG theory merged ...................... 40
Figure 2.5: The model of Herzberg’s two factor theory ......................................................... 42
Figure 2.6: Components of job satisfaction .......................................................................... 47
Figure 2.7: The job satisfaction model ................................................................................. 51
Figure 2.8: Responses to job satisfaction/dissatisfaction ..................................................... 70
xiv
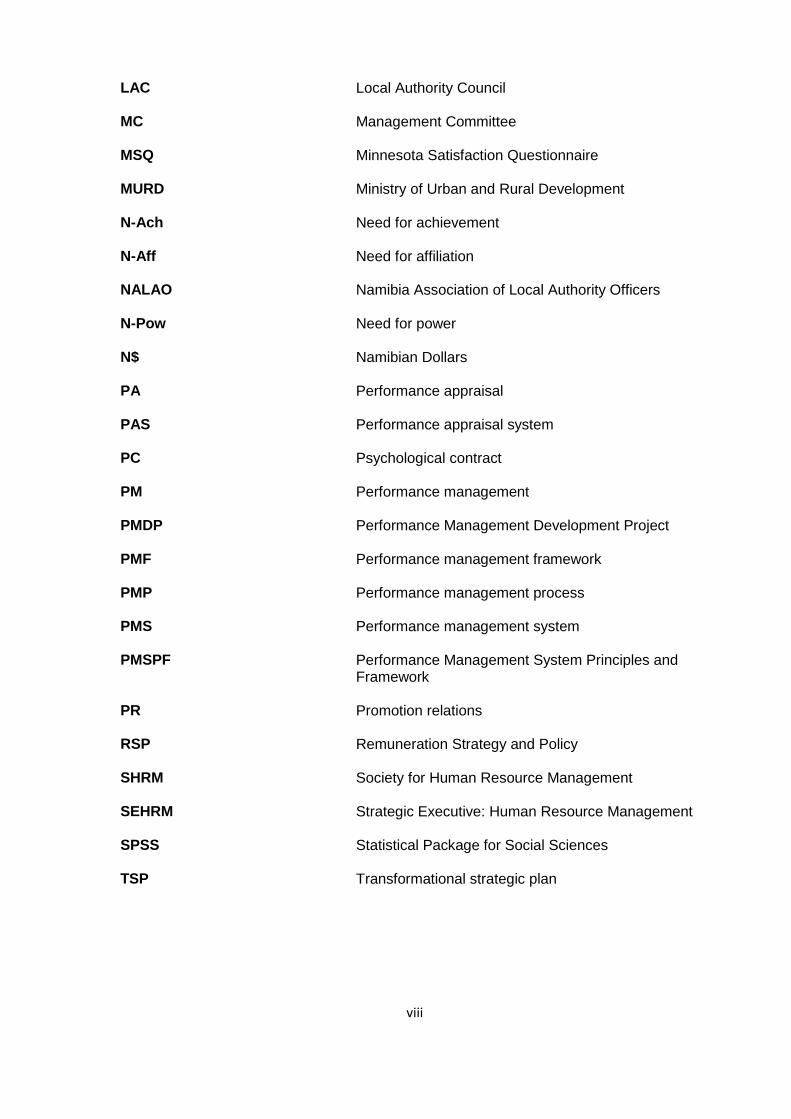
Figure 2.9: The performance management process ............................................................. 82
Figure 2.10: A process diagram of the performance appraisal ............................................. 84
Figure 2.11: The multifaceted objectives of the performance appraisal ................................ 85
Figure 2.12: The heuristic framework of individual work performance .................................. 89
Figure 2.13: A model of the psychological contract .............................................................. 97
Figure 3.1: The balanced scorecard of the CoW Municipality ............................................. 116
Figure 4.1: Research Onion ............................................................................................... 122
Figure 4.2: The dimensions of decision-making in research design ................................... 129
Figure 5.1: Gender categories ........................................................................................... 152
Figure 5.2: Age categories ................................................................................................. 152
Figure 5.3: Highest qualification categories ........................................................................ 153
Figure 5.4: Job position categories .................................................................................... 153
Figure 5.5: Years of service categories .............................................................................. 154
Figure 5.6: Job grade categories ....................................................................................... 154
Figure 5.7: Values of the correlation coefficient.................................................................. 165
LIST OF TABLES Table 2.1: Definitions of motivation ..................................................................................... 35 Table 2.2: Classification of motivation theories .................................................................... 36 Table 2.3: Overall employee Job Satisfaction ...................................................................... 68 Table 3.1: Core values and descriptions ............................................................................ 106 Table 4.1: The contrast between the dedu ......................................................................... 127 Table 4.2: Quantitative versus qualitative research designs ............................................... 127 Table 4.3: Cronbach’s alpha reliability coefficients for the JDI/JIGQ facets ........................ 143 Table 5.1: The work itself facet .......................................................................................... 155 Table 5.2: The pay facet .................................................................................................... 157 Table 5.3: The promotion facet .......................................................................................... 158 Table 5.4: The supervision facet ........................................................................................ 159 Table 5.5: The people on the present job ........................................................................... 160 Table 5.6: The job in general facet ..................................................................................... 162 Table 5.7: Average scores and percentage ........................................................................ 163 Table 5.8: The mean, the standard deviat .......................................................................... 164 Table 5.9: Correlations of the job satis ............................................................................... 166 Table 5.10: The means and standard devia ....................................................................... 170
Table 5.11: The independent samples test ........................................................................ 170
Table 5.12: The mean age of the responde ....................................................................... 172
Table 5.13: The ANOVA .................................................................................................... 174
APPENDICES Appendix A ………………………………………………………………………………..232 Appendix B………………………………………………………………………………...234 Appendix C……………………………………………………………………………… 240 Appendix D……………………………………………………………………………… 241 Appendix E……………………………………………………………………………. 242 Appendix F…………………………………………………………………...………… 243

1
CHAPTER ONE
BACKGROUND TO THE RESEARCH PROBLEM
1.1 Introduction
The Society for Human Resource Management (SHRM) (2008:4) in their research report
indicated that the recruitment and retention of competent staff members underpins the success
of businesses no matter their size. Their view is that those employees who are satisfied with
their jobs are likely to stay with their employer longer than do those who are not. Thus, the
failure to secure employee job satisfaction might result in difficulties in retaining such
employees. Conversely, losing employees through resignations becomes destructive to the
service delivery programmes and plans of the organisation involved.
According to Robbins et al. (2009:20) there is a relationship between job performance,
absenteeism, and turnover and job satisfaction. From all of these factors mentioned above,
only the relationship between job satisfaction and job performance was the sole focus of the
current study.
Ensuring that employees are happy and motivated it is often not attainable as the expectations
of employees shift rapidly. Changing employee expectations originates from "demographic
trends, such as growing numbers of generation Y employees (those born after 1981). Women
entering the workforce, the retirement of baby boomers (those born between 1945 and 1964),
caring for children and ageing parents, and more general changes in society, such as
increased stress levels as employees attempt to juggle work and personal responsibilities"
(SHRM, 2008:4).
Therefore, the factors that have long been thought to satisfy employees might fluctuate over
time, depending on such characteristics as gender and age (SHRM, 2008:4). Further factors
contributing to the fluctuation can be linked to changes in the workplace, as well as to
economic, demographic and social trends (SHRM, 2012:3). According to the SHRM (2012:3),
a noticeable fluctuation has occurred since 2002 in the overall job satisfaction levels of
employees. Of all the above-mentioned factors contributing to job satisfaction, only two
remained among the top five contributors to job satisfaction in 2012 (SHRM, 2012:4).
The SHRM (2012:4-5), found "opportunities to use skill and abilities (63%) displaced job
security (61%) for the number one spot …, placing job security second on the list.

2
The other three contributors among the top five were pay (60%), communication between
employees and senior management (57%), and the relationship with immediate supervisors
(54%) respectively.
Top management is urgently required to address the fluctuating needs of employees to avoid
a rise in existing job attrition rates. Not only would their doing so improve their employees’
sense of job satisfaction, but it would also have a profoundly positive effect on the prevailing
levels of motivation, job performance, and, ultimately, service delivery. As both the internal and
the external factors might change over time, it is imperative for the management of
organisations to be aware of, and to understand, the characteristics that contribute to their
employees’ levels of job satisfaction or dissatisfaction, so as to ensure optimum motivation and
job performance.
1.2 Background information
Researchers have, for many decades, been interested in why some employees report being
very satisfied with their jobs, while some report poor satisfaction levels, and some even
dissatisfaction with their jobs. Over the past few decades, many studies have been carried out
on job satisfaction and job performance. The most notable research in this area, consisting of
the Hawthorne studies that were conducted during 1924, showed the importance of the
relationship between job satisfaction and job performance (Muchinsky, 1985, cited in
Redmond, 2011:13).
Job satisfaction and job performance are significant variables that have an impact on the
quality of service delivery. Locke (1976, cited in Akafo & Boateng, 2015:114 & Robbins and
Judge (2011:115), refers to job dimensions that add value to employees' job satisfaction
consisting of the job, advancement, acknowledgement, remunerations, operational
environments, management, colleagues and corporation and leadership.
Rotenberry and Moberg (2007, cited in Ahmad et al., 2010:259) found that employees who
were positive and involved in their jobs performed better than did those whose attitude was
negative towards their jobs. Griffin (1991, cited in Grant et al., 2010:417), gives examples of
the practical importance of job satisfaction and job performance.
The study in question was conducted at a bank, where it had been found that the bank tellers
were dissatisfied with their jobs.

3
The tellers, who viewed themselves as overvalued assistants, found their jobs dull, and
complained of macro management at work, where even small decisions could only be taken
by them with their superior's permission.
The above-mentioned factors resulted in employees neglecting their jobs, leading to high
absenteeism rates, late arrival at work, and minimal expenditure of effort in the workplace
(Griffin, 1991, cited in Grant et al., 2010). In practical terms, the employees’ negative attitude
translated into them not performing adequately at work, which, in turn, resulted in them making
errors, voicing their discontent to management, and, in the process, them losing trust in their
leadership. The ultimate result was the need for multiple disciplinary actions, which resulted in
a high labour turnover.
Furthermore, the study in question reported that the employees' performance improved once
positive action was taken by management to correct the identified problems that had
contributed to the employees' job dissatisfaction levels. Thus, the conclusion of the study
mentioned above supports the notion that those employees who are dissatisfied with their jobs
tend to perform poorly, as opposed to those who are satisfied with their jobs. In the above-
mentioned instance, poor performance resulted from the employers concerned allowing
conditions at work to deteriorate to the point where the quality service delivery of the bank
involved was compromised.
Similarly, the study found that the employees' performance improved once positive action had
been taken by management to correct the problems identified as having contributed to the
employees' job dissatisfaction levels.
Job satisfaction, evidently, has a profound effect on job performance, and, ultimately, on
service delivery in various sectors. The quality of service provision by the Local Authorities in
Africa, specifically those in South Africa and Namibia, seemed to have hit rock bottom at the
time of the present study, causing grave concern among the executive leadership in their
neighbouring countries.
According to Pretorius and Schurink (2007:19), South African municipalities have faced a
daunting task in terms of the requirement that they provide quality services to ratepayers …
According to the two aforementioned researchers, the number of petitions from communities
clamouring for quality municipal services has soared over the last several years, as can be
seen in the mass media.

4
Poor service delivery, especially in South Africa, has been evident from the wave of street
protests that have taken place in recent times (Pretorius & Schurink, 2007:19).
In response, President Zuma has highlighted that reinforcing local government service delivery
is a major concern (IT-Online, 2010). Furthermore, the President has acknowledged the
existence of numerous problems to do with the Local Authorities (i.e. the municipalities) in
South Africa, such as “ineffective professional administration and weak performance
management”.
Even though fewer street protests have occurred in Namibia than in South Africa, the standard
of service delivery in Namibia has remained far from satisfactory up to the time of the current
study. The poor quality of such delivery is evident from a speech made by the Deputy Minister,
of Regional and Local Government, Housing and Rural Development in Namibia (DMRGHRD).
In his address to the Local Authority Council (LAC) [Municipality] leaders, made in 2009, the
aforesaid minister asserted that the LAC leaders could reconcile their differences for the sake
of effective and efficient service delivery to their constituencies, as the latter demanded (Anon,
2009:2).
Furthermore, the Association for Local Authorities in Namibia (ALAN) and the Namibia
Association of Local Authority Officers (NALAO) had signed an agreement with a PM company,
Vision Active Namibia, after the launch of the Performance Management Development Project
(PMDP) (Anon, 2009:2). The PMDP was claimed to have been designed to "improve
accessibility to local government by enhancing the effectiveness and efficiencies of all local
authorities across Namibia".
In addition to improving such accessibility, the project also provided a platform from which to
measure the quality of the service delivered by municipalities, and from which to improve the
development and growth of individual staff members in this regard, through a standard
performance management system (PMS) that had been implemented across all municipalities
in the country. At the time at which the current study was undertaken, the implementation of
PMS across all municipalities was further evidence that the LACs in Namibia had come to
recognise the urgent need for efficient and effective service delivery.
LACs appeared to be willing to change the situation from a non-performance culture (the way
in which things had previously been done) to a performance culture (which could be seen as
a different way of doing things).

5
According to Shmailan (2010:02), profitable corporations are determined by superior
performance by their staff members to reach and or exceed their targets.
The influence of employee job satisfaction on job performance remains imperative in the
twenty-first century. In the contemporary municipal environment, the primary concerns the
improvement in the performance of employees, with a view to increasing their effectiveness
and efficiency through attitude (job satisfaction) change. Such a need was created by the
pressure to perform to the ratepayers' expectations, which were of a type of service delivery
that was worth paying for.
Job satisfaction has long been considered a significant and persistent problem in
municipalities. As a result, theories have been developed, and numerous studies have been
conducted to identify the causes of job satisfaction. Job satisfaction theories predict that
employees who find their job challenging, interesting, or pleasurable tend to perform better
than those who do not.
For the CoW Municipality to improve its service delivery, the job satisfaction of its line
managers had to be considered seriously, because, according to Robbins et al. (2009:79),
satisfied workers produce better results. At the time of the present study, the CoW had no PMS
in place to steer its productivity and operations, as the previous system [performance appraisal
(PA) system] was suspended in 1998. This was despite senior management at the time giving
no apparent reason for such suspension.
Although, at the stage at which the current research was undertaken, efforts were being made
to implement a PMS to manage employees' performance after more than a decade with no
such formal system having been in place, there was no evidence that employees' performance
was likely to improve in future. Having PM tools and processes in place had been insufficient
to ensure the implementation of an effective PMS.
According to McMahon (2013:7) PMS is now a standard in organisations around the world.
The embracing of such a system would effectively mean that the CoW required its line
managers to be highly motivated. The level of management involved has a crucial role to play
in the successful implementation of a PMS, as the managers themselves have the joint
responsibility of ensuring the success of any PMS that is implemented.

6
According to the Chartered Institute of Personnel and Development (CIPD) (2012a), line
managers are responsible for the implementation of human resource (HR) strategies.
Employees that are happy with their line managers are likely to high level of job satisfaction
which in turn are associated with higher performance It is for this reason that the line managers
involved need to be satisfied with what is required of them in terms of their current roles and
responsibilities.
For municipalities to be open to adopting a performance culture, they need to take the attitude
(job satisfaction) of their line managers and employees into account. According to The CIPD
(2012a), line managers have a direct influence on how employees execute their jobs.
Some line managers encourage the employees under their supervision to work well, whereas
and others tend to suppress the performance of their employees due to micro managing them
in terms of an autocratic management style. Selecting the right line manager for each particular
job is of crucial importance to those involved attaining the right attitude (job satisfaction), skills,
and level of confidence to ensure that they are capable of positive management, and of
understanding their degree of impact and their source of motivation, resulting in superior
performance.
Kerns (2008) supports the above rationale in stating that "mounting evidence suggests that a
happy and high performing workforce [in terms of managers and employees] correlates with
greater employee [manager job] satisfaction”.
By implication, the above suggests that the poor performance of a workforce correlates with
low levels of employee satisfaction. Since the CoW first initiated the implementation of a PMS
in 2004, various challenges have prevented its realisation. Line managers have seemed not
to be keen on participating in the successful implementation of the system concerned.
According to Lombard (2015), the challenges facing the CoW could be summarised as follows:
managers and employees took a considerable amount of time to finalise their job descriptions and those of their subordinates on time;
managers and employees missed out on crucial training opportunities;
there was general resistance to change; and
a change management process was not in place.

7
The question, thus, arose as to whether the line managers were satisfied with their jobs, and,
if they were, why the proposed PMS was taking so long to implement. In effect, they could
have fully participated in its implementation.
Line managers have the day-to-day responsibility of implementing ‘traditional’ human resource
(HR) initiatives (CIPD, 2012a). The Institute opines that where employees feel positive … with
their line managers … they are more likely to have higher levels of job satisfaction, commitment
and loyalty, which are in turn associated with higher levels of performance or discretionary
behaviour. Discretionary behaviour refers to the efforts exceeding set targets associated with
the job resulting in high performance that increase profitability of an organisation (Ahmad,
2012:1).
According to the SHRM (2012:1), awareness of staff member’s attitude towards their jobs
assist organisations value choses that support employers during the introduction of policies
boosting job satisfaction. The current research was motivated by the growing concern
regarding the lack of service delivery as a result of poor performance, and its perceived impact
on the job satisfaction levels maintained among line managers in the CoW Municipality.
Moreover, the overall purpose of the present study was to assess the prevailing levels of job
satisfaction of the line managers employed by the CoW Municipality in Namibia, using
empirical outcomes, at a time when the Municipality in question was implementing a PMS.
The findings of the current study could, ultimately, indicate whether the line managers surveyed
were, indeed, satisfied with their jobs, and whether they were ready to perform their jobs in
terms of the envisaged PMS, with the aim of improving their job performance. Their satisfaction
therewith, it was felt, would ultimately cascade the performance culture downward to the lower
level employees, resulting in enhanced performance and service delivery.
The present study was envisaged as providing greater awareness and understanding of the
relationship between job satisfaction and job performance. The study was also aimed at
indicating whether the CoW itself could have undertaken research into the issue of job
satisfaction, or else run the risk of failing in its efforts to implement the proposed PMS.
Finally, the current chapter provides an overview of the whole study, starting by giving the
relevant background, identifying the problem statement involved, justifying the study, stating
the objectives of the study, overviewing the methodology used, and, finally, providing the layout
of the chapters.

8
1.3 Statement of the research problem
The following subsections cover the main problem, the sub problem and the explanation for
the persistence of the problems.
1.3.1 Main problem
Perceived poor job satisfaction among the line managers in the CoW Municipality is believed
to have led to an unacceptably low level of job performance from 2008 to 2017. In the
contemporary local authority (LA) environment, the primary concern is quality service delivery.
Quality service delivery can be achieved by means of improving the performance of line
managers, with the view of increasing their efficiency and effectiveness. Such a need exists
as a direct result of the pressure to perform to the ratepayers' expectations, in such a way as
to achieve quality service delivery.
Currently, the CoW Municipality has no PMS in place to steer its service delivery operations
effectively and efficiently (Lombard, 2015; Vries, 2016). According to them the PA system that
was in place, as was mentioned earlier, was suspended in 1998, with no reason being
advanced by management for such suspension, and without any intention to continue with it
until a new PMS was developed and implemented.
Although efforts had been made since then to implement a new PMS to manage employees'
performance, at the time at which the current study was undertaken, no evidence had yet been
seen that line managers were satisfied with their jobs, and were performing optimally, in line
with their embracing of a new PMS (Ndura, 2016).
1.3.2 Sub-problem
As a direct result of the problems indicated in subsection 1.2.1 above, the CoW Municipality’s
service delivery was profoundly affected. The overwhelming number of complaints received
from the ratepayers concerned, especially in terms of those reported in the media during the
period under review, had provided evidence of possible problems existing within the CoW
Municipality at the time of the study.
The complaints involved ranged from those of poor electricity and water connection services,
waste removal services, slow and inadequate repairs and maintenance of road infrastructure,
wrongly calculated water and electricity charges, poor sanitation service provision, and poor
customer care, amongst others.

9
1.3.3 Explanation for the persistence of the problems concerned
Before 1998, the CoW Municipality had a PA / evaluation system in place, in terms of which
such appraisals were conducted on an annual basis. The appraisal/evaluation was merely a
measuring tool, and not necessarily a PMS, as it is known today. It was the CoW Municipality's
way of evaluating the talent, skills and abilities of its staff.
At the same time, it also served to provide an opportunity for the employees and supervisors
to have a one-on-one discussion on where the gaps exist concerning their performance, and
what it would take to improve such gaps (Lombardt, 2015).
As a result, the employees performed well to earn merit increases, as per the
appraisal/evaluation guidelines. As indicated above, such practice was suspended after an
institutional restructuring process was carried out in 1998.
However, since the suspension of the PA system in 1998, the CoW Municipality had no
institutional mechanism in place to measure, monitor and evaluate employees' performance in
line with their talent, skills and abilities (Lombardt, 2015), at least not until the time of the
present study. Due to the absence of a policy framework for PM, employees’ job performance
was perceived to have taken a downward spiral, resulting in inadequate service delivery to the
CoW Municipality's clients.
Other employment factors, such as absenteeism, employee turnover, the abuse of sick leave,
the increased number of injuries on duty, and an increase in the number of cases of incapacity
are a possible outcome as a result of their job dissatisfaction, and, in turn, their job performance
(Ndura, 2016). The reasons for an individual employee’s job satisfaction might, however, differ
from employee to employee.
1.4 Research objectives
The research objectives consist of the main objective, the sub-objectives and the research
questions.
1.4.1 Main objective
The motivation for the current study was prompted by growing concerns regarding poor service
delivery to Windhoek residents. Such poor service delivery to the residents was partly blamed
on the poor performance of CoW employees, and its perceived influence on job satisfaction
levels amongst the line managers in the CoW Municipality.

10
The primary objective of the present study was to conduct a survey on the job satisfaction
levels of the line managers concerned during the period, 2012 to 2017, when the CoW
Municipality was busy implementing a PMS. Once the variables concerned have been
identified, the CoW Municipality could be better able to understand and appreciate their
preferences when developing programmes and policies designed to influence levels of job
satisfaction within the CoW Municipality.
1.4.2 Sub-objectives
The specific sub-objectives of the study entailed measuring the six facets (the work itself, the
co-workers, and the opportunity for promotion as factors in support of motivation; pay and
supervision as hygiene factors; and the overall level of job satisfaction) of job satisfaction
involved by means of the following:
measurement of the job satisfaction levels of line managers in the CoW Municipality, based on selected job satisfaction facets;
determination of the factors influencing the line managers’ job satisfaction levels, based on selected facets (being those of hygiene and motivation, as listed above); and
the offering of suitable recommendations for improving, or enhancing, the job satisfaction of line managers in the CoW.
1.4.3 Research questions
The primary purpose of the current study was to evaluate the level of job satisfaction amongst
line managers, using empirical outcomes, at a time when the CoW was busy implementing a
PMS.
The secondary purpose involved was to identify factors explaining the job satisfaction, or job
dissatisfaction, of the group of employees mentioned above. Once such factors have been
determined, the CoW Municipality management could be capable of improving their
understanding of, and appreciating their preferences in relation to, the development of
programmes and policies that are designed to influence their levels of job satisfaction in terms
of working for the CoW.

11
The current study sought to answer the following questions, assuming that levels of job
satisfaction have a direct bearing on job performance:
is there any difference between the job satisfaction of male and female employees?;
is there any difference between job satisfaction and the age of employees?;
which of the following factors affect job satisfaction and dissatisfaction; o employees’ nature of work in their present job (w);
o pay (p);
o opportunities for promotion relations (PR);
o co-workers; and
o supervision?
which factors affect the global job satisfaction of employees?; and
do hygiene and motivating factors impact on the poor job performance of line managers at the CoW Municipality?
1.5 Research hypotheses
A hypothesis is a theory designed to be tested, given a likely relationship between two or more
factors (Bryman & Bell, 2007:88). Similarly, Saunders et al. (2012:672) believe that a
hypothesis is a suggestion that can be tested to validate if the is a significant difference or
relationship amongst a number of factors, events or philosophies. In other words, a hypothesis
is a tentative solution, or explanation, of a research problem, with the task of the researcher
being to find answers to the underlying assumptions. The following tentative assumptions
(hypotheses) were put forward for investigation in the case of the present study.
First hypothesis
The first hypothesis consists of the following:
H0 (null): No statistically significant correlation exists between the job satisfaction of line managers in relation to specific job satisfaction facets, consisting of (a) the nature of the work itself; (b) the pay; (c) the opportunity for promotion; (d) the nature of supervision; (e) the relationships with co-workers; and (f) the job in general (JIG).
H1 (alternative): A statistically significant correlation exists between the job satisfaction of line managers in relation to specific job satisfaction facets, consisting of (a) the nature of the work itself; (b) the pay; (c) the opportunity for promotion; (d) the nature of supervision; (e) the relationships with co-workers; and (f) the JIG.

12
Second hypothesis The second hypothesis consists of the following:
H0 (null): No statistically significant difference exists between men and women in relation to the job satisfaction facets, consisting of: (a) the nature of the work itself; (b) the pay; (c) the opportunity for promotion; (d) the nature of supervision; (e) the relationships with co-workers; and (f) the JIG.
H1 (alternative): A statistically significant difference exists between men and women in terms of the statistically significant correlation between the job satisfaction of line managers in relation to the job satisfaction facets, consisting of: (a) the nature of the work itself; (b) the pay; (c) the opportunity for promotion; (d) the nature of supervision; (e) the relationships with co-workers; and (f) the JIG.
Third hypothesis The third hypothesis consists of the following:
H0 (null): No statistically significant difference exists between the different age groups in relation to the job satisfaction facets, consisting of: (a) the nature of the work itself; (b) the pay; (c) the opportunity for promotion; (d) the nature of supervision; (e) the relationships with co-workers; and (f) the JIG.
H1 (alternative): A statistically significant difference exists between the different age groups in relation to the job satisfaction facets, consisting of: (a) the nature of the work itself; (b) the pay; (c) the opportunity for promotion; (d) the nature of supervision; (e) the relationships with co-workers; and (f) the JIG.
1.6 Assumptions
The current study was based on the following assumptions:
that the line managers at the CoW were not satisfied with some facets of their jobs, including the work itself, the pay, opportunities for promotion, the nature of their supervision, their relationships with their co-workers, and their JIG;
that the participants could answer the research questions truthfully and accurately, based on their personal experience;
that the participants could respond honestly, and to the best of their abilities; and
that top management would make use of the recommendations of the research report.
1.7 Theoretical framework
The factors of motivation, job satisfaction, and performance have been known to be linked
(Ngo, 2009). Therefore, line managers need to be concerned with, and monitor, the level of
motivation and satisfaction of employees in their respective organisations. Exploration of the
theory of motivation aim[s] to generalise and draw conclusions from individual events why
certain thinks happen one way or the other (Ahmad, 2013:20).

13
Throughout the literature review focused on employee performance, it became evident that
some factors associated with employee motivation tend also to be related to employee job
satisfaction (attitude). Accordingly, Amaoko (2011:1) opines that employee job satisfaction
[attitude] is somehow linked to each other. Schermerhorn et al. (1985, cited in Amaoko,
2011:1), argues that motivation is inner strength of individuals responsible for level, vision,
resolve, effort used to accomplish work.
The challenge, thus, for employers is, first, to secure motivated employees for their
organisations, so as to ensure productivity that will ultimately translate into service delivery.
Enhanced productivity would lead to employers providing incentives to their employees, so as
to motivate them to ensure their efficient performance. Moreover, motivation is underpinned
by four content theories (discussed in detail in subsection 2.2.4) of motivation that tend to
dominate organisational thinking (Smit et al., 2008:340). Amaoko (2011:2) opines that
motivation and job satisfaction are achieved when an employee's efforts are rewarded.
To keep employees motivated at all times, employers need to create an environment that
promotes productivity, so as to prevent employees developing undesirable attitudes that might
lead to their poor behaviour (Higuera, 2014). When supervisors discuss their employees'
attitudes, more often than not they refer to the issue of job satisfaction, which is, at times, used
interchangeably (Robbins & Judge, 2011:110-111). Attitude is viewed as the manner in which
people view their roles, which, in turn, influence their opinions and/or beliefs (Robbins & Judge,
2011:106). Social psychologists tend to agree that attitudes have three components, namely
cognition, affect and behaviour (Robbins & Judge, 2011:106; 2014:98). Job satisfaction is seen
as the typical attitude that employees display towards their jobs, or roles, in an organisation
(Robbins et al., 2009:20).
Peptone (1999, cited in Padala, 2010:17) and Rotenberry and Moberg (2007, cited in Ahmad
et al., 2010:259) refer to job satisfaction to be as a summation of employees' feelings in four
distinct areas, namely the work, supervision, individual modification and social interactions.
Similarly, Bowling Green State University (BGSU) (2009:3) refers to job satisfaction as those
employees feelings related to their work. The most frequently used definition of job satisfaction
is stated as it being "a pleasurable or positive emotional state resulting from the appraisal of
one's job" (Locke, 1976, cited in Vanden Berghe, 2011:14).
The definition implies that a person with a high level of job satisfaction will hold positive feelings
towards their job, and one who is dissatisfied with their job will hold negative feelings about it.

14
The greater the job satisfaction, the more positive the job holder is likely to feel about his or
her job, and the more productive he or she will be.
The lower the job satisfaction, the more cynical the employees involved will tend to feel about
their job, and the less productive they will be in it. The wide-ranging definitions given above
anticipate that employees will interact with other employees and supervisors, as well as adhere
to rules and regulations, and be productive even under unfavourable conditions (Robbins &
Judge, 2011:114). Job dissatisfaction has long been considered to be a significant and
persistent problem in the Local Authorities. As a result, relevant theories have been developed,
and numerous studies have been conducted to identify the causes of job satisfaction.
Hertzberg (1987, cited in Amaoko, 2011:3) suggests the following interventions to eliminate
dissatisfaction amongst employees in any given organisation:
fix inadequate and obstructive company policies;
provide effective, supportive and non-intrusive supervision;
create and support a culture of respect and dignity for all team members;
ensure that wages and salaries are competitive;
provide job security; and
build job status by providing meaningful work for all positions.
Although the directives mentioned above are used by organisations to eliminate job
dissatisfaction, they do not necessarily translate into employees being satisfied with their jobs.
However, following the directives lays the groundwork for employees to be motivated (Amaoko,
2011:3). It is, thus, imperative for the leaders of any organisation to create pleasant working
environments to facilitate employee job satisfaction.
Hertzberg (1987, cited in Amaoko, 2011:3), asserts that it is imperative to take care of concerns
related to motivation to promote job enhancement in the workplace. His proposition in relation
to the above concerns will ensure that each job fits each job holder, which in turn, help to
ensure job satisfaction.

15
In general, employees tend not to be satisfied with their job, be it in some facet(s) of their job,
or the whole job. Such dissatisfaction is evident from the multitude of results obtained in various
studies that have already been conducted on job satisfaction. One such study, done in 2010
in the USA, indicated that employees' job satisfaction levels were at their lowest ebb of the
past 23 years (Wegrzyn, 2010, cited in Heskett, 2010). Furthermore, the dip in such levels was
seen as poor focus by individual staff members with increased emphasis on business
profitability (Akhil Aggarwal, 2010, cited in Heskett, 2010). The importance of employers caring
about their employees' happiness and job satisfaction levels cannot, therefore, be overstated
(Thornton, 2009).
According to Kerns (2008), there is evidence that greater job satisfaction, productivity and profit
is associated with employees that like their jobs because they become high performers The
researcher further asserts that securing a balance between performance and happiness could
bring about, and lead to the maintenance of, success in the workplace. Assessing the job
satisfaction levels of employees from time to time, so as to ensure that any aspect that causes
dissatisfaction is dealt with promptly is of paramount importance (Spector, 1997, cited in
Mueller & Kim, 2008:119).
According to Salleh et al. (2011:32) “performance is viewed as the implementation of an action,
or one's ability” to perform. This contention above refers to the way in which employees perform
their work, which, in turn, tends to influence their service delivery either positively or negatively.
Such performance is seen as the execution of competencies to achieve productivity. According
to Robbins and Judge (2011:118), an employee's response to job dissatisfaction can be
expressed in one of four different ways, consisting of the following:
exit is behaviour that is directed towards leaving the organisation, including looking for a new position, as well as resigning [exit is a destructive and active response.];
voice involves actively and constructively attempting to improve conditions, including suggesting improvements, discussing problems with one’s superiors, and some forms of union activity [voice is an active and constructive response.];
loyalty involves passively, but optimistically, waiting for conditions to improve, including speaking up for the organisation in the face of external criticism, and trusting the organisation and its management to ‘do the right thing’. [loyalty is a passive, but constructive, response]; and
neglect involves passively allowing conditions to worsen, including allowing oneself to become subject to chronic absenteeism or lateness, reduced effort, and increased error rate [neglect is a passive and destructive response].

16
Hertzberg (1987, cited in Amaoko, 2011:3) suggests undertaking the following interventions to
ensure job satisfaction:
providing opportunities for achievement;
recognising workers’ contributions;
creating work that is rewarding, and that matches the skills and abilities of the employees concerned;
giving as much responsibility to each team member as possible;
providing opportunities to advance in the company through internal promotion; and
offering training and development opportunities, so that the employees can pursue the positions they want within the organisation.
The attainment of job satisfaction can have a significant impact on employees' job
performance. In a study conducted by Rotenberry and Moberg (2007, cited in Ahmad et al.,
2010:259), employees who were positive about their jobs were found to perform better than
did those employees whose attitude was negative towards their jobs. Gu and Chi (2009, cited
in Shmailan, 2010:02) assert their belief that there is a "strong connection between being
satisfied at their job and their performance", the latter of which is viewed as the implementation
of an action, or one's ability to perform.
According to Salleh et al. (2011:32), job performance is seen as the execution of competencies
to achieve “quality, quantity, cooperation, dependability and creativity”. Thus, an organisation's
priority is to make job performance the primary focus of line managers, because, otherwise,
the performance level of the employees involved will deteriorate owing to the decline in their
skills, and if it does the job attitudes [job satisfaction] of employee worsen (Salleh et al.,
2011:32). An employee's level of performance is determined during job performance reviews
by an employer (University of Washington, 2007).
Kerns (2008) refers to job performance “actions that drive the achievement of key results”. In
contrast, happiness is “the experience of frequent, mildly pleasant emotions, the relative
absence of unpleasant feelings, and a general feeling of satisfaction with one’s life”.
Accordingly, job satisfaction and life satisfaction can be seen to be linked. Jex (2002, cited in
Vanden Berghe, 2011:) refer to job performance as a multitude of behaviours employees are
involved during their time at work.

17
The weakness of this definition lies in its failure to state whether the behaviour involved is
negative or positive, as well as in its failure to state whether the behaviours in question are
general, or specifically directed towards the job. A more acceptable definition is the one given
by Milkovich et al. (1991, cited in Vanden Berge, 2011), which describes job performance as
“consist[ing] of complicated series of interacting variables about aspects of the job, the
employee and the environment”. According to Bratton and Gold (2007:274) refers to job
performance as:
“the set of interconnected practices which are designed to ensure that a person's
overall capabilities and potential are appraised so that important goals can be set for
work [to deliver efficient and effective services] and … [job] performance can be
collected and reviewed.”
The three approaches defining the dimensions of job performance, according to Milkovich et
al. (1991, cited in Vanden Berghe, 2011:24) include viewing them as a function of outcomes,
behaviour, and personality traits.
Aziri (2011, cited in Shmailan, 2010:2) suggests that the purpose of employing staff is so that
they can execute the work assigned to them both efficiently and effectively. Thus, an
organisation's priority ought to make job performance the primary focus of line managers and
supervisors. According to Salleh et al. (2011:32) “performance is very important because it will
reflect the … [organisational] performance”. In the event that the level of job attitudes [job
satisfaction] of employees decline so does their performance. As alluded to above, job
satisfaction and job performance are somehow related. Locke (1983, cited in Thornton, 2009)
opines that "positive job satisfaction is higher productivity".
The assertion is, however, not supported by most researchers, who believe that job satisfaction
has no relationship to job performance (Thornton, 2009:12). The adoption of a PMS by
organisations ensures that employees perform at high levels, and, as such, serve to enhance
their competitive edge in delivering services to their clients (Bratton & Gold, 2007:275; Dessler,
2011, cited in Shmailan, 2010:02). However, the success of implementing a PMS rests mainly
with employees, especially at the senior level of management.
The various job attitudes (job satisfaction, job involvement, and organisational commitment)
play a significant role in job performance. For an LA to adopt a performance culture, they need
to take the job satisfaction of their employees into account.

18
For the CoW Municipality to improve its service delivery, the job satisfaction of its line
managers had to be taken into serious consideration. The assertion is in line with the view of
Robbins et al. (2009:79) that "happy workers are productive workers".
Zelenski et al. (2008, cited in Thornton, 2009:12) indicate that people that seem to be happy
are likely to produce more. Job performance refers to the way in which employees perform
their work, which, in turn, influences service delivery positively or negatively. Such
performance, while being seen as the coming together of competencies (knowledge, skills and
attitude) to achieve organisational goals, also refers to the execution of job-related tasks by
employees.
1.8 Research methodology
Research methodology refers to the systematic theoretical scrutiny of the theory and
assumptions on which a study is based (Saunders & Rojon, 2014:3). Moreover, Saunders,
Lewis and Thornhill (2012:674) refer to research methodology as "how research should be
undertaken, including the … philosophical assumptions upon which research is based and the
implications of the methods [involved]". According to the University of Southern California
(n.d.), research methods are "generalised and established ways of approaching research
questions (e.g., qualitative vs. quantitative methods)". Not all methods can be applied to all
research questions, so choosing such an approach is limited by the ambit of the study
conducted.
The quantitative research design is an excellent way of finalising results, and of proving, or
disproving, a hypothesis. The current study followed a deductive (quantitative) approach,
according to which the hypotheses involved were tested for their ability to form the basis of this
study, by means of the administration of a structured questionnaire. According to Gronhaug
and Ghauri (2005, cited in Mbundu, 2011:40), quantitative designs is used when there is a
large number of respondents in order to make accurate comparisons amongst the populations.
Quantitative research aims at testing theories, determining facts, statistical analysis,
demonstrating the relationships between aspects, and predicting findings.
To gather the required data, the researcher selected a quantitative design using a structured
questionnaire, as has been stated above. The use of such a method seemed to be appropriate
for the study on hand. The survey research, involving the above-mentioned questionnaire, was
undertaken to assess the job satisfaction of line managers in the CoW Municipality.

19
Survey research is especially appropriate for making exploratory and descriptive studies of
large populations, hence its appropriateness for the current study (Saunders et al., 2012:177).
The questionnaire survey design was chosen for the following reasons:
• it surveys large samples at a reasonable cost. In the current study, line managers in the CoW Municipality were surveyed;
• it is relatively objective, and the personal details of the participants remain unknown, and can be analysed statistically; and
• it is relatively easy to design and adopt.
However, the numerous problems to do with using the survey research method were
acknowledged by the present researcher, who attempted to minimise them. Details of the
problems and validity issues relating to such use are discussed in depth in Chapter Four.
Furthermore, the respondents were assured of the confidentiality of their personal details, and
the study was edited to protect the identity of the individuals concerned before its circulation
to the organisation's management.
The most important aspects of the research methodology adopted in the case of the current
study included the following: the research objectives; the research process, consisting of the
research philosophy and approach, the research design / methodological choices, the
research strategy, the time horizons, the techniques and procedures, the population, and the
sampling; the data collection procedures; and the research instruments (i.e. the questionnaire).
1.8.1 Research objectives
The research objectives were discussed in section 1.4.
1.8.2 Research process
The research process that was adopted followed the implementation of the ‘research onion'
approach could be applied to collect the required data that was needed to answer the questions
asked, as outlined in section 4.2. The six different topics chosen represented the various layers
of the ‘onion' (Saunders et al., 2012:160).
Each layer of the research onion is discussed in detail below to justify the selection of each
element concerned, and to show how it assisted with the answering of the relevant research
questions involved.

20
1.8.2.1 Research philosophy and approach
The outer layer of Saunders et al.’s (2012:160) research onion refers to the research
philosophy that was selected, which matched the research questions of the study, which acted
as guidelines for the researchers concerned (Saunders et al., 2012:129).
However, the various views and opinions that were linked to the research philosophies
considered consisted of: positivism; interpretivism; realism; and pragmatism (Saunders et al.,
2012:129-137). A detailed description of, and the differences in, each philosophical view were
indicated in the preceding paragraph, with the comparisons of the three approaches being
discussed in detail in section 4.3.The second layer of the ‘research onion' model refers to the
research approach. According to Saunders et al. (2012:129-137), the three alternative
approaches to research consist of: deduction; induction; and abduction (Saunders et al.,
2012:143-148).
After considering the various research strategies, the positivist position and the deductive
approach were chosen for the current study. The reason for the selection is that they were
found to be most suitable for the study, due to its quantitative nature. The study also needed
to test the hypotheses concerned to generate the required findings.
1.8.2.2 Research design / methodological choices
The research design refers to the overall strategy that is chosen to integrate the different
components of a study both coherently and logically, thereby ensuring that the research
undertaken will adequately address the research problem involved (Saunders et al., 2012:40).
According to Jensen and Laurie (2016:4), a research design serves as a roadmap for a study,
to help ensure the maintenance of a feasible and appropriate path. For the current study to
attain its objectives, as discussed in section 4.2, a research design was required to fit the study.
Saunders et al. (2012:159) refer to a research design as the plan, structure and strategy for
investigating what information was obtained from the research participants to provide answers
to specific research questions, to address a research problem, or to test a hypothesis.
Moreover, Blanche et al. (2010:34) refer to a research design as framework of strategic nature
that acts as a facilitator between the research questions and the implementation of the
research. The above definition is supported by Dahlberg and McCaig (2010:30), who recognise
a research design as being "an overarching strategy for unearthing useful answers to
problems".

21
Study designs consist of both quantitative and qualitative methodological approaches.
According to Flick (2009:26), a researcher may choose one (mono approach) or two
approaches in the same study, with the approach concerned being known as hybrid or mixed
(multiple).
According to Dahlberg and McCaig, (2010:22) qualitative research refers to non-numerical
data, which includes “in-depth interview, focus groups/group interviews and diaries”.
Quantitative research, which concerns numerical data, depends on counting and on statistical
analysis, which can include postal questionnaires, and online and structured interviews
(Blanche et al., 2010:47; Dahlberg & McCaig, 2010:22; Jensen & Laurie, 2016:12). The
research design espoused for the current study was the quantitative research approach.
1.8.2.3 Research strategy
Research strategies are manifold, as they give orientation to a study, while relying on an
established structure for the research design (Jensen & Laurie, 2016:15). In general, a strategy
is an action plan to accomplish an objective" (Saunders et al., 2012:172). The survey research
strategy was chosen for the current study, due to it being associated with the deductive
approach selected for the research.
1.8.2.4 Time horizons
The amount of time that was available for the current study was an important factor to consider,
as it entailed having to be limited time wise in regards to the undertaking of the research.
Saunders et al. (2012:190-191) and Bryman and Bell (2007:190-191) distinguish between two
opposing time horizons, the longitudinal analysis and the cross-sectional study.
Given the time constraints for the study, the cross-sectional research approach was selected
to provide a ‘snapshot' of the current levels of employees' understanding and an awareness of
their job satisfaction levels, as well as of their degree of job involvement, and the extent of
organisational commitment shown during the implementation of the PMS.
1.8.2.5 Techniques and procedures
A study must have an explicit plan in place, including consideration of the techniques
(sampling, data collection and analysis) to be used in selecting the participants who are
required for the study (Blanche et al., 2010:48).

22
The current study used a questionnaire as a technique for sampling, data collection and
analysis. The technique is expanded on in subsection 1.9.4 below.
1.8.2.5.1 Population
A population represents the group about which a study is designed to generate knowledge
(Jensen & Laurie, 2016:88).
It is evident from the above that a population is a group of elements from which a researcher
selects a sample with regards to which he or she might like to generalise the findings made
(Saunders et al., 2012:190-285). Henn, et al. (2006:129) simply put it as "the entire group that
you want to study". A population represents the entire group of people, and, if the group is
small, then it becomes possible to study the individual members of the population (Kumar,
2012:193; Jensen & Laurie, 2016:88).
1.8.2.5.2 Research Sampling
Sampling is the process of selecting units (e.g. people and organisations) from a population of
interest, so that, by studying the sample, results may reasonably be generalised back to the
population from which they came (Bryman & Bell, 2007:180-182). The research objectives set
and the questions for a study determine the nature of the sample required (Saunders et al.,
2012:158).
Careful decision-making regarding the sampling size is required before selecting the
respondents involved, so as to ensure that the research concerned is neat and of sufficient
empirical depth. The selection of the sample size was based on the guidelines suggested by
Saunders et al. (2012:266).
Two sampling techniques exist, namely non-probability and probability sampling (Saunders et
al., 2012:158). Probability sampling (or representative sampling) is a sampling technique in
terms of which the required samples are gathered by means of a process that gives all the
individuals in the population an equal chance of selection (Jensen & Laurie, 2016:93). A non-
probability sample is a “sample that has not been selected using a random selection method
”Bryman & Bell, 2007:182). For this study, non-probability sampling (volunteer sampling) was
selected and used. The volunteer sampling (self-selection sampling) allows respondents’ to
decide if they are interested to participate in the research (Saunders et al., 20012:289).

23
1.8.3 Data collection procedures
The collection of data for the current study took place through the administration of the Job
Descriptive Index (JDI) and JIG measures (questionnaires) consisting of only closed-ended
questions. The questionnaire contained two sections, namely Section A that was designed to
elicit demographic information from the respondents, and section B, containing statements that
were directed at evaluating the participant's job satisfaction. The use of a questionnaire was
preferred to other methods, as the employment of such a tool is relatively inexpensive and
efficient. Also, the results obtained were easily quantifiable and facilitated statistical analysis.
Furthermore, the use of a survey questionnaire was selected because of the method’s
established validity and reliability, relative ease of administration, and user- friendliness, as
well as because it had previously been used extensively by other researchers.
The demographical information (section A) obtained enabled the researcher to analyse the
participants' responses according to the grouping of the individual information of each
respondent, such as age, gender, level of education, and length of service in the CoW
Municipality. Section B of the questionnaire contained statements to which the interviewees
were required to respond.
The JDI measured the individual's satisfaction with different facets of their jobs, such as the
work itself, their pay, promotion opportunities, supervision and relationships with their co-
workers. The JIG scale measured the respondents’ overall level of satisfaction with the job.
Both the aforementioned measures were administered in paper-and-pencil format, while some
were electronically distributed, via email or online survey (BGSU, 2009:3).
The JDI and JIG measures consisted of short lists of phrases and adjectives describing
different facets of the job, or the overall job. The respondents had to select ‘yes’, ‘no’, or
‘uncertain’ in response to each word or short phrase supplied. A ‘yes’ response meant that the
adjective or phrase concerned described the job situation involved, whereas a ‘no’ response
meant that the adjective or phrase was not considered to describe the job situation, and
‘unknown’ meant that the respondent could not decide whether or not the descriptors were
applicable to their job situation (BGSU, 2009:3).
The information obtained enabled the researcher to analyse the data given, to work through
the findings, and to devise recommendations, as are given in chapters Five and Six.

24
1.8.4 Research instruments (i.e. the questionnaire)
The JDI and JIG questionnaire is unique amongst measures of job satisfaction, because of its
continual revision. The original version of the questionnaire was published in 1969. Since then,
the scale was revised in 1985, 1997, and, most recently, in 2009 (Lake et al., n.d.).
Furthermore, the questionnaire has demonstrated excellent reliability and validity as a
research instrument over the years (Lake et al., n.d). A detailed discussion of the selection and
description of the instrument is given in Chapter Four.
The questionnaires were self-reported measures of job satisfaction, in terms of which the JDI
scale was used to measure the amount of job satisfaction experienced in terms of different
facets of the job situation (the work itself, the pay, the opportunities for promotion, the nature
of supervision, and the relationships with co-workers), and the JIG scale was used to measure
the overall degree of job satisfaction experienced.
Obtaining an individualised picture of job satisfaction was, thus, feasible, as well as was
securing an accurate measurement of the level of job satisfaction prevailing among groups of
individuals, in terms of numerous workplace factors.
As the researcher opted to administer the questionnaires electronically, they were distributed
via email, together with a covering letter to all the respondents, since all the participants
concerned had access to email facilities.
The respondents were required to print out, and to complete, the questionnaire, after which
the researcher collected the completed questionnaires in person. The collected data are
presented as follows:
• frequency tables have been used for the demographic information in section A; and
• figures and tables have been used for the research questions in section B.
1.9 Ethical considerations
Since the study involved the employees of a particular institution, it was important to consider
the ethical issues involved. This will ensure that the required ethical standards were met, as
suggested by Bryman and Bell (2007:127) and that they are associated with integrity of a piece
of research and of the disciplines that are involved. Ethics in research refer to the behavioural
values associated with researcher’s behaviour in relation to the rights of the participants’ in the
research (Saunders, et al., 2012:226).

25
Struwig and Stead (2003, cited in Naanda, 2010:88) opines that Research ethics provides
moral guidelines to researchers on how to conduct research, thus helping researchers to avoid
scientific misconduct such as distorting and inventing data, plagiarism, publishing other
researchers' work as their contribution without acknowledging the source, failing to maintain
anonymity and confidentiality to the respondents, and falsely reporting results.
Bryman and Bell (2007:127) opine that ethics in research cannot be disregarded, because they
relate to the integrity of the study and the broader field within which it resides. Given the above,
a high standard of research ethics was maintained throughout the current study. Additionally,
plagiarism was avoided (Bryman & Bell, 2007:120-133), as well as was the preventing of harm
to the participant, invasion of privacy, and deception of the participants. The participants’
consent was also ensured, as suggested by Diener and Crandal (1978, cited in Bryman & Bell,
2007:132).
1.10 Scope and limitation
The current study was limited to determining the job satisfaction levels of line managers in the
CoW Municipality. The fact that the study was only conducted in one municipality could impact
on, or even limit, the Generalisability of the research findings obtained in relation to other
municipalities.
Due to the limited amount of time that was available for the study, the research concentrated
on only one municipality, as it was impossible to conduct a study on all the Namibian
municipalities. During the study period, the environment was uneasy, due to a deadlock on the
harmonisation of job grades that occurred at the time. Hence, the adverse situation might have
influenced the responses that were obtained, as there was constant uncertainty and
indecisiveness during the job evaluation (JE).
Time constraints could also have had an adverse impact on the present study in terms of the
participants having to take the time to respond, as the period during which it was undertaken
was impacted on by the wage negotiation occurring at that stage. In general, the focus of the
study was on CoW Municipality employees, who were subject to the Paterson grading system.
The study was, therefore, largely dependent on the honesty, sincerity and integrity of the
respondents concerned.

26
1.11 Significance of the study
Every leader has to ensure that employees are well taken care of while they are at work.
Employees have to be seen to perform their duties within an expedient working environment
in which they are satisfied with their jobs.
To enhance productivity, it is necessary to ensure that employees are satisfied with their jobs.
To be able to achieve such job satisfaction, the leaders involved need to know what contributes
to the job satisfaction, or job dissatisfaction, of those employees who are under their charge.
The significance of the present study was to investigate and highlight the levels of job
satisfaction amongst line managers at the CoW Municipality.
Therefore, the study recommended to the CoW Municipality top management how to improve
the job satisfaction of the employees concerned. The results of the study might be of value to
executives in understanding what causes individual job satisfaction and dissatisfaction.
Furthermore, the study’s value might lie in showing how such factors are linked to job
performance, and how the latter can be encouraged and promoted within the organisation. In
respect to the above, firstly, the present study provides an enhanced understanding of the
issues of motivation, attitude (job satisfaction), and organisational and job performance
through the literature review that was undertaken in the associated research.
Such knowledge is likely to contribute to determining the employees' readiness and
receptiveness that are necessary for their successful participation in the implementation of the
new PMS, as reflected by their prevailing levels of job satisfaction. An organisation's human
capital can become its competitive advantage, and, therefore, job satisfaction and its influence
on job performance are crucial to the CoW Municipality's service delivery. After all, regardless
of any technological advancement, the CoW Municipality still depends on its human capital for
effective service delivery. Hence, it might no longer be feasible to consider an individual's level
of job satisfaction in isolation from their job performance.
Furthermore, the present study, in addition to assessing and describing the prevailing status
quo, also provided critical insights that could prove necessary in assisting the CoW Municipality
to revisit and address identified issues that are vital, namely the attaining of employee job
satisfaction and, ultimately, their efficient job performance and service delivery. The study
provides comprehensive insight into the state of line managers’ levels of job satisfaction, and
what impact their job satisfaction was having on their performance.

27
The CoW Municipality could benefit from the present study of the job satisfaction levels of their
employees, especially if, and when, actions are taken on the findings and recommendations
of the study to ensure the following:
• that no finances are wasted on poor performance that could have been prevented;
• the guaranteeing of the provision of quality service to the ratepayer;
• the proper implementation of future amendments to the PMS; and
• the recruitment of employees with the right attitude.
Secondly, the study was expected to inform the executive team of the CoW Municipality about
the degree of job satisfaction among line managers. Such information could have been
evidence of their buy-in (acceptance) and/or resistance (rejection) to the proposed PMS, with
their approach having subsequent effects on the related implementation thereof.
Thirdly, the researcher benefited from the study, in that he developed an in-depth
understanding of the topic, as it provided a wealth of information. Fourthly, the study could
prove beneficial to other researchers who wish to conduct similar studies, as they can acquire
background information from the results of the study, which could serve as a guideline for the
modification of their own research. The study could add to the growing body of knowledge in
the field of work attitude and performance. The results of the study could also serve as a guide
to other researchers who would like to embark on a study of a similar nature.
Lastly, the issues identified could further inform recommendations regarding certain areas that
researchers can investigate to establish the variables underpinning job satisfaction and job
performance.
1.12 Outline of the thesis
The introductory chapter has served to introduce the subject matter at stake, to set the relevant
context, and to provide the purpose of the research. The thesis is divided into nine chapters,
which serve as a route map guiding the reader through the rest of the thesis. As such, brief
details of the content of each chapter are given in such was to present an overview of how the
storyline of the research unfolds.
The first three chapters after the introduction are made up of the literature review, a description
of the background of the municipality, and a depiction of the research methodology.

28
The following five chapters encompass the sections revealing, discussing and analysing the
results, and the making of conclusive remarks and recommendations. A summary overview of
the study concludes the thesis.
1.12.1 Chapter One: Background to the research problem
Chapter one has provided an overview of the concepts being researched in the current study,
namely job satisfaction and job performance.
The chapter has briefly highlighted the background to the study, the problem statement, the
purpose of the study, the research objectives, and the questions and hypotheses of the
research. The researcher's assumptions, the theoretical framework, the significance of the
study, its scope and limitations, and its methodology are provided, ending in the chapter's
outline.
1.12.2 Chapter Two: The literature review
Chapter two gives the context of the research topic. The chapter consists of a literature review
that highlights the theories of motivation, job satisfaction and job performance within a relatively
wide context.
Firstly, the chapter commences with a discussion of the concept of the motivation process and
its various definitions, and how they relate to job satisfaction and job performance. The chapter
further reviews the relevant literature, and critically reflects on the relevant content theories, as
well as on the subject matter that has generated on going empirical study over the decades.
Secondly, the chapter discusses the concept of attitudes and behaviour at work and its related
definitions, followed by the components and causes and types of employee job attitudes.
Thirdly, job satisfaction as a work attitude is discussed, with its related definition being
introduced, followed by a discussion on how to measure job satisfaction, the causes and
consequences of job satisfaction, and the effect of positive or negative job satisfaction in the
workplace. Fourthly, the concept of PM and the related definition of job performance are
introduced, followed by discussions on the management of organisational performance,
including the meaning of performance and PA, team performance, the individual, the role of
line managers in individual performance, the psychological contract (PC) and job performance,
ending in a summary of the chapter.
29
1.12.3 Chapter Three: Overview of the Municipal sector in Namibia
Chapter three deals with overview and background of the Municipality sector in Namibia. The
above is followed by a discussion of the CoW Municipality and its operations and staff
management, the PMS at CoW Municipality as an essential element of local government
modernisation, how the perceived research problem is experienced, the shortcomings of the
performance, the PA in the municipality, the decision to change to a new PMS, and the nature
of the adopted PMS, ending in a summary of the chapter.
1.12.4 Chapter Four: Research design and methodology
Chapter four, the researcher identifies and discusses the research design and methodology
used, including the research objectives and questions, the process (including the philosophy
and approach), the research design, the nature of research design, the research strategy, the
techniques and procedures, the data processing and analysis, the time horizon, the
questionnaire validity and reliability, the limitation and delimitation of the study, and the ethical
considerations concerned.
Further detailed discussions focus on the research instruments and questionnaire used, the
population and sampling, the administrative procedures involved, and the statistical data
analysis undertaken.
Furthermore, the chapter explains the modus operandi employed by the researcher to test the
theoretical propositions of the study. To that effect, the systemised rules, procedures and
practices involved are propounded. The sampling, with its accompanying sample size and
sample-specific properties, are mapped out. Moreover, the collection, capturing, analysis and
interpretation of the data are concisely and thoroughly presented.
The chapter concludes the above-mentioned discussions with an array of measuring
instruments, including the JDI and JIG questionnaire, and the data analysis, using the chi-
square test, t-tests, correlation, and multiple regressions.
1.12.5 Chapter Five: Data analysis and research findings
Chapter five illustrates the results of the study that emerged from the data analysis. The
descriptive statistics, in terms of the demographic data, the frequencies, the means, the
standard deviations, the analysis of variance (ANOVA) and the correlation among participants
are presented together with figures and tables.

30
1.12.6 Chapter Six: Discussion of results
Chapter six presents a detailed interpretation and the findings of the study in the sequence in
which they were reported, with discussions of the descriptive statistics being reported first, so
as to give a biographical overview of the sample data involved. The above is followed by an
interpretation of the outcomes of the scores on the six items contained in the JDI facets and
on the JIG scale. Through the discussions, the testing of the hypotheses and the assumptions
made are discussed and clarified, with the appropriate conclusions being drawn.
1.12.7 Chapter Seven: Conclusion and recommendations
Chapter seven draws concluding remarks about the research aims and questions, with a
critical evaluation of the methodology, and a discussion of the study’s limitations, and of the
opportunities for further research. Furthermore, the study concludes by summarising the
findings and the specific recommendations made based thereon.
1.13 Chapter summary
The current chapter has provided an introduction and the background to the study, along with
the detailing of the objectives for undertaking the study and related questions.
The above was followed by the research hypotheses and assumptions, the theoretical
framework, the significance of the study, the research methodology and design, validity and
reliability issues, the limitations of the study, and, finally, the layout of the chapter.
The following chapter, Chapter Two, reviews the literature on job satisfaction and job
performance.

31
CHAPTER TWO
LITERATURE REVIEW
2.1 Introduction
The most significant challenge that is posed to the contemporary management of human
capital is the maintenance of employees’ motivation. Motivation results in the enhancement of
employees’ levels of job satisfaction, and in improved job performance, with the sole purpose
of motivation being to increase the efficiency, the effectiveness, and, ultimately, the productivity
that could culminate in quality service delivery.
In contrast, employee job satisfaction (job attitude), or lack thereof, influences the performance
of employees that leads to either excellent or poor service delivery. The motivation, job
satisfaction and job performance of employees are important tools whereby management can
achieve organisational goals and objectives (Mullins, 2010:252). It is, thus, important for
management to keep employee motivation high, so that the employees may exhibit high
performance levels. Employee motivation and job satisfaction are intricately linked, though
there are differences between the two, which are highlighted in the current chapter.
Chapter Two provides insight into contemporary literature reviews and thoughts by
researchers related to the research covered, especially in the areas of theories of motivation
and employee job satisfaction, with the latter being the most important employee job attitude,
and its relationship to job performance.
The chapter is divided into various sections, starting with the introduction, and continuing with
a discussion on motivation in the workplace, the motivation process, the definition of
motivation, and content theories of motivation. Furthermore, the chapter also discusses job
satisfaction as a work attitude, and defines the term ‘job satisfaction’. A discussion follows of
the different types of job satisfaction, and of contemporary research on the general satisfaction
of employees, and on how to measure employee job satisfaction, as well as on the causes of
job satisfaction/dissatisfaction.
Finally, the chapter discusses job performance, with the discussion being inclusive of
managing organisational, individual, and team performance, the role of line managers, job
satisfaction and performance, and the PC. In conclusion, Chapter Two ends with a summary
of the chapter.

32
2.2 Motivation in the workplace
Motivation inspires people to act in a particular manner (Smit et al., 2008:338). Successful
organisations aspire to employ the best and the most highly motivated workers who are
available in the labour market. Motivated employees are well-known to be “characterised by
high productivity, better quality of work with less wastage, and [to have] a greater sense of
urgency” (Riley, 2012) than do less well-motivated workers.
Researchers have, over the years, devised various theories to discover what motivates
employees, and considered how they can employ the findings to raise employee motivation
levels, so as to improve their performance and satisfaction (Smit et al., 2008:337). Motivation
in the workplace is primarily seen as the driving force behind human behaviour regarding their
work (Smit et al., 2008:338), with it varying “both between individuals and within individuals at
different times” (Robbins & Judge, 2011:238). The analysis of motivation, as was mentioned
earlier, “Attempt[s] to understand why people act in particular ways and seek[s] to draw general
conclusions from individual cases”. The challenge, thus, for employers is, primarily, to find
motivated employees for their organisations, so as to ensure sustained performance that
ultimately translates into efficient service delivery.
Throughout the analysis of the literature surrounding employee performance, it has become
evident that some factors associated with employee motivation are also related to employee
job satisfaction (job attitude) and performance. According to Amaoko (2011:1), employee job
satisfaction (job attitude) is somehow linked to the motivation of employees that leads to
effective and efficient performance, which is relatively difficult to achieve.
It is, however, vital to take into account that motivation alone cannot influence performance.
Smit et al. (2008:339) suggest that the relevant factors to be taken into consideration in this
respect are “motivation (goal or desire), ability (training, knowledge, and skills) and the
opportunity to perform”.
Furthermore, the author explains motivation as follows: “Motivation × Ability × Opportunity =
Performance” Then again, according to Mullins (2010:254), performance is made up of ability
level and motivation (performance = function (ability × motivation). Motivation, in the current
study, was confined to the analysis of the worker's psychological level alone, with other forms
of motivation, therefore, not forming part of the discussion. According to Robbins and Judge
(2011:238), motivation is regarded as “a process that accounts for an individual's intensity,
direction, and persistence of effort toward attaining a goal".

33
2.2.1 The motivation process
Due to the multiple needs that the same people have at any one time, it is virtually impossible
to satisfy them all simultaneously. As soon as the one need is satisfied, the ensuing need
becomes apparent (Smit et al., 2008:338). The motivation process shown in Figure 2.1 below,
is the one advocated by Smit et al. (2008:338), was adopted for the current study.
Feedback
Figure 2.1: The motivation process
(Adopted from Smit et al., 2008:338)
In its simplest form, the motivation process begins with a need, which emanates from an
individual's perception of a deficiency that they have (Smit et al., 2008:338). While general
motivation is concerned with any need, the current study narrows the focus to organisational
needs that are reflected in work-related behaviour. For instance, an employee might feel the
need for more challenging work, for higher pay, for more time off, or for the respect and
admiration of their colleagues. His or her desire (motive) is, consequently, to attain an above-
average performance score. Such needs lead to thought processes that guide an employee's
decision to satisfy them, by means of following a particular course of action (behaviour).
According to Schulze and Steyn (2003, cited in Teck-Hong & Waheed, 2011:4-5) "… in order
to understand people's behaviour at work, managers or supervisors must be aware of the
concept of needs or motives, which will help ‘move’ their employees to act.”
The motivation process concerns the unsatisfied need of an individual, with the need
eventually leading to a state of tension that is followed by an unspecified amount of effort,
depending on the extent of the pressure that is required to satisfy the need. The result can be
poor or excellent performance from the employees. It is, thus, essential for management to
understand why some employees perform better than do others during different situations and
at different times. The consequence of the above-mentioned behaviour could lead to a person
being either satisfied, or dissatisfied. If an employee's chosen course of action results in the
anticipated outcome and reward, that person would, likely, be motivated by the prospect of a
similar rewarding act in the same way in future. The need of an employee might motivate him
or her to engage in a particular form of behaviour.
Need Motive Behaviour Consequences Satisfaction/Dissatisfaction

34
He or she may then decide to work overtime, so that they exceed their allotted targets.
Furthermore, the employee might be satisfied if he/she receives a bonus, but dissatisfied if
they do not. However, if an employee's actions do not result in the expected reward, they are
then unlikely to repeat the same behaviour as a result of dissatisfaction. It, therefore, appears
that the reward acts as a feedback mechanism to help the employee to evaluate the
consequences of their behaviour when considering future action.
If the employee remains dissatisfied, his/her need remains unsatisfied, and the motivation
process commences from the beginning again. The sole purpose of employing people is to
obtain the performance of work. Thus, the primary duty of line management, after the
employment of an individual, is to ensure that their subordinates perform to the best of their
ability (Robbins et al., 2009:19). Mol (2008:8) concurs with the authors mentioned above, but
also states that employees function at one of three basic levels:
“minimum level: doing less than what is required;
expected level: doing what is required; and
Maximum level: doing more than what is required.”
Employees at the first level are prone to make errors, to be tardy, and to do poor-quality work,
with some of them even being ill-disciplined. Employees at the expected (second) level do
what is required from their superiors, with nothing more and nothing less. Employees at the
third and last level perform way beyond their targets, exerting effort to satisfy the requirements
of their workplace (Mol, 2008:9). Such employees are also characterised by taking the
initiative, by applying their competencies, and by employing extra effort to achieve
organisational goals – such employees are deemed motivated. Furthermore, Mol (2008:7)
indicates that, when employees do a job solely for the sake of being paid, they are moved,
rather than motivated. The author further suggests that motivated employees enjoy their work,
and are completely involved therein (Mol, 2008:6).
In conclusion, Mol (2008:9) opines that motivation stems from the design of work that makes
workers proud of their achievements. Kusin (n.d) cited in Mullins (2010:253), opine that "work
is about letting people know they are important, their hard work and efforts matter, and they’re
doing a good job. And this kind of recognition, in fact, can sometime be more important than
money. Thus, motivation can reward employees what they really want most from work. In
return managers can expect productivity, quality and service.

35
2.2.2 Definitions of motivation
The meaning of the Latin word motivus is ‘a moving cause’, with the word ‘motivation’
stemming therefrom (Herbert, n.d.). In contrast, Smit et al. (2008:338) state that the meaning
of the Latin word movere is ‘to move’, with the word ‘motivation’ stemming therefrom.
Table 2.1: Definitions of motivation
Definitions Source
1 “A passion to work for reasons beyond status and money; a propensity to pursue goals with energy and persistence”
Huczynski and Buchanan (2007:147)
2 “An inner desire to satisfy an unsatisfied need” Smit et al. (2008:337)
3 “The processes that account for an individual’s intensity, direction, and persistence of effort toward attaining a goal”
(2011, 2014:216)
4 “[F]orces acting either on or within a person to initiate behaviour”
Herbert and Cofer, (n.d.)
5 “The forces within an individual that account for level, direction and persistence of effort expended at work”
Schermerhorn et al. (1985, cited in Amaoko, 2011:1)
6 “Motivation is the creation of stimuli, incentives and working environments that enable people to perform to the best of their ability"
Chartered Management Institute (n.d., cited in Mullins, 2010:253)
7 "[A]n internal force, dependent on the needs that drive a person to achieve"
Teck-Hong and Waheed (2011:75)
The various definitions of the concept ‘motivation’ are subjected to individual interpretation and
understanding. The definition of motivation that was adopted for the current study was the
systematic workplace process that influences employees’ job attitude and job satisfaction,
leading to sustained employee performance.
2.2.3 Theories of motivation
Theories of motivation can be utilised to elucidate the behaviour and attitude of employees,
hence the many challenging theories that have arisen in an attempt to clarify the concept of
motivation (Mullins, 2010:259).
Motivation theories seek to explain why employees are motivated by, and satisfied with, one
type of work and not with another. As was stated in 2.2.1 above, it is essential for managers
to have a basic understanding of what motivates employees, because highly motivated
employees are more likely to produce superior quality products or service than do employees
who lack similar motivation (Mullins, 2010:259).

36
Furthermore, the author opines that theories cannot predict specific behaviour, but can only
suggest possible actions that might be taken under specific circumstances. This is so because
a variety of factors need to be taken into consideration.
Table 2.2 below classifies the different theories of motivation that were available at the time of
the study. However, the current research discusses only the four content theories of motivation
that dominate current organisational thinking (Smit et al., 2008:314; Mullins, 2010:259-277).
Table 2.2: Classification of motivation theories
Content theories Process theories Reinforcement theories
Focus Identifying the needs that employees want to satisfy; and
Determining the factors that influence employee behaviour.
The process of goal- setting; and
Evaluating the levels of satisfaction attained after the achievement of goals.
Behaviour as a function of its consequences.
Theories Maslow’s hierarchy of needs model;
Herzberg’s two-factor theory;
McClelland’s achievement motivation theory; and
Alderfer’s modified need hierarchy model.
Equity theory; and
Expectancy theory.
Reinforcement theory.
The content theories of motivation explain the underlying forces determining why people
(employees) have different needs at different times. Employee attitudes are positively
influenced when employers notice what motivates the employee (Smit et al., 2008:340).
2.2.4 Content theories of motivation
The content theories are grounded on the supposition that people have an individual need,
which serves as their motivator (Teck-Hong & Waheed, 2011:75). Before discussing motivation
theories, it is essential first to define the term ‘theory’. English Oxford Living Dictionaries
(EOLD) (n.d.) define the term ‘theory’ as “a supposition or a system of ideas intended to explain
something, especially based on general principles independent of the thing to be explained”.
The Cambridge English Dictionary (CED) (n.d.) define the term ‘theory’ as “something
suggested as a reasonable explanation for facts, a condition, or an event …”.

37
Robbins et al. (2009:523) define the term ‘theory’ as "a set of systematically interrelated
concepts or hypotheses that purport to explain and predict phenomena". The
BusinessDictionary (n.d.) define the term theory as “a set of assumptions, propositions, or
accepted facts that attempts to provide plausible or rational cause-and-effect (causal)
relationships among a group or observed phenomenon”. It said to have its origin from the
Greek work thorȯs, a spectator).
Research conducted over the years by academics has resulted in them developing theories of
workplace motivation (Sandilands, n.d.). Each of the theories concerned proposes the taking
of a particular approach to the causes and effects of worker motivation, with all the approaches
involved having been used before, with some degree of success. Mullins (2010:253) opines
that “the purpose of motivation theories is to predict behaviour [attitude]”. The content theories
of motivation discussed in the current study include:
the hierarchy of needs model by Maslow’s;
the modified need hierarchy model by Alderfer’s;
the two-factor theory Herzberg’s; and
the achievement motivation theory McClelland’s.
Based on a review of motivation theory, Mitchell (n.d., cited in Mullins, 2010:253) identified four
common characteristics underlying the definition of motivation:
motivation is typified as an individual phenomenon. Each person is unique, and all the major theories of motivation allow for their uniqueness to be demonstrated in one way or another;
motivation is usually described as being intentional. Motivation is assumed to be under the worker’s control, and behaviours that are influenced by motivation, such as the amount of effort expended, are seen as choices of action;
the two factors of greatest importance to motivation, which is multifaceted, are: (i) what gets people activated (arousal); and (ii) the force of an individual to engage in desired behaviour (in terms of direction or choice of behaviour); and
the purpose of motivational theories is to predict behaviour. Motivation is neither the behaviour itself, nor is it the performance. Motivation concerns action, and the internal and external forces that influence a person's choice of action.

38
As discussed above, content theories refer to employee needs that are seen as shortages
that invigorate, or that initiate, attitudes that fulfil the identified needs. It is evident that the
stronger the needs concerned are, the more motivated the employee is to satisfy them. In
contrast, a satisfied need does not translate into a motivated employee, as needs cannot be
viewed in isolation (Smit et al., 2008:339). The content theories of motivation are part of the
body of management theories designed and implemented to assist and bolster employee
performance, and, ultimately, quality service delivery. They emphasise what motivates
employees.
2.2.4.1 Maslow’s hierarchy of needs theory
One of the earliest and best-known content theories is the needs hierarchy theory developed
by psychologist Abraham Maslow (Smit et al., 2008:340; Robbins and Judge, 2011:239).
Robbins et al. (2009:145) and Robbins and Judge (2011:239) state that all humans have five
levels of needs. The different levels, from highest to lowest, are needs relating to the self-
fulfilment, or self-actualisation, needs, esteem or egoistic needs social needs safety and
security needs and physiological needs. Figure 2.2: below, are the levels of needs, according
to Maslow:
(Adopted from Smit et al., 2008:340; Robbins et al., 2009:145)
Figure 2.2: Maslow hierarchy of needs

39
As can be seen from the above, physiological needs, which include the need to satisfy
biological requirements for food, air, water, and shelter, are at the bottom of the hierarchy. The
next tier up is constituted of safety needs involving the need for a secure and stable
environment, and for the absence of pain, threat, or illness.
Belongingness includes the need for love, affection, and interaction with other people. The
need for esteem includes the need for self-esteem, which is realised through personal
achievement, as well as the need for social esteem through the recognition of, and respect
from, others.
At the top of the hierarchy is self-actualisation, which represents the need for self-fulfilment,
meaning a sense that the person’s potential has been realised. Maslow (1950, cited Smit et
al., 2008:341; Robbins & Judge, 2011:239) theorised that each level of need must be met
before the person can begin to focus on satisfying the need expressed in the level above.
2.2.4.2 Alderfer’s existence, relatedness and growth (ERG) needs theory
Maslow's model laid the foundation for Alderfer's ERG need theory concerning the needs
included in his model. Robbins and Judge (2011:239) opine that the theory has the best
research support amongst the early theories, concluding that it allows for reasonably "well-
supported predictions of the relationship between achievements need and job performance".
Basically, Alderfer (1969, cited in Value Based Management.net, n.d.) simplified Maslow's
theory by re-categorising his hierarchy of needs into three different categories, existence
needs (consist of physiological and safety needs and comprising Maslow’s first two levels),
relatedness needs (consist of social and external esteem and comprise Maslow's third and
fourth levels), and growth needs, (consist of internal esteem and self-actualisation needs and
comprising Maslow's fourth and fifth levels).
The ERG framework takes into account that the order of importance of the three types might
differ for each person. Hence, managers need to consider that many different employees’
needs require satisfying at the same time. Concentrating on satisfying one need at a time is
unlikely to motivate employees (Value Based Management.net, n.d.).

40
Figure 2.4 below illustrates, ERG needs that correspond to Maslow's conceptualisation of
physiological and safety needs.
(Adopted from Robbins and Judge (2011:239)
Relatedness needs refer mainly to Maslow's conceptualisation of belongingness needs, while
growth needs correspond to Maslow’s conceptualisation of esteem and self-actualisation
needs.
(Adopted from Swanepoel et al., 2008:325-327)
Self-actualisation needs
Esteem needs
Social needs
Safety needs
Physiological needs
Growth needs (Psychosocial)
Relatedness needs (Biosocial, cognitive)
Existence needs (First-order needs)
Figure 2.3: The ERG needs theory
Figure 2.4: Maslow’s hierarchy of needs with Alderfer’s ERG theory merged
Growth needs
Relatedness needs
Existence needs
Creativity, continued self-development
Self-confidence, achievement, competence, knowledge, autonomy, reputation, status, and respect
Desire to creative and productive, as well as to compete for meaningful tasks

41
Unlike Maslow’s theory, which postulates that the lower level needs could first be satisfied
before the higher level needs are, the ERG model postulates that needs are satisfied as, and
when, they occur. This emanates from the assertion that people’s (in the present instance,
employees’) needs "may vary for each" (Value Based Management.net, n.d.). If the existence
and relatedness needs have been satisfied, but growth need fulfilment has been blocked, the
individual will become frustrated, and relatedness needs will again emerge as the dominant
source of motivation.
According to value-based management. net (n.d.), the frustration-regression principle relates
to when a “higher level need remains unfulfilled, the person may regress to lower level needs
that appear easier to satisfy”. The principle concerned influences motivation in the workplace.
The author states that, “if growth opportunities are not provided to employees, they may
regress to relatedness needs, and socialise more with co-workers”. The more co-workers
socialise at the workplace, the more productivity suffers. It is the duty of management to identify
such behaviours earlier and to take actions to satisfy the frustrated needs of the employees to
enable them to come back on track with their growth.
2.2.4.3 Herzberg's two-factor theory of motivation (model)
One of the earliest theories of job satisfaction is Herzberg’s two-factor theory, which is believed
to encompass a practical approach to employee motivation (Teck-Hong & Waheed, 2001:76).
Herzberg (1950, cited in Smit et al., 2008:343), Robbins et al. (2009:14) and Robbins and
Judge (2011:240) indicated that Herzberg conducted research to determine the “relationship
between job satisfaction and productivity”, using 200 accountants and engineers from over
nine companies in the United States.
According to Teck-Hong and Waheed (2011:76), the above-mentioned professionals were
asked to describe experiences in which they felt either extremely bad or outstanding about
their jobs, and to rate their feelings on the experiences. Herzberg concluded that aspects that
impact on job satisfaction differ from those that influence dissatisfaction, hence the name that
was assigned to his theory, being the ‘two-factor model’ (Herzberg, 1950, cited in Smit et al.,
2008:343; Robbins et al., 2009:246; Robbins & Judge, 2011:24; Teck-Hong & Waheed,
2011:76). Hertzberg (1969, cited in Teck-Hong & Waheed, 2011:76) indicates that the
significant finding of his research was that the events that led to satisfaction were,
unsurprisingly, of an entirely different kind from those that led to dissatisfaction.

42
According to Teck-Hong and Waheed (2011:76), Hertzberg found that real feelings are
commonly associated with the job content (referring to hygiene factors) such as "interpersonal
relationships, salary, supervision and company policy”. Motivators are those elements that are
built into the job itself, "such as achievement, recognition, responsibility and advancement".
Motivating factors are intrinsic factors, such as a sense of achievement, recognition, the work
itself, responsibility and advancement (in relation to personal growth), that contribute to the job
satisfaction of employees and that are directly related to job content.
According to Herzberg (1950, cited in Smit et al., 2008:343), hygiene factors include:
organisational policy; administration; status; job security; supervision; relationship with one’s
supervisor; salary; work conditions; relationships with peers and subordinates; and personal
life. If not adequately considered, the factors can contribute to job dissatisfaction that is related
to the job context.
Furthermore, the author states that the consideration of hygiene factors in the work
environment can help to eliminate resentment, with the absence of such consideration possibly
causing dissatisfaction. The failure to take hygiene factors into account in the workplace is
associated with negative feelings of the employees, thus detracting from their motivation.
The hygiene factors are similar to Maslow's lower needs, with their consideration being
regarded as contributing towards the prevention of dissatisfaction (Smit et al., 2008:343). One
set of factors entails those which, if absent, can cause dissatisfaction. Figure 2.3 below
illustrates the motivator and hygiene factors.
Satisfied
AREAS OF SATISFACTION
Not satisfied
Not dissatisfied
AREAS OF DISSATISFACTION
Dissatisfied Figure 2.5: The model of Herzberg’s two factor theory
(Adopted from Smit et al., 2008:345)
MOTIVATOR FACTORS
Achievement Recognition The work itself Responsibility Advancement
HYGIENE FACTORS
Organisation’s policy Supervision Salary Working conditions
Interpersonal relationships

43
Amaoko (2011:2) argues that the motivation-hygiene model, as discussed above, postulates
that “employee motivation is achieved when employees are faced with challenging but
enjoyable work where one can achieve growth, and demonstrate responsibility and advance
in the organisation”. The researcher concludes that motivation and job satisfaction are
achieved when an employee's efforts are rewarded.
The above-mentioned two types of satisfaction are different, as is shown later on in the current
study, with it helping to look at jobs from both points of view. An example of the above is that,
if there is dissatisfaction with the current job, one must consider to what extent such
dissatisfaction is due to the kind of the work involved. Consideration must also be given to
what extent the dissatisfaction is due to the conditions of the work being done. If this is the
case, the dissatisfaction involved can be regarded as intrinsic to the job.
The above assertion calls for an alternate solution after the dissatisfaction was found to be
extrinsic in nature. Such extrinsic discontent is the focus of the current study. Job expectations,
thus, clearly influence job satisfaction. Job expectations refer only to what an employee
expects from a job, such as responsibility, satisfaction, and good pay.
If employees have high expectations of their job, they are likely to think that the outcome of
their work will be positive, but if they keep their expectations of their job low, they will tend not
to be disappointed about any negative outcome therefrom.
In a study conducted by Winer and Schiff (1980, cited in Teck-Hong & Waheed, 2011:76),
using Herzberg's two-factor theory, they found that achievement was the highest rated
motivator of all acknowledged motivators. The contributions made by Herzberg’s research
were significant in encouraging the acceptance of the concept of motivation in the workplace.
The contribution made by his study reinforced the understanding of the applicability of
Maslow’s philosophy in a practical sense in the workplace.
The study further drew prominence to job-centred factors in regard to the motivation of
employees, resulting in the awareness of the concept of job enrichment in the workplace.
Herzberg’s research also established that monetary pay has relatively little influence on
motivation. Accordingly, supervisors could not only consider hygiene factors as stimulating
motivation, which they might, in particular situations, not do, but they could also seek to
facilitate the implementation of motivators to ensure motivation of their subordinates (Jones &
Lloyd, 2005, cited in Smit et al., 2008:344-345).

44
Once hygiene factors have come to be given proper consideration in the workplace,
organisations can make use of motivator factors to influence their employees to feel motivated
and satisfied. Such factors are related to aspects like achievement, recognition, the work itself,
responsibility, advancement, and growth, which are said to be the only factors that can
motivate employees and increase satisfaction levels. Despite the enormous changes and
challenges brought about by technological change and globalisation in the workplace,
Herzberg’s research of over half a century ago still pertains to modern-day organisations
(Jones & Lloyd, 2005, cited in Smit et al., 2008:346).
The discussion shows that some features of a job are reliably linked to job satisfaction, while
others are related to job dissatisfaction. Once the hygiene factors have been addressed, the
motivators can stimulate as sense of satisfaction among employees (Smit et al., 2008:344-
345; Robbins et al., 2009:146; Amaoko, 2011:2; Robbins & Judge, 2011:21).
2.2.4.4 McClelland’s acquired needs model
McClelland (n.d., cited in Smit et al., 2008:346), Robbins et al. (2009:248), and Robbins and
Judge (2011:244-245) opine that people (employees in the current context) tend to develop a
variety of needs throughout their lifespan.
The authors above suggest that the need for achievement, power and affiliation
“predominate[s] in different people”. The above suggests that an individual can be an achiever,
a motivated person, or an affiliate.
McClelland proposed the need for achievement (N-Ach) theory, or the necessity of
achievement, as a way of explaining the common tendency of people to seek increasingly
higher rewards for their actions. The theory is particularly relevant in the contemporary
workplace. McClelland (n.d., cited in Smit et al., 2008:346) identified three primary types of
motivating needs that are present in people.
He furthermore, states that all three needs, consisting of the need for achievement, the need
for affiliation and the need for power, can be present in people, but that the weight that is
attached to each can vary from person to person.

45
The three needs are discussed in the following subsections.
(a) Need for achievement (N-Ach)
The N-Ach is defined as the drive to excel and to achieve, in relation to a set of standards that
demand striving for success (Robbins & Judge, 2011:244-245).
In the workplace, the employee is focused on improving their performance and results by
exercising self-discipline, keeping to a schedule, accepting responsibility, and becoming
success-oriented. McClelland identified the need as being critical to business success, since
most employers expect their employees to perform, at the very least, satisfactorily to attain
organisational goals. Hence, a person who has a high need for achievement will be driven by
such a need, and will aim to accomplish challenging goals.
Such employees have a high need for feedback on their achievement and progress, as well
as a need for a sense of accomplishment. Those with a high achievement need also tend to
like to take personal responsibility for their achievements.
(b) Need for affiliation (N-Aff)
The N-Aff, which involves the desire for friendly and close interpersonal relationships, is said
to motivate people to make friends, to become members of groups, and to associate with
others. The characteristics of the need are the focus of human companionship, interpersonal
relations, and concern for others (Smit et al., 2008:346).
(c) Need for power (N-Pow)
The N-Pow makes people behave in a way in which they would not otherwise have acted (Smit
et al., 2008:346). Under the influence of such a need, there is a strong desire to obtain and
control others, resources, and the working environment.
The need is characterised by a propensity for either totalitarian or democratic methods of
control and assertive behaviour. People with a high need for power seek opportunities to
influence and control others, hence, leadership positions, and are often articulate, outspoken
and stubborn. People with a need for power want to direct and command other people
(McClelland, n.d., cited in Smit et al., 2008:346).

46
From the above discussion of the three motivators described in terms of McClelland’s theory,
it seems that employees with a high need for achievement endeavour to attain success, and
are much more motivated to take on, and to complete, challenging tasks than are others. They
also seek out responsibilities, tasks and goals that they will have a reasonable chance of
achieving. In most cases, such people, as employees, tend to avoid responsibilities, tasks or
goals that are either too easy or too difficult to master or achieve. In contrast, employees with
a high need for power enjoy roles requiring persuasion.
The challenge, thus, for employers is, firstly, to attract motivated employees for their
organisations, so as to promote productivity that will ultimately translate into service delivery.
The theories discussed above have important implications for motivating employees in today’s
workplaces, and, therefore, line managers are expected to encourage their subordinates to
strive for success in the workplace.
In the final analysis of the above-mentioned theories, it can be concluded that motivation is the
force that initiates, guides and maintains goal-oriented behaviours. In brief, motivation is what
causes people to act. The four theories discussed in the current study are concerned with
advancing the propositions about human behaviour that suggest that people have needs. The
above discussion states that a satisfied need is not necessarily a motivator of behaviour, as
only unsatisfied needs tend to motivate people to act in such a way as to satisfy them.
2.3 Attitudes and behaviour at work
The present section briefly discusses how attitude is linked to behaviour, and how employees’
levels of satisfaction, or dissatisfaction, with their jobs affect their performance. The previous
section highlighted the need for employers to recruit motivated individuals, and to keep them
motivated, so as to achieve success in attaining organisational goals and objectives. It also
stressed that motivated employees display a positive attitude towards their work. The negative
attitudes and behaviours of employees are, per se, counterproductive.
Substantial dissimilarities exist among different employees’ attitudes and their behaviour, as
will be demonstrated below. Employees’ attitudes are the feelings that they have towards their
employers and colleagues, as well as those regarding remuneration and benefits. The holding
of such attitudes can affect them either positively or negatively. In contrast, behaviour in the
workplace is the way in which employees respond to treatment by their employers, which can,
once again, be either positively or negatively.

47
If the employees’ feelings are positive, their behaviour is likely to correspond with their positive
feelings. Higuera (2014) proposes an attitudinal equation: cognition + feeling (affect) =
behaviour. Attitude can directly impact on how employees perform their tasks. As attitude "is
an inward feeling, employee's bad attitude might remain hidden" and only manifest in the
employee's behaviour.
Employees generally have an attitude concerning their jobs in terms of the various job-related
aspects (i.e. salaries, supervisors, locations, and health and safety in terms of the working
environment). Some of the employees concerned might have legitimate concerns, while others
do not.
2.3.1 Definition of attitude
It must be borne in mind that people have thoughts and feelings that direct their actions.
Robbins and Judge (2011:106) refer to an attitude as the manner in which people perceive
their roles which, ultimately influences their opinion on, or their belief about, it. Further, Robbins
and Judge, 2011:106, 2014:98 opine that attitude is an “evaluative statements or judgements
concerning objects, people, or events. Moreover, Smit et al. (2008:299) sees it as a “collection
of feelings and beliefs”.
2.3.2 Components of attitude
Agreement exists among social psychologists that attitudes have three components: cognition;
affect; and behaviour (Robbins & Judge, 2011:106,).
Figure 2.4 below depicts the components of job satisfaction.
Figure 2.6: Components of job satisfaction
(Adopted from Robbins & Judge, 2014:98)
Job
Cognitive
Evaluative
Behavioural
My work is challenging and
interesting.
I like/dislike my job.
I am reliable and I work hard.

48
The components of attitude comprise:
• the cognitive component: involving thoughts that an employee has towards
someone, something, or a situation; • the affective component: in terms of which, after a process of reflection, an
employee develops certain feelings towards someone, something, or a situation based on the musing; and
• the behavioural component: being the end product that is influenced by the
thoughts and feelings that a person has experienced.
Employees always have attitudes (cognition, affect, and behaviour) concerning their jobs or
some such facets of their employment as salaries, supervisors, locations, health and safety,
the environment. Managers could, therefore, concern themselves with the attitude of their
employees, because it serves as an indicator of potential problems (Smit et al., 2008:299). For
organisations to evaluate their way of business and employee management, it is imperative to
understand the components mentioned earlier, and their correlation to job performance.
Employees’ level of satisfaction is, thus, critical, because it influences their behaviour at work.
Behaviour is the manner of conducting oneself, and the responses of an individual or group to
their environment. Ultimately, it relates to how employees perform, resulting in their attitude
towards their work-related behaviour, which can be in relation to a report format, a finished
good, and/or a service provided.
The above-mentioned components of attitudes might be present in such a form as to influence
the attitudes of employees at a particular point in time. Also, an attitude towards an object or
person might only contain one or two of the components at any given moment.
The question that requires answering pertains to whether the development of an attitude
always follows a specific behaviour, Festinger (n.d.) cited in Robbins and Judge (2011:107)
opines that it does.
A Manager could know about the various motivation theories, as expounded on by various
scholars, and what drives specific employees' needs (Higuera, 2014). Such knowledge could
enable them to create an opportunities that promote employee performance effectively.

49
2.3.3 Types of job attitudes
Attitude affects almost all aspects of life, including the workplace. Robbins and Judge
(2011:110-111) refer to job satisfaction and involvement, organisational commitment and
support, and employee engagement as factors that are related to the formation of work-related
attitudes. When supervisors discuss employees’ attitudes, they frequently refer to job
satisfaction, with the two terms sometimes being used interchangeably (Robbins & Judge,
2011:110-111). A high level of job satisfaction implies the adoption of a positive attitude by
employees towards their job, while job dissatisfaction implies their adoption of a negative
attitude towards their job. Thus, job satisfaction plays a significant role in job performance.
For a municipality to adopt a particular performance culture, they need to take the job
satisfaction of their senior managers into account. Line managers’ performance contributes
substantially to the productivity of organisations (CIPD, 2012b). As indicated above, job
satisfaction is the prevailing attitude that managers and employees display towards their job
or roles in an organisation (Robbins et al., 2009:20). It seems that the higher the level of job
satisfaction attained, the more confident the employees concerned are likely to feel about their
job, and the more productive they are inclined to be.
The lower the level of job satisfaction achieved, the more negative the employees involved are
apt to feel about their job, and the less productive they will be. For example, employees might
develop negative attitudes if they work long hours, if the company is having difficulties, or if
they have relationship issues with their manager, or with one another. If employees feel that
there is little chance for advancement, or that their efforts are not appreciated by the
organisation for which they work, they might develop a negative attitude towards their job.
Management could strive to remedy the situation when they encounter negativity from their
subordinates, so as to encourage the development of a positive work environment.
A positive work environment is vital for the maintenance of an effective and efficient workplace.
Employees who work in a positive environment are more likely to help find solutions to work-
related challenges, and will be inclined to remain loyal to their employer, even if experiences
periods of financial difficulty. Employees have some responsibility for altering their attitude. If
management does everything in its power to create a positive environment, and the workers
still refrain from participating in helping to foster such an environment, there is little else that
the management can do to improve the situation. There are times when management cannot
change an employee's attitude.

50
Everyone has an attitude, which can be either positive or negative. One aspect of a person's
attitude is the impact that it can have on others. A manager who has a positive attitude can lift
the spirits of his/her co-workers, whereas a manager with a negative attitude can lower their
spirits. The positive or negative attitude of employees affects their work performance, and the
performance of their co-workers. A negative attitude is dangerous to have in the workplace, as
it can spread to the employee’s colleagues, negatively affecting their performance as well.
The following issues need to be considered: whether it is the responsibility of the manager to
help change their subordinates' attitude; whether the employee alone is responsible for their
own attitude change; whether attitude can be modified, on whether the only workable solution
is to dismiss the employees concerned when they have a negative attitude towards the
workplace.
2.4 Job satisfaction as a work attitude
According to Teck-Hong and Waheed (2011:77), job satisfaction is a catalyst for organisational
success. Many researchers believe that, to be able to understand employee motivation and
performance, it is important to be acquainted with the concept of job satisfaction (Bashayreh,
2009, cited in Indermun & SaheedBayat, 2013:2).
Employees’ degree of satisfaction with their jobs remains the most studied job attitude in the
field of organisational behaviour, due to its significance for both the employees and the
organisations concerned (Ahmad et al., 2010:258). Various authors find a link between
motivation, job performance and job satisfaction (Ngo, 2009, cited in Indermun &
SaheedBayat, 2013:2). According to Shikdar and Das (2003, cited in Teck-Hong & Waheed,
2011:77) “increased job satisfaction increases worker productivity”. Many studies have been
carried out on the nature of job satisfaction, with seminal research having taken place in the
form of the Hawthorne studies at Western Electrics during the 1920s and 1930s. Only after the
aforementioned studies did the psychological state of employees start to be taken seriously
(Anteby & Khurana, 2012).
The aforementioned Hawthorne studies dealt with the issue of workers’ motivation, as it related
to work productivity. The remarkable impact of such motivation in organisations was seen, and
how employees reacted to various situations (Anteby & Khurana, 2012). The conclusion of the
studies was that "mental attitudes, proper supervision, and informal social relationships
experienced in a group were crucial to productivity and job satisfaction”.

51
Field (2008) suggests the job satisfaction model contained in Figure 2.5 below.
(Adopted from Field, 2008)
Job satisfaction in the workplace has both extrinsic and intrinsic characteristics (Kula & Gueler,
2014:210). Newstrom (2007:123, cited in Saif et al., 2012:1384) states that "people bring with
them certain drives and needs that affect their performance; therefore, understanding how
needs stimulate performance and how rewards on such performance lead to job satisfaction
is indispensable for managers".
Therefore, line managers in an organisation have to be concerned about their subordinates’
performance, requiring them to monitor the level of satisfaction of such employees
continuously.
The job satisfaction of employees is critical to organisational survival (Latif et al., 2013:167),
which makes the fact that employees are increasingly productive during their working hours
when they are relatively satisfied with their jobs of paramount importance to the success of
organisations. Buitendach (2005), cited in Booysen, (2008:9) opines that co-workers enjoying
satisfaction from performing their jobs are likely to be better representatives of their
organisation than are those who do not.
When these factors are optimal job dissatisfaction will be eliminated.
However, these factors do not increase
job satisfaction
When these factors are optimal, job satisfaction will be increased.
Factors leading to dissatisfaction:
Poor pay Poor compensation
Poor work conditions Lack of promotions
Poor benefits offering Lack of job security
Factors leading to satisfaction:
Good leadership practices Good manger relationship
Recognition Advancement
Personal growth Feedback and support
Clear direction and objectives
Employee Fulfilment Employee Dissatisfaction Commitment Satisfaction
Engagement
Figure 2.7: The job satisfaction model

52
Whether employees are satisfied with their jobs and whether most employees are satisfied
with their jobs is of key importance to their productivity. The answer to such questions can
vary. In Namibia in general, and in the CoW Municipality in particular, at the time at which the
current study was undertaken, there was lack of knowledge on the issue, as there was no
research data available to support the answer.
The more satisfied an employee is, the more impact such satisfaction is likely to have on their
performance due to their “high involvement and loyalty” which ultimately lead to organisational
productivity (Sullivan, 2009, cited in Kanwal et al., 2015:2845). The author, furthermore, states
that performance is not only determined by job satisfaction alone, as other factors of job
satisfaction are motivation, ability, and the work environment. According to Car (2005, cited in
Teck-Hong & Waheed, 2011:78), motivation is seen as expectations of future result, with job
satisfaction being seen as results emanating from the past.
Indermun and SaheedBayat (2013:1) state that “satisfied employees form a bond with the
company and take pride in their organisational membership, they believe in the goals and
values of the organisation”. The two researchers conclude by saying that satisfied employees
show “high levels of performance and productivity” and that dissatisfied employees show “low
levels of productivity”.
For an organisation to be successful through the performance of its employees, understanding
job satisfaction and management beliefs becomes crucial (Putman, 2002, cited in Indermun &
SaheedBayat, 2013:2).
Rotenberry and Moberg (2007, cited in Ahmad et al., 2010:259) found that employees who
were confident and involved in their jobs performed better than those employees whose
attitude was negative towards their jobs. According to Zain, Ishak and Ghani (2004, cited in
Indermun & SaheedBayat, 2013:1), “employees’ thoughts, feelings, interactions, and
performance” are mechanisms of job satisfaction. How employees perceive their jobs involves
thoughts and feelings that result in certain behaviour.
According to Aziri (2011:79), the importance of job satisfaction is fuelled by the emergence of
such adverse outcomes as "a lack of loyalty, increased absenteeism, increase number of
accidents, etc.".

53
Spector (1997, cited in Aziri, 2011:79) states the following three important features of job
satisfaction:
organisations need to be guided by human values, meaning that organisations treat workers “fairly and with respect”. Job satisfaction assessments can indicate high levels of job satisfaction that are likely to serve as an indication of employees’ emotional and mental states;
employees’ behaviour, as a direct result of the level of their job satisfaction, drives the functioning, activities and success of a business;
the level of job satisfaction prevailing within a work environment can be seen to serve as an indicator of the standard of organisational activities conducted. The measurement of Job Evaluation (JE) can serve as an effective gauge of where change is required in the business units involved.
Furthermore, employee’s opinions or belief systems determine how they feel about their job,
and, ultimately, how they fulfil their required roles, such as applying their acquired skills and
knowledge, and/or by totally ignoring the requirements of their roles (Spector, 1997, cited in
the European Foundation for the Improvement of Living and Working Conditions, 2007:4). The
above statement advocates that, in the workplace, people develop certain attitudes towards
their job, by taking into account their feelings, their beliefs, and, ultimately, their behaviour.
The plethora of definitions of job satisfaction that attempt to clarify the meaning of the term are
discussed in subsection 2.4.1 below. In brief, job satisfaction is defined differently by many
researchers.
2.4.1 Definition of job satisfaction
As the concept of job satisfaction is defined differently by many researchers, no universal
agreement exists on the authoritative definition (Aziri, 2011:77). Spector (1997, cited in Mueller
& Kim, 2008:119), refers to job satisfaction as “the degree to which people like or dislike their
jobs”.
In line with the above definition by Spector, the BGSU (2009:1) defines job satisfaction as
being the “feelings workers have about their jobs”. Then again, job satisfaction is defined as a
“favourable or unfavourable” emotional state resulting from one’s job (Newstrom, 2007, cited
in Pandey & Khare, 2012:27). The most used definition of job satisfaction is given as “a
pleasurable or positive emotional state resulting from the appraisal of one’s job or job
experience” (Locke, 1976, cited in Akafo & Boateng, 2015:114). The definition given above
clearly demonstrates the importance of the three components of an attitude that were
discussed in subsection 2.2.2 above.

54
Furthermore, job satisfaction is defined as a “positive affect of employees towards their job or
job situation” (Locke, 1976, cited in Pandey & Khare, 2012:27). Bullock (2003, cited in Padala,
2010:17) describes job satisfaction as "an attitude which results from balancing and summation
of many particular likes and dislikes experienced in connection with the job". Padala (2010:18)
refers to job satisfaction as the “output of a work environment”.
Moreover, Peptone (1999, cited in Padala, 2010:18), defines job satisfaction as a summation
of employees’ feelings in four distinct areas, namely “job, management, personal adjustment
and social relations”. Further readings reveal the existence of a relationship between job
performance and job satisfaction (Robbins et al., 2009:20).
Robbins and Judge (2011:61) define job satisfaction as being “a positive feeling about a job
resulting from an evaluation of its characteristics”. The above definition implies that a person
with a high level of job satisfaction is likely to hold positive feelings towards their job, and an
individual who is dissatisfied with their job is likely to hold negative feelings about their job.
Kardam and Rangnekar (2012) have developed two definitions of job satisfaction: “the
emotional feeling of an employee towards his job”, and “an affective reaction to a job that
results from the comparison of perceived outcomes with those that are desired”. They also
opine that job satisfaction implies that there "is a psychological attachment of an employee
with his job".
The definitions of job satisfaction given above, which are wide-ranging, anticipate employees
interacting with other employees, as well as their supervisors, adhering to rules and
regulations, and being productive, even under unfavourable conditions (Robbins & Judge,
2011:114). From all of the variables mentioned above, only the relationship between job
satisfaction and job performance is the topic of the current research.
2.5 The measurement of job satisfaction
The above discussion clearly indicates that a relationship exists between overall employee
motivation and job satisfaction, which, again, leads to the quality of individual job performance
and, ultimately, to the quality of organisational performance.
In general, as employees are inclined to be dissatisfied with their jobs, some means of
measuring the level of (dis)satisfaction is required. Measuring levels of job satisfaction can
help organisations to determine the prevailing levels of employee job satisfaction.
55
Thus, assessing the job satisfaction levels of employees from time to time, so as to ensure that
the aspect that causes dissatisfaction is dealt with (Spector, 1997, cited in Mueller & Kim,
2008:119), is of extreme importance. To make sure that employers care about their employees'
happiness and levels of job satisfaction, the process of measuring their job satisfaction levels
could be introduced into organisations. At the time of the current study, most, if not all, of the
Municipalities in Namibia failed to measure their employees’ levels of job satisfaction, with their
knowledge about the matter seeming to be alien to them (Ndura, 2016).
In most instances, levels of job satisfaction are measured by means of the employment of a
scientific research method involving the administration of a questionnaire (Aziri, 2011:82).
Assessing how satisfied employees are with their job entails making a complex summation of
some discrete job elements, requiring a suitable measuring instrument. Measuring job
satisfaction involves the assessment of "attitudes or feelings" that are not readily discernible,
thus complicating the whole measuring process (Prando, 2006:28, cited in Govender,
2013:36). Job satisfaction instruments, which are designed in multiple ways, may be selected
for use, depending on the different reasons for the research conducted.
Robbins and Judge (2011:114), and the BGSU (2009:2) argue that there are two types of job
satisfaction measures, being those pertaining to global job and job facet satisfaction. Similarly,
Robbins and Judge (2011:114) and Robbins et al. (2009:77) point out that it is possible to
measure levels of job satisfaction, in relation to which they propose the employment of two
commonly used methods of measurement, namely “a single global rating and a summation
score made up of a number of job facets”. Larkin (1995:9, cited in Govender, 2013:36)
postulates the existence of three first models in terms of measuring employee attitudes, being
the faceted, global facet, and fulfilment of needs concepts. The author claims that the success
of such measures relies heavily on the honesty of the respondents concerned in terms of
reporting their feelings.
The faceted concept ensures an extensive assessment of various facets of the job. The facets
that can be assessed are "workload, job security, compensation, working conditions, general
management practices and opportunities for growth and development" (Ironson et al.,
1989:194, cited in Govender, 2013:37). Job facet satisfaction concerns the attitude that
employees might have in relation to a particular aspect of the job. Hence, the measure seeks
to determine the level of satisfaction experienced in terms of each aspect.

56
Although employees might experience a great deal, or only a modicum, of satisfaction
regarding each aspect of their job (Ram, 2013:21), their doing so does not guarantee that they
are happy with certain aspects of their job (Van Scheers & Botha, 2014:100).
According to Spector (1996:214, cited in Govender, 2013:37), the faceted concept of job
satisfaction assumes that “employee’s views of different aspects of a job can vary
independently and should, therefore, be measured separately". Similarly, Mueller and Kim
(2008) refer to “facet-specific job satisfaction as a measure asking about particular aspects of
one’s job, such as pay, security, co-workers, and promotion opportunities”.
On the other hand Locke (1976, cited in Akafo & Boateng, 2015:114) refers to a number of job
dimensions that add value to the level of employees' job satisfaction experienced. The
dimensions are “work, promotion, recognition, benefits, working conditions, supervision and
co-workers, company and management”. Similarly, Robbins and Judge (2011:115) refer to the
dimensions as “key elements”, including “the nature of the work, supervision, present pay,
promotion opportunities, and relations with co-workers”.
Furthermore, Spector (1997:2, cited in Kula & Gueler, 2014:210) says job satisfaction has nine
aspects: “pay, promotion, supervision, benefits provided, contingent rewards as a means of
recognition and appreciation, operating procedures and policies, dealing with co-workers’,
nature of the work, and communication within the organization”.
The global concept theory is “one-dimensional and is treated as a single, overall feeling
towards the job” (Spector, 1996:214, cited in Govender, 2013:37). In the current study, the
respondents were asked direct statements about their general sense of the job. Even though
the research tool is easy to administer, it is difficult to “ascertain if respondents are answering
the same question objectively to gauge a proper perspective” (Govender, 2013:37).
Mueller and Kim (2008) refer to global job satisfaction as being the “the employee’s general
feelings about a job … [which] … is typically measured by questions referencing the job”.
According to the authors concerned, global job satisfaction is the most researched topic in the
current area of study, referring to the employees’ complete body of feelings about their job.
Job facet satisfaction refers to feelings about such specific job aspects as remuneration and
the quality of relationships with co-workers. It is, thus, possible for employees to gain a
modicum of satisfaction regarding a particular aspect, or certain aspects, of their job, while
simultaneously being highly satisfied with their overall job.

57
The fulfilment of needs concept determines whether the needs of the employee are fulfilled by
the job that they are assigned to do (Govender, 2013:37). According to Govender (2013:37),
the instrument in question is relatively unpopular among researchers, with it being difficult to
score in relation to the other instruments, and with it largely depending on the researcher
concerned regarding the choice of facets that they want to use. What makes the test more
difficult is the fact that employees’ needs are many, with them not being able to be solved only
by their employer. Thus, the test concerned might not cover all the employees’ needs involved.
Users of the instrument are provided with various options from which they can select that which
best fits their purpose and needs. Measurement includes interviews, singly-item measures, the
JIG item measures, and workplace observation (Saunders et al., 2012:416). There is a plethora
of instruments that measure job satisfaction however the one most used includes the Job
Satisfaction Survey (JSS), JDI, (JIG) and Minnesota Satisfaction Questionnaire (MSQ).
The JSS was developed by Spector and provides good reliability and validity (Spector, 1985
cited in Astrauskaite et al., 2011:42). The JDI and JIG were developed by the (BGSU, 2009:3).
Initially there were 72 items in the JDI which assess five facets of job satisfaction which
includes: work pay, promotions, supervision and co-workers.
The JIG is a measure of “global satisfaction” which mean that participants responds to give
their satisfaction with their job in a broad overall sense (BGSU, 2009:3). Both have short list of
‘phrases’ and ‘adjectives’ that describe different facet of the job or the overall job. The MSQ, a
5-point Likert-type scale with 20 items was developed by Weiss et al. in 1967 (Fields, 2002:7).
There is a longer and shorter version of the MSQ which consists of 20 items. This can also be
separated into two sub-scales for intrinsic and extrinsic satisfaction (Moolman, 1993, cited in
Martins & Proença, 2012:1-5).
For the current study, the JDI and JIG were chosen for data collection purposes, with them
being the most popular job satisfaction assessment tool with researchers, due to their simplicity
and considerable psychometric quality. The JDI is broken down into five facets of satisfaction:
work; pay; promotion; supervision; co-workers; and the global satisfaction rating (BGSU,
2009:3).
A description of the different facets is given in section 4.4. The JDI is a 72-item scale, in which
the respondents evaluate adjectives and phrases according to the extent to which each
describes their job using the answers yes, no and uncertain (BGSU, 2009:3).

58
2.5.1 Causes of job satisfaction
Preceding a discussion of the causes of job satisfaction, a parallel is drawn between the
causes of accidents and those of job satisfaction. Heinrich’s domino theory states that
accidents do not just happen, but result from a chain of sequence of events (Hattingh & Acutt,
2009:95). Such an incident might occur because management did something that they could
not have done, or else they might have failed to do something that they could have done.
Tracing the causes of an accident back to an individual, or to several people, and/or some
conditions is almost always possible. Just as with accidents, job satisfaction and/or
dissatisfaction can be caused by the presence or absence of a variety of factors. Employees
tend to expect line managers in an organisation to be exemplary, and to walk the talk. They
might, therefore, become discouraged if line managers fail to take action to correct poor
performance (Alexander, 2010, cited in Heskett, 2010).
The majority of employees in the US were found in the present decade to lack enthusiasm
about their work (Robbins & Judge, 2011:2380). Robbins et al. (2009:78) and the SHRM
(2012:4) found the following top five aspects below contributing to employee job
satisfaction/dissatisfaction levels:
work itself;
pay;
opportunities for promotion (career advancement opportunities);
supervision; and
associates (co-workers)
Before employers can improve the satisfaction levels of their employees, they need to know at
least what aspects require improvement. Bajpai and Srivastava (2010, cited in Grover &
Wahee, 2013) suggest that employees like jobs that provide opportunities to utilise their
competencies, that offer freedom in relation to a variety of tasks, and that offer them feedback
on their performance.
The following subsections provide detailed discussions of the top five causes of employees'
job satisfaction/dissatisfaction selected for consideration in the current study, namely: the work
itself facet; the pay facet; the opportunity for promotion (career advancement opportunities)
facet; the supervision facet; the co-workers facet; and the JIG facet.
59
2.5.1.1 The work itself facet
The "work itself aspect means how interesting, challenging or exciting an employee's job is".
Keeping employees motivated and satisfied in the absence of stimulating work is challenging
(SHRM, 2012:33). The concept of work is referred to by Bratton and Gold (2007:158) as
“physical and mental activity that is carried out at a particular place and time, according to
instructions, in return for a wage or salary”.
According to Goel (2008, cited in Kanwal et al., 2015:2845), a job can be defined as a collection
or aggregation of tasks, duties and responsibilities which as a whole is regarded regular
assignment to individual employees, meaning thereby that when the total work is to be done
is divided and grouped into packages … .
The way in which a job is designed can have a substantial impact on the “attitudes, beliefs,
and feelings of the employee” (Hackman & Oldham, 1975, cited in Agarwal & Gupta, 2015:6).
Employees don’t just to ‘get by’, apart from doing ‘dull and repetitive tasks, they want to work
on “topics that inspire and energize them; double bonus if employees are given the freedom
to decide what, how and/or when their projects are completed” (SHRM, 2014:21). The following
five job characteristics define the motivating potential of a job (Agarwal & Gupta, 2015:6):
task identity;
job autonomy;
job feedback;
task variety; and
task significance.
Task identity refers to the extent to which an individual knows, or participates in, the completion
of a whole piece of work. Job autonomy refers to the extent of decision-making freedom that
may be exercised on the job by the employee. Job feedback describes the availability of
information from the supervisor about performance effectiveness.
Task variety is the degree to which an individual employee may use multiple skills in performing
their work. Task significance is the importance of the job for other people in the workplace
(Agarwal & Gupta, 2015:6).

60
When employees consider their work to be meaningful and satisfying, it is possible for them to
be satisfied with it, which, in turn, motivates them to excel therein (SHRM, 2010:31). According
to the SHRM (2016:32), employees are more “motivated to explore tasks that incite curiosity
and inspiration” than they are tasks that are more mundane. Contrary to the above, various
forms of work create "tension, contradiction and change” (Bratton & Gold, 2007:158).
According to Parvin and Kabir (2011:115), the degree of job satisfaction or job dissatisfaction
achieved not only depends on the nature of the work itself, but also on the benefits that they
derive from the job and other factors to do with the work. Moreover, the SHRM (2012:33)
opines that it is not easy for employees to remain motivated and satisfied with their jobs when
the latter are not “interesting, challenging or exciting”.
Over the years, employees have continued to rate the above-mentioned aspect as of great
importance to them. When asked about how important work itself was to job satisfaction the
response rates have tended to vary slightly over the last three years. In 2014, 51% indicated
so, while 68% stating that they were satisfied with their work (SHRM, 2014:25), whereas, 50%
indicated so in 2015, while 73% stating that they were satisfied with their work (SHRM,
2015:25), whereas, 48% indicated so in 2016, while 74% reporting that they were satisfied with
their job (SHRM, 2016:32). The above-mentioned data indicate that employees want more
from their work experience. They want a job from which they can derive enjoyment, and which
also challenges them to perform excellently.
2.5.1.2 The pay facet
Pay is used to reward employees so as to motivate them, or so as to elicit positive behaviour
from them in terms of enhancing their performance that might otherwise be detrimental to
organisational success (Akafo & Boateng, 2015:113). In support of the above, Lawler (2003,
cited in Akafo & Boateng, 2015:112) opines that rewards and recognition motivate employees,
resulting in superior performance.
Conversely, Mol (2008:181) suggests that reward that motivates is "something that is given
without obligation", and that the moment that "something has been promised, it becomes
compensation". The author further states that, once employees are entitled to payment, they
are moved by it, but not necessarily motivated. The author concludes by indicating that a
reward that motivates is "therefore something that is not only given without obligation but
something that is given as recognition for good performance".

61
Eshun and Duah (2011, cited in Akafo & Boateng, 2015:113) opines that, even though people
work for pay as their motivator, there are many other ways to achieve motivation other than
money. In general, pay is commonly known to be important to employees in terms of motivation
and job satisfaction, with it serving as a motivator of desired employee behaviours (Eshun &
Duah, 2011, cited in Akafo & Boateng, 2015:113).
According to Zhang et al. (2011:679), even though pay is not seen as the primary cause of job
satisfaction, it is still an important constituent, because financial remuneration is deemed to
serve as a reward, and as recognition, for performance. Notably, pay definitions tend to vary
from organisations to organisation.
Furthermore, Erasmus et al. (2008:476) define remuneration as the financial and nonfinancial
extrinsic rewards provided by an employer for the time, skills, and effort made available by the
employee in fulfilling job requirements aimed at achieving institutional objectives. According to
CIPD (2014), the term ‘compensation’ (pay) "is usually taken to refer solely to financial rewards
(base pay and earnings)", with the term ‘remuneration’ being used "interchangeably with
rewards as it encompasses the wider benefits package in addition to pay". Akafo and Boateng
(2015:113) refer to base pay as the basic pay that employees receive. The CIPD (2014)
suggests that pay may be divided into two categories:
base or fixed pay is, the guaranteed cash wage, or salary, paid to individual employees for performing their work for a contracted period; and
total earnings including base pay, plus such additional variable elements of earnings as bonus payments, as well as overtime earnings.
Furthermore, Williams, et al. (2007:429) also found that satisfaction with pay has four
dimensions:
pay levels;
pay raises;
benefit levels; and
pay structure and administration.
According to the SHRM’s (2016:21) JSS, pay remains one of the top five job satisfaction facets
that are most important to employees. In 2012, 52% of their employees indicated that pay was
a significant facet, with 57% being satisfied with their pay (SHRM, 2012:25).
62
According to their research, pay was the fourth leading contributor to job satisfaction in 2014
(in terms of US employees’ ratings 36% regarded pay to be important, whereas 60% regarded
it as significant, with 62% of the employees surveyed expressing their satisfaction with their
pay), down from third position in 2012 (SHRM, 2014:22).
Organisations must develop compensation packages as a strategy when competing for, and
striving to retain, top talent. The majority of employees feel that they are not paid well.
Moreover, according to the latest research of the SHRM (2016:21), pay was in the second
position, moving up two notches from fourth position, with 65% of the employees being
satisfied with the facet.
Furthermore, the SHRM (2016:22) identified four components specific to pay that affects
employees’ levels of job satisfaction. The components were:
being paid competitively in relation to the local market;
the base rate of pay;
the opportunity for a variable rate of pay; and
stock options.
Of the four components affecting employee job satisfaction, being paid competitively in relation
to the local market ranked as most important for satisfaction. According to findings in a study
involving medical practitioners carried out by Yaseen (2013:142), their finding indicated that
pay and other factors had a direct effect on job satisfaction.
Accordingly, they proposed that their government could revise and amend the service structure
of the practitioners. In contrast, Yang, Miao, Zhu, Sun, Liu and Wu (2008) cited in Yaseen
(2013:145) note that, in China, pay and satisfaction influence one another. Moreover, NL
(2012, cited in Yaseen, 2013:145) states that salary is a hygiene factor that decreases levels
of job dissatisfaction.
According to Sheffield (2016), 41% of UK employees were “satisfied with their level of pay,
[while] more than 36% thought they could be paid more”. Furthermore, the study concluded
that the issue of pay was not linked to employee satisfaction. The SHRM (2012:5) recommends
that managers address the issue of compensation dissatisfaction by sharing information
concerning the organisation’s compensation philosophy.
63
Furthermore, they also suggest that line managers help employees to understand how their
pay is determined, and that they frequently update employees on what their total rewards
package, including benefits, entails. The role of benefits has become an increasingly vital
aspect of an employee's level of job satisfaction. Properly designed, employee benefit
packages can be extremely effective in attracting, motivating, satisfying, and retaining
employees.
When developing benefits packages, employers could take into account, and anticipate, the
needs, preferences, and makeup of their workforce (SHRM, 2012:26). Providing cost-effective
and affordable benefits to employees can be challenging for an organisation, but, given that
54% of the respondents rated benefits as a significant contributor to their level of job
satisfaction, employers could keep the above in mind (SHRM, 2012:26).
Pay, in the form of money and benefits, not only helps employees satisfy their basic needs,
but it also helps to obtain the needs and wants expressed at other levels. Employees often see
pay as being a reflection of how their employer values their contribution to the organisation;
thus, the above discussion clearly indicates that employees’ tangible benefits remain
important, despite any challenges that they might face in coming to understand their pay
structures.
2.5.1.3 The opportunity for promotion (career advancement opportunities) facet
Career development "is an opportunity for employees to continually take part in more advanced
or diverse activities that result in improving skills, gaining new skills, taking greater
responsibility at work, improving their status and earning higher income" (SHRM, 2012:9).
Furthermore, the SHRM stresses that opportunity for promotion is an important facet in regard
to the discussion of employee job satisfaction.
The component includes dimensions of whether the chances for advancement are good,
whether promotions are handled fairly, and whether the employer is concerned about giving
everyone an opportunity for a promotion. Promotion for employees means advancement in
rank or position resulting from their performance and/or tenure in relation to the prevailing
hierarchical structure, and also depending on the organisational practices and policies in place.
Supervising employee performance and assisting employees to manage their careers works
together in unison (Erasmus et al., 2008:396).

64
According to Erasmus et al. (2008:413), promotion involves moving into a more senior position
than before, with the new position demanding "higher-level responsibility, more complex work,
greater competency demands and better remuneration". Khurana (2009, cited in Kanwal et al.,
2015:284) opines that promotion "means assignment to a post carrying more income, higher
status and more responsibility to the employee".
Responsibility relates to various errands that are performed by employees at their workplace
(Kanwal et al., 2015:284). Receiving a promotion is key to an employee's career and quality of
life, with it also being linked to other work facets (Kosteas, n.d.). Furthermore, Khurana (2009)
cited in Kanwal et al. (2015:2845) opines that the promotion of employees is beneficial for both
the employee and the employer. The prominence of career advancement opportunities has
been on a gradual upward trend since 2007 (SHRM, 2012:10).
Such a tendency may be attributed to employees feeling that they have mastered their current
position’s responsibilities, and that they are looking for more challenging positions within their
organisation (SHRM, 2012:10). Advancement, by its very nature, is not stagnant (Erasmus et
al., 2008:413). One of the most dissatisfying aspects of a job that an employee might
experience is the feeling that they are stuck in their position, and that they see no room for
growth, or advancement.
Employees want to feel as though they are working towards some end in their career, and that,
through hard work and dedication, they will be recognised for their efforts by being promoted
to the next job or level at some not too distant time in the future. The effect that promotional
opportunities seem to have on job satisfaction results from promotions taking a number of
different forms, and being accompanied by a variety of rewards. For example, individuals who
are promoted on the basis of seniority often experience job satisfaction, but not as much as
those who are promoted on the basis of performance.
The results of promotion are increased attachment to their organisation, the lifting of their spirit
and morale, and a reduction in training costs (Kanwal et al., 2015).
Unsatisfied employees are more likely to look for opportunities outside their organisation than
are satisfied ones (SHRM, 2012:10). Thus, the level of satisfaction derived from a promotion
depends on the acceptability of the rank to which an employee is promoted, the nature of the
new tasks required from the employee, or the additional amount of pay that is accessed
thereby.

65
The above is in line with the research conducted by the SHRM (2011:10), which indicated that
employees in large organisations employing “500 or more employees” felt that the facet
concerned was more important than did those working for small organisations of “fewer than
100 employees”. Furthermore, the research indicated that career advancement opportunities
were a higher priority for younger employees (aged 30 or younger) than they were for
employees aged 46 to 64 years old.
In 2012, the SHRM study found that career advancement opportunities for employees were
important to 47% of those surveyed, with them being significant to 34%, and with 48% of the
employees involved being satisfied with the number of such opportunities that were being
made available to them.
The above-mentioned opportunities were valued more highly by employees in middle
management level positions than by those in non-management positions, as well as by
executive-level employees.
Lastly, the assigned values were significantly higher for "Generation X employees (between
31 and 45 years of age) than for Baby Boomers (46 to 64 years old)" (SHRM, 2012:10-11). In
2016, the SHRM study found that career advancement opportunities for employees were very
important (47%), with 33% being somewhat satisfied with them, and 24% being very satisfied
with them. The percentage of employees that was found to regard their career advancement
opportunities as being very important to their job satisfaction levels had risen by 20% in the
preceding eight years (SHRM, 2016:17).
Organisations could pay close attention to employees' level of satisfaction with their career
advancement opportunities, as they might otherwise become discouraged if they are
continuously passed over for promotion.
2.5.1.4 The supervision facet
Employees’ feelings of job satisfaction with their job mostly stems from the type of relationship
that they have with their immediate supervisor.
According to the SHRM (2011:14), the relationship an employee has with his or her supervisor
is a central element to the employee's affiliation with the organisation, and it has been argued
that many employees’ behaviours are largely a function of the way [in which] they are managed
by their supervisors.

66
The SHRM (2012:15), in their 2012 survey, found that the supervisor’s leadership and
management style setting of the tone for the work environment “can provide the workforce with
direction”, and, thus, also direct their behaviour. Supervisors represent their organisations in
monitoring the performance of their subordinates. Similarly, Shanock and Eisenberger (2006,
cited in Ariani, 2015:36) opine that the supervisor, as a representative, fulfils the role of
providing performance feedback and of setting pay levels.
Supervisors assess their subordinates’ performance from time to time, and provide feedback
on it so that the employees can be encouraged to enhance the contributions that they make to
their organisation (Bhate, 2013:2). Merriam-Webster Dictionary (n.d.) defines supervision as
“the action or process of watching and directing what someone does or how something is
done”. The Business Dictionary (2014) defines supervision as the “action of overseeing and
managing employees in the workplace”.
According to Bhate (2013:2), “strong supervisor support improves the quality of employment
and is associated with increased job satisfaction … “. Supervisor support is defined “as the
extent to which leaders value their employees’ contributions and care about their well-being”.
Similarly, Castle (2005, cited in Dill, 2008:2) is of the view that "supportive supervision can play
a significant … [part in how an employee] … feels about her job, and ultimately, [determine]
whether or not she decides to stay in her position”.
Employees are known to join an organisation, or to quit their job, because of their supervisors
(Shriar, 2015). An organisation could prevent such attrition by forming strong bonds with their
subordinates. The relationship that exists between employees and their overseers is
fundamental to the employees’ commitment to the organisation concerned.
According to Ariani (2015:36), supervisors can form excellent relationships with their co-workers,
with the latter researcher noting that supervisors are expected to be exemplary, and to educate
their subordinates in the values of the organisation. Similarly, Fernandez (2008:197) opines that
effective leaders promote a sense of job satisfaction among their followers, and to create the
right conditions for innovation. Such leaders can also inspire their followers to create new and
improved ways of completing their tasks, while simultaneously facilitating effective
organisational change. Senior management has a duty to increase the degree of employee
job satisfaction by keeping them well-informed, and by frequently communicating information
throughout the organisation (SHRM, 2012:49).

67
Healthy relationships are underpinned by open lines of communication, which allow the
supervisor to respond both effectively and efficiently to the needs of the employees in a timely
manner (SHRM, 2011:14). According to the SHRM’s (2012:15) yearly survey, they found that
"communication between employee and senior management" had ranked in the list of the top
five contributors to employee job satisfaction five times since 2002.
Employees in the SHRM 2012 survey rated the relationship with their supervisor as being more
important to their job satisfaction than were either benefits, or compensation. Furthermore, the
above-mentioned aspect was rated more important by “middle-management employees than
by professional and non-exempt, non-management employees” (SHRM, 2012:17).
Finally, the 2010 survey indicated that more female employees reported supervision to be an
important facet of job satisfaction than did male employees (SHRM, 2010:22).
Supervision is seen as a highly vital part of any workplace that intends to maximise its success
potential. It naturally follows, then, that poor supervision in the workplace is among the primary
obstacles to an organisation achieving success. Employees, no matter the tasks that they are
required to do, must receive the proper instruction and training to ensure that they are doing
their jobs correctly, and with minimal risk of error or injury.
Supervisors could communicate their expectations and provide regular feedback about work
performance so as to minimise any misunderstandings that might occur. Employees need to
know what they are supposed to do, the expected levels for their performance, and what
constitutes good performance.
2.5.1.5 The co-workers facet
Employees spend eight or more hours a day at their job intermingling with their colleagues.
According to the SHRM (2016:33), "positive relationship with co-workers can foster a sense of
loyalty, camaraderie, moral support and engagement among staff". Similarly, Bateman
(2009:4) opines that co-worker support is seen to make a working environment either pleasant
or unpleasant. Teamwork can, accordingly, be seen to make a noteworthy contribution to the
prevailing levels of job satisfaction.
Some positions exist in which employees are required to work alone, while, in the case of other
jobs, employees are required to collaborate continuously with their co-workers so as to be able
to realise a shared goal (SHRM, 2009:29).

68
Vitell and Singhapakdi (2008:345) postulate that the work group is the "extent to which there
is evidence of a team spirit within the organisation". As a result, co-workers’ relations become
a source of “support to co-workers and positive effect on employee satisfaction” (Madlock &
Booth-Butterfield, 2012, cited in Ariani, 2015:37).
Productive and supportive colleagues appear to be valuable in terms of discouraging job
dissatisfaction from surfacing, rather than in terms of promoting job satisfaction. However, co-
workers are not essential to job satisfaction as such, but if the relationship among co-workers
is weak, it might have an adverse effect on levels of job satisfaction.
According to Jain and Kaur (2014:1), “good work environment or culture affects not only the
performance of employees … ”. When co-workers are appreciated by team members whom
they like, they seem to have a psychological advantage in the workplace (Dorothea, 2015:37).
According to Rothmann and Welsh (2013), cited in Dorothea, (2015:35), employees make
themselves freely available for new assignments, “if they know that co-workers and
supervisors care about them. The above-mentioned authors further indicate that recent
research shows that groups requiring considerable interdependence among the members to
get a job done will have higher [job] satisfaction".
All jobs are marked by relationships between co-workers and supervisors, with all needing to
adhere to company rules and regulations, to the meeting of performance standards, and to the
accepting of working conditions that are often less than ideal (Robbins & Judge, 2011:114).
Finally, problematic co-workers, as well as supervisors, can be a major factor in terms of
employees' levels of happiness at work. Employees can increase their job satisfaction by
maintaining positive relationships in the workplace, by avoiding negative people, by asking for
guidance as to the necessary requirements for success, by setting their own goals, by giving
themselves rewards, and by sustaining positive thinking.
2.5.1.6 The job in general facet
The JIG facet refers to a situation in which an employee considers the whole job and everything
about it, both in terms of intrinsic and extrinsic job satisfaction. The research that was
conducted annually by the SHRM aimed to establish how well phrases or words that were put
to the respondents described their thoughts on what their jobs were like most of the time.

69
When employees’ job satisfaction levels are high, it translates into increased productivity,
commitment, and employee retention for organisations (SHRM, 2010:33). The overall
employees’ job satisfaction levels over a number of years, since 2002, are given below,
according to the SHRM (2010:37) study.
Table 2.3: Overall employee Job Satisfaction (2002-2010)
(Adopted form SHRM, 2010:35)
Year of survey Somewhat satisfied (in %) Very satisfied (in %)
2010 (n = 605) 44 40
2009 (n = 602) 45 41
2008 (n = 601) 41 41
2007 (n = 604 41 39
2006 (n = 604) 41 39
2005 (n = 600) 38 39
2004 (n = 604) 40 37
2003 No research was undertaken for this year.
2002 (n = 604) 47 30
2.5.2 The consequences of job dissatisfaction
If an organisation does not consider the levels of job satisfaction among its employees, it can
expect some such consequences as absenteeism, turnover, poor productivity and customer
services, and low morale, which might result in poor service delivery.
Job satisfaction is, thus, a desirable outcome that aims to reduce such consequences. As
noted by Shiota (2011), “a good attitude [job satisfaction] in the workplace promotes a good
work ethic. A bad attitude [job dissatisfaction], however, could be hazardous to your career”.
Shiota (2011) furthermore states that employees with positive attitudes [as symptomatic of job
satisfaction] “work harder, persevere in the face of obstacles, and have higher expectations”.
According to Robbins and Judge (2011:118), employees’ response to job dissatisfaction can
be expressed in a number of ways, “which differ from each other on two dimensions (active
vs. passive and constructive vs. destructive)”.

70
Figure 2.8 below illustrate the responses to job satisfaction.
Active
EXIT VOICE
Destructive Constructive
NEGLECT LOYALTY
Passive Figure 2.8: Responses to job satisfaction/dissatisfaction
(Adopted from Robbins & Judge, 2011:118)
The four responses portrayed above are explained in more detail below:
in terms of exit, “[b]ehaviour [is] directed toward leaving the organisation, including looking for a new position as well as resigning” (exit is a destructive and active response);
voice involves an active and constructive attempt to improve conditions, including by means of suggesting improvements, discussing problems with superiors, and some forms of union activity (voice is an active and constructive response);
loyalty entails passive but optimistic waiting for conditions to improve, including speaking up for the organisation in the face of external criticism, and trusting the organisation and its management to ‘do the right thing. (loyalty is a passive and constructive response); and
neglect entails passively allowing conditions to worsen, including through chronic absenteeism or lateness, reduced effort, and increased error rate (neglect is a passive and destructive response). (Robbins & Judge, 2011:118).
In most cases, managers think they can handle poor performance by means of increasing their
subordinates’ competencies through training alone. Although training can increase employees'
competencies, it might not improve their attitudes [levels of job satisfaction] as well (Shiota,
2011). Unless people have the right attitude [and are able to gain job satisfaction] towards their
jobs, no amount of training is likely to improve their performance.
Attitude [in the form of job satisfaction] tends to influence people to work diligently, no matter
whether they are at work or at home. Such an influence is possible because people have the
capacity to act both positively and negatively.
Responses to job Dissatisfaction

71
Grant et al. (2010:417) concluded that employees who are not satisfied with their job tend to
perform more poorly than do those who are satisfied with it. The former are more likely to leave
their jobs than are those with a higher job satisfaction level. Furthermore, the above-mentioned
researchers found that employees' performance increased once decisive action was taken by
management to correct any identified problems that contributed to the employees' job
dissatisfaction. A certain degree of job satisfaction is, thus, a prerequisite for the ultimate
performance of employees in organisations. Various studies that have been conducted in the
past indicate that job satisfaction plays an enormous role in job performance.
2.6 Performance management
2.6.1 Introduction
Managing performance is about maximising the productivity and profitability of organisations
by means of optimising the efficiency and effectiveness of their employees to achieve their
objectives. According to McMnon (2013:4) performance management (PM) encompass the
“assessment and development of people at work”. The definition given above is supported by
Amstrong (2009) cited in McMnon (2013:5) who define PM as “a systematic process for
improving organisational performance” through individual and team efforts. Varma et al. (2008)
cited in McMnon (2013:4) see PM as a process to set “goals, determine standards, assign and
evaluate work, and distribute rewards”. In short PM it is to improve individual, team and
organisational performance and growth McMnon (2013:4).
Employees make use of their knowledge, skills and attitude to achieve job performance, and,
ultimately, organisational goals (Vanden Berghe, 2011:24). The execution of job-related tasks
by employees, in turn, has a huge influence on service delivery being either positive or
negative.
A high level of organisational performance is achieved by well-motivated employees who are
prepared to exercise discretionary effort (Armstrong, 2010:136). In LAs, performance is a
crucial matter for both the employees and the employer who care for better service delivery.
Employee job performance is an on-going activity, with the ultimate objective of improving both
individual and organisational performance. Performance reviews by employers determine the
future performance of employees.
The review of performance is planned, monitored, and rewarded, making use of a tool that is
known as the PMS. The adoption of a PMS requires implementation by the organisation
involved.

72
The present subsection defines the nature of performance. Furthermore, it discusses the
nature of job performance and its relationship to job satisfaction, and to the managing of
organisational performance, while simultaneously defining the meaning of the terms
‘performance appraisal’ and ‘performance management’, ’teamwork performance’, and
‘individual work performance’. The role of line managers in individual performance is also
considered. Lastly, a description of the notion of ‘psychological contract and performance’
follows. The chapter ends with a summary.
2.6.2 Definition of job performance
Performance refers to individual and team activities that result in organisational success
(Rothwell et al., 2000:35, cited in Colli, 2013:19). Similarly, Kerns (2008) propounds the notion
that performance depends on activities that enhance the attainment of actions that drive the
achievement of important outcomes. Furthermore, the author in question refers to happiness
as "the experience of frequent, mildly pleasant emotions, the relative absence of unpleasant
feelings, and a general sense of satisfaction with one's life”.
Jex (2002, cited in Vanden Berghe, 2011:24) sees job performance as the multitude of
employee behaviours that they display while working. Jex’s clarification, however, falls short
on not stating whether the behaviour involved is negative or positive. The clarification also
does not state whether such performance is general and/or directed towards the job. However,
it is assumed that the behaviour involved consists of both negative and positive behaviour
towards the job. Corvellec (1995, cited in Kaburia, 2013) advises that performance “is not …
straightforward …”.
Moreover, performance is seen to "consist of complicated series of interacting variables about
aspects of the job, the employee and the environment" (Milkovich & Wigdor, 1991, cited in
Vanden Berghe, 2011:24). Oberoi and Rajgarhia (2013) put it as "performance is [a] true …
test for survival in the marketplace." Koopmans et al. (2011:856) consider job performance to
be something that is intangible, and a hidden concept that cannot be assessed.
The above definitions refer to outputs or outcomes (in terms of accomplishment), as well as
stating that performance is about doing the work, as well as being about the results achieved.
Performance, which can only occur when employees are motivated and satisfied with their job,
is the execution of job-related tasks by employees during the performance of their job, with the
doing of such tasks being aimed at ensuring organisational performance as a whole.
73
Job performance consists of many parts that are made up of indicators that can differ among
various jobs that can be assessed. A more acceptable definition is the one given by Milkovich
et al. (1991, cited in Vanden Berghe, 2011:4), who describe job performance as consisting “of
complicated series of interacting variables pertaining to aspects of the job, the employee and
the environment”. Vroom (1964, cited in Armstrong, 2010:248) opines that individual
performance is the result of "ability multiplied by motivation”. Thus, an employee’s performance
is a function (result) of both ability and motivation, for which he provides the formula:
Performance = (ƒ) Ability × Motivation.
If an employee is highly qualified, but his or her performance is inadequate, the lack of
appropriate performance can be due to the absence of motivation, resulting in the inability to
produce quality work. Job satisfaction is considered a determinant of job performance,
whereas work quality is an indicator of job performance. There is a difference between job
performance and work productivity, despite the two terms often being used interchangeably in
the literature (Koopmans et al., 2011:856). Work productivity is defined "as input divided by
output”, with work productivity being a narrower concept than job performance. Performance
includes the action, or process, of performing a task or function, which, in turn, influences
service delivery either positively or negatively.
According to Churchill et al. (1987, cited in Salleh et al., 2011:31), the basis of performance is
"personal, organisational, environmental, motivation, skill level, attitudes and role perceptions".
Employees could, thus, not only be competent (meaning knowledgeable, skilful, and with a
positive attitude), but they could be able to apply their competencies within the social setting
of the organisation by means of ensuring sustained organisational performance. Employee
performance is the cornerstone of quality service delivery in organisations.
2.6.3 Job performance and its relationship to job satisfaction
The influence of employee job satisfaction on job performance remains fundamental in the
twenty-first century. The association between the two variables remains a dominant research
topic in the organisational behaviour literature (Ram, 2013:17; Skibba, 2002, cited in Indermun
& SaheedBayat, 2013:2). The research that has, so far, been conducted to clarify, by means
of theories, the relationship between job performance and job satisfaction is not conclusive
(Shaikh et al., 2012:322; Muindi & K’Obonyo, 2015:225). The authors concerned opine that
the various research studies previously undertaken have considered only certain aspects as
impacting on job performance and job satisfaction.
74
The assertion was first highlighted during the debate of the Hawthorne studies during the
1930s, with, since then, various researchers having critically examined the idea that a "happy
employee is a productive employee" (Skibba, 2002, cited in Indermun & SaheedBayat,
2013:3). Further review of Laffaldoano and Muchinsky’s (1985, cited in Muindi & K’Obonyo,
2015:225) work suggests that the statistical correlation between job satisfaction and
performance indicates the existence of a weak relationship. However, further research into the
subject matter concerned does not agree with the conclusion drawn in the above respect, due
to other studies having found that the correlation between job satisfaction and individual job
performance is actually positive (Goslin, 2005, cited in Bakotić, 2016:118-119).
Job performance and job satisfaction seem to have a reciprocal relationship, as suggested by
Skibba (2002, cited in Indermun & SaheedBayat, 2013:3), who asserts that the “underlying
theory of this reciprocal model is that if the satisfaction is extrinsic, then satisfaction leads to
performance, but if the satisfaction is intrinsic, then the performance leads to satisfaction”. The
above view is contrary to that of Shaikh et al. (2012:323) and Muindi and K’Obonyo (2015:225),
who suggest that “job satisfaction causes performance [more] than performance causes job
satisfaction”. In his study of banking sector staff and managers, Shaikh et al. (2012:325) found
tasks and contextual performance to be weak predictors of job satisfaction.
In contrast, Steinhaus and Perry (1996, cited in Maroofi & Dehghani, 2013:105) suggest that
employees who are grateful and satisfied with their jobs are likely to perform well. Evidently,
therefore, the job performance of employees ensures the competitiveness of successful
organisations (Trevor et al., 2007:4). The competitiveness of organisations results in
organisational performance. In the global competitive arena, organisations could not only
endeavour to improve their performance but they could continuously strive for improvement to
secure their survival (Chamanifard et al., 2015:852). Moreover, the authors concerned opine
that organisational success "can be reflected in … performance”. Latif et al. (2013:166) and
Mafini and Pooe (2013, cited in Chamanifard et al., 2015:854) found a positive correlation
between job satisfaction and organisational performance.
Organisational performance is seen as a management philosophy in accordance with which
work is performed (Chamanifard et al., 2015:853). Kim (2005, cited in Chamanifard et al.,
2015:853) opines that organisational performance "is the extent to which an organisation
performs well in pursuing its mission or produces outputs towards its mission".
75
The following dimensions of organisational performance (Tangen, 2004, cited in Chamanifard
et al., 2015:853) pertain:
Effectiveness includes doing the right things, at the right time, with the right quality. In practice, effectiveness is expressed as a ratio of actual output to expected output.
Efficiency is defined as a ratio of resources that are expected to be consumed to resources actually consumed.
Productivity is defined as the traditional ratio of output to input.
Quality is a widely used concept. To render the term more tangible than it might otherwise be, quality is measured at several checkpoints.
Innovation is a managerial system that emphasises an organisation's mission, the searching for new and specific opportunities, and the determining of success scales.
In addition, Naseem et al. (2011, cited in Chamanifard et al., 2015:854) established the
existence of a relationship between employee satisfaction and organisational performance.
Similarly, Kuzey (2012, cited in Chamanifard et al., 2015:854) also established that job
satisfaction influences organisational performance. However, in contrast to the above, Bakotić
(2016:118) opines that the above-mentioned relationship is complicated. Accordingly, it is vital
for organisations to pay attention to their employees’ job satisfaction and performance,
because such factors can influence organisational performance as a whole.
In the contemporary municipal environment, the primary concern is improving the performance
of employees, with a view to increasing their effectiveness and efficiency through attitude
change. The need was created by the pressure to perform to the ratepayers' expectations; by
providing service delivery that they can see is worth their financial input.
For the CoW Municipality to improve its service delivery, the job satisfaction of its employees
must be taken into account. Job performance provides a competitive advantage, by means of
playing a central role in organisational performance, and, ultimately, in organisational success.
2.6.4 Managing organisational performance
Performance in organisations influences the organisation's continued existence. It is,
therefore, necessary to discuss the notion of managing organisational, team and individual
performance. For organisations to accomplish their goals and objectives, they should
continuously look for better ways of organising and managing.

76
According to Smit et al. (2008:187) organising entail the “process of determining which takes
each of the managers and workers should perform, who will perform them, and how these
tasks will be managed and coordinated”. Performance, in contrast, refers to individual and
team activities resulting in organisational success (Rothwell et al., 2000:35, cited in Colli,
2013:19). In turn, performance includes the activities, or the process, of performing a task or
function that influences service delivery positively and/or negatively.
Moreover, when the above definitions are combined, organisational performance can be seen
as relating to how successful an organised group of people with the particular purpose of
performing a needed function is. According to Armstrong (2010:247), organisations are created
to serve their customers in the following five ways, namely by:
delivering high-quality goods and services;
acting ethically (exercising social responsibility) with regard to their employees and the public at large;
rewarding their employees equitably, according to their contribution;
rewarding shareholders by increasing the value of their holdings, as long as doing so is consistent with the requirement to meet the needs of the other stakeholders; and
ensuring that the organisation has the capability required to guarantee continuing success.
There is growing recognition that the primary source of competitive advantage derives from an
organisation’s HR. In order to compete in the ever-changing global business environment,
organisations need to “embrace change related to innovation, management practices and …
services” (Indermun, 2014:126).
Business management is the output, or the result, of an organisation, be it financially or service
orientated. Managing performance entails directly managing a business as a single entity
(Gheorghe & Hack, 2007, cited in Armstrong, 2010:253).
In recognising the need and urgency for improved service delivery, Namibian LAs have
demonstrated their willingness to change the situation from non-performing (the way in which
things have been done in the past) to performing (which is a different way of doing business),
so as to improve their service delivery.

77
Change in organisations, as mentioned above, has been brought about by various challenges,
including: globalisation; the value chain of business competitiveness and HR services;
profitability through cost and growth; a capability focus; change and change technology; and
the attracting, retaining, and measuring of competence and intellectual capital. Turnaround is,
however, not transformation (Ulrich, 1997, cited in Alamri, 2013).
The current-day organisation realises that their employees can provide a competitive
advantage, by contributing to the organisation’s performance. Due to the realisation that
employees are the most valuable asset of an organisation, the importance of PM has been
recognised as a priority (Oberoi & Rajgarhia, 2013).
Furthermore, such challenges as interest rate hikes and increases in taxation exist. Notably,
the CoW Municipality’s continued service delivery was under threat at the time of the current
study, due to environmental change. Notwithstanding the ever-changing environment,
Armstrong (2010:247) suggests that organisations are in business to meet the needs of their
stakeholders, which they do in the following five ways:
delivering high-quality goods and services;
acting ethically (exercising social responsibility) concerning their employees and the public at large;
rewarding their employees equitably according to their contribution in the private sector;
rewarding shareholders by increasing the value of their holdings, as long as this is consistent with the requirement to meet the needs of other stakeholders; and
ensuring that the organisation has the capability required to guarantee continuing success.
The management of organisational performance is a “strategic approach” that is directed at
benefiting various stakeholders. Furthermore, Armstrong (2010:255) opines that PMSs are
vital, because they are aligned with the business strategy and aid in attaining goals.
The conducting of PM ensures that organisations attain better results from individuals and
teams by understanding and managing their performance in terms of agreed objectives,
standards and competency requirements (Armstrong, 2010:259).

78
In addition to needing to attaining, or exceeding, the expectations of customers, to survive,
organisations also need to sustain their continued growth and expansion, and to build a high-
performance culture, which requires the involvement of the employees in the organisation. A
performance culture can be found where satisfied employees understand why they must
perform to attain and/or exceed agreed expectations (Armstrong, 2010:250).
The following three approaches can make a substantial contribution to the building of a high-
performance culture in organisations (Armstrong, 2010:251):
the implementation of high performance by means of operating a high-performance work system;
the use of rewards; and
the employment of systematic methods of managing performance.
According to e-reward (2003, cited in Armstrong, 2010:250), a high-performance culture is
characterised by the following:
employees are aware of their duties, knowing exactly what to do regarding their goals and accountabilities;
employees are competent to do what is required of them;
top performance is noticed, and rewarded accordingly;
employees are convinced of the importance of their jobs, and their competencies fit their jobs; and
there is sufficient support, timely feedback, performance evaluation, and development.
Furthermore, organisational performance is considered as the execution of competencies by
employees to achieve “quality, quantity, cooperation, dependability and creativity” (Salleh et
al., 2011:31). The result means that an organisation needs to develop its organisational
capability to perform effectively and efficiently, so as to be able to attain required results
(Armstrong, 2010:247).
The development of organisational capability requires organisations to create systematic steps
for enhancing measures (motivation and job satisfaction) that could increase organisational,
team and individual performance (Armstrong, 2010:247).

79
As referred to by Kumar (2012:829), satisfied employees tend to produce increased customer
satisfaction that, in turn, results in positive organisational performance. The above-mentioned
assertion is supported by Oberoi and Rajgarhia (2013), who emphasise that an employee’s
performance has a significantly positive effect on organisational performance and competitive
advantage. Due to the above, satisfied employees are crucial to influencing organisational
performance.
By implication, it means "taking a broad and long-term view of where the business is going and
managing performance in ways that ensure that this strategic thrust is maintained" (Armstrong,
2010:254). The aim is to give clear direction during challenging times to ensure that the need
for all stakeholders (employees, teams and the organisation) are met through the development
and implementation of "integrated systems for managing and developing performance"
(Armstrong, 2010:254).
The challenge of managing organisations requires employers to have PMSs in place to ensure
that performance is maintained (planned, reviewed regularly, and met with feedback). PM
ensures that organisations attain improved results through individual employees and teams by
means of promoting the understanding and management of their performance, in terms of set
objectives, standards, and competency requirements (Armstrong, 2010:259).
Furthermore, PMS allows people to achieve set performance expectations to which they have
agreed, while simultaneously fostering organisational and individual capability. An organisation
needs to manage the performance of its employees to be able to have a competitive advantage
over its rivals. In the present instance, the CoW Municipality was required to administer the
performance of workers in their employment, and, to do so, it had to have a well-developed
PMS in place.
Armstrong (2010:253-254) postulates that the management (planning, organising, monitoring,
and control) of organisational performance takes place in terms of the following dimensions
creating visions for the future planning and determining the present organisational state, and
developing strategies to improve that state; designing, developing and implementing
improvements interventions; designing, redesigning, developing, and implementing
measurement and evaluation systems; putting cultural support systems in place to reward and
reinforce progress.
80
It is, thus, imperative that organisations have suitable management systems in place, so as to
ensure that outstanding performance is identified, with positive feedback being given through
recognition and reward.
Top performers could, in this way, be encouraged to remain with the organisation so as to
ensure its sustained progress. As the performance of organisations helps to ensure their
continued survival, it is necessary to discuss the concept of PM, which is usually associated
with PA. The terms “performance management and performance appraisal have been used
interchangeably in the literature” (Rao, 2008, cited in Coleman, 2009). However, a significant
difference exists between the two systems, will be briefly discussed in subsection 2.5.3.1
below.
Organisational, team and individual performance is affected by various factors that are outside
its control, some of which transform themselves from time to time, or which are influenced by
such advocacy groups as unions. According to IntraHealth International (2014:5), the external
factors include factors over which the organisation has little or no control, such as:
national policies, regulations, standards, and professional scopes of work;
licensing, or accreditation, requirements and processes;
social norms regarding gender, culture, class, religion, and ethnicity;
socioeconomic conditions, education levels, and standards of living;
market conditions and customer needs and preferences;
national and local infrastructure: transportation, energy, telecom, water, and sanitation; and
political changes in the national and local government.
2.6.4.1 The meaning of ‘performance management’
PM in organisations is done in an orderly manner, with the aim of improving the performance
of teams and individual capabilities (Armstrong, 2010:247). Furthermore, Armstrong
(2010:253) postulates that the management of organisational performance "take place in a
number of dimensions". He further argues that the administration of organisational
performance involves the adoption of a "strategic approach" to benefit the various
stakeholders.

81
Similarly, Armstrong (2010:260) suggests the following Performance Management Process
(PMP) taking place in a performance cycle:
planning: agreeing on objectives and competency requirements, as expressed in the role profiles; identifying the required behaviours; producing plans expressed in PAs for meeting objectives and improving performance; preparing personal development plans to enhance knowledge, skills and competence, and to reinforce the desired behaviours;
acting: carrying out the work required to achieve objectives by referring to the plans and by responding to new demands;
monitoring: checking on the amount of progress made in achieving objectives and in responding to new demands; treating PM as a continuous process – ‘managing performance all the year round’ – rather than as an annual appraisal event; and
reviewing: involving a ‘stocktaking' discussion of progress and achievements at a review meeting and identifying where action is required to develop performance, as a basis for completing the cycle by means of continuing to the planning stage.
The above-mentioned processes create a platform for enhancing performance as a direct
result of performance agreements including such aspects as the formulation of development
plans, the provision of feedback, and the supply of a recognition and reward system
(Armstrong, 2010:61). Gheorghe and Hack (2007, cited in Armstrong, 2010:253) are of the
view that actively managing performance is simply running a business – running the entire
business as one entity. It’s a continuous cycle of planning, executing, measuring results and
planning the next actions. In the context of a larger strategic initiative, that means continuous
improvement. PM, in itself, is critical to organisations for various reasons. Effective PM
enhances individual and team performance, fosters on going employee and team
development, and improves overall organisational efficiency and effectiveness (Armstrong &
Baron, 1998, cited in Ahmad, 2012:51).
Furthermore, PM makes employees aware of the contribution that they make by continuously
improving their skills, behaviour and contributions made to business processes (CIPD, 2014).
Halogen Software Inc. (2013) refers to PM as a “set of on-going management practices that
help ensure employees get the direction, feedback and development they need to succeed in
their roles”.
The definition is supported by Bratton and Gold (2007:274), who refer to PM “as a set of
interconnected practices which are designed to ensure that a person's overall capabilities and
potential are appraised so that important goals can be configured for work [to deliver efficient
and effective services] and … [job] performance can be collected and reviewed”.

82
Torrington et al. (2013:196), in contrast, suggest that PM is “a continuous process of
identifying, measuring, and developing the performance of individuals and teams and aligning
performance with the strategic goals of the organisation”. Additionally, the CIPD (2014) refers
to PM as "a holistic process bringing together many of the elements that make up the
successful practice of people management including, in particular, learning and development".
PM enhances line management relationships by encouraging them to build lasting and positive
relationships with individuals based on clear expectations, trust and empowerment. The
authors opine that PM is about fostering performance culture, in terms of which employees are
cognisant of the contribution that they make towards "continuous improvement of business
processes and their skills, behaviour and contributions”.
The above view is supported by Fletcher (2001, cited in Coleman, 2009), who considers PM
to be a process that forms part of a larger system affecting employee performance, as well as
part of the entire organisation and its departments setting new goals and development
objectives. Similarly, Armstrong (2010:247) proposes that managing performance involves
taking systematic action to improve organisational, team and individual performance. The
author further asserts that it enables performance expectations to be defined, and forms the
basis for developing organisational and individual capability. The author concludes by saying
that, for individuals, PMPs are associated with both financial and non-financial rewards.
The CIPD (2014) opines that a good PMP drives engagement by means of facilitating on going
communication on performance outcomes throughout the organisation, reinforcing its purpose,
linking objectives at organisational, department and individual levels. Furthermore, the authors
advance the idea that PM requires a PMS to achieve its desired output. The system provides
a framework to support the optimal performance of employees and supervisors (CIPD, 2014).
Figure 2.9 bellow illustrates the performance management system.
Figure 2.9: The performance management process
(Adopted from Bratton & Gold, 2007:585)
Performance assessment
Performance appraisal
Employee development
Employee reward Work effort
Start of year End of year
Performance diary notes

83
Armstrong (2009:9) considers PMS “as a process designed to improve organisational, team
and individual performance … [which] … is owned and driven by the line manager”. It is,
therefore, important for an organisation to embrace a transparent methodology when
implementing the chosen PMS. Smit et al. (2008:321) opine that the PMS used by an
organisation impacts on the attitude of employees, so that, ultimately, the behaviours of
employees and their colleagues can either encourage or discourage performance.
In recent years, having a PMS in place has become critical, because line managers are under
constant pressure to improve the performance of their organisations by thereby improving
organisational, team and individual performance (Armstrong, 2010:247; Oberoi & Rajgarhia,
2013). The PMS used by any organisation has an impact on the job satisfaction of its
employees and their co-workers, as it can either encourage or discourage quality performance
(Smit et al., 2008:321).
2.6.4.2 The meaning of ‘performance appraisal’
Employees’ levels of performance are determined during job performance reviews by their
employer (University of Washington, 2007). The PM system adopted by an organisation guides
the performance appraisal system (PAS) that is in place to reward employees, either as a team
and/or as an individual (Smit et al., 2008:321). The assessment and compensation of
employees can have a negative and/or positive outcome, depending on the behaviour that is
strengthened by the PMS involved.
Performance evaluation, or the measuring of performance, has become a necessary practice
in HRM, with it having become well-documented (Grund & Sliwka, 2007:1). Jawahar (2007,
cited in Kumar, 2012:87) considers PAS as a crucial component of HRM practices that
contribute to decision-making that is integral to employees’ actions and outcomes. Individual
PA, as suggested by Kumar (2012:828), is “essential in recognising and motivating
individuals". Employees’ appraisal, as part of their performance, has long been viewed as a
contributing factor to organisational success. The measuring of employees’ performance is not
a new phenomenon (Ghauri, 2012:35).
The PMS adopted by an organisation guides the PA system that is intended to reward
employees as an individual, or as a member of a team or group (Smit et al., 2008:321). The
PAS alone is sometimes adequate, depending on the context in which it is used.

84
Furthermore, Budworth and Mann (2011, cited in Ghauri, 2012:36-37) suggest that the main
aim of the PAS is to make available performance information for administrative and
developmental purposes related to organisational decision-making.
The administrative aspect deals with such issues as bonuses, salary and wage increases (or
the lack thereof) and merit bonuses, promotions, transfers, dismissals, and retrenchments.
Furthermore, the above-mentioned view is supported by Regal and Hollman (1987, cited in
Ghauri, 2012:38), who indicate that top management backing is crucial for the adoption of a
particular process by an organisation.
The PA is also an important tool for the managing of employees’ performance (Torrington et
al., 2013:195). Figure 2.10 below is a process diagram of the performance appraisal.
Figure 2.10: A process diagram of the performance appraisal
(Adopted from CIPD, 2013)
The choice and process of appraisal is not the same in all organisations. According to Kumar
(2012:88), PAS is not universal. A PAS used in one organisation will not necessarily work in
another organisation, with its development and management having to be “tailor-made to
match employee and organisational characteristics and qualities".
The Online Dictionary of Library and Information Science (2012, cited in Kwaku & Boateng,
2015:60) defines PA as a structured formal interaction between a subordinate and a supervisor
that usually takes the form of a periodic interview, in which the work performance of the
subordinate is examined and discussed with a view to identifying weaknesses, strengths and
opportunities for improvement and skills development.
Review
Work effort
Start of assessment period End of assessment period
Appraisal

85
According to Lansbury (1988) cited in Kwaku and Boateng (2015:60), PA is the process of
identifying, evaluating and developing the work performance of the employee in the
organisation, so that organisational goals and objectives are actually achieved while, at the
same time, benefiting employees regarding recognition, receiving feedback, and offering
career guidance. However, Beer (1981, cited in Ghauri, 2012:36), opines that the PA’s
objectives could be split in two to make performance information available to employees and
the organisation separately.
Figure 2.11 below illustrate the organisational PA objectives.
Figure 2.11: The multifaceted objectives of the performance appraisal
(Adopted from Beer, 1981, cited in Ghauri, 2012:36)
According to Armstrong (2009) and Stone (2010) cited in Ghauri (2012:35), PA is the
“systematic evaluation of a particular function on the basis of prescribed performance
indicators and highlighting the areas for further development and growth of an individual
employee”. In contrast, Kwaku and Boateng (2015:58) view PA as a process of evaluating an
employee’s work performance in an organisation or corporate entity. The process is used by
supervisors on an annual basis to evaluate employees formally, with the primary intention of
attempting to improve employee and organisational performance.
Organisational
PA objectives
To provide feedback to employees
To develop bases for monetary increment
To help manager with retention and warnings
To counsel and coach to improve
performance To discuss career opportunities and planning
To motivate through recognition and support
To seek rewards and self-image
To strengthen employee–supervision relations
To diagnose individual and organisational problems
To obtain feedback about their performance
To receive feedback about self-development
Evaluation
objectives
Coaching
objectives
Employee
objectives

86
Similarly, the CIPD (2013) provides the following five key elements of the PA process:
measurement: assessing performance against agreed targets and objectives, and behaviour and attitudes against espoused values;
feedback: providing information to individuals on their performance and progress, and on what is required for them to continue to perform well in the future, particularly given any change in the programme, and in the evolution of job roles;
positive reinforcement: emphasising what has been done well and constructively criticising what requires improvement, drawing out the importance of how things are done and what has been done, as well as ensuring that effort is directed at value-adding activities;
exchange of views: entailing a frank exchange of opinions about what has happened, how appraisees can improve their performance, the support that they require from their managers to achieve this, and their aspirations for their future career; and
agreement: involving the joint coming to an understanding of all parties about what needs to be done to improve and sustain performance generally, and to overcome any issues discussed.
The developmental aspect deals with recognising performance gaps requiring filling. The key
objectives of PAS include officially informing employees of how their performance is evaluated,
recognising and rewarding deserving employees, giving feedback on areas of improvement,
and empowering employees to take up more advanced responsibilities than before (Stone,
2010, cited in Ghauri, 2012:37).
According to Ghauri (2012:38), organisations are only able to achieve the objectives of a PAS
if the system is fully supported by top management. Such support is discernible when
managers at all levels embrace the “development, execution and success” of the process
entailed (Song et al., 1997, cited in Ghauri, 2012:38).
Anderson (2010, cited in Ghauri, 2012:38) asserts that “senior management’s commitment
cannot be obtained until they are convinced with process’s result orientation, practicability and
the required support”.
2.6.5 Teamwork performance
Merriam Webster (n.d.) defines a team as "a number of persons associated together in work
or activity". The Business Dictionary (n.d.) defines a team as “a group of people with a full set
of complementary skills required to complete a task, job, or project”.
87
Similarly, Heathfield (2017) defines team performance as the behaviour of any group of people
who are organised to work together interdependently and cooperatively, so as to accomplish
their goals or mission. Making use of teams in all types of organisations is a global
phenomenon. Baker and Salas (1997, cited in Bell, 2007:595) refer to teams as “units of two
or more individuals who interact interdependently to achieve a common objective”.
However, bringing team members together to accomplish interdependent tasks only
sometimes results in effective team performance (Salas et al., 2004, cited in Mathieu &
Tammy, 2009:90). According to Bell (2007:595), team members’ interdependent interactions
result in whether or not a team is successful.
To be successful, they engage in a number of team "processes or interdependent acts that
convert inputs to outcomes through cognitive, verbal, and behavioral activities directed towards
organising task work to achieve collective goals” (Marks et al., 2001, cited in Bell, 2007:595).
Furthermore, the above-mentioned author emphasises that teams ensure the completion of
work that is required to be done by more than one employee. Moreover, teams are used
extensively by organisations in efforts to maximise the benefits to be gained from economic
and technological advances (Devine et al., 1999, cited in Bell, 2007:595).
According to Levine and Moreland (1990, cited in Bell, 2007:595), “team composition is the
configuration of member attributes in a team and is thought to have a powerful influence on
team processes and outcomes” (Kozlowski & Bell, 2003, cited in Bell, 2007:595). Chen et al.
(2007:331) suggest that organisations need “to lead and motivate not only individuals but also
teams as a whole”. Horwitz and Horwitz (2007:990-991) opine that team performance is seen
as a “multidimensional construct that encompasses several outcome measures such as
quantitative production, qualitative team outcomes, and team cohesion”.
2.6.6 Individual work performance
Individual performance has been shown to have a significantly positive effect on organisational
performance, making the input of employees the key factor for competitive advantage (Oberoi
& Rajgarhia, 2013).
It is, thus, clear that an individual’s performance impacts on an organisation’s wider strategies
and goals, with the management of every employee’s performance, therefore, being
imperative. Of primary importance to an organisation is individual job performance, which could
be the key focus of line managers’ endeavours.

88
Various studies have been conducted on individual work performance. Armstrong (2010:259)
notes that individual performance “is developed through performance management systems”.
According to Koopmans et al. (2011:856), individual work performance is referred to as an
issue that has not only grasped companies all over the world but also fuelled a great deal of
research in fields of management, occupational health, and work and organizational
psychology.
Furthermore, Koopmans et al. (2011:856) consider work performance to be intangible, and as
a hidden concept that cannot be assessed. The authors concerned conclude by stating that
work performance consists of many parts that are made up of indicators that can differ between
jobs, and that can be assessed.
They suggest a heuristic framework for such performance (as presented in Figure 2.12), with
the intention of promoting the understanding of the nature of individual work performance.
Koopmans et al. (2011:863), in contrast, further opine that individual work performance
consists of four dimensions, namely, “task performance, contextual performance, adaptive
performance, and counterproductive work behaviour … [which] … capture the full range of
behaviours that constitute individual work performance in virtually any job”.
Furthermore, Koopmans et al. (2011:864) concluded that the importance of the above-
mentioned framework lies “in shaping the design of workplace interventions and assessing the
effects of that intervention on individual work performance.”
Notwithstanding how much employees are motivated to perform, it is, nevertheless, important
to indicate the challenges that impair their performance. Separating individual work
performance from team and organisational performance is impossible (Koopmans et al.,
2011:864). Koopmans et al. (2011:856) also differentiate between causal variables and
indicators of work performance.
According to the researchers concerned, “[c]ausal variables determine or predict one’s level
of work performance, whereas indicators are reflections of work performance. For example,
job satisfaction is considered a determinant of work performance, whereas work quality is an
indicator of work performance”. Individual performance is affected mainly by two factors,
namely those of the employee and those of the organisation. Individual factors include the
attributes of employees.
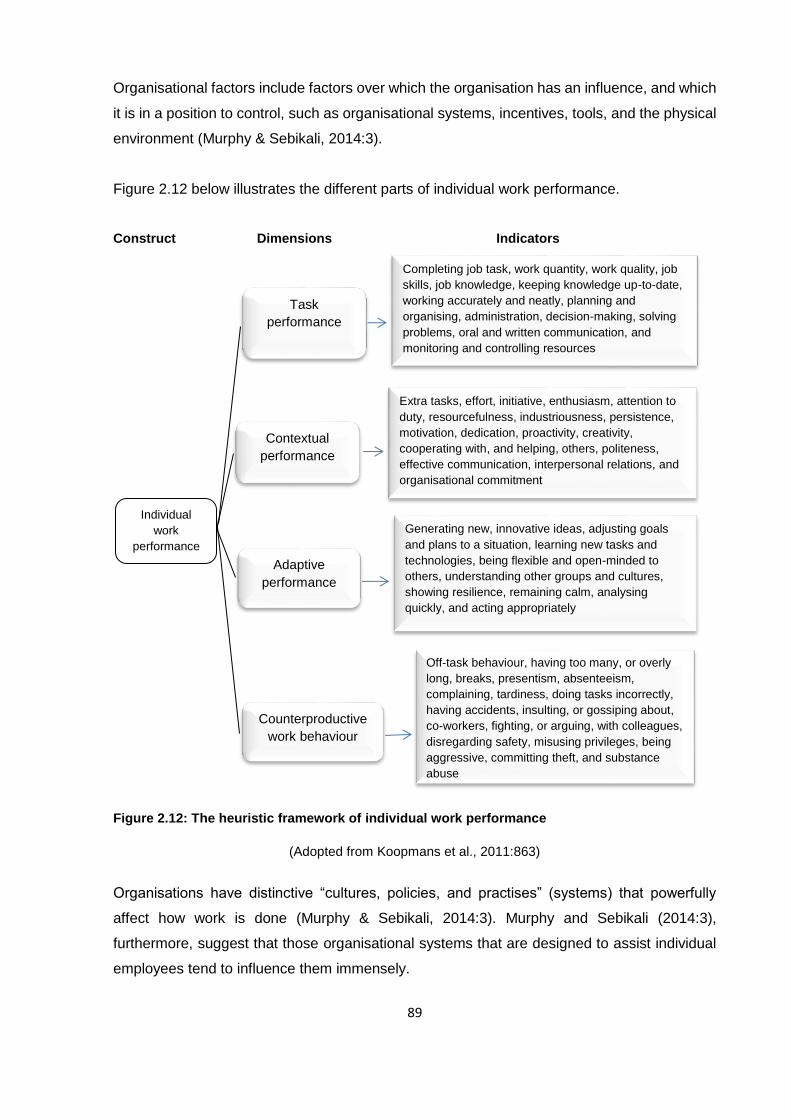
89
Organisational factors include factors over which the organisation has an influence, and which
it is in a position to control, such as organisational systems, incentives, tools, and the physical
environment (Murphy & Sebikali, 2014:3).
Figure 2.12 below illustrates the different parts of individual work performance.
Construct Dimensions Indicators
Figure 2.12: The heuristic framework of individual work performance
(Adopted from Koopmans et al., 2011:863)
Organisations have distinctive “cultures, policies, and practises” (systems) that powerfully
affect how work is done (Murphy & Sebikali, 2014:3). Murphy and Sebikali (2014:3),
furthermore, suggest that those organisational systems that are designed to assist individual
employees tend to influence them immensely.
Off-task behaviour, having too many, or overly
long, breaks, presentism, absenteeism,
complaining, tardiness, doing tasks incorrectly,
having accidents, insulting, or gossiping about,
co-workers, fighting, or arguing, with colleagues,
disregarding safety, misusing privileges, being
aggressive, committing theft, and substance
abuse
Task
performance
Contextual
performance
Individual
work
performance
Completing job task, work quantity, work quality, job
skills, job knowledge, keeping knowledge up-to-date,
working accurately and neatly, planning and
organising, administration, decision-making, solving
problems, oral and written communication, and
monitoring and controlling resources
Extra tasks, effort, initiative, enthusiasm, attention to
duty, resourcefulness, industriousness, persistence,
motivation, dedication, proactivity, creativity,
cooperating with, and helping, others, politeness,
effective communication, interpersonal relations, and
organisational commitment
Generating new, innovative ideas, adjusting goals
and plans to a situation, learning new tasks and
technologies, being flexible and open-minded to
others, understanding other groups and cultures,
showing resilience, remaining calm, analysing
quickly, and acting appropriately
Adaptive
performance
Counterproductive
work behaviour

90
Leaders, specifically line managers, have a duty to pay attention to the design of such systems,
and to ensure that they are kept relevant, so as to enable individuals to perform optimally and
to achieve set objectives. The following key system components are be considered (Murphy &
Sebikali, 2014:3):
clear organisational goals, strategic plans, and structure;
effective leadership;
clear job expectations and authority;
supportive supervisory systems;
clear operational policies and efficient processes;
realistic workloads;
effective management systems (finance, HR, logistics, and information);
fair and transparent HR, marked by hiring, management, and appraisal systems;
termination/exit processes;
clear communication and information channels and access; and
adequate financial resources.
Successful organisations tend to provide attractive incentives to inspire employees to
contribute positively to the organisation's goals and results. According to Murphy and Sebikali
(2014:3), “incentives can encourage employees to work better through communicating clear
expectations, feedback, and rewards to improve performance”. Elements to consider, in terms
of improving individual performance, include:
clear expectations regarding responsibility, accountability, and autonomy;
constructive performance feedback;
fair compensation and rewards systems;
recognition for good performance;
consequences for poor performance;
engaging and meaningful work; and
professional development and career opportunities.

91
In terms of tools and the physical environment, whether employees are well-equipped with the
necessary tools, supplies, and supportive physical environment to perform well is of
importance (Murphy & Sebikali, 2014:4). An organisation could also have maintenance
systems in place to support the sound functioning of the workplace. According to Murphy and
Sebikali (2014:4), key components to consider include:
the equipment, instruments, consumable supplies, drugs, and other commodities;
the protocol/procedure manuals, job aids, and record-keeping tools;
the physical work environment (furniture, workspace, power, water, light, and ventilation);
the workplace safety measures; and
the information technology and communication systems, equipment, and connectivity.
The concept of ‘knowledge and skills’ refers to whether employees are competent to work
correctly (Murphy & Sebikali, 2014:4-5). The elements to consider in this respect include the
fostering of:
a basic education for literacy and math;
clinical, technical, professional knowledge and skills;
social and communication skills;
problem-solving, critical thinking, teamwork, and leadership skills; and
relevant work experience.
Individual attributes distinguish employees from one another in many different respects
(Murphy & Sebikali, 2014:4-5). Individual employees bring different attributes into play that can
affect their own, and their team’s, total performance. Personal characteristics include:
internal motivation;
gender/ethnic/class identity;
religious, ethical, and moral values;
optional, intellectual, physical, and creative abilities; and
previous life and work experience.

92
All other things being equal, the more effort that is put into a job, the higher the level of
performance is that will be attained. The next essential ingredient for achieving high
performance is the acquisition of appropriate skills. Even though individuals might exert much
effort in performing a task, they will only succeed in attaining their desired goals if they possess
the skills that are necessary to perform the tasks concerned.
To meet work performance expectations, an employee need to know what the expectations
concerned are. Any effort and ability that is exerted inappropriately will not yield high
performance. Line managers could, therefore, use their communication skills to ensure that
employees have a thorough understanding of what is expected of them (Tasmin & Akkas,
2017:82).
Having outlined and defined the nature of individual work performance, it is now necessary to
review the relationship between performance and the role of line managers.
2.6.7 The role of line managers in individual performance
The complexity of managing organisations in the contemporary fast-changing business world
requires line managers to view performance in several different functional areas
simultaneously. Line managers could help to ensure the provision of such non-monetary
rewards as positive feedback, recognition, opportunities for development, and the scope to
exercise responsibility (Armstrong, 2010:250).
An essential element of an organisation's long-term success is the collective effort exerted by
its employees. Employees’ performance and motivation are the energies that keep an
organisation’s service delivery smooth. In addition, line managers play an essential role in
delivering consistent performance results (financial and non-financial) by utilising the abilities
of those employees whom they manage.
According to Armstrong (2010:250), financial reward includes "pay reviews and fixing rates of
pay" and non-financial rewards, including "positive feedback, recognition, opportunity to
develop and scope to exercise responsibility”. A line manager’s greatest responsibility is to
manage individual performance by motivating change in performance through providing
appropriate feedback, monitoring, and training. According to the CIPD (2014), line managers
are responsible for managing individual employees’ performance. In turn, they must report to
a higher level of management than their own on the performance and well-being of the
employees whom they manage (CIPD, 2014).
93
The success of line managers greatly depends on their ability to understand and implement
the adopted PMS, since they are primarily responsible for its operation (Armstrong, 2010:250).
It is, thus, imperative for line managers to understand their role in the management of
performance. Furthermore, an organisation is also reliant upon the ability of its line
management to ensure that individuals deliver on the organisation's mission and objectives.
Appraisal of how PAs contribute to PM in general is also of key importance (CIPD, 2013).
According to the CIPD (2014), "line managers have responsibility for directly managing
individual employees and teams". In turn, line managers’ report to top management on the
progress of those employees whom they manage on the attainment of organisational goals
and objectives.
Line managers influence the way in which employees perform their jobs. Furthermore, line
managers can either encourage the employees under their supervision to do their job well or
‘suppress’ the performance of employees if they micro-manage them, or by means of their
‘autocratic’ management style (CIPD, 2012a).
The results of a study conducted by Newaz (2012:1) showed that the line managers in
Sainsbury’s UK had failed to achieve the objectives of their PMS. Selecting the right line
managers for each job is important, being those with the right attitude [including a feeling of
job satisfaction], skills, and confidence levels. Such selection could help to ensure that they
are able to manage the extent of their impact on the employees’ motivation levels, and, hence,
to influence the employees’ performance positively (CIPD, 2012b).
Smit et al. (2008:297) suggest that the important variables related to employee behaviours
about which managers could know include “attitudes; motivation; personality; perception;
learning and ability”. Similarly, line managers need to learn to understand and comprehend the
complex nature of their employees as people if they want to achieve their work-related goals.
Line managers have an indispensable role to play in handling employee performance during
the implementation of a PMS (CIPD, 2012b). Mounting evidence suggests that a happy and
high-performing workforce (consisting of managers and employees) is likely to exhibit more
[job] satisfaction than a less content and productive one would (Kerns, 2008). By implication,
the above suggests that a poorly performing workforce tends to display low levels of employee
satisfaction.

94
The adoption of a PMS by organisations enhances their competitive edge in the delivery of
service to their clients (Bratton & Gold, 2007:275). Berntahl et al. (2003) cited in McMahon
(2013:7) in their study confirmed that “organisations with strong PMS are 51 percent more
likely to outperform their competitors on financial measures and 41 per cent more likely to
outperform their competitors on non-financial measures”. Non-financial measures include
measures such as customer satisfaction, employee retention, and quality of products or
services. The CoW Municipality effectively requires highly motivated line managers, who have
a crucial role to play in the successful implementation of the PMS. As was previously stated,
such managers have the joint responsibility of ensuring the success of the PMS, together with
the employees involved.
According to the CIPD (2012a), "line managers have a responsibility to a higher level of
management for those employees or teams [performance]" during the implementation of a
PMS. Therefore, they need to be satisfied with their current roles and responsibilities.
Furthermore, the CIPD (2014) opines that line managers have a central role to play in PM, by
ensuring that the employees or teams that they manage:
know and understand what is expected of them;
have the skills and ability to deliver on the set expectations;
are supported by the organisation in developing their capacity to meet such expectations;
are given feedback on their performance; and
have the opportunity to discuss and to contribute to individual and team aims and objectives.
Success in implementing a PMS rests mainly with the top senior managers, the line managers,
and the employees. In the current study, line managers refer to D band employees at a
managerial and non-managerial level in the CoW Municipality. At the time of the current study,
the CoW was using the Paterson Job Grading System for the grouping of employees. The D2
and D3 levels were comprised of line managers, who had employees reporting to them. The
D1 and D2 levels consisted of the section heads, of which some had employees reporting to
them, and some not. The specialists (non-section heads) were to be found at either the D1 or
the D2 levels (Hartzenberg, 2012). Therefore, the line managers and supervisors needed to
be satisfied with their roles and responsibilities in order to aid in implementing the PMS in the
CoW Municipality.

95
2.6.8 Psychological contract and job performance
The discussion that follows provides insight into PM and its role in shaping the PC between
employees and employers. In essence, PM is about improving performance. Armstrong (2006,
cited in Newaz, 2012:2) points out that PM is crucial in developing a positive PC between
employers and employees.
The above holds true because, according to Newaz (2012:1), the PMS, which is comprised of
all the necessary components play[s] a significant role in developing employees as well as [in]
facilitating the formation of a positive PC ... [thus] partial and inattentive implementation of the
system makes the situation unfavourable for the PC to develop. Employees are bound by
contractual commitments into which they enter into at the time of them accepting employment.
The consideration of well-motivated employee behaviour is widely known to be incorporated
into a description of the employees’ goals and interests at the time of the appointment of an
employee. In most instances, the result is an ‘unwritten’ contract, which is known as the
‘psychological contract’ (Markin et al., 2002, cited in Nawaz, 2012:2).
Furthermore, the authors opine that the PC is becoming a powerful concept in the work context,
due to the challenges that employee–employer relationships have to face. Two sets of interests
are indicated in regard to the above, being those of the employing organisations, on the one
hand, and of individual workers, on the other.
According to the CIPD (2014), the term ‘psychological contract’, which became popular
following the economic downturn in the early 1990s, refers to "a set of reciprocal but unwritten
expectations between individuals and their employer" (Wiley, 2008, cited in Kinsella, 2009).
According to Rousseau (1989), cited in Fayyazi and Aslani (2015:1031) a “ PC is an individual’s
belief regarding the terms and conditions of a reciprocal exchange agreement between that
focal person and another party”.
The PC relates to workplace affiliation, as viewed by the signature parties concerned. The
contract binds both parties to a promise of what they can and cannot expect from each other;
if fulfilled the “relationship is beneficial and if not fulfilled constitute a breach” with negative
consequences (Robison & Rousseau, 1994 cited in Fayyazi & Aslani, 2015:1031).
A PC pertains to the views of the employee and employer, in terms of their collective
responsibilities towards each other (CIPD, 2014).

96
The Business Dictionary.com (2014) defines such a contract as “the unwritten understandings
and informal obligations between an employer and its employees regarding their mutual
expectations of how each will perform their respective roles.” Within a typical business, the PC
might include such elements as the levels of employee commitment and job satisfaction, as
well as the quality of working conditions.
The above-mentioned authors give the following example, "if a new manager believes they
were promised pay commensurate with performance at the time of hire, then it creates an
expectation but, it also creates a perceived obligation that is part of the psychological contract".
In the above case, the PC accomplishes two tasks, defining both the employment relationship
and the expectations involved.
A more comprehensive definition of the PC is given below by Guest, Conway and Briner (1996,
cited in Armstrong, 2010:144):
“The psychological contract is concerned with assumptions, expectations, promises and mutual obligations. It creates attitudes and emotions that form and govern behaviour. A psychological contract is implicit. It is also dynamic – it develops over time as experience accumulates, employment conditions change, and employees re-evaluate their expectations.”
The above definition is amplified by the following definition given by Rousseau and Wade-
Benzoni (1994, cited in Armstrong, 2010:145):
“Psychological contracts refer to beliefs that individuals hold regarding promises made, accepted and relied upon between themselves and another. (In the case of organisations, these parties include an employee, client, manager, and organisation as a whole).Because psychological contracts represent how people interpret promises and commitments, both parties in the same employment relationship (employer and employee) can have different views regarding specific terms.”
Millmore et al. (2007, cited in Newaz, 2012:2) conducted research at three organisations that
used PM as an important part of their move to build a PC. The authors concluded that “the
move towards developing the psychological contract was hampered by ineffective
implementation of performance management”.
In support of the above point of view, Armstrong (2006, cited in Nawaz, 2012:2) points out that
performance is involved in the creation of a constructive PC. The PC might include such things
as the levels of employee commitment, job satisfaction, the quality of working conditions, and,
ultimately, performance.

97
The importance of the PC concerning PM “... is that it highlights how easy it is for organisations
to assume that employees seek primarily monetary rewards; this is not necessarily the case”
(Newaz, 2012). In brief, the PC is becoming a powerful concept in the work context. In
particular, meta-analytic evidence from 28 studies suggests a strong negative relationship
between job satisfaction and PC breach (Zhao et al., 2007). Furthermore, related studies
conducted over the years strongly suggest that individual performance is the result of
motivated employee behaviour, as was discussed in section 2.2.
A well-motivated employee’s behaviour is commonly known to be attained when incorporating
employee goals and interests with those of the organisation during the appointment of the
employee. In section 2.2, it was also mentioned that motivation leads to job satisfaction, which,
in turn, leads to performance. Kardam and Rangnekar (2012) opine that job satisfaction implies
that there "is a psychological attachment of an employee with his job". Employees' obligations,
which start with the recruitment process, are viewed as promises and expectations that are
normally conveyed through the legal contract of employment (CIPD, 2013). To illustrate how a
PC affects performance, Guest and Conway (2004, cited in Kudzanayi, et al., 2015:32)
propound the useful model (simplified) given in Figure 2.13 below.
(Adopted from Guest & Conway, 2004, cited in Kudzaniyi, et al., 2015:32)
The simplified model of the above-mentioned PC above suggests that:
the extent to which employers adopt people management practices will have a significant influence on the state of the PC;
the state of the contract will be reflected in employees’ sense of fairness and trust and their belief that the employer will deliver on the ‘deal’ between them; and
a positive PC will lead to greater employee commitment and satisfaction.
Inputs
Employee characteristics
Organisation
characteristics
Human Resources practices
Output
Employee behaviour
Performance
Delivery
Content
Fairness
Trust
Figure 2.13: A model of the psychological contract
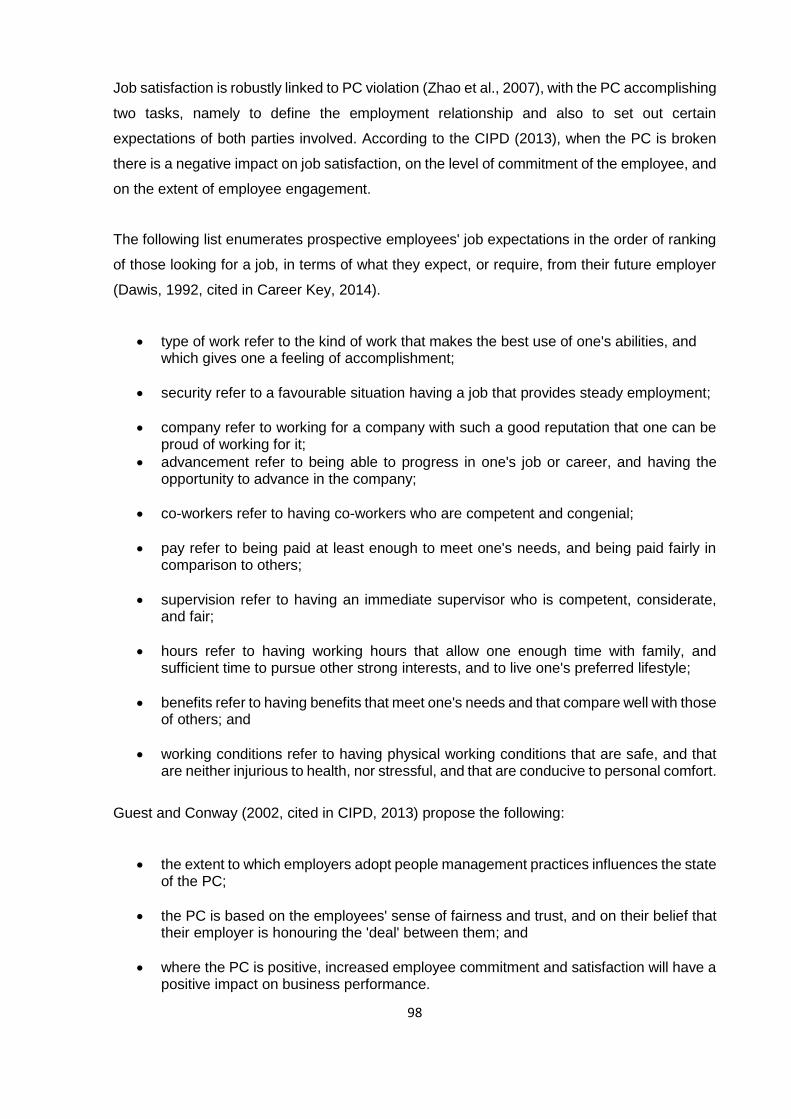
98
Job satisfaction is robustly linked to PC violation (Zhao et al., 2007), with the PC accomplishing
two tasks, namely to define the employment relationship and also to set out certain
expectations of both parties involved. According to the CIPD (2013), when the PC is broken
there is a negative impact on job satisfaction, on the level of commitment of the employee, and
on the extent of employee engagement.
The following list enumerates prospective employees' job expectations in the order of ranking
of those looking for a job, in terms of what they expect, or require, from their future employer
(Dawis, 1992, cited in Career Key, 2014).
type of work refer to the kind of work that makes the best use of one's abilities, and which gives one a feeling of accomplishment;
security refer to a favourable situation having a job that provides steady employment;
company refer to working for a company with such a good reputation that one can be proud of working for it;
advancement refer to being able to progress in one's job or career, and having the opportunity to advance in the company;
co-workers refer to having co-workers who are competent and congenial;
pay refer to being paid at least enough to meet one's needs, and being paid fairly in comparison to others;
supervision refer to having an immediate supervisor who is competent, considerate, and fair;
hours refer to having working hours that allow one enough time with family, and sufficient time to pursue other strong interests, and to live one's preferred lifestyle;
benefits refer to having benefits that meet one's needs and that compare well with those of others; and
working conditions refer to having physical working conditions that are safe, and that are neither injurious to health, nor stressful, and that are conducive to personal comfort.
Guest and Conway (2002, cited in CIPD, 2013) propose the following:
the extent to which employers adopt people management practices influences the state of the PC;
the PC is based on the employees' sense of fairness and trust, and on their belief that their employer is honouring the 'deal' between them; and
where the PC is positive, increased employee commitment and satisfaction will have a positive impact on business performance.

99
A breach of the PC is related to a range of undesirable employee attitudes and behaviours.
Furthermore, a PC breach is negatively related to job satisfaction and employee performance
(Zao et al., 2007:651; Johnson & O'Leary-Kelly, 2003, cited in Ahmed & Muchiri, 2014:3).
Avoiding a PC breach can, thus, be seen as important, because it is related to the employees'
job dissatisfaction and to negative behaviours. Naturally, employees tend to believe that the
promises that are made to them in return for their decision to expend their time and effort on
helping an organisation to attain its overall vision and aims could be honoured by their
employers (Ahmed & Muchiri, 2014:3).
2.7 Summary
Chapter Two has examined how motivation and job attitudes (in the form of job satisfaction)
form an integral part of the modern workplace, which directly impacts on employee
performance, with the sole purpose of increasing the efficiency and effectiveness, as well as,
ultimately, the productivity of organisations. How employee motivation is intricately linked to
job satisfaction and job performance has been shown, with the differences between the two
concepts being highlighted. Furthermore, employee job satisfaction (job attitude), or the lack
thereof, has been indicated as influencing the performance of employees that, in turn, leads
either to excellent, or to poor, service delivery. In short, employees who have a positive job
attitude are inclined to be much more successful than are those with a negative job attitude.
Given the information presented in the current chapter, a connection between job satisfaction
and employee performance is clearly evident. Thus, the conclusion reached in this regard
points to the fact that job satisfaction has an irrefutable effect on employee performance.
The chapter also differentiated between motivation and job satisfaction, indicating that both
intrinsic and extrinsic motivation is believed to cause the behaviour of employees, and also to
regulate the performance levels of employees.
Furthermore, job satisfaction is seen as the joy, or pleasure, of working, with it also being the
sense of accomplishment that can be attained after having flawlessly completed a job.
Similarly, it is possible for employees to continue working in a job even when they gain no job
satisfaction therefrom, as long as there is motivation in the form of a good salary and perks
(being the hygiene factors involved).
100
Evidence from the various studies indicates that two types of job satisfaction are based on the
level of employees' feelings regarding their employment. The first type, which is most often
studied, is global job satisfaction, which refers to the employees' overall feelings about their
job.
The second is job facet satisfaction, which refers to feelings about specific job aspects, such
as salary, benefits, and the quality of relationships with one's co-workers. It is, thus, clear that
people have different reasons for being satisfied with their jobs. However, some degree of
contentment is essential to doing a job for a long time. Such a feeling will ultimately determine
if the employer can recruit, and, above all, retain, the right staff, who are prepared to perform
to the best of their ability.
PM is considered to play a significant role in enhancing organisational success, by means of
ensuring that all individuals understand the contribution that they are expected to make to the
success of the organisation concerned. Employees, thus, need to be supported, motivated and
equipped with the relevant skills to be enabled to carry out their duties.
PM, which is, perhaps, one of the most challenging aspects of management responsibilities,
is critical to the ultimate success of an organisation. A well-devised and well-implemented PMS
inspires employee attitudes that are, in turn, likely to drive positive business outcomes. PM is,
thus, a catalyst for the development of employees, because its presence is required for the
improvement of individual and team performance. Conversely, PA is operational, taking place
in the form of short to medium-term interventions, and it is concerned only with the performance
and development of individual employees. While PA is a tool of PM, the data produced thereby
can feed into other elements of PM. PA, by itself, does not constitute PM.
The conceptualisation of PM is strategic to developing a positive PC between employers and
employees. The literature discussed in the course of the chapter has, further, revealed that the
PC defines the employment relationship and attendant expectations.
It strengthens the need for line managers to become more effective in communicating and
consultation with employees, which assists, in turn, with the adjusting of expectations. The PC
reinforces the need for line managers to become ever more effective in terms of the
communications process. Deteriorating efforts to fulfil or manage expectations may have grave
consequences on the relationship and the organisation involved.

101
Consultations about anticipated changes helps in adjusting the expectations involved, and, if
necessary, facilitate renegotiation of the deal. Public interest in the PC can be stimulated by
fears about job insecurity.
However, the survey evidence suggests that such fears have been exaggerated, and that
employers could, nevertheless, be paying more attention to restoring employees' trust in their
organisation than they have tended to do in the past. The above means clarifying what is on
offer, and meeting commitments, or, if necessary, explaining what might have gone wrong and
regularly monitoring employees’ attitudes.
Line management has, thus, a crucial role to play in the successful implementation of the PMS,
since it has a joint responsibility of ensuring the latter’s success.
During the implementation of a PMS, organisations require line managers to be highly
motivated, so as to ensure that the implementation of the PMS is successful.
The above discussion shows that the success of an effective PMS is determined by the manner
in which it is incorporated into the structural functioning of an organisation by line management
and employees alike. Furthermore, various studies indicate that a poor PC, in respect of the
employees involved, can result in the ineffective implementation of a PMS in an organisation.
Finally, it is important for supervisors to understand how attitudes affect employees’ work
behaviour. To assist line managers in improving their ability to change counterproductive
attitudes, organisations, thus, need to conduct research so as to access valuable information
that could remain current on such topical issues as job satisfaction, motivation and employee
performance. By doing so, they could help to ensure their steady improvement.

102
CHAPTER THREE
OVERVIEW OF THE CITY OF WINDHOEK MUNICIPALITY
3.1 Introduction
The previous chapter provided the literature review that was conducted for the study. Chapter
Three, therefore, provides a brief overview of the municipal sector in the Republic of Namibia.
According to the Namibian Vision 2030 policy framework, the country could be prosperous,
industrialised and developed by its people, with it enjoying peace, harmony, and political
stability (National Planning Commission of Namibia, 2015:42). Vision 2030 further foresees
that the quality of life of all Namibians could improve both in the urban and the rural areas by
2030.
Such improvement is likely to lead to an increase in the demand for essential social services
and infrastructural facilities in both the urban and the rural areas. Thus, having an adequate
economic base in place could serve to strengthen the municipal administration that assists the
rural population with the diversification of its economy and with maintaining a healthy living
environment (Namibia Vision, 2004:49, cited in Katoma, 2009:41).
Most, if not all, of the strategic goals of municipalities are based on the national strategic goals,
as stated in the Namibia Vision 2030 policy framework for long-term national development
(National Planning Commission of Namibia, 2015). Therefore, the Namibian municipalities
could assume an important role in generating wealth and in improving the quality of life of its
residents, through the translation of the government’s socio-economic policies into a
productive social and economic infrastructure.
The current study is focused on the period after independence (since 1990) when Namibia
became a unitary democratic republic with a three-tier system of governance, consisting of the
central government, and the regional and local authorities (von Wietersheim, 2015:19-65).
Furthermore, the present chapter introduces PM as an essential element of local government
modernisation. Similarly, the chapter discusses the (perceived) research problem experienced,
and the shortcomings of the PA, as it is currently undertaken in the CoW Municipality.
The chapter further touches on the decision to change to a new system, the reasons therefor,
and, finally, the adopted PMS.

103
3.2 The municipal sector profile
The legal basis for the municipal sector in Namibia is enshrined in Chapter 12, Article 102
(111) of the Constitution of 1990 (Namibia, 1990:56-57).
Shortly after independence, the Local Authority Act No. 23 of 1992 (the Act) was signed into
law by the President of Namibia on 28 August 1992 in line with Article 102(1) of the Namibian
Constitution (Kuusi, 2009:6). The Act further provides for the establishment of the powers,
functions and other related matters of the municipalities concerned (Kuusi, 2009:9).
Primarily, the Act was promulgated to provide for the determination, for purposes of local
government, of local authority councils; the establishment of such local authority councils; and
to define the powers, duties and functions of local authority councils; and to provide for
incidental matters (Namibia, 1992:1-2).
Municipalities are responsible for the provision, operation, and maintenance of a wide range
of municipal infrastructures and services in line with their powers, as defined by the Act. The
municipality provides the following services, among others: water; sewerage and drainage;
cemeteries; street and public places; electricity and gas; serviced land; infrastructure; and
public transport and housing schemes (Namibia, 1992:61-84).
According to the enacted legislations, municipalities have governing bodies in the form of
municipal or town councils. The governing bodies are tasked to perform duties that are required
for the functioning of the areas under their jurisdiction, in conformity with the pertinent
legislation.
According to the ALAN (n.d.), there are 51 municipalities in Namibia, which are categorised as
follows:
part one municipalities consist of the three autonomous municipalities of Windhoek, Walvis Bay, and Swakopmund;
the ten part two municipalities, which have limited autonomy, fall under the control of the Ministry of Urban and Rural Development (MURD); and
part three municipalities consist of 25 town, and 13 village councils. The town and village councils are much more restricted in terms of their autonomy than are the part one and two municipalites. The part three municipalities are responsible for governing the affairs of the local authorities through the MURD.

104
Part one municipalities falling under part one have a solid financial basis and considerable
autonomy concerning the determination of property tax, and the obtaining of loans under the
provisions of the Act. They are mandated to source funds that they utilise for managing their
affairs and for generating income by way of providing services and amenities to their
ratepayers in their area of jurisdiction.
As part two municipalities are severely constrained in terms of their finances, they tend to fail
to ensure a smooth provision of services to their communities. The towns and villages
concerned are characterised by high levels of unemployment and poverty.
As most of the ratepayers are, as a result, unable to pay for municipal services, the
municipalities concerned, in most instances, have to rely on state finances for their capital and
operational expenditures (Kuusi, 2009:7). Part three municipalities, which have a fragile
financial basis, are subject to control measures exercised by the MURD.
Moreover, the Namibian government, through the MURD, assists by providing subsidies to
them to ensure that continuous development takes place, especially in newly proclaimed
villages and towns (Kuusi, 2009:7). A subsidy, in most instances, is agreed upon whenever
projects are in place from which the government can derive direct benefits.
3.3 Profile of the City of Windhoek
The CoW Municipality, which is the municipality of the capital city of Namibia, Windhoek, is
located in central Namibia, in the Khomas Highland plateau area, around 1 700 metres (5 600
ft) above sea level (Dewitz, 2009:7). At the time of the current study, the population was
estimated at between 350 000 and 400 000 (Haihambo, 2015).
The first democratically elected Council for the Municipality was sworn into office in 1992,
following the enactment of the enabling Act, Act 23 of 1992, as indicated above (Namibia,
1990:56-57). The powers and functions of the CoW Municipality are spelled out in the Act.
The Municipality consists of fifteen elected councillors, headed by the mayor and a
Management Committee (MC), consisting of five councillors, under the chairperson of the
committee. The Municipality, which employed about 2 180 staff members at the end of June
2015, has an annual budget of N$4.1 billion (Haihambo, 2015).

105
The strategic direction of the CoW Municipality below is based on the national strategic goals,
as stated in the National Vision 2030 policy framework for long-term national development
(refer to the vision in subsection 3.3.1 below).
3.3.1 CoW Municipality’s strategic intent
CoW Municipality’s strategic intent consists of its vision, mission statement and core values,
discussed below.
3.3.1.1 CoW Municipality’s vision
The vision of CoW Municipality is “to be a caring and smart city by 2022”. The focus of the City
is to ensure that it becomes known as:
a caring city, by means of focusing on becoming an institution that enables social progression in terms of; and
– public safety;
– the addressing of social crises;
– the strengthening of service orientation; and
a smart city, by means of focusing on ensuring that the institution governs itself effectively and that it embraces innovation in such a way as to:
– restore and retain financial sustainability;
– promote technological advancement, cleanliness, and innovation; and
– adhere to such criteria as ensuring best practice, creating vibrancy, promoting green environmental awareness, and assessing affordability when embarking on investment and expenditure considerations.
3.3.1.2 CoW Municipality’s mission statement and core values
The mission of the CoW Municipality was redefined in February 2017 as: “to enhance the
quality of life for all our people by rendering efficient and effective municipal services”. In
addressing what type of attitude and behaviour is necessary and conducive to helping achieve
its mission, the CoW Municipality defined certain “core values” during a values survey
conducted in August 2016.
3.3.1.3 Core values
Feedback from the values survey conducted in 2016, and subsequent staff submissions for an
internal values competition, yielded five core values as being key behavioural drivers in
achieving the CoW’s Municipality’s vision (see Table 3.1 below).

106
Table 3.1: Core values and descriptions
Adopted from the CoW (CoW, 2017:16)
Value Behavioural description
Teamwork Let’s do the right thing, right, together
Customer focus We render friendly, fair, simple, fast and effective service to all residents.
Communication We are transparent, and keep our staff and customers well-informed.
Fairness and equity We treat staff and residents the same, and with respect.
Integrity We are trustworthy, responsible and honest in all our dealings.
The CoW Municipality’s core values speak to the types of behaviour that Windhoek seeks
to display towards its customers and staff members. The values guide what types of
behaviour needed to be reflected by all employees so as to project the desired image to all
stakeholders (Vries, 2015). Windhoek’s leadership especially needs to ensure that the
values are constantly communicated with their staff, so as to embed the desired corporate
culture within the CoW Municipality (2017:15-16).
3.4 Management of staff
Given the task that the CoW Municipality faces concerning quality service provision to its
residents, its organisational performance needs to be of a certain standard at all times, let
alone having a performance management framework (PMF) in place. As with any other
municipality indicated in section 3.5 on page 107 below, the CoW Municipality depends on a
well-crafted PMF to manage the performance of its employees. A well-crafted and
implemented PMF has the potential to enhance the achievement of its vision, mission, and
goals, and, ultimately, to provide much-needed services to its residents.
The PMF, however, needs to be properly managed and to be implemented in full to ensure the
required performance. Excellent performance need to be identified and rewarded so as to
ensure that it is repeated, and so as to ensure further organisational sustainability.
According to Lombard (2016), the CoW Municipality had a PAS in place from early 1980 until
1998 to manage its performance. The final evaluation of the assessment was usually
conducted annually as a way of evaluating the performance of its staff members, and of
rewarding those who were found to perform exceptionally well.

107
The PAS referred to above adhered to a 10-point factor rating scale. According to Lombardt
(2016), the scale consisted of five factors:
quality and quantity of work;
reliability;
work relations; and
initiative.
The researcher concerned further asserts that each factor was defined, as well as was each
rating on the 10-point scale, progressing from 1 (low) to 10 (high). Furthermore, Lombard
(2016) states that, in 1998, the CoW Municipality underwent a transformation and restructuring
phase that did away with the PAS, without replacing it with another. The researcher concludes
that the PAS involved was merely an appraisal tool, and not the PMS that was in place at the
time of the study.
From 1990 to 1998 the appraisal system indicated above also served to provide opportunities
for staff members and supervisors to hold one-on-one discussions that were aimed at
identifying any performance gaps concerned, and at working out how to fill them.
The result of the appraisal system in question was the possibility of awarding merit increases
to the employees, which served to supplement any hikes in their annual salary and benefits.
As a result, the employees’ job satisfaction levels tended to remain high (Lombard, 2016).
From 1990 to 1998, the employees tended to serve the Municipality well, presumably as a
direct result of them wanting to earn merit increases. Moreover, it seems that, at the time, the
management also executed their roles concerning the appraisal process well, indicating that
their job satisfaction levels tended to be high at the time.
3.5 The PMS at CoW Municipality as an important element of local government
modernisation
The above-mentioned strategic direction was adopted to promote high levels of staff
performance that would ensure the supply of quality municipal services. Their priority was to
improve the performance of the CoW Municipality, and to ensure that the right services were
delivered to the right people at the right time. Other municipalities, worldwide, are also
responsible for the provision of a wide range of municipal infrastructures and services, in line
with their mandate as defined by the specific legislation that is in place.

108
Such municipalities as those of Beaufort West, Bridgend County Borough, and Charlotte, are
also facing similar challenges, and therefore have had to adopt the use of PM tools. The
challenges experienced tend to increase pressure on the municipalities concerned to provide
municipal services that conform to the expectations of the residents involved. They also aim to
identify the scope for improvement, to track any progress made, and to come to a heightened
understanding of the challenges involved.
The details of other municipalities, such as those referred to above, is given below to provide
a perspective on the suitable number of employees that are required to provide municipal
services to a population of a similar size to that of the CoW Municipality. In the light of the
above, the hope is to enhance the understanding that the implementation of a PMS could be
beneficial to an LA environment.
The Beaufort West Municipality, which is located in the Western Cape province of South Africa,
forms part of the Central Karoo District Municipality. According to the 2011 census, the
Municipality had a total population of 49 586. A total number of 529 employees were noted as
being in the service of the Municipality in 2008 (Beaufort West Municipality, 2008). Certain
positions were filled from time to time on a temporary basis, with a total number of 34
employees being temporary. Beaufort West adopted a PMS entailing the successful
application of performance measurement measures so as to be able to gain insight into, and
to make judgments about, the Municipality, and the effectiveness and efficiency of their
programmes, and so as to facilitate the analysis of performance data.
South African legislation of the time motivated the adoption of the PMS. The White Paper on
Local Government (1998) proposed the introduction of PMSs for local government, as a tool
for monitoring the progress of service delivery at the local administration level. Furthermore,
the Municipal Systems Act of 2000 (Act No. 32 of 2000) requires local governments to develop
a PMS (Beaufort West Municipality, 2008).
The Bridgend County Borough Council (BCBC) is located in the heart of South Wales, with it
being centred between two main cities, Cardiff to the east, and Swansea to the west. With an
area of about 25 500 hectares under its control, the BCBC managed a population of 139 178
in 2014 (BCBC, 2013). Approximately 7 500 council staff were employed at the time to deliver,
or to commission the delivery of, services within the ambit of the BCBC. The authority also
worked in partnership with other bodies to provide services.

109
In undergoing a massive programme of change, the BCBC set out priority areas for improving
the performance of the Council, so as to ensure that the right services were delivered to the
right people at the right time. Such service was to be achieved through the delivery of good
services to the local population, and by means of improved PM (BCBC, 2013). The BCBC
aimed to be a modern organisation with the reputation of providing the best service of any
fellow councils in Wales.
Charlotte is located in Southwestern North Carolina's Piedmont region in the USA. The city is
about 85 miles south-east of the Appalachian Mountains, and about 180 miles north-west of
the Atlantic Ocean. It is situated near the South Carolina state line, with an area of 242.87
square miles. Two elective entities govern Charlotte-Mecklenburg County: an 11-member city
council with an elected mayor, all of whom serve two-year terms; and a professional city
manager, who is appointed by the local city council. About 540 828 people live in Charlotte,
with approximately 695 454 living in Mecklenburg County.
Charlotte-Mecklenburg County implemented a balanced scorecard (BSC) methodology to
achieve healthy, fiscally prudent growth, while providing high-quality service at low cost to the
city's residents. The current population is estimated at 809 950 (United States Census Bureau,
2015). As seen above, it appears that local authorities worldwide are keen to build a system
that guides effectiveness and efficiency in their day-to-day operations into their management
practices.
3.6 (Perceived) research problem experienced
Shortly after the transformation and restructuring process took place in CoW Municipality
during 1998, as was referred to earlier, the existing practice of managing the performance of
employees was suspended, with a view and understanding to introduce an improved PMS.
However, after then, the Municipality had no other institutional mechanism in place to measure,
monitor and evaluate employee performance in line with their talent, skills, and abilities
(Lombard, 2016).
The result of the above absence was that merit increases were abolished, which negatively
affected the net income of the employees, and resulted in a lack of differentiation between
those who performed exceptionally well and those who did not. Moreover, the absence of a
policy framework for instituting a PMS for securing reliable and consistent job performance
caused a downward spiral resulting in poor service delivery to the CoW’s customers (Lombard,
2016).

110
The lack of ongoing PA led to significant performance problems that affected service delivery
negatively. According to Itula (2016) the CoW Municipality is still experiencing persistent poor
service delivery, specifically in the following areas, which can be blamed on the perceived low
levels of job performance by its employees, especially since 2008:
serviced land delivery;
accurate account billing;
the provision of water to some areas of the population;
the supply of sewerage and drainage to the rural areas;
gravedigging;
the provision of electricity;
public transport and housing schemes.
Management, as a key driver of the implementation of strategic initiatives in the respective
departments, clearly was not doing enough to improve the performance of the employees. The
reasons for management’s lack of performance monitoring might have been linked to their job
satisfaction levels. Improving the job satisfaction of the management teams concerned could
result in a high level of individual and organisational performance. The current study argues
that CoW management can overcome the problem of poor performance through the adoption
and implementation of a contemporary PMS.
3.7 Shortcomings of the performance appraisal in the CoW Municipality
Several views exist on the subject of PAs in general, and on why organisations apply them.
Some institutions conduct PAs because they feel obliged to do so, and because others are
also doing them. The purpose of a PA is to determine how effectively employees are achieving
their goals, growing within the scope of their job, and communicating with their colleagues and
supervisors. When PAs are correctly used, they can become an effective tool for gauging
employee performance.
Sullivan (2011) opines that a large number (90 percent) of PAs is poor. Furthermore, the
researcher suggests that successful organisations understand the importance of incorporating
PAs into their PMP and strategy. The notion is supported by Lotich (2014), who opines that a
PA can only be effective when it forms part of a well-designed PMS (as discussed in subsection
2.5.3.1 above), which was not the case with the CoW Municipality.
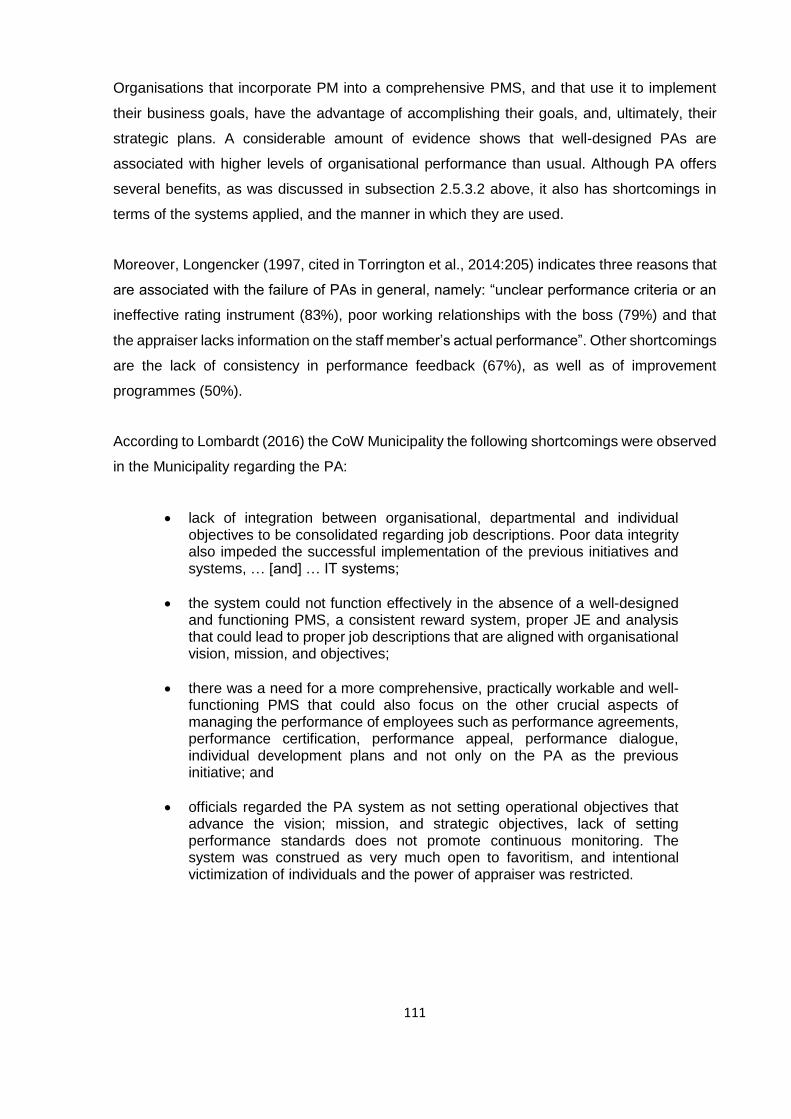
111
Organisations that incorporate PM into a comprehensive PMS, and that use it to implement
their business goals, have the advantage of accomplishing their goals, and, ultimately, their
strategic plans. A considerable amount of evidence shows that well-designed PAs are
associated with higher levels of organisational performance than usual. Although PA offers
several benefits, as was discussed in subsection 2.5.3.2 above, it also has shortcomings in
terms of the systems applied, and the manner in which they are used.
Moreover, Longencker (1997, cited in Torrington et al., 2014:205) indicates three reasons that
are associated with the failure of PAs in general, namely: “unclear performance criteria or an
ineffective rating instrument (83%), poor working relationships with the boss (79%) and that
the appraiser lacks information on the staff member’s actual performance”. Other shortcomings
are the lack of consistency in performance feedback (67%), as well as of improvement
programmes (50%).
According to Lombardt (2016) the CoW Municipality the following shortcomings were observed
in the Municipality regarding the PA:
lack of integration between organisational, departmental and individual objectives to be consolidated regarding job descriptions. Poor data integrity also impeded the successful implementation of the previous initiatives and systems, … [and] … IT systems;
the system could not function effectively in the absence of a well-designed and functioning PMS, a consistent reward system, proper JE and analysis that could lead to proper job descriptions that are aligned with organisational vision, mission, and objectives;
there was a need for a more comprehensive, practically workable and well-functioning PMS that could also focus on the other crucial aspects of managing the performance of employees such as performance agreements, performance certification, performance appeal, performance dialogue, individual development plans and not only on the PA as the previous initiative; and
officials regarded the PA system as not setting operational objectives that advance the vision; mission, and strategic objectives, lack of setting performance standards does not promote continuous monitoring. The system was construed as very much open to favoritism, and intentional victimization of individuals and the power of appraiser was restricted.

112
The above-mentioned problems can be solved by organisations that treat PM as an important
process for managing talent, and not just as an annual compensation exercise.
3.8 The decision to change to a new system
Given the shortcomings stated in section 3.7 above, and in the quest to solve the non-
performance of employees, and, ultimately, to address its record of poor service delivery, the
CoW Municipality had to act fast. According to Vries (2016), the CoW Council, at its meeting
on 27 July 2011, recognised the need for an overall guiding document that would lay out the
strategic intentions of the CoW Municipality for both the short, as well as the medium, term.
Acting on the directive mentioned above, the Department of Human Resources subsequently
designed and drafted the Integrated Business Plan (IBP) with input from various stakeholders.
The organisational planning started with the formulation of an overall strategic plan, which
cascaded downwards into a business plan, and, eventually, individual plans that were
regarded as performance agreements. The performance agreements required the
achievement of real targets and measurable results by those concerned.
Thus, performance was to be managed based on the attainment of specific goals and outputs.
Vries (2016), furthermore, indicates that the draft IBP was subsequently approved at the
Council meeting in July 2011. The meeting further resolved that all senior executives need to
enter into performance agreements, as they were the custodians of the IBP. Doing so would,
in turn, help to ensure a sense of personal accountability towards the exertion of effort and the
performance of tasks required to achieve the objectives of the Municipality related to improved
service delivery.
For the CoW Municipality to meet its goals, it requires a well-designed framework to be in place
for the implementation of a PMS. Within such a context, the Municipality initiated the
development of a PMS. According to Vries (2016), the need for the design and implementation
of a new PMS was first expressed at a workshop held in 2005. The participants at the workshop
deliberated on previous attempts to implement a PMS. In conclusion, Vries (2016) opines that
the purpose of the implementation of the PMS was to set a “clear direction, identify objectives
and measure achievements”.
Similarly, Lombard (2016) opines that, during the 1990s, organisations started to move actively
towards strategic planning, so as to be able to enhance organisational effectiveness.

113
All levels of planning, from the strategic plan to individual planning, require tangible and
measurable outputs. The success of any organisation (as well as any individual) is measured
against the achievement of output targets. Furthermore, PA mainly focuses on inputs, which
are difficult to measure objectively, and which do not accurately predict actual
performance/results.
To conclude, Lombard (2016) suggests that the advantage of moving towards an output-
oriented PMS is the fact that clear and measurable targets can be agreed upon. He further
states that the concept of the PMS has contributed substantially to the motivation of staff
members, compared to the setting of subjective input targets. The nature of performance
discussions, based on subjective outputs, frequently tends to lead to conflict, which is hard to
solve. In contrast, output performance reviews, based on tangible results, are inclined to be
less subjective, and an advantage for the appraiser, as well as for the appraised employee
(Lombard, 2016).
Thus, it is clear that the implementation of the PMS envisaged by the CoW Municipality was
set to create a new performance-orientated (result-oriented) culture in the Municipality.
The new performance culture was expected to be linked to the effective management of people
(in terms of strategy alignment and individual development) within the organisation.
In other words, all performance could be integrated from the highest level (that of the strategic
plan) down to the individual level (that of the performance agreement of the individual staff
member). The adoption of such an approach also leads to integrative HR management,
whereby all HR systems could be properly linked, in terms of a PMS. Moreover, further
strategies, including JE and remuneration policies, which are aimed at aiding the
implementation of the PMS were also developed.
The successful implementation of a PMS necessitates that all systems, processes, policies
and structures be aligned with the overall organisational direction. Equally, the Municipality
had to develop key policies to ensure that it formed strong pillars for the successful
implementation of the PMS. The CoW Municipality approved the Performance Management
System Principles and Framework (PMSPF), as well as the Job Evaluation Policy (JEP) and
the Remuneration Strategy and Policy (RSP), on 7 May 2008 (Vries, 2016). The above-
mentioned policies served as fundamental pillars for the PMS implementation.

114
3.8.1 The Performance Management System Principles and Framework (PMSPF)
The PMSPF was developed to guide the operations of the PMS within the CoW. The
document, outlining the details of the PM policy framework for the CoW Municipality,
established the logical sequence, as well as the contextual framework processes, that would
be followed in implementing the PM.
The result was a principles-guided service within the CoW. Thus, the framework describes
‘how’ the CoW’s cycle and processes of performance planning, monitoring, measurement,
review, reporting and improvement would be conducted, organised and managed, including
determining the roles of the different players involved. The PMF describes ‘what’ aspects or
dimensions of performance were to be measured. This Framework was treated as a reference,
and as a working document, to be used by the managers, supervisors, heads of divisions and
team leaders to ensure that the PMS was implemented effectively across the board within the
CoW Municipality (Vries, 2016).
The following aspects of PMS are discussed in the Framework: the importance of the PMS, as
well as its aims and objectives; the PM team; the personal and HR development plans; and
the performance measurement, verification, agreements, recognition and assessment
appeals.
The framework is supplemented by conducting relevant training programmes that provide the
necessary skills, and that facilitate the creation of organisational culture and attitudes for the
successful implementation of the PMS.
Thus, human and institutional capacity-building tends to focus on involvement in the process,
on ensuring buy-in, and on aligning and mobilising support for critical functions for its
successful implementation (Vries, 2016). Also, stakeholder buy-in and acceptance are critical
to the successful implementation of a PMS. As a complement to the implementation of the
major capacity-building strategy involved, it was essential that information about the PMS be
widely disseminated among all the employees of the CoW Municipality. Return on investment
on PMS could be recognised as possibly being of a long-term nature.
Finally, the implementation of the PMS process started with the strategic objectives involved,
which were aligned to the vision, mission, organisational objectives, departmental objectives
and balance scorecard of the CoW Municipality (Vries, 2016).

115
3.8.2 Job evaluation (JE) policy
The JE policy set out the CoW Municipality’s guiding principles for each component of the JE
undertaken. The basic objectives of the JE policy were to support the CoW Municipality’s IBP,
and to align the policies with the remuneration policies and processes relating to organisational
needs (Vries, 2016).
3.8.3 Remuneration strategy and policy (RSP)
The philosophy underpinning the IBP was that employees could be rewarded for the value they
create. As such, the RSP was to play a critical role in attracting and retaining high-performing
individuals, and, thereby, support the Municipality’s commitment to ensuring its
competitiveness in the skills market. The RSP was to reinforce, encourage and promote the
superior performance and the achievement of the organisation’s strategic goals.
As was indicated in the policy, remuneration will not be a stand-alone management process,
but it will be fully integrated into the other management processes. It will be undertaken
consistent with the economic requirements of the CoW Municipality, and commensurate with
the same requirements of the stakeholders.
It is, thus, clear that the manner in which the CoW Municipality remunerates its employees will
reflect the dynamics of the market and the context in which it operates. The CoW Municipality
will be, at all times, aligned with the strategic directions involved, and its specific value drivers,
while simultaneously acknowledging its focus on PM which, in turn, could boost its superior
performance (Haihambo, 2016).
3.9 The adopted performance management system (PMS)
As the name indicates, PA focuses mainly on the assessment of individual performance that
often occurs annually (Torrington et al., 2014:195). Conversely, PM tends to focus on the
process of managing the performance of staff members (Torrington et al., 2014). PM, thus,
entails much more than merely appraising PA systems. As a stand-alone system, it suffers
from the disadvantage that an individual’s performance is not properly integrated within the
bigger network of goals, as reflected by the divisional, departmental and organisational
goals/planning.
The adoption of a PMS by organisations enhances their competitive edge in the delivery of
service to their clients (Bratton & Gold, 2007:274). The success of implementing such a system
rests mainly with the management and the employees, among other aspects.

116
During the 2005/2006 financial year, the implementation of the PMS was approved, with it
similarly being followed by the approval of a new five-year IBP for the CoW Municipality. The
adopted PMS for the CoW Municipality in 2007 utilises a balanced scorecard framework (BSF),
as is depicted in Figure 3.1 below.
The implementation of the PMS that was adopted by the CoW Municipality consists of two
parts, the pre-implementation phase, and the actual implementation phase, as stated below:
the pre-implementation phase deals with the communication process regarding the vision, the strategic objectives of the BSC, the departmental goals, and the alignments of the job descriptions of the planned PMS.
the actual implementation phase involves entering into performance agreements, individual development plans, performance reviews, PA, and recognition (reward).
The BSF (Figure 3.1) below is structured to focus on the stakeholders and the customers
concerned, as well as on the learning and growth, the resources, and the internal business
processes of the organisation.
Figure 3.1: The balanced scorecard of the CoW Municipality
(Adopted from the CoW Municipality, 2011:21)
The purpose of adopting the BSF is to create a system of linked strategic thrusts, strategic
objectives, measures, targets and initiatives that collectively describe the strategy of the
organisation and how such an approach can be achieved (Vries, 2016).
INTERNAL BUSINESS PROCESS
STRATEGY
CUSTOMER & STAKEHOLDER
VISION
LEARNING &
GROWTH
RESOURCES

117
According to its quest to implement the PMS, in 2011, the CoW Municipality adopted and
piloted its five-year IBP successfully, in two departments (Information, communication and
Technology and Finance).
The piloting of the IBP was followed by the development of the communication strategy that
was officially launched during 2013 (Vries, 2016). The process was, however, not completed
as, by June 2017, it was evident that there was still no fully functional PMS in place.
3.10 The way forward for the CoW Municipality since June 2017
In its quest to revive its effort to implement the PMS, the CoW Municipality adopted a new
transformational strategic plan (TSP), which has been grafted onto the existing system since
September 2016. According to the Chief Executive (CEO) (2017) cited in the CoW Municipality
(2017:8), the adoption of the TSP “took into account past performance and anticipated
demands for improved service delivery form an increasingly knowledgeable and sophisticated
customer base”.
The CEO (2017, cited in the CoW Municipality, 2017:9-10) asserts that the new impetus is a
base for a “sound turn-around strategy with clear governance and financial rescue and
strategic funding plans”.
He, furthermore, promised that the residents could expect a new and exciting drive to be
implemented, with the aim of restoring the “name and the image” of the CoW Municipality, by
facilitating the taking of tough decisions in the upcoming financial year, 2017/2018. In
conclusion, the CEO declared that the CoW Municipality would “achieve its goal of becoming
a Smart and Caring City by 2022”.
3.11 Summary
In Chapter Three, the legislative foundations (the Constitution of Namibia, the Local Authority
Act, and the National Vision 2030), within which the CoW Municipality was founded, were
briefly discussed. This was followed by a brief discussion of the Municipal sector in Namibia,
and of how it links up with the National Vision 2030, as it was adopted in 2004. Additionally,
the various municipalities and their specific roles were also covered, in the light of their legal
powers and functions. Furthermore, the funding of the local government was also briefly
discussed, specifically in relation to its role in ensuring that the local government is in a position
to deliver services effectively and efficiently. The chapter further provided an overview of the
CoW Municipality, in the light of its adopted vision and mission.

118
The perceived origin of the problem at the CoW Municipality that gave rise to the current study,
and the notable absence of a culture of performance, were also discussed. It was noted that,
despite one of its values being given as being a “winning team”, postulating that there was,
indeed, a performance culture in place, with the ultimate aim of the CoW Municipality being to
excel in everything that it does (in terms of quality service delivery).
The chapter also discussed how performance in the CoW Municipality was being managed.
Clearly, a lack of a PMS contributes to the existing problem, as was stated above. The result
was the adoption of a PMS by the CoW Municipality, which, at the time of the present study
(in 2016) was in the process of implementation that had first started in 2007. Why it was taking
so long to implement and apply the PMS was not clear at that stage, however. The overall
purpose of the current study was to assess the job satisfaction levels of managerial,
supervisory and non-managerial employees in the D band (according to the Paterson grading
system) in a municipality in Namibia, using empirical outcomes at a time when the Municipality
concerned was busy implementing a PMS.

119
CHAPTER FOUR
RESEARCH METHODOLOGY
4.1 Introduction
Chapter Three presented a brief overview of the LA sector in the Republic of Namibia and of
the CoW Municipality under research. Chapter Four explains why the particular methodology
and methods concerned were chosen. Determining the relevant research methodology and
methods is an important aspect of any research, with the two concepts being used
interchangeably by various researchers. Noting the distinction between the research method
and the methodology used was, thus, important to the development of the current study (Henn
et al., 2006:9).
A research methodology refers to the systematic theoretical scrutiny of the theory and
assumptions on which a study is based (Saunders & Rojon, 2014:3). Moreover, Saunders et
al. (2012:674) refer to a research methodology as the methods of undertaken research that
include the … logical norms based on the research and the consequences of such methods.
Dahlberg and McCaig (2010:22) argue that the term ‘methodology’ “includes the underlying
assumptions of methods”.
In contrast, however, Henn et al. (2006:9) argue that methodology is concerned with the
research strategy in its entirety. In essence, a research methodology is how research is
conducted scientifically, and the research methods concern the techniques for conducting the
research. According to the University of Southern California (n.d.), research methods are
"generalised and established ways of approaching research questions (e.g., qualitative vs.
quantitative methods)”.
Clearly, all methods cannot be applied to all research questions; hence the choice of the
method used in the current study was limited by the area of research conducted. The term
‘research methods’ refers to the methods or techniques utilised in a study, such as the methods
used to collect data, the establishing of relationships between the data and the unknowns, and
the evaluation of the accuracy of the results obtained (Saunders et al., 2012:674). The above
assertion is supported by Dahlberg and McCaig (2010:22), who refer to methods “as a set of
tools used to examine a phenomenon”. Furthermore, Henn et al. (2006:9) state that methods
are the range of techniques that are available to collect the required data.

120
A good research is known to be based on well-thought-out methodologies and methods, it was,
thus, important for the study to adopt the required steps, and to be able to justify the rationale
behind the steps.
The purpose of this chapter, therefore, is to describe the methodology and methods that were
associated with the various phases of the research, being the research tools to collect the data,
to analyse the findings, and to draw the required conclusions (Henn et al., 2006:46). The ethical
issues arising from the process are also discussed.
4.2 Research objectives
4.2.1 Main objective
The current research study was motivated by the growing concern about the lack of service
delivery as a result of the perceived poor performance, and its perceived influence on the levels
of job satisfaction among the line managers and non-managerial employees in the D-Band
level (i.e. the line managers) of the employees in the CoW Municipality. According to the BGSU
(2009:3) “job satisfaction is defined as the feelings workers have about their job”.
The primary objective of the present study was to conduct a survey of the job satisfaction levels
of the line managers involved during the implementation of the performance management
system (PMS) in the CoW Municipality.
4.2.2 Sub-objectives
The specific objectives of the study were to measure the six facets (the work itself, the
relationships with co-workers, and the opportunity for promotion as factors for motivation,
pay and supervision as hygiene factors, and the levels of overall job satisfaction.
The sub-objectives were, therefore, the following:
to measure the levels of job satisfaction of the line managers in the CoW Municipality, based on selected job satisfaction facets;
to determine the factors influencing the line managers’ levels of job satisfaction, based on selected facets (i.e. the facets of hygiene and motivator items listed above); and
to offer suitable recommendations for improving, or enhancing, the job satisfaction levels of the line managers in the CoW.
121
4.2.3 Research questions
The questions in this study were the following:
is there any difference between the job satisfaction levels of the male and female line managers?;
is there any difference between the job satisfaction levels and the age of the line managers?;
what are the factors that affect the job satisfaction and dissatisfaction levels with regard to; o those who impact on the line managers’ present job; o the line managers working in the same workplace; o the pay; o the opportunities for promotion; and o the supervision?
what are the factors affecting the global job satisfaction levels of the line managers?; and
do the hygiene and motivating factors have an impact on the poor job performance of the line managers in the CoW Municipality?
4.3 Research process
Saunders et al. (2012:160) introduced the concept of a ‘research onion’ that could be applied
to collect the data required to provide the answers to the questions in the study. The authors
state further that the central idea of doing research, and of solving a problem, lies at the centre
of the whole research process, which they compare to an onion that has several layers that
can be peeled off.
A brief description of the research process onion, as described by Saunders (2012:128),
follows in Figure 4.1 on page 121. According to Saunders et al. (2012:160), the research
process, which has a similar form or makeup as an onion, has the following layers, covering
six sub-topics, namely: the research philosophy; the research approach; the methodological
choice; the research strategy; the time horizons; and the techniques and procedures
(Saunders et al., 2012:160).

122
Each layer of the research onion is discussed in the study to explain why each element was
selected, and how this assisted in answering the research questions given in subsection 4.2.3
above.
Figure 4.1: Research Onion
(Adopted from Saunders, 2011 cited in Saunders et al., 2012:160)
4.3.1 Research philosophy and approach
The ‘research onion’ model initially encouraged researchers to determine an appropriate
research philosophy. The outer layer of Saunders et al.’s (2012:160) research onion refers to
the research philosophy involved. The research philosophy selected depends on the research
questions chosen for the study, which act as guidelines for the researchers concerned
(Saunders et al., 2012:129).
The research philosophy promotes consideration of how knowledge is to be developed to
respond to the research questions involved, as given in section 4.2. The adopted philosophy
could be seen as a “multidimensional set of continua rather than separate positions” (Niglas,
2010, cited in Saunders et al., 2012:129 & Saunders et al., 2012:130).

123
Adopting a particular philosophy can be considered as essential to the researcher's
assumptions about the way in which they experience the world, which, in turn, underpins the
research strategy and the methods selected (Saunders et al., 2012:128).
Subsequently, other methodological elements and approaches were considered, in keeping
with the coherence of the research. Coherence is achieved when the selected research
methods fit together with an internal logic of their own (Blanche et al., 2010:38).
As was stated in section 4.3 above, the knowledge and its growth, are contained by the
research philosophy involved, including the assumptions that are made about the relevant
techniques from the perspective of the researcher. How the researcher thinks about the
development of knowledge influences their philosophical stance.
The various views and opinions that are linked to the research philosophy are: positivism,
interpretivism, realism, and pragmatism (Saunders et al., 2012:129-137). The differences
between the four philosophical views are indicated below.
4.3.1.1 Positivism
In broad view, the positivist adopts a similar view to how the research is to be conducted in
terms of the social sciences, meaning that the research could be done similarly to how the
methods are carried out in the natural sciences, which is called taking a positivist, or scientific,
approach (Henn et al., 2006:11). Such a view of positivism maintains that the objects of social
sciences, namely people, are suitable for the implementation of scientific methods.
According to Henn et al. (2006:11), "the purpose of social research is to establish the scientific
laws of society … which is arrived at by testing research hypotheses". By testing is meant the
creation of the awareness associated with such reasons that result in negative actions (Henn
et al., 2006:28).
In taking a positivist stance, the researcher involved adopts the philosophical stance of the
natural scientist (Robson, 2009:19), who collects data in an apparently value-free manner
regarding the truth as they see it. In order to generalise the research data Scientists hope to
find "consistencies and underlying associations in the data. From a theoretical perspective,
positivism is based on the concept of neutrality and objectivity, entailing a researcher’s
remaining separate from, and not affected by, the research field involved.

124
Furthermore, the positivist researcher maintains that it is possible to adopt a distant, detached,
neutral, and non-interactive position. Positivism, which involves the objective analysis of
events, employs such structured quantitative methods as surveys, and JDI and JIG
questionnaires, together with the statistical analysis of data to ensure reliability and
generalisability (Henn et al., 2006:27).
4.3.1.2 Realism
Realism is quite similar to the positivist approach, in that it holds that reality is based on what
people experience with their senses, and also that human beings are too complex to be studied
like objects, such as with the natural sciences. Another feature of realism is that the reality is
independent of the human mind (Henn et al., 2006:14).
4.3.1.3 Interpretivism
Researchers who hold the view of interpretivism believe that the social world is so complex
that the study of individuals requires an in-depth understanding of how they experience certain
phenomena, and why they react in the way that they do to what happens around them. The
philosophy links to the qualitative research approach (Henn et al., 2006:14).
4.3.1.4 Pragmatism
The term ‘pragmatism’, which was coined by American philosophers in the twentieth century
(Emporia State University, 2016), comes from the Greek word pragma, meaning ‘action’, or
‘affair’ (Thayer & Rosenthal, n.d.). Reliable and relevant data to be collected that advance the
research is most welcomed and supported by Pragmatists (Kelemen & Rumens, 2008, cited
in Saunders et al., 2012:130).
The philosophy of pragmatism is an approach, or a mixture of methods, that work best in a
real-world situation. Kelemen and Rumens (2008, cited in Saunders et al., 2012:130) are of
the opinion that pragmatism when translated in concrete outcomes are relevant.
This means that the “ideology or proposition is true if it works satisfactorily, that the meaning
of a proposition is to be found in the practical consequences of accepting it [pragmatist idea],
and that unpractical ideas are to be rejected” (Internet Encyclopedia of Philosophy (IEP), n.d).
Pragmatism is, thus, used when it seems unrealistic to select any position that excludes the
real-world actualities concerned (Saunders et al., 2012:130).

125
4.3.1.5 Justification of the research philosophy
A positivist philosophical position was selected for the study to ensure the success and the
effectiveness of the research process in terms of justifying the hypothesis. The philosophical
position in question entails the testing and evaluation of the hypothesis derived through the
evaluation of observable social realities. Adopting a position such as the above would enable
the researcher to assume the role of an objective analyst, able to make detached
interpretations about the data concerned (Saunders et al., 2012:134).
The other philosophies were considered, but they were not found suitable for the research.
The estimation of the perception of managers resulted in the adoption of the approach as an
objective of the research.
4.3.2 Research approaches
The second layer of the ‘research onion’ model refers to the research approach.
The three alternative approaches to research are the deductive, the inductive, and the
abductive approaches (Saunders et al., 2012:143-148), which are described in the following
subsections.
4.3.2.1 The deductive approach
The deductive approach, which is mainly preferable in the natural sciences, is a ‘top-down
approach’, moving from the theory to the data (Dahlberg & McCaig, 2010:20). The approach
starts with the observation of the researcher, who then introduces the probable theory of how
the problem might have arisen. Henn et al. (2006:49) use the term ‘deduction’ to refer to where
a researcher starts from the standpoint of a particular theory to explain a specific phenomenon.
From the theory, the researcher formulates a hypothesis that requires confirming or refuting,
by way of research (Dahlberg & McCaig, 2010:20). Similarly, Saunders et al. (2012:669) agree
that the deductive approach is associated with evaluating the theoretical proposition using a
strategy specifically designed for the purpose of its testing.
The outcome of the adoption of such an approach leads to the further development of a new
theory, which may be tested by further studies.

126
The six sequential steps through which a deductive research approach moves (Blaiki, 2010,
cited in Saunders et al., 2012:144) are:
step one is to put forward a tentative idea, a premise, a hypothesis, or a set of hypotheses to form a theory.
step two is to use the existing literature, or by specifying the conditions under which the theory is expected to hold, deduce a testable proposition or number of propositions.
step three is to examine the premises and the logic of the case that produced them, comparing this argument with existing theories to see whether it offers an advance in understanding. If it does, then continue.
step four test the above-mentioned premises by collecting the appropriate data to measure the concepts or variables involved, and then analysing them.
step five, if the results of the analysis are inconsistent with the assumptions made (i.e. if the test fails) consider the theory false, and either reject, or modify, it. Restart the entire process.
step six, if the results of the analysis are consistent with the premises made, regard the theory as corroborated.
According to Saunders et al. (2012:162), quantitative research is used together with the
adoption of the deductive approach to test the theory concerned. Therefore, the approach is
suitable for use in quantitative studies, as it is the kind of method that allows for the application
of theories in the real world, because the validity of the assumptions involved needs to be
tested and considered through the appropriate research.
4.3.2.2 The inductive approach
As can be seen to be contrary to the deductive approach, Henn et al. (2006:50) refer to the
inductive approach as moving from observing a particular occurrence to end up with a theory.
By comparison with the deductive approach, an inductive approach is mainly preferable in the
natural sciences.
According to Saunders et al. (2012:672), an inductive approach is an approach used to
development a philosophy after the observation of empirical data. The above-mentioned
definition is supported by Dahlberg and McCaig (2010:20), who state that the approach moves
from the data to the theory.
The inductive approach starts with the collection of data (e.g. through the interviewing of
subjects) by the researcher, who then makes sense of the data collected by means of analysis.
The result of the analysis is the formulation of a theory (Dahlberg & McCaig, 2010:20).

127
From the theory, the researcher formulates the hypotheses that require confirming and/or
refuting through the research that is undertaken leading to the further development of a theory
that can be tested by further study.
The validity of inductive research comes from the analysis that is achieved by means of
eliminating predictions and considering hypotheses. The process starts with the collection of
data by means of interviewing the subjects, with sense being made of the data collected by
means of the process of analysis. Henn et al. (2006:50) opine that inductive research includes
the conducting of “experiments, group projects, and individual projects”. As inductive
approaches are mainly used in qualitative research, the approach is suitable for qualitative
studies.
4.3.2.3 The abductive approach
According to Suddaby (2006, cited in Saunders et al., 2012:144), an abductive approach does
not move in one direction from the theory to the data, or from the data to the theory. Instead,
it moves back and forth between theory and data, in a combination of deduction and induction
(containing elements of the deductive and inductive approaches).
Table 4.1: The contrast between the deductive and abductive approaches
(Adopted from Saunders et al., 2012:144)
Deduction Induction Abduction
Logic In a deductive inference, when the premises are true, the conclusion must also be true
In an inductive inference, known premises are used to generate untested conclusions
In an abductive inference, known premises are used to generate testable conclusions
Generalisability Generalising from the general to the specific
Generalising from the specific to the general
Generalising from the interactions between the specific and the general
Use of data Data collection is used to evaluate the propositions of hypotheses related to an existing theory
Data collection is used to explore a phenomenon, to identify themes and patterns, and to create a conceptual framework
Data collections are used to explore a phenomenon, to identify themes and patterns, to locate such in a conceptual framework, and to test the above through subsequent data collection
Theory Theory falsification or verification
Theory generation and building
Theory generation or modification, incorporating existing theory where appropriate, so as to build a new theory, or to modify an existing theory
128
The abductive approach uses data to discover an occurrence, to look at themes, and to clarify
the patterns found, so as to create, or to modify, an existing theory by means of additional data
collection (Saunders et al., 2012:150). Hence, the approach is a mixture of a qualitative and a
quantitative study. The comparison between deductive, inductive and abductive approaches
is tabulated in Table 4.1 on page 127).
4.3.2.4 Justification of the research approach
The current study followed a deductive (quantitative) approach, with the hypotheses being
tested to form the basis of the findings of the study, using a JDI and JIG questionnaire.
Employing the deductive approach enhanced the generalisability of the research (Saunders et
al., 2012:145).
Dahlberg and McCaig (2010:21) in support of the above, state that a deductive approach is
used in quantitative research, whereas inductive research is typically applied in qualitative
research. As was stated earlier, in terms of the deductive research approach, the researcher
develops a hypothesis, which is tested and examined to establish a [further] theory. In contrast,
an inductive research approach involves collecting data and developing a theory as a result of
the data analysis involved (Dahlberg, et al. 2010:20; Saunders et al., 2012:145).
4.4 Research design
For the current study to attain its objectives, as was discussed in section 4.2 above, a research
design is required. Saunders et al. (2012:159) refer to a research design as the plan, structure
and strategy followed to investigate what information to be obtained from the research
participants to answer specific research questions, to answer a research problem, or to test a
hypothesis. The plan illustrates the steps that the researcher has to follow to provide answers
to the set research questions.
The research design is a roadmap for a study, by means of which to maintain a feasible and
appropriate path (Jensen & Laurie, 2016:4). In the view of Jensen and Laurie (2016:4), a
research design “is the plan … to identify the methods and procedures … use[d] throughout
… the research project”. Research design is a plan that gives birth to the actual research Henn
et al. (2006:46)”. Moreover, Blanche et al. (2010:34) refer to a research design as framework
of strategic nature that acts as a facilitator between the research questions and the
implementation of the research. The definition is supported by Dahlberg and McCaig
(2010:30), who opine that a research design is an all-encompassing approach for finding
meaningful solutions to challenges.

129
Blanche et al. (2010:37) stress that the following four dimensions are required during the
formation of a research design: the purpose of the research; the theoretical paradigm informing
the research; the context, or situation, within which the research is carried out; and the
research techniques employed to collect and analyse the data. Figure 4.2 below illustrates the
dimensions of decision-making in research.
Purpose Paradigm
Research design
Context Techniques
Figure 4.2: The dimensions of decision-making in research design
(Adopted from Blanche et al., 2010:37)
As was indicated in subsection 4.3.1, a good research design could gain coherence by linking
together the four dimensions shown in Figure 4.2 above. Furthermore, Saunders et al.
(2012:159) opine that a research design contains specific objectives from research
question(s).
Punch (2009:113), in support of Saunders et al.’s (2012:159) statement, suggests that a
research design deals with the following main questions in terms of the conducting of research:
which strategy is to be followed during the research?;
according to which time frame will the research be conducted?;
from where, and from whom, will the data be collected?; and
how will the data be analysed and interpreted?
The research design acts as the architectural blueprint of the study, connecting the data
collection and the analysis of the research question to the rest of the study (Bickman & Rog,
2009:13).The questions that need to be answered could be able to be validated, objective,
precise and cost effective (Kumar, 2012:99), this will give it its reliability, helpfulness and
viability (Bickman & Rog, 2009:13).
The research design of the current thesis was influenced and constructed using the research
process ‘onion’ shown in Figure 4.1 on page 128. The significance of making the right choices
was to accomplish coherence throughout the research. The research design of the study is
discussed below.
130
4.4.1 Methodological choice (approaches)
Research designs are divided into quantitative and qualitative methodological approaches,
with the present section of the current thesis focusing briefly on the differences between the
two approaches. An overview of the differences is given in Table 4.2 on page 131.
According to Flick (2009:26), a researcher may make use of the two approaches in the same
study, which is then known as the hybrid, or mixed, approach.
The two approaches are briefly outlined in subsections 4.4.1.1 and 4.4.1.2 below.
4.4.1.1 Quantitative research
Quantitative research is about numerical data, with it depending on counting and statistical
analysis, which includes such surveys as postal JDI and JIG questionnaires, and online and
structured interviews (Blanche et al., 2010:47; Dahlberg & McCaig, 2010:22; Jensen & Laurie,
2016:12). Moreover, quantitative research emphasises quantification in the collection and
analysis of data from a sample (Singh, 2007:123).
It is evident that researchers make use of “experiments, surveys and predetermined
instruments in investigating their hypotheses” (Naanda, 2010:79). According to Gronhaug and
Ghauri (2005, cited in Mbundu, 2011:40), is used when there is a large number of respondents
in order to make accurate comparisons amongst the populations.
Quantitative designs are specific, rightly structured, clearly defined and easily recognised, as
well as passing the test for reliability and validity (Kumar, 2012:103). Such designs, therefore,
consist of systematic records comprised of figures constructed by researchers utilising the
process of measurement and the imposed structure. Because the designs measure variables,
they look for incidences of behaviour or condition, measuring the statistical association
between them (Saunders et al., 2012:144).
4.4.1.2 Qualitative research
In the words of Jensen and Laurie (2016:12) and Dahlberg and McCaig (2010:22), qualitative
research refers to non-numerical data.. According to Saunders et al. (2012:678) qualitative
data is unmeasured non-numerical data. Such research further consists of systematic records
that include words, phrases or images that create an in-depth understanding of the variables
concerned. It also identifies in-depth responses, categories, and themes (Blanche et al.,
2010:47; Saunders et al., 2012:161).

131
Bryman and Bell (2007:578) opine that the main difficulties associated with qualitative research
are that “ït very rapidly generates a large, cumbersome database because of its reliance on
prose in the form of such media as field notes, interview transcripts, or documents”.
The researchers state further that such research is undertaken by means of collecting data by
way of observation and interviewing. The data collected are analysed inductively by means of
categorising and organising them into patterns that produce a descriptive and narrative
synthesis.
According to Hennink et al. (2011:33), it is hard to define qualitative data. The researchers
opine that qualitative research is collective name including a range of methods and believes.
(See below, in Table 4.2, on page 132 the differences between quantitative and qualitative
research designs). The characteristics of qualitative research are that it is naturalistic, with it
studying objects in a natural setting, and having the following features:
the researcher’s role is to gain a holistic view of the context of the study;
the researchers attempt to capture the required data, on the perceptions of the local actors, from the inside;
by means of reading the relevant material, researchers might be able to isolate certain themes and expressions that can be reviewed with the informants, while maintaining the material in its original format;
the main task is to explicate the ways in which people in a particular setting behave in a particular manner;
the material can be interpreted in different ways;
standardised instruments are used least in the method, because the researcher is considered to be the main instrument in the study; and
data are analysed through words.

132
Table 4.2: Quantitative versus qualitative research designs
(Adopted from Dahlberg & McCaig, 2010:22)
Techniques Qualitative research Quantitative research
Kind of descriptions General and detailed description, difference in kind
Numerical descriptions, quantification, difference in number/degree
Cases Few cases
Many cases
Examples of methods/Ontology/
Focus groups, in-depth interviews, diaries, observations/ ethnography, content analysis
JDI and JIG questionnaire surveys, observations, content analysis
Perception of reality
No reality existing outside perceptions
Reality independent of perceptions
Generalisation to population at large
Knowledge is subjective; bias cannot be avoided
Aim to collect objective data possible (if sampling accurate)
Understanding and explanation
Understanding of meaning (e.g. of behaviour)
Description and explanation (e.g. of behaviour)
Theory development
Inductive approach
Deductive approach
4.4.1.3 Justification of the research design of the current study
The method of survey research, involving the use of a JDI and JIG questionnaire, was adopted
to assess the job satisfaction levels of the line managers in the CoW Municipality. Survey
research is especially appropriate for making exploratory and descriptive studies of large
populations (Saunders et al., 2012:177), hence its appropriateness for use in the current study.
According to the findings made, and a comparison between quantitative and qualitative
research, the quantitative research was clearly found to be the most suitable method for
reaching the research objectives of the study.
The following reasons for the choice were advanced:
firstly, it is associated with the adoption of a deductive approach that is appropriate for the research;
secondly, the study made use of data to test the theory; and
finally, the study was about the relationship between two variables which would be measured numerically and analysed using various statistical techniques.

133
4.4.2 Nature of the research design
Research can follow an exploratory, a descriptive, or an explanatory research design (Blanche
et al., 2010:44; Saunders et al., 2012:170). Below is a brief discussion of each type of research
design possible.
4.4.2.1 Exploratory research
The objective of exploratory research is to gather preliminary information, so as to define and
to gain a clear understanding of the problem (Blanche et al., 2010:44). Moreover, exploratory
research involves the gathering of relevant facts and opinions, by means of interviewing
experts in the particular discipline and conducting in-depth individual and focus group
interviews. Thus, an exploratory research design is relatively flexible and versatile (Saunders
et al., 2012:171).
4.4.2.2 Descriptive research
The overall goal of the descriptive research design is to gain an accurate and precise picture
of the topic under study (Blanche et al., 2010:44). In contrast, Bickman and Rog (2009:15)
refer to the purpose of descriptive research as being “to provide a picture of a phenomenon as
it naturally occurs, as opposed to studying the effects of the phenomenon or intervention”.
When using a descriptive research design, the primary purpose is to describe situations and
events as they happen. Such a design explains how things are, or how things have changed
over time, and it can be the continuation of exploratory research (Saunders et al., 2012:171).
Typically, the researcher already has a general understanding of the topic before he/she starts
to collect the required data.
4.4.2.3 Explanatory research
Explanatory research is conducted to explain why events are the way they are, with it,
therefore, looking for the causes and reasons for problems (Blanche et al., 2010:44).
Thus, in such research, pre-existing theories are often used to develop the preliminary ideas
of a possible solution to a question, with further data being collected to verify, or to modify, the
description. Such research typically requires the examination of a large number of cases, and,
therefore, the required data are collected using quantitative methods like surveys, prior to
analysis (Saunders et al., 2012:172).

134
4.5 Research strategy
Research strategies are manifold, as they give orientation to a study, while relying on an
established structure for the research design (Jensen & Laurie, 2016:15). In general, a strategy
is a plan with objectives (Saunders et al., 2012:172). Similarly, the authors concerned refer to
a research strategy as being a plan of how a study will answer the research questions asked.
It is, therefore, the tool that a scientist employs to address the research hypothesis involved.
To test the hypothesis, the researcher requires a plan of how to go about doing so. In the
current study, a research survey was used to capture the required data by addressing
questions to the appropriate respondents in a formal manner and by applying a regular record
of their responses through coding (Saunders et al., 2012:173).
4.5.1 Justification of the research design used in the current study
Survey research, involving a JDI and JIG questionnaire, was adopted to assess the job
satisfaction of the line managers in the CoW Municipality. Survey research is especially
appropriate for making exploratory and descriptive studies of large populations (Saunders et
al., 2012:177), hence its appropriateness for the current study. According to the findings and
a comparison between quantitative and qualitative research, it is clear that the quantitative
research was found to be the most suitable method for reaching the research objectives of the
current study.
The following reasons for the choice were advanced:
firstly, quantitative research was associated with the deductive approach which was considered to be appropriate for the research;
secondly, the study made use of data to test the theory; and
finally, the study concerned the relationship between two variables that would be measured numerically, and analysed using various statistical techniques.
4.6 Time horizons
An important factor that was considered was the time constraint that was available for
undertaking the research. Saunders et al. (2012:190-191) and Bryman and Bell (2007:190-
191) distinguish between two opposing time horizons, being those of longitudinal analysis and
cross-sectional research.
135
4.6.1 Longitudinal analysis
Longitudinal analysis has been carried out on a relatively small sample on more than one
occasion, and over some years, while requiring many more resource commitments than it has
tended to have in the past (Jensen & Laurie, 2016:15). The two researchers further caution
that the method is vulnerable to change, such as that of participants dropping out because
they move, lose interest, change their contact details, become unreachable, or die.
4.6.2 Cross-sectional research
Cross-sectional research is conducted on a fairly large sample at a single point in time, so as
to assess the research topic at that given point in time, at a relatively low cost (Jensen & Laurie,
2016:15). Kumar (2012:147) is of the view that cross-sectional research is “a one-shot or status
studies, and [it] is the most commonly used design in the social sciences”.
Kumar (2012:147) argues further that cross-sectional research is straightforward, since the
researcher decides on the objectives of the study, chooses the sampling frame and sample,
and collects the data from the respondents. Given the time constraints for the study, the cross-
sectional research was selected to provide a ‘snapshot' of the current levels of the employees'
understanding and of their awareness of their own levels of job satisfaction, during the
implementation of the PMS.
4.7 Research techniques and procedures
All studies need to have an explicit plan in mind including the techniques (in relation to the
sampling, the data collection, and the analysis) used for selecting the participants needed for
the study (Blanche et al., 2010:48).
4.7.1 Research population
A research population represents a group about which the study design used is intended to
generate knowledge (Jensen & Laurie, 2016:88).
A population is a group of elements from which a researcher draws samples, and in terms of
which any findings made can be generalised (Saunders et al., 2012:190-285). Henn et al.
(2006:129) define a research population as all the members participating in the study.
It is imperative to have decided on the population before selecting the respondents concerned,
so as to avoid empirically shallow research.

136
A population represents the entire group of people, and, if the group is small, then it becomes
possible to study the individual members of the population (Kumar, 2012:193; Jensen & Laurie,
2016:88). The target population for the present study was 102 line managers at the CoW
Municipality.
The population chosen consisted of the line managers (consisting of the supervisory and non-
supervisory staff at the D Band level) in the CoW Municipality. The CoW Municipality used the
Paterson Job Grading System for grouping employees. The D2 and D3 levels were occupied
by divisional heads that had employees reporting to them. The D1 and some D2 levels were
held by the section heads, some of whom had staff members reporting to them, while some of
them did not. There were also specialists (i.e. non-section heads) who had been graded at the
D1 and some at D2 levels, although they were not section heads. Therefore, the target
population included (n=102) line managers employed by the CoW Municipality.
4.7.2 Sampling
In many cases, populations are too substantial to study as a whole, in which case a small
group is selected, on which the study is based (Jensen & Laurie, 2016:88). Sampling is the
process of selecting units (e.g. people, or organisations) from a population of interest, so that,
by studying the sample, reasonable generalisations might be drawn from the results back to
the population from which the sample was chosen (Bryman & Bell, 2007:180-182; Blanche et
al., 2010:49). Generalisation is the result of the study of a sample that represents a population
(Jensen & Laurie, 2016:88).
Henn et al. (2006:130) define a sample as identified part of the population with characteristics
similar to those of the population. Moreover, Saunders et al. (2012:158) see sampling as a
relatively small number that is representative of a population, or which has the particular
characteristics of the total population involved. The selection of the sampling strategy in the
current study was based on the purpose and objectives of the research undertaken (Blanche
et al., 2010:4). Two sampling techniques exist, namely non-probability and probability sampling
(Saunders et al., 2012:158).
4.7.2.1 Probability sampling
A probability sample is a sample that has been selected using random selection so that each
unit in the population has a known chance of being selected (Bryman & Bell, 2007:182).

137
Probability sampling (or representative sampling) is a sampling technique in terms of which
the required samples are gathered by means of a process that gives all the individuals in the
population an equal chance of selection (Jensen & Laurie, 2016:93). Such sampling is linked
to the survey research approach, and it helps with making inferences from the chosen sample
regarding the population, with the aim of answering the research questions concerned, and
with meeting the research objectives of the study (Saunders et al., 2012:262). Such a sampling
method includes the following sampling: simple random; systematic random; stratified random;
multi-stage; and cluster (Saunders et al., 2012:258; Jensen & Laurie, 2016:93).
4.7.2.2 Non-probability sampling
A non-probability sample is a sample that has not been selected using a random selection
method. By implication, in non-probability sampling (i.e. non-random sampling), the units are
selected through a process that does not give all the individuals in the population an equal
chance of being selected (Bryman & Bell, 2007:182). The above means that such sampling
does not follow the theory of probability in terms of choosing the elements from the sampling
frame (Kumar, 2012:206).
Furthermore, Kumar (2012:206) states that non-probability designs are utilised when the
populations are unknown, or not easily identifiable. Thus, the selection of a sample is made by
other non-probability means, such as by quota, purposive, volunteer, and haphazard sampling
(Saunders et al., 2012:261). According to Saunders et al. (2012:283), sample size is unclear
since there is no clear rules unlike the probability sampling of the researcher is left to make his
own judgement.
For this study, non-probability sampling (volunteer sampling) was selected and used. The
volunteer sampling (self-selection sampling) allows respondents to decide if they are interested
to participate in the research (Saunders et al., 20012:289). The full population were invited by
letter to take part in the study and only 76 completed the questionnaire, where after data from
those who responded was collected and analysed (Saunders et al., 20012:288).
4.7.3 Data collection method
To draw valid conclusions, it was clear that the data required was the primary material, in the
form of numbers (numerical or quantitative) or words (qualitative data), that would enable an
analysis to be undertaken (Blanche et al., 2010:51). Inaccurate, invalid and unreliable data
(i.e. research information) is not useful for any research study (Bickman & Rog, 2009:23).

138
The collection of data for the study was done through the administration of the JDI and the JIG
Scale Measures (i.e. the JDI and JIG questionnaire), which consisted of closed-ended
questions only. A JDI and JIG questionnaire is a research tool that is used to collect job
satisfaction data from the research participants involved (Kumar, 2012:145). It consists of a
short list of “phrases and adjectives that describe different facets of the job or the job overall”.
The above-mentioned method was specially selected for the study, because of its established
reliability, validity, relative ease of administration, user-friendliness, and extensive use by other
researchers in the past (BGSU, 2009:3). The data collection for the study was conducted at
the CoW Municipality during August 2014.
Regular follow-ups with the respondents were made telephonically, and via emails, so as to
enhance the response rate. The conduct of the study was approved by the then Strategic
Executive: Human Resource Management (SEHRM) and the CEO, respectively, of the CoW
Municipality before any data were collected from within the Municipality. (An approval letter to
such effect is attached as Annexure A.)
4.7.3.1 The research instrument (JDI and JIG questionnaire)
The JDI and the JIG Scale (i.e. the JDI and JIG questionnaire) was adopted for purposes of
the current research. The questionnaire involved was selected for the current research, since
it is unique among measures of job satisfaction, because of its continual revision (BGSU, n.d.).
The original version of the JDI and JIG questionnaire was published in 1969.
Since then, the JDI and JIG questionnaire was revised in 1985, 1997, and, most recently, in
2009 (BGSU, n.d.). According to the Lake et al. (n.d.), the JDI and JIG questionnaire has
demonstrated excellent reliability and validity over the years (refer to section 4.8 on page 142
for detailed information in this regard).
The JDI and JIG questionnaire consists of measures dealing with job satisfaction, with different
facets of the job situation (i.e. the work itself, the pay, the opportunities for promotion, the
supervision, the relationships with co-workers, and the job in general (JIG)) scales measuring
the overall job satisfaction levels experienced with the job, as was previously mentioned. It is,
thus, feasible to obtain an individualised picture of job satisfaction, as well as to provide an
accurate measurement of the job satisfaction levels involved for the groups of individuals
concerned in terms of numerous workplace factors.

139
In this study, the JDI and JIG questionnaire, together with a covering letter (Annexure B), was
emailed to each participant involved, since all the participants had access to email facilities.
The respondents were required to print out, and to complete the questionnaire. After that, the
completed questionnaires were collected.
4.7.3.2 The construction of the JDI and JIG questionnaire
For the current study, and as was reported in subsection 4.6.3.1, a structured, self-
administered JDI and JIG questionnaire was adopted and distributed to the respondents to
gather a broad spectrum of information. The research instrument is more advantageous to use
than are other instruments that can also be employed for purposes of data collection. The JDI
and JIG questionnaire for the present study was specifically selected because of its established
reliability, its relative ease of administration, and its user-friendliness, and because it had
previously been used extensively by other researchers.
Firstly, the questionnaire is less time-consuming than are other methods, and secondly, its use
is preferable, as it is inexpensive and time-efficient, with it being easily quantifiable and easy
to analyse statistically. Furthermore, only closed-ended questions were included in the
research instrument to allow the researcher to discover the participants' perceptions of their
levels of job satisfaction. The questions were compiled to examine the job satisfaction levels
of the line managers of the CoW Municipality during the implementation of the PMS, as
organisational excellence can only be attained when employees experience job satisfaction.
In other words, the questions were related to the set objectives of the study.
4.7.3.3 The JDI and JIG questionnaire items
The JDI and JIG questionnaire consisted of two sections (sections A and B). The demographic
information contained in Section A enabled the researcher to analyse the participants'
responses according to the different groups of individuals, in terms of their age, gender,
qualification, position, tenure, and job grade. Section B contained statements that were based
on the JDI and JIG measure (i.e. the questionnaire).The above aspect was discussed in full in
Chapter Two. The respondents had to select ‘yes’, ‘no’ or ‘?’ (i.e. uncertain) in response to
each word or short phrase provided.
A ‘yes’ response was taken to mean that the adjective or phrase described the job situation,
with a ‘no’ response being taken to mean that the adjective or phrase cannot describe the job
situation. The ‘?’ response meant that the respondent could not decide either way (BGSU,
2009:3).

140
The information given above enabled the researcher to analyse, and to come up with findings
and recommendations pertaining to the study, as is discussed in chapters Five, Six, and
Seven.
4.7.3.4 The pilot study
The JDI and JIG questionnaire had to be tested, despite it being reported on by the Lake, et
al. (n.d.) as being a reliable and valid tool prior to its use to collect the required data. Pretesting
and piloting of a questionnaire can help to identify any questions that might not be clear to the
participants, or any challenges with the questions that might lead to biased responses. The
aim of pilot testing is, therefore, to refine the questions for the participants, so that they are
able to answer them with relative ease, and so as to ensure that the data obtained are recorded
correctly (Saunders et al., 2012:451).
So doing helps with investigating the research questions to be answered. However, if
significant changes do need to be made in relation to the questions or structure, it might be
necessary to repeat the pretesting exercise with different people before starting the survey. In
the current study, before embarking on the full-scale data collection, copies of the JDI and JIG
questionnaire were distributed to five employees at senior management level in the CoW
Municipality.
The aim of the pilot study in the above-mentioned instance was to test how easy or difficult it
was to complete the JDI and JIG questionnaire. At the time, all of the participants found the
JDI and JIG questionnaire easy to complete. The pilot study also contributed to provide
assurance of the reliability and validity of the study. Since the questionnaire was a standard
adopted instrument, no shortcomings were identified, with the questionnaire having a high
validity and reliability.
4.7.3.5 Administration of the JDI and JIG questionnaire
The administering of JDI and JIG questionnaires during research is considered to be one of
the most important steps that can be taken in such respect. In the current study, it was decided
to administer the JDI and JIG questionnaire using paper and pencil. As was indicated in 4.6.3.1
above, the JDI and JIG questionnaire was administered electronically, and distributed via email
to the respondents concerned, since all the participants had access to email facilities.
The JDI and JIG questionnaires for the respondents were accompanied by a covering letter to
them, with the intention of collecting the required data, which is a common method of data
collection (Kumar, 2012:147).

141
Unfortunately, a drawback of such an approach tends to be the low response rate obtained
(Kumar, 2012:147). As was mentioned in subsection 4.6.3, permission to administer the JDI
and JIG questionnaire was requested (Annexure A) and obtained from the CoW Municipality,
as the study would allow for an indication of the critical success factors of job satisfaction to
be obtained, and of how such factors contribute to service delivery.
For the current study, the JDI and JIG questionnaire, together with a covering letter, was
emailed to each participant. The above took place after prior communication with the
respondents. The respondents were required to print out, and to complete, the questionnaire,
after which the completed questionnaires were collected.
4.7.3.6 Collection and compiling of the responses
The respondents were given 21 working days in which to complete the JDI and JIG
questionnaires, and to return them to the researcher. The researcher did follow-ups via the
telephone and email to remind them of the deadline.
After the completion of the JDI and JIG questionnaire, the data were compiled. Because the
data were obtained with pen and paper, it necessitated that the data be entered manually into
Microsoft Excel software, and transferred to the SPSS (version 16). The data were first coded,
with a prewritten syntax file being purchased for the recoding of the data, as per the quick
reference guide provided by the (BGSU, 200b:1-4).
4.7.3.7 Eliminations of bias in the JDI and JIG questionnaire
The language used in the JDI and JIG questionnaire was simple, clear and understandable.
Moreover, part of the reason for choosing to apply a quantitative approach was to reduce any
possible bias, as the use of such an approach required the author to maintain critical distance
from the respondents (Saunders et al., 2012:192).
4.7.3.8 Cronbach's alpha reliability coefficient scores for the JDI and JIG
questionnaire
The Cronbach’s alpha, developed by Lee Cronbach in 1951, provides “a measure of the
internal consistency of a test or scale", using a number between 0 and 1.
The method is a way of measuring reliability, or internal consistency (Tavakol, 2011:53).
Therefore it is, important that internal consistency be determined before any test can be used
for research purposes to ensure the validity of the study.

142
Within each section of the JDI and JIG questionnaire, the variance of the individual items
was compared with the variance of the sum scale of the section as a whole, using
Cronbach's alpha. Doing so will either confirmed that all of the elements contributed
sufficiently to the section, or else identified those individual items that might be removed
before further analysis.
The rationale for using Cronbach’s testing procedure in such a way was to identify the lowest
number of factors that might represent what was observed. Cronbach’s alpha reliability
coefficients were calculated to estimate the reliability of the JDIQ instrument. For the results
obtained, the factor of Cronbach's alpha was below 0.85. Cronbach's alpha determines the
internal consistency, or the average correlation, of items in a survey instrument to gauge its
reliability. The Cronbach's alpha reliability coefficients for the five facets, work itself, pay,
promotion, supervision, co-workers, and the job in general, respectively, are depicted in
Table 4.3 on page 137 .
A commonly accepted rule of thumb (in terms of Cronbach's alpha internal consistency) for
describing internal consistency is described in the following subsection (Tavakol, 2011:53).
4.7.3.9 The internal consistency of Cronbach's alpha
The following applies in terms of Cronbach’s alpha internal consistency:
α ≥ 0.9 – excellent;
0.9 > α ≥ 0.8 – good;
0.8 > α ≥ 0.7 – acceptable;
0.7 > α ≥ 0.6 – questionable;
0.6 > α ≥ 0.5 – poor; and
0.5 > α – unacceptable
Cronbach's alpha determines the internal consistency or average correlation of items in a
survey instrument to gauge its reliability. As indicated in 4.8.3.9 a 0.7 is an acceptable cut off
point for internal consistency for Cronbach’s alpha. The rationale for using Cronbach’s testing
procedure in this way was to identify the lowest number of factors that might represent the
observed. Cronbach’s alpha reliability coefficients were calculated to estimate the reliability of
the JDIQ instrument.

143
The Cronbach's alpha reliability coefficient for the JDI and JIG JDI and JIG questionnaire
instrument is 0,88 (lowest) and (0,92 (highest) which is highly acceptable. It measures how
strongly each of the items in the JDI facet scales and the JIG are related to the other items on
their respective scales. Below in Table 4.3 is the Alpha reliable coefficient, number of items in
each construct and the correlation among the JDI and JIG facets.
Table 4.3: Cronbach’s alpha reliability coefficients for the DDI/JIGQ facets
(Adopted from the BGSU, 2009:15)
JDI and JIG facets Alpha reliable coefficient
Number of items in each construct
W P PR S C JIG
Work facet (W) 0,90 18
0,88 9 0,34
Promotion facet (PR)
0,91 9 0,37 0,31
Supervisor facet (S) 0,92 18 0,42 0,31 0,41
Co-worker facet (C) 0,92 18 0,47 0,31 0,26 0,47
Job in general facet (JIG)
0,92 18 0,69 0,45 0,42 0,58 0,54
The reliability measures aim to explain the validity of the research instrument used for
collecting the data. A high alpha value indicates a high consistency in the way in which the
respondents completed the instrument. Although there is no fixed value for the acceptance or
rejection point, an alpha of greater than 0,70 and 0,80 is considered to be significant, with it
meaning that the scale measured the same underlying hypothesis (BGSU, 2009:15; Saunders
et al., 2012:430).
4.8 Data processing and analysis
The purpose of the data analysis was to convert the information (data) with the aim to give
answers to the research questions (Blanche et al., 2010:52).
For the data, a data entry application was developed in a Microsoft Excel program, into which
the relevant data were entered. Consequently, the Excel data file was imported into the SPSS,
version 16, where the required data cleaning and validation were done.
The data cleaning consisted of looking at the missing data from the JDI and JIG questionnaire,
straight-line responses, out of range values, and the reverse scoring. Illogical values were
corrected by means of comparing the respondent’s responses to the corresponding hard copy
JDI and JIG questionnaire.

144
The cleaning of data was done as per the quick reference guide from the BGSU. The frequency
and cross-tabulation tables were generated using SPSS version 16, and the required graphs
were created in Excel.
4.9 Validity and reliability
Validity and reliability are an integral part of any research study. Validity is the extent to which
collected data accurately represent the study subject (Jensen & Laurie, 2016:143). According
to Kumar (2012:178), validity “is the ability of an instrument to measure what it is designed to
measure”. In short, Henn et al. (2006:33), state that validity “is the generation of real, rich, and
deep data”.
Data validation is something that could be done throughout a research study, because, if the
data are not trustworthy, then the study is not credible. Barbie (1989:133, cited in Kumar,
2012:178) argues that validity “is the extent to which an imperial measure adequately reflects
the real meaning of the concept under considerations”.
Bickman and Rog (2009:11) support Jensen and Laurie (2016:143) in stating the following:
credibility refers to the validity of the study, and to whether the design is sufficiently rigorous to
provide support for the making of definitive conclusions and desired recommendations.
Reliability is the quality of a criterion that is linked to the extent to which the measures are
used, the data are consistently collected, and the result is provided (Jensen & Laurie,
2016:143). According to Kumar (2012:181), reliability refers to when the data collection
instrument is consistent, stable, predictable, and accurate. Furthermore, the above depends
on how many degrees of consistency and stability the tool has, in which case the greater is its
reliability (Kumar, 2012:181). For Henn et al. (2006:33), reliability is "the generation of hard
data that is replicable by other researchers”. The primary sources of inaccuracies in survey
errors are the random error (related to reliability) and the systematic error (related to validity).
The former error is the “extent to which responses to a question randomly diverge from each
other”, whereas the latter error “affects all responses to the question in a similar way” (Jensen
& Laurie, 2016:143).
A complete, reliable survey should be without random error, meaning that, if a question is read
twice to the same person, in the same way, it should mean the same, and the answer should
be the same every time. Avoiding all errors is not possible during the research, but the number
of errors can be reduced if the sample size is increased (Jensen & Laurie, 2016:143).

145
In the current study, the data entry involved the manual keying in of responses, which required
that some corrections had to be made. The researcher, however, was of the opinion that any
remaining errors would not significantly affect the study's reported results.
4.10 Limitations and delimitations of the study
Time was a limiting factor for the current study, because the researcher personally managed
the distribution, the collection, and the analysis of the JDI and JIG questionnaires. The
questionnaires were distributed to the line managers via email. The study depended on the
amount of time that was available to the line managers to complete the JDI and JIG
questionnaire, since it was self-administered. The respondents were reminded by email and
telephone calls to encourage them to complete the questionnaire.
4.11 Ethical considerations
Ethical considerations are inherent to any research (Lapan & Quartaroli, 2009:2), with such
considerations including the researcher’s motivations for the study, the well-being of the
respondents, the freedom to choose, and the dignity of the respondents.
Acting ethically helps researchers to avoid such scientific misconduct as distorting and
inventing data, plagiarism, publishing other researchers’ work as their own contribution without
acknowledging the source, failing to maintain the anonymity and confidentiality of the
respondents, and falsely reporting results. Furthermore, Bryman and Bell (2007:131) are of
the opinion that “ethical issues cannot be ignored”, because they relate to the integrity of the
study and field of study.
Since the study involved line managers in the CoW Municipality, it was important to consider
ethical issues to ensure that the required ethical standard was met, as suggested by Saunders
et al. (2012:230-231). Struwig and Stead (2003:66, cited in Naanda, 2010:88) opine that
“research ethics provides moral guidelines to researchers on how to conduct research”. It is
important, though, that a research study does not create unhappiness among its participants
(Dahlberg & McCaig, 2010:42).
Similarly, reference must be made to the relevant research principles, based on the purpose
of the research subject, and those affected by it (Jensen and Laurie, 2016:48).

146
The author is of the opinion that, abiding by research ethics helps to maintain integrity; to
protect the welfare of others; to build support for the researcher and for the research; and to
give direction when facing challenging situations. According to Soobrayan (2003, cited in
Dahlberg & McCaig, 2010:42), ethics is an integral component of any research study, and it
cannot be incorporated only towards the end.
In contrast, Bryman and Bell (2007:127) state that “ethical issues cannot be ignored”, because
they relate to the integrity of the study and the field of study. Struwig and Stead (2003:66, cited
in Naanda, 2010:88) opine that "research ethics provides moral guidelines to researchers on
how to conduct research”. They state further that:
“At the same time, it helps researchers to avoid scientific misconduct such as distorting and inventing data, plagiarism, publishing other researcher's work as their contribution without acknowledging the source, failing to maintain anonymity and confidentiality to the respondents, and falsely reporting results.”
It is important that anyone who is conducting research comply with professional ethics. Given
the above, a high standard of research ethics was maintained during the current study. As a
requirement, and as was suggested by Dahlberg and McCaig (2010:53), the study was
embarked upon only after the request for approval was scrutinised and approved by the Ethics
Committee of the Faculty of Business and Management Sciences at the Cape Peninsula
University of Technology (CPUT).
Given the above, a high standard of research ethics was maintained at all times throughout
the study. As suggested by Diener and Crandal (1978, cited in Bryman & Bell, 2007:132), the
above was done by means of: avoiding plagiarism (Bryman & Bell, 2007:132); preventing harm
to the participants; ensuring that the consent given was informed; preventing the invasion of
privacy; and avoiding the deception of participants.
In the light of the requirements of the research ethics applied, the following research issues
were considered: informed consent; voluntary participation; anonymity; confidentiality; and
avoidance of harm.
4.11.1 Informed consent
The informed consent (written or oral) of the participants is of paramount importance during
the data collection, with it being the “a bedrock principle of social research” (Jensen & Laurie,
2016:143).

147
Informed consent implies that the respondents are informed about the purpose of the study,
and about the advantages of conducting such a study (Lapan & Quartaroli, 2009:2; Dahlberg
& McCaig, 2010:43). The above researchers further explain that informed consent is made up
of two parts. The first part entails that “the research should always be conducted openly and
honestly, and that the participants should be aware of what is taking part in the research”.
Jensen and Laurie (2016:49) support Dahlberg and McCaig’s (2010:43), statement, saying
that "it is the responsibility of the researcher to explain the purpose of the research", in terms
of the undertaking, the financing used, and the access to it. Secondly, the "participation has to
be voluntary, and partisans must give their consent to being involved … [in the] … project”.
In the current study, the respondents were informed of the aim of the study, namely to evaluate
the critical success factors of leadership, and how such factors contribute to driving fruitful and
sustainable transformation. The instructions on the research instrument indicated what was
expected of the respondents (Saunders et al., 2012:231). Researchers have the duty to shield
participants in studies from harm, thus they need to inform them of the possible consequences
of their participation before they do so (Henn et al., 2006:9).
4.11.2 Voluntary participation
The consent form covered the principles of voluntary participation, with it ensuring that the
respondents were informed of their rights. Voluntary participation implies that the respondents
must not be coerced to participate in the study. Their participation must be voluntary, and they
could be allowed to withdraw freely from the study at any time (Dahlberg & McCaig, 2010:43;
Saunders et al., 2012:231).
4.11.3 Anonymity
Participants’ rights to anonymity could be respected. Proper precautions are necessary during
the research process, so as to protect the identity of the participants (Henn et al., 2006:85).
Furthermore, Jensen and Laurie (2016:49) state that the information provided need to be
shared with the agreed upon parties, and that personal information could not be recorded. The
researcher is duty bound to protect the identity of the participants, as well as the data collected.
To adhere to the above principle, the respondents were required not to write down their name
on the JDI and JIG questionnaire that they completed. The questionnaires were self-
administered, with email and telephonic support from the researcher. The respondents were
assured that their responses would be kept confidential.
148
4.11.4 Confidentiality
Researchers must keep the nature and quality of the participants' information strictly
confidential (Saunders et al., 2012:231). The principle of confidentiality refers to an agreement
between persons that limits other people having access to specific information. The British
Sociological Association (2002:3, cited in Jensen & Laurie, 2016:49), support the assertion
above, stating the following: participants need to know how much confidentiality will be
afforded to them during the collection of the required data.
According to Somekh and Lewin (2008:57), confidentiality is referred to as a "principle that
allows people not only to talk in confidence, but also to refuse to allow publication of any
material that they think might harm them in any way". When the principle of anonymity is
respected, it assures the respondents of confidentiality (Henn et al., 2006:85).
4.11.5 Avoidance of harm
Harm done to respondents in various ways, such as “physically, psychologically, legally, and
professionally”, is another concern that could be taken into consideration in terms of research
design (Henn et al., 2006:9). Researchers could thus not expose their research participants to
unnecessary physical or psychological harm. The current study did not expose the
respondents to any harm. They were informed that the information collected would only be
used for the study (academic purposes), and not for any personal purposes (Saunders et al.,
2012:234).
4.12 Summary
The current chapter provided an overview of the research process, which has been broken
down into various steps, of which the details are well explained.
The different stages covered the whole spectrum of the methodology and methods employed
in the research study.
The chapter started with a brief overview of Saunders’ (2012) research onion, which has
several layers that can be peeled off, and which can be applied to collect data that are required
to answer specific research questions. The different layers cover the following six topics: the
philosophy; the research approach; the methodological choice; the research strategy; the time
horizons; and the techniques and procedures. The six topics are operational in nature, follow
a logical sequence, and detail the various methods, approaches and procedures in a simple,
step-by-step manner.

149
Due consideration was given to the research philosophies (positivism, interpretivism, and
realism) forming the framework within which the existing body of knowledge could have been
developed to respond to the research questions, The different approaches to research
(deductive, inductive, and abductive) were briefly discussed, and the preferred philosophy and
approach were selected. Furthermore, the study design was discussed. The research design
refers to the plan, the structure, the overarching strategic framework, and the roadmap for the
study, which is adhered to so as to maintain a feasible and appropriate path through the
required research. The design serves as a bridge between the research questions and the
execution, or implementation, of the research. The research design is developed to identify the
methods and procedures used throughout the research project.
The study plan illustrates the steps that the researcher follows to obtain answers to the
research questions being investigated by way of the unearthing of useful answers to the
problems concerned. The four dimensions (purpose, paradigm, context, and techniques)
required during the formulation of a research design were expounded on at great length. The
research design of the current thesis was influenced by, and constructed using, the research
process ‘onion’ shown in Figure 4.1 on page 121 The importance of making the right choices
to achieve coherence throughout the research was discussed.
The two methodological approaches (quantitative and qualitative), and the nature of the
research design (i.e. the exploratory, descriptive or explanatory purpose), was discussed, with
the reasons being given for the preferred choice for the current study. An important factor that
was considered and discussed was the time constraint that was available for the undertaking
of the research. Five reasons were provided for the preferred choice.
The various research techniques and procedures (including sampling, and data collection and
analysis) required for conducting the study were thoroughly discussed. The section discussed
the sampling process, explaining the between probability and non-probability sampling
techniques.
Finally, important issues of validity and reliability, the limitation and delimitation of the study,
the eliminating of bias and the importance of ethical concerns (i.e. informed consent, the
avoidance of harm, confidentiality, anonymity, and the voluntary nature of participation in the
study) considerations were discussed. As could be deduced from the chapter, ethical
challenges could be attributed to the subject matter and the conduct of the research. Chapter
Five presents and analyses the findings made, with the results being linked to the literature
review.
150
CHAPTER FIVE
DATA ANALYSIS AND FINDINGS
5.1 Introduction
In Chapter Four, the study methodology was discussed in detail. The current chapter illustrates
the results of the study that emerged from the data analysis. The descriptive statistics, in terms
of the demographic data, the frequencies, the means, the standard deviations, the ANOVA,
and the correlation among the participants, are presented with the aid of graphs and tables.
The data were analysed by means of commenting on the objective and the research
hypothesis concerned, looking at each assessment of the study. The objective was to measure
the job satisfaction levels of the line managers in the CoW Municipality. Statistics can help
understand a phenomenon by means of confirming, or rejecting, a hypothesis.
The JDI facets and the JIG scale (in the form of the JDI and JIG questionnaires) were given to
(n=102) line managers, of whom 76 (n=76; 75%) completed the questionnaires, and 26 (n=26;
25%) did not. The data from the JDI and JIG questionnaires were analysed, with the findings
being presented according to the sequence of the JDI and JIG questionnaire, and in terms of
the hypothesis. The two sections of the JDI and JIG questionnaire were:
section A: Biographical data (covered in Figures 5.1 to 5.5 on page ); and
section B: The JDI (covered in Tables 5.1 to 5.11 on page ).
The current chapter illustrates the results of the study that emerged from the data analysis.
The descriptive statistics, in terms of the utilising of the frequencies, the means, the standard
deviation, and the percentage of the demographic data analysis characteristics and variations
among the different participants, are presented in tables and graphs.
5.2 Descriptive statistics (i.e. the results)
The descriptive statistics calculated for the population in the study are depicted in Figures 5.1
to 5.6 on page 152 -155 and in Tables 5.1 to 5.5 on page in the various subsections, and in
detail in Chapter Six on page 177 - 202.
5.2.1 Univariate analysis of section A of the JDI and JIG questionnaire
Univariate analysis is used to explore the data across the cases, one variable at a time. The
three values that are utilised are the distribution, the central tendency, and the dispersion
(Bryman & Bell, 2007:357).

151
5.2.1.1 The distribution of demographic data
Demographic data, which are information regarding the demographic characteristics of a
population are an important aspect of any survey. According to the Population Reference
Bureau (n.d.), demography is defined as “the scientific study of human populations, and
other characteristics [such as age, sex, class, etc.], as well as the causes and
consequences of changes in these factors”.
The data assist management in "such areas … [as] training and reward management”
(Bratton & Gold, 2007:145). The data are, thus, essential to the study. They assist in
contextualising the findings, and in the formulation of the appropriate recommendations. The
recommendations given could enable the management of CoW Municipality to take note of the
levels of job (dis)satisfaction of the line managers, and to generalise them to all the employees
concerned.
Furthermore, the findings should portray an understanding of the common generational
differences experienced. Most current workplaces are staffed by four distinct generational
cohorts (i.e. veterans, baby boomers, and generations X and Y) (France, Leahy & Parsons,
2007, cited in Morris, 2011:9). Differences exist between the generational cohorts in the
workplace, with organisations needing to manage those from each cohort in various ways, so
as to improve their effectiveness and efficiency (Fenzel, 2013:16).
According to Landry (2008:94, cited in Morris, 2011:10), the previous research undertaken on
generational differences “does not demonstrate that generations are completely different, but
rather that they have similarities as well as differences”. The above-mentioned research
findings assisted the researcher in determining what factors might have influenced the
respondents’ answers, interests, and opinions, leading to response variation between the
groups mentioned. The age, gender, education, position held, and tenure of the respondents
tended to determine their depth of knowledge and experience, with the focus on the survey.
Once they are provided with the findings of the current study, the CoW Municipality
management could avoid making stereotyping assumptions about the line managers, whose
characteristics of age, gender, highest school qualification, position, and years of service are
divulged in the study. Certain anticipations were held of the outcomes of the present study.
For example, respondents in their early twenties were thought to be likely to answer the
questions asked differently to how those who were in their 40s and 50s did.

152
It was, thus, important to present the results coherently, with the aim of uncovering the
trends/clues that would enable the study bringing about of the anticipated improvements at the
CoW Municipality. The distribution is a summary of the frequency of individual values, or of
ranges of values, for the variables concerned.
Figure 5.1 below shows the sample distribution of the respondents according to gender.
Figure 5.1: Gender categories
Figure 5.1 above indicates that the majority of the respondents (n=48; 63%) were men,
whereas the rest were women (n=28; 37%).
Figure 5.2 below shows the sample distribution according to age.
Of the respondents, 49% (n=37) were in the age group 21 to 40 years old, whereas 33% (n=25)
were in the age group 41 to 50 years old, with, lastly, 18% (n=14) being older than 51 years.
48
28
0
10
20
30
40
50
60
Male Female
Gender
Figure 5.2: Age categories

153
Figure 5.3 below presents the highest qualifications of the respondents.
Figure 5.3: Highest qualification categories Figure 5.3 above indicates that 38% (n=29) of the respondents had a diploma/degree, whereas
33% (n=25) had an Honours/BTech degree, and 28% (n=21) had a Master’s degree as their
highest level of qualification. Lastly, 1% (n=1) had Matric, or lower.
Figure 5.4 below presents the job position of the respondents.
I Figure 5.4: Job position categories
The results concerning the job position, which are given in Figure 5.3 above, indicate that the
majority (45%; n=34) of the respondents were divisional heads, whereas 20% (n=15) were
sectional heads, and 35% (n=27) were specialists.
0 5 10 15 20 25 30
Matric and lower
Diploma/degree
Honours/Btech degress
Master+
1
29
25
21
Qualifications
0 5 10 15 20 25 30 35
DIVISIONAL HEAD
SECTIONAL HEAD
SPECIALIST
34
15
27
Position

154
Figure 5.5 below presents the tenure of the respondents.
Figure 5.5: Years of service categories
The majority of the respondents (51%; n=39) had worked for longer than ten years in the CoW
Municipality. Those who had worked for the Municipality for more than five years, but for fewer
than ten years, comprised 16% (n=12), whereas those who had worked for longer than a year,
but for fewer five years, comprised 26% (n=20), of the sample. Lastly, the respondents who
had worked for under a year formed 7% (n=5) of the sample.
Figure 5.6 below presents the job grades of the respondents.
Figure 5.6: Job grade categories Figure 5.6 above shows that the majority of the respondents (46%; n=35) were graded D1, with 42%
(n=32) being graded D2, and 12% (n=9) D3.
5
20
12
39
0
5
10
15
20
25
30
35
40
45
Less than a year More than a year butless than five years
More than 5 years butless than ten years
More than ten years
Tenure
35
46.1
46.1
46.1
32
42.1
42.1
88.2
9
11.8
11.8
100
0 20 40 60 80 100 120
Frequency
Percent
Valid Percent
Cumulative Percent
Valid Total Valid D3 Valid D2 Valid D1
Grade

155
5.3 Result of the JDI and JIG questionnaire
In computing the frequency reports on the specific JDI and JIG scale facet statements
(negative and positive), some statements were found to have met with almost unanimous
(dis)agreement. The responses concerned can be viewed in tables 5.1 through 5.7 (on pages
155 – 163), with the latter table indicating the score averages. The reliability of each facet is
an indicator of how accurate the measure is at assessing the prevailing level of satisfaction
(with higher reliability indicating greater accuracy). The reliability of each facet in the current
sample was excellent, with a reliability of 0,70 being considered acceptable (refer to subsection
4.7.3.9).
5.3.1 Work on present job
The question about work on the present job attempted to capture the significance of the
circumstances under which the employees performed, which could have had as much of an
impact on their success, comfort and safety as did the intrinsic details of the task itself
(Ramasodi, 2010:10). Furthermore, the results of the current study might provide additional
insight into the similarities and differences in the attitudes of the respondents, which could
assist in improving the quality of the work performed. The respondents were asked to describe
the qualities in terms of the JDI and JIG, as is indicated in the following tables.
Table 5.1: The work itself facet
Descriptors Score Male Female Total Percentage Males (%) Females (%)
Fascinating (W1)
Yes 31 16 47 0.64 0.66 0.34
No 8 9 17 0.23 0.47 0.53
? 7 3 10 0.14 0.70 0.30
Routine (W2)
Yes 16 11 27 0.36 0.59 0.41
No 28 17 45 0.61 0.62 0.38
? 2 0 2 0.03 1.00 0.00
Satisfying (W3)
Yes 34 20 54 0.73 0.63 0.37
No 8 8 16 0.22 0.50 0.50
? 4 0 4 0.05 1.00 0.00
Boring (W4)
Yes 4 3 7 0.09 0.57 0.43
No 38 24 62 0.84 0.61 0.39
? 4 1 5 0.07 0.80 0.20
Good (W5)
Yes 34 20 54 0.73 0.63 0.37
No 9 4 13 0.18 0.69 0.31
? 3 4 7 0.09 0.43 0.57
Accomplishment (W6)
Yes 40 24 64 0.86 0.63 0.37
No 2 3 5 0.07 0.40 0.60
? 4 1 5 0.07 0.80 0.20
Respected (W7)
Yes 32 21 53 0.72 0.60 0.40
No 7 4 11 0.15 0.64 0.36
? 7 3 10 0.14 0.70 0.30
Exciting (W8)
Yes 27 18 45 0.61 0.60 0.40
No 9 10 19 0.26 0.47 0.53

156
? 10 0 10 0.14 1.00 0.00
Rewarding (W9)
Yes 30 17 47 0.64 0.64 0.36
No 12 6 18 0.25 0.67 0.33
? 4 4 8 0.11 0.50 0.50
Useful (W10)
Yes 42 25 67 0.93 0.63 0.37
No 1 1 2 0.03 0.50 0.50
? 2 1 3 0.04 0.67 0.33
Challenging(W11)
Yes 35 23 58 0.77 0.60 0.40
No 10 4 14 0.19 0.71 0.29
? 2 1 3 0.04 0.67 0.33
Simple (W12)
Yes 11 3 14 0.19 0.79 0.21
No 33 24 57 0.78 0.58 0.42
? 1 1 2 0.03 0.50 0.50
Repetitive (W13)
Yes 11 9 20 0.27 0.55 0.45
No 34 16 50 0.68 0.68 0.32
? 1 3 4 0.05 0.25 0.75
Creative (W14)
Yes 34 15 49 0.69 0.69 0.31
No 6 7 13 0.18 0.46 0.54
? 5 4 9 0.13 0.56 0.44
Dull (W15)
Yes 2 3 5 0.07 0.40 0.60
No 38 20 58 0.79 0.66 0.34
? 5 5 10 0.14 0.50 0.50
Uninteresting (W16)
Yes 3 3 6 0.08 0.50 0.50
No 39 23 62 0.86 0.63 0.37
? 2 2 4 0.06 0.50 0.50
Can see results (W17)
Yes 36 24 60 0.82 0.60 0.40
No 7 3 10 0.14 0.70 0.30
? 2 1 3 0.04 0.67 0.33
Uses my abilities (W18)
Yes 36 23 59 0.81 0.61 0.39
No 7 3 10 0.14 0.70 0.30
? 2 2 4 0.05 0.50 0.50
The respondents were requested to think about their work and to describe it, based on the
qualities mentioned. The respondents’ outcome, as shown in Table 5.1 above, consisted of
75% agreement and 76% disagreement, on average. In terms of the scale, the respondents
found their work on present jobs: useful (93%); indicative of accomplishment (86%); with visible
results (82%); using their abilities (81%); challenging (77%); good and satisfying (73%);
respected (72%); creative (69%); rewarding and fascinating (64%); and exciting (61%).
Furthermore, they did not tend to find their present jobs: uninteresting (86%); boring (84%);
dull (79%); simple (78%); or repetitive and routine (61%).
5.3.2 Pay
The question on pay attempted to capture the significance of how the respondents saw their
pay as a reflection of how management viewed their contribution to the organisation.
Furthermore, the results of the study might have provided additional insight into the similarities
and differences in terms of the views of the respondents, which could assist in improving their
perceptions on the pay facet. See table 5.2 on page 157 below.

157
The above-mentioned perceptions of the line managers could assist the management to
improve the pay equity involved, and, in the process, improve the levels of job satisfaction.
Table 5.2: The pay facet
Descriptors Score Male Female Total Percentage Male (%) Female (%)
Adequate for normal expenses (P1)
Yes 29 22 51 0.69 0.57 0.43
No 12 4 16 0.22 0.75 0.25
? 5 2 7 0.09 0.71 0.29
Fair (P2)
Yes 33 21 54 0.73 0.61 0.39
No 9 7 16 0.22 0.56 0.44
? 4 0 4 0.05 1.00 0.00
Barely liveable on (P3)
Yes 10 5 15 0.20 0.67 0.33
No 32 21 53 0.72 0.60 0.40
? 4 2 6 0.08 0.67 0.33
Bad (P4)
Yes 5 4 9 0.12 0.56 0.44
No 39 21 60 0.81 0.65 0.35
? 2 3 5 0.07 0.40 0.60
Comfortable (P5)
Yes 30 23 53 0.72 0.57 0.43
No 14 5 19 0.26 0.74 0.26
? 2 0 2 0.03 1.00 0.00
Less than I deserve (P6)
Yes 19 9 28 0.38 0.68 0.32
No 21 16 37 0.50 0.57 0.43
? 6 3 9 0.12 0.67 0.33
Well-paid (P7)
Yes 20 16 36 0.49 0.56 0.44
No 19 10 29 0.39 0.66 0.34
? 7 2 9 0.12 0.78 0.22
Enough to live on (P8)
Yes 37 20 57 0.77 0.65 0.35
No 4 8 12 0.16 0.33 0.67
? 5 0 5 0.07 1.00 0.00
Underpaid (P9)
Yes 16 7 23 0.31 0.70 0.30
No 28 18 46 0.61 0.61 0.39
? 3 3 6 0.08 0.50 0.50
The respondents were requested to think of their pay at the time of the study and to describe
it, based on the qualities listed. The respondents’ outcome, as indicated in Table 5.2 above,
was positive 69% of the time, and negative 66% of the time, on average. The respondents’
pay was found to be: enough to live on (77%); comfortable (72%); adequate for normal
expenses (69%); and well-paid (49%). Furthermore, they did not find their pay bad (81%);
barely liveable on (72%); underpaying (61%); or less than they deserved (50%).
5.3.3 Opportunities for promotion
The question regarding the opportunities for promotion attempted to capture the significance
of how the respondents saw the importance of promotion, as well as its frequency, fairness
and desirability, and how it could influence their job satisfaction levels. Furthermore, the results
of the study might provide additional insights into the similarities and differences in the views
of respondents that could assist in improving their perceptions of promotions. The perceptions
of the line managers could assist the management to improve on their promotional practices
in the CoW Municipality, as per table 5.3 on page 158 below.

158
Table 5.3: The promotion facet
Descriptors Score Male Female Total Percentage Male (%) Female (%)
Good opportunities (PR1)
Yes 11 8 19 0.26 0.58 0.42
No 31 15 46 0.62 0.67 0.33
? 5 4 9 0.12 0.56 0.44
Limited opportunities (PR2)
Yes 33 19 52 0.70 0.63 0.37
No 12 6 18 0.24 0.67 0.33
? 2 2 4 0.05 0.50 0.50
Ability (PR3)
Yes 19 11 30 0.41 0.63 0.37
No 21 12 33 0.45 0.64 0.36
? 7 4 11 0.15 0.64 0.36
Dead-end (PR4)
Yes 17 8 25 0.34 0.68 0.32
No 25 14 39 0.53 0.64 0.36
? 5 5 10 0.14 0.50 0.50
Good chance (PR5)
Yes 10 7 17 0.23 0.59 0.41
No 30 17 47 0.64 0.64 0.36
? 7 3 10 0.14 0.70 0.30
Very limited (PR6)
Yes 32 17 49 0.66 0.65 0.35
No 13 8 21 0.28 0.62 0.38
? 2 2 4 0.05 0.50 0.50
Infrequent (PR7)
Yes 23 15 38 0.52 0.61 0.39
No 16 8 24 0.33 0.67 0.33
? 7 4 11 0.15 0.64 0.36
Regular (PR8)
Yes 4 4 8 0.11 0.50 0.50
No 35 20 55 0.75 0.64 0.36
? 7 3 10 0.14 0.70 0.30
Fairly good chance (PR9)
Yes 10 7 17 0.23 0.59 0.41
No 30 17 47 0.64 0.64 0.36
? 6 3 9 0.12 0.67 0.33
The respondents were requested to consider their opportunities for promotion that they had at
the time and to describe it, based on the qualities listed. The respondents’ outcome (as
indicated in Table 5.3 above) was positive 32% of the time, and negative 34% of the time, on
average. The respondents perceived themselves as being promoted on their abilities (41%),
and as having good opportunities for promotion (26%). They felt that they had a good, or fairly
good, chance of promotion (23%), and promotions happened regularly (11%). Furthermore, a
fairly low percentage found that the opportunities for their promotion were dead-end (53%),
infrequent (33%), very limited (28%), and limited (24%).
5.3.4 Supervision
The question regarding supervision of the employee’s present job attempted to capture the
significance of the interpersonal relationships participated in at work, and how the employees
related to their supervisor in the workplace, in terms of the amount of support that they
received, whether of a technical, emotional or social nature. Furthermore, the results (in table
5.4 on page 159 below) of the study might provide additional insight into the similarities and
differences in attitude which can promote a (non-) productive workplace.

159
Table 5.4: The supervision facet
Descriptors Score Male Female Total Percentage Male (%) Female (%)
Supportive (S1)
Yes 31 22 53 0.71 0.58 0.42
No 13 4 17 0.23 0.76 0.24
? 3 2 5 0.07 0.60 0.40
Hard to please (S2)
Yes 10 7 17 0.23 0.59 0.41
No 30 18 48 0.64 0.63 0.38
? 7 3 10 0.13 0.70 0.30
Impolite (S3)
Yes 5 1 6 0.08 0.83 0.17
No 38 25 63 0.84 0.60 0.40
? 4 2 6 0.08 0.67 0.33
Praises good work (S4)
Yes 22 16 38 0.51 0.58 0.42
No 18 12 30 0.40 0.60 0.40
? 7 0 7 0.09 1.00 0.00
Tactful (S5)
Yes 27 18 45 0.60 0.60 0.40
No 15 3 18 0.24 0.83 0.17
? 5 7 12 0.16 0.42 0.58
Influential (S6)
Yes 24 18 42 0.56 0.57 0.43
No 18 7 25 0.33 0.72 0.28
? 5 3 8 0.11 0.63 0.38
Up-to-date (S7)
Yes 21 18 39 0.52 0.54 0.46
No 22 5 27 0.36 0.81 0.19
? 4 5 9 0.12 0.44 0.56
Unkind (S8)
Yes 3 1 4 0.05 0.75 0.25
No 42 25 67 0.91 0.63 0.37
? 1 2 3 0.04 0.33 0.67
Has favourites (S9)
Yes 15 9 24 0.32 0.63 0.38
No 25 15 40 0.53 0.63 0.38
? 8 4 12 0.16 0.67 0.33
Tells me where I stand (S10)
Yes 14 14 28 0.37 0.50 0.50
No 28 8 36 0.48 0.78 0.22
? 5 6 11 0.15 0.45 0.55
Annoying (S11)
Yes 8 4 12 0.16 0.67 0.33
No 35 21 56 0.75 0.63 0.38
? 4 3 7 0.09 0.57 0.43
Stubborn (S12)
Yes 11 6 17 0.23 0.65 0.35
No 34 20 54 0.72 0.63 0.37
? 2 2 4 0.05 0.50 0.50
Knows job well (S13)
Yes 23 21 44 0.59 0.52 0.48
No 14 3 17 0.23 0.82 0.18
? 9 4 13 0.18 0.69 0.31
Bad (S14)
Yes 5 1 6 0.08 0.83 0.17
No 38 22 60 0.80 0.63 0.37
? 4 5 9 0.12 0.44 0.56
Intelligent (S15)
Yes 31 21 52 0.69 0.60 0.40
No 8 2 10 0.13 0.80 0.20
? 8 5 13 0.17 0.62 0.38
Poor planner (S16)
Yes 15 2 17 0.23 0.88 0.12
No 28 21 49 0.65 0.57 0.43
? 4 5 9 0.12 0.44 0.56
Around when needed (S17)
Yes 30 21 51 0.68 0.59 0.41
No 15 5 20 0.27 0.75 0.25
? 2 2 4 0.05 0.50 0.50
Lazy (W18)
Yes 7 0 7 0.09 1.00 0.00
No 33 26 59 0.79 0.56 0.44
? 7 2 9 0.12 0.78 0.22

160
The respondents were requested to think of the kind of supervision that they received on their
job at the time, and to describe it, based on the qualities mentioned. The respondents’ outcome
(see Table 5.4 on page 159 above) was positive 58% of the time, and negative 78% of the
time, on average.
In terms of the above scale, the respondents found that the kind of supervision that they
received on their jobs was supportive (71%), and that their supervisors were intelligent (69%)
and around when they were needed (68%). The supervisors were also found to be tactful
(60%) and influential (56%), and to know their jobs well (59%). The respondents indicated that
their supervisors were up-to-date (52%), and that they praised them for good work (51%), and
told them where they stood (64%). Furthermore, the respondents affirmed that they did not
find the way in which they were supervised unkind (91%), impolite (84%), bad (80%), or
annoying (75%). In addition, they did not find their supervisors lazy (79%), stubborn (72%),
poor planners (65%), hard to please (64%), or with favourites (53%).
5.3.5 People on the present job (i.e. the co-workers)
The question on co-workers on the present job attempted to capture the significance of the
interpersonal relationships participated in at work, and how the employees related to one
another in the workplace. Furthermore, the results (see Table 5.5 below) of the study might
provide additional insight into the similarities and differences in behaviour that can foster the
development of a positive, or a negative, working environment. The working environment, in
turn, can have an adverse impact on the levels of job satisfaction experienced in the workplace.
Table 5.5: The people on the present job (i.e. the co-workers) facet
Descriptors Score Male Female Total Percentage Male (%) Female (%)
Stimulating (C1)
Yes 25 15 40 0.55 0.63 0.38
No 15 10 25 0.34 0.60 0.40
? 6 2 8 0.11 0.75 0.25
Boring (C2)
Yes 5 2 7 0.10 0.71 0.29
No 37 21 58 0.79 0.64 0.36
? 4 4 8 0.11 0.50 0.50
Slow (C3)
Yes 18 11 29 0.40 0.62 0.38
No 24 14 38 0.52 0.63 0.37
? 4 2 6 0.08 0.67 0.33
Helpful (C4)
Yes 33 21 54 0.73 0.61 0.39
No 10 4 14 0.19 0.71 0.29
? 4 2 6 0.08 0.67 0.33
Stupid (C5)
Yes 2 0 2 0.03 1.00 0.00
No 39 26 65 0.89 0.60 0.40
? 5 1 6 0.08 0.83 0.17
Responsible (C6)
Yes 32 19 51 0.69 0.63 0.37
No 7 2 9 0.12 0.78 0.22
? 8 6 14 0.19 0.57 0.43

161
Likeable (C7)
Yes 38 20 58 0.78 0.66 0.34
No 5 1 6 0.08 0.83 0.17
? 4 6 10 0.14 0.40 0.60
Intelligent (C8)
Yes 33 20 53 0.72 0.62 0.38
No 5 4 9 0.12 0.56 0.44
? 9 3 12 0.16 0.75 0.25
Easy to make enemies (C9)
Yes 10 6 16 0.22 0.63 0.38
No 29 14 43 0.60 0.67 0.33
? 6 7 13 0.18 0.46 0.54
Rude (C10)
Yes 7 5 12 0.16 0.58 0.42
No 33 19 52 0.70 0.63 0.37
? 7 3 10 0.14 0.70 0.30
Smart (C11)
Yes 30 20 50 0.68 0.60 0.40
No 7 3 10 0.14 0.70 0.30
? 9 4 13 0.18 0.69 0.31
Lazy (C12)
Yes 15 9 24 0.33 0.63 0.38
No 23 15 38 0.52 0.61 0.39
? 8 3 11 0.15 0.73 0.27
Unpleasant (C13)
Yes 4 6 10 0.14 0.40 0.60
No 35 16 51 0.70 0.69 0.31
? 8 4 12 0.16 0.67 0.33
Supportive (C14)
Yes 33 20 53 0.73 0.62 0.38
No 6 4 10 0.14 0.60 0.40
? 7 3 10 0.14 0.70 0.30
Active (C15)
Yes 24 14 38 0.51 0.63 0.37
No 16 7 23 0.31 0.70 0.30
? 7 6 13 0.18 0.54 0.46
Narrow interests (C16)
Yes 16 10 26 0.36 0.62 0.38
No 27 10 37 0.51 0.73 0.27
? 3 7 10 0.14 0.30 0.70
Frustrating (C17)
Yes 17 10 27 0.37 0.63 0.37
No 23 14 37 0.51 0.62 0.38
? 6 3 9 0.12 0.67 0.33
Stubborn (C18)
Yes 16 10 26 0.36 0.62 0.38
No 25 12 37 0.51 0.68 0.32
? 5 5 10 0.14 0.50 0.50
The respondents were requested to think about the majority of people with whom they worked,
or whom they met in connection with their work, and to describe their interaction with them
based on the qualities concerned. The respondents’ outcome was positive 67% of the time,
and negative 63% of the time, on average. In terms of the scale, the respondents declared that
the majority of those with whom they worked, or whom they met in connection with their work,
were: likeable (78%); helpful and supportive (73%); intelligent (72%); responsible (69%); smart
(68%); stimulating (55%); and active (51%). Furthermore, the respondents did not find those
involved stupid (89%), boring (79%), unpleasant and rude (70%), easy to make enemies of
(60%), slow and lazy (52%), or with narrow interests, as well as being frustrating and stubborn
(51%).
5.3.6 The JIG
The descriptors of the respondent’s job, in general, are listed in Table 5.6 on page 162.

162
Table 5.6: The job in general facet
Descriptors Score Male Female Total Percentage Male (%) Female (%)
Pleasant (JIG1)
Yes 39 20 59 0.79 0.66 0.34
No 5 5 10 0.13 0.50 0.50
? 3 3 6 0.08 0.50 0.50
Bad (JIG2) Yes 3 1 4 0.05 0.75 0.25
No 42 25 67 0.91 0.63 0.37
? 2 1 3 0.04 0.67 0.33
Great (JIG3) Yes 26 14 40 0.53 0.65 0.35
No 12 9 21 0.28 0.57 0.43
? 9 5 14 0.19 0.64 0.36
Waste of time (JIG4)
Yes 2 1 3 0.04 0.67 0.33
No 39 24 63 0.84 0.62 0.38
? 6 3 9 0.12 0.67 0.33
Good (JIG5) Yes 44 24 68 0.91 0.65 0.35
No 3 1 4 0.05 0.75 0.25
? 0 3 3 0.04 0.00 1.00
Undesirable (JIG6)
Yes 4 0 4 0.05 1.00 0.00
No 41 25 66 0.89 0.62 0.38
? 2 2 4 0.05 0.50 0.50
Worthwhile (JIG7)
Yes 38 24 62 0.83 0.61 0.39
No 5 3 8 0.11 0.63 0.38
? 4 1 5 0.07 0.80 0.20
Worse than most (JIG8)
Yes 1 2 3 0.04 0.33 0.67
No 41 24 65 0.87 0.63 0.37
? 5 2 7 0.09 0.71 0.29
Acceptable (JIG9)
Yes 43 26 69 0.92 0.62 0.38
No 2 2 4 0.05 0.50 0.50
? 2 0 2 0.03 1.00 0.00
Superior (JIG10)
Yes 12 13 25 0.34 0.48 0.52
No 24 12 36 0.49 0.67 0.33
? 10 2 12 0.16 0.83 0.17
Better than most (JIG11)
Yes 22 18 40 0.53 0.55 0.45
No 15 6 21 0.28 0.71 0.29
? 10 4 14 0.19 0.71 0.29
Disagreeable (JIG12)
Yes 6 8 14 0.18 0.43 0.57
No 33 17 50 0.66 0.66 0.34
? 9 3 12 0.16 0.75 0.25
Content-making (JIG13)
Yes 20 12 32 0.43 0.63 0.38
No 13 11 24 0.32 0.54 0.46
? 14 5 19 0.25 0.74 0.26
Inadequate (JIG14)
Yes 10 5 15 0.20 0.67 0.33
No 32 20 52 0.69 0.62 0.38
? 5 3 8 0.11 0.63 0.38
Excellent (JIG15)
Yes 19 12 31 0.41 0.61 0.39
No 17 8 25 0.33 0.68 0.32
? 11 8 19 0.25 0.58 0.42
Rotten (JIG16) Yes 2 2 4 0.05 0.50 0.50
No 41 24 65 0.87 0.63 0.37
? 4 2 6 0.08 0.67 0.33
Enjoyable (JIG17)
Yes 37 20 57 0.75 0.65 0.35
No 7 3 10 0.13 0.70 0.30
? 4 5 9 0.12 0.44 0.56
Poor (JIG18) Yes 2 0 2 0.03 1.00 0.00
No 40 24 64 0.85 0.63 0.38
? 5 4 9 0.12 0.56 0.44

163
The respondents were requested to think about the JIG, regarding what it was like most of the
time, and to describe it, based on the qualities presented. The findings are depicted in Table
5.6 above, with 64% having responded positively, and 82% having responded negatively, on
average. In terms of the above-mentioned scale, the respondents found their JIG: acceptable
(92%); good (91%); worthwhile (83%); pleasant (79%); enjoyable (75%); great, and better than
most (53%); content-making (43%); excellent (41%); and superior (34%). Furthermore, they
did not find their JIG: bad (91%); undesirable (89%); worse than most, and rotten (87%); poor
(85%); a waste of time (84%); inadequate (69%); and disagreeable (66%).
5.3.7 Average scores of ‘yes’ and ‘no’
The average scores and percentages of ‘yes’ and ‘no’ responses to the questions asked on
the JDI and JIG questionnaire are given below, in table 5.7 below.
Table 5.7: Average scores and percentages of ‘yes’ and ‘no’ responses
Work itself Pay Promotion Supervision Co-workers JIG
Yes %
No %
Yes %
No %
Yes %
No %
Yes %)
No %
Yes %
No %
Yes %
No %
0,64 0,61 0,69 0,72 0,26 0,24 0,71 0,64 0,55 0,79 0,79 0,91
0,73 0,84 0,73 0,81 0,7 0,53 0,51 0,84 0,73 0,52 0,53 0,84
0,73 0,78 0,72 0,5 0,41 0,28 0,6 0,91 0,69 0,89 0,91 0,89
0,86 0,68 0,72 0,61 0,23 0,33 0,56 0,53 0,78 0,6 0,83 0,87
0,72 0,79 0,49
0,11
0,52 0,75 0,72 0,7 0,92 0,66
0,61 0,86 0,77
0,23
0,37 0,72 0,68 0,52 0,34 0,69
0,64
0,59 0,8 0,73 0,7 0,53 0,87
0,93
0,69 0,65 0,51 0,51 0,43 0,85
0,77
0,68 0,79
0,51 0,41
0,69
0,51 0,75
0,82
0,81
8.95 4.56 4.12 2.64 1.94 1.38 5.23 6.63 5.39 6.25 6.44 6.58
75% 76% 69% 66% 32% 34% 58% 74% 67% 63% 64% 82%
Table 5.7 above illustrate score per facet. Work itself scored 8.95 from the yes responses and
4.56 from the no responses giving a percentage of 75% and 76% respectively. Pay scored
4.12 from the yes responses and 2.64 from the no responses giving a percentage of 69% and
66% respectively. Promotion scored 1.9 from the yes responses and 1.38 from the no
responses giving a percentage of 32% and 34% respectively.

164
Supervision scored 5.23 from the yes responses and 6.63 from the no responses giving a
percentage of 58% and 74% respectively. Co-worker scored 5.39 from the yes responses and
6.25 from the no responses giving a percentage of 67% and 63% respectively. Finally, JIG
scored 6.44 from the yes responses and 6.58 from the no responses giving a percentage of
64% and 82% respectively.
5.4 Central tendency, dispersion and statistical reliability
The central tendency of distribution is an estimate of the ‘centre’ of a distribution of values. The
dispersion refers to the spread of the value around the central tendency. The statistics given
in Table 5.8 indicate the mean and the SD of each JDI facet. The scores on each facet could
range from 0 (completely unsatisfied) to 54 (completely satisfied). Generally, a rule of thumb
was that the scores ranging from 0 to 22 were considered ‘unsatisfied’, with the scores between
23 to 31 being considered ‘neutral’, and the scores between 32 and 54 being considered
‘satisfied’ (Nicholas, 2017). An examination of the means obtained indicates that the current
sample was highly satisfied on every facet, except for promotion (M = 17.86).
The means, which indicates the average distribution, is calculated by summing up all the
values in a distribution, and then dividing the total by the number of values obtained (Bryman
& Bell, 2007:359). The SD, which indicates how far the average score in the sample is from
the mean, is “essentially the average amount of variation around the mean”. In other words, a
high SD is associated with a relatively large amount of variation in whatever quality is being
measured (which was, in the present instance, the prevailing levels of satisfaction).
The SD is calculated by taking the “difference between each value in a distribution and the
mean and then dividing the total of the differences by the number of values” concerned
(Bryman & Bell, 2007:358-359). Statistical reliability is required in order to ensure the validity
and precision of the statistical analysis. The reliability of each facet indicates how accurate the
measure is at assessing satisfaction – the higher the reliability, the greater is the accuracy
involved. A reliability factor of 0.70 is considered acceptable. The reliability of each facet in
Table 5.8 below in the current sample was found to be very good.
Table 5.8: The mean, the standard deviation and the statistical reliability factor of the facets
Facets Mean Standard deviation Gronbach's coefficient alpha
Work itself 41.74 11.55 0.87
Pay 37.68 15.52 0.84
Promotion 17.86 17.62 0.91
Supervision 37.56 14.40 0.91
Co-workers 37.38 13.52 0.90
JIG 41.15 11.12 0.86

165
An examination of the means indicated that the current sample was highly satisfied on every
facet, except for promotion (M = 17.86).The mean values obtained indicated that most line
managers experienced a high satisfaction level in the case of the facets: work on present job
(M = 41.74); pay (M = 37.68); supervision (M = 37.56.); people on present job (i.e. co-workers)
(M = 37.38); and JIG (M = 41.15). The respondents were less satisfied on the facet
opportunities for promotion (M = 17.86).
5.5 Correlations
The Pearson correlation coefficient could not be used in the above instance, since the data
were not normally distributed. Consequently, the Spearman’s rank correlation coefficient
(Spearman’s rho) was used for correlation analysis in the study. The correlation in question is
a “statistical test that assesses the strength of the relationship between two ranked data
variables” (Saunders, et al., 2012:682). Besides assessing the strength of the relationship, the
data collected were also required to establish whether the probability of the correlation
coefficient had occurred by chance alone.
Hair, Black, Babin, Anderson and Tatham (2006), cited in Saunders, (2012:521) suggest
values guiding the interpretation of the correlation coefficient, as illustrated in Figure 5.7 below.
-1 -0.8 -0.6 -0.35 -0.2 0 0.2 0.35 0.6 0.8 1
Perfect Very Strong Moderate Week None Weak Modrate Strong Very Perfect negative strong negative negative negative positive positive positive strong positive negative positive
Perfect Independence
Figure 5.7: Values of the correlation coefficient
Adopted from Hair, Black, et al. (2006), cited in Saunders, (2012:521)

166
Table 5.9: Correlations of the job satisfaction facets and the job in general
Spearman's rho W P PR S C JIG
W Correlation coefficient
1.000 .141 .174 .280* .463** .458**
Sig. (2-tailed) . .234 .143 .016 .001 .001
N 73 73 72 73 71 73
P Correlation coefficient
.141 1.000 .419** .581** .385** .330**
Sig. (2-tailed) .234 . .001 .001 .001 .004
N 73 74 73 74 72 74
PR Correlation coefficient
.174 .419** 1.000 .332** .442** .280*
Sig. (2-tailed) .143 .001 . .004 .001 .016
N 72 73 74 74 73 74
S Correlation coefficient
.280* .581** .332** 1.000 .552** .306**
Sig. (2-tailed) .016 .001 .004 . .001 .008
N 73 74 74 75 73 75
C Correlation coefficient
.463** .385** .442** .552** 1.000 .638**
Sig. (2-tailed) .001 .001 .001 .001 . .001
N 71 72 73 73 73 73
JIG Correlation coefficient
.458** .330** .280* .306** .638** 1.000
Sig. (2-tailed) .001 .004 .016 .008 .001 .
N 73 74 74 75 73 75
*. Correlation is significant at the 0.05 level (2-tailed). **. Correlation is significant at the 0.01 level (2-tailed).
5.5.1 Work itself and pay
The findings in Table 5.9 above show that a weak uphill (positive) linear relationship exists
between the work itself and the pay facets, (N = 73), r = 0,141. The result further indicates that
no significant relationship exists, since the ρ-value is >0,05, ρ-value = 0,234. The coefficient
of the determination for the correlation coefficient is 0,02, which means that 2% of the variation
in the responses to P is directly due to the variation in the responses to W.
5.5.2 Work itself and promotion
The findings in Table 5.9 above show that a weak uphill (positive) linear relationship exists
between the work itself and the opportunity facets, (N = 73), r = 0,174. The result further
indicates the absence of a significant relationship, ρ-value = >0,05, ρ-value = 0,143.

167
The coefficient of the determination for the correlation coefficient is 0,03, which means that 3%
of the variation in the responses to PR is directly due to the variation in the responses to W.
5.5.3 Work itself and supervision
The findings in Table 5.9 on page 166 above show that a weak uphill (positive) linear
relationship exists between the work itself and supervision, (N = 72), r = 0,280. The result
further indicates the significance of the relationship between the work itself and the supervision
facets, since the ρ-value is <0,05, ρ-value = 0,016. The coefficient of the determination for the
correlation coefficient concerned is 0,08, which means that 8% of the variation in the responses
to S was directly due to the variation in the responses to W. The correlation is significant at the
0.05 level (1-tailed).
5.5.4 Work itself and the co-workers
The findings in Table 5.9 on page 166 above show that a moderate uphill (positive) linear
relationship exists between the work itself and the co-workers, (N = 71), r = 0,463. The result
further indicates the significance of the relationship between the work itself and the co-worker
facets, since the ρ-value is <0,05, ρ-value = 0,001. The coefficient of the determination for the
correlation coefficient is 0,21, which means that 21% of the variation in the responses to C is
directly due to the variation in the responses to W. The correlation is significant at the 0.001
level (2-tailed).
5.5.5 Work itself and the JIG
The findings in Table 5.9 on page 166 above show that a moderate uphill (positive) linear
relationship exists between the work itself and the JIG, (N = 73), r = 0,458.
The result further indicates that there is a significant relationship between the work itself and
the supervision facets, since the ρ-value is <0,05, ρ-value = 0,001. The coefficient of
determination for the correlation coefficient is 0,21, which means that 21% of the variation in
the responses to the JIG is directly due to the variation in the responses to W. The correlation
is significant at the 0.01 level (2-tailed).
5.5.6 Pay and the opportunity for promotion
The findings in Table 5.9 on page 166 above show that a moderate uphill (positive) linear
relationship exists between pay and the opportunity for promotion, (N = 73), r = 0,419. The
result further indicates that a significant relationship exists between the pay and promotion
facets, since the ρ-value is <0,05, ρ-value = 0,001.

168
The coefficient of determination for the correlation coefficient is 0,18, which means that 18%
of the variation in the responses to PR is directly due to the variation in the responses to P.
The correlation is significant at the 0.01 level (2-tailed).
5.5.7 Pay and supervision
The findings in Table 5.9 on page 166 above show that a moderate uphill (positive) linear
relationship, (N = 74), r = 0,581, exists between pay and supervision. The result further
indicates the significance of the relationship between the pay and supervision facets, since the
ρ-value is <0,05, ρ-value = 0,001. The coefficient of the determination for the correlation
coefficient is 0,34, which means that 34% of the variation in the responses to S is directly due
to the variation in the responses to P. The correlation is significant at the 0.01 level (2-tailed).
5.5.8 Pay and the co-workers
The findings in Table 5.9 on page 166 above show that a moderate uphill (positive) linear
relationship exists between pay and the co-worker, (N = 72), r = 0,385. The result further
indicates that there is a significant relationship between the pay and co-worker facets, since
the ρ-value is <0,05, ρ-value = 0,001. The coefficient of determination for the correlation
coefficient is 0,15, which means that 15% of the variation in the responses to C is directly due
to the variation in the responses to P. The correlation is significant at the 0.01 level (2-tailed).
5.5.9 Pay and the JIG
The findings in Table 5.9 on page 166 above show that a weak uphill (positive) linear
relationship exists between pay and the JIG, (N = 73), r = 0,330. The result further indicates
that there is a significant relationship between the pay and JIG facets, since the ρ-value is
<0,05, ρ-value = 0,004. The coefficient of determination for the correlation coefficient is 0,109,
which means that 10,9% of the variation in the responses to the JIG is directly due to the
variation in the responses to P. The correlation is significant at the 0.01 level (2-tailed).
5.5.10 Promotion and supervision
The findings in Table 5.9 on page 166 above show that a weak uphill (positive) linear
relationship exists between promotion and supervision, (N = 74), r = 0,332. The result further
indicates that there is a significant relationship between the promotion and supervision facets,
since the ρ-value is <0,05, ρ-value = 0,001. The coefficient of determination for the correlation
coefficient is 0,110, which means that 11% of the variation in the responses to S is directly due
to the variation in the responses to the PR. The correlation is significant at the 0.01 level (2-
tailed).
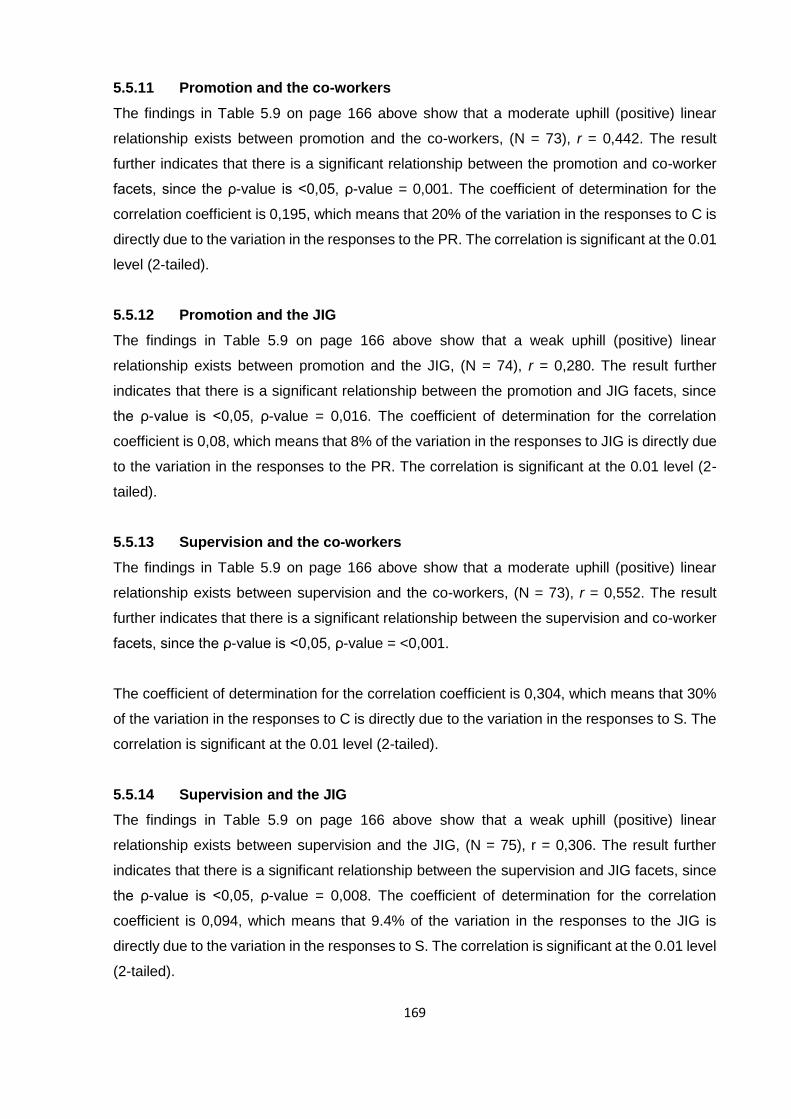
169
5.5.11 Promotion and the co-workers
The findings in Table 5.9 on page 166 above show that a moderate uphill (positive) linear
relationship exists between promotion and the co-workers, (N = 73), r = 0,442. The result
further indicates that there is a significant relationship between the promotion and co-worker
facets, since the ρ-value is <0,05, ρ-value = 0,001. The coefficient of determination for the
correlation coefficient is 0,195, which means that 20% of the variation in the responses to C is
directly due to the variation in the responses to the PR. The correlation is significant at the 0.01
level (2-tailed).
5.5.12 Promotion and the JIG
The findings in Table 5.9 on page 166 above show that a weak uphill (positive) linear
relationship exists between promotion and the JIG, (N = 74), r = 0,280. The result further
indicates that there is a significant relationship between the promotion and JIG facets, since
the ρ-value is <0,05, ρ-value = 0,016. The coefficient of determination for the correlation
coefficient is 0,08, which means that 8% of the variation in the responses to JIG is directly due
to the variation in the responses to the PR. The correlation is significant at the 0.01 level (2-
tailed).
5.5.13 Supervision and the co-workers
The findings in Table 5.9 on page 166 above show that a moderate uphill (positive) linear
relationship exists between supervision and the co-workers, (N = 73), r = 0,552. The result
further indicates that there is a significant relationship between the supervision and co-worker
facets, since the ρ-value is <0,05, ρ-value = <0,001.
The coefficient of determination for the correlation coefficient is 0,304, which means that 30%
of the variation in the responses to C is directly due to the variation in the responses to S. The
correlation is significant at the 0.01 level (2-tailed).
5.5.14 Supervision and the JIG
The findings in Table 5.9 on page 166 above show that a weak uphill (positive) linear
relationship exists between supervision and the JIG, (N = 75), r = 0,306. The result further
indicates that there is a significant relationship between the supervision and JIG facets, since
the ρ-value is <0,05, ρ-value = 0,008. The coefficient of determination for the correlation
coefficient is 0,094, which means that 9.4% of the variation in the responses to the JIG is
directly due to the variation in the responses to S. The correlation is significant at the 0.01 level
(2-tailed).

170
5.5.15 Co-workers and the JIG
The findings in Table 5.9 on page 166 above show that there exist a strong uphill (positive)
linear relationship between, (N = 73), r = 0,638. The result further indicates that there is a
significant relationship between the co-workers and JIG facets, since the ρ-value is <0,05, ρ-
value = 0,001. The coefficient of determination for the correlation coefficient is 0,407, which
means that 41% of the variation in the responses to the JIG is directly due the variation in the
responses to C. The correlation is significant at the 0.01 level (2-tailed).
5.6 Comparative statistics
The following statistics are comparisons of subgroups in the sample on each facet of the JDI
and JIG. The comparisons given in Table 5.10 below were made on the basis of gender. The
present sample consisted of 47 males and 28 female. Table 5.10 below illustrate the means
and standard deviation comparison of gender for the line managers.
Table 5.10: The means and standard deviation comparison of gender
Facet Gender N Mean Std deviation Std error mean
W Male 45 42.16 11.531 1.719
Female 28 41.07 11.760 2.222
P Male 46 36.74 15.128 2.231
Female 28 39.21 16.306 3.082
PR Male 47 17.53 16.217 2.366
Female 27 18.44 20.156 3.879
S Male 47 35.51 14.732 2.149
Female 28 41.00 13.364 2.526
C Male 46 37.54 13.688 2.018
Female 27 37.11 13.469 2.592
JIG Male 47 41.04 11.204 1.634
Female 28 41.32 11.182 2.113
Table 5.11: The independent samples test
Facet and variances Levene's test for equality of
variances t-test for equality of means
F Sig. t df
Sig. (2-
tailed) Mean
diff
Std error diff
95% Confidence interval of the diff
Lower Upper
W Equal variances assumed
.220 .641 .388 71 .699 1.084 2.797 -4.492 6.660
Equal variances not assumed
.386 56.54
8 .701 1.084 2.810 -4.543 6.711
P Equal variances assumed
.027 .870 -.663 72 .510 -2.475 3.734 -9.920 4.969
Equal variances not assumed
-.651 53.83
8 .518 -2.475 3.804 -10.102 5.152
PR Equal variances assumed
2.35 .130 -.213 72 .832 -.913 4.284 -9.453 7.628
Equal variances not assumed
-.201 45.38
6 .842 -.913 4.543 -10.061 8.236

171
S Equal variances assumed
.940 .335 -1.615 73 .111 -5.489 3.400 -12.265 1.286
Equal variances not assumed
-1.655 61.36
7 .103 -5.489 3.316 -12.119 1.141
C Equal variances assumed
.130 .719 .131 71 .896 .432 3.299 -6.146 7.011
Equal variances not assumed
.132 55.33
0 .896 .432 3.285 -6.150 7.015
JIG
Equal variances assumed
.004 .951 -.104 73 .917 -.279 2.673 -5.606 5.048
Equal variances not assumed
-.104 56.98
7 .917 -.279 2.671 -5.628 5.071
The overall findings in tables 5.10 and 5.11 on page 170 revealed the statistics discussed in
subsections 5.6.1 to 5.6.7 below.
5.6.1 The work itself
On the work itself facet, the men (N = 45) scored higher (M = 42,16; SD = 11,53) than did the
women (N = 28; M = 41,07; SD = 11,76), resulting in a mean difference of 1,09, a t-value 0,39,
and a ρ-value of 0,69, indicating the absence of a significant difference, since the ρ-value is at
the >0,05 level (2-tailed). The ρ-value should be less than 0,05.
5.6.2 Pay
On the pay facet, the women (N = 28) scored higher (M = 39,21; SD = 16,31) than did the men
(N = 46; M = 36,74; SD = 15,13), resulting in a mean difference of -2,45, a t-value of 0,39, and
a ρ-value of 0,51, indicating the absence of a significant difference, since the ρ-value is at the
>0,05 level (2-tailed). The ρ-value should be less than 0,05.
5.6.3 Promotion
On the promotion facet, the women (N = 27) scored higher (M = 18,44; SD = 20,16) than did
the men (N = 47; M = 17,53; SD = 16,22), resulting in a mean difference of -0,92, a t-value of
0,21, and a ρ-value of 0,83, which indicates the absence of a significant difference, since the
ρ-value is at the >0,05 level (2-tailed). The ρ-value should be less than 0,05.
5.6.4 Supervision
The women (N = 28) scored higher (M = 41,00; SD = 13,37) than did the men (N = 47; M =
35,51; SD = 14,73), resulting in a mean difference of -5,49, a t-value of -1,62, and a ρ-value of
0,111, indicating the absence of a significant difference, since the ρ-value is at the >0,05 level
(2-tailed). The ρ-value should be less than 0,05.

172
5.6.5 Co-workers
The men (N = 46) scored higher (M = 37,54; SD = 13,69) than did the women (N = 27; M =
37,11; SD = 13,47), resulting in a mean difference of ,43, a t-value of 0,13, and a ρ-value of
0,90, indicating the absence of a significant difference, since the ρ-value is at the >0,05 level
(2-tailed). The ρ-value should be less than 0,05.
5.6.6 The JIG
The women (N = 28) scored higher (M = 41,32; SD = 11,18) than did the men (N = 47; M =
41,04; SD = 11,20), resulting in a mean difference of -2,28, a t-value of -0,104, and a ρ-value
of 0,92, indicating the absence of a significant deference, since the ρ-value is at the >0,05 level
(2-tailed). The ρ-value should be less than 0,05.
5.7 Age comparison
In the current study, a one-way ANOVA was used to compare more than two groups with
regard to the influence of the different age groups on the different facets concerned. The
independent variable (age) consisted of three categories: the 21- to 40-year-olds; the 41- to
50-year-olds, and those aged 51 years or older. Table 5.12 below shows the mean and the SD
for each of the facets concerned.
The following statistics are those of the comparisons of the sample subgroups on each facet
of the JDI and JIG. The comparisons in Table 5.12 below were made on the basis of gender,
with 47 men and 28 women being present in the current sample. The Table shows the first
output, the descriptive.
The table is a useful initial guide, as it shows the mean score for each age group involved.
Table 5.12: The mean age of the respondents
Age W P PR S C JIG
21–40 years old Mean 40.97 39.06 18.17 40.57 38.03 39.54
N 35 36 36 37 36 37
Std deviation 11.801 15.759 17.451 13.190 13.214 13.148
41–50 years old Mean 39.38 33.83 14.83 32.08 33.00 40.21
N 24 24 24 24 24 24
Std deviation 12.314 14.637 16.129 15.071 14.958 9.127
51 years and above Mean 47.71 40.71 22.29 39.00 43.69 47.00
N 14 14 14 14 13 14
Std deviation 7.477 16.203 20.634 14.581 8.664 5.657
Total Mean 41.74 37.68 17.86 37.56 37.38 41.15
N 73 74 74 75 73 75
Std deviation 11.549 15.520 17.624 14.395 13.515 11.121
The overall findings in Table 5.12 above reveal the statistics indicated below.

173
On the work itself, the respondents (N = 35) aged 21 to 40 years old scored a mean of 40.97,
and an SD of 11,80; those aged 41 to 50 years old (N = 24) scored a mean of 39,38, and an
SD of 12,31; and those aged 51 years and above (N = 14) scored a mean of 47,71, and an SD
of 7.45.
On pay, the respondents aged 21 to 40 years old (N = 36) scored a mean of 39.06 and an SD
of 15,76; those aged 41 to 50 years old (N = 24) scored a mean of 33,83, and an SD of 14,64;
and those aged 51 years and above (N = 14) scored a mean of 40,71 and an SD of 16,20.
On opportunities for promotion, the respondents aged 21 to 40 years old (N = 36) scored a
mean of 18.17 and an SD of 17,45; those aged 41 to 50 years old (N = 24) scored a mean of
14,83, and an SD of 16,13; and those aged 51 years and above (N = 14) scored a mean of
22,29, and an SD of 20,63.
On supervision, the respondents aged 21 to 40 years old (N = 37) scored a mean of 40.97,
and an SD of 13,19; those aged 41 to 50 years old (N = 24) scored a mean of 32,08, and an
SD of 15,07; and those aged 51 years and above (N = 14) scored a mean of 39,00 and an SD
of 14,58.
On the relationships with co-workers, the respondents aged 21 to 40 years old (N = 36) scored
a mean of 38,03, and an SD of 13,21; those aged 41 to 50 years old (N = 24) scored a mean
of 33,00, and an SD of 13,21; and those aged 51 years and above (N = 13) scored a mean of
43,69, and an SD of 8,88.
On the JIG, the respondents aged 21 to 40 years old (N = 37) scored a mean of 39,54, and an
SD of 13,15; those aged 41 to 50 years old (N = 24) scored a mean of 40.21, and an SD of
9,13; and those 51 years and above (N = 14) scored a mean of 47,00, and an SD of 5,66.
Table 5.13 on page 174 below shows the ANOVA table, including the sums of squares, the
degrees of freedom, the mean squares, the F-value, and the observed significance value. In
Table 5.13 on page 174, an ANOVA was calculated in terms of the participants’ age, in relation
to the rating of the different facets concerned. The mean score and the SD given in Table 5.13
on page 174 above is the same for all three age groups. In other words, the mean, or SD, for
the line managers aged 21 to 40 years old is equal to the mean score obtained for the other
two groups, aged 41 to 50 years old, and aged 51 years and above, respectively.

174
Table 5.13: The ANOVA
Sum of squares df Mean square F Sig.
W * Age Between groups (combined) 654.601 2 327.301 2.560 .085
Within groups 8949.454 70 127.849
Total 9604.055 72
P * Age Between groups (combined) 552.137 2 276.068 1.151 .322
Within groups 17032.079 71 239.888
Total 17584.216 73
PR * Age Between groups (combined) 497.458 2 248.729 .796 .455
Within groups 22177.190 71 312.355
Total 22674.649 73
S * Age Between groups (combined) 1083.566 2 541.783 2.737 .071
Within groups 14250.914 72 197.929
Total 15334.480 74
C * Age Between groups (combined) 993.519 2 496.759 2.860 .064
Within groups 12157.741 70 173.682
Total 13151.260 72
JIG * Age Between groups (combined) 596.239 2 298.120 2.509 .088
Within groups 8555.148 72 118.821
Total 9151.387 74
The analysis for all the facets was not significant, with that for work yielding F(2,70) = 2,56, ρ
= 0,085; for pay F(2, 71) = 1,15, ρ = 0,322; for promotion F(2, 71) = 0,80, ρ = 0,455; for
supervision F(2, 72) = 2,74, ρ = 0,071; for co-workers F(2, 70) = 2,86, ρ = 0,064; and for the
JIG F(2, 72) = 2,51, ρ = 0,088. Since the ρ-value for all facets was found to be greater than
0,05, the null hypothesis was accepted.
5.8 Summary
Chapter Five has summarised the discussions and the presentations of the results obtained
from the research. The chapter has also covered the JDI and JIG questionnaire, the data
analysis, and the presentation of the results. After conducting the analysis, the results
discovered were reported in increasing levels of complexity.
A brief interpretation of the biographical findings of the sample was discussed, followed by the
interpretation of the results of the JDI and JIG questionnaires.

175
The primary purpose of the data analysis was, first, to highlight the demographical distributions
involved, and to check for the differences in perceptions of such motivational factors as the
following:
• type of work, with reference to the kind of work that makes the best use of one's abilities and that gives one a feeling of accomplishment;
• advancement, with reference to being able to progress in one's job or career, and
having the chance to advance in the company; • co-workers, with reference to having co-workers who are, preferably, competent and
congenial; • pay, with reference to being paid at least enough to meet one's needs, and being paid
fairly in comparison to others; • supervision, with reference to having an immediate supervisor who is, preferably,
competent, considerate, and fair; and • benefits, with reference to having access to benefits that meet one's needs, and
which compare well with those granted to others.
Furthermore, a comparison was made of the normative scores of respondents to the overall
national norms data. The normative score for the overall norms was clearly above the 50th
percentile for the work and pay facets, whereas the normative score for the promotion,
supervisor, co-worker and JIG facets was below the 50th percentile.
Finally, the Pearson correlation coefficient (r) was used for the correlation analysis to provide
meaningful associations between the variables. The results were presented in tables, and the
areas of concern were highlighted. The results revealed that, while the CoW Municipality had
put various motivation efforts and strategies in place for the eventual implementation of the
PMS, there were areas requiring strengthening to optimise the results of the PMS strategy.
Mostly the hygiene factors were in place. The following chapter (Chapter Six) discusses the
data presented in Chapter Five.

176
CHAPTER SIX
DISCUSSION OF RESULTS
6.1 Introduction
Chapter Five presented the data analysis of the study, whereas Chapter Six presents the
detailed interpretation and findings that were made in the sequence in which they were
reported. Furthermore, the discussion is supported by the available literature on which the
focus was primarily related to the SHRM, with its many detailed research reports, which had a
bearing on the findings of the current study.
The SHRM is the world's largest professional association, which has been devoted to the
subject of human resource management since 1948. The SHRM represents 275 000 individual
members in over 160 countries, with more than 575 affiliates in the United States, and with
subsidiary offices in China, India and the United Arab Emirates. The role of the SHRM is to
serve the needs of HR professionals, providing them with the latest statistics on such
contentious topic as job satisfaction (SHRM, 2016:1).
The descriptive statistics are reported on first, so as to give a biographical overview of the
sample data involved.
Secondly, the overview is followed by the interpretation of the outcomes of the scores on the
six items contained in the JDI facets and on the JIG Scale. The hypotheses tested and the
interpretations made are discussed and clarified, and the associated conclusions and
recommendations are provided.
Chapter Seven deals with the conclusion, and highlights areas for improvement and makes
recommendations for implementation, including in respect of future research.
6.2 Descriptive statistics
Descriptive statistics were used to cover what was detected in the data. Furthermore, they
were used to describe the essential features of the data in the study. The use of descriptive
statistics allows a researcher to compare the various variables explored statistically (Saunders
et al., 2012:502).

177
6.2.1 Discussion of the univariate data elicited by section A of the JDI and JIG
questionnaire
6.2.1.1 Distribution of the demographic data
Biographical data, which provide information about the demographical characteristics of a
population, are an important aspect of any survey. According to the Population Reference
Bureau (n.d.), demography is defined as “the scientific study of human populations, and
other characteristics [such as age, sex, class, etc.], as well as the causes and
consequences of changes in these factors”. Even though using such data was not essential
to the study, their use assisted with the contextualising of the findings, and with the formulation
of the appropriate recommendations. The recommendations supplied could enable the CoW
Municipality management to take note of the levels of job (dis)satisfaction of the line managers.
Most of today's workplaces have four distinct generational cohorts (i.e. veterans, baby
boomers, and generations X and Y) represented in the workplace (France, Leahy & Parsons,
2007, cited in Morris, 2011:9). Differences exist between the different generational cohorts in
the workplace, which requires that organisations manage those from each cohort differently,
so as to improve their effectiveness and efficiency (Fenzel, 2013:16). According to Landry
(2008:94, cited in Morris, 2011:10), previous research on generational differences failed to
“demonstrate that generations are completely different but rather that they have similarities as
well as differences”.
The characteristics mentioned above were designed to support the researcher in determining
what factors might have influenced the respondents’ answers, interests, and opinions, so as
to be able to determine how the responses had come to vary between the groups concerned.
The age, gender, education, position held and tenure of respondents often determine their
level of knowledge and experience with the focus of the survey.
The CoW Municipality management should avoid making stereotyping assumptions about the
line managers and the other employee groups’ characteristics, such as their age, gender,
highest educational qualification, position, and years of service, once they are provided with
the findings of the study, which include such details. For example, it was to have been
anticipated that the respondents who were in their early 20s at the time of the study would,
most likely, answer the questions differently compared to how those who were in their 40s and
50s did. It was, thus, important to present the results coherently, with the aim of uncovering
the relevant trends/clues that would enable the anticipated improvements to be brought about
in the CoW Municipality.

178
Section A of the JDI and JIG questionnaire dealt with the personal information of the
respondents, such as their age, gender, position, highest educational qualification, years of
service (i.e. their tenure), and job grade. In general, there were more male (63%, n=48,) than
female (37%, n = 28,) respondents in all the job categories surveyed (see Figure 5.1 and Figure
5.1 on page 152). The majority (49%; n=37) of the respondents were between 21 and 40 years
old, with 33% (n=25) being between 41 and 50 years old, and 18% (n=14) being 51 years old,
or above. The three age categories involved provided a relatively representative response, as
the difference in percentages found was not very significant, with 49% (n=37) being between
the ages of 21 and 40 years old, with 33% (n=25) being between the ages of 41 and 50 years
old, and with 22% (n=14) between 51 years old, or older.
Clearly, more line managers (49%) fell in the younger age category of 21 to 40 years old than
in the older categories of 41- to 50-year-olds (33%) and those aged 51 years, or older (18%).
The above-mentioned result can only mean that the CoW Municipality is, primarily, a relatively
young, male-dominated workforce. The current study could provide insight into the possible
differences in job satisfaction and motivation in relation to age and gender. The trend is not in
line with the new trend of balancing employment practices in the workplace.
In general, workforces are becoming increasingly diverse, creating professional environments
that are rich with experience and maturity, as well as with creative ideas and perspectives that
facilitate workplace efficiency (Lindenberger, 2017). Organisations that employ both male and
female workers who are widely disparate in age have the advantage of creating a dynamic,
multi-generational workforce, with a diverse range of skill sets that are beneficial to their well-
being as a whole.
Moreover, the current study focused on the issue of job satisfaction. It is imperative that
diversity in the workplace is well-balanced, so as to determine the different levels of motivation,
as stated by the various researchers concerned, like Huczynski and Buchanan (2007:258).
Furthermore, the findings indicated that 96% of the respondents (n=75) in all the age
categories had qualifications higher than Grade 12, (99%) of the respondents having a tertiary
education. Such statistics are indicative of the fact that they, in general, had a considerable
amount of knowledge and skills, and that they could understand how to complete the JDI and
JIG questionnaire concerning their job satisfaction levels. The respondents involved can be
assumed to have met the job specifications concerned, and to have been in a position to
understand the basic concepts relating to job satisfaction.

179
Usually, employees are likely to complain when the job performance and satisfaction
concerned does not meet their expected standards. Respondents with relatively low levels of
educational qualifications might require more information and attention from their
management, so that they could be treated accordingly.
From the statistics in Table 5.5 on page 154, 51% (n=39) of the respondents could be seen to
have worked for longer than a decade for the CoW Municipality. Those who had worked for
longer than five years, but for less than ten years, formed 16% (n=12) of the total percentage
of respondents. Furthermore, those who had worked for the CoW Municipality for longer than
a year, but for less than five years, formed 26% (n=20) of the total. The last group worked less
than a year account for 5% (n=5).
Such statistics indicate that they had considerable knowledge of the organisation, and that
they had a clear grasp on their experiences in relation to their job satisfaction levels. The details
as to the number of years’ tenure helped to reveal valuable information regarding the prevailing
job satisfaction levels, as well as contributing to make the results more realistic than they might
otherwise have seemed.
6.3 Result of the JDI and JIG questionnaire
In his study, Locke (1976, cited in Bull, 2005:33) found that different job dimensions added
value to the employees' job satisfaction levels. The dimensions involved were "work itself, pay,
promotions, and recognition, working conditions, benefits, supervision and co-workers".
McCormick and Ilgen (1985:309, cited in Bull, 2005:22) hypothesised that the above-
mentioned dimensions influence the employees' opinions regarding "how interesting the work
is, how routine, how well they are doing, and, in general, how much they enjoy doing it".
6.3.1 Perceptions of work in terms of the job itself
The work itself plays a very significant role in determining employees' job satisfaction levels
that might translate into either a positive, or a negative, organisational impact. Especially line
managers are inclined to remain motivated and satisfied when their work is “interesting,
challenging or exciting” (SHRM, 2011:28).
In their study, Rotenberry and Moberg (2007, cited in Ahmad, et al., 2010:259), found that
employees who were confident and involved in their jobs performed better than did those
employees whose attitude was negative towards their jobs.

180
According to an SHRM (2016:21) job satisfaction survey, work itself takes the ninth spot in the
top ten job satisfaction contributors. “The work … should motivate employees to perform at
their best and show commitment to the organisation, enhancing work conditions to support the
organisation’s mission and thus impacting on job satisfaction” (Ayers, 2005, cited in Ramasodi,
2010:10).
The circumstances under which employees perform can have as much impact on their
success, comfort and safety in the workplace as do the essential details of the task itself
(Ramasodi, 2010:10). In general, in this study, the respondents were found to be highly
satisfied with the nature of their work in their present job see Table 5.7 on page 163, given
their high rate of positive (yes) responses.
The result is in line with the latest results obtained from the SHRM job satisfaction survey,
which found that 48% of the employees reported that the work itself was imperative for attaining
a sense of job satisfaction (SHRM, 2016:32). Furthermore, the outcome compares very well
with the finding from a study of pharmaceutical companies that scored 62% in terms of facet
on the working conditions [job itself] (Kabir, 2011:117).
Over half (75%; see Table 5.7 on page 163) of the respondents indicated that the nature of the
work itself was highly satisfactory. Differences were, however, found among the various
demographic categories. The outcome compared well with the findings made in the study of
pharmaceutical companies at 62% in terms of facet on the job itself. The same study found
that the work conditions influenced the levels of job satisfaction attained in the enterprises
concerned (Kabir, 2011:117).
The high number of positive scores (see table 5.1 on page 155) (81%, representing 61% of
the male, and 39% of the female, respondents) provided showed that the respondents felt that
they were able to use their abilities in the workplace; with 93% (representing 63% of the male,
and 37% of the female, respondents) revealing that they felt useful in their roles; with 77%
(representing 60% of the male, and 40% of the female, respondents) finding the job
challenging; with 73% (representing 63% of the male, and 37% of the female, respondents)
finding the job satisfying and good; with 86% (representing 63% of the male, and 37% of the
female, respondents) finding that it gave them a sense of accomplishment; with 72%
(representing 60% of the male, and 40% of the female, respondents) feeling that they were
respected; and with 82% (representing 60% of the male, and 40% of the female, respondents)
being able to see the results of their work.

181
Of the respondents, 84% (representing 61% of the male, and 39% of the female, respondents)
found the job itself not boring; with 79% (representing 40% of the male, and 60% of the female,
respondents) found their job not dull; and 86% (representing 63% of the male, and 37% of the
female, respondents) found it not uninteresting.
The aforementioned result could be a reason for the majority of the participants having worked
for more than ten years at the CoW Municipality. It also affirms the fact that the majority were
appropriately qualified, with only 4% being in possession of a Grade 12, or a lower qualification.
The results show that the respondents felt highly confident in their current job.
6.3.2 Perceptions of pay in the current job
According to the SHRM (2016:21), pay remains one of the top five job satisfaction facets, with
it having been the most important facet for employees since 2002. According to Certo
(2010:299), viewing money as a resource to be used for taking care of personal needs is vital.
In addition, it is also seen as the importance that an organisation put on the value of its line
managers.
In today's changing business environment, coupled with uncertainty, pay can have an
enormous impact on the prevailing job satisfaction levels, and, ultimately, on organisational
performance (Hanif & Kamal, 2009:3).
Concerning pay, over half (69%) (see Table 5.7 on page 163) of the respondents indicated
that they were satisfied with their pay. The finding is supported by the study outcome from a
study of pharmaceutical companies, in which the relevant score was 60%.
The same study revealed that the work conditions influenced the levels of job satisfaction
experienced in the enterprise concerned (Kabir, 2011:117).
A significant 77% (see Table 5.2 on page 157) (representing 65% of the male, and 35% of the
female, respondents) stated that they felt that they had enough to live on, and 81% described
their situation as significantly being not bad (representing 65% of the male, and 35% of the
female, respondents).

182
The percentage of those who felt that they were well-paid was 49% (representing 56% of the
male, and 44% of the female, respondents), which was not significantly different than the
percentage (31%) of those employees who felt that they were underpaid (representing 70% of
the male, and 30% of the female, respondents), showing that the percentage for both was very
low. A similar result (38%, representing 68% of the male, and 32% of the female, respondents)
was obtained in response to the question asked as to whether the employees felt that they
were paid less than they deserved.
The above result implies that the workforce was comfortable with their payments. The high
positive scores (77%, representing 65% of the male, and 35% of the female, respondents)
obtained for the pay being enough to live on, and for the pay being fair (73%, representing
61% of the male, and 39% of the female, respondents), seem to suggest that the respondents
were content with their remuneration. The aspect of pay being fair was considered more
positively than was the aspect of being comfortable (72%, representing 57% of the male, and
43% of the female, respondents).
However, a significantly low score was obtained for earning less than one deserved (38%,
representing 68% of the male, and 32% of the female, respondents). Being comfortable with
one's pay received a positive response at 72% (representing 57% of the male, and with 43%
of the female, respondents), indicating that those who earned less than they deserved were
not at all comfortable. The above result clearly shows that the line managers in the CoW
Municipality were satisfied with their pay.
Similarly, there is evidence that some of the respondents were not pleased with one or other
aspect of the statements. The result was in line with the latest results received in response to
the SHRM job satisfaction survey. In their study, the SHRM (2016:21) reported that 65% of the
employees surveyed were satisfied with their overall pay.
Judge et al. (2010:162) concluded that:
“…level of pay had little relation to either job or pay satisfaction. The statement above indicates: that within an organisation, those who make more money are little more satisfied than those who make considerably less. Moreover, relatively well-paid samples of individuals are only trivially more satisfied than relatively poorly paid samples. The findings of this review … that appear in the literature suggest that earnings are only weakly satisfying to individuals even when they confine their satisfaction to an evaluation of their pay.”

183
Job satisfaction is impacted on by an employee's views about the fairness of the company’s
wage scale, as well as about the current compensation that they might be receiving. Dugguh
and Dennis (2014:13), in supporting the above view, opine that pay is not a motivator.
However, staff members want to be paid what they deserve, with them failing to do so leading
to unhappiness among the staff members who, in turn, are likely to decrease their output.
Companies need to have a mechanism in place for evaluating employee performance, and for
providing salary increases to top performers. The opportunity to earn such special incentives
as bonuses, extra paid time off or additional vacations also brings excitement to the workplace,
as well as higher job satisfaction levels.
6.3.3 Perceptions of opportunities for promotion
Career advancement opportunities were in the top five of the contributors to job satisfaction,
with them declining in importance from 2002 onwards (SHRM, 2011:10). However, according
to the SHRM (2016:17), promotion remains a contributor to job satisfaction levels. The SHRM
survey found that, over the last eight years, the importance of promotion has increased by
20%.
Concerning promotion, 32% (see Table 5.7on page 163) of the respondents indicated that they
were satisfied with the opportunities for promotion granted to them (see Table 5.3 see page
158). The result of individual statements indicated very low ‘yes’ scores in such regard. The
outcome observed does not compare with the result of 60% that was obtained in the above
regard in response to a study conducted on the work conditions at pharmaceutical companies.
The same study found that the work conditions, in particular, influenced the levels of job
satisfaction experienced in those companies (Kabir, 2011:117).
The general feeling of the respondents in the current study was that the opportunities for
promotion were limited, with a score of 70% (see Table 5.3 on page 158) (representing 63%
of the male, and 37% of the female, respondents), and very limited, with a score of 66%
(representing 65% of the male, and 35% of the female, respondents), which implies that few
employees (26%, representing 58% of the male, and 42% of the female, respondents)
perceived themselves as having excellent opportunities for promotion. Furthermore, no
significant difference was found in the perceptions regarding the opportunities available for
promotion based on abilities.

184
The result is reflected by the 41% positive outcome in such regard (representing 63% of the
male, and 37% of the female, respondents), as opposed to the 45% ‘no’ outcome (representing
64% of the male, and 36% of the female, respondents). The finding implies that the majority of
the employees were sceptical as to how the promotional processes were handled.
As a result, there was a general feeling among the respondents that they had reached a dead
end in their present jobs, with a score of 34% (representing 68% of the male, and 32% of the
female, respondents), and with a score of 53% (representing 64% of the male, and 36% of the
female, respondents) for those who believed that they had not.
The findings involved could only mean that there were few relatively high positions for which
to aspire, because of the pyramid management structure, and, hence, promotions could not
largely be determined by the qualifications held by the employees.
As such, there were strong indications that promotions were not regular (75%, representing
64% of the male and 36% of the female, respondents). Similarly, the chances for promotion
were perceived as not being fair by 64% of the respondents (representing 64% of the male,
and 36% of the female, respondents).
Opportunity for promotion was an aspect of motivation referred to by Amaoko (2011:2). He
opines that “employee motivation is achieved when employees are faced with challenging but
enjoyable work where one can achieve, grow and demonstrate responsibility and advance in
the organisation". Amaoko (2011:2) concludes that motivation and job satisfaction can be
accomplished when an employee's efforts are rewarded.
The results obtained clearly show that the line managers in the CoW Municipality were not
satisfied with their opportunities for promotion. Promotion happens when a staff member
changes jobs in an upward direction within an organisational structure, so as to assume more
responsibility and accountability than before (Dessler, 2008, cited in Naveed, et al., 2011:301).
Staff members tend to become more satisfied with their current job if they believe that there is
an opportunity for growth in the organisation, along with the acceptance of more
responsibilities, and, along with it, higher compensation than before. Promotion comes with an
increased salary, and with a larger span of authority and control, then before, hence the
previously mentioned increase in responsibility. When staff members feel that they contribute
to their workplace, they tend to be more satisfied with it than they might otherwise have been.

185
According to Naveed et al. (2011:301), promotion “is a predictor of job satisfaction”. Effective
supervisors know that their employees require recognition and praise for their efforts and
accomplishments.
6.3.4 Perceptions of supervision given (question four)
Supervision, comprising “technical and general supervision in the organisation”, plays a crucial
role in the job satisfaction of staff members (Dugguh & Dennis, 2014:13). According to Young
(2009, cited in Ogunsina, 2011:13), “supervisory behaviour has become the impending
scourge to the development and success of organisations (both public and private) in the
country". The relationship between the subordinate and their supervisors is, thus, very
significant, taking the sixth place concerned, since 53% of the respondents perceived it to be
important (SHRM, 2011:28).
Supervision, as a hygiene factor, is closely related to the working environment, being similar
to Maslow's lower needs, and being responsible for preventing dissatisfaction among the
employees involved (Smit et al., 2008:246). Concerning supervision (see Table 5.7 on page
163), slightly more than half (58%) of the respondents indicated that they were satisfied with
the supervision that they received. The outcome involved compares very well with the 56%
outcome of a study that was done on pharmaceutical companies, in terms of the level of work
conditions. In the same study, the working conditions were found to influence the job
satisfaction levels at the enterprises concerned.
A significant high percentage of ‘yes’ scores was obtained (see Table 5.4 on page 159) (71%,
representing 58% of the male, and 42% of the female, respondents) in response to the
statement that the supervisors were supportive, with the scores for the supervisors being 69%
(representing 59% of the male, and 41% of the female, respondents) for them being intelligent;
68% (representing 59% of the male, and 41% of the female, respondents) for them being
around when needed; and 60% (representing 60% of the male, and 40% of the female,
respondents) for them being tactful.
The above percentages were followed by the just over 50% scores, with 59% (52% male and
48% female) indicating that their supervisors knew their job well; 56% (57% male and 43%
female) stating that they were influential; 52% (54% male and 48% female) indicating that they
were up-to-date; and 51% (58% male and 42% female) mentioning that they praised the
performance of good work.

186
Furthermore, the participants indicated (see Table 5.4 on page 159) that their supervisors were
not: unkind (91%, representing 63% of the male, and 37% of the female, respondents); impolite
(84%, representing 60% of the male, and 40% of the female, respondents); bad (80%,
representing 63% of the male, and 37% of the female, respondents); lazy (79%, representing
56% of the male, and 42% of the female, respondents);
annoying (75%, representing 63% of the male, and 37% of the female, respondents); stubborn
(72%, representing 63% of the male, and 37% of the female, respondents); poor planners
(65%, representing 57% of the male, and 43% of the female, respondents); and hard to please
(64%, representing 63% of the male, and 38% of the female, respondents). Of the total
percentage, 53% (representing 63% of the male, and 37% of the female, respondents) of the
respondents stated that their supervisors had no favourites.
However, there was no clear indication of whether the supervisors had favourites, with the ‘yes’
percentage in such regard being 32% (representing 63% of the male, and 37% of the female,
respondents) and the ‘no’ percentage being 53% (representing 63% of the male, and 37% of
the female, respondents).
In relation to the supervisors knowing the job well, 59% (52% of the male and 48% female)
said ‘yes’, whereas 23% (representing 82% male, and 18% female, respondents) said ‘no’; in
relation to the supervisors being up-to-date, 52% (representing 54% of the male, and 48% of
the female, respondents) said ‘yes’, whereas 36% (representing 81% of the male, and 19% of
the female, respondents) said ‘no’; in relation to the supervisors making the employees aware
of where they stood, 37% (50% of the male, and 50% of the female, respondents) said ‘yes’,
whereas 48% (representing 78% of the male, and 22% of the female, respondents) said ‘no’;
and in relation to the supervisors clearly praising good work, 51% (representing 58% of the
male, and 42% of the female, respondents) said ‘yes’, whereas 40% (60% of the male, and
40% of the female, respondents) said ‘no’.
6.3.5 Perceptions of the respondents’ relationships with their co-workers (question
five)
The relationship with co-workers was rated second on the survey list during the 2012 job
satisfaction and engagement survey, with it tending to be prioritised more highly by the female
staff members involved (SHRM, 2012:35). During their study, the SHRM (2012:35), found that
the staff members concerned indicated that 40% of their relationships with their co-workers
were necessary, and that 79% were satisfied with their relationships with their colleagues.

187
In 2016, 40% of the staff members reported that their relationships with their colleagues were
important, with 77% stating that they were happy with such relationships (SHRM, 2016:33).
Additionally, the SHRM (2012:34) opines that a "relationship with co-workers is important to
their success at work”. A positive relationship can nurture a “sense of loyalty, camaraderie,
and moral support and engagement among staff” (SHRM, 2016:33).
Responses to the perceptions regarding the relationships of the respondents with their co-
workers indicated a high positive rating of 67% and a slightly lower negative rating (63%), on
average (see Table 5.7 on page 163). The outcome compares very well with the outcome of
the study undertaken into the pharmaceutical companies, which scored 66% in the above
regard (Kabir, 2011:117).
The current study found further that 78% of the respondents (see Table 5.5 on page 160)
(representing 66% of the male, and 34% of the female, respondents) found their co-workers
likeable; 73% (representing 61% of the male, and 39% of the female, respondents) found them
helpful; 73% (representing 62% of the male, and 38% of the female, respondents) found them
supportive; 72% (representing 62% of the male, and 38% of the female respondents) found
them intelligent; 69% (representing 63% of the male, and 37% of the female, respondents)
found them responsible; 68% (representing 60% of the male, and 40% of the female,
respondents) found them smart; 55% (representing 63% of the male, and 37% of the female,
respondents) found them stimulating; and 51% (representing 63% of the male, and 37% of the
female, respondents) found them active.
Furthermore, 89% (see Table 5.5 on page 160) (representing 60% of the male, and 40% of
the female, respondents) did not find their colleagues stupid; 79% (representing 64% of the
male, and 36% of the female, respondents) did not find them boring; 70% (representing 69%
of the male, and 31% of the female, respondents) did not find them unpleasant; 70%
(representing 63% of the male, and 37% of the female, respondents) did not find them rude;
60% (representing 67% of the male, and 33% of the female, respondents) did not find them
easy to make enemies of; 52% (representing 63% of the male, and 37% of the female,
respondents) did not find them slow; 52% (representing 61% of the male, and 39% of the
female, respondents) did not find them lazy; 51% (representing 73% of the male, and 27% of
the female, respondents) did not find them of narrow interests; 51% (representing 62% of the
male, and 38% of the female, respondents) did not find them frustrating; and 51% (representing
68% of the male, and 32% of the female, respondents) did not find them stubborn.

188
What is striking about the above results, even if they do indicate a positive outcome, is the fact
that the respondents failed to rate many elements highly, giving the effect that the respondents
were not entirely satisfied with their co-workers. Clearly, there was room for continuous
improvement (in terms of the work to be done) by the management concerned, because they
expected the employees to improve their performance by cooperating with one another.
The studies that were done regarding the level of affiliation experienced with co-workers at the
pharmaceutical companies surveyed, to which reference has previously been made, found that
the respondents were “somewhat unhappy”. They also concluded that the relationships with
co-workers influenced the levels of job satisfaction experienced at the companies (Kabir,
2011:117). Accordingly, it is clear that the CoW management could pay attention to the aspect
involved by encouraging the line managers concerned to build relationships within the work
environment that could serve to enhance their job satisfaction and efficiency levels.
6.3.6 Perceptions on the JIG scale
The JIG scale was designed to measure the employees' levels of satisfaction with their jobs.
"The JIG is a measure of global satisfaction, meaning that participants are asked to think about
how satisfied they are with their job in a broad, overall sense" (BGSU, 2009). It was important
to measure the different facets, or dimensions, of satisfaction presented in subsections 6.3.1
to 6.3.6. Increased productivity, commitment and employee retention are the result of elevated
employee job satisfaction levels (SHRM, 2010:33). The overall job satisfaction of US
employees was found to be 84% in 2010 (SHRM, 2010:34).
Responses to the perceptions of the job satisfaction levels in relation to the overall job indicated
a high ‘yes’ score of 64% and a high ‘no’ score of 82% (see Table 5.7 on page 163). In general,
92% of the respondents (representing 62% of the male, and 38% of the female, respondents)
found their job acceptable; 91% of them (representing 65% of the male, and 35% of the female,
respondents) found their job good; 83% of them (representing 61% of the male, and 39% of
the female, respondents) find their job worthwhile; 79% of them (representing 66% of the male,
and 34% of the female, respondents) perceived their job pleasant; 75% of them (representing
65% of the male, and 35% of the female, respondents) found their job enjoyable; 53% of them
(representing 65% of the male, and 35% of the female, respondents) opined that their job was
great; and 53% of them (representing 55% of the male, and 45% of the female, respondents)
regarded their job as better than most.

189
The respondents scored very low (see Table 5.6 on page 161) (43%, representing 63% of the
male, and 37% of the female, respondents) on the dimension that their job made them content;
with 41% (representing 61% of the male, and 39% of the female, respondents) stating that
their job was excellent, and, finally, 34% (representing 48% of the male, and 52% of the female,
respondents) rating their job as superior.
In terms of the opinions expressed on the superiority of the respondents’ job (34%),
significantly divergent views were noted between the genders (in the case of 48% of the male,
and 52% of the female, respondents). The finding implies that the respondents were uncertain
on the measure, probably because of the lack of benchmarks involved.
A similar outcome was also reflected in terms of ‘the job, in general, makes me content’ (43%)
and ‘my job, in general, is excellent’ (41%). The above outcome could be observed by the lack
of clear percentage difference in the scores involved (‘yes’, ‘no’ and ‘not sure’), as reflected in
Table 5.6.
6.4 Central tendency and dispersion
Descriptive statistics, in the form of arithmetic means and SDs, were computed for the JDI
facet and for the JIG scale (in terms of the JDI and JIG questionnaire). The JDI and JIG
questionnaire was designed to measure how people felt about the job that they were currently
doing. The questionnaire measures how satisfied the line managers in the CoW Municipality
were on particular work facets (work on present job, present pay, and opportunities for
promotion, supervision, co-workers, and the JIG).
The statistics indicated in section 5.4 on page 164 were the mean, the SD, and the statistical
reliability of each job facet concerned. The scores on each facet could range from 0 (completely
unsatisfied) to 54 (completely satisfied). The rule of thumb applied was that the scores ranging
from 0 to 22 were considered ‘unsatisfied’, with the scores from 23 to 31 being considered
‘neutral’, and the scores from 32 to 54 being considered ‘satisfied’ (Nicholas, 2017). An
examination of the means indicates that the current sample was highly satisfied on every facet,
except on opportunity for promotion (M = 17.86).
The line managers were most satisfied with the facets work on present job (M = 41.74); JIG
(M = 41.15); pay (M = 37.68); supervision (M = 37.56); and people on the present job (M =
37.38) see Table 5.8 on page 160. They were, however, not satisfied with the facet
opportunities for promotion (M = 17.86.10).

190
However, the mean for work was found to be high at 41.74, while that for promotion being
found to be the lowest, at 17.86. The statistics further reveal that the promotion facet elicited
most dissatisfaction from the respondents.
The SD indicates how far away the average score in the sample is from the mean. In other
words, in the current study, a higher SD was associated with a larger amount of variation in
the level of job satisfaction attained. The SD per facet is shown as the highest score for the
opportunity for promotion (17,62); followed by that for pay (15,52); supervision (14,40); co-
workers (13,52); the work itself (11,55); and the JIG (11,12), with the latter being the lowest.
The above statistics indicate the relatively large amount of variation in how satisfied the
respondents were, especially in terms of promotion and pay.
The reliability of each JDI facet and of the JIG scale indicates how accurate the measure was
at assessing the prevailing levels of job satisfaction, meaning that a higher reliability indicated
more accuracy, given that a reliability of .70 was considered acceptable. The reliability of each
facet in the current sample was found to be very good (work itself = 0,87; pay = 0,84;
opportunity for promotion = 0,91; supervision = 0,91; co-workers = 0,90; and JIG = 0,86.
Overall, the line managers were satisfied with their jobs. They were, however, not as pleased
with the facet on opportunities for promotion, as they were on the other facets of: work on the
present job; pay; supervision; and co-workers (tables 5.7 see page 163 and 5.8 see page 164).
6.5 Bivariate correlation
A bivariate correlation is a statistical technique that reveals whether two variables are related
(Bryman & Bell, 2007:360). The assertion is supported by the Research Methods Knowledge
Base (n.d.), which is of the opinion that "correlation is a single number that describes the
degree of relationship between two variables". According to the University of the West of
England (n.d.), correlation is a technique for investigating the relationship between two
quantitative variables. The technique is a test for measuring the amount of significance of a
correlation between two variables.
As was stated in Chapter Five, the Spearman’s rank correlation coefficient (Spearman’s rho)
was used for the correlation analysis in the current study to quantify the strength, as well as
the direction, of the relationship concerned. The Spearman’s rho is a non-parametric test that
measures the amount, and the significance, of a correlation between two variables.
191
The Spearman’s rho, which has been tested over time, is one of the most popularly and widely
used of business and management research association measures that are aimed at testing
the strengths of the linear relationship between two variables (Saunders et al., 2012:521).
Bryman and Bell (2007:361) profess that correlation does not mean causality, but it provides
important associations between the variables concerned, which is an assertion that is
supported by Saunders et al. (2012:521). The authors say that, although correlation does not
mean causality, it does reveal important associations between the variables involved.
The correlation coefficient uses any value between –1 and +1, with the closer the –1 and +1,
the closer is the relationship between the two variables concerned (Bryman & Bell, 2007:362;
Saunders et al., 2012:521). Thus, the correlation coefficient is either positive or negative, thus
indicating its direction. The correlation coefficients are reported as r (rho) = a value between -
1 and +1 (keeping in mind that squaring them makes then easier to understand).
The correlation coefficient, which is useful, is frequently used by researchers. The square of
the coefficient (or r squared) is equal to the percentage of the variation in one variable that is
related to the variation in the other. The above is called the “coefficient of determination, which
expresses how much of the variation in one variable is due to the other variable” (Bryman &
Bell, 2007:364).
The interpretation of the results of a correlation coefficient analysis only explore the level of
significance of the correlation coefficient concerned (Saunders et al., 2012:521). According to
Bryman and Bell (2007:368), a "test of statistical significance allows the analyst to estimate
how confident he or she can be that the results are deriving from a … are generalisable to the
population from which the sample was drawn”.
The aim of the interpreted results was not to establish cause-and-effect relationships. The
result only shows how, or to what extent, two variables (taking into account the elements within
the facets) relate to each other, and whether the relationship is significant, either positively or
negatively, as well as its related strength. The interpretation of the results of the correlation
analysis only explored the level of significance of the correlation coefficient, whereby the
correlation coefficient was found not to be significant, thus it was neither interpreted, nor
discussed.
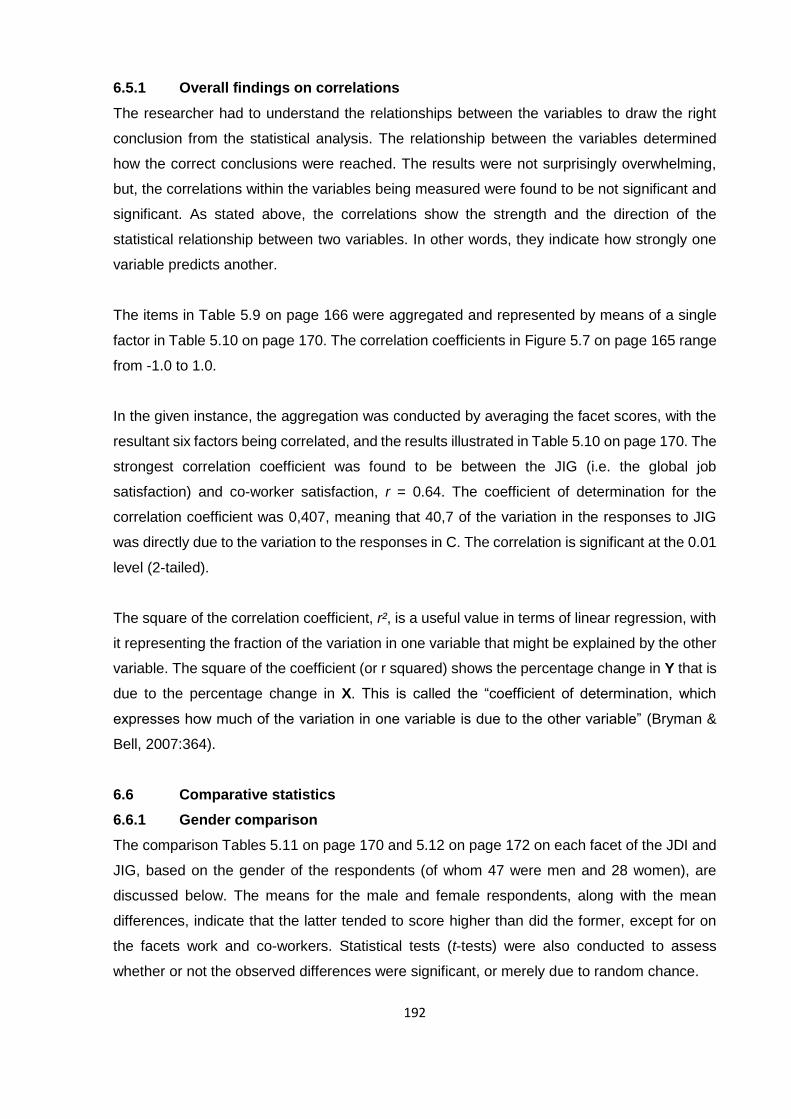
192
6.5.1 Overall findings on correlations
The researcher had to understand the relationships between the variables to draw the right
conclusion from the statistical analysis. The relationship between the variables determined
how the correct conclusions were reached. The results were not surprisingly overwhelming,
but, the correlations within the variables being measured were found to be not significant and
significant. As stated above, the correlations show the strength and the direction of the
statistical relationship between two variables. In other words, they indicate how strongly one
variable predicts another.
The items in Table 5.9 on page 166 were aggregated and represented by means of a single
factor in Table 5.10 on page 170. The correlation coefficients in Figure 5.7 on page 165 range
from -1.0 to 1.0.
In the given instance, the aggregation was conducted by averaging the facet scores, with the
resultant six factors being correlated, and the results illustrated in Table 5.10 on page 170. The
strongest correlation coefficient was found to be between the JIG (i.e. the global job
satisfaction) and co-worker satisfaction, r = 0.64. The coefficient of determination for the
correlation coefficient was 0,407, meaning that 40,7 of the variation in the responses to JIG
was directly due to the variation to the responses in C. The correlation is significant at the 0.01
level (2-tailed).
The square of the correlation coefficient, r², is a useful value in terms of linear regression, with
it representing the fraction of the variation in one variable that might be explained by the other
variable. The square of the coefficient (or r squared) shows the percentage change in Y that is
due to the percentage change in X. This is called the “coefficient of determination, which
expresses how much of the variation in one variable is due to the other variable” (Bryman &
Bell, 2007:364).
6.6 Comparative statistics
6.6.1 Gender comparison
The comparison Tables 5.11 on page 170 and 5.12 on page 172 on each facet of the JDI and
JIG, based on the gender of the respondents (of whom 47 were men and 28 women), are
discussed below. The means for the male and female respondents, along with the mean
differences, indicate that the latter tended to score higher than did the former, except for on
the facets work and co-workers. Statistical tests (t-tests) were also conducted to assess
whether or not the observed differences were significant, or merely due to random chance.

193
6.6.2 Overall findings on gender comparison
Based on the result (see Tables 5.11 on page 170 and 5.12 on page 172), the conclusion
drawn is that the male and female respondents did not differ significantly on any JDI facet and
JIG scale (with the ρ-values for work itself being 0,69; for pay being 0,51; for the opportunities
for promotion being 0,83; for supervision being 0,111; for co-workers being 0,90; and for the
JIG being 0,92). The ρ-value for all facets was found to be >0,05 level (2-tailed), with it meant
to be less than 0,05. The results obtained indicate the possibility that the differences between
the scores of the male and female respondents in the study occurred randomly. In other words,
statistically speaking, the possibility that the men and women involved did not differ significantly
on each facet in the population from which the sample came could not be ruled out.
6.6.3 Age comparison
Comparisons were made based on age (see Table 5.13 on page 174). A one-way ANOVA
(see Table 5.13 page 174) was conducted on each facet to assess whether or not the observed
differences were significant, or merely due to random chance. No further test was done, since
the result indicated that the difference was found not to be significant.
6.6.4 Overall findings on the age comparison
According to Anderson, et al. (2009:295), the "ρ-value is a probability, computed using the test
statistic, which measures the support (or lack of support) provided by the sample for the null
hypothesis". Overall, the "smaller the ρ-value, the less support it indicates for the null
hypothesis". The test statistic means that a small ρ-value influences the rejection of the null
hypothesis.
Based on the result, as indicated in Table 5.13 page 174, the ρ-value was indicated for the
following facets: for work itself for all three groups (the 21–40-year-olds, the 41–50-year-olds,
and those 51 years old, or older), the ρ-value = 0,085; for pay for all three groups (the 21–40-
year-olds, the 41–50-year-olds, and those 51 years old, or older), the ρ-value = 0,322; for the
opportunity for promotion for all three groups (the 21–40-year-olds, the 41–50-year-olds, and
those 51 years old, or older), the ρ-value = 0,455; for supervision for all three groups (the 21–
40-year-olds, the 41–50-year-olds, and those 51 years old, or older), the ρ-value = 0,71; for
relationships with co-workers for all three groups (the 21–40-year-olds, the 41–50-year-olds,
and those aged 51 years, or older), the ρ-value = 0,064; and for the JIG for all three groups
(the 21–40-year-olds, the 41–50-year-olds, and those aged 51 years, or older), the ρ-value =
0,088. The ρ-value for all facets is >0,05 level (2-tailed), with it meant to be less than 0,05.

194
6.7 Research hypothesis
A hypothesis test examines two opposing hypotheses about a population: the null (H0)
hypothesis, and the alternative hypothesis (H1). The H0 hypothesis states that a population
parameter is equal to a value. It is often an initial claim, made using previously acquired
research or knowledge. The H1 hypothesis states that the population parameter is different to
the value of the population parameter in the null hypothesis. The alternative hypothesis is what
is believed to be true or what is hoped to be possible to prove true (Anderson et al., 2009:287-
291).
6.7.1 Hypothesis 1: finding
The first null hypothesis of the study, H0 (null), was stated, as there was no statistically
significant correlation between the job satisfactions of the line managers on the job satisfaction
facets, which were: (a) the work itself; (b) the pay; (c) the opportunity for promotion; (d) the
supervision; (e) the co-workers; and (f) the JIG. The corresponding alternative hypothesis, H1
(alternative), was that there was a statistically significant correlation between the job
satisfaction of the line managers on the job satisfaction facets, which were: (a) the work itself;
(b) the pay; (c) the opportunity for promotion; (d) the supervision; (e) the co-workers; and (f)
the JIG.
Based on the results, as depicted in Table 5.9 page 166, the correlation between the different
facets ranges between the work itself and pay (r = 0,14, ρ = 0.234), being the lowest, and the
co-workers and the JIG (r = 0,64, ρ = 0,00) being the highest. The relationship between the
work itself and pay were found to be r = 0,14, ρ = 0,234; between work itself and the opportunity
for promotion being r = 0,174, ρ = 0,143; between the work itself and supervision being r =
0,280, ρ = 0,016; between the work itself and co-workers being r = 0,463, ρ = 0,001; and
between the work itself and the JIG being r = 0,458, ρ = 0,001.
The relationship between pay and the opportunity for promotion was found to be r = 0,419, ρ-
value = 0,001; between pay and supervision being r = 0,518, ρ-value = 0,001; between pay
and the co-workers being r = 0,385, ρ-value = 0,001; and between pay and the JIG r = 0,272,
ρ-value = 0,004. The relationship between opportunity for promotion and supervision was
found to be r = 0,332, ρ-value = 0,004; between opportunity for promotion and the co-workers
being r = 0,442, ρ = 0,001, and between opportunity for promotion and the JIG being r = 0,280,
ρ = 0,016.

195
The relationship between supervision and the co-workers was found to be r = 0,552, ρ = 0,001,
and between supervision and the JIG being r = 0,306, ρ = 0,008.
To conclude the above enumeration, the relationship between co-workers and the JIG was
found to be r = 0,64, ρ = 0,001.
As stated above, the correlation between the work itself, pay, the opportunity for promotion,
the co-workers, and the JIG was indicated. Correlation, as is known, is a statistical tool that is
used to measure the linear relationship between two or more variables.
The value of the correlation coefficient ranges from -1.00 to +1.00. The value of +1.00
represents a perfect positive correlation, whereas the value of -1.00 represents a perfect
negative correlation. A value of 0.001 represents the absence of a relationship (Bryman & Bell,
2007:362; University of Texas at Austin, 2012:15).
The work itself and pay and the work itself with opportunity for promotion shows a weak uphill
(positive) linear relationship, among the six variables (r = 0,14, ρ = 0,234 and r = ,0174, ρ =
0,143 respectively). Clearly, there is no significant relationship, since the ρ-value is >0,05, as
it should be <0,05. For the above findings, the null hypothesis is accepted.
The rest of the variable, as indicated above, shows a moderate to strong uphill (positive) linear
relationship, since their ρ-value is <0,05, hence the rejection of the null hypothesis for the
facets concerned.
6.7.2 Hypothesis 2: finding
The second null hypothesis of the study, H0 (null), was stated, as there was no statistically
significant difference between men and women on the job satisfaction facets, which were (a)
the work itself; (b) the pay; (c) the opportunity for promotion; (d) the supervision; (e) the co-
workers; and (f) the JIG.
The corresponding alternative hypothesis, H1 (alternative), was that there was a statistically
significant difference between men and women as a statistically significant correlation of the
line managers on the job satisfaction facets, which were: (a) the work itself; (b) the pay; (c) the
opportunity for promotion; (d) the supervision; (e) the co-workers; and (f) the JIG.
196
To analyse the differences between two groups, a t-test is required to test the difference of
means between the groups (Steinberg, 2011:289). According to Frost (2016), “a test statistic
is a standardised value that is calculated from sample data during a hypothesis test”.
Similarly, the Investopedia (n.d.) refers to a t-test as "an analysis of two populations’ means
through the use of statistical examination”.
The aim of the t-test usually is to try to find evidence of a significant difference between
population means (2-sample t) by comparing the means of two groups. The test measures the
size of the difference, relative to the variation in the sample data. The t-test is frequently used
to test the probability of difference between two populations, and, if the sample findings are
unlikely, given the null hypothesis, the null hypothesis is rejected.
Typically, the above involves comparing the ρ-value to the significance level, and rejecting the
null hypothesis, when the ρ-value is less than the significance level (Stat Trek, n.d.).
Based on the results in Table 5.11 page 170, the ρ-value for work itself 0,699; for pay is 0,510;
for opportunity for promotion is 0,832; for supervision is 0,111; for co-workers is 0,896; and for
JIG is 0,917. The results indicate that the difference was no significant difference between the
gender groups of the line managers, and since the ρ-value for all facets was found to be greater
than 0,05, the null hypothesis was accepted.
6.7.3 Hypothesis 3: finding
The second null hypothesis of the study, H0 (null), was stated as there were no statistically
significant differences between age groups on different facets, which were: (a) the work itself;
(b) the pay; (c) the opportunity for promotion; (d) the supervision; (e) the co-workers; and (f)
the JIG.
The corresponding alternative hypothesis, H1 (alternative), was that there were statistically
significant differences between the different age groups on the job satisfaction facets, which
were: (a) the work itself; (b) the pay; (c) the opportunity for promotion; (d) the supervision; (e)
the co-workers; and (f) the JIG.
To analyse the differences between three groups and more, an F statistic test was needed to
test the group “variance measure to describe the mean differences between all groups”
(Steinberg, 2011:290).

197
Similarly, Laerd statistics (n.d.) states that a "one-way analysis of variance (ANOVA) is used
to determine whether there are any statistically significant differences between the means of
three or more independent (unrelated) group".
The significant differences identify where, and how, the age groups differ on different facets of
the JDI facets (work, supervision, co-workers, and JIG). The analysis is used to test the null
hypothesis by comparing the variance between the group’s means to determine whether any
of the means are statistically significantly different from each other (Laerd statistics, n.d.).
Typically, the above involves comparing the ρ-value to the significance level, and rejecting the
null hypothesis, when the ρ-value is less than the significance level (Stat Trek, n.d.).
Based on the results in section 5.13 on page 174, the ρ-value for: work itself is 0,085; pay is
0,322; opportunity for promotion is 0,455; supervision is 0,071; co-workers is 0,064; and JIG
is 0,055. The results indicate that the difference is not significant between the age groups of
the line managers, leading to the acceptance of the null hypothesis.
6.8 Assumptions
The current study was conducted based on the following assumptions, namely that:
the CoW line managers were not satisfied with some facets of their jobs, including the work itself, the pay, the opportunity for promotion, the supervision, the co-workers, and the JIG;
the participants would answer the research questions truthfully and accurately, based on their personal experience;
the participants would respond honestly and to the best of their ability; and
the top management concerned could use the recommendations of the research report.
6.9 Validation of assumptions
The statistics strongly indicate that the line managers were highly satisfied with five facets (the
work itself, the pay, the supervision, the co-workers, and the JIG), but not with another
(opportunity for promotion). The finding is illustrated in Table 5.8 on page 164. Furthermore,
the assumptions given in subsections 6.13.2 and 6.13.3 were validated by the alpha values,
as presented in Table 5.8 on page 164. In terms of the assumption presented in subsection
6.10.4, only time will tell if the management of the CoW Municipality will make use of the
recommendations provided.

198
6.10 The job satisfaction, hygiene and motivating factors relating to performance
management (PM)
One of the research questions pertained to whether hygiene and motivating factors impacted
on the poor job performance of CoW Municipality line managers. According to Huczynski and
Buchanan (2007:258), the "hygiene factors aspects of work which remove dissatisfaction but
do not contribute to motivation and performance, including pay, company policy, supervision,
status, security and working conditions” are related to the organisational context. Furthermore,
the above-mentioned authors state that motivators are aspects of work that lead to high levels
of satisfaction, including in relation to motivation and performance.
Such motivators include achievement, recognition, responsibility, advancement, growth, and
the work itself, in relation to the job context. Only pay and supervision, as the hygiene factors,
and the work itself, the opportunity for promotion, and the co-workers, as the motivating factors,
are discussed in the current study.
A performance management system is known for enhancing the competitive edge (Bratton &
Gold, 2007). However, the understanding for a PM to be successful, most of the hygiene and
motivating factors must be implemented and managed to a high degree.
Similarly, Robbins et al. (2009:145) and Robbins and Judge (2011:239) opine that, once a
relatively low need has been satisfied, it ceases to play a role in satisfying a relatively high
need. Additionally, according to Amaoko (2011:1), employees’ job satisfaction is somehow
linked to their motivation, in terms of ensuring effective performance, which is subject to stress.
6.10.1 Pay (hygiene factor) and job satisfaction
The statistical results in terms of the motivation factors in relation to pay revealed that over half
(69%) (see Table 5.7 on page 163) of the respondents indicated that they were satisfied with
their pay. According to Khalid et al. (2012:128), pay is a “very primary factor of satisfaction for
almost every type of employee …”, despite the fact that the authors express indecision relating
to its influence on job satisfaction and performance.
Oshagbemi (2000, cited in Khalid et al., 2012:128) concludes that a statistically significant
relationship exists between pay and level of job satisfaction. Conversely, Bassett (1994, cited
in Khalid et al., 2012:128) opines that there is a lack of proof that pay on its own “improves
employee’s [job] satisfaction or reduces dissatisfaction”.

199
Similarly, Young, Worchel and Woehr (1998, cited in Khalid et al., 2012:128) failed to find a
significant relationship between pay and job satisfaction.
6.10.2 Supervision (hygiene factor) and job satisfaction
In terms of supervision (see Table 5.7 on page 158), over half (58%) of the respondents
indicated that they were satisfied with the supervision that they received. The establishment of
supervisory support is critical in creating a sense of job satisfaction (Robbins et al., 2003, cited
in Khalid et al., 2012:128). According to Peterson and Puia (2003, cited in Khalid et al.,
2012:128), a positive relationship exists between job satisfaction and supervision.
Packard and Kauppi (1999, cited in Khalid et al., 2012:128) established that employees with
supervisors “having a democratic management style experienced the higher level of
satisfaction than [did those] with [an] autocratic leadership style".
6.10.3 Work itself (motivating factor) and job satisfaction
The statistical results in terms of the motivation factors in relation to the work itself revealed
that over half (75%) (see Table 5.7 on page 163) of the respondents indicated that they were
satisfied with the facet. Robbins et al. (2003, cited in Rast & Tourani, 2012:93) state that work
itself is “the extent to which the job provides the individual with stimulating tasks, opportunities
for learning and personal growth, and the chance to be responsible and accountable for
results”. Furthermore, in a study by Khaleque and Choudahary (1984, cited in Rast & Tourani,
2012:93), on Indian managers, the work itself was found to be an essential factor in terms of
job satisfaction.
According to Griffen and Moorhead (2009, cited in Rast & Tourani, 2012:93), the work itself
has "a significant effect" on the employees. Similarly, Sharma and Bhaskar (1999, cited in Rast
& Tourani, 2012:93) accept that the significant enhancement of job satisfaction depends on
the job allocated to the employee.
6.10.4 The opportunity for promotion and job satisfaction (motivating factor)
The statistical results in terms of the motivation factors in relation to the opportunity for
promotion revealed a very low percentage (32%) (see Table 5.7 on page 163) of the
respondents who indicated that they were satisfied with the facet. Likewise, David and Wesson
(2000, cited in Rast & Tourani, 2012:93) advocated that "limited opportunities for promotion
were common in public sector organisations thereby discouraging the qualified employees
from remaining on the job".

200
According to Ellickson and Logsdon (2002, cited in Rast & Tourani, 2012:93), various authors
see a correlation between job satisfaction and the opportunity for promotion. In addition,
Kreitner and Kinicky (2004, cited in Rast and Tourani, 2012:93) stress the fact that the aspect
of fairness is critical to a sense of job satisfaction resulting in the promotion of the employee’s
concerned. According to Rast and Tourani (2012:94), the level of job satisfaction tends to drop
where employees have relatively few advancement prospects.
6.10.5 Co-workers (motivating factor) and job satisfaction
The statistical results in terms of the motivation factors in relation to the co-workers revealed
a very high percentage (67%) (see Table 5.7 163) of the respondents who indicated that they
were satisfied with the facet concerned. Correspondingly, a survey completed by Berta (2005)
cited in Khalid et al. (2012:128) found "that positive relationship with fellow workers enhances
job satisfaction". Viswesvaran, Deshpande and Joseph (1998, cited in Khalid et al., 2012:128)
confirmed earlier findings that “there is a highly positive correlation between job satisfaction
and co-workers”.
The sense of job satisfaction is enhanced when colleagues are friendly and supportive
(Kreitner & Kinicki, 2001, cited in Khalid et al., 2012:128). Contrary to the above, Madison
(2000, cited in Khalid et al., 2012:128) opines that those employees who lack support from
their colleagues are more likely to be dissatisfied with their jobs.
The statistical results in relation to the hygiene and motivating factors, and the discussion in
6.8, revealed that the respondents indicated that they were satisfied with all but one of the
facets of their jobs, being the opportunity for promotion. However, minor differences were found
among the different demographic categories, as depicted in subsections 6.3.1 on page 180
and 6.3.3 on page 183.
The CoW Municipality evidently did put adequate hygiene factors, such as pay, in place, as
well as employing relatively good supervisors. The hygiene factors alone could have made the
work more exciting, and therefore stimulating, resulting in high performance. However, such
hygiene factors as the supervisors not being “up to date”, them “not telling employees where
they stood”, and “not being influential” must be corrected to satisfy the employees and to
improve their performance subsequently.
Although having a good salary and an effective supervisor cannot lead to satisfaction, the
absence of such hygiene factors can result in the employees being dissatisfied with their jobs.

201
It can, further, be noted that, while the CoW Municipality has implemented hygiene factors
adequately, the workers were expected to perform well, and mostly based on the hygiene
factors that were well-implemented. Hence, the employees could not feel dissatisfied with their
jobs. The non-performance of employees can only be attributed to the hygiene factors
involved. Thus, it can be concluded that, in CoW Municipality, the hygiene factors did not
impact on poor job performance.
Such factors as the work itself, the opportunity for promotion, and the co-workers, can only
demotivate employees if they are negative towards them. The study result indicated that only
the opportunity for promotion scored very low, and thus could have served to demotivate the
employees. For example, the fact that the respondents did not see themselves as being likely
to have an opportunity for regular promotion might have made the implementation of PMS
somewhat difficult. Alternative rewards would, thus, be required to motivate the employees in
this regard, so that they can maintain their current positions, while feeling equally useful and
satisfied. Hence, the efforts made to implement the PMS could be supported by policies that
are inclined to increase the levels of employee motivation and, consequently, satisfaction.
Such attachment mostly happens if an employee's expectations are met, which is likely to
trigger a sense of accomplishment.
6.11 Summary
Chapter Six has discussed the results obtained from the research instrument, starting with a
brief interpretation of the biographical findings of the sample. The discussion was followed by
the interpretation of the results that were obtained in response to the JDI and JIG
questionnaire. The responses to the questions asked in the questionnaire yielded the following
outcomes per facet. In general, both the male and the female respondents perceived the facet,
work itself, to be satisfying.
They indicated that they could use their abilities, that they felt useful, that they found their jobs
challenging and good, that their work gave them a sense of accomplishment, that they were
respected, that they could see the results of their efforts, that their work was satisfying,
fascinating, exciting, and rewarding, and that they were allowed to be creative, Furthermore,
they indicated that they did not find their jobs boring, dull and uninteresting, routine, simple,
and repetitive.

202
Regarding the pay facet, most of the respondents were satisfied with the amount of pay that
they received. They indicated, in addition to them thinking themselves well-paid, that their pay
was adequate for their normal expenses, fair, comfortable, and enough to live on. They,
however, indicated that their pay was barely enough to live on, bad, and less than they
deserved. However, there was little difference between those who felt they were not well-paid
and those who felt that they were well-paid. The statistics imply that the respondents were just
about comfortable with their pay.
Regarding the facet opportunities for promotion, the respondents declared that they were
dissatisfied with the limited opportunities available (with there being few higher positions to
which to aspire), in terms of the way in which promotions were handled in the past.
Clearly, given the managerial structure, promotions could not largely be determined by the
qualifications held by the employees involved, because the opportunities involved were limited,
as the respondents indicated. As a result, there was a general feeling that they had not reached
a dead end in their present jobs. No clear difference was evident between the respondents
who said that promotion was not awarded on the basis of ability and those who agreed that
promotion was done on such a basis.
Regarding the facet supervision, the respondents noted that they were happy that their
supervisors were supportive, polite, intelligent, good, kind, not annoying, and easy to please.
There was, however, no clear proof that the supervisors had favourites, were up-to-date, knew
their job well, made the employees aware of where they stood regarding performance, or that
they praised good work. Furthermore, the respondents found their supervisors moderately
influential.
Regarding the facet co-workers, the respondents expressed a high level of satisfaction with
their co-workers in respect of them being helpful, responsible, likeable, intelligent, clever, and
neither boring, nor rude. However, more male respondents than female respondents found
them stubborn and frustrated. Furthermore, the respondents found that their male co-workers
were more positive than were their female co-workers, except in terms of the perception that
their co-workers were rude. In general, the CoW Municipality was found to have encouraged
such hygiene factors as salaries, good working conditions and supervision, and organisational
policies.

203
The results from the correlation and hypotheses testing also indicate that the line managers
were satisfied with their jobs, despite their lack of satisfaction with their opportunities for
promotion. However, the above did not affect the level of employee performance significantly.
It is becoming increasingly evident that high levels of both job satisfaction and employee
performance can increase levels of organisational efficiency and effectiveness. Therefore, the
results of the current study have important practical implications. The general assumption is
that job satisfaction impacts on employee performance. The results of the current study have
revealed the absence of a significant relationship between job satisfaction and employee
performance. Thus, organisational efforts to improve employee performance by means of
exclusively concentrating on enhancing levels of job satisfaction are unlikely to be effective
(Bowling, 2007:177).
The top management of CoW Municipality could not interpret the above-mentioned results as
indicating that the issue of job satisfaction is unimportant. In the present instance, job
satisfaction seems not to be the cause of employee performance. However, having satisfied
employees might still benefit the organisation through other means.
From the above, it is clear that the CoW Municipality seems to have implemented hygiene
factors well, but to be lacking in terms of the intrinsic motivation, opportunity for promotion. The
lack of such effective essential factors as achievements; promotion on terms of ability;
recognition; the lack of regular promotions; and the lack of opportunity for advancement by
promotion is a major problem in the CoW Municipality. The presence of hygiene factors
eliminates dissatisfaction, and its absence causes dissatisfaction. Job satisfaction is an
important end in itself, and top management ought to feel obligated to enhance the well-being
and satisfaction of the employees who work under them.
The following chapter summarises the current study as a whole, and provides
recommendations to guide the top management to develop its strategies, to resolve the
presently experienced problems and to improve on the existing policies.

204
CHAPTER SEVEN
CONCLUSION AND RECOMMENDATIONS
7.1 Introduction
With Chapter Six having presented the study results, Chapter Seven provides the associated
conclusions, which are compared to the literature and to the results obtained from the empirical
findings of the JDI and JIG questionnaire. Secondly, the chapter offers suitable
recommendations for enhancing the job satisfaction levels of line managers in the CoW
Municipality.
The commissioning of the study was motivated by the growing concern regarding the lack of
service delivery, as a result of the perceived poor performance and its perceived influence on
job satisfaction levels among the line managers in the CoW Municipality. The objectives
(discussed in section 4.2) of the study were aimed at measuring the job satisfaction levels of
line managers in the CoW Municipality, based on the following selected job satisfaction facets:
the work itself; the relationships with co-workers; and the opportunities for promotion (factors
of motivation); the pay; the supervision (hygiene factors); and the overall levels of job
satisfaction. According to the SHRM (2012), the facets in question are the top five causes
contributing to the prevailing levels of employee job (dis)satisfaction. Furthermore, some
research questions (as were discussed in section 1.4) and tentative research hypotheses (as
were discussed in section 1.5) were generated to investigate the relatively broad objectives of
the research. Assumptions were also made to demarcate the borders of the study.
The measuring of job satisfaction levels assisted the researcher to determine the factors
influencing job satisfaction, and the recommendations that could assist with eliminating all the
factors causing job dissatisfaction. To address the issue of poor service delivery as a result of
poor performance, the CoW Municipality was chosen as the research context, particularly due
to the Municipality’s significant importance to the country.
The methodology used to collect the data regarding the job satisfaction of the line managers
consisted of a pre-coded, self-administered, close-ended JDI and JIG scale (i.e. the JDI and
JIG questionnaire) from the BGSU. The questionnaire consisted of two sections.
The demographic information was elicited in section A, with section B eliciting responses to
statements made to evaluate the respondents’ job satisfaction levels (refer to subsection
4.8.3.3).

205
Additionally, the data were analysed using descriptive statistics in terms of demographic data,
frequencies, means, standard deviations, the ANOVA, and correlation. The latter was adopted
as such, focusing on the theme (i.e. job satisfaction) of the study. A significant (75%) response
rate was obtained, due, in large part, to the personal approach that was taken towards the data
collection.
Finally, the service of a statistician was employed to compute the statistical analysis, including
the formulated hypothesis. The SPSS, version 16 for Windows, was used for the statistical
analysis. The findings provided important guidelines for the management of CoW Municipality
on how to address the motivational needs of employees, so as to improve their levels of job
satisfaction and, ultimately, the degree of satisfaction attained with the employees’ job
performance.
7.2 Conclusions
7.2.1 Conclusions relating to the literature findings
Conclusions were made relating to the literature findings of Chapter Two. The theories that
were presented in Chapter Two indicated the complex nature of the relationship between
motivation, job satisfaction, and job performance, in that such different components of the work
environment cannot be viewed one-dimensionally (Smit et al., 2008:339). Furthermore, the
nature of motivation, in relation to job satisfaction and job performance, was explained,
including the measurement of job satisfaction.
Various theories exist on what motivates employees, and on how one can employ such findings
to enhance the employees’ motivation in terms of improving levels of job satisfaction and,
ultimately, job performance (Smit et al., 2008:337). Job performance, on its own, has a positive
impact on organisational performance, which translates into service delivery. The content
theories of motivation explain the underlying forces of why people (i.e. respondents’’, in the
present study) tend to have different needs at different times (Teck-Hong & Waheed, 2011:75).
The content theories of motivation, particularly Maslow’s hierarchy of needs theory, and
Herzberg's two-factor theory, assume the existence of a direct relationship between motivation,
job satisfaction, and job performance. Herzberg differentiated between motivation and what
moves employees. Moving people involves people performing at work, primarily because they
are paid as promised (using the carrot-and-stick approach), so that, when the payment is
withdrawn, or reduced, the extent of performance is reduced as well.

206
Conversely, Maslow's theory differs from that of Herzberg, in the sense that the former theorist
provides a hierarchy of needs that range from the lower to the higher level needs, starting from
a base of physiological needs (safety and security needs), and moving upwards through the
social needs, the esteem, and the egoistic needs, to the self-actualisation needs.
Due to the multiple needs that people have simultaneously, it is virtually impossible to satisfy
all their needs at the same time. It is apparent that the motivation process deals with the
unsatisfied needs of an employee. Such needs leads to a state of tension, which is followed
by an unspecified amount of effort, depending on the extent of the pressure exerted to satisfy
the need, which, in turn, can result in poor or excellent performance.
The literature review’s findings further indicated that motivation in the workplace is primarily
seen as being the driving force behind human behaviour in relation to their work (Higuera,
2014). In contrast, job satisfaction, as work behaviour, is primarily seen as being essential and
significant for the attainment of employee effectiveness and efficiency.
Employees tend to operate at minimum, expected or maximum levels, depending on their
satisfaction levels at the time. Moreover, employees’ behaviour is seen to be guided by their
needs at work. The consequences of their work-related behaviour have been found to lead to
employees’ levels of (dis)satisfaction. Amaoko (2011:1) cites further evidence from the
literature that indicates that high levels of motivation tend to increase the associated levels of
job satisfaction, and, in turn, job performance.
Robbins and Judge (2011:118) further indicate that the employees’ response to a sense of job
dissatisfaction can be expressed in a number of ways that differ from one another on two
dimensions (active vs passive, and constructive vs destructive). Positive job satisfaction at
work contributes to employee performance, rather than suppressing appropriate performance
at work. As was indicated in the literature review, the comprehensive measurement of the
overall sense of job satisfaction is one of the most useful practices that an organisation can
adopt.
Job satisfaction and job performance represent one of the most challenging areas facing line
managers today when it comes to managing employees. Although various studies have been
conducted, as is indicated by Anteby and Khurana (2012), on job satisfaction and employment,
in Namibia the subject concerned is one of the least studied research fields.

207
Moreover, many studies have demonstrated an unusually significant impact on the job
satisfaction and motivation of workers, whereas the level of motivation has an impact on
productivity, and, hence, also on the performance of business organisations (Anteby &
Khurana, 2012).
Laffaldoano and Muchinsky (1985, cited in Muindi & K’Obonyo, 2015:225), suggest that the
statistical correlation between job satisfaction and job performance is weak. However, further
research, as conducted by Goslin (2005, cited in Bakotić, 2016:118-119), on the subject matter
does not agree with the above-mentioned conclusion, as it found that the correlation between
job satisfaction and individual job performance was positive.
Skibba (2002, cited in Indermun & SaheedBayat, 2013:3) further suggests that job
performance and job satisfaction seem to have a reciprocal relationship, which is contrary to
the findings of the study in question. Definite conclusions can be drawn relating to the literature
review results, as discussed in Chapter Two, and as elucidated above, as well as being
indicated in the following paragraphs.
Motivation, in itself, brings about a vitality that creates job satisfaction among employees over
a period of time, so as to enhance the potential to perform effectively and efficiently. As a result
of the fluctuations in the job satisfaction levels of employees, it has become increasingly
important for the employers concerned to comprehend the theories of motivation, job
satisfaction and job performance, and how they impact on organisational performance.
To attain comprehension of the above, the frequency of measuring job satisfaction has become
relatively significant, as has the accurate recording of the reasons given for the degree of
(dis)satisfaction related thereto. Without the above, coming to any meaningful conclusion as
to what causes, or affects, employee job satisfaction is difficult. There is, thus, no doubt that
there is a significant linkage between motivation, job satisfaction and job performance. A
further conclusion is that people's (i.e. employees’ in the current context) needs are dominant
motivators, and that, therefore, the line managers can motivate their employees by means of
influencing their job satisfaction levels, when attempting to address their needs.
Moreover, it can be concluded that the measuring, the documenting, and the implementing of
the findings of the current study, pertaining to the job satisfaction levels of the employees, can
contribute to the comprehension of the related aspects concerned by the top management of
the CoW Municipality.

208
Finally, it can be concluded that it is important to keep the employees’ job satisfaction levels
high to increase their motivation, as well as their job and organisational performance, which
tends to have a profound effect on their service delivery in general.
7.2.2 Conclusions on the empirical findings
Overall, no surprising findings were obtained in the current study, as both the male and the
female employees reported that they were satisfied with their jobs. The main aim of the study
was to determine the prevailing level of job satisfaction, and its impact on respondents’
performance at the CoW Municipality.
The present study found that the respondents’ most satisfactory JDI facet, from high to low,
was: the work itself (mean = 41.74); their present pay (mean = 37.68); their supervision (mean
= 37.56); their relationships with their co-workers (mean = 37.38); and their opportunities for
promotion (mean = 17.86). The mean of the JIG facet job in general was 41.15). The scores
on each facet could range from 0 (completely unsatisfied) to 54 (completely satisfied).
From the above-mentioned findings, the statistics strongly indicated that the line managers
concerned were satisfied on the five JDI facets (the work itself; the pay; the supervision, the
relationships with co-workers; and the JIG). The single exception to the above was the
opportunities for promotion. It is, thus, inevitable that opportunities for promotion could exert
an influence on job satisfaction levels.
The conclusion could, thus, be drawn from the current study that the respondents’ were highly
satisfied with:
the work itself; their present pay;
their supervision;
their relationships with their co-workers; and
with the JIG.
However, they were not satisfied with their opportunities for promotion. Despite the findings
made in the above respect, it is further concluded that opportunities for promotion tend to affect
the level of employee performance. In contrast, the satisfaction with work itself was ranked the
highest of the different facets involved.

209
The conclusion could, thus, be drawn that the respondents’ enjoyed their jobs. However, the
finding of a statistically significant relationship between the different facets varied between
weak, moderate and strong. The strongest correlation was found between the JIG and the co-
worker facet, with the weakest being found between the work itself and the pay.
The results that were obtained in relation to the first hypothesis revealed that there was a
statistically no significant correlation between ‘work itself’ and pay” and ‘work itself’ and
‘promotion’. The linear relationship was found to be weak uphill (positive), hence the H0 (null)
was accepted.
For the rest of the facets the result revealed that there was a statistically significant correlation
between work itself and supervision, pay and the JIG, opportunity for promotion and
supervision, opportunity for promotion and the JIG, supervision and the JIG with weak uphill
(positive) and a moderate uphill (positive) for work itself and co-workers, work itself and the
JIG, pay and the opportunity for promotion, pay and supervision, pay and the co-workers,
opportunity for promotion and the co-workers, supervision and the co-workers, and a strong
uphill (positive for co-workers and the JIG, hence the H0 (null) was rejected.
The results that were obtained in relation to the second hypothesis indicated, through
correlation analysis, that there was no statistically significant relationship between men and
women in terms of job satisfaction. Since the ρ-value for all facets was found to be greater
than 0,05, the null hypothesis was accepted.
The results that were obtained in relation to the third hypothesis revealed, through correlation
analysis, that there were no statistically significant differences between the different age
groups on the job satisfaction facets. The significant correlations between the various facets
can be concluded as indicating the direct influence of the variables concerned on the high job
satisfaction levels of the employees involved. Since the ρ-value for all facets was found to be
greater than 0,05, the null hypothesis was accepted.
The results of the study have essentially useful implications for improved service delivery.
Thus, the top management of CoW Municipality could consider the results of the study to be
important. Job satisfaction is very important by itself, and the management involved could
strive to enhance the well-being and satisfaction of their employees.
210
The CoW Municipality management should see job satisfaction as part of the holistic workplace
entity, which is important. Job satisfaction, as a single factor, cannot, on its own, result in
employee non-performance. The recommendations that are provided hereunder are proposed
to guide the top management of the CoW Municipality to develop strategies, to resolve
problems, and to improve on the existing policies.
Furthermore, the study has indicated the importance of motivation, job satisfaction and job
performance. It is, thus, essential for the top management of the CoW Municipality to consider
different ways of improving employee job satisfaction levels.
7.3 Recommendations
The current study could make an important contribution to the understanding of motivation, job
satisfaction and job performance for the line managers in the CoW Municipality. No study has,
heretofore, focused on determining the relationship between job satisfaction and employee
performance in the Namibian LA sector.
The study has provided information regarding the LA sector, specifically in relation to the CoW
Municipality line managers, which can be used to develop interventions to assist with improving
employee performance, and with increasing the levels of employee job satisfaction, through
the application of the findings made.
The recommendations made firstly, relate to the findings on the research questions, and,
secondly, relating to future research on the topic. CoW Municipality employees could
constantly be kept motivated, so as to ensure that the job satisfaction and employee
performance levels remain at high levels.
The constructs should regularly be monitored by the executive management, which should
recommend the appropriate changes to be made to the MC to ensure that job satisfaction
levels are sustained. Doing so could ultimately lead to an improvement in the current levels of
employee performance. If the management and the MC of CoW Municipality were to implement
a programme to increase the prevailing job satisfaction levels, employee organisational
performance could, concomitantly, improve.
Improving such performance, in turn, could lead to additional benefits related to the sustaining
of, and to the improvement of, the relevant success rate achieved in the short, medium and
long term.

211
7.3.1 The work itself
The work itself scored the highest as a facet, hence the general feeling of satisfaction with
regards to the nature of their work among the line managers in the CoW Municipality. As stated
by the SHRM (2012:33), employees have, over the years, continued to rate the aspect as very
important.
Moreover, the SHRM (2012:33) opines that it is not easy for employees to remain motivated
and satisfied with their jobs when the job is not “interesting, challenging or exciting”. Although
the work itself facet scored the highest, there is still room for improvement. The management
of CoW Municipality could still continue reviewing the remuneration packages, and redesign
them to meet the employees’ expectations.
7.3.2 The pay
Pay scored the second highest of the facets, hence the general feeling of satisfaction with
regards to pay among the line managers in the CoW Municipality. Clearly, from the given result,
the line managers in the CoW Municipality were satisfied with their level of pay. However, there
is evidence that a minority of respondents were not satisfied with some aspect of the
statements. Certo (2010:299) states that money is necessary, not only as a means to pay the
bills, but also as a sign of the employees’ value for the organisation concerned.
Moreover, Ghazanfar, et al. (2011:121) opines that employees tend to expect a compensation
plan that is fair and equitable, and which provides them with tangible rewards that are
commensurate with their skills. Moreover, such an intervention should also provide recognition
of, and a livelihood for, the employees.
The management of CoW Municipality urgently needs to review their remuneration package,
and possibly to redesign it to increase the likelihood that it will satisfy employees’ expectations,
by making it fair, equitable and free of bias.
7.3.3 The opportunities for promotion
Opportunity for promotion scored the poorest, being below average, be tokening the
overwhelming feeling of dissatisfaction with regards to the opportunities for promotion among
the line managers in the CoW Municipality.
According to the SHRM (2012:9), one of the many contributing factors to the issue of job
satisfaction is the opportunity for promotion.

212
The perception that there is little scope for promotion does not give participants’ much hope
for future advancement at the CoW Municipality. Mayhew (2012:1a) states that the cycle of
promotion, motivation, job satisfaction, and performance feedback is critical, as each part of
the cycle is dependent on the others. The employees could be given opportunities to advance
in their field of work, so that they are in a fit state to accept the responsibilities entrusted to
them.
Top management at the CoW Municipality, therefore, needs to develop defined criteria for
promotion opportunities, including those along the succession planning / career path. The
policy needs to display fairness, in that it could present an unbiased process in terms of
providing equal opportunities to all the employees in the CoW Municipality.
7.3.4 The employees’ relationship with their supervisor
The relationship with the supervisor scored the third highest of the various facets concerned,
hence the general feeling of satisfaction with regards to supervision among the line managers
in CoW Municipality. The current study supports the earlier findings that were made in terms
of emphasising the correlation between the employee’s relationship with their supervisor and
the level of job satisfaction experienced.
A significant finding in the study was that the general feeling among the respondents was that
they experienced a good working relationship with their supervisor. Furthermore, recognising
individual differences in needs encourages a two-way exchange in communication.
Finally, actively listening to the employees’ concerns requires paying heed to the personal
power sources that are relationship-orientated, and which affect the actions and the attitudes
of the employees. The management and supervisors at the CoW Municipality could continue
to offer support to the employees, as doing so would assist in creating a conducive and healthy
working environment that encourages the development and maintenance of positive employee
attitudes.
7.3.5 The employee’s relationship with their co-workers
The relationship with co-workers scored the fourth highest of the different facets concerned,
hence the general feeling of happiness with regards to the supervision practised among the
line managers in the CoW Municipality.

213
A significant number of the respondents indicated that they liked their co-workers, and that
they were happy to work with them. According to Madlock and Booth-Butterfield (2012:22),
positive organisational relationships and the practising of interpersonal skills among co-
workers can increase the organisational effectiveness, and it might contribute to an
organisation’s sense of financial well-being. Moreover, Chiaburu and Harrison (2008:2)
highlight that co-workers are not only a vital part of the social environment at work, but that
they can define it.
Therefore, it is imperative that the Executive Management and the MC of CoW Municipality
encourage, foster and maintain a harmonious working relationship among their employees so
as to benefit both the employees and the organisation concerned.
It is, further, recommended that the management could organise team-building events and
social gatherings to allow the employees to interact on a more informal and social level.
Additionally, building a workforce with common goals, and providing a positive organisational
culture and climate, could enhance the co-worker relationships.
7.3.6 The job in general
In terms of the overall satisfaction measurement, the facet of JIG scored the highest, hence
the general feeling of happiness with regards to supervision among the line managers in CoW
Municipality. It was, thus, concluded that the line managers were satisfied with their jobs.
7.3.7 Further recommendations
7.3.7.1 Policies and procedures of the organisation
While policies and procedures act as guidelines within which an employee must work, the
management of CoW Municipality must exercise a degree of flexibility to facilitate and
encourage increased job satisfaction and higher employee performance than before. Hughes
(2007:283) stresses that those organisations that are flexible in their policies and procedures
are likely to benefit from improved employee performance, reduced absenteeism and
increased staff morale.
Also, they are prone to becoming employers of choice, thereby increasing the degree of
employee loyalty felt, and improving on the associated service delivery, due to the health and
dedication of their employees.

214
7.3.7.2 The autonomy to make decisions
The freedom of employees who have been delegated the necessary authority to make work-
related decisions should be encouraged by the management of CoW Municipality. Associated
with the delegation of duties is responsibility and accountability. According to Lloyd (2008:31),
autonomy is considered to be a motivating factor that is vital for the expression of discretionary
behaviours, as, without autonomy, all job roles would be prescribed, leaving no latitude for the
employees concerned to act independently.
7.3.7.3 The commitment to organisational goals
The management should continue to promote the organisation's vision, mission and values,
and to obtain buy-in from the staff, thereby developing a sense of organisational commitment.
Furthermore, the employees must be encouraged to participate at strategic levels within the
organisation, thereby increasing the degree of organisational effectiveness present.
The current study revealed that a significant portion of the line managers had no more than
three years’ service at the CoW Municipality, with almost one-third having less than one year’s
service. Less than 10% of the respondents’ had worked for longer than ten years for the
Municipality.
The management of CoW should explore, and implement, methods to ensure improved
employee retention. Hausknecht, et al. (2009:271) highlight that job satisfaction, extrinsic
rewards, and organisational commitment were the most frequently mentioned reasons for
employees staying with an organisation.
7.4 Limitations of the study
Although every effort was made with the planning and execution to make the research design
and research method reliable, some limitations were evident in the study. There was only a
limited amount of current literature that focused specifically on motivation, job satisfaction and
job performance during the implementation of a PMS in the LA sector.
The literature reviewed consisted of a mixture of the following sectors: private; education;
business; and public. However, most of the literature came from the business and private
sectors. The data gathered were from a particular LA. As a result, the present study highlighted
the findings and results that were specific to the CoW Municipality. Thus, the results cannot be
generalised to other LAs, as the situational factors involved might differ.

215
7.5 Suggestions for future research
The research undertaken highlighted important and interesting insights into motivation, job
satisfaction and employee performance at the CoW Municipality. The study has the potential
to add value to the LA sector as a whole in Namibia, by providing guidelines and
recommendations to increase the prevailing levels of job satisfaction and employee
performance.
Since the study was limited to the line managers in the CoW Municipality of the Khomas region,
further research could include all the employees in the CoW Municipality and other LAs across
the other regions. Doing so might provide valuable and comparable insights into job
satisfaction and employee performance as the key components of strategic decision- making
in the LAs in Namibia.
7.6 Summary
In the current chapter, conclusions were presented relating to the findings of the research,
firstly referring to the literature review, and secondly relating to the empirical study. Following
on such presentation, recommendations were given for future research into the predictability
of work-related attitudes. The chapter concluded with a discussion of the most important
limitations of the research.

216
8. References Agarwal, U.A. & Gupta, V. 2015. Examining the mediating and moderating effects of engagement and conscientiousness for the job characteristics and intention to quit relationship. Indian Institute of Management, 1-34. Ahmad, H., Ahmad, K. & Shah, I.A. 2010. Relationship between Job satisfaction, Job performance Attitude towards Work and Organisational Commitment. European Journal of Social Sciences, 18(2):257-267, May. Ahmad, M.S. 2012. Impact of organisational culture on performance management practices in Pakistan. Business Intelligence Journal, 5(1):50-55, January. Ahmed, E. & Muchiri, M. 2014. Effects of Psychological Contract breach, Ethical Leadership and Supervisors’ fairness of employees’ Performance and Wellbeing. World Journal of Management, 5(2): 1-13, September 2. Akafo, V. & Boateng, P.A. 2015. The impact of reward and recognition on job satisfaction and motivation. European Journal of Business and Management, 7(24):112-124. Alamri, W. 2013. A critical analysis of the Ulrich Four-Role Model. http://waleedhr.blogspot.com/2013/10/a-critical-analysis-ofthe-ulrich-four.html [24 June 2013]. Amaoko, K.G. 2011. Application of Frederick Herzberg's two-factor theory in assessing and understanding employee motivation at work: A Ghanaian perspective. European Journal of Business Management, 3(9). Anderson, D.R., Sweeney, D.J., Williams, T.A., Freeman, J. & Shoesmit, E. 2009. Statistics for business and economics. South Melbourne: South-Western Cengage Learning. Anon. 2009. Local Authorities to step up performance: The Namibian: 3, November 2. Anteby, M. & Khurana. R. 2012. The Hawthorne effect. http://www.library.hbs.edu/hc/ hawthorne/09.htm [27 June 2017]. Ariani, D.W. 2015. Relationship with supervisor and co-workers, psychological condition and employee engagement in the workplace. Journal of Business and Management, 4(3):34-47. Armstrong, M. 2009. Armstrong's handbook of performance management: An evidence-based guide to delivering high-performance. 9th ed. London: Kogan Page. Armstrong, M. 2010. Essential human resource management practice: A guide to people management. London: Kogan Page.
Astrauskaite, M., Vaitkevicius, R. & Perminas, A. 2011. Job satisfaction survey: A confirmatory factor analysis based on secondary school teachers’ sample. International Journal of Business and Management, 6(5):42, May. Aziri, B. 2011. Job satisfaction: A literature review. Management Research and Practice, 3(4):77-86.

217
Bakotić, D. 2016. The relationship between job satisfaction and organisational performance. Economic Research, 29(1):118-130. http://dx.doi.org/10.1080/1331677X.2016.1163946 [23 June 2017]. Bateman, G. 2009. Employee perceptions of co-worker support and its effect on job satisfaction, work stress and intention to quit. Unpublished Master’s dissertation, University of Canterbury, Canterbury. Beaufort West Municipality. 2008. Performance management system implementation policy. https://www.overstrand.gov.za/en/documents/policies/174-performance-management-system-implementation/file [06 June 2016]. Bell, T. 2007. Deep-level composition variables as predictors of team performance: A meta-analysis. Journal of Applied Psychology, 92(3):595-615. Bhate, R. 2013. Supervisor support: Global perspective. http://www.bc.edu/content/dam/files/research_sites/agingandwork/pdf/publications/QI3_SupervisorSupport.pdf [12 May 2013]. Bickman, L. & Rog, D.J. 2009. Applied social research methods. Los Angeles: SAGE. Blanche, M.T., Durrheim, K. & Painter, D. (eds). 2010. Research in practice: Applied methods for the social sciences. Cape Town: University of Cape Town Press. Booysen, C. 2008. A study of the relationship between job satisfaction experienced by employees within a retail company and their organisational citizenship behaviour. Unpublished Master baccalaureate commerce in industrial psychology. University of the Western Cape, Cape Town. Bowling, N.A. 2007. Is the job satisfaction–job performance relationship spurious? A meta-analytic examination. Journal of Vocational Behaviour, 71(2):167-185, October. http://www.sciencedirect.com/science/article/pii/S0001879107000425 [08 July 2014]. Bowling Green State University (BGSU). 2009a. The Job Descriptive Index and job in general quick reference guide. Bowling Green, OH: BGSU. Bowling Green State University (BGSU). 2009b. How to use SPSS syntax.. Bowling Green, OH: BGSU. Bowling Green State University (BGSU). N.d. Progression of the Job Descriptive Index. Bowling Green, OH: BGSU. https://www.bgsu.edu/arts-and-sciences/psychology/services/job-descriptive-index/history.html [11 February 2018]. Brattton, J. & Gold, J. 2007. Human Resource Management: Theory and practice. China, Palgrave Macmillan.

218
Bridgend County Borough Council (BCBC). 2013. Performance Management Framework. http://www1.bridgend.gov.uk/media/188158/pmf-final-for-publication-dec-2013-.pdf [05 June 2016]. Bryman, A. & Bell, E. 2007. Business research methods. 2nd ed. New York: Oxford University Press. Bull, I.H.F. 2005. The relationship between job satisfaction and organisational commitment amongst high school teachers in disadvantaged areas in the Western Cape. Unpublished Master’s dissertation, University of the Western Cape, Cape Town. Business Dictionary. n.d. Definition of team. http://www.businessdictionary.com/ definition/team.html [4 July 2017]. Business Dictionary. n.d. Theory definition. http://www.businessdictionary.com.difinition/theory.html Business Dictionary.com. 2014. Psychological contract. http://www.businessdictionary.com/definition/psychological-contract.html#ixzz3DyItPpcE [19 September 2014]. Cambridge English Dictionary. n.d. http://dictionary.cambridge.org/us/dictionary/english/theory [20 August 2017]. Career Key. 2014. Job satisfaction. http://www.careerkey.org/choose-a-career/job-satisfaction.html [29 September 2014]. Certo, S.C. 2010. Supervision: Concepts and skill-building. New York: McGraw-Hill. Chamanifard, R., Nikpour, A. & Chamanifard, S. 2015. The effect of social capital on organisational performance: The mediating role of employee’s satisfaction. International Review of Management and Business Research, 4(3):852-860, September. Chartered Institute of People Development (CIPD). 2005. Managing change: The role of the psychological contract. http://www.cipd.co.uk/nr/rdonlyres/06b92739-19f8-4bb4-ae47-796ea5f5cb15/0/manachang1105.pdf [20 September 2016]. Chartered Institute of People Development (CIPD). 2012a. The role of line managers in HR and L&D. https://www.cipd.co.uk/knowledge/fundamentals/people/hr/line-managers-factsheet [14 January 2014]. Chartered Institute of People Development CIPD. 2012b. Perspectives on leadership in 2012. Implications for HR: stewardship, leadership and governance. http://www.the-stress-site.net/uploads/2/7/0/6/2706840/perspectives_on_leadership.pdf [22 March 2015].

219
Chartered Institute of People Development (CIPD). 2005. Managing change: The role of the psychological contract. http://www.cipd.co.uk/nr/rdonlyres/06b92739-19f8-4bb4-ae47-796ea5f5cb15/0/manachang1105.pdf [20 September 2016]. Chartered Institute of People Development (CIPD). 2013. The psychological contract – factsheet. https://www.google.com.na/search?output=search&sclient=psy-ab&q=CIPD+%282013%29+the+following+happens+when+the+psychological+contract+is+broken%3A&btnK= [12 July 2014]. Chartered Institute of People Development (CIPD). 2014. A survey report. https://www.google.com.na/?gws_rd=cr,ssl&ei=gb0VVJPBI-bjywOW04HoBA#q=According+to+the+CIPD+(2014)+pay+may+be+divided+in+into+two+categories [12 July 2014]. Chen, G., Kirkman, B.L., Kanfer, R., Allen, D. & Rosen, B. 2007. A multilevel study of leadership, empowerment, and performance in teams. Journal of Applied Psychology, 92(2):331-346, March. Chiaburu, S. & Harrison, D.A. 2008. Do co-workers make the place? Conceptual synthesis and meta-analysis of lateral social influences in organizations. Journal of Applied Psychology, 1-67, April. http://www.personal.psu.edu/dsc188/1.pdf [05 April 2013]. City of Windhoek. 2011. Integrated Business Plan. 2011. The City of Windhoek. City of Windhoek (CoW). 2017 Municipality. Transformational strategic plan report: 2017. Windhoek: CoW. Coleman, T. 2009. Performance management: Recommendations for implementing performance management systems in organisations. University of Wollongong. http://www.evanscorp.net.au/Papers/PerformanceManagement.pdf [15 March 2014]. Colli, L.A. 2013. The Performance Management System of the Department of Economic Development and Tourism in the Western Cape.Unpublished Magister Technologiae Thesis.Cape Peninsula University of Technology, Cape Town. Concise Oxford English dictionary. 2004. 11th ed. New York: OUP. Dahlberg, L. & McCaig, C. 2010. Practical research and evaluation: A start-to-finish guide for practitioners. Los Angeles: SAGE. Dewitz, C. 2009. Windhoek: A brief city guide. Windhoek: KuisebVerlag. Dill, J. 2008. Supervision, job satisfaction, and retention among nursing assistants. Unpublished Master’s thesis, University of North Carolina, Charlotte. Dugguh, S.I. & Dennis, D.A. 2014. Job satisfaction theories: Traceability to employee performance in organisations. Journal of Business and Management, 16(5):11-18, May.

220
Dorothea, W.A. 2015. Relationship with supervisor and co-workers, psychological conditions and employee engagement in the workplace. Journal of business and management. 4(3), 34-47. Emporia State University. 2016. Pragmatism. http://www.emporia.edu/socsci/research-and-teaching-links/philosophy-book/chp12.html [20 August 2016]. English Oxford Living dictionaries. https://en.oxforddictionaries.com/definition/theory [20 August 2017]. Erasmus, B., Van Wyk, M. & Schenk, H. 2008. South African human resource management: theory and practice. Cape Town: Juta. European Foundation for the Improvement of Living and Working Conditions. 2007. Measuring job satisfaction in surveys-Comparative analytical report. https://www.eurofound.europa.eu/ [17 May 2016]. Fayyazi, M. & Aslani, F. (2015). The influence of Psychological contract breach on Employees’deviant workplace behavior: The mediating role of job satisfaction. International Journal of Economics, Commerce and management, 3(5):1032-1042, May. Fenzel, J.L. 2013. Examining generational differences in the workplace: work centrality, narcissism, and their relation to employee work engagement. Published PhD dissertation, University of Wisconsin-Milwaukee, Wisconsin. Fernandez, S. 2008. Examining the effects of leadership behavior on employee perceptions of performance and job satisfaction. Public Performance and Management Review, 32(2):175-205. Field, J. 2008. Job Satisfaction Model. https://talentedapps.wordpress.com/2008/04/11/job-satisfaction-model-for-retention/ [28 February 2015]. Flick, U. 2009. An introduction to qualitative research. London: SAGE. Frost, J. 2016. Understanding t-test: t-values and t-distributions. http://blog.minitab.com/blog/adventures-in-statistics-2/understanding-t-tests-t-values-and-t-distributions [17 July 2017]. Ghauri, E. 2012. Improving performance appraisal practices: A multiple case study of the Pakistan pharmaceutical industry. Published PhD thesis, Southern Cross University, Lismore, NSW. Ghazanfar, F., Chuanmin, S., Khan, M.M. & Bashir, M. 2011. A study of the relationship between satisfaction with compensation and work motivation. International Journal of Business and Social Science, 2(1):120-13, January 11. Govender, D.M. 2013. An investigation into job satisfaction and employee performance at Stodels Retail Nurseries: A case study. Unpublished Magister Technogiae: Human Resources thesis, Durban University of Technology (DUT), Durban, South Africa.

221
Grant, A.M., Fried, Y. & Juillerat, T. 2010. Work matters: Job design in classic and contemporary perspectives. http://www.management.wharton.upenn.edu/grant/GrantFriedJuillerat_APAHandbook.pdf [10 January 2012]. Grover, H. & Wahee, J.S. 2013. Study on factors influencing job satisfaction of employees in Delhi/NCR. International Journal of Business Management, 3(2):101-112, December. Grund, C. & Sliwka, D. 2007. Individual and job-based determinants of performance appraisal: Evidence from Germany. http://ftp.iza.org/dp3017.pdf [17 June 2017]. Haihambo, I. 2015. Interview with the researcher on 12 February 2015, Windhoek. Halogen Software Inc. 2013. Employee performance management: A step-by-step guide to best practices. http://www.halogensoftware.com/uploads/learn/whitepapers-and-ebooks/employee-performance-management-a-step-by-step-guide-to-best-practices/employee-performance-management-a-step-by-step-guide-to-best-practices.pdf [20 August 2014]. Hanif, M.F. & Kamal, Y. 2009. Pay and job satisfaction: A comparative analysis of different Pakistani commercial banks. Proceedings of the National research conference, Szabist, 25 June 2009. Islamabad: Shaheed Zulfikar Ali Bhutto Institute of Science & Technology: 1-20. Hartzenberg, S. [email protected]. 2012. Divisional Heads 2013.E-mail to FN Hambuda ([email protected]) [03 September 2013]. Hattingh, J. & Acutt, J. 2009. Occupational health: Management & practice for health practitioners. Lansdowne: Juta. Hausknecht, J.P., Rodda, J. & Howard, M.J. 2009. Targeted employee retention: Performance-based and job-related differences in reported reasons for staying. Human Resource Management, 48(2):269-288. http://onlinelibrary.wiley.com/doi/10.1002/hrm.20279 [07 January 2013]. Heathfield, S.M. n.d. The 5 causes of employee negativity understand the causes to prevent and deal with negativity at work. http://humanresources.about.com/od/workrelationships/a/negativitycause.htm [June 2014]. Heathfield, S.M. 2017. What is a team? https://www.thebalance.com/what-is-a-team-1919226 [4 July 2017]. Henn, M., Weinstein, M. & Foard, N. 2006. A short introduction to social research. London: SAGE. Herbert, P.L. & Cofer. C. n.d. Motivation: Behaviour. http://www.brittannica.com./topic/motivation [12 February 2018]. Hennink, M., Hutter, H. & Bailey, A. 2011. Qualitative research methods. London: SAGE.

222
Heskett, J. 2010. Why are fewer and fewer U.S. employees satisfied with their jobs? http://hbswk.hbs.edu/item/6404.html [22 January 2012]. Higuera, V. 2014. Behaviour vs. attitude in employees. Hearst Newspapers. http://smallbusiness.chron.com/behavior-vs-attitude-employees-37187.html [2014 June 2014]. Horwitz, S.K. & Horwitz, I.B. 2007. The effects of team diversity on team outcomes: A meta-analytic review of team. Journal of Management, 33(6):987-1015. Huczynski, A.A. & Buchanan, D.A. 2007. Organisational behaviour. New York: Prentice Hall. Hughes, N. 2007. Is life a balancing act? Industrial and Commercial Training, 39(5):281-284. http://www.emeraldinsight.com/journals.htm?articleid=1615962 [05 April 2013]. Indermun, V. & SaheedBayat, M. 2013. The job satisfaction-employee performance relationship: A theoretical perspective. International Journal of Innovative Research in Management, 2(11):1-9, November 13. Internet Encyclopedia of Philosophy. (n.d). http://www.iep.utm.edu/pragmati/ [10 February 2018]. IntraHealth International. 2014. Guide to optimising performance and quality: Stages, steps, and tools. https://www.intrahealth.org/opq/wp-content/uploads/2014/06/OPQ_Guide_Final June-2014.pdf [4 June 2017]. Investopedia. n.d. What is a t-test? http://www.investopedia.com/terms/t/t-test.asp [17 July 2017]. IT-Online. 2010. Give public servants the tools to create a high performance culture. http://www.it-online.co.za/2010/01/20/give-public-servants-the-tools-to-create-a-high-performance-culture/ [20 November 2012]. Itula, P.F. 2016. Interview with researcher on 15 June 2016, Windhoek Jain, R. & Kaur, S. 2014. Impact of work environment on job satisfaction. International Journal of Scientific and Research Publications, 4(1):1-8, January. Jensen, E. & Laurie. 2016. Doing real research – a practical guide to social research. London: SAGE. Joshua, D. 2008. Internal factors influencing job satisfaction in the freight forwarding company. Unpublished Master’s dissertation, Durban University of Technology, Durban. Judge, T.A., Piccolo, R.F., Podsakoff, N.P., Shaw, J.C. & Rich, B.L. 2010. The relationship between pay and job satisfaction: A meta-analysis of the literature. Journal of Vocational Behavior, 77(2):157-167, April. Kabir, M.M. 2011. Factors affecting employee job satisfaction of pharmaceutical sector. Australian Journal of Business and Management Research, 1(9):113-123, December.

223
Kaburia, C. 2013. Leadership style of school principals and performance of primary schools in Nairobi County of Kenya. Unpublished research project, University of Nairobi, Kenya. Kanwal, S., Nawaz, M.M., Saeed, S & Mushtag, H. 2015. Study on Hertzberg intrinsic factors of Motivation. International Journal of scientific research and management (IJSRM), 3(5): 2321-3418, May 2015. Kardam, B.L. & Rangnekar, S. 2012. Job satisfaction: Investigating the role of experience & education. Journal of Arts, Science & Commerce, 4(1):16, October 12. http://www.researchersworld.com/vol3/issue4/vol3_issue4_1/Paper_03.pdf [24 August 2014]. Katoma, F.N. 2009. The role of middle managers in strategy execution: A case study of a Local Authority Council (LAC). Unpublished Master’s dissertation, University of Stellenbosch, Stellenbosch. Kerns, D.C. 2008. Putting performance and happiness together in the workplace. Graziadio Business Review, 11(1). http://gbr.pepperdine.edu/2010/08/putting-performance-and-happiness-together-in-the-workplace/ [01 August 2013]. Khalid, S., Irshad, Z.M. & Mahmood, B. 2012. Job satisfaction among academic staff: A comparative analysis between public and private sector Universities of Punjab, Pakistan. International Journal of Business and Management, 7(1): 126 – 136, January. Kinsella, M. 2009. An evaluation of employee engagement. Unpublished research project, National College, Ireland. Koopmans, L., Bernaards, C.M., Hildebrandt V.H., Schaufeli, W.B., De Vet, H.C.W. & Van der Beek, A.J. 2011. Conceptual frameworks of individual work performance: A systematic review. Journal of Occupational and Environmental Medicine, 53(8):856-866, August. Kosteas, V.D. n.d. Job satisfaction and promotions. http://academic.csuohio.edu/kosteas_b/Job%20Satisfaction%20and%20Promotions.pdf [7 June 2017]. Kula, S. & Gueler, A. 2014. Influence of supervisor support on job satisfaction levels: An evaluation of Turkish National Police (TNP) officers in the Istanbul Police Department. International Journal of Criminal Justice Sciences. 9(2):209-224, July-December. Kumar, R. 2012. Research methodology – a step-by-step guide for beginners. London: SAGE. Kwaku, A.G. & Boateng, S.M. 2015. Performance appraisal system in academic and research libraries in Ghana: a survey. Library Review, 64(58–81) http://www.emeraldinsight.com/doi/abs/10.1108/LR-02-2014-0019 [11 June 2015]. Kudzanayi, G., Noreen, G.S. & Kudakwashe, S. (2015). Role of the Psychological Condtract in Employee Retention for Local Authorities in Zimbabwe. Journal of Research in Business Management, 4(8): 30-36, October 15.

224
Kuusi, S. 2009. Local government system in Namibia. http://www.kunnat.net/fi/Sivut/default.aspx [25 February 2015]. Laerd statistics (n.d.). https://statistics.laerd.com/statistical-guides/one-way-anova-statistical-guide.php [25 April 2017]. Lake, C.J., Gopalkrishnan, P., Sliter, M.T. & Withrow, S. n.d. The job descriptive Index: newly updated and available for download. https://www.siop.org/tip/july10/06jdi.aspx [12 February 2018]. Lapan, S.D. & Quartaroli, M.T. (eds). 2009. Research essentials: An introduction to design and practices. San Diego, CA : PB Printing. Latif, M.S., Ahmad, M., Qasim, M., Mushtag, M., Frdoos, A. & Naem, H. 2013. Impact of employee’s job satisfaction on organisational performance. European Journal of Business and Management, 5(5):2222-2839. Legal Assistance Centre. n.d. The Constitution of Namibia: 1990. Windhoek: Legal Assistance. Lindenberger, J. 2017. Diversity and the workplace. https://www.experience.com/alumnus/article?channel_id=diversity&source_page=additional_articles&article_id=article_1134069577860 [03 March 2017]. Lloyd, R. 2008. Discretionary effort and the performance domain. Australian and New Zealand Journal of Organizational Psychology, 1(1):22-34. http://www.atyponlink.com/AAP/doi/pdf/10.1375/ajop.1.1.22 [06 July 2011]. Lombard, J.G. 2016. Interview with researcher on 23 March 2016, Windhoek. Lotich, P. 2014. Advantages and disadvantages of performance appraisals. http://thethrivingsmallbusiness.com/advantages-and-disadvantages-of-performance-appraisals/ [04 September 2015]. McMnon, G. 2013. Performance management in Human resource management. Palgrave Macmillan Madlock, P.E. & Booth-Butterfield, M. 2012. The influence of relational maintenance strategies among co-workers. Journal of Business Communication, 49(1):21-47, November 3. Maroofi, F. & Dehghani, M. 2013. The effects of job satisfaction on job performance and organisational obligations relationship. International Journal of Research in Social Sciences, 3(4);105-113, December. Mathieu, J.E. & Tammy, L. 2009. Laying the foundation for successful team performance trajectories: The roles of team charters and performance strategies. Journal of Applied Psychology, 94(1):90-103.

225
Martins, H. & Proença, T. 2012. Minnesota satisfaction questionnaire – psychometric properties and validation in a population of Portuguese hospital workers. http://wps.fep.up.pt/wps/wp471.pdf [20 June 2017]. Mayhew, R. n.d. The disadvantages of appraisal systems. http://yourbusiness.azcentral.com/disadvantages-appraisal-systems-7630.html [04 September 2015]. Mayhew, R. 2012a. Advancement and employee performance. http://smallbusiness.chron.com/advancement-employee-performance-19132.html [07 January 2013]. Mayhew, R. 2012b. Signs of good employee work relationships. http://work.chron.com/signs-good-employee-work-relationships-3829.html [07 January 2013]. Mbundu, I.N. 2011. A critical evaluation of job satisfaction levels during the transitional period of a merger: The case of Walter Sisulu University. Unpublished Master’s dissertation, University of South Africa, Pretoria. McShane, S.L. & Von Glinow, M.A. 2005. Organisational behaviour. Boston: McGraw-Hill. Merriam Webster dictionary. n.d. Definition of a team. https://www.merriam-webster.com/dictionary/team [4 July 2017]. Millmore, M., Saunders, M., Lewis, P., Thornhill, A. & Morrow, T. 2007. Strategic human resource management: Contemporary issues, London: Financial Times Press. Mol, A. 2008. Creating winners in the workplace: Motivating people towards excellence. Cape Town: Struik Christian Books. Morris, C.M. 2011. A quantitative study about job satisfaction perception among four generational cohorts in today’s workforce. Unpublished PhD thesis, Capella University, Minneapolis. Mueller, C.W. & Kim, S.W. 2008. The contented female worker: Still a paradox?. Bingley: Emerald Group. http://books.google.com/books?id=rynLSn6zYRkC [22 May 2016].
Muindi, F. & K’Obonyo, P. 2015. Quality of work life, personality, job satisfaction, competence, and job performance: A critical review of literature. European Scientific Journal, 11(26): 223-240, September. Mullins, L.J. 2010. Management and organisational behaviour. Cape Town: Prentice Hall. Murphy, C. & Sebikali, B. 2014. Guide to optimizing performance and quality: Stages, steps, and tools. http://www.intrahealth.org/opq/wp-content/uploads/2014/06/OPQ_Guide_Final_ [27 June 2017].

226
Naanda, R.N. 2010. The integration of identified employability skills into the Namibian Vocational Education and Training curriculum. Unpublished PhD thesis, Stellenbosch University, Stellenbosch. Namibia.1992. Local Authority Act. Notice 116 of 1992. Government Gazette, 470: 4-87 Namibia. 1990. Namibia Constitution Third Amendment Act. Notice 8 of 2014. Government Gazette, 5589: 60 National Planning Commission of Namibia. 2015. Poverty and deprivation in Namibia 2015. Windhoek: National Planning Commission of Namibia. http://un.org.na/home_htm_files/NPC-Summary%20Report.pdf [12 June 2015]. Naveed, A., Usman, A. & Bushra, F. 2011. Promotion: A predictor of job satisfaction, a study of glass industry of Lahore (Pakistan). International Journal of Business and Social Sciences, 2(16):301-307, September. Ndura, M. 2016. Interview with researcher on 23 March 2016, Windhoek. Newaz, M.T. 2012. The role of Performance Management System in shaping psychological contract: A case study approach. International Journal of Business Management Tomorrow, 2(3), March. www.ijbmt.com. [20 August 2014]. Ngo, D. 2009. Importance of employee satisfaction. http://www.humanresources.hrvinet.com/importance-of-employee-satisfaction/ [20 January 2014]. Nicholas, T. 2017. Data analysis email to the researcher, 28 March. Oberoi, M. & Rajgarhia, P. 2013. What your Performance Management System needs most. Gallup Business Journal. Businessjournal.gallup.com. http://businessjournal.gallup.com/content/161546/performance-management-system-needs.aspx [15 September 2014]. Ogunsina, S.O. 2011. Influence of supervisory behaviour and job stress on job satisfaction and turnover intention of police personnel in Ekiti State. Journal of Management and Strategy, 2(3):13-20, September. Online Dictionary of Library and Information Science (ODLIS). n.d. What is performance appraisal? http://lu.com/odlis/index.cfm [15 May 2013]. Padala, S.R. 2010. Employees’ job satisfactions and organisational commitment in Nagarjuna Fertilizers and Chemicals Limited. International Research Journal of Management and Business Studies, 1(1):17-27, March 10.
Pandey, C. & Khare, R. 2012. Impact of job satisfaction and organisational commitment on employee loyalty. International Journal of Social Science & Interdisciplinary Research, 1(8):26-41, August.

227
Parvin, M.M. & Kabir, M.M.N. 2011. Factors affecting employee job satisfaction of pharmaceutical sector. Australian Journal of Business and Management Research, 1(9):113-123, December. Population Reference Bureau. n.d. Glossary of demographic terms. http://www.prb.org/pdf04/glossary.pdf [14 April 2017]. Pretorius, D. & Schurink, W. 2007. Enhancing service delivery in local government: The case of a district municipality. SA Journal of Human Resource Management, 5(3):19-29. www.sajhrm.co.za/index.php/sajhrm/article/viewFile/148/122 [23 June 2017]. Punch, K.F. 2009. Introduction to research methods in education. London: SAGE. Ram, P. 2013. Relationship between job satisfaction and job performance in the public sector – a case study from India. International Journal of Academic Research in Economics and Management Sciences, 2(2):16-35, March. Ramasodi, J.M.B. 2010. Factors influencing job satisfaction among healthcare professionals at South Rand Hospital. Unpublished Master’s dissertation, University of Limpopo, Polokwane. Rast, S. & Tourani, A. 2012. Evaluation of employees’ job satisfaction and role of gender difference: An empirical study at airline industry in Iran. International Journal of Business and Social Science, 3(7):91-100, April. Redmond, B.F. 2011. Job satisfaction. Last modified by Lane, K.D. on 6 November 2016. https://wikispaces.psu.edu/display/PSYCH484/11.+Job+Satisfaction [10 December 2011]. Research Methods Knowledge Base. n.d. Correlation. http://www.socialresearchmethods.net/kb/statcorr.php [12 April 2017]. Riley, J. 2012. Motivation theory – introduction. http://www.tutor2u.net/business/people/motivation_theory_introduction.asp [20 January 2013]. Robbins, S.P. & Judge, T.A. 2011. Organisational behaviour. Global edition. Cape Town: Pearson. Robbins, S.P. & Judge, T.A. 2014. Organisational behavior. Global edition. Harlow: Pearson. Robbins, S.P. & Judge, T.A. 2015. Organisational behaviour. Global edition. New York: Pearson. Robbins, S.P., Judge, T.A., Odendaal, A. & Roodt, G. 2009. Organisational behaviour: Global and Southern African perspective. Cape Town: Pearson. Robson, C. 2009. Real world research: A resource for social scientists and practitioner-researcher. Singapore: Blackwell.

228
Saif, S.K., Nawaz, A., Jan, F.A. & Khan, M.I. 2012. Synthesizing the theories of job-satisfaction across the cultural/attitudinal dimensions. Interdisciplinary Journal of Contemporary Research in Business, 3(9):1-15, January. Salleh, F., Yaakub, N. & Dzulkifli, Z. 2011. The influence of skills levels on job performance of public service employees in Malaysia. Business and Management Review, 1(1):31-40, Sandilands, T. n.d. Can you have multiple motivational theories in a workplace? Houston Chronicle. http://smallbusiness.chron.com/can-multiple-motivational-theories-workplace-37416.html [20 August 2014]. Saunders, M., Lewis, P. & Thornhill, A. 2012. Research methods for business students. New York: Prentice Hall. Saunders, M.N.K. & Rojon, C. 2014. There’s no madness in my method: Explaining how your research findings are built on firm foundations' coaching. International Journal of Theory, Research and Practice, 7(1):74-83, August 01. Scheers, L. & Botha, J. 2014. Analysing relationship between employee job satisfaction and motivation. Journal of Business and Retail Management Research, 9(1): October. Shadrach-Ayidu, P. 2013. Theories of motivation at the workplace and implications for managers. http://thesmartquest.com/blog/2013/11/28/theories-of-motivation-at-the-workplace-and-implications-for-managers/ [24 August 2014]. Shaikh, A.M., Bhutto, A.N. & Maitlo, Q. 2012. Facets of job satisfaction with performance. International Journal of Business and Social Science, 3(7):322-326, April. Sheffield, H. 2016. UK workers' job satisfaction at two-year low as employers fail to engage staff. http://www.independent.co.uk/news/business/news/uk-workers-job-satisfaction-at-two-year-low-as-employers-fail-to-engage-staff-cipd-finds-a7016091.html [06 June 2017]. Shiota, 2011. Why Does Your Attitude Affect Your Workplace?. http://www.ehow.com/facts_5882073_attitude-affect-workplace_.html#ixzz1bv76zIu [26 October 2011]. Shriar, J. 2015. How co-workers affect your job satisfaction. https://www.officevibe.com/blog/how-coworkers-affect-job-satisfaction [12 May 2017]. Shmailan, B.A.S. 2010. The relationship between job satisfaction, job performance and employee engagement: An explorative study. Business Management and Economics, 4(1):1-18, January. Singh, K. 2007. Quantitative social research methods. New Delhi: SAGE. Smart Quest. 2013. Theories of motivation at the workplace and implications for managers. Smart Quest. http://thesmartquest.com/blog/2013/11/28/theories-of-motivation-at-the-workplace-and-implications-for-managers/ [24 August 2014].

229
Smit, P.J., Cronjé, C.J. De J., Brevis, T. & Vrba, J.M. 2008. Management principles. Contemporary edition for Africa. Cape Town: Juta. Society for Human Resource Management (SHRM). 2008. Job satisfaction survey report: Meeting the needs of a multifaceted workforce: What matters most? June 2008. Alexandria: SHRM Research Department. Society for Human Resource Management (SHRM). 2009. Employee job satisfaction survey report. http://www.shrm.org/research/ surveyfindings/articles/documents/09-0282_emp_job_sat_survey_final.pdf [20 June 2013]. Society for Human Resource Management (SHRM). 2010. Employee job satisfaction survey report. http://www.shrm.org/research/ surveyfindings/articles/documents/10-0282_emp_job_sat_survey_final.pdf [20 June 2013]. Society for Human Resource Management (SHRM). 2011. Employee job satisfaction survey report. http://www.shrm.org/research/surveyfindings/articles/documents/11-0618%20job_satisfaction_fnl.pdf [20 June 2013]. Society for Human Resource Management (SHRM). 2012. Employee job satisfaction survey report. http://www.shrm.org/legalissues/stateandlocalresources/stateandlocalstatutesandregulations/documents/12-0537%202012_jobsatisfaction_fnl_online.pdf [20 June 2013]. Society for Human Resource Management (SHRM). 2014. Job satisfaction and engagement research report: optimising organisational culture for success-employee relations. https://store.shrm.org/2015-job-satisfaction-and-engagement-report-optimizing-organizational-culture-for-success.html [20 May 2016]. Society for Human Resource Management (SHRM). 2016. Employee job satisfaction and engagement: Revitalising a changing workforce. Alexandria, VA: SHRM. Somekh, B. & Lewin, C. 2008. Research methods in the social sciences. Los Angeles: SAGE. Statistics South Africa. 2011. The local government handbook: A complete handbook to South African municipalities. http://www.localgovernment.co.za/locals/view/212/beaufort-west-local-municipality [06 June 2016]. Stat Trek. n.d. Hypothesis test: Difference between means. http://stattrek.com/hypothesis-test/difference-in-means.aspx?tutorial=ap [17 July 2017]. Steinberg, W. 2011. Statistics alive. Los Angeles: SAGE.

230
Sullivan, J. 2011. The top 50 problems with performance appraisals. http://www.eremedia.com/tlnt/the-top-50-problems-with-performance-appraisals/ 04 September 2015]. Swanepoel, B., Erasmus, B., Van Wyk, M. & Schenk, H. 2008. Human resource management: Theory and practice. Cape Town: Juta.
Tasmin, M. & Akkas, A. 2017. Impact of supervisory communication skills on employee job satisfaction: A case study on Kia Motors. European Journal of Business and Management, 9(6):82-108, March. Tavakol, M. 2011. Making sense of Cronbach’s alpha. International Journal of Medical Education, 2:53-55, June 27. https://www.ijme.net/archive/2/cronbachs-alpha.pdf [20 July 2017]. Teck-Hong, T. & Waheed, A. 2011. Herzberg’s motivation-hygiene theory and job satisfaction in the Malaysian retail sector: The mediating effect of love for money. Asian Academy of Management Journal, 16(1):73-94, January. Thayer, H.S. & Rosenthal, S.B. n.d. https://www.britannica.com/topic/pragmatism-philosophy [20 August 2016].
Thornton, C.R. 2009. The impact of employee participation on the Job satisfaction of blue-collare workers. Unpublished Bachelor of Arts thesis, Collorado College, Collorado Springs. Torrington, D., Hall, L., Taylor, S. & Atkinson, C. 2013. Human resource management. New York: Pearson. Trevor, C.O., Hausknecht, J.P. & Howard, M.J. 2007. Why high and low performers leave and what they find elsewhere: Job performance effects on employment transitions. http://digitalcommons.ilr.cornell.edu/cgi/viewcontent.cgi?article=1467&context=cahrswp [21 June 2017]. Trochim, W.M. 2006. Research design. http://www.socialresearchmethods.net/kb/ [20 October 2006]. United States Census Bureau. 2015. United States census. http://www.census.gov/ quickfacts/table/PST045215/3712000 [05 June 2016]. University of Southern California. n.d. Types of research designs. http://libguides.usc.edu/content.php?pid=83009&sid=818072 [15 June 2013]. University of Texas at Austin. 2012. SPSS: Descriptive and inferential statistics for Windows. https://stat.utexas.edu/images/SSC/documents/SoftwareTutorials/ SPSS_DescriptiveInferential.pdf [17 July 2017]. University of the West of England. n.d. Data analysis. http://learntech.uwe.ac.uk/da/Default.aspx?pageid=1409 [14 April 2017].

231
University of Washington. 2007. Employee performance. http://www.washington.edu/admin/hr/roles/ee/jobperformance/index.html> [10 February 2012]. Value Base Management.net. n.d. EFG theory. http://www.valuebasedmanagement.net/methods_alderfer_erg_theory.html [25 June 2014]. Vanden Berghe, J. 2011. Job satisfaction and job performance at the workplace. Unpublished Master’s dissertation, Arcada University of Applied Science, Helsinki.
Van Scheers, L. & Botha, J. 2014. Analysing relationship between employee job satisfaction and motivation. Journal of Business Retail Management Research (JBRMR), 9(1):98-109, October 24. Vitell, S. & Singhapakdi, A. 2008. The role of ethics institutionalization in influencing organizational commitment, job satisfaction, and esprit de corps. Journal of Business Ethics, 81(2):343-353. Vries, l. 2016. Interview with researcher on 23 March 2016, Windhoek. Von Wietersheim, E. (2015). The Constitution of the Republic of Namibia. Windhoek: Konrad-Adenauer-Fondation and namibia Scientific Society. Williams, M.M., McDaniel, L. & Ford. 2007. Understanding multiple dimensions of compensation satisfaction. Journal of Business and Psychology, 21(3):429-459. WorldatWork. n.d. Performance management: Strategy, design and Implementation. Cape Town: South African Reward Association. [Unpublished course notes.] Yaseen, A. 2013. Effect of compensation factors on employee satisfaction-A study of doctor’s dissatisfaction in Punjab. International Journal of Human Resources Studies, 3(1): 142-157. Zhang, Y.X., Yao, J. & Cheong, J.O. 2011. City managers’ job satisfaction and frustration: Factors and implications. American Review of Public Administration, 41(6):670-685. Zhao, H., Wayne, S.J., Glibkowski, B. & Bravo, J. 2007. The impact of psychological contract breach on work-related outcomes: A meta-analysis. Personnel Psychology Journal, 60(3): 647-680, September 4.