Embed Size (px)
Citation preview
SRJIS/BIMONTHLY/ DR. DEEPIKA CHAPLOT (5616-5630)
MAY-JUNE 2017, VOL- 4/31 www.srjis.com Page 5616
JOB SATISFACTION IS STEP TOWARDS SUCCESS: - A STUDY OF MAX LIFE
INSURANCE
Deepika Chaplot, Ph. D.
The insurance sector performs an important role in a country„s economic development. It works
like mobilize of savings, a promoter of investment activities, a stabilizer of the financial market, as
well as a risk manager. One of the main challenges in management is to implement effective human
development strategies continuously to improve organizational performance and accountability. A
major problem confronted by Insurance sector today in increasing job dissatisfaction among its
employees. Thus a research on “Job Satisfaction within the Insurance sector” is required, to spotlight
the factors that have influenced the job satisfaction of an employee in the insurance sector. The most
important focus of this research study has been to understand the factors that affect and influence the
job satisfaction of employees in the Insurance sector, especially in Max Life Insurance and how much
important they are. In this research paper author takes some major factors that influence the job
satisfaction, like working hours, convenience, and good culture of working, growth opportunities and
job security. Tests to be used in this research are Reliability test and ANOVA.
1.1 INTRODUCTION
Insurance has become one of the demanding financial products in India. Its fundamental
motto is to protect the family from any uncertainty in life. Therefore it is a long term
investment and people need to know about it. Indian life insurance is too old. It has been here
since British Period and after independence; it has come completely under the control of
Government. Recently there has been a convergence of interest on the efforts by
organizations to look at the conditions that foster greater satisfaction to job. The basic reason
behind this renewed interest is the perception that broadens even at global level; shifts in the
internal structures as well as employment practices are inducing changes in the ties that unite
employees to their job.
Hence insurance sector is vital for the present scenario. In this article author analyzes the
satisfaction level among the employees of Max Life Insurance because the job satisfaction is
required in insurance sector to survive. Every insurance company greatly depends on man
power if man power is not satisfactory, company not will survive in future.
Scholarly Research Journal's is licensed Based on a work at www.srjis.com
AAAA Abstract

SRJIS/BIMONTHLY/ DR. DEEPIKA CHAPLOT (5616-5630)
MAY-JUNE 2017, VOL- 4/31 www.srjis.com Page 5617
1.2 UNDERSTANDING INSURANCE
Insurance is basically a financial products
and quite popular in India. It is simply a legal
contract between insurer and insured. The
insurer is the company and of course the
insured are the customers. It compensates our
financial loss as a consequence of any kind of
uncertain death or any other circumstances.
This long-term product needs a meticulous
planning in both design and implementation.
Insurance is broadly divided into two; life and
general insurance. Afterward health insurance
has originated from general insurance.
The products of insurance are normally
known as plans or policies (Barik & Patra,
2014). The money charged from customers is
known as premiums and of course the duration is referred as term of plan. The products are of
different types in nature starting from term insurance to unit linked plans.
1.3 JOB SATISFACTION
Job satisfaction explains how much comfortable a person is with his / her job. It is a relatively
the latest term since in earlier centuries the jobs that were available to a particular person
were often predetermined by the occupation of his parent. There are a number of factors
which may influence a person’s level of job satisfaction. Some factors contain the
level and measure of pay and benefits, the perceived fairness of the promotion system within
a company, the overall quality of the working conditions, leadership as well as social
relationships and the job itself (the various range of tasks involved, the interest and challenge
the job generates, and of course the clarity of the job description).
The happier the people are in their own job, the more satisfied they are actually said to be.
Job design aims to enhance job satisfaction as well as performance methods include job
rotation, job enlargement and job enrichment. Quite a few other factors of satisfaction include
the management style, culture, employee’s involvement, empowerment and autonomous
SRJIS/BIMONTHLY/ DR. DEEPIKA CHAPLOT (5616-5630)
MAY-JUNE 2017, VOL- 4/31 www.srjis.com Page 5618
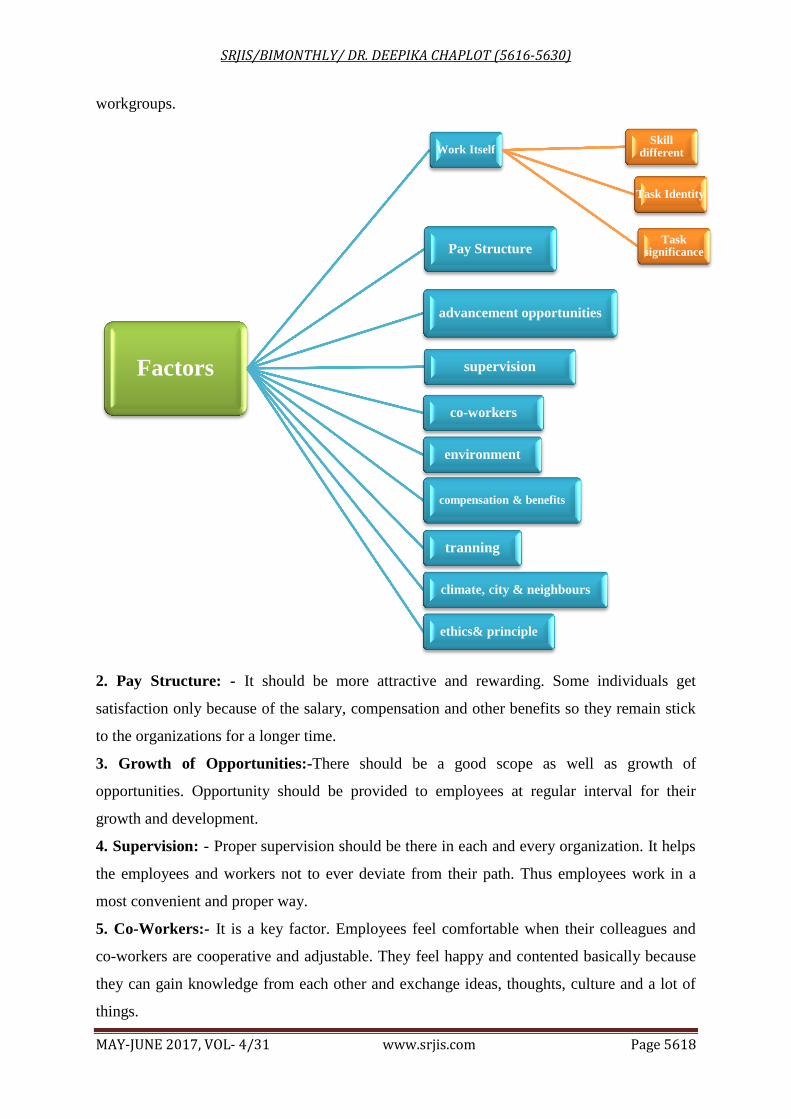
workgroups.
2. Pay Structure: - It should be more attractive and rewarding. Some individuals get
satisfaction only because of the salary, compensation and other benefits so they remain stick
to the organizations for a longer time.
3. Growth of Opportunities:-There should be a good scope as well as growth of
opportunities. Opportunity should be provided to employees at regular interval for their
growth and development.
4. Supervision: - Proper supervision should be there in each and every organization. It helps
the employees and workers not to ever deviate from their path. Thus employees work in a
most convenient and proper way.
5. Co-Workers:- It is a key factor. Employees feel comfortable when their colleagues and
co-workers are cooperative and adjustable. They feel happy and contented basically because
they can gain knowledge from each other and exchange ideas, thoughts, culture and a lot of
things.
Factors
Work Itself Skill
different
Task Identity
Task significance Pay Structure
advancement opportunities
supervision
co-workers
environment
compensation & benefits
tranning
climate, city & neighbours
ethics& principle

SRJIS/BIMONTHLY/ DR. DEEPIKA CHAPLOT (5616-5630)
MAY-JUNE 2017, VOL- 4/31 www.srjis.com Page 5619
6. Environment: - Company should be free from partiality, discrimination, dispute and
politics. Employees prefer to work in a pleasant environment.
7. Compensation & Benefits: - Employees wish more compensation & benefits. Benefits
attract employees more like perquisites, scripts benefits and also club memberships etc.
8. Training: - The nature of training given to employees according to their work profile. It
also includes the benefits the employees can get from it.
9. Climate, City & Neighbors: - Employees like to work in good climatic conditions. In
certain cases city also matters if it is not affordable to him according to the salary he gets and
even the neighborhood influences the preference of work.
10. Ethics & Principle: - The principles, rules and methods a firm has adopted for doing
business. Some individuals are stuck to their ethics. They never compromise with theirvalues
and principles (Irshad & Priyanka, 2013).
1.3 OVERVIEW OF MAX LIFE INSURANCE
Max Life Insurance, the leading non-bank promoted private life insurer, is a joint venture of
Max Financial Services Ltd. and Mitsui Sumitomo Insurance Co. Ltd. Max Financial
Services Ltd. is part of the Max Group, a leading Indian multi-business corporation whereas
Mitsui Sumitomo Insurance is a member of MS&AD Insurance Group, which is amongst the
leading insurers on the planet. Max Life Insurance produces complete and comprehensive
long-term savings, protection and also retirement solutions via its premium quality agency,
distribution and multi-channel distribution partners.
A financially stable company with a strong
track record since last 15 years, Max Life
Insurance offers superior investment expertise
and also has the vision 'To be the most admired
life insurance company by securing the financial
future of customers'. The organization possesses
a strong customer-centric approach geared
toward advice-based sales and quality service delivered through its superior human capital.
Max Life Insurance has positioned itself towards the quality platform and also has developed
a strong corporate governance model based on the core values of caring, credibility,
collaboration as well as excellence. At Max Life Insurance, providing a superior customer
experience is central to its vision and of course the company is committed and dedicated to
provide superior service experience to the customer. As a proactive step towards service
SRJIS/BIMONTHLY/ DR. DEEPIKA CHAPLOT (5616-5630)
MAY-JUNE 2017, VOL- 4/31 www.srjis.com Page 5620
excellence, Max Life Insurance has launched the "Treating Customer Fairly" (TCF)
policy. The TCF policy strives to raise standards in the way the company interacts with
customers at each and every touch point directly from the pre-sales engagement to the
payment of benefits. The company values human capital and considers it to be its competitive
advantage. Max Life Insurance believes that persons are its major organizational assets and
therefore lays a strong emphasis on employee friendly practices, leading to a high level of
employee engagement as well as motivation. This is often reflected in the recognition that the
company has received from the Great Places to Work Institute, India, as one of the best work
places in the industry. Max Life Insurance believes that being a corporate; it has a
responsibility to get engaged with society. This engagement takes it a step beyond being
merely ethical and honest in business but also practices with other association in providing
the right products based on their needs. They believe in caring for society and also have made
a decision to concentrate on providing a secure and safe future for under privileged children.
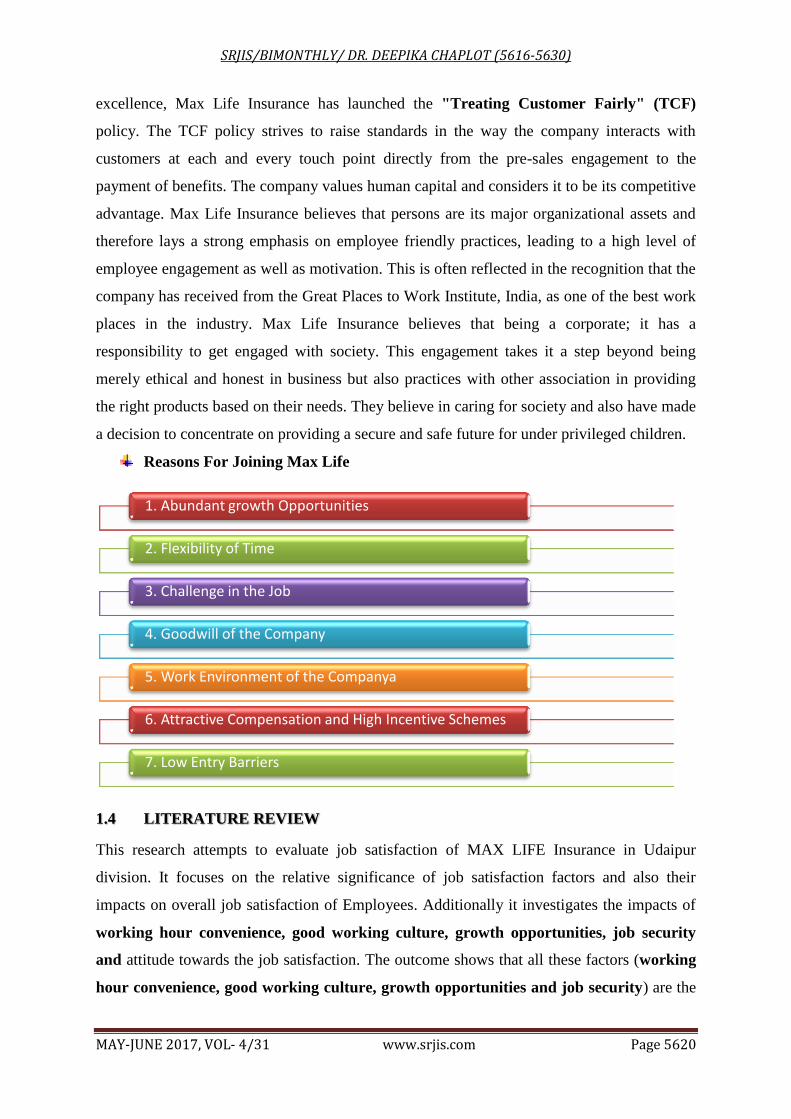
Reasons For Joining Max Life
1.4 LITERATURE REVIEW
This research attempts to evaluate job satisfaction of MAX LIFE Insurance in Udaipur
division. It focuses on the relative significance of job satisfaction factors and also their
impacts on overall job satisfaction of Employees. Additionally it investigates the impacts of
working hour convenience, good working culture, growth opportunities, job security
and attitude towards the job satisfaction. The outcome shows that all these factors (working
hour convenience, good working culture, growth opportunities and job security) are the
1. Abundant growth Opportunities
2. Flexibility of Time
3. Challenge in the Job
4. Goodwill of the Company
5. Work Environment of the Companya
6. Attractive Compensation and High Incentive Schemes
7. Low Entry Barriers

SRJIS/BIMONTHLY/ DR. DEEPIKA CHAPLOT (5616-5630)
MAY-JUNE 2017, VOL- 4/31 www.srjis.com Page 5621
important factors contributing to job satisfaction. Private MAX LIFE has higher levels of job
satisfaction than those from public sectors as they enjoy better facilities and supportive work
environment. Gender and age differences have relatively lower level of impact on it. The
overall job satisfaction of the MAX LIFE is positive.
Rahman, Raza Naqvi, and Ismail (2008) exposed that job satisfaction and organizational
commitment has a negative effect on turnover intentions, conversely perceived alternative job
opportunities has a significant positive correlation along with turnover intentions and is
actually the major factor connected with turnover intention among its professionals in
Pakistan.
Van Dick et al. (2004) have also observed that job satisfaction being a predictor of turnover
intention; nevertheless it is a mediating variable in between organizational identification and
more than that turnover intention. In accordance with their Sales Force Turnover study,
organizational identification feeds into job satisfaction which, in turn, predicts turnover
intention.
Zheng and Lamond (2009) noticed that training, size, duration of operation as well as the
nature of the industry are significantly associated with turnover.
Kreitner (2006) noticed that in recent times, most employees have little difficulty in
satisfying basic needs. Since these needs are already satisfied, the employees and workers
move on to various other (or higher) needs, which are concerned to safety needs.
1.5 RESEARCH METHODOLOGY
The methodology to be followed for conducting the research consists of the specification in
design of research, sample design, survey questions asked to respondents design, data
collection as well as statistical tools used for analyzing the collected data. Primary sources of
data are to be used in the present article which is collected from Max Life Insurance,
Udaipur. Primary data are those which are collected as first hand data and also for the first
time. The data collected in this way are original in character.
1.5.1 Questionnaire Design
Job satisfaction is a very important attribute which is frequently measured by organizations.
The most common method of measurement is the use of rating scales where employees report
their reactions to their jobs. Questions related to pay; work responsibilities, variety of tasks,
promotional opportunities, the work itself and co-workers are asked. Several questions of yes
or no answers are asked while others are asked to rate satisfaction level on 1 – 5 scale where
1 represents “not at all satisfied” and 5 represents “extremely satisfied”.

SRJIS/BIMONTHLY/ DR. DEEPIKA CHAPLOT (5616-5630)
MAY-JUNE 2017, VOL- 4/31 www.srjis.com Page 5622
1.5.2 Sampling
The data are collected from the employees with the help of structured survey questions
asked to respondents. A sample of 50 has been considered for this project through
convenient sampling method. Several statistical tools for analyzing and interpreting the
data will be used in this research for instance reliability test and ANOVA test. The
research design of this study is empirical.
1.5.3 Objective
To study the working environment of max life insurance.
To study the factors of job satisfaction in Max Life Insurance.
To Measure the satisfaction levels of employees on various factors.
1.5.4 Hypothesis
H01:- There is no significant difference between male and female respondents towards
the convenient working hours in Max Life Insurance.
H02:- There is no significant difference between male and female respondents towards
the growth opportunities in Max Life Insurance.
H03:- There is no significant difference between male and female respondents towards
the good culture of working in Max Life Insurance.
H04:- There is no significant difference between male and female respondents towards
the security of job in Max Life Insurance.
H05:- There is no significant difference between educational qualification of male and
female respondents towards the convenient working hours in Max Life Insurance.
H06:- There is a significant difference between educational qualifications of
respondents towards the growth opportunities in Max Life Insurance.
H07:- There is a significant difference between educational qualifications of
respondents towards the good culture of working in Max Life Insurance.
H08:- There is a significant difference between educational qualifications of
respondents towards the security of job in Max Life Insurance.
1.5.5 Data collection
The primary data has been collected by using questionnaires. The questionnaire has 15
questions excluding marital status, age and factor incited of MAX Life Insurance Company.
In this research paper researcher discusses only four dependent variables such as
working hours, growth opportunities, good working culture and security of job. A five

SRJIS/BIMONTHLY/ DR. DEEPIKA CHAPLOT (5616-5630)
MAY-JUNE 2017, VOL- 4/31 www.srjis.com Page 5623
point scale will be used such as strongly disagree, disagree, neutral, agree and strongly agree.
1.6 DATA ANALYSIS
Table: - 1 Frequency table of gender class
Gender
Frequency Percent
Valid
Percent
Cumulative
Percent
Valid
Male 12 24 24 24
Female 38 76 76 100
Total 50 100 100
Graph 1:- Frequency graph of gender class
As shown in table 1 and graph 1 first important demographic variable is gender. According to
the table1 frequency of gender indicated that from 50 respondents 38 (76%) of respondents
are females and remaining 12 (24%) are males. It displays that the number of female
employees are higher as compared to male employees. It interprets that female employees
feel more secured in working with a Max Life Insurance company.
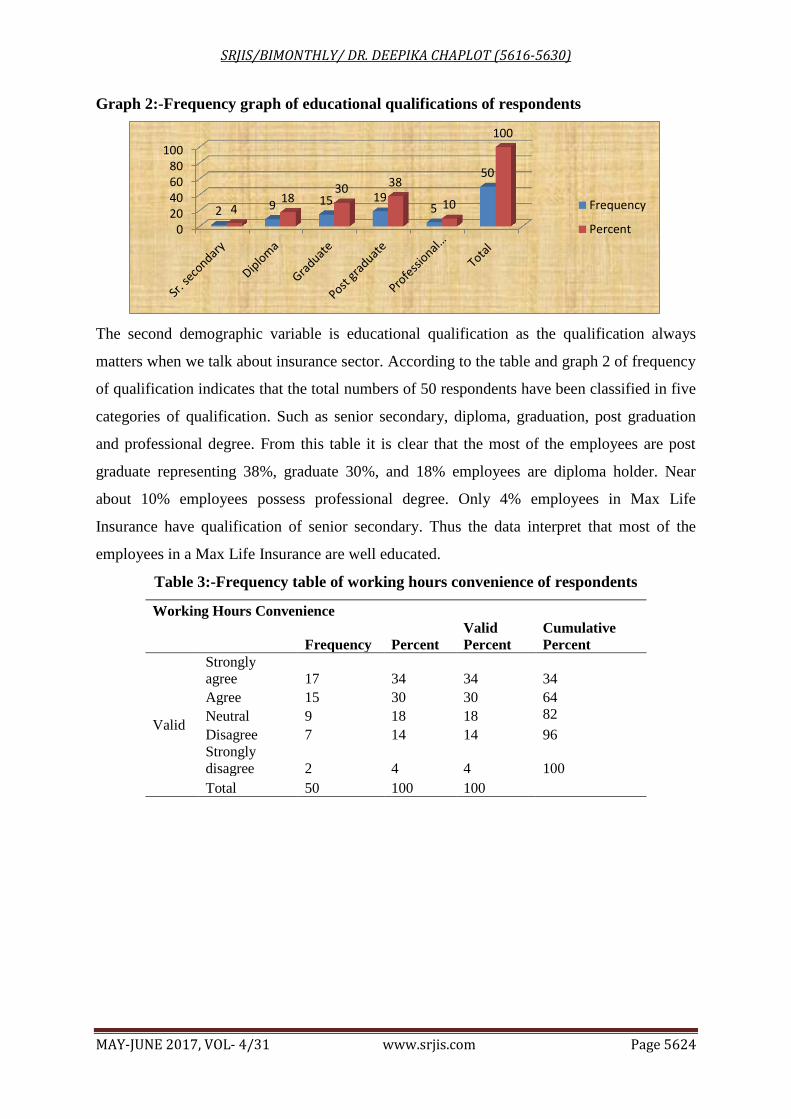
Table 2:- Frequency table of educational qualifications of respondents
Educational qualification
Frequency Percent
Valid
Percent
Cumulative
Percent
Valid
Sr. secondary 2 4 4 4
Diploma 9 18 18 22
Graduate 15 30 30 52
Post graduate 19 38 38 90
Professional
degree 5 10 10 100
Total 50 100 200
0
50
100
Male Female Total
12
38 50
24
76
100
Frequency
Percent
SRJIS/BIMONTHLY/ DR. DEEPIKA CHAPLOT (5616-5630)
MAY-JUNE 2017, VOL- 4/31 www.srjis.com Page 5624
Graph 2:-Frequency graph of educational qualifications of respondents
The second demographic variable is educational qualification as the qualification always
matters when we talk about insurance sector. According to the table and graph 2 of frequency
of qualification indicates that the total numbers of 50 respondents have been classified in five
categories of qualification. Such as senior secondary, diploma, graduation, post graduation
and professional degree. From this table it is clear that the most of the employees are post
graduate representing 38%, graduate 30%, and 18% employees are diploma holder. Near
about 10% employees possess professional degree. Only 4% employees in Max Life
Insurance have qualification of senior secondary. Thus the data interpret that most of the
employees in a Max Life Insurance are well educated.
Table 3:-Frequency table of working hours convenience of respondents
Working Hours Convenience
Frequency Percent
Valid
Percent
Cumulative
Percent
Valid
Strongly
agree 17 34 34 34
Agree 15 30 30 64
Neutral 9 18 18 82
Disagree 7 14 14 96
Strongly
disagree 2 4 4 100
Total 50 100 100
020406080
100
2 9 15 19 5
50
4 18
30 38
10
100
Frequency
Percent

SRJIS/BIMONTHLY/ DR. DEEPIKA CHAPLOT (5616-5630)
MAY-JUNE 2017, VOL- 4/31 www.srjis.com Page 5625
Graph 3:-Frequency graph of working hour’s convenience of respondents
According to the table and graph 3, total numbers of male and female respondents are 50, out
of which 17 (34%) employees are extremely satisfied with their working hours and 15 (30%)
employees are satisfied with their working hour. 9(18%) employees are neutral in their
opinion about it. Further we find that 7 (14%) employees are dissatisfied with their working
hours of job. Only 2 (4%) employees are strongly dissatisfied with their working hours. So
considering the overall opinion of the respondents it can say that the majority of employees in
a Max Life Insurance are satisfied with their working hours. It implies that working hours are
convenient for the employees in Max Life Insurance.
Table 4:-Frequency table of Growth opportunities of respondents
Growth opportunities
Frequency Percent
Valid
Percent
Cumulative
Percent
Valid
Strongly Agree 13 26 26 26
Agree 22 44 44 70
Neutral 12 24 24 94
Disagree 2 4 4 98
Strongly
Disagree 1 2 2 100
Total 50 100 100
020406080
100
17 15 9 7 2
50 34 30
18 14 4
100
Frequency
Percent

SRJIS/BIMONTHLY/ DR. DEEPIKA CHAPLOT (5616-5630)
MAY-JUNE 2017, VOL- 4/31 www.srjis.com Page 5626
Graph 4:-Frequency graph of growth opportunities
As the above table and graph shows that the total number of male and female respondents are
50, out of which 22 (44%) respondents that is the majority of respondents are agreed that
growth opportunities in Max Life Insurance is good. 24% of the respondents are neutral in
their opinion. Few of the respondents are disagree on growth opportunities. It indicates that
opportunities of future growth are good in Max Life Insurance.
Table 5:- Frequency table of good working culture
Good work Culture
Frequency Percent
Valid
Percent
Cumulative
Percent
Valid
Strongly Agree 17 34 34 34
Agree 12 24 24 58
Neutral 2 4 4 62
Disagree 14 28 28 90
Strongly
Disagree 5 10 10 100
Total 50 100 100
Graph 5:- Frequency graph of good working culture
As the above table and graph shows that the total number of male and female respondents are
50, out of which 17 (34%) respondents that is the majority of respondents are strongly agree
that there is good working culture in Max Life Insurance. 24% of the respondents are agree
with it. Few of the respondents are neutral on good working culture in Max Life Insurance
and only 19 were disagree that it has a good working culture.
020406080
100
13 22 12
2 1
50 26
44 24
4 2
100
Frequency
Percent
0
50
100
17 12 2 14 5
50 34 24
4 28
10
100
Frequency
Percent
SRJIS/BIMONTHLY/ DR. DEEPIKA CHAPLOT (5616-5630)
MAY-JUNE 2017, VOL- 4/31 www.srjis.com Page 5627
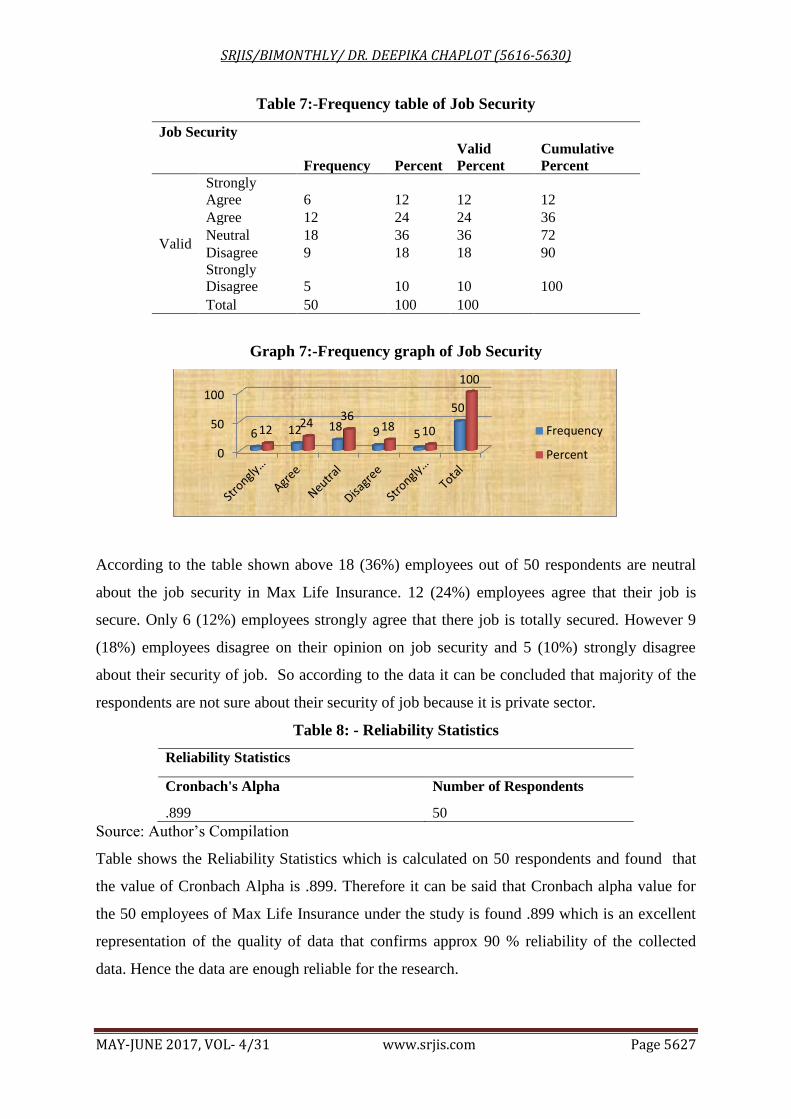
Table 7:-Frequency table of Job Security
Job Security
Frequency Percent
Valid
Percent
Cumulative
Percent
Valid
Strongly
Agree 6 12 12 12
Agree 12 24 24 36
Neutral 18 36 36 72
Disagree 9 18 18 90
Strongly
Disagree 5 10 10 100
Total 50 100 100
Graph 7:-Frequency graph of Job Security
According to the table shown above 18 (36%) employees out of 50 respondents are neutral
about the job security in Max Life Insurance. 12 (24%) employees agree that their job is
secure. Only 6 (12%) employees strongly agree that there job is totally secured. However 9
(18%) employees disagree on their opinion on job security and 5 (10%) strongly disagree
about their security of job. So according to the data it can be concluded that majority of the
respondents are not sure about their security of job because it is private sector.
Table 8: - Reliability Statistics
Reliability Statistics
Cronbach's Alpha Number of Respondents
.899 50
Source: Author’s Compilation
Table shows the Reliability Statistics which is calculated on 50 respondents and found that
the value of Cronbach Alpha is .899. Therefore it can be said that Cronbach alpha value for
the 50 employees of Max Life Insurance under the study is found .899 which is an excellent
representation of the quality of data that confirms approx 90 % reliability of the collected
data. Hence the data are enough reliable for the research.
0
50
100
6 12 18 9 5
50
12 24
36 18 10
100
Frequency
Percent
SRJIS/BIMONTHLY/ DR. DEEPIKA CHAPLOT (5616-5630)
MAY-JUNE 2017, VOL- 4/31 www.srjis.com Page 5628
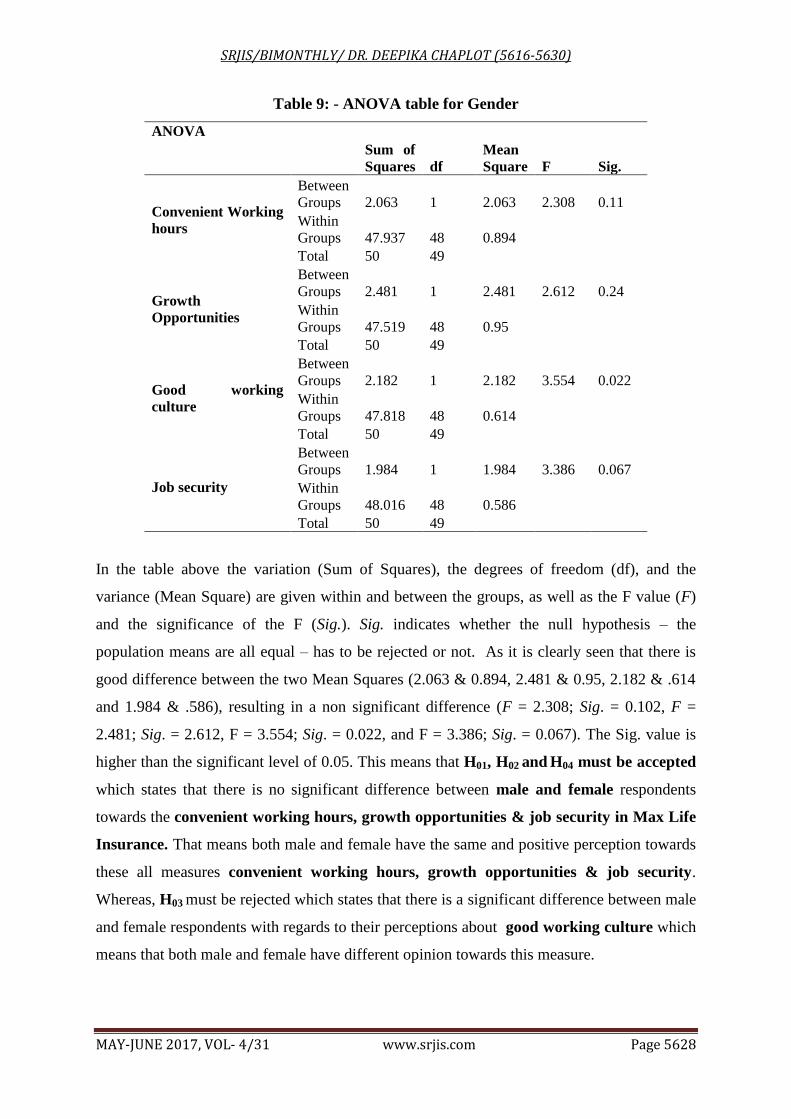
Table 9: - ANOVA table for Gender
ANOVA
Sum of
Squares df
Mean
Square F Sig.
Convenient Working
hours
Between
Groups 2.063 1 2.063 2.308 0.11
Within
Groups 47.937 48 0.894
Total 50 49
Growth
Opportunities
Between
Groups 2.481 1 2.481 2.612 0.24
Within
Groups 47.519 48 0.95
Total 50 49
Good working
culture
Between
Groups 2.182 1 2.182 3.554 0.022
Within
Groups 47.818 48 0.614
Total 50 49
Job security
Between
Groups 1.984 1 1.984 3.386 0.067
Within
Groups 48.016 48 0.586
Total 50 49
In the table above the variation (Sum of Squares), the degrees of freedom (df), and the
variance (Mean Square) are given within and between the groups, as well as the F value (F)
and the significance of the F (Sig.). Sig. indicates whether the null hypothesis – the
population means are all equal – has to be rejected or not. As it is clearly seen that there is
good difference between the two Mean Squares (2.063 & 0.894, 2.481 & 0.95, 2.182 & .614
and 1.984 & .586), resulting in a non significant difference (F = 2.308; Sig. = 0.102, F =
2.481; Sig. = 2.612, F = 3.554; Sig. = 0.022, and F = 3.386; Sig. = 0.067). The Sig. value is
higher than the significant level of 0.05. This means that H01, H02 and H04 must be accepted
which states that there is no significant difference between male and female respondents
towards the convenient working hours, growth opportunities & job security in Max Life
Insurance. That means both male and female have the same and positive perception towards
these all measures convenient working hours, growth opportunities & job security.
Whereas, H03 must be rejected which states that there is a significant difference between male
and female respondents with regards to their perceptions about good working culture which
means that both male and female have different opinion towards this measure.

SRJIS/BIMONTHLY/ DR. DEEPIKA CHAPLOT (5616-5630)
MAY-JUNE 2017, VOL- 4/31 www.srjis.com Page 5629
Table 10:- Results of hypothesis
S.
No.
Hypotheses Difference Status
1. H01 Non
Significant
Accepted
2. H02 Non
Significant
Accepted
3. H03 Significant Rejected
4. H04 Non
Significant
Accepted
Table 11: - ANOVA table of Education Qualufications
ANOVA
Sum of
Squares
df Mean
Square
F Sig.
Convenient
working
hours
Between
Groups
1.098 1 1.098 1.234 0.226
Within
Groups
48.902 48 0.89
Total 50 49
Growth
opportunities
Between
Groups
2.498 1 2.498 2.842 0.05
Within
Groups
47.502 48 0.879
Total 50 49
Good
Working
culture
Between
Groups
0.325 1 0.325 0.481 0.846
Within
Groups
49.675 48 0.676
Total 50 49
Job Security
Between
Groups
2.598 1 2.598 3.056 0.198
Within
Groups
47.402 48 0.85
Total 50 49
In the table above it is clear that there is good difference between the two Mean Squares
(1.098 & 0.89, 2.498 & 0.879, 0.325 & 0.676 and 2.598 & 0.85), resulting in a non
significant difference (F = 1.234; Sig. = 0.226, F = 2.842; Sig. = 0.05, F = 0.481; Sig. =
0.846, and F = 3.056; Sig. = 0.198). The Sig. value is higher than the Sig. level of 0.05. This
means that H05, H06, H07 and H08 must be accepted which state that there is no significant
difference amongst various educational qualifications of respondents towards the convenient
working hours, growth opportunities, good working culture and job security in Max
Life Insurance. That means according to qualification both male and female have the same
SRJIS/BIMONTHLY/ DR. DEEPIKA CHAPLOT (5616-5630)
MAY-JUNE 2017, VOL- 4/31 www.srjis.com Page 5630
and positive perception towards these all measures convenient working hours, growth
opportunities, good working culture and job security.
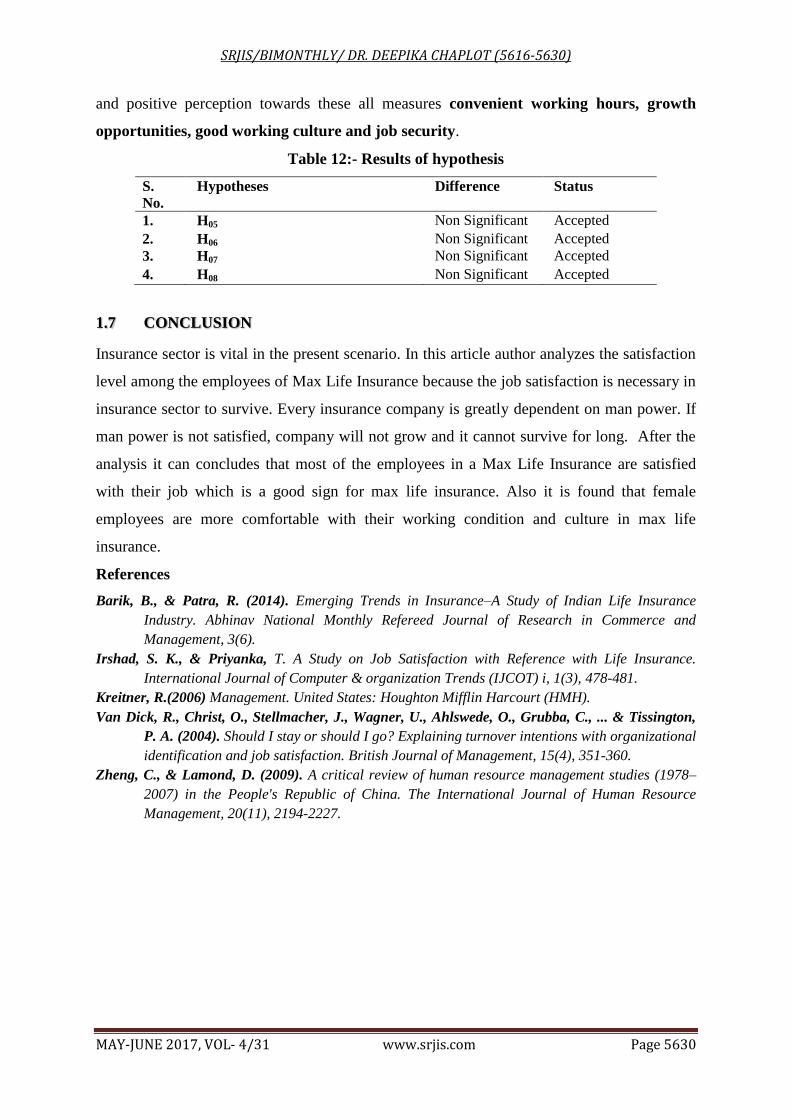
Table 12:- Results of hypothesis
S.
No.
Hypotheses Difference Status
1. H05 Non Significant Accepted
2. H06 Non Significant Accepted
3. H07 Non Significant Accepted
4. H08 Non Significant Accepted
1.7 CONCLUSION
Insurance sector is vital in the present scenario. In this article author analyzes the satisfaction
level among the employees of Max Life Insurance because the job satisfaction is necessary in
insurance sector to survive. Every insurance company is greatly dependent on man power. If
man power is not satisfied, company will not grow and it cannot survive for long. After the
analysis it can concludes that most of the employees in a Max Life Insurance are satisfied
with their job which is a good sign for max life insurance. Also it is found that female
employees are more comfortable with their working condition and culture in max life
insurance.
References
Barik, B., & Patra, R. (2014). Emerging Trends in Insurance–A Study of Indian Life Insurance
Industry. Abhinav National Monthly Refereed Journal of Research in Commerce and
Management, 3(6).
Irshad, S. K., & Priyanka, T. A Study on Job Satisfaction with Reference with Life Insurance.
International Journal of Computer & organization Trends (IJCOT) i, 1(3), 478-481.
Kreitner, R.(2006) Management. United States: Houghton Mifflin Harcourt (HMH).
Van Dick, R., Christ, O., Stellmacher, J., Wagner, U., Ahlswede, O., Grubba, C., ... & Tissington,
P. A. (2004). Should I stay or should I go? Explaining turnover intentions with organizational
identification and job satisfaction. British Journal of Management, 15(4), 351-360.
Zheng, C., & Lamond, D. (2009). A critical review of human resource management studies (1978–
2007) in the People's Republic of China. The International Journal of Human Resource
Management, 20(11), 2194-2227.