Embed Size (px)
Citation preview

2021UNAUDITED RESULTS
Brait SE (Registered in Malta as a European Company)(Registration No. SE1)Share code: BATISIN: LU0011857645Bond code: WKN: A2SBSU LEI code: 549300VB8GBX4UO7WG59(“Brait”, the “Company” or “Group”)
FOR THE SIX MONTHS ENDED
30 SEPTEMBER 2020
Unaudited interim results for the six months ended 30 September 2020
CONTENTS PAGE
PAGE INDEX
SECTION ONE - BRAIT’S INTERIM 1HFY21 RESULTS PRESENTATION
Overview Page 4
Executive Summary Page 7
Brait NAV & Liquidity Page 9
Virgin Active: nine months ended 30 September 2020 Page 14
Premier: six months ended 30 September 2020 Page 24
New Look: six months ended 30 September 2020 Page 32
Portfolio Valuations Page 35
Conclusion Page 39
SECTION TWO - ANNEXURES
SECTION THREE – UNAUDITED INTERIM 1HFY21 RESULTS ANNOUNCEMENT
BRAIT’SINTERIM RESULTS
PRESENTATION
30 September 2020
4 Unaudited interim results for the six months ended 30 September 2020
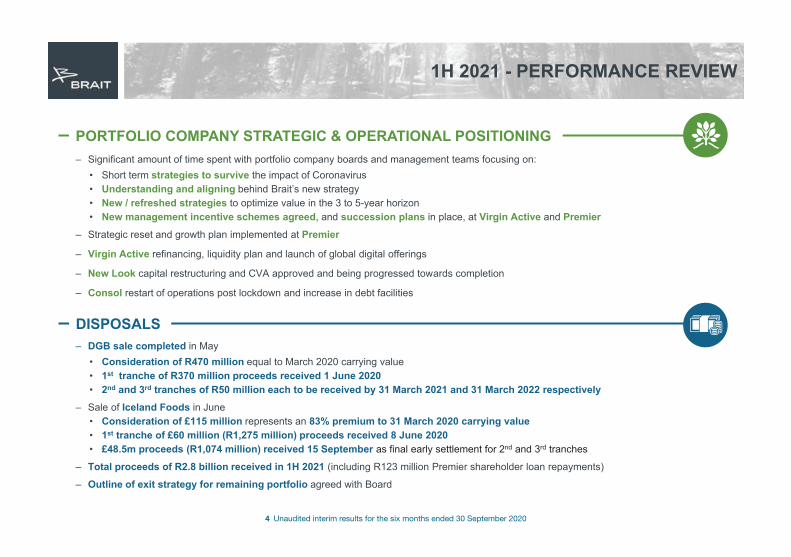
1H 2021 - PERFORMANCE REVIEW
PORTFOLIO COMPANY STRATEGIC & OPERATIONAL POSITIONING
DISPOSALS
– Significant amount of time spent with portfolio company boards and management teams focusing on:• Short term strategies to survive the impact of Coronavirus• Understanding and aligning behind Brait’s new strategy• New / refreshed strategies to optimize value in the 3 to 5-year horizon• New management incentive schemes agreed, and succession plans in place, at Virgin Active and Premier
– Strategic reset and growth plan implemented at Premier
– Virgin Active refinancing, liquidity plan and launch of global digital offerings
– New Look capital restructuring and CVA approved and being progressed towards completion
– Consol restart of operations post lockdown and increase in debt facilities
– DGB sale completed in May • Consideration of R470 million equal to March 2020 carrying value• 1st tranche of R370 million proceeds received 1 June 2020• 2nd and 3rd tranches of R50 million each to be received by 31 March 2021 and 31 March 2022 respectively
– Sale of Iceland Foods in June• Consideration of £115 million represents an 83% premium to 31 March 2020 carrying value• 1st tranche of £60 million (R1,275 million) proceeds received 8 June 2020• £48.5m proceeds (R1,074 million) received 15 September as final early settlement for 2nd and 3rd tranches
– Total proceeds of R2.8 billion received in 1H 2021 (including R123 million Premier shareholder loan repayments)
– Outline of exit strategy for remaining portfolio agreed with Board
5 Unaudited interim results for the six months ended 30 September 2020
1H - PERFORMANCE REVIEW
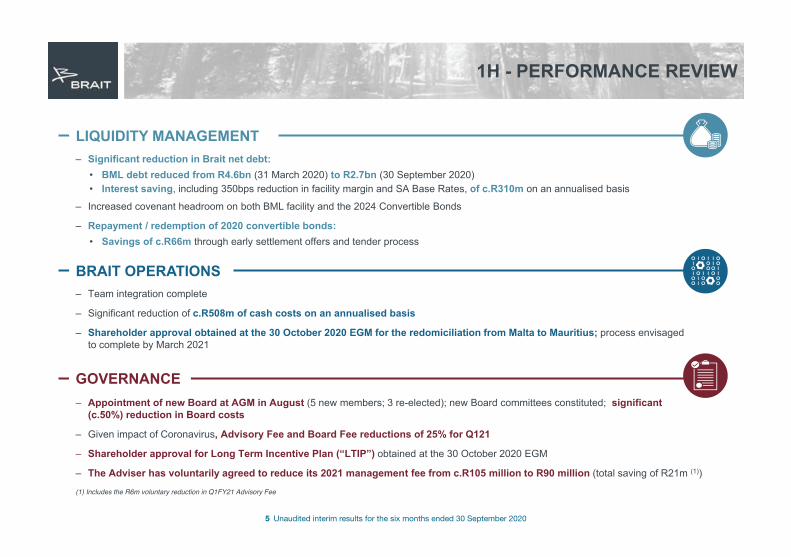
LIQUIDITY MANAGEMENT
BRAIT OPERATIONS
– Significant reduction in Brait net debt:• BML debt reduced from R4.6bn (31 March 2020) to R2.7bn (30 September 2020)• Interest saving, including 350bps reduction in facility margin and SA Base Rates, of c.R310m on an annualised basis
– Increased covenant headroom on both BML facility and the 2024 Convertible Bonds
– Repayment / redemption of 2020 convertible bonds:• Savings of c.R66m through early settlement offers and tender process
– Team integration complete
– Significant reduction of c.R508m of cash costs on an annualised basis
– Shareholder approval obtained at the 30 October 2020 EGM for the redomiciliation from Malta to Mauritius; process envisaged to complete by March 2021
GOVERNANCE– Appointment of new Board at AGM in August (5 new members; 3 re-elected); new Board committees constituted; significant
(c.50%) reduction in Board costs
– Given impact of Coronavirus, Advisory Fee and Board Fee reductions of 25% for Q121
– Shareholder approval for Long Term Incentive Plan (“LTIP”) obtained at the 30 October 2020 EGM
– The Adviser has voluntarily agreed to reduce its 2021 management fee from c.R105 million to R90 million (total saving of R21m (1))
(1) Includes the R6m voluntary reduction in Q1FY21 Advisory Fee
6 Unaudited interim results for the six months ended 30 September 2020
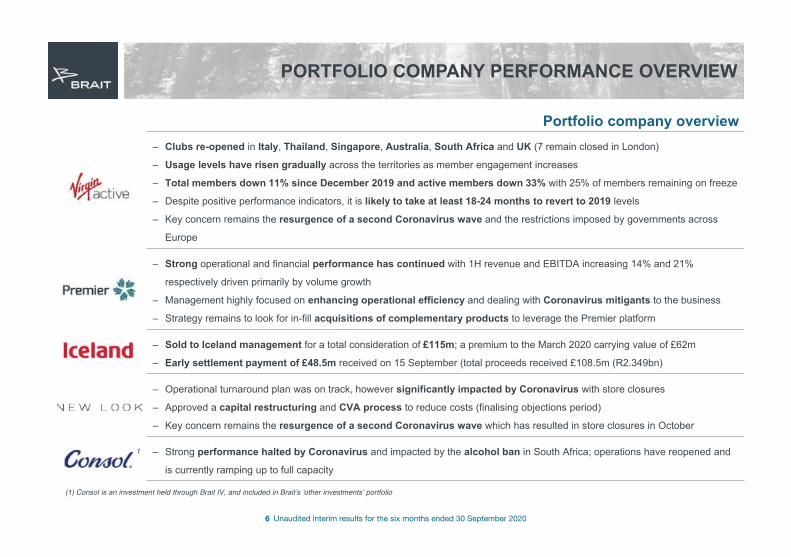
PORTFOLIO COMPANY PERFORMANCE OVERVIEW
Portfolio company overview– Clubs re-opened in Italy, Thailand, Singapore, Australia, South Africa and UK (7 remain closed in London)
– Usage levels have risen gradually across the territories as member engagement increases
– Total members down 11% since December 2019 and active members down 33% with 25% of members remaining on freeze
– Despite positive performance indicators, it is likely to take at least 18-24 months to revert to 2019 levels
– Key concern remains the resurgence of a second Coronavirus wave and the restrictions imposed by governments across
Europe
– Strong operational and financial performance has continued with 1H revenue and EBITDA increasing 14% and 21%
respectively driven primarily by volume growth
– Management highly focused on enhancing operational efficiency and dealing with Coronavirus mitigants to the business
– Strategy remains to look for in-fill acquisitions of complementary products to leverage the Premier platform
– Sold to Iceland management for a total consideration of £115m; a premium to the March 2020 carrying value of £62m
– Early settlement payment of £48.5m received on 15 September (total proceeds received £108.5m (R2.349bn)
– Operational turnaround plan was on track, however significantly impacted by Coronavirus with store closures
– Approved a capital restructuring and CVA process to reduce costs (finalising objections period)
– Key concern remains the resurgence of a second Coronavirus wave which has resulted in store closures in October
– Strong performance halted by Coronavirus and impacted by the alcohol ban in South Africa; operations have reopened and
is currently ramping up to full capacity
(1) Consol is an investment held through Brait IV, and included in Braitʼs ʻother investmentsʼ portfolio
1

7 Unaudited interim results for the six months ended 30 September 2020
EXECUTIVE SUMMARY
8 Unaudited interim results for the six months ended 30 September 2020
EXECUTIVE SUMMARY
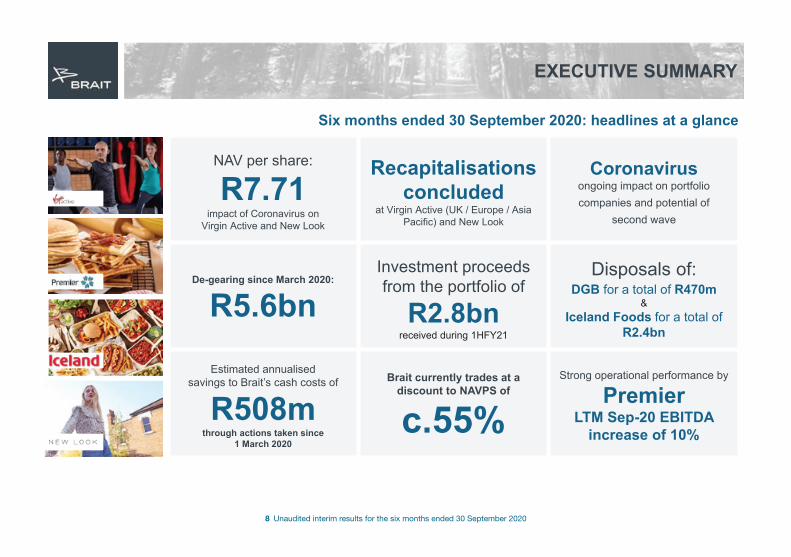
Six months ended 30 September 2020: headlines at a glance
NAV per share:
R7.71impact of Coronavirus on
Virgin Active and New Look
Recapitalisations concluded
at Virgin Active (UK / Europe / Asia Pacific) and New Look
Coronavirusongoing impact on portfoliocompanies and potential of
second wave
De-gearing since March 2020:
R5.6bnInvestment proceeds from the portfolio of
R2.8bnreceived during 1HFY21
Disposals of:DGB for a total of R470m
& Iceland Foods for a total of
R2.4bn
Estimated annualised savings to Brait’s cash costs of
R508mthrough actions taken since
1 March 2020
Brait currently trades at a discount to NAVPS of
c.55%Strong operational performance by
PremierLTM Sep-20 EBITDA
increase of 10%
9 Unaudited interim results for the six months ended 30 September 2020
BRAIT NAV & LIQUIDITY
10 Unaudited interim results for the six months ended 30 September 2020
BRAIT NAV ANALYSIS
Rand NAV per share (1)
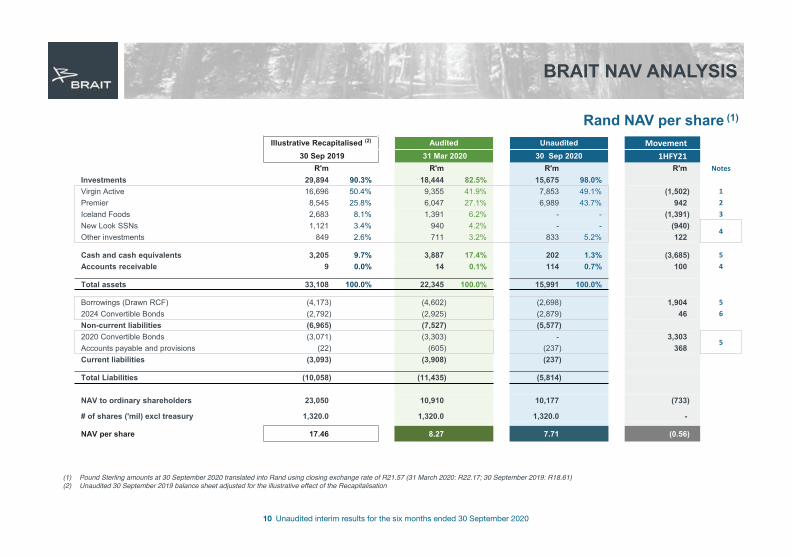
Illustrative Recapitalised (2) Audited Unaudited Movement30 Sep 2019 31 Mar 2020 30 Sep 2020 1HFY21
R'm R'm R'm R'm NotesInvestments 29,894 90.3% 18,444 82.5% 15,675 98.0%Virgin Active 16,696 50.4% 9,355 41.9% 7,853 49.1% (1,502) 1Premier 8,545 25.8% 6,047 27.1% 6,989 43.7% 942 2Iceland Foods 2,683 8.1% 1,391 6.2% - - (1,391) 3New Look SSNs 1,121 3.4% 940 4.2% - - (940)
4Other investments 849 2.6% 711 3.2% 833 5.2% 122
Cash and cash equivalents 3,205 9.7% 3,887 17.4% 202 1.3% (3,685) 5Accounts receivable 9 0.0% 14 0.1% 114 0.7% 100 4
Total assets 33,108 100.0% 22,345 100.0% 15,991 100.0%
Borrowings (Drawn RCF) (4,173) (4,602) (2,698) 1,904 52024 Convertible Bonds (2,792) (2,925) (2,879) 46 6Non-current liabilities (6,965) (7,527) (5,577)2020 Convertible Bonds (3,071) (3,303) - 3,303
5Accounts payable and provisions (22) (605) (237) 368Current liabilities (3,093) (3,908) (237)
Total Liabilities (10,058) (11,435) (5,814)
NAV to ordinary shareholders 23,050 10,910 10,177 (733)
# of shares ('mil) excl treasury 1,320.0 1,320.0 1,320.0 -
NAV per share 17.46 8.27 7.71 (0.56)
(1) Pound Sterling amounts at 30 September 2020 translated into Rand using closing exchange rate of R21.57 (31 March 2020: R22.17; 30 September 2019: R18.61)(2) Unaudited 30 September 2019 balance sheet adjusted for the illustrative effect of the Recapitalisation
11 Unaudited interim results for the six months ended 30 September 2020
BRAIT NAV ANALYSIS
# Item R’m
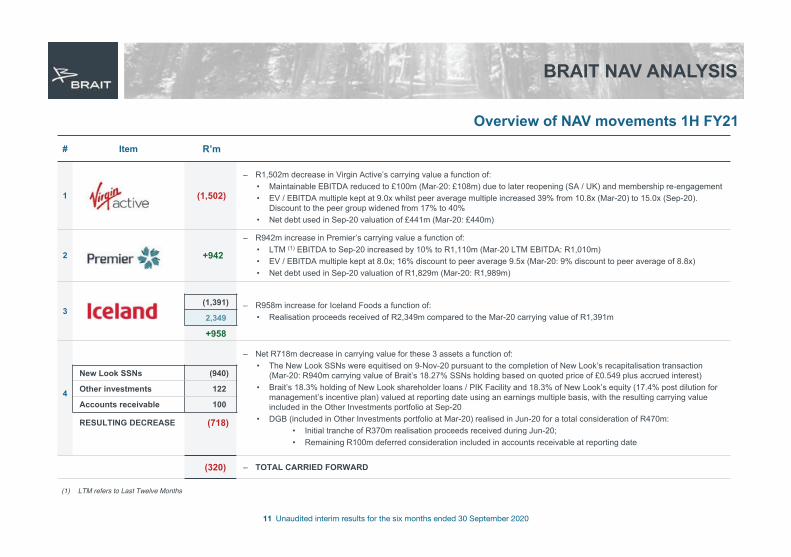
1 (1,502)
– R1,502m decrease in Virgin Active’s carrying value a function of:• Maintainable EBITDA reduced to £100m (Mar-20: £108m) due to later reopening (SA / UK) and membership re-engagement • EV / EBITDA multiple kept at 9.0x whilst peer average multiple increased 39% from 10.8x (Mar-20) to 15.0x (Sep-20).
Discount to the peer group widened from 17% to 40%• Net debt used in Sep-20 valuation of £441m (Mar-20: £440m)
2 +942
– R942m increase in Premier’s carrying value a function of:• LTM (1) EBITDA to Sep-20 increased by 10% to R1,110m (Mar-20 LTM EBITDA: R1,010m)• EV / EBITDA multiple kept at 8.0x; 16% discount to peer average 9.5x (Mar-20: 9% discount to peer average of 8.8x)• Net debt used in Sep-20 valuation of R1,829m (Mar-20: R1,989m)
3 – R958m increase for Iceland Foods a function of:• Realisation proceeds received of R2,349m compared to the Mar-20 carrying value of R1,391m
4
– Net R718m decrease in carrying value for these 3 assets a function of:• The New Look SSNs were equitised on 9-Nov-20 pursuant to the completion of New Look’s recapitalisation transaction
(Mar-20: R940m carrying value of Brait’s 18.27% SSNs holding based on quoted price of £0.549 plus accrued interest)• Brait’s 18.3% holding of New Look shareholder loans / PIK Facility and 18.3% of New Look’s equity (17.4% post dilution for
management’s incentive plan) valued at reporting date using an earnings multiple basis, with the resulting carrying value included in the Other Investments portfolio at Sep-20
• DGB (included in Other Investments portfolio at Mar-20) realised in Jun-20 for a total consideration of R470m:• Initial tranche of R370m realisation proceeds received during Jun-20; • Remaining R100m deferred consideration included in accounts receivable at reporting date
(320) – TOTAL CARRIED FORWARD
(1,391)
2,349
+958
New Look SSNs (940)
Other investments 122
Accounts receivable 100
RESULTING DECREASE (718)
Overview of NAV movements 1H FY21
(1) LTM refers to Last Twelve Months
12 Unaudited interim results for the six months ended 30 September 2020
BRAIT NAV ANALYSIS
# Item R’m
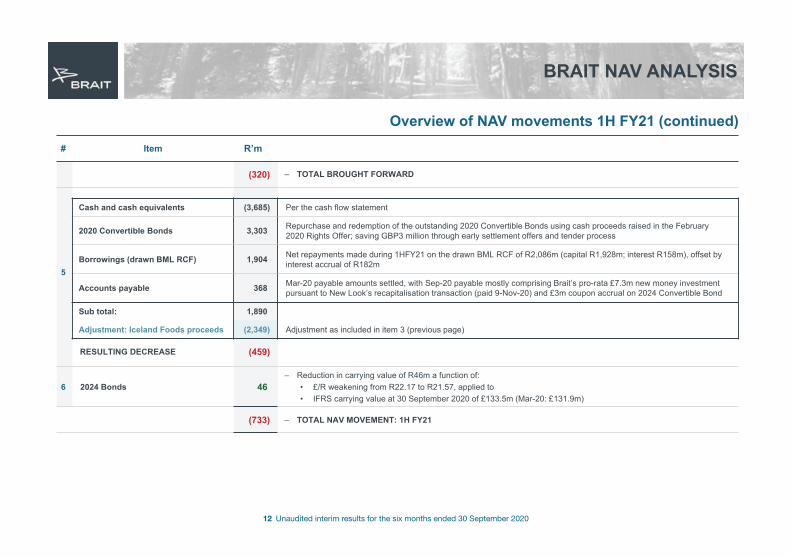
(320) – TOTAL BROUGHT FORWARD
5
6 2024 Bonds 46– Reduction in carrying value of R46m a function of:
• £/R weakening from R22.17 to R21.57, applied to • IFRS carrying value at 30 September 2020 of £133.5m (Mar-20: £131.9m)
(733) – TOTAL NAV MOVEMENT: 1H FY21
Cash and cash equivalents (3,685) Per the cash flow statement
2020 Convertible Bonds 3,303 Repurchase and redemption of the outstanding 2020 Convertible Bonds using cash proceeds raised in the February 2020 Rights Offer; saving GBP3 million through early settlement offers and tender process
Borrowings (drawn BML RCF) 1,904 Net repayments made during 1HFY21 on the drawn BML RCF of R2,086m (capital R1,928m; interest R158m), offset by interest accrual of R182m
Accounts payable 368 Mar-20 payable amounts settled, with Sep-20 payable mostly comprising Brait’s pro-rata £7.3m new money investment pursuant to New Look’s recapitalisation transaction (paid 9-Nov-20) and £3m coupon accrual on 2024 Convertible Bond
Sub total: 1,890
Adjustment: Iceland Foods proceeds (2,349) Adjustment as included in item 3 (previous page)
RESULTING DECREASE (459)
Overview of NAV movements 1H FY21 (continued)
13 Unaudited interim results for the six months ended 30 September 2020
6,348
3,303
2,925
2,925 2,879
6,4024,601
3,5482,698
Sep 19 (prerestructure)
Mar 20 (Actual) Mar-20 (incl. DGB,Iceland & VA loan)
Sep-20
Total Group debt (R million)
2020 Convertible Bond
2024 Convertible Bond
Drawn BML RCF
BRAIT LIQUIDITY & DEBT ANALYSIS
Available liquidity, debt and covenantsLIQUIDITY
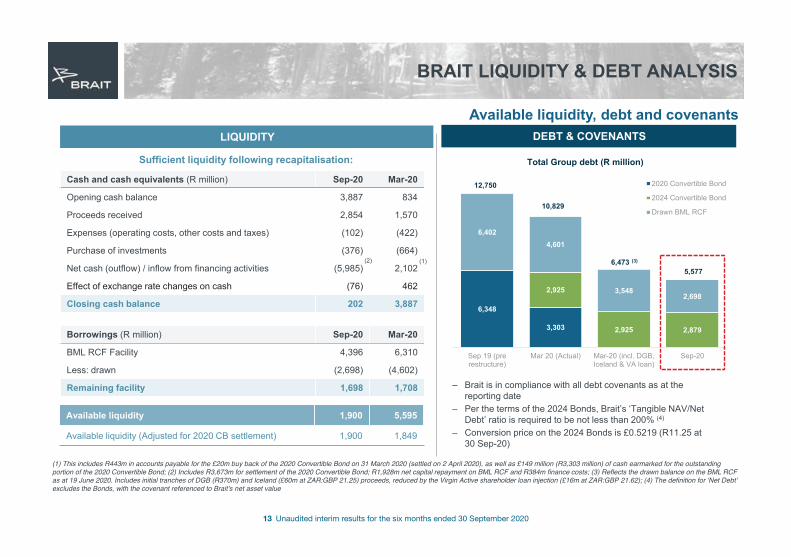
Cash and cash equivalents (R million) Sep-20 Mar-20
Opening cash balance 3,887 834
Proceeds received 2,854 1,570
Expenses (operating costs, other costs and taxes) (102) (422)
Purchase of investments (376) (664)
Net cash (outflow) / inflow from financing activities (5,985) 2,102
Effect of exchange rate changes on cash (76) 462
Closing cash balance 202 3,887
Borrowings (R million) Sep-20 Mar-20
BML RCF Facility 4,396 6,310
Less: drawn (2,698) (4,602)
Remaining facility 1,698 1,708 – Brait is in compliance with all debt covenants as at the reporting date
– Per the terms of the 2024 Bonds, Brait’s ‘Tangible NAV/Net Debt’ ratio is required to be not less than 200% (4)
– Conversion price on the 2024 Bonds is £0.5219 (R11.25 at 30 Sep-20)
Available liquidity 1,900 5,595
Available liquidity (Adjusted for 2020 CB settlement) 1,900 1,849
DEBT & COVENANTS
12,750
6,473 (3)
5,577
Sufficient liquidity following recapitalisation:
10,829
(1)(2)
(1) This includes R443m in accounts payable for the £20m buy back of the 2020 Convertible Bond on 31 March 2020 (settled on 2 April 2020), as well as £149 million (R3,303 million) of cash earmarked for the outstanding portion of the 2020 Convertible Bond; (2) Includes R3,673m for settlement of the 2020 Convertible Bond; R1,928m net capital repayment on BML RCF and R384m finance costs; (3) Reflects the drawn balance on the BML RCF as at 19 June 2020. Includes initial tranches of DGB (R370m) and Iceland (£60m at ZAR:GBP 21.25) proceeds, reduced by the Virgin Active shareholder loan injection (£16m at ZAR:GBP 21.62); (4) The definition for ʻNet Debtʼ excludes the Bonds, with the covenant referenced to Braitʼs net asset value

14 Unaudited interim results for the six months ended 30 September 2020
VIRGIN ACTIVE
Nine months ended 30 September 2020
15 Unaudited interim results for the six months ended 30 September 2020
VIRGIN ACTIVE
Overview
Brait effective economic interest
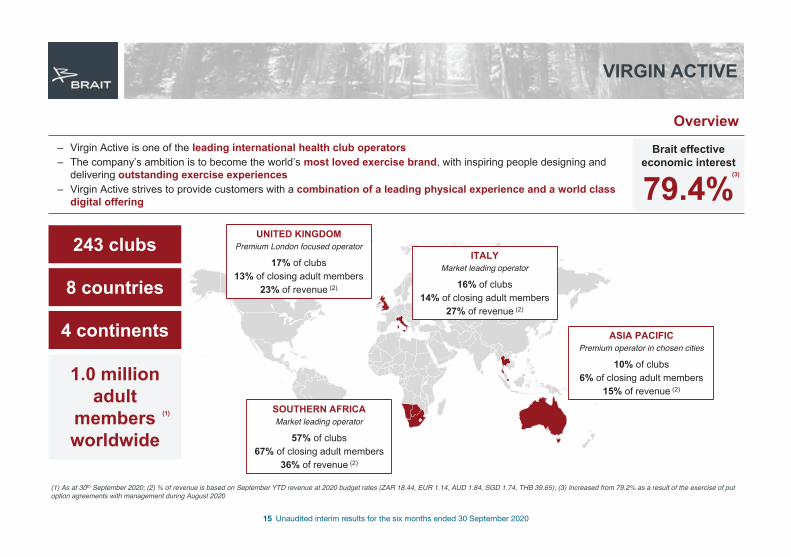
79.4%– Virgin Active is one of the leading international health club operators– The company’s ambition is to become the world’s most loved exercise brand, with inspiring people designing and
delivering outstanding exercise experiences– Virgin Active strives to provide customers with a combination of a leading physical experience and a world class
digital offering
243 clubs
8 countries
4 continents
1.0 million adult
members worldwide
UNITED KINGDOMPremium London focused operator
17% of clubs13% of closing adult members
23% of revenue (2)
SOUTHERN AFRICAMarket leading operator
57% of clubs67% of closing adult members
36% of revenue (2)
ITALYMarket leading operator
16% of clubs14% of closing adult members
27% of revenue (2)
ASIA PACIFICPremium operator in chosen cities
10% of clubs6% of closing adult members
15% of revenue (2)
(1)
(1) As at 30th September 2020; (2) % of revenue is based on September YTD revenue at 2020 budget rates (ZAR 18.44, EUR 1.14, AUD 1.84, SGD 1.74, THB 39.65); (3) Increased from 79.2% as a result of the exercise of put option agreements with management during August 2020
(3)
16 Unaudited interim results for the six months ended 30 September 2020
VIRGIN ACTIVE
Financial overview: nine months ended 30 September
REV
ENU
E (£
m)
EBIT
DA
(£m
)
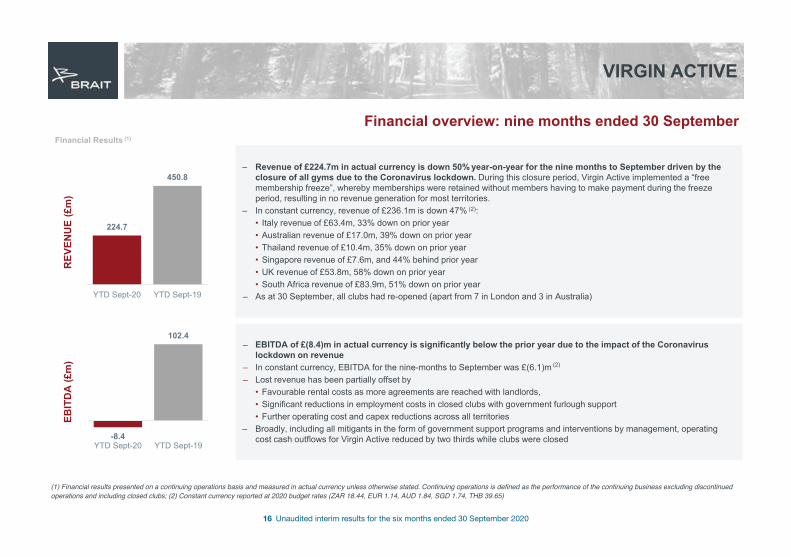
– Revenue of £224.7m in actual currency is down 50% year-on-year for the nine months to September driven by the closure of all gyms due to the Coronavirus lockdown. During this closure period, Virgin Active implemented a “free membership freeze”, whereby memberships were retained without members having to make payment during the freeze period, resulting in no revenue generation for most territories.
– In constant currency, revenue of £236.1m is down 47% (2):• Italy revenue of £63.4m, 33% down on prior year• Australian revenue of £17.0m, 39% down on prior year• Thailand revenue of £10.4m, 35% down on prior year• Singapore revenue of £7.6m, and 44% behind prior year• UK revenue of £53.8m, 58% down on prior year• South Africa revenue of £83.9m, 51% down on prior year
– As at 30 September, all clubs had re-opened (apart from 7 in London and 3 in Australia)
– EBITDA of £(8.4)m in actual currency is significantly below the prior year due to the impact of the Coronavirus lockdown on revenue
– In constant currency, EBITDA for the nine-months to September was £(6.1)m (2)
– Lost revenue has been partially offset by• Favourable rental costs as more agreements are reached with landlords, • Significant reductions in employment costs in closed clubs with government furlough support• Further operating cost and capex reductions across all territories
– Broadly, including all mitigants in the form of government support programs and interventions by management, operating cost cash outflows for Virgin Active reduced by two thirds while clubs were closed
224.7
450.8
YTD Sept-20 YTD Sept-19
-8.4
102.4
YTD Sept-20 YTD Sept-19
(1) Financial results presented on a continuing operations basis and measured in actual currency unless otherwise stated. Continuing operations is defined as the performance of the continuing business excluding discontinued operations and including closed clubs; (2) Constant currency reported at 2020 budget rates (ZAR 18.44, EUR 1.14, AUD 1.84, SGD 1.74, THB 39.65)
Financial Results (1)
17 Unaudited interim results for the six months ended 30 September 2020
VIRGIN ACTIVE
Update on the VA territories
ITALY
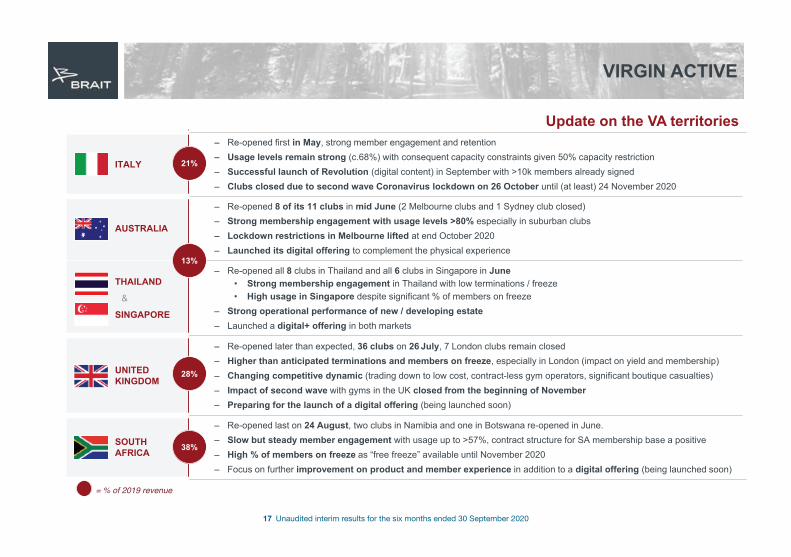
– Re-opened first in May, strong member engagement and retention– Usage levels remain strong (c.68%) with consequent capacity constraints given 50% capacity restriction– Successful launch of Revolution (digital content) in September with >10k members already signed– Clubs closed due to second wave Coronavirus lockdown on 26 October until (at least) 24 November 2020
AUSTRALIA
– Re-opened 8 of its 11 clubs in mid June (2 Melbourne clubs and 1 Sydney club closed) – Strong membership engagement with usage levels >80% especially in suburban clubs– Lockdown restrictions in Melbourne lifted at end October 2020 – Launched its digital offering to complement the physical experience
THAILAND
&
SINGAPORE
– Re-opened all 8 clubs in Thailand and all 6 clubs in Singapore in June• Strong membership engagement in Thailand with low terminations / freeze• High usage in Singapore despite significant % of members on freeze
– Strong operational performance of new / developing estate– Launched a digital+ offering in both markets
UNITED KINGDOM
– Re-opened later than expected, 36 clubs on 26 July, 7 London clubs remain closed– Higher than anticipated terminations and members on freeze, especially in London (impact on yield and membership)– Changing competitive dynamic (trading down to low cost, contract-less gym operators, significant boutique casualties)– Impact of second wave with gyms in the UK closed from the beginning of November– Preparing for the launch of a digital offering (being launched soon)
SOUTH AFRICA
– Re-opened last on 24 August, two clubs in Namibia and one in Botswana re-opened in June. – Slow but steady member engagement with usage up to >57%, contract structure for SA membership base a positive– High % of members on freeze as “free freeze” available until November 2020– Focus on further improvement on product and member experience in addition to a digital offering (being launched soon)
21%
13%
28%
38%
= % of 2019 revenue
18 Unaudited interim results for the six months ended 30 September 2020
VIRGIN ACTIVE
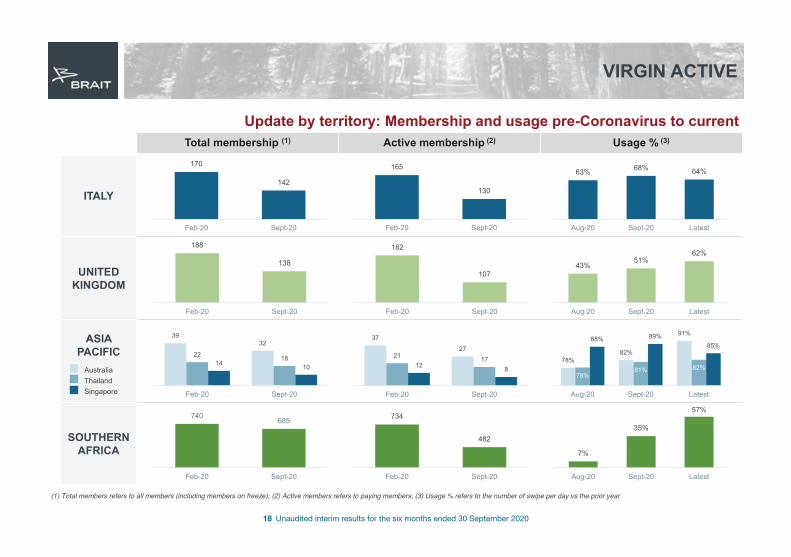
Update by territory: Membership and usage pre-Coronavirus to currentTotal membership (1) Active membership (2) Usage % (3)
ITALY
UNITED KINGDOM
ASIA PACIFIC
SOUTHERN AFRICA
170
142
Feb-20 Sept-20
165
130
Feb-20 Sept-20
188
138
Feb-20 Sept-20
182
107
Feb-20 Sept-20
3932
22 1814 10
Feb-20 Sept-20
37
2721 17
12 8
Feb-20 Sept-20
740 685
Feb-20 Sept-20
734
482
Feb-20 Sept-20
AustraliaThailandSingapore
63% 68% 64%
Aug-20 Sept-20 Latest
43%51%
62%
Aug-20 Sept-20 Latest
78%82%
91%
78%81% 82%
88% 89%85%
Aug-20 Sept-20 Latest
7%
35%
57%
Aug-20 Sept-20 Latest
(1) Total members refers to all members (including members on freeze); (2) Active members refers to paying members; (3) Usage % refers to the number of swipe per day vs the prior year
19 Unaudited interim results for the six months ended 30 September 2020
Re-opened in May
11 1110
0 1
8 87
8
02468
1012
Jan-20 Feb-20 Mar-20 Apr-20 May-20 Jun-20 Jul-20 Aug-20 Sep-20
Rev
enue
(£m
)
Revenue
166 165
0 0
147124 109 122 130
68%
0%
50%
100%
150%
0
100
200
Jan-20 Feb-20 Mar-20 Apr-20 May-20 Jun-20 Jul-20 Aug-20 Sep-20
Usa
ge %
vs
PY
Activ
e m
embe
rs (‘
000)
Active membership and usage %Active membership Usage
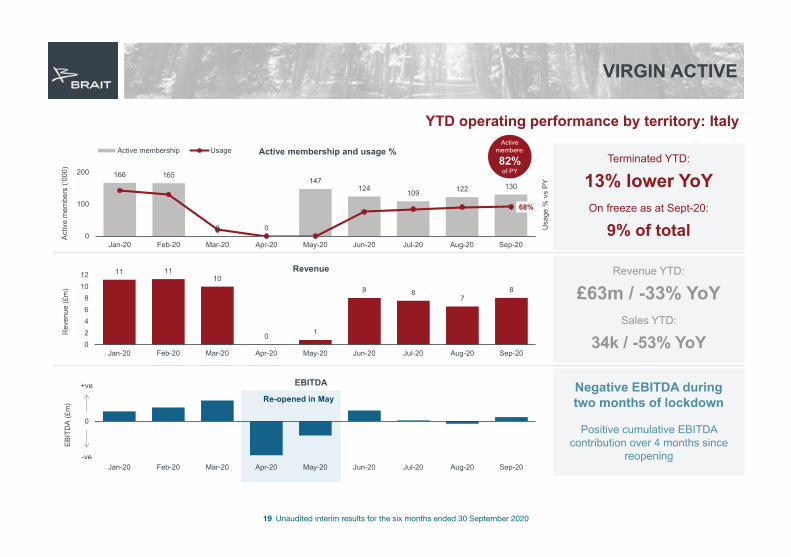
VIRGIN ACTIVE
YTD operating performance by territory: Italy
Terminated YTD:
On freeze as at Sept-20:
13% lower YoY
9% of total
Active members:
82%of PY
Revenue YTD:
£63m / -33% YoYSales YTD:
34k / -53% YoY
Jan-20 Feb-20 Mar-20 Apr-20 May-20 Jun-20 Jul-20 Aug-20 Sep-20
EBIT
DA
(£m
)
EBITDA Negative EBITDA during two months of lockdown
Positive cumulative EBITDA contribution over 4 months since
reopening
0
+ve
-ve
20 Unaudited interim results for the six months ended 30 September 2020
Re-opened on 26 July
13 14
9
0
0 02
8 8
-5
0
5
10
15
Jan-20 Feb-20 Mar-20 Apr-20 May-20 Jun-20 Jul-20 Aug-20 Sep-20Rev
enue
(£m
)
Revenue
182 182
0 0 0 0
108 107 107
51%
0%
50%
100%
150%
0
100
200
Jan-20 Feb-20 Mar-20 Apr-20 May-20 Jun-20 Jul-20 Aug-20 Sep-20
Usa
ge %
vs
PY
Activ
e m
embe
rs (‘
000)
Active membership and usage %Active membership Usage
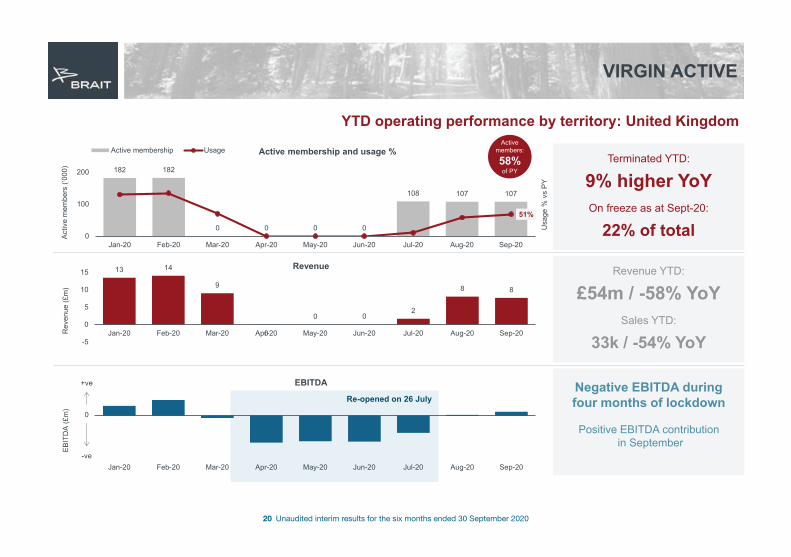
VIRGIN ACTIVE
YTD operating performance by territory: United Kingdom
Terminated YTD:
On freeze as at Sept-20:
9% higher YoY
22% of total
Revenue YTD:
£54m / -58% YoYSales YTD:
33k / -54% YoY
Jan-20 Feb-20 Mar-20 Apr-20 May-20 Jun-20 Jul-20 Aug-20 Sep-20
EBIT
DA
(£m
)
EBITDA Negative EBITDA during four months of lockdown
Positive EBITDA contributionin September
Active members:
58%of PY
0
+ve
-ve
21 Unaudited interim results for the six months ended 30 September 2020
Re-opened in June
70 70
0 0 0
58 52 52 5383%
0%
50%
100%
150%
0
50
100
Jan-20 Feb-20 Mar-20 Apr-20 May-20 Jun-20 Jul-20 Aug-20 Sep-20
Usa
ge %
vs
PY
Activ
e m
embe
rs (‘
000)
Active membership and usage %Active membership Usage
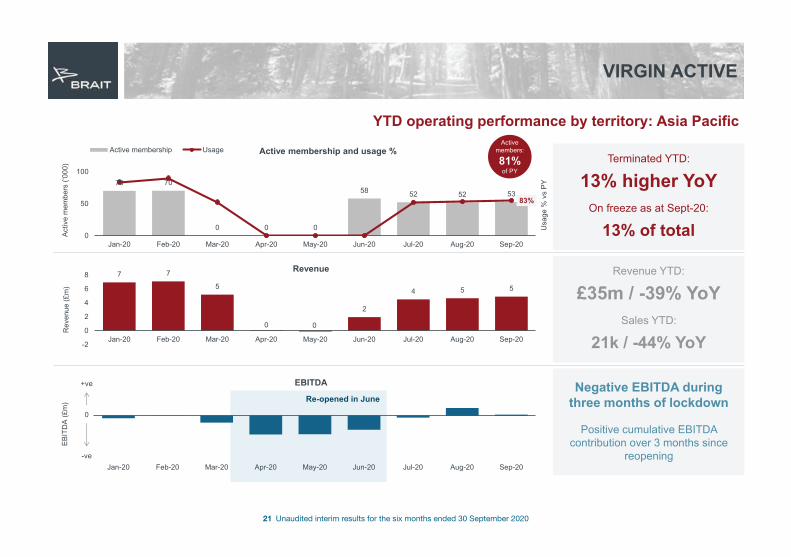
VIRGIN ACTIVE
YTD operating performance by territory: Asia Pacific
Terminated YTD:
On freeze as at Sept-20:
13% higher YoY
13% of total
Revenue YTD:
£35m / -39% YoYSales YTD:
21k / -44% YoY
7 7
5
0 0
2
4 5 5
-2
0
2
4
6
8
Jan-20 Feb-20 Mar-20 Apr-20 May-20 Jun-20 Jul-20 Aug-20 Sep-20
Rev
enue
(£m
)
Revenue
Jan-20 Feb-20 Mar-20 Apr-20 May-20 Jun-20 Jul-20 Aug-20 Sep-20
EBIT
DA
(£m
)
EBITDA Negative EBITDA during three months of lockdown
Positive cumulative EBITDA contribution over 3 months since
reopening
Active members:
81%of PY
0
+ve
-ve
22 Unaudited interim results for the six months ended 30 September 2020
739 734 718 697 702 701 693519 482
35%
0%
50%
100%
0
500
1,000
Jan-20 Feb-20 Mar-20 Apr-20 May-20 Jun-20 Jul-20 Aug-20 Sep-20
Usa
ge %
of P
Y
Activ
e m
embe
rs (‘
000)
Active membership and usage %Active membership Usage
Re-opened on 24 August
19 2017
2 3 30
7
13
0
5
10
15
20
25
Jan-20 Feb-20 Mar-20 Apr-20 May-20 Jun-20 Jul-20 Aug-20 Sep-20
Rev
enue
(£m
)
Revenue
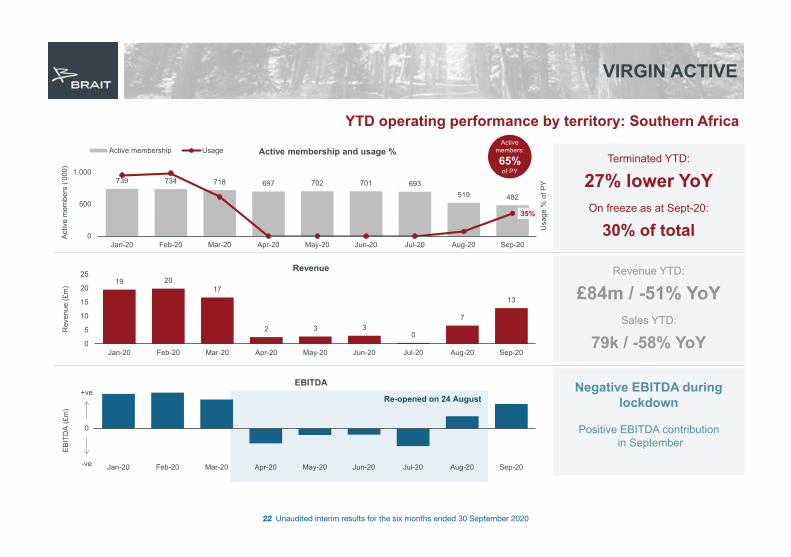
VIRGIN ACTIVE
YTD operating performance by territory: Southern Africa
Terminated YTD:
On freeze as at Sept-20:
27% lower YoY
30% of total
Revenue YTD:
£84m / -51% YoYSales YTD:
79k / -58% YoY
Jan-20 Feb-20 Mar-20 Apr-20 May-20 Jun-20 Jul-20 Aug-20 Sep-20
EBIT
DA
(£m
)
EBITDA Negative EBITDA during lockdown
Positive EBITDA contributionin September
Active members:
65%of PY
0
+ve
-ve
23 Unaudited interim results for the six months ended 30 September 2020
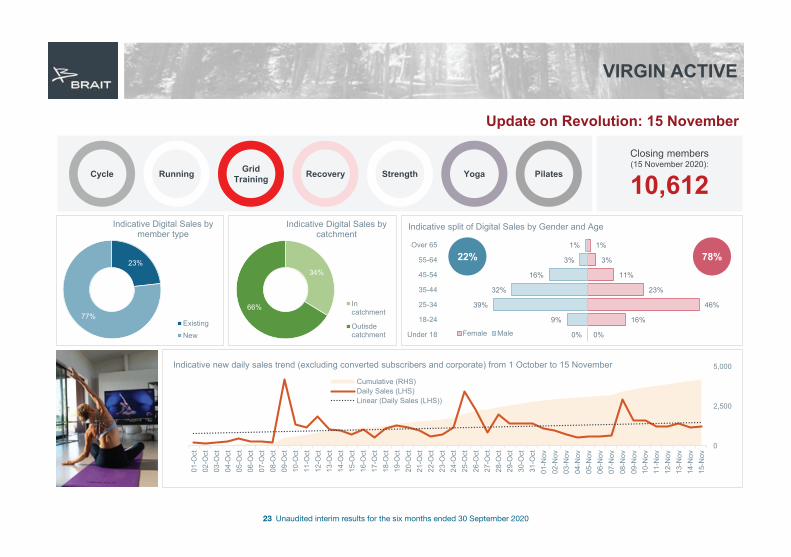
0%
9%
39%
32%
16%
3%
1%
0%
16%
46%
23%
11%
3%
1%
Under 18
18-24
25-34
35-44
45-54
55-64
Over 65
Indicative split of Digital Sales by Gender and Age
Female Male
VIRGIN ACTIVE
Update on Revolution: 15 November
Closing members (15 November 2020):
10,612
22% 78%23%
77%
Indicative Digital Sales by member type
ExistingNew
34%
66%
Indicative Digital Sales by catchment
Incatchment
Outisdecatchment
Cycle Running Grid Training Recovery Strength Yoga Pilates
0
2,500
5,000
0
100
200
300
400
01-O
ct02
-Oct
03-O
ct04
-Oct
05-O
ct06
-Oct
07-O
ct08
-Oct
09-O
ct10
-Oct
11-O
ct12
-Oct
13-O
ct14
-Oct
15-O
ct16
-Oct
17-O
ct18
-Oct
19-O
ct20
-Oct
21-O
ct22
-Oct
23-O
ct24
-Oct
25-O
ct26
-Oct
27-O
ct28
-Oct
29-O
ct30
-Oct
31-O
ct01
-Nov
02-N
ov03
-Nov
04-N
ov05
-Nov
06-N
ov07
-Nov
08-N
ov09
-Nov
10-N
ov11
-Nov
12-N
ov13
-Nov
14-N
ov15
-Nov
Indicative new daily sales trend (excluding converted subscribers and corporate) from 1 October to 15 November
Cumulative (RHS)Daily Sales (LHS)Linear (Daily Sales (LHS))
24 Unaudited interim results for the six months ended 30 September 2020
PREMIER
Six months ended 30 September 2020
25 Unaudited interim results for the six months ended 30 September 2020
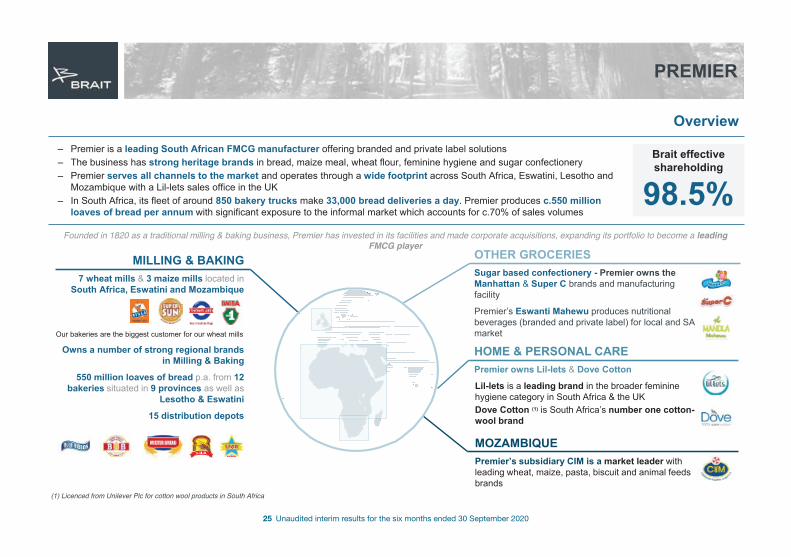
MILLING & BAKING7 wheat mills & 3 maize mills located in
South Africa, Eswatini and Mozambique
Our bakeries are the biggest customer for our wheat mills
Owns a number of strong regional brands in Milling & Baking
550 million loaves of bread p.a. from 12 bakeries situated in 9 provinces as well as
Lesotho & Eswatini
15 distribution depots
PREMIER
Overview
Brait effective shareholding
98.5%– Premier is a leading South African FMCG manufacturer offering branded and private label solutions– The business has strong heritage brands in bread, maize meal, wheat flour, feminine hygiene and sugar confectionery– Premier serves all channels to the market and operates through a wide footprint across South Africa, Eswatini, Lesotho and
Mozambique with a Lil-lets sales office in the UK– In South Africa, its fleet of around 850 bakery trucks make 33,000 bread deliveries a day. Premier produces c.550 million
loaves of bread per annum with significant exposure to the informal market which accounts for c.70% of sales volumes
Founded in 1820 as a traditional milling & baking business, Premier has invested in its facilities and made corporate acquisitions, expanding its portfolio to become a leading FMCG player
OTHER GROCERIES Sugar based confectionery - Premier owns theManhattan & Super C brands and manufacturing facility
Premier’s Eswanti Mahewu produces nutritional beverages (branded and private label) for local and SA market
HOME & PERSONAL CAREPremier owns Lil-lets & Dove Cotton
Lil-lets is a leading brand in the broader feminine hygiene category in South Africa & the UKDove Cotton (1) is South Africa’s number one cotton-wool brand
MOZAMBIQUEPremier’s subsidiary CIM is a market leader with leading wheat, maize, pasta, biscuit and animal feeds brands
(1) Licenced from Unilever Plc for cotton wool products in South Africa
26 Unaudited interim results for the six months ended 30 September 2020
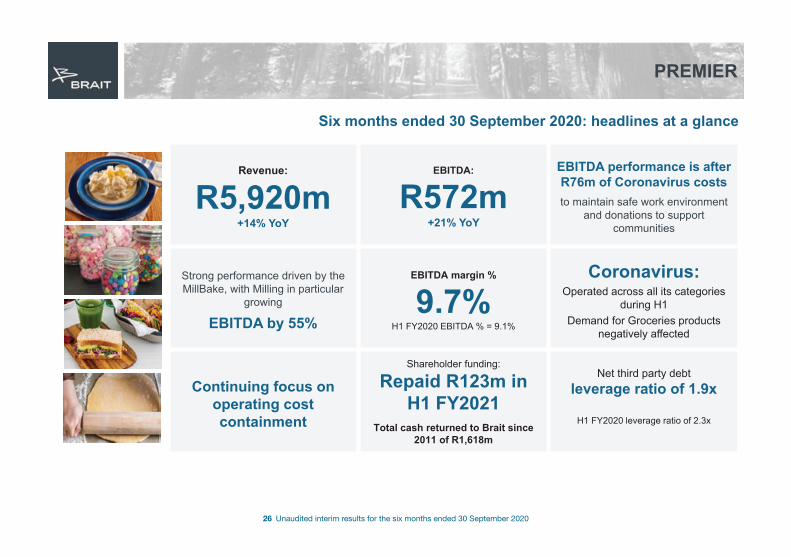
PREMIER
Six months ended 30 September 2020: headlines at a glance
Revenue:
R5,920m+14% YoY
EBITDA:
R572m+21% YoY
EBITDA performance is after R76m of Coronavirus coststo maintain safe work environment
and donations to support communities
Strong performance driven by the MillBake, with Milling in particular
growing
EBITDA by 55%
EBITDA margin %
9.7%H1 FY2020 EBITDA % = 9.1%
Coronavirus:Operated across all its categories
during H1Demand for Groceries products
negatively affected
Continuing focus on operating cost containment
Shareholder funding:
Repaid R123m in H1 FY2021
Total cash returned to Brait since 2011 of R1,618m
Net third party debt leverage ratio of 1.9x
H1 FY2020 leverage ratio of 2.3x
27 Unaudited interim results for the six months ended 30 September 2020
PREMIER
Performance overview to 30 September 2020
OPERATIONAL PERFORMANCE
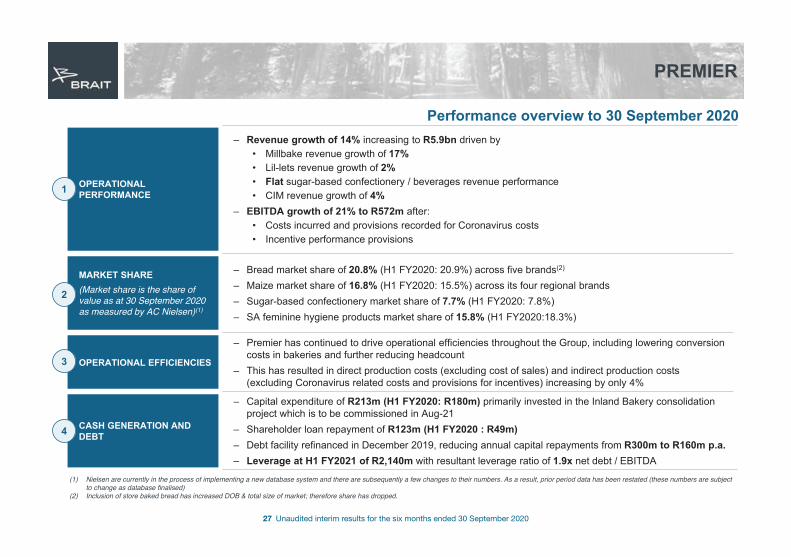
– Revenue growth of 14% increasing to R5.9bn driven by• Millbake revenue growth of 17%• Lil-lets revenue growth of 2%• Flat sugar-based confectionery / beverages revenue performance• CIM revenue growth of 4%
– EBITDA growth of 21% to R572m after:• Costs incurred and provisions recorded for Coronavirus costs• Incentive performance provisions
MARKET SHARE(Market share is the share of value as at 30 September 2020 as measured by AC Nielsen)(1)
– Bread market share of 20.8% (H1 FY2020: 20.9%) across five brands(2)
– Maize market share of 16.8% (H1 FY2020: 15.5%) across its four regional brands– Sugar-based confectionery market share of 7.7% (H1 FY2020: 7.8%)– SA feminine hygiene products market share of 15.8% (H1 FY2020:18.3%)
OPERATIONAL EFFICIENCIES
– Premier has continued to drive operational efficiencies throughout the Group, including lowering conversion costs in bakeries and further reducing headcount
– This has resulted in direct production costs (excluding cost of sales) and indirect production costs (excluding Coronavirus related costs and provisions for incentives) increasing by only 4%
CASH GENERATION AND DEBT
– Capital expenditure of R213m (H1 FY2020: R180m) primarily invested in the Inland Bakery consolidation project which is to be commissioned in Aug-21
– Shareholder loan repayment of R123m (H1 FY2020 : R49m)– Debt facility refinanced in December 2019, reducing annual capital repayments from R300m to R160m p.a. – Leverage at H1 FY2021 of R2,140m with resultant leverage ratio of 1.9x net debt / EBITDA
1
2
3
4
(1) Nielsen are currently in the process of implementing a new database system and there are subsequently a few changes to their numbers. As a result, prior period data has been restated (these numbers are subject to change as database finalised)
(2) Inclusion of store baked bread has increased DOB & total size of market; therefore share has dropped.
28 Unaudited interim results for the six months ended 30 September 2020
PREMIER
Income statement: Six months ended 30 September 2020
5,9205,198
H1 FY2021 H1 FY2020
572474
H1 FY2021 H1 FY2020
378294
H1 FY2021 H1 FY2020
REV
ENU
E (R
m)
EBIT
DA
(1)(R
m)
EBIT
(1)(R
m)
(Bef
ore
impa
irmen
ts)
% growth
+14%
+21%
+28%
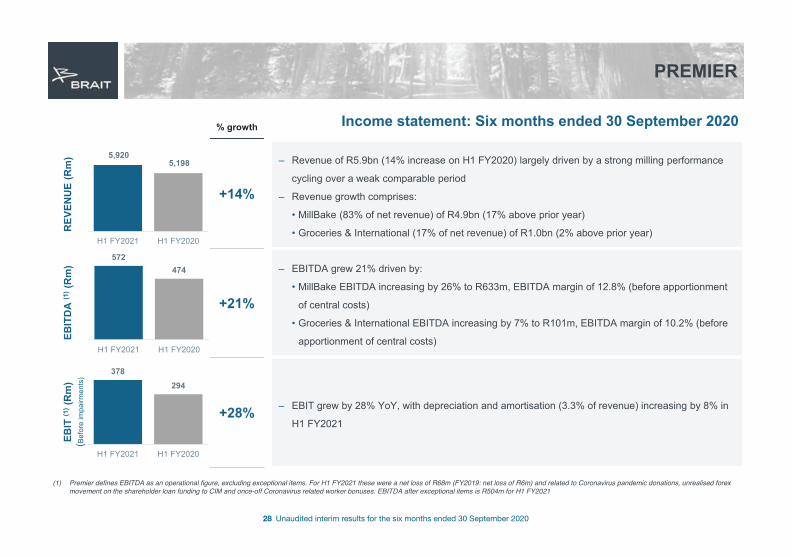
– Revenue of R5.9bn (14% increase on H1 FY2020) largely driven by a strong milling performance
cycling over a weak comparable period
– Revenue growth comprises:
• MillBake (83% of net revenue) of R4.9bn (17% above prior year)
• Groceries & International (17% of net revenue) of R1.0bn (2% above prior year)
– EBITDA grew 21% driven by:
• MillBake EBITDA increasing by 26% to R633m, EBITDA margin of 12.8% (before apportionment
of central costs)
• Groceries & International EBITDA increasing by 7% to R101m, EBITDA margin of 10.2% (before
apportionment of central costs)
– EBIT grew by 28% YoY, with depreciation and amortisation (3.3% of revenue) increasing by 8% in
H1 FY2021
(1) Premier defines EBITDA as an operational figure, excluding exceptional items. For H1 FY2021 these were a net loss of R68m (FY2019: net loss of R6m) and related to Coronavirus pandemic donations, unrealised forex movement on the shareholder loan funding to CIM and once-off Coronavirus related worker bonuses. EBITDA after exceptional items is R504m for H1 FY2021
29 Unaudited interim results for the six months ended 30 September 2020
PREMIER
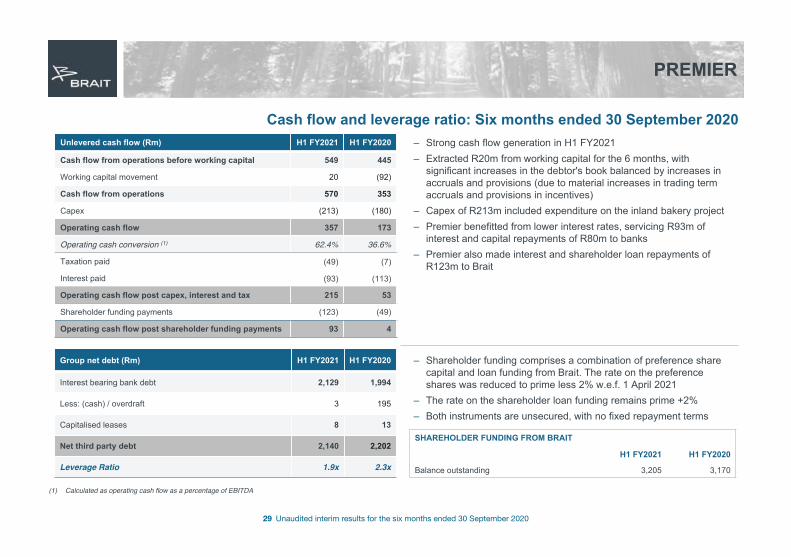
Cash flow and leverage ratio: Six months ended 30 September 2020– Strong cash flow generation in H1 FY2021– Extracted R20m from working capital for the 6 months, with
significant increases in the debtor's book balanced by increases in accruals and provisions (due to material increases in trading term accruals and provisions in incentives)
– Capex of R213m included expenditure on the inland bakery project– Premier benefitted from lower interest rates, servicing R93m of
interest and capital repayments of R80m to banks– Premier also made interest and shareholder loan repayments of
R123m to Brait
Unlevered cash flow (Rm) H1 FY2021 H1 FY2020
Cash flow from operations before working capital 549 445
Working capital movement 20 (92)
Cash flow from operations 570 353
Capex (213) (180)
Operating cash flow 357 173
Operating cash conversion (1) 62.4% 36.6%
Taxation paid (49) (7)
Interest paid (93) (113)
Operating cash flow post capex, interest and tax 215 53
Shareholder funding payments (123) (49)
Operating cash flow post shareholder funding payments 93 4
Group net debt (Rm) H1 FY2021 H1 FY2020
Interest bearing bank debt 2,129 1,994
Less: (cash) / overdraft 3 195
Capitalised leases 8 13
Net third party debt 2,140 2,202
Leverage Ratio 1.9x 2.3x
– Shareholder funding comprises a combination of preference share capital and loan funding from Brait. The rate on the preference shares was reduced to prime less 2% w.e.f. 1 April 2021
– The rate on the shareholder loan funding remains prime +2%– Both instruments are unsecured, with no fixed repayment terms
SHAREHOLDER FUNDING FROM BRAIT
H1 FY2021 H1 FY2020
Balance outstanding 3,205 3,170
(1) Calculated as operating cash flow as a percentage of EBITDA
30 Unaudited interim results for the six months ended 30 September 2020
PREMIER
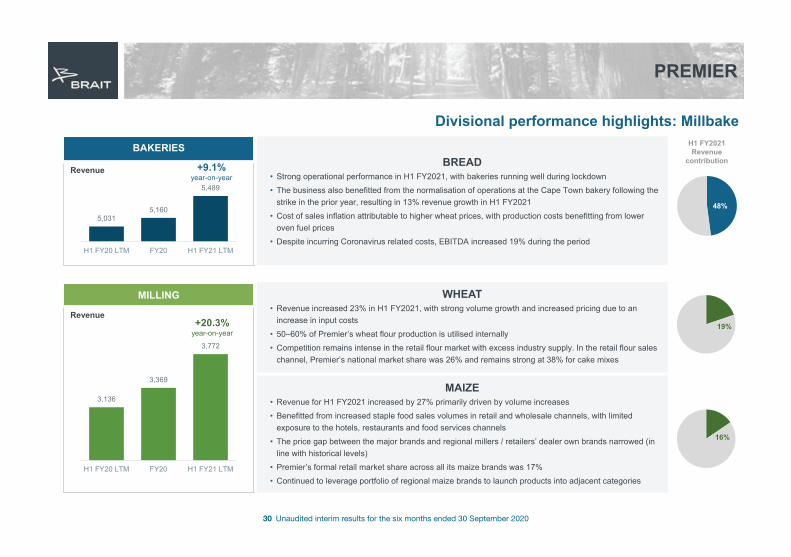
Divisional performance highlights: MillbakeBAKERIES
Revenue
5,0315,160
5,489
H1 FY20 LTM FY20 H1 FY21 LTM
+9.1% year-on-year
BREAD• Strong operational performance in H1 FY2021, with bakeries running well during lockdown• The business also benefitted from the normalisation of operations at the Cape Town bakery following the
strike in the prior year, resulting in 13% revenue growth in H1 FY2021• Cost of sales inflation attributable to higher wheat prices, with production costs benefitting from lower
oven fuel prices• Despite incurring Coronavirus related costs, EBITDA increased 19% during the period
WHEAT• Revenue increased 23% in H1 FY2021, with strong volume growth and increased pricing due to an
increase in input costs• 50–60% of Premier’s wheat flour production is utilised internally• Competition remains intense in the retail flour market with excess industry supply. In the retail flour sales
channel, Premier’s national market share was 26% and remains strong at 38% for cake mixes
MAIZE• Revenue for H1 FY2021 increased by 27% primarily driven by volume increases• Benefitted from increased staple food sales volumes in retail and wholesale channels, with limited
exposure to the hotels, restaurants and food services channels• The price gap between the major brands and regional millers / retailers’ dealer own brands narrowed (in
line with historical levels)• Premier’s formal retail market share across all its maize brands was 17%• Continued to leverage portfolio of regional maize brands to launch products into adjacent categories
48%
H1 FY2021 Revenue
contribution
19%
16%
MILLING
Revenue
3,136
3,369
3,772
H1 FY20 LTM FY20 H1 FY21 LTM
+20.3%year-on-year
31 Unaudited interim results for the six months ended 30 September 2020
1,883
2,0182,041
H1 FY20 LTM FY20 H1 FY21 LTM
PREMIER
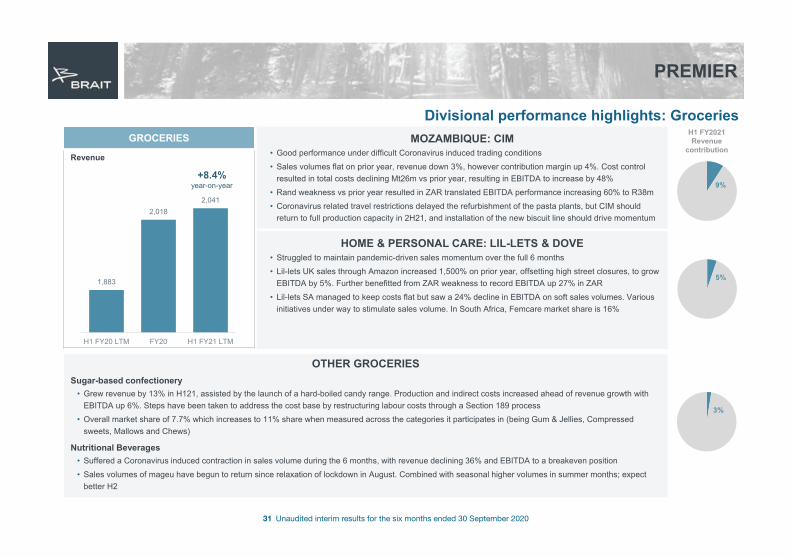
Divisional performance highlights: GroceriesGROCERIES
Revenue
MOZAMBIQUE: CIM• Good performance under difficult Coronavirus induced trading conditions• Sales volumes flat on prior year, revenue down 3%, however contribution margin up 4%. Cost control
resulted in total costs declining Mt26m vs prior year, resulting in EBITDA to increase by 48%• Rand weakness vs prior year resulted in ZAR translated EBITDA performance increasing 60% to R38m• Coronavirus related travel restrictions delayed the refurbishment of the pasta plants, but CIM should
return to full production capacity in 2H21, and installation of the new biscuit line should drive momentum
HOME & PERSONAL CARE: LIL-LETS & DOVE• Struggled to maintain pandemic-driven sales momentum over the full 6 months• Lil-lets UK sales through Amazon increased 1,500% on prior year, offsetting high street closures, to grow
EBITDA by 5%. Further benefitted from ZAR weakness to record EBITDA up 27% in ZAR• Lil-lets SA managed to keep costs flat but saw a 24% decline in EBITDA on soft sales volumes. Various
initiatives under way to stimulate sales volume. In South Africa, Femcare market share is 16%
OTHER GROCERIESSugar-based confectionery
• Grew revenue by 13% in H121, assisted by the launch of a hard-boiled candy range. Production and indirect costs increased ahead of revenue growth with EBITDA up 6%. Steps have been taken to address the cost base by restructuring labour costs through a Section 189 process
• Overall market share of 7.7% which increases to 11% share when measured across the categories it participates in (being Gum & Jellies, Compressed sweets, Mallows and Chews)
Nutritional Beverages• Suffered a Coronavirus induced contraction in sales volume during the 6 months, with revenue declining 36% and EBITDA to a breakeven position• Sales volumes of mageu have begun to return since relaxation of lockdown in August. Combined with seasonal higher volumes in summer months; expect
better H2
H1 FY2021 Revenue
contribution
+8.4% year-on-year
5%
3%
9%

32 Unaudited interim results for the six months ended 30 September 2020
NEW LOOK
UPDATE
33 Unaudited interim results for the six months ended 30 September 2020
NEW LOOK
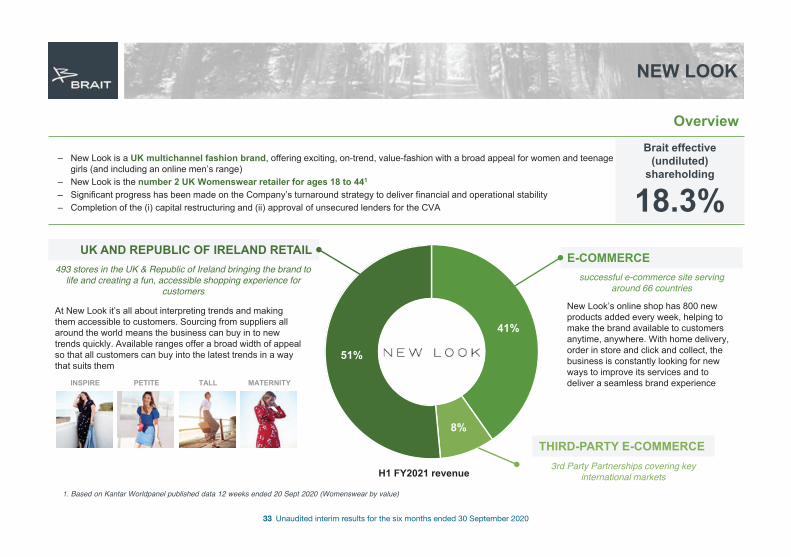
OverviewBrait effective
(undiluted) shareholding
18.3%– New Look is a UK multichannel fashion brand, offering exciting, on-trend, value-fashion with a broad appeal for women and teenage
girls (and including an online men’s range)– New Look is the number 2 UK Womenswear retailer for ages 18 to 441
– Significant progress has been made on the Company’s turnaround strategy to deliver financial and operational stability– Completion of the (i) capital restructuring and (ii) approval of unsecured lenders for the CVA
41%
8%
51%
H1 FY2021 revenue
UK AND REPUBLIC OF IRELAND RETAIL E-COMMERCE
THIRD-PARTY E-COMMERCE
successful e-commerce site serving around 66 countries
3rd Party Partnerships covering key international markets
493 stores in the UK & Republic of Ireland bringing the brand to life and creating a fun, accessible shopping experience for
customers
At New Look it’s all about interpreting trends and making them accessible to customers. Sourcing from suppliers all around the world means the business can buy in to new trends quickly. Available ranges offer a broad width of appeal so that all customers can buy into the latest trends in a way that suits them
New Look’s online shop has 800 new products added every week, helping to make the brand available to customers anytime, anywhere. With home delivery, order in store and click and collect, the business is constantly looking for new ways to improve its services and to deliver a seamless brand experienceINSPIRE PETITE TALL MATERNITY
1. Based on Kantar Worldpanel published data 12 weeks ended 20 Sept 2020 (Womenswear by value)
34 Unaudited interim results for the six months ended 30 September 2020
NEW LOOK
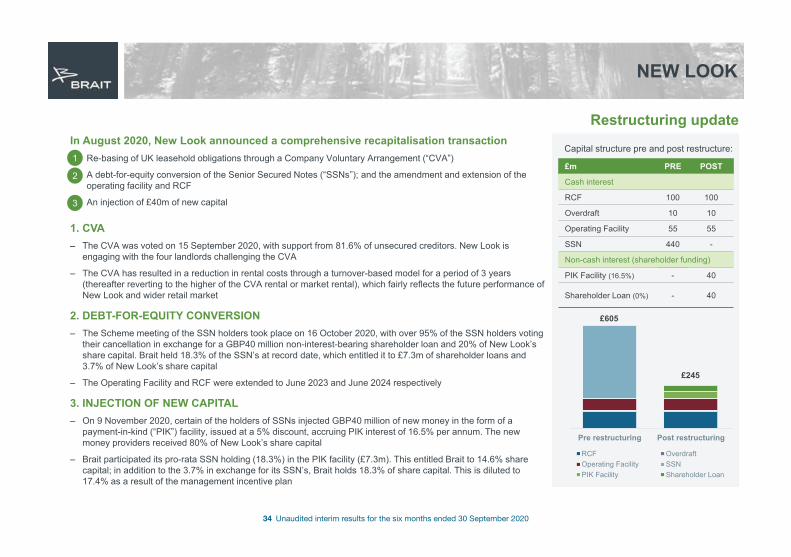
Capital structure pre and post restructure:
£m PRE POST
Cash interest
RCF 100 100
Overdraft 10 10
Operating Facility 55 55
SSN 440 -
Non-cash interest (shareholder funding)
PIK Facility (16.5%) - 40
Shareholder Loan (0%) - 40
Pre restructuring Post restructuring
RCF OverdraftOperating Facility SSNPIK Facility Shareholder Loan
£605
£245
In August 2020, New Look announced a comprehensive recapitalisation transaction1. Re-basing of UK leasehold obligations through a Company Voluntary Arrangement (“CVA”)
2. A debt-for-equity conversion of the Senior Secured Notes (“SSNs”); and the amendment and extension of the operating facility and RCF
3. An injection of £40m of new capital
1. CVA– The CVA was voted on 15 September 2020, with support from 81.6% of unsecured creditors. New Look is
engaging with the four landlords challenging the CVA
– The CVA has resulted in a reduction in rental costs through a turnover-based model for a period of 3 years (thereafter reverting to the higher of the CVA rental or market rental), which fairly reflects the future performance of New Look and wider retail market
2. DEBT-FOR-EQUITY CONVERSION– The Scheme meeting of the SSN holders took place on 16 October 2020, with over 95% of the SSN holders voting
their cancellation in exchange for a GBP40 million non-interest-bearing shareholder loan and 20% of New Look’s share capital. Brait held 18.3% of the SSN’s at record date, which entitled it to £7.3m of shareholder loans and 3.7% of New Look’s share capital
– The Operating Facility and RCF were extended to June 2023 and June 2024 respectively
3. INJECTION OF NEW CAPITAL– On 9 November 2020, certain of the holders of SSNs injected GBP40 million of new money in the form of a
payment-in-kind (“PIK”) facility, issued at a 5% discount, accruing PIK interest of 16.5% per annum. The new money providers received 80% of New Look’s share capital
– Brait participated its pro-rata SSN holding (18.3%) in the PIK facility (£7.3m). This entitled Brait to 14.6% share capital; in addition to the 3.7% in exchange for its SSN’s, Brait holds 18.3% of share capital. This is diluted to 17.4% as a result of the management incentive plan
1
2
3
Restructuring update

35 Unaudited interim results for the six months ended 30 September 2020
PORTFOLIO VALUATIONS
36 Unaudited interim results for the six months ended 30 September 2020
VALUATION OVERVIEW
Virgin Active
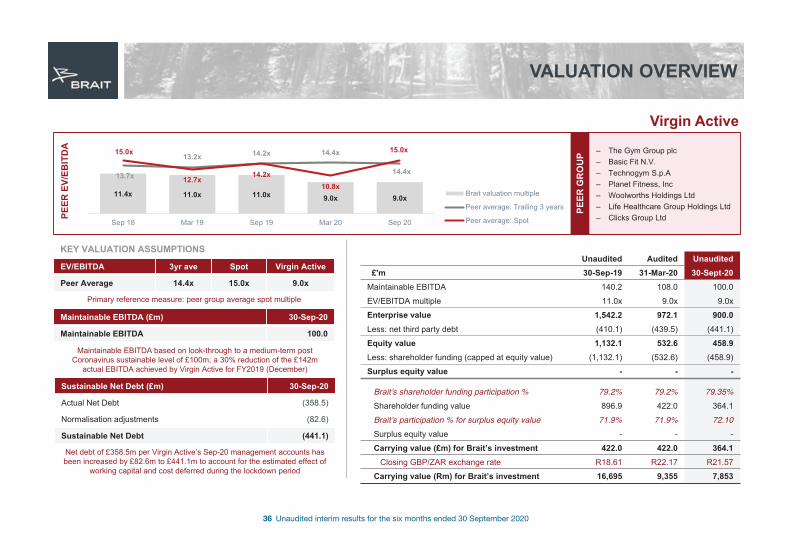
Unaudited Audited Unaudited£'m 30-Sep-19 31-Mar-20 30-Sept-20
Maintainable EBITDA 140.2 108.0 100.0
EV/EBITDA multiple 11.0x 9.0x 9.0xEnterprise value 1,542.2 972.1 900.0Less: net third party debt (410.1) (439.5) (441.1)Equity value 1,132.1 532.6 458.9Less: shareholder funding (capped at equity value) (1,132.1) (532.6) (458.9)Surplus equity value - - -
Braitʼs shareholder funding participation % 79.2% 79.2% 79.35%Shareholder funding value 896.9 422.0 364.1Braitʼs participation % for surplus equity value 71.9% 71.9% 72.10Surplus equity value - - -Carrying value (£m) for Brait’s investment 422.0 422.0 364.1
Closing GBP/ZAR exchange rate R18.61 R22.17 R21.57Carrying value (Rm) for Brait’s investment 16,695 9,355 7,853
EV/EBITDA 3yr ave Spot Virgin Active
Peer Average 14.4x 15.0x 9.0x
Maintainable EBITDA (£m) 30-Sep-20
Maintainable EBITDA 100.0
Sustainable Net Debt (£m) 30-Sep-20
Actual Net Debt (358.5)
Normalisation adjustments (82.6)
Sustainable Net Debt (441.1)
KEY VALUATION ASSUMPTIONS
– The Gym Group plc– Basic Fit N.V.– Technogym S.p.A– Planet Fitness, Inc– Woolworths Holdings Ltd– Life Healthcare Group Holdings Ltd– Clicks Group LtdPE
ER E
V/EB
ITD
A
PEER
GR
OU
P
Maintainable EBITDA based on look-through to a medium-term post Coronavirus sustainable level of £100m; a 30% reduction of the £142m
actual EBITDA achieved by Virgin Active for FY2019 (December)
Net debt of £358.5m per Virgin Active’s Sep-20 management accounts has been increased by £82.6m to £441.1m to account for the estimated effect of
working capital and cost deferred during the lockdown period
Primary reference measure: peer group average spot multiple
11.4x 11.0x 11.0x 9.0x 9.0x
13.7x
13.2x 14.2x 14.4x
14.4x
15.0x
12.7x14.2x
10.8x
15.0x
Sep 18 Mar 19 Sep 19 Mar 20 Sep 20
Brait valuation multiple
Peer average: Trailing 3 years
Peer average: Spot
37 Unaudited interim results for the six months ended 30 September 2020
VALUATION OVERVIEW
Premier
– Tiger Brands Limited– AVI Limited– Rhodes Food Group Holdings
Limited
PEER
EV/
EBIT
DA
PEER
GR
OU
P
Unaudited Audited UnauditedR'm 30-Sep-19 31-Mar-20 30-Sep-20
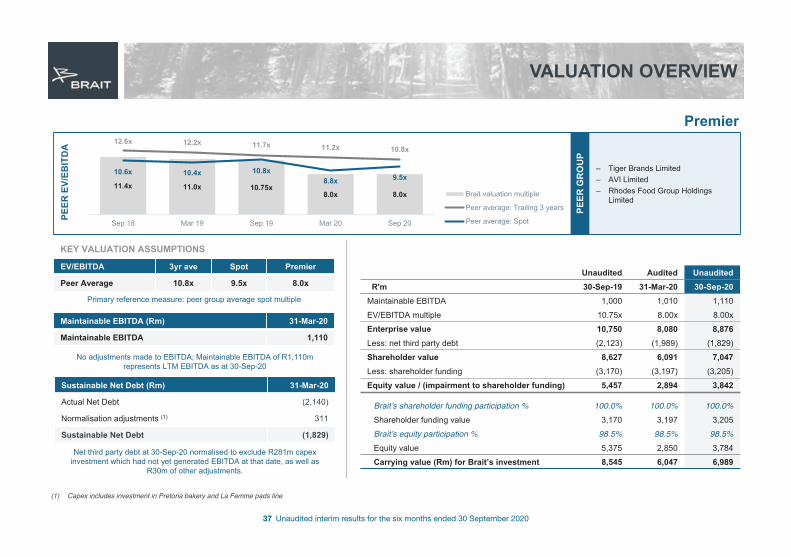
Maintainable EBITDA 1,000 1,010 1,110
EV/EBITDA multiple 10.75x 8.00x 8.00xEnterprise value 10,750 8,080 8,876Less: net third party debt (2,123) (1,989) (1,829)Shareholder value 8,627 6,091 7,047Less: shareholder funding (3,170) (3,197) (3,205)Equity value / (impairment to shareholder funding) 5,457 2,894 3,842
Braitʼs shareholder funding participation % 100.0% 100.0% 100.0%Shareholder funding value 3,170 3,197 3,205Braitʼs equity participation % 98.5% 98.5% 98.5%Equity value 5,375 2,850 3,784Carrying value (Rm) for Brait’s investment 8,545 6,047 6,989
EV/EBITDA 3yr ave Spot Premier
Peer Average 10.8x 9.5x 8.0x
Maintainable EBITDA (Rm) 31-Mar-20
Maintainable EBITDA 1,110
Sustainable Net Debt (Rm) 31-Mar-20
Actual Net Debt (2,140)
Normalisation adjustments (1) 311
Sustainable Net Debt (1,829)
KEY VALUATION ASSUMPTIONS
No adjustments made to EBITDA; Maintainable EBITDA of R1,110m represents LTM EBITDA as at 30-Sep-20
Net third party debt at 30-Sep-20 normalised to exclude R281m capex investment which had not yet generated EBITDA at that date, as well as
R30m of other adjustments.
Primary reference measure: peer group average spot multiple
(1) Capex includes investment in Pretoria bakery and La Femme pads line
11.4x 11.0x 10.75x8.0x 8.0x
12.6x 12.2x 11.7x 11.2x 10.8x
10.6x 10.4x 10.8x8.8x 9.5x
Sep 18 Mar 19 Sep 19 Mar 20 Sep 20
Brait valuation multiple
Peer average: Trailing 3 years
Peer average: Spot
38 Unaudited interim results for the six months ended 30 September 2020
VALUATION OVERVIEW
Other Investments
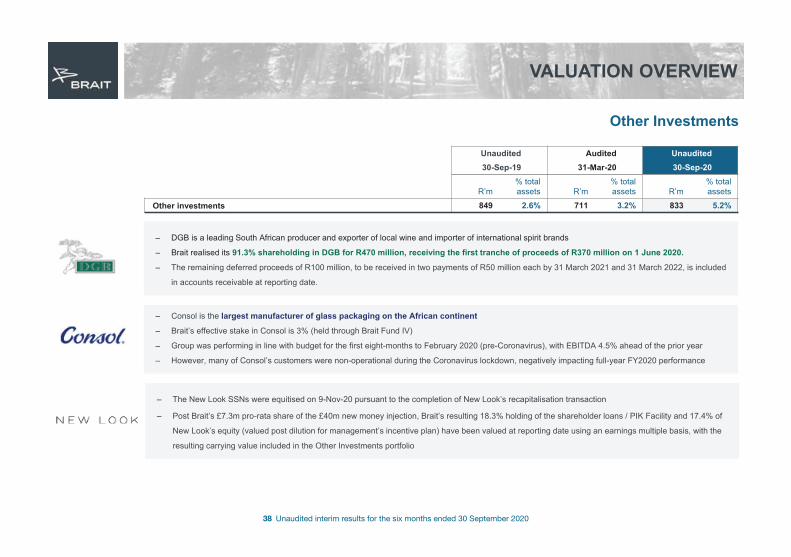
– Consol is the largest manufacturer of glass packaging on the African continent
– Brait’s effective stake in Consol is 3% (held through Brait Fund IV)
– Group was performing in line with budget for the first eight-months to February 2020 (pre-Coronavirus), with EBITDA 4.5% ahead of the prior year
– However, many of Consol’s customers were non-operational during the Coronavirus lockdown, negatively impacting full-year FY2020 performance
Unaudited Audited Unaudited30-Sep-19 31-Mar-20 30-Sep-20
R’m% total assets R’m
% total assets R’m
% total assets
Other investments 849 2.6% 711 3.2% 833 5.2%
– DGB is a leading South African producer and exporter of local wine and importer of international spirit brands
– Brait realised its 91.3% shareholding in DGB for R470 million, receiving the first tranche of proceeds of R370 million on 1 June 2020.
– The remaining deferred proceeds of R100 million, to be received in two payments of R50 million each by 31 March 2021 and 31 March 2022, is included
in accounts receivable at reporting date.
– The New Look SSNs were equitised on 9-Nov-20 pursuant to the completion of New Look’s recapitalisation transaction
– Post Brait’s £7.3m pro-rata share of the £40m new money injection, Brait’s resulting 18.3% holding of the shareholder loans / PIK Facility and 17.4% of
New Look’s equity (valued post dilution for management’s incentive plan) have been valued at reporting date using an earnings multiple basis, with the
resulting carrying value included in the Other Investments portfolio

39 Unaudited interim results for the six months ended 30 September 2020
CONCLUSION & OUTLOOK
40 Unaudited interim results for the six months ended 30 September 2020
CONCLUSION & OUTLOOK
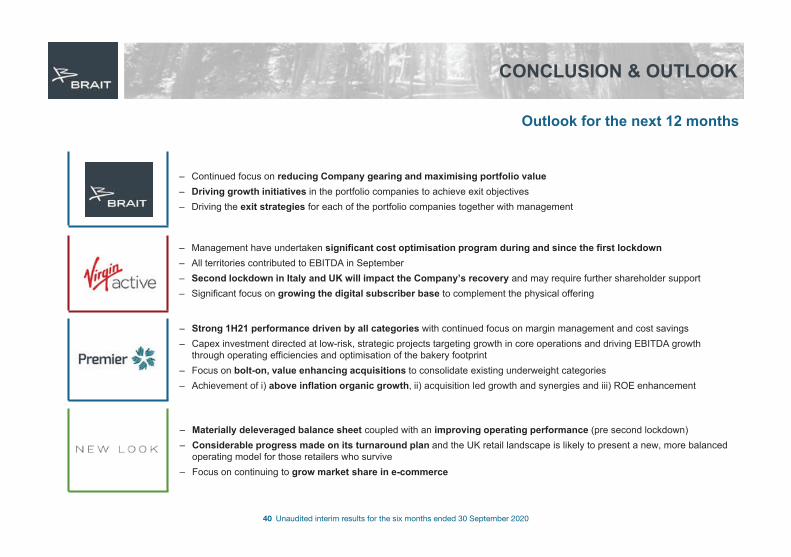
Outlook for the next 12 months
– Management have undertaken significant cost optimisation program during and since the first lockdown– All territories contributed to EBITDA in September– Second lockdown in Italy and UK will impact the Company’s recovery and may require further shareholder support– Significant focus on growing the digital subscriber base to complement the physical offering
– Strong 1H21 performance driven by all categories with continued focus on margin management and cost savings– Capex investment directed at low-risk, strategic projects targeting growth in core operations and driving EBITDA growth
through operating efficiencies and optimisation of the bakery footprint– Focus on bolt-on, value enhancing acquisitions to consolidate existing underweight categories– Achievement of i) above inflation organic growth, ii) acquisition led growth and synergies and iii) ROE enhancement
– Materially deleveraged balance sheet coupled with an improving operating performance (pre second lockdown)– Considerable progress made on its turnaround plan and the UK retail landscape is likely to present a new, more balanced
operating model for those retailers who survive– Focus on continuing to grow market share in e-commerce
– Continued focus on reducing Company gearing and maximising portfolio value– Driving growth initiatives in the portfolio companies to achieve exit objectives– Driving the exit strategies for each of the portfolio companies together with management

41 Unaudited interim results for the six months ended 30 September 2020
RESULTS PRESENTATION
ANNEXURES
FY21 H130 September 2020
42 Unaudited interim results for the six months ended 30 September 2020
BRAIT’S 1H21 RESULTS: 6 MONTHS ENDED 30 SEPTEMBER 2020
Summarised statement of comprehensive incomeUNAUDITED AUDITED
30 Sep 2020 30 Sep 2019 31 Mar 2020
R’m R’m R’m
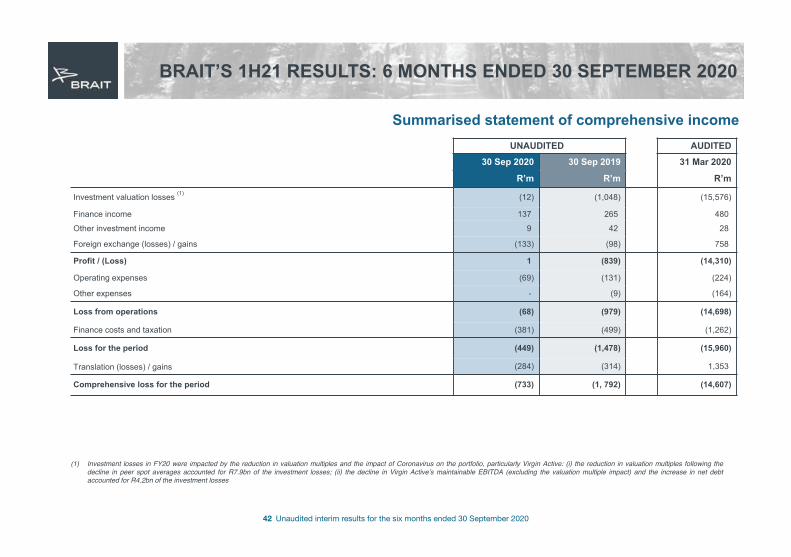
Investment valuation losses (1) (12) (1,048) (15,576)
Finance income 137 265 480
Other investment income 9 42 28
Foreign exchange (losses) / gains (133) (98) 758
Profit / (Loss) 1 (839) (14,310)
Operating expenses (69) (131) (224)
Other expenses - (9) (164)
Loss from operations (68) (979) (14,698)
Finance costs and taxation (381) (499) (1,262)
Loss for the period (449) (1,478) (15,960)
Translation (losses) / gains (284) (314) 1,353
Comprehensive loss for the period (733) (1, 792) (14,607)
(1) Investment losses in FY20 were impacted by the reduction in valuation multiples and the impact of Coronavirus on the portfolio, particularly Virgin Active: (i) the reduction in valuation multiples following thedecline in peer spot averages accounted for R7.9bn of the investment losses; (ii) the decline in Virgin Activeʼs maintainable EBITDA (excluding the valuation multiple impact) and the increase in net debtaccounted for R4.2bn of the investment losses
43 Unaudited interim results for the six months ended 30 September 2020
BRAIT’S 1H21 RESULTS: 6 MONTHS ENDED 30 SEPTEMBER 2020
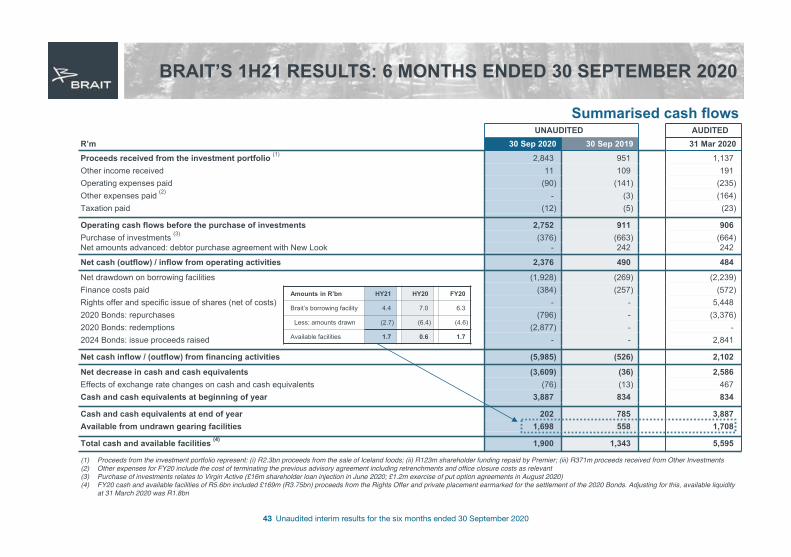
UNAUDITED AUDITEDR’m 30 Sep 2020 30 Sep 2019 31 Mar 2020Proceeds received from the investment portfolio (1) 2,843 951 1,137Other income received 11 109 191Operating expenses paid (90) (141) (235)Other expenses paid (2) - (3) (164)Taxation paid (12) (5) (23)
Operating cash flows before the purchase of investments 2,752 911 906Purchase of investments (3) (376) (663) (664)Net amounts advanced: debtor purchase agreement with New Look - 242 242
Net cash (outflow) / inflow from operating activities 2,376 490 484
Net drawdown on borrowing facilities (1,928) (269) (2,239)Finance costs paid (384) (257) (572)Rights offer and specific issue of shares (net of costs) - - 5,4482020 Bonds: repurchases (796) - (3,376)2020 Bonds: redemptions (2,877) - -2024 Bonds: issue proceeds raised - - 2,841
Net cash inflow / (outflow) from financing activities (5,985) (526) 2,102
Net decrease in cash and cash equivalents (3,609) (36) 2,586Effects of exchange rate changes on cash and cash equivalents (76) (13) 467Cash and cash equivalents at beginning of year 3,887 834 834
Cash and cash equivalents at end of year 202 785 3,887Available from undrawn gearing facilities 1,698 558 1,708
Total cash and available facilities (4) 1,900 1,343 5,595
Summarised cash flows
Amounts in R’bn HY21 HY20 FY20
Brait’s borrowing facility 4.4 7.0 6.3
Less: amounts drawn (2.7) (6.4) (4.6)
Available facilities 1.7 0.6 1.7
(1) Proceeds from the investment portfolio represent: (i) R2.3bn proceeds from the sale of Iceland foods; (ii) R123m shareholder funding repaid by Premier; (iii) R371m proceeds received from Other Investments (2) Other expenses for FY20 include the cost of terminating the previous advisory agreement including retrenchments and office closure costs as relevant(3) Purchase of investments relates to Virgin Active (£16m shareholder loan injection in June 2020; £1.2m exercise of put option agreements in August 2020)(4) FY20 cash and available facilities of R5.6bn included £169m (R3.75bn) proceeds from the Rights Offer and private placement earmarked for the settlement of the 2020 Bonds. Adjusting for this, available liquidity
at 31 March 2020 was R1.8bn
44 Unaudited interim results for the six months ended 30 September 2020
BRAIT OVERVIEW
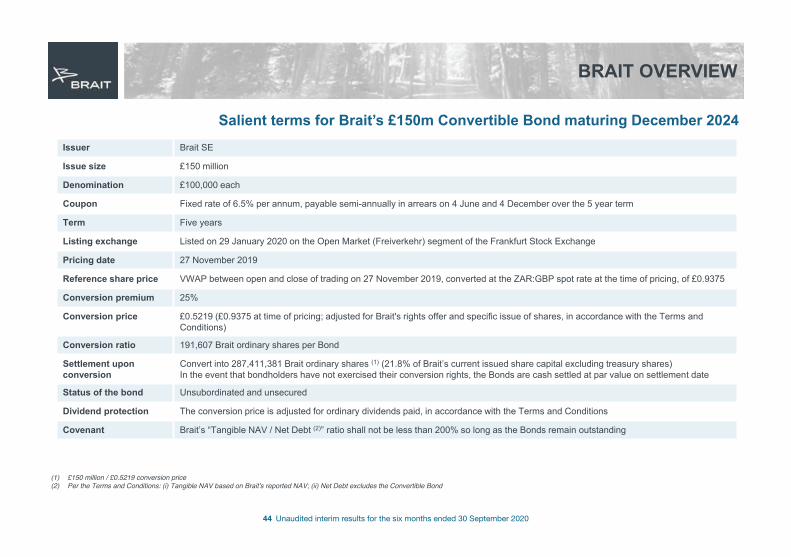
Salient terms for Brait’s £150m Convertible Bond maturing December 2024Issuer Brait SE
Issue size £150 million
Denomination £100,000 each
Coupon Fixed rate of 6.5% per annum, payable semi-annually in arrears on 4 June and 4 December over the 5 year term
Term Five years
Listing exchange Listed on 29 January 2020 on the Open Market (Freiverkehr) segment of the Frankfurt Stock Exchange
Pricing date 27 November 2019
Reference share price VWAP between open and close of trading on 27 November 2019, converted at the ZAR:GBP spot rate at the time of pricing, of £0.9375
Conversion premium 25%
Conversion price £0.5219 (£0.9375 at time of pricing; adjusted for Brait's rights offer and specific issue of shares, in accordance with the Terms and Conditions)
Conversion ratio 191,607 Brait ordinary shares per Bond
Settlement upon conversion
Convert into 287,411,381 Brait ordinary shares (1) (21.8% of Brait’s current issued share capital excluding treasury shares)In the event that bondholders have not exercised their conversion rights, the Bonds are cash settled at par value on settlement date
Status of the bond Unsubordinated and unsecured
Dividend protection The conversion price is adjusted for ordinary dividends paid, in accordance with the Terms and Conditions
Covenant Brait’s “Tangible NAV / Net Debt (2)” ratio shall not be less than 200% so long as the Bonds remain outstanding
(1) £150 million / £0.5219 conversion price(2) Per the Terms and Conditions: (i) Tangible NAV based on Braitʼs reported NAV; (ii) Net Debt excludes the Convertible Bond

45 Unaudited interim results for the six months ended 30 September 2020
BRAIT OVERVIEW
Salient terms for BML RCF facility
Key TermsFacility Commitment • R6.3bn with tenure to 28 February 2023 (3-years)
• Facility commitments to reduce by agreed % of proceeds received from portfolio company disposals and refinancings • All proceeds must be mandatorily prepaid to the facility
Margin • Margin for facility will be 460 bps on JIBAR, payable quarterly with a right to rollup• The margin is subject to downward margin ratchet based on total commitments as Brait de-gears:
• 60bps reduction whilst commitments <= R5.25bn• Further 40bps reduction whilst commitments <= R3.5bn• Further 40bps reduction whilst commitments <= R2.0bn
Covenants • Covenants are NAV based and set with sufficient headroom for short term volatility
Brait’s revolving credit facility held by its subsidiary Brait Mauritius Limited (the “BML RCF”) is secured on a senior basis by the assets of BML
As at 30 Sep 2020Facility Commitment • Following the capital repayments during the current six month reporting period, the facility commitment has decreased
to R4.4bn
Margin • As the facility commitment is less than R5.25bn, the interest margin has reduced to 400 bps on JIBAR, payable quarterly with a right to rollup

46 Unaudited interim results for the six months ended 30 September 2020
VIRGIN ACTIVE
Additional information and summary 5-year financials
47 Unaudited interim results for the six months ended 30 September 2020
VIRGIN ACTIVE
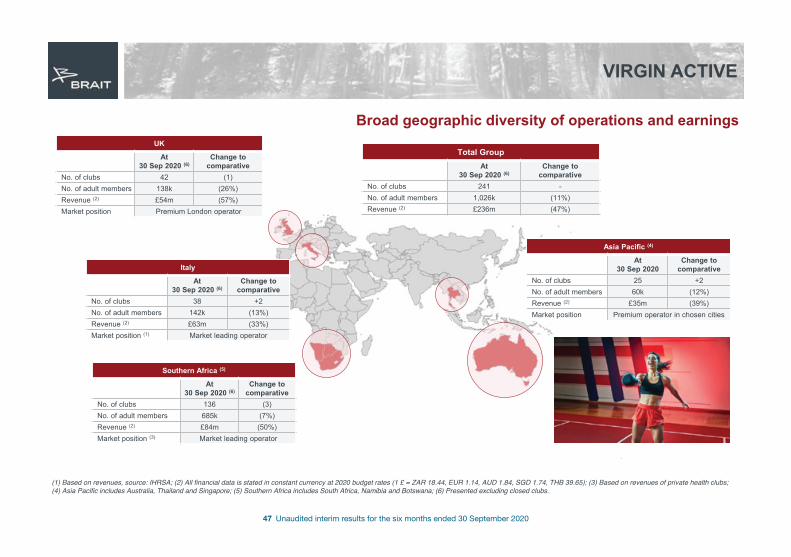
Broad geographic diversity of operations and earningsUK
At 30 Sep 2020 (6)
Change to comparative
No. of clubs 42 (1)No. of adult members 138k (26%)Revenue (2) £54m (57%)Market position Premium London operator
Total GroupAt
30 Sep 2020 (6)Change to
comparative No. of clubs 241 -No. of adult members 1,026k (11%)Revenue (2) £236m (47%)
Italy
At 30 Sep 2020 (6)
Change to comparative
No. of clubs 38 +2No. of adult members 142k (13%)Revenue (2) £63m (33%)Market position (1) Market leading operator
Southern Africa (5)
At 30 Sep 2020 (6)
Change to comparative
No. of clubs 136 (3)No. of adult members 685k (7%)Revenue (2) £84m (50%)Market position (3) Market leading operator
Asia Pacific (4)
At 30 Sep 2020
Change to comparative
No. of clubs 25 +2No. of adult members 60k (12%)Revenue (2) £35m (39%)Market position Premium operator in chosen cities
(1) Based on revenues, source: IHRSA; (2) All financial data is stated in constant currency at 2020 budget rates (1 £ = ZAR 18.44, EUR 1.14, AUD 1.84, SGD 1.74, THB 39.65); (3) Based on revenues of private health clubs; (4) Asia Pacific includes Australia, Thailand and Singapore; (5) Southern Africa includes South Africa, Namibia and Botswana; (6) Presented excluding closed clubs.
48 Unaudited interim results for the six months ended 30 September 2020
VIRGIN ACTIVE
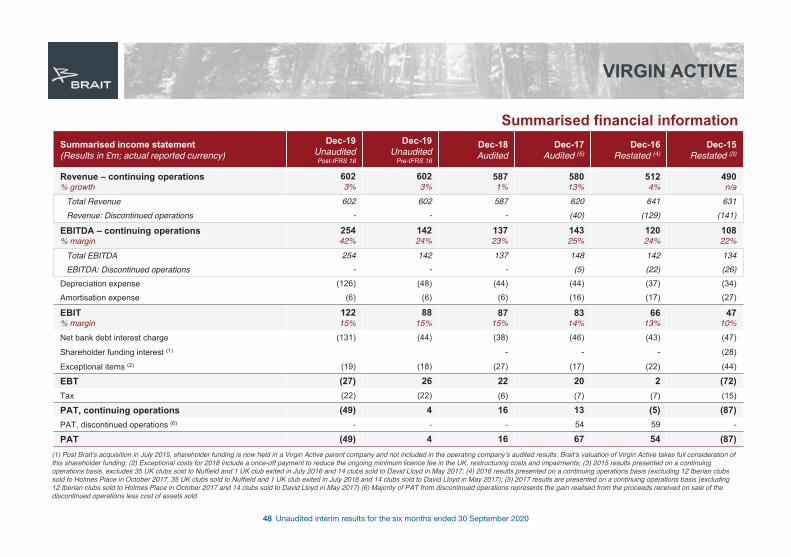
Summarised financial informationSummarised income statement(Results in £m; actual reported currency)
Dec-19UnauditedPost-IFRS 16
Dec-19Unaudited
Pre-IFRS 16
Dec-18Audited
Dec-17Audited (5)
Dec-16Restated (4)
Dec-15Restated (3)
Revenue – continuing operations% growth
6023%
6023%
5871%
58013%
5124%
490n/a
Total Revenue 602 602 587 620 641 631Revenue: Discontinued operations - - - (40) (129) (141)
EBITDA – continuing operations% margin
25442%
14224%
13723%
14325%
12024%
10822%
Total EBITDA 254 142 137 148 142 134 EBITDA: Discontinued operations - - - (5) (22) (26)
Depreciation expense (126) (48) (44) (44) (37) (34)
Amortisation expense (6) (6) (6) (16) (17) (27)
EBIT% margin
12215%
8815%
8715%
8314%
6613%
4710%
Net bank debt interest charge (131) (44) (38) (46) (43) (47)
Shareholder funding interest (1) - - - (28)
Exceptional items (2) (19) (18) (27) (17) (22) (44)
EBT (27) 26 22 20 2 (72)Tax (22) (22) (6) (7) (7) (15)
PAT, continuing operations (49) 4 16 13 (5) (87)PAT, discontinued operations (6) - - - 54 59 -
PAT (49) 4 16 67 54 (87)(1) Post Braitʼs acquisition in July 2015, shareholder funding is now held in a Virgin Active parent company and not included in the operating companyʼs audited results. Braitʼs valuation of Virgin Active takes full consideration of this shareholder funding; (2) Exceptional costs for 2018 include a once-off payment to reduce the ongoing minimum licence fee in the UK, restructuring costs and impairments; (3) 2015 results presented on a continuing operations basis, excludes 35 UK clubs sold to Nuffield and 1 UK club exited in July 2016 and 14 clubs sold to David Lloyd in May 2017; (4) 2016 results presented on a continuing operations basis (excluding 12 Iberian clubs sold to Holmes Place in October 2017, 35 UK clubs sold to Nuffield and 1 UK club exited in July 2016 and 14 clubs sold to David Lloyd in May 2017); (5) 2017 results are presented on a continuing operations basis (excluding 12 Iberian clubs sold to Holmes Place in October 2017 and 14 clubs sold to David Lloyd in May 2017) (6) Majority of PAT from discontinued operations represents the gain realised from the proceeds received on sale of the discontinued operations less cost of assets sold
49 Unaudited interim results for the six months ended 30 September 2020
VIRGIN ACTIVE
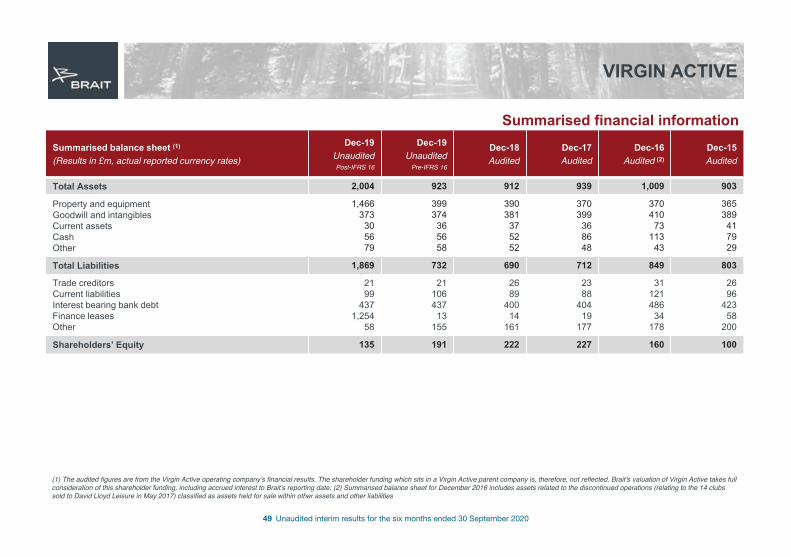
Summarised financial informationSummarised balance sheet (1)
(Results in £m, actual reported currency rates)
Dec-19 UnauditedPost-IFRS 16
Dec-19 Unaudited
Pre-IFRS 16
Dec-18 Audited
Dec-17 Audited
Dec-16 Audited (2)
Dec-15 Audited
Total Assets 2,004 923 912 939 1,009 903
Property and equipmentGoodwill and intangiblesCurrent assetsCashOther
1,466373
305679
399374
365658
390381
375252
370399
368648
370410
73113
43
365389
417929
Total Liabilities 1,869 732 690 712 849 803
Trade creditorsCurrent liabilitiesInterest bearing bank debt Finance leasesOther
2199
4371,254
58
21106437
13155
2689
40014
161
2388
40419
177
31121486
34178
2696
42358
200
Shareholders’ Equity 135 191 222 227 160 100
(1) The audited figures are from the Virgin Active operating companyʼs financial results. The shareholder funding which sits in a Virgin Active parent company is, therefore, not reflected. Braitʼs valuation of Virgin Active takes full consideration of this shareholder funding, including accrued interest to Braitʼs reporting date; (2) Summarised balance sheet for December 2016 includes assets related to the discontinued operations (relating to the 14 clubs sold to David Lloyd Leisure in May 2017) classified as assets held for sale within other assets and other liabilities
50 Unaudited interim results for the six months ended 30 September 2020
VIRGIN ACTIVE
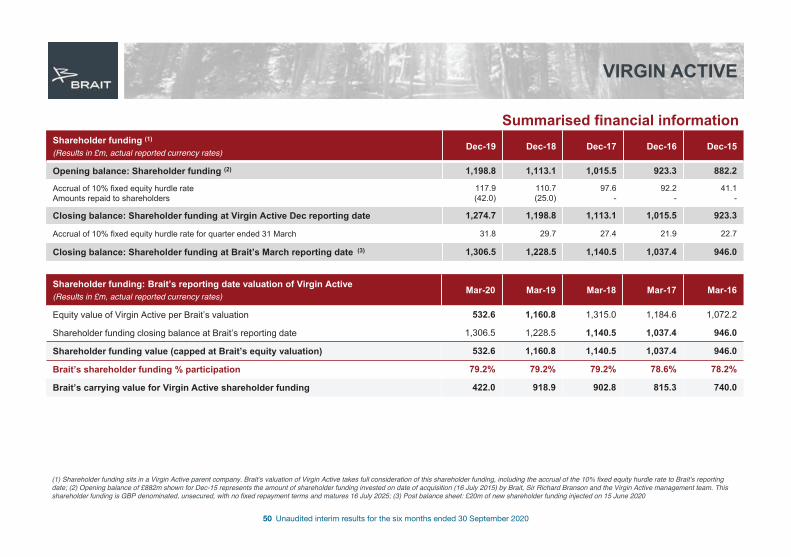
Summarised financial informationShareholder funding (1)
(Results in £m, actual reported currency rates)Dec-19 Dec-18 Dec-17 Dec-16 Dec-15
Opening balance: Shareholder funding (2) 1,198.8 1,113.1 1,015.5 923.3 882.2
Accrual of 10% fixed equity hurdle rateAmounts repaid to shareholders
117.9(42.0)
110.7(25.0)
97.6-
92.2-
41.1-
Closing balance: Shareholder funding at Virgin Active Dec reporting date 1,274.7 1,198.8 1,113.1 1,015.5 923.3
Accrual of 10% fixed equity hurdle rate for quarter ended 31 March 31.8 29.7 27.4 21.9 22.7
Closing balance: Shareholder funding at Brait’s March reporting date (3) 1,306.5 1,228.5 1,140.5 1,037.4 946.0
Shareholder funding: Brait’s reporting date valuation of Virgin Active(Results in £m, actual reported currency rates)
Mar-20 Mar-19 Mar-18 Mar-17 Mar-16
Equity value of Virgin Active per Brait’s valuation 532.6 1,160.8 1,315.0 1,184.6 1,072.2
Shareholder funding closing balance at Brait’s reporting date 1,306.5 1,228.5 1,140.5 1,037.4 946.0
Shareholder funding value (capped at Brait’s equity valuation) 532.6 1,160.8 1,140.5 1,037.4 946.0
Brait’s shareholder funding % participation 79.2% 79.2% 79.2% 78.6% 78.2%
Brait’s carrying value for Virgin Active shareholder funding 422.0 918.9 902.8 815.3 740.0
(1) Shareholder funding sits in a Virgin Active parent company. Braitʼs valuation of Virgin Active takes full consideration of this shareholder funding, including the accrual of the 10% fixed equity hurdle rate to Braitʼs reporting date; (2) Opening balance of £882m shown for Dec-15 represents the amount of shareholder funding invested on date of acquisition (16 July 2015) by Brait, Sir Richard Branson and the Virgin Active management team. This shareholder funding is GBP denominated, unsecured, with no fixed repayment terms and matures 16 July 2025; (3) Post balance sheet: £20m of new shareholder funding injected on 15 June 2020
51 Unaudited interim results for the six months ended 30 September 2020
VIRGIN ACTIVE
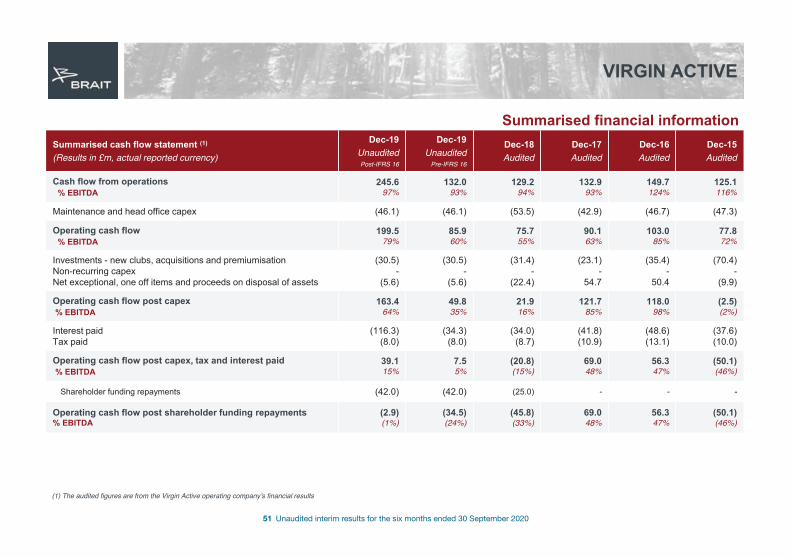
Summarised financial informationSummarised cash flow statement (1)
(Results in £m, actual reported currency)
Dec-19UnauditedPost-IFRS 16
Dec-19Unaudited
Pre-IFRS 16
Dec-18 Audited
Dec-17 Audited
Dec-16 Audited
Dec-15 Audited
Cash flow from operations% EBITDA
245.697%
132.093%
129.294%
132.993%
149.7124%
125.1116%
Maintenance and head office capex (46.1) (46.1) (53.5) (42.9) (46.7) (47.3)
Operating cash flow% EBITDA
199.579%
85.960%
75.7 55%
90.1 63%
103.0 85%
77.8 72%
Investments - new clubs, acquisitions and premiumisationNon-recurring capexNet exceptional, one off items and proceeds on disposal of assets
(30.5)-
(5.6)
(30.5)-
(5.6)
(31.4)-
(22.4)
(23.1)-
54.7
(35.4)-
50.4
(70.4)-
(9.9)
Operating cash flow post capex% EBITDA
163.464%
49.835%
21.916%
121.785%
118.098%
(2.5)(2%)
Interest paidTax paid
(116.3)(8.0)
(34.3)(8.0)
(34.0)(8.7)
(41.8)(10.9)
(48.6)(13.1)
(37.6)(10.0)
Operating cash flow post capex, tax and interest paid% EBITDA
39.115%
7.55%
(20.8)(15%)
69.048%
56.347%
(50.1)(46%)
Shareholder funding repayments (42.0) (42.0) (25.0) - - -
Operating cash flow post shareholder funding repayments% EBITDA
(2.9)(1%)
(34.5)(24%)
(45.8)(33%)
69.048%
56.347%
(50.1)(46%)
(1) The audited figures are from the Virgin Active operating companyʼs financial results
52 Unaudited interim results for the six months ended 30 September 2020
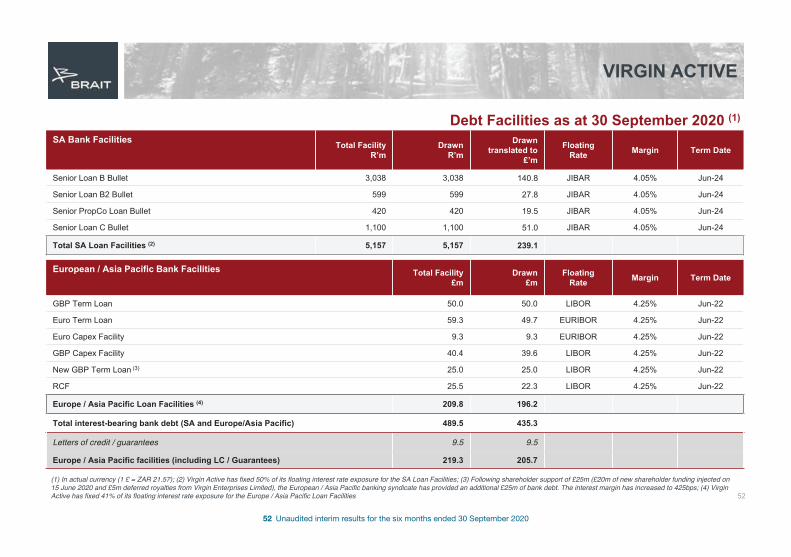
VIRGIN ACTIVE
Debt Facilities as at 30 September 2020 (1)
SA Bank Facilities Total FacilityR’m
Drawn R’m
Drawn translated to
£’m
FloatingRate Margin Term Date
Senior Loan B Bullet 3,038 3,038 140.8 JIBAR 4.05% Jun-24
Senior Loan B2 Bullet 599 599 27.8 JIBAR 4.05% Jun-24
Senior PropCo Loan Bullet 420 420 19.5 JIBAR 4.05% Jun-24
Senior Loan C Bullet 1,100 1,100 51.0 JIBAR 4.05% Jun-24
Total SA Loan Facilities (2) 5,157 5,157 239.1
European / Asia Pacific Bank Facilities Total Facility£m
Drawn£m
FloatingRate Margin Term Date
GBP Term Loan 50.0 50.0 LIBOR 4.25% Jun-22
Euro Term Loan 59.3 49.7 EURIBOR 4.25% Jun-22
Euro Capex Facility 9.3 9.3 EURIBOR 4.25% Jun-22
GBP Capex Facility 40.4 39.6 LIBOR 4.25% Jun-22
New GBP Term Loan (3) 25.0 25.0 LIBOR 4.25% Jun-22
RCF 25.5 22.3 LIBOR 4.25% Jun-22
Europe / Asia Pacific Loan Facilities (4) 209.8 196.2
Total interest-bearing bank debt (SA and Europe/Asia Pacific) 489.5 435.3
Letters of credit / guarantees 9.5 9.5
Europe / Asia Pacific facilities (including LC / Guarantees) 219.3 205.7
52
(1) In actual currency (1 £ = ZAR 21.57); (2) Virgin Active has fixed 50% of its floating interest rate exposure for the SA Loan Facilities; (3) Following shareholder support of £25m (£20m of new shareholder funding injected on 15 June 2020 and £5m deferred royalties from Virgin Enterprises Limited), the European / Asia Pacific banking syndicate has provided an additional £25m of bank debt. The interest margin has increased to 425bps; (4) Virgin Active has fixed 41% of its floating interest rate exposure for the Europe / Asia Pacific Loan Facilities
53 Unaudited interim results for the six months ended 30 September 2020
VIRGIN ACTIVE
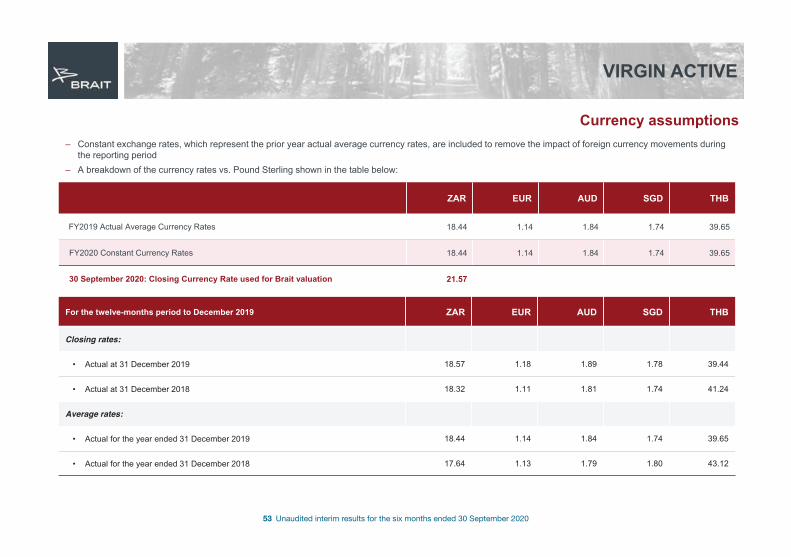
Currency assumptions– Constant exchange rates, which represent the prior year actual average currency rates, are included to remove the impact of foreign currency movements during
the reporting period– A breakdown of the currency rates vs. Pound Sterling shown in the table below:
ZAR EUR AUD SGD THB
FY2019 Actual Average Currency Rates 18.44 1.14 1.84 1.74 39.65
FY2020 Constant Currency Rates 18.44 1.14 1.84 1.74 39.65
30 September 2020: Closing Currency Rate used for Brait valuation 21.57
For the twelve-months period to December 2019 ZAR EUR AUD SGD THB
Closing rates:
• Actual at 31 December 2019 18.57 1.18 1.89 1.78 39.44
• Actual at 31 December 2018 18.32 1.11 1.81 1.74 41.24
Average rates:
• Actual for the year ended 31 December 2019 18.44 1.14 1.84 1.74 39.65
• Actual for the year ended 31 December 2018 17.64 1.13 1.79 1.80 43.12
54 Unaudited interim results for the six months ended 30 September 2020
VIRGIN ACTIVE
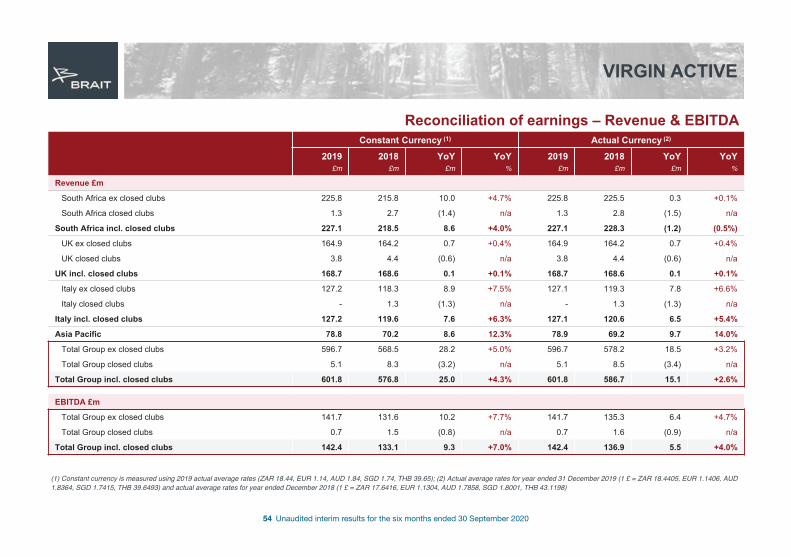
Reconciliation of earnings – Revenue & EBITDA Constant Currency (1) Actual Currency (2)
2019£m
2018£m
YoY£m
YoY %
2019£m
2018£m
YoY£m
YoY %
Revenue £m
South Africa ex closed clubs 225.8 215.8 10.0 +4.7% 225.8 225.5 0.3 +0.1%
South Africa closed clubs 1.3 2.7 (1.4) n/a 1.3 2.8 (1.5) n/a
South Africa incl. closed clubs 227.1 218.5 8.6 +4.0% 227.1 228.3 (1.2) (0.5%)
UK ex closed clubs 164.9 164.2 0.7 +0.4% 164.9 164.2 0.7 +0.4%
UK closed clubs 3.8 4.4 (0.6) n/a 3.8 4.4 (0.6) n/a
UK incl. closed clubs 168.7 168.6 0.1 +0.1% 168.7 168.6 0.1 +0.1%
Italy ex closed clubs 127.2 118.3 8.9 +7.5% 127.1 119.3 7.8 +6.6%
Italy closed clubs - 1.3 (1.3) n/a - 1.3 (1.3) n/a
Italy incl. closed clubs 127.2 119.6 7.6 +6.3% 127.1 120.6 6.5 +5.4%
Asia Pacific 78.8 70.2 8.6 12.3% 78.9 69.2 9.7 14.0%
Total Group ex closed clubs 596.7 568.5 28.2 +5.0% 596.7 578.2 18.5 +3.2%
Total Group closed clubs 5.1 8.3 (3.2) n/a 5.1 8.5 (3.4) n/a
Total Group incl. closed clubs 601.8 576.8 25.0 +4.3% 601.8 586.7 15.1 +2.6%
EBITDA £m
Total Group ex closed clubs 141.7 131.6 10.2 +7.7% 141.7 135.3 6.4 +4.7%
Total Group closed clubs 0.7 1.5 (0.8) n/a 0.7 1.6 (0.9) n/a
Total Group incl. closed clubs 142.4 133.1 9.3 +7.0% 142.4 136.9 5.5 +4.0%
(1) Constant currency is measured using 2019 actual average rates (ZAR 18.44, EUR 1.14, AUD 1.84, SGD 1.74, THB 39.65); (2) Actual average rates for year ended 31 December 2019 (1 £ = ZAR 18.4405, EUR 1.1406, AUD 1.8364, SGD 1.7415, THB 39.6493) and actual average rates for year ended December 2018 (1 £ = ZAR 17.6416, EUR 1.1304, AUD 1.7858, SGD 1.8001, THB 43.1198)
55 Unaudited interim results for the six months ended 30 September 2020
PREMIER
Additional information and summary 5-year financials
56 Unaudited interim results for the six months ended 30 September 2020
PREMIER
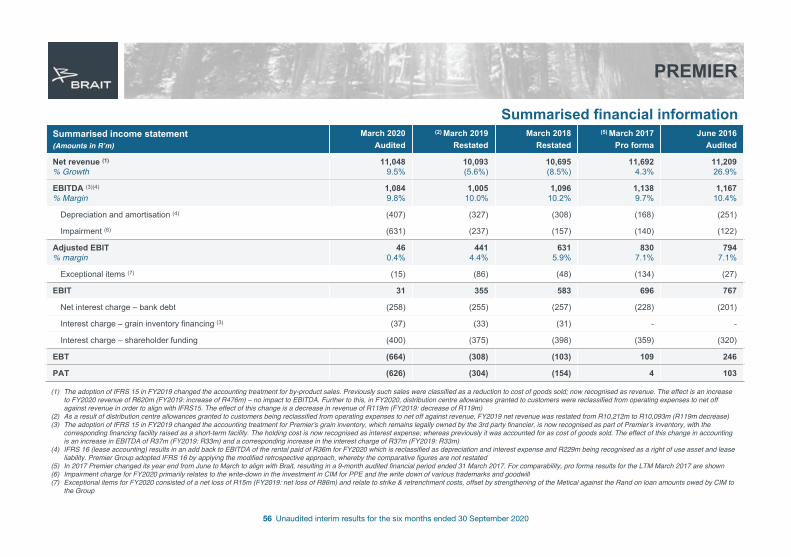
Summarised income statement (Amounts in Rʼm)
March 2020Audited
(2) March 2019Restated
March 2018Restated
(5) March 2017 Pro forma
June 2016Audited
Net revenue (1)
% Growth11,048
9.5%10,093(5.6%)
10,695(8.5%)
11,6924.3%
11,20926.9%
EBITDA (3)(4)
% Margin1,0849.8%
1,00510.0%
1,09610.2%
1,1389.7%
1,16710.4%
Depreciation and amortisation (4) (407) (327) (308) (168) (251)
Impairment (6) (631) (237) (157) (140) (122)
Adjusted EBIT% margin
460.4%
4414.4%
6315.9%
8307.1%
7947.1%
Exceptional items (7) (15) (86) (48) (134) (27)
EBIT 31 355 583 696 767
Net interest charge – bank debt (258) (255) (257) (228) (201)
Interest charge – grain inventory financing (3) (37) (33) (31) - -
Interest charge – shareholder funding (400) (375) (398) (359) (320)
EBT (664) (308) (103) 109 246
PAT (626) (304) (154) 4 103
Summarised financial information
(1) The adoption of IFRS 15 in FY2019 changed the accounting treatment for by-product sales. Previously such sales were classified as a reduction to cost of goods sold; now recognised as revenue. The effect is an increase to FY2020 revenue of R620m (FY2019: increase of R476m) – no impact to EBITDA. Further to this, in FY2020, distribution centre allowances granted to customers were reclassified from operating expenses to net off against revenue in order to align with IFRS15. The effect of this change is a decrease in revenue of R119m (FY2019: decrease of R119m)
(2) As a result of distribution centre allowances granted to customers being reclassified from operating expenses to net off against revenue, FY2019 net revenue was restated from R10,212m to R10,093m (R119m decrease)(3) The adoption of IFRS 15 in FY2019 changed the accounting treatment for Premierʼs grain inventory, which remains legally owned by the 3rd party financier, is now recognised as part of Premierʼs inventory, with the
corresponding financing facility raised as a short-term facility. The holding cost is now recognised as interest expense; whereas previously it was accounted for as cost of goods sold. The effect of this change in accounting is an increase in EBITDA of R37m (FY2019: R33m) and a corresponding increase in the interest charge of R37m (FY2019: R33m)
(4) IFRS 16 (lease accounting) results in an add back to EBITDA of the rental paid of R36m for FY2020 which is reclassified as depreciation and interest expense and R229m being recognised as a right of use asset and lease liability. Premier Group adopted IFRS 16 by applying the modified retrospective approach, whereby the comparative figures are not restated
(5) In 2017 Premier changed its year end from June to March to align with Brait, resulting in a 9-month audited financial period ended 31 March 2017. For comparability, pro forma results for the LTM March 2017 are shown(6) Impairment charge for FY2020 primarily relates to the write-down in the investment in CIM for PPE and the write down of various trademarks and goodwill (7) Exceptional items for FY2020 consisted of a net loss of R15m (FY2019: net loss of R86m) and relate to strike & retrenchment costs, offset by strengthening of the Metical against the Rand on loan amounts owed by CIM to
the Group
57 Unaudited interim results for the six months ended 30 September 2020
PREMIER
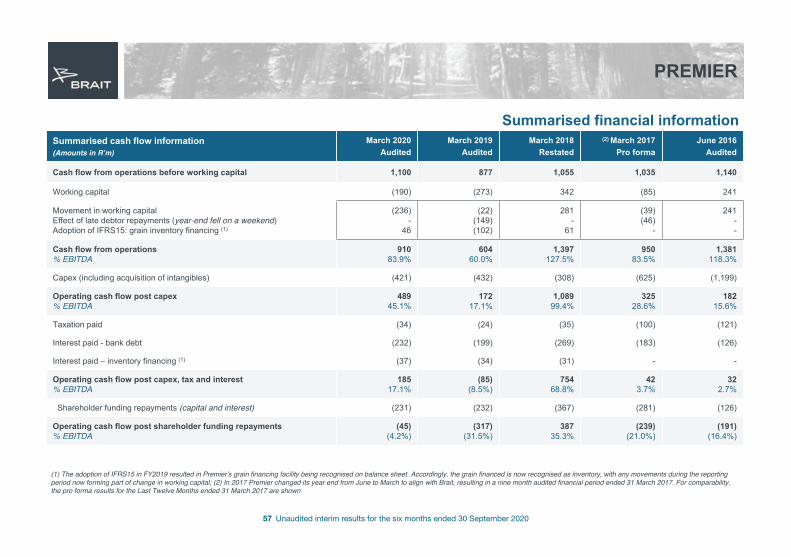
Summarised cash flow information (Amounts in Rʼm)
March 2020Audited
March 2019Audited
March 2018Restated
(2) March 2017Pro forma
June 2016Audited
Cash flow from operations before working capital 1,100 877 1,055 1,035 1,140
Working capital (190) (273) 342 (85) 241
Movement in working capitalEffect of late debtor repayments (year-end fell on a weekend)Adoption of IFRS15: grain inventory financing (1)
(236)-
46
(22)(149)(102)
281-
61
(39)(46)
-
241--
Cash flow from operations% EBITDA
91083.9%
60460.0%
1,397127.5%
95083.5%
1,381118.3%
Capex (including acquisition of intangibles) (421) (432) (308) (625) (1,199)
Operating cash flow post capex % EBITDA
48945.1%
17217.1%
1,08999.4%
32528.6%
18215.6%
Taxation paid (34) (24) (35) (100) (121)
Interest paid - bank debt (232) (199) (269) (183) (126)
Interest paid – inventory financing (1) (37) (34) (31) - -
Operating cash flow post capex, tax and interest% EBITDA
18517.1%
(85)(8.5%)
75468.8%
423.7%
322.7%
Shareholder funding repayments (capital and interest) (231) (232) (367) (281) (126)
Operating cash flow post shareholder funding repayments% EBITDA
(45)(4.2%)
(317)(31.5%)
38735.3%
(239)(21.0%)
(191)(16.4%)
Summarised financial information
(1) The adoption of IFRS15 in FY2019 resulted in Premierʼs grain financing facility being recognised on balance sheet. Accordingly, the grain financed is now recognised as inventory, with any movements during the reporting period now forming part of change in working capital; (2) In 2017 Premier changed its year end from June to March to align with Brait, resulting in a nine month audited financial period ended 31 March 2017. For comparability, the pro forma results for the Last Twelve Months ended 31 March 2017 are shown
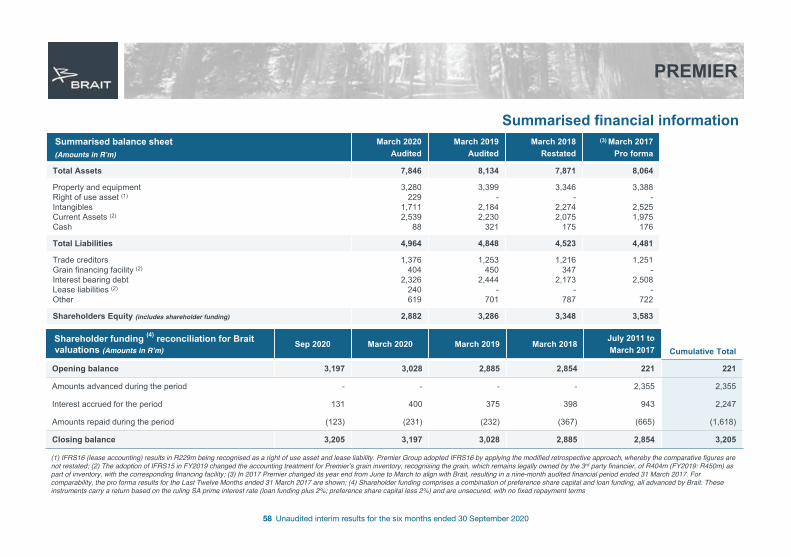
58 Unaudited interim results for the six months ended 30 September 2020
PREMIER
Summarised balance sheet(Amounts in Rʼm)
March 2020Audited
March 2019Audited
March 2018Restated
(3) March 2017Pro forma
Total Assets 7,846 8,134 7,871 8,064
Property and equipmentRight of use asset (1)
IntangiblesCurrent Assets (2)
Cash
3,280229
1,7112,539
88
3,399-
2,1842,230
321
3,346-
2,2742,075
175
3,388-
2,5251,975
176
Total Liabilities 4,964 4,848 4,523 4,481
Trade creditorsGrain financing facility (2)
Interest bearing debt Lease liabilities (2)
Other
1,376404
2,326240619
1,253450
2,444-
701
1,216347
2,173-
787
1,251-
2,508-
722
Shareholders Equity (includes shareholder funding) 2,882 3,286 3,348 3,583
Shareholder funding (4) reconciliation for Braitvaluations (Amounts in Rʼm)
Sep 2020 March 2020 March 2019 March 2018July 2011 to March 2017 Cumulative Total
Opening balance 3,197 3,028 2,885 2,854 221 221
Amounts advanced during the period - - - - 2,355 2,355
Interest accrued for the period 131 400 375 398 943 2,247
Amounts repaid during the period (123) (231) (232) (367) (665) (1,618)
Closing balance 3,205 3,197 3,028 2,885 2,854 3,205
Summarised financial information
(1) IFRS16 (lease accounting) results in R229m being recognised as a right of use asset and lease liability. Premier Group adopted IFRS16 by applying the modified retrospective approach, whereby the comparative figures are not restated; (2) The adoption of IFRS15 in FY2019 changed the accounting treatment for Premierʼs grain inventory, recognising the grain, which remains legally owned by the 3rd party financier, of R404m (FY2019: R450m) as part of inventory, with the corresponding financing facility; (3) In 2017 Premier changed its year end from June to March to align with Brait, resulting in a nine-month audited financial period ended 31 March 2017. For comparability, the pro forma results for the Last Twelve Months ended 31 March 2017 are shown; (4) Shareholder funding comprises a combination of preference share capital and loan funding, all advanced by Brait. These instruments carry a return based on the ruling SA prime interest rate (loan funding plus 2%; preference share capital less 2%) and are unsecured, with no fixed repayment terms
UNAUDITED INTERIM RESULTS ANNOUNCEMENT
for the six months ended 30 September 2020
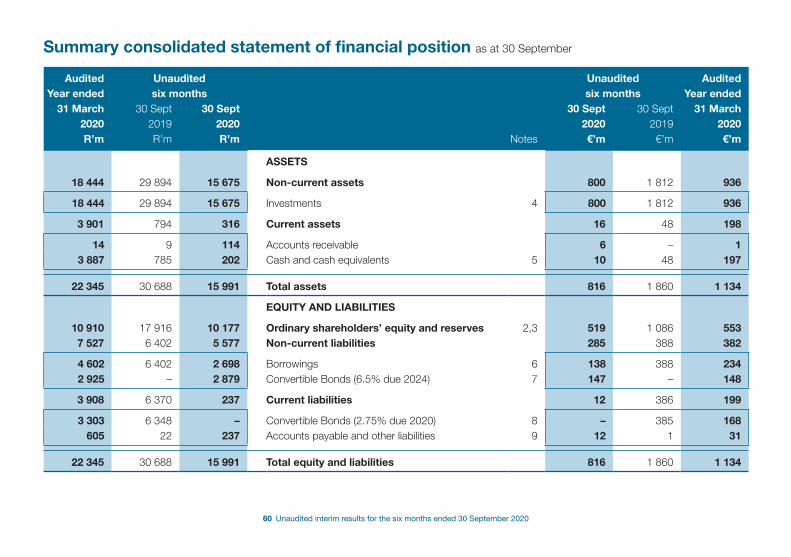
60 Unaudited interim results for the six months ended 30 September 2020
Summary consolidated statement of financial position as at 30 September
Audited Unaudited Unaudited AuditedYear ended six months six months Year ended
31 March 30 Sept 30 Sept 30 Sept 30 Sept 31 March2020 2019 2020 2020 2019 2020R’m R’m R’m Notes €’m €’m €’m
ASSETS
18 444 29 894 15 675 Non-current assets 800 1 812 936
18 444 29 894 15 675 Investments 4 800 1 812 936
3 901 794 316 Current assets 16 48 198
14 9 114 Accounts receivable 6 – 1 3 887 785 202 Cash and cash equivalents 5 10 48 197
22 345 30 688 15 991 Total assets 816 1 860 1 134
EQUITY AND LIABILITIES
10 910 17 916 10 177 Ordinary shareholders’ equity and reserves 2,3 519 1 086 553 7 527 6 402 5 577 Non-current liabilities 285 388 382
4 602 6 402 2 698 Borrowings 6 138 388 234 2 925 – 2 879 Convertible Bonds (6.5% due 2024) 7 147 – 148
3 908 6 370 237 Current liabilities 12 386 199
3 303 6 348 – Convertible Bonds (2.75% due 2020) 8 – 385 168 605 22 237 Accounts payable and other liabilities 9 12 1 31
22 345 30 688 15 991 Total equity and liabilities 816 1 860 1 134
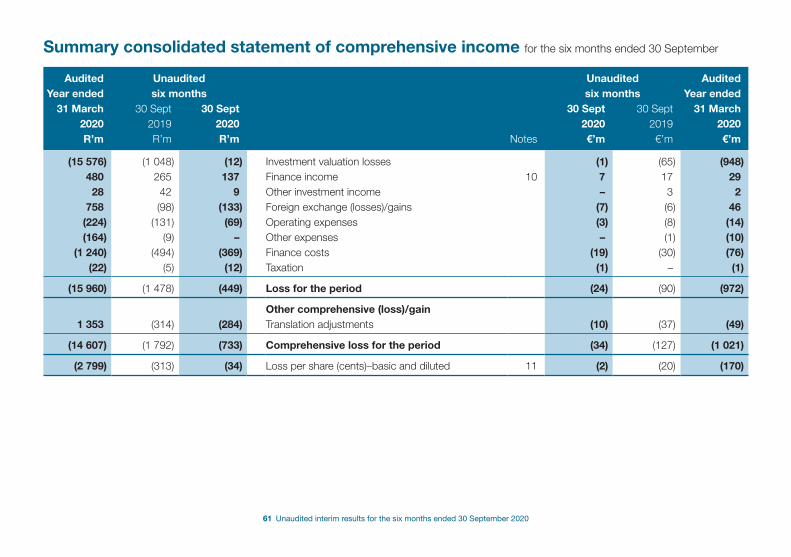
61 Unaudited interim results for the six months ended 30 September 2020
Summary consolidated statement of comprehensive income for the six months ended 30 September
Audited Unaudited Unaudited AuditedYear ended six months six months Year ended
31 March 30 Sept 30 Sept 30 Sept 30 Sept 31 March2020 2019 2020 2020 2019 2020R’m R’m R’m Notes €’m €’m €’m
(15 576) (1 048) (12) Investment valuation losses (1) (65) (948) 480 265 137 Finance income 10 7 17 29 28 42 9 Other investment income – 3 2
758 (98) (133) Foreign exchange (losses)/gains (7) (6) 46 (224) (131) (69) Operating expenses (3) (8) (14) (164) (9) – Other expenses – (1) (10)
(1 240) (494) (369) Finance costs (19) (30) (76) (22) (5) (12) Taxation (1) – (1)
(15 960) (1 478) (449) Loss for the period (24) (90) (972)
Other comprehensive (loss)/gain 1 353 (314) (284) Translation adjustments (10) (37) (49)
(14 607) (1 792) (733) Comprehensive loss for the period (34) (127) (1 021)
(2 799) (313) (34) Loss per share (cents)–basic and diluted 11 (2) (20) (170)
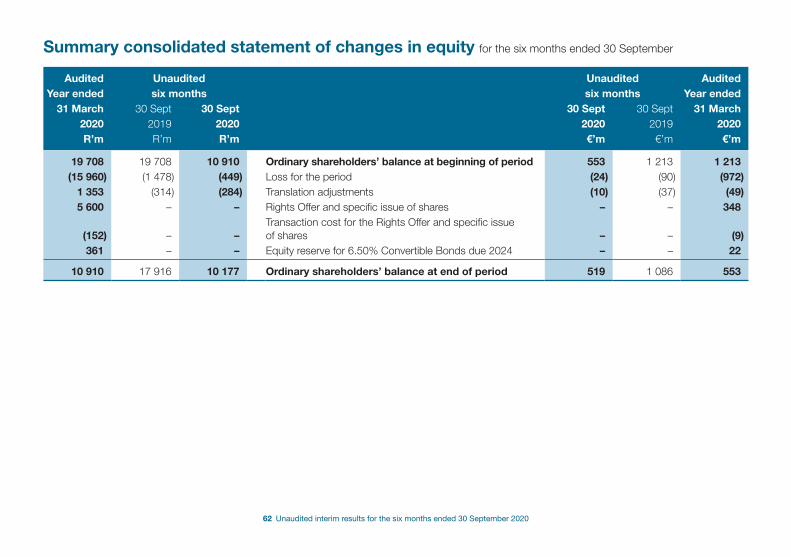
62 Unaudited interim results for the six months ended 30 September 2020
Summary consolidated statement of changes in equity for the six months ended 30 September
Audited Unaudited Unaudited AuditedYear ended six months six months Year ended
31 March 30 Sept 30 Sept 30 Sept 30 Sept 31 March2020 2019 2020 2020 2019 2020R’m R’m R’m €’m €’m €’m
19 708 19 708 10 910 Ordinary shareholders’ balance at beginning of period 553 1 213 1 213 (15 960) (1 478) (449) Loss for the period (24) (90) (972)
1 353 (314) (284) Translation adjustments (10) (37) (49) 5 600 – – Rights Offer and specific issue of shares – – 348
(152) – –Transaction cost for the Rights Offer and specific issue of shares – – (9)
361 – – Equity reserve for 6.50% Convertible Bonds due 2024 – – 22
10 910 17 916 10 177 Ordinary shareholders’ balance at end of period 519 1 086 553
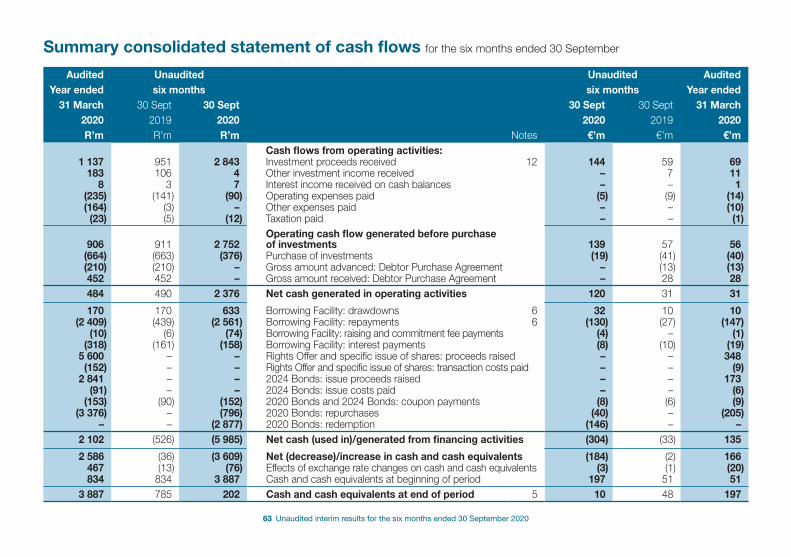
63 Unaudited interim results for the six months ended 30 September 2020
Summary consolidated statement of cash flows for the six months ended 30 September
Audited Unaudited Unaudited AuditedYear ended six months six months Year ended
31 March 30 Sept 30 Sept 30 Sept 30 Sept 31 March2020 2019 2020 2020 2019 2020R’m R’m R’m Notes €’m €’m €’m
Cash flows from operating activities: 1 137 951 2 843 Investment proceeds received 12 144 59 69
183 106 4 Other investment income received – 7 11 8 3 7 Interest income received on cash balances – – 1
(235) (141) (90) Operating expenses paid (5) (9) (14) (164) (3) – Other expenses paid – – (10)
(23) (5) (12) Taxation paid – – (1)
906 911 2 752 Operating cash flow generated before purchase of investments 139 57 56
(664) (663) (376) Purchase of investments (19) (41) (40) (210) (210) – Gross amount advanced: Debtor Purchase Agreement – (13) (13) 452 452 – Gross amount received: Debtor Purchase Agreement – 28 28 484 490 2 376 Net cash generated in operating activities 120 31 31
170 170 633 Borrowing Facility: drawdowns 6 32 10 10 (2 409) (439) (2 561) Borrowing Facility: repayments 6 (130) (27) (147)
(10) (6) (74) Borrowing Facility: raising and commitment fee payments (4) – (1) (318) (161) (158) Borrowing Facility: interest payments (8) (10) (19)
5 600 – – Rights Offer and specific issue of shares: proceeds raised – – 348 (152) – – Rights Offer and specific issue of shares: transaction costs paid – – (9)
2 841 – – 2024 Bonds: issue proceeds raised – – 173 (91) – – 2024 Bonds: issue costs paid – – (6)
(153) (90) (152) 2020 Bonds and 2024 Bonds: coupon payments (8) (6) (9) (3 376) – (796) 2020 Bonds: repurchases (40) – (205)
– – (2 877) 2020 Bonds: redemption (146) – – 2 102 (526) (5 985) Net cash (used in)/generated from financing activities (304) (33) 135
2 586 (36) (3 609) Net (decrease)/increase in cash and cash equivalents (184) (2) 166 467 (13) (76) Effects of exchange rate changes on cash and cash equivalents (3) (1) (20) 834 834 3 887 Cash and cash equivalents at beginning of period 197 51 51
3 887 785 202 Cash and cash equivalents at end of period 5 10 48 197
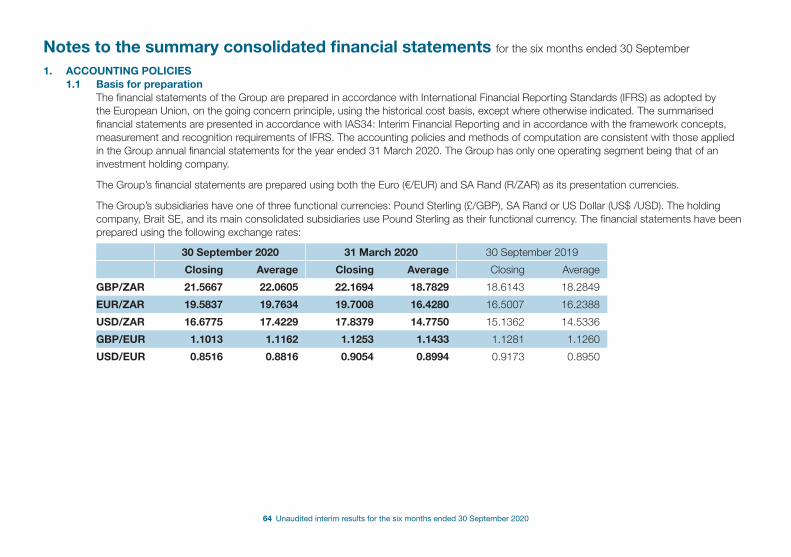
64 Unaudited interim results for the six months ended 30 September 2020
Notes to the summary consolidated financial statements for the six months ended 30 September
1. ACCOUNTING POLICIES1.1 Basis for preparation
The financial statements of the Group are prepared in accordance with International Financial Reporting Standards (IFRS) as adopted by the European Union, on the going concern principle, using the historical cost basis, except where otherwise indicated. The summarised financial statements are presented in accordance with IAS34: Interim Financial Reporting and in accordance with the framework concepts, measurement and recognition requirements of IFRS. The accounting policies and methods of computation are consistent with those applied in the Group annual financial statements for the year ended 31 March 2020. The Group has only one operating segment being that of an investment holding company.
The Group’s financial statements are prepared using both the Euro (€/EUR) and SA Rand (R/ZAR) as its presentation currencies.
The Group’s subsidiaries have one of three functional currencies: Pound Sterling (£/GBP), SA Rand or US Dollar (US$ /USD). The holding company, Brait SE, and its main consolidated subsidiaries use Pound Sterling as their functional currency. The financial statements have been prepared using the following exchange rates:
30 September 2020 31 March 2020 30 September 2019
Closing Average Closing Average Closing Average
GBP/ZAR 21.5667 22.0605 22.1694 18.7829 18.6143 18.2849
EUR/ZAR 19.5837 19.7634 19.7008 16.4280 16.5007 16.2388
USD/ZAR 16.6775 17.4229 17.8379 14.7750 15.1362 14.5336
GBP/EUR 1.1013 1.1162 1.1253 1.1433 1.1281 1.1260
USD/EUR 0.8516 0.8816 0.9054 0.8994 0.9173 0.8950
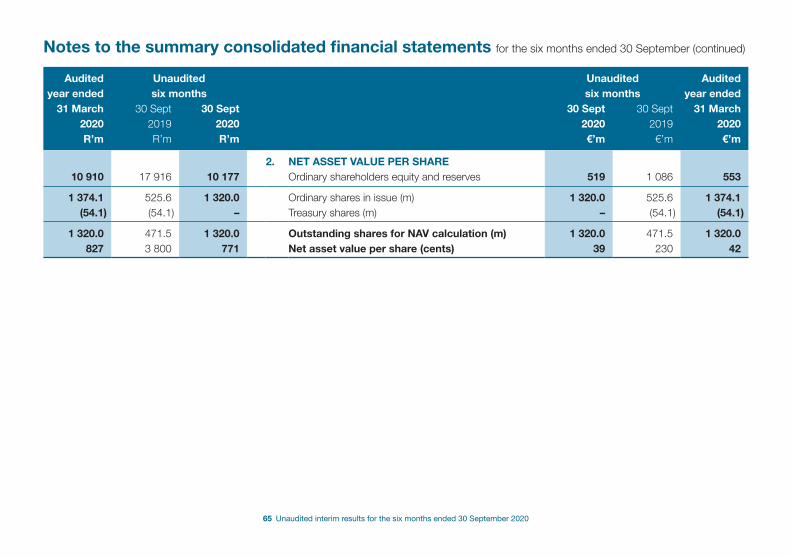
65 Unaudited interim results for the six months ended 30 September 2020
Notes to the summary consolidated financial statements for the six months ended 30 September (continued)
Audited Unaudited Unaudited Auditedyear ended six months six months year ended
31 March 30 Sept 30 Sept 30 Sept 30 Sept 31 March2020 2019 2020 2020 2019 2020R’m R’m R’m €’m €’m €’m
2. NET ASSET VALUE PER SHARE 10 910 17 916 10 177 Ordinary shareholders equity and reserves 519 1 086 553
1 374.1 525.6 1 320.0 Ordinary shares in issue (m) 1 320.0 525.6 1 374.1(54.1) (54.1) – Treasury shares (m) – (54.1) (54.1)
1 320.0 471.5 1 320.0 Outstanding shares for NAV calculation (m) 1 320.0 471.5 1 320.0 827 3 800 771 Net asset value per share (cents) 39 230 42
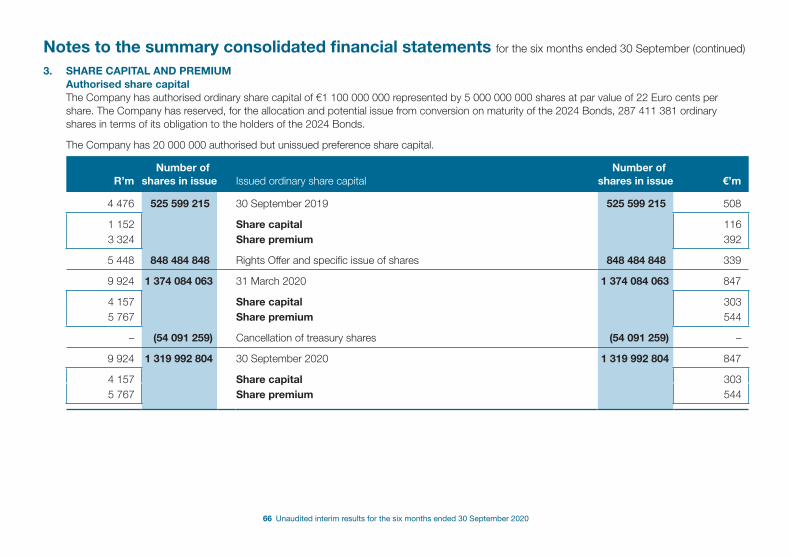
66 Unaudited interim results for the six months ended 30 September 2020
Notes to the summary consolidated financial statements for the six months ended 30 September (continued)
3. SHARE CAPITAL AND PREMIUMAuthorised share capitalThe Company has authorised ordinary share capital of €1 100 000 000 represented by 5 000 000 000 shares at par value of 22 Euro cents per share. The Company has reserved, for the allocation and potential issue from conversion on maturity of the 2024 Bonds, 287 411 381 ordinary shares in terms of its obligation to the holders of the 2024 Bonds.
The Company has 20 000 000 authorised but unissued preference share capital.
R’mNumber of
shares in issue Issued ordinary share capitalNumber of
shares in issue €’m
4 476 525 599 215 30 September 2019 525 599 215 508
1 152 Share capital 116 3 324 Share premium 392
5 448 848 484 848 Rights Offer and specific issue of shares 848 484 848 339
9 924 1 374 084 063 31 March 2020 1 374 084 063 847
4 157 Share capital 303 5 767 Share premium 544
– (54 091 259) Cancellation of treasury shares (54 091 259) –
9 924 1 319 992 804 30 September 2020 1 319 992 804 847
4 157 Share capital 303 5 767 Share premium 544
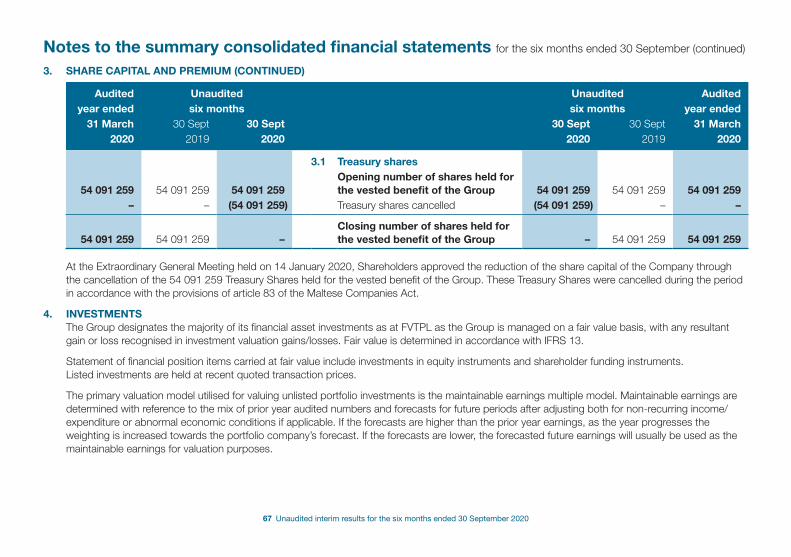
67 Unaudited interim results for the six months ended 30 September 2020
Notes to the summary consolidated financial statements for the six months ended 30 September (continued)
3. SHARE CAPITAL AND PREMIUM (CONTINUED)
Audited Unaudited Unaudited Auditedyear ended six months six months year ended
31 March 30 Sept 30 Sept 30 Sept 30 Sept 31 March2020 2019 2020 2020 2019 2020
3.1 Treasury shares
54 091 259 54 091 259 54 091 259 Opening number of shares held for the vested benefit of the Group 54 091 259 54 091 259 54 091 259
– – (54 091 259) Treasury shares cancelled (54 091 259) – –
54 091 259 54 091 259 –Closing number of shares held for the vested benefit of the Group – 54 091 259 54 091 259
At the Extraordinary General Meeting held on 14 January 2020, Shareholders approved the reduction of the share capital of the Company through the cancellation of the 54 091 259 Treasury Shares held for the vested benefit of the Group. These Treasury Shares were cancelled during the period in accordance with the provisions of article 83 of the Maltese Companies Act.
4. INVESTMENTSThe Group designates the majority of its financial asset investments as at FVTPL as the Group is managed on a fair value basis, with any resultant gain or loss recognised in investment valuation gains/losses. Fair value is determined in accordance with IFRS 13.
Statement of financial position items carried at fair value include investments in equity instruments and shareholder funding instruments. Listed investments are held at recent quoted transaction prices.
The primary valuation model utilised for valuing unlisted portfolio investments is the maintainable earnings multiple model. Maintainable earnings are determined with reference to the mix of prior year audited numbers and forecasts for future periods after adjusting both for non-recurring income/expenditure or abnormal economic conditions if applicable. If the forecasts are higher than the prior year earnings, as the year progresses the weighting is increased towards the portfolio company’s forecast. If the forecasts are lower, the forecasted future earnings will usually be used as the maintainable earnings for valuation purposes.
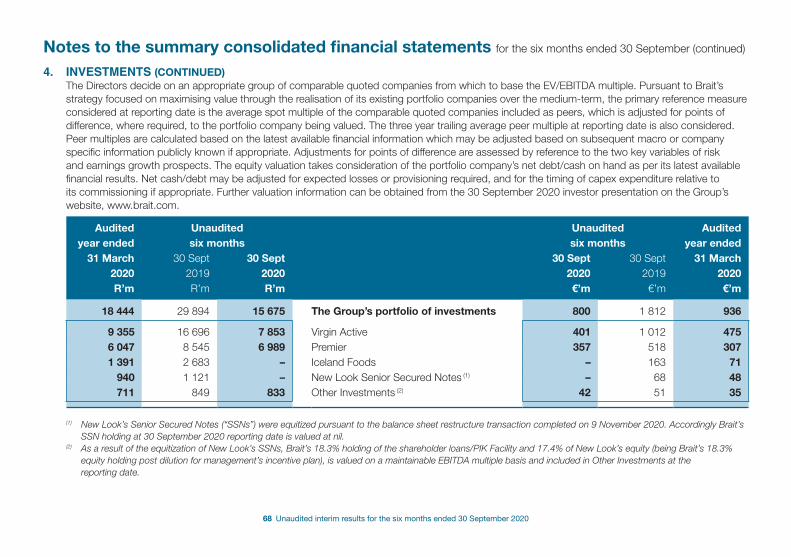
68 Unaudited interim results for the six months ended 30 September 2020
Notes to the summary consolidated financial statements for the six months ended 30 September (continued)
4. INVESTMENTS (CONTINUED)The Directors decide on an appropriate group of comparable quoted companies from which to base the EV/EBITDA multiple. Pursuant to Brait’s strategy focused on maximising value through the realisation of its existing portfolio companies over the medium-term, the primary reference measure considered at reporting date is the average spot multiple of the comparable quoted companies included as peers, which is adjusted for points of difference, where required, to the portfolio company being valued. The three year trailing average peer multiple at reporting date is also considered. Peer multiples are calculated based on the latest available financial information which may be adjusted based on subsequent macro or company specific information publicly known if appropriate. Adjustments for points of difference are assessed by reference to the two key variables of risk and earnings growth prospects. The equity valuation takes consideration of the portfolio company’s net debt/cash on hand as per its latest available financial results. Net cash/debt may be adjusted for expected losses or provisioning required, and for the timing of capex expenditure relative to its commissioning if appropriate. Further valuation information can be obtained from the 30 September 2020 investor presentation on the Group’s website, www.brait.com.
Audited Unaudited Unaudited Auditedyear ended six months six months year ended
31 March 30 Sept 30 Sept 30 Sept 30 Sept 31 March2020 2019 2020 2020 2019 2020R’m R’m R’m €’m €’m €’m
18 444 29 894 15 675 The Group’s portfolio of investments 800 1 812 936
9 355 16 696 7 853 Virgin Active 401 1 012 475 6 047 8 545 6 989 Premier 357 518 307 1 391 2 683 – Iceland Foods – 163 71
940 1 121 – New Look Senior Secured Notes (1) – 68 48711 849 833 Other Investments (2) 42 51 35
(1) New Look’s Senior Secured Notes (“SSNs”) were equitized pursuant to the balance sheet restructure transaction completed on 9 November 2020. Accordingly Brait’s SSN holding at 30 September 2020 reporting date is valued at nil.
(2) As a result of the equitization of New Look’s SSNs, Brait’s 18.3% holding of the shareholder loans/PIK Facility and 17.4% of New Look’s equity (being Brait’s 18.3% equity holding post dilution for management’s incentive plan), is valued on a maintainable EBITDA multiple basis and included in Other Investments at the reporting date.
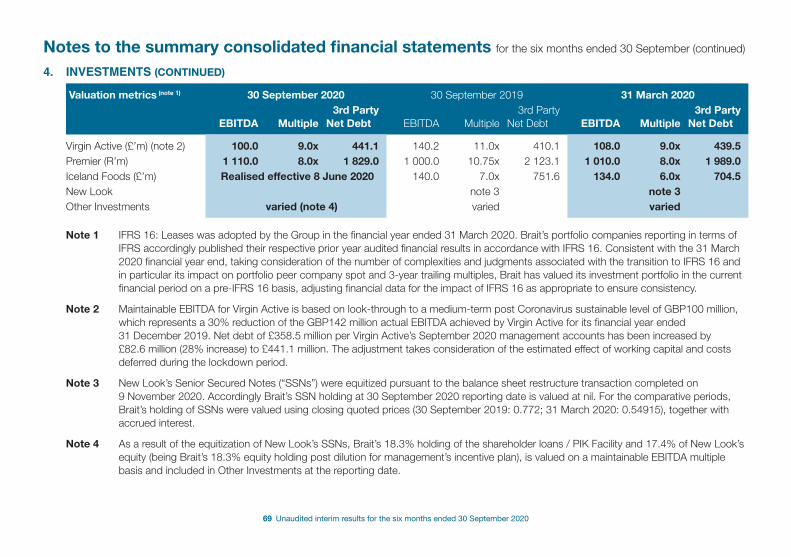
69 Unaudited interim results for the six months ended 30 September 2020
Notes to the summary consolidated financial statements for the six months ended 30 September (continued)
4. INVESTMENTS (CONTINUED)
Valuation metrics (note 1) 30 September 2020 30 September 2019 31 March 2020
EBITDA Multiple3rd Party
Net Debt EBITDA Multiple3rd Party
Net Debt EBITDA Multiple3rd Party
Net Debt
Virgin Active (£’m) (note 2) 100.0 9.0x 441.1 140.2 11.0x 410.1 108.0 9.0x 439.5 Premier (R’m) 1 110.0 8.0x 1 829.0 1 000.0 10.75x 2 123.1 1 010.0 8.0x 1 989.0 Iceland Foods (£’m) Realised effective 8 June 2020 140.0 7.0x 751.6 134.0 6.0x 704.5 New Look note 3 note 3Other Investments varied (note 4) varied varied
Note 1 IFRS 16: Leases was adopted by the Group in the financial year ended 31 March 2020. Brait’s portfolio companies reporting in terms of IFRS accordingly published their respective prior year audited financial results in accordance with IFRS 16. Consistent with the 31 March 2020 financial year end, taking consideration of the number of complexities and judgments associated with the transition to IFRS 16 and in particular its impact on portfolio peer company spot and 3-year trailing multiples, Brait has valued its investment portfolio in the current financial period on a pre-IFRS 16 basis, adjusting financial data for the impact of IFRS 16 as appropriate to ensure consistency.
Note 2 Maintainable EBITDA for Virgin Active is based on look-through to a medium-term post Coronavirus sustainable level of GBP100 million, which represents a 30% reduction of the GBP142 million actual EBITDA achieved by Virgin Active for its financial year ended 31 December 2019. Net debt of £358.5 million per Virgin Active’s September 2020 management accounts has been increased by £82.6 million (28% increase) to £441.1 million. The adjustment takes consideration of the estimated effect of working capital and costs deferred during the lockdown period.
Note 3 New Look’s Senior Secured Notes (“SSNs”) were equitized pursuant to the balance sheet restructure transaction completed on 9 November 2020. Accordingly Brait’s SSN holding at 30 September 2020 reporting date is valued at nil. For the comparative periods, Brait’s holding of SSNs were valued using closing quoted prices (30 September 2019: 0.772; 31 March 2020: 0.54915), together with accrued interest.
Note 4 As a result of the equitization of New Look’s SSNs, Brait’s 18.3% holding of the shareholder loans / PIK Facility and 17.4% of New Look’s equity (being Brait’s 18.3% equity holding post dilution for management’s incentive plan), is valued on a maintainable EBITDA multiple basis and included in Other Investments at the reporting date.
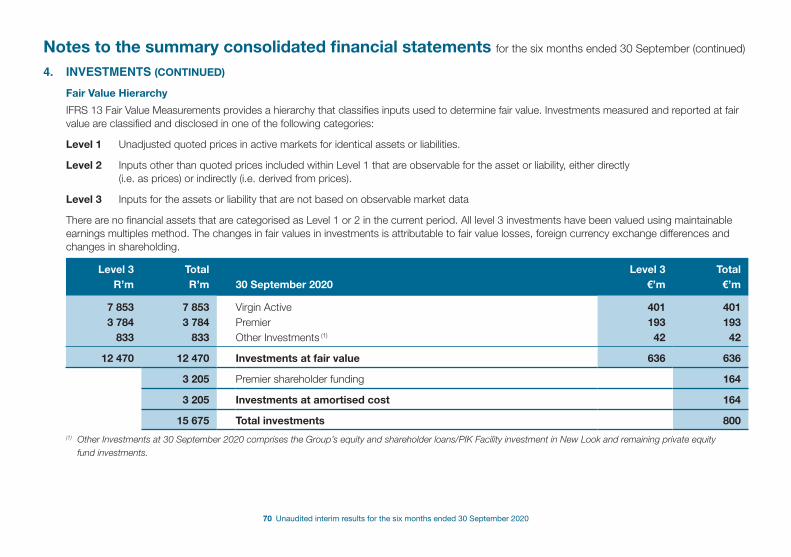
70 Unaudited interim results for the six months ended 30 September 2020
Notes to the summary consolidated financial statements for the six months ended 30 September (continued)
4. INVESTMENTS (CONTINUED)
Fair Value Hierarchy
IFRS 13 Fair Value Measurements provides a hierarchy that classifies inputs used to determine fair value. Investments measured and reported at fair value are classified and disclosed in one of the following categories:
Level 1 Unadjusted quoted prices in active markets for identical assets or liabilities.
Level 2 Inputs other than quoted prices included within Level 1 that are observable for the asset or liability, either directly (i.e. as prices) or indirectly (i.e. derived from prices).
Level 3 Inputs for the assets or liability that are not based on observable market data
There are no financial assets that are categorised as Level 1 or 2 in the current period. All level 3 investments have been valued using maintainable earnings multiples method. The changes in fair values in investments is attributable to fair value losses, foreign currency exchange differences and changes in shareholding.
Level 3 Total Level 3 TotalR’m R’m 30 September 2020 €’m €’m
7 853 7 853 Virgin Active 401 4013 784 3 784 Premier 193 193
833 833 Other Investments (1) 42 42
12 470 12 470 Investments at fair value 636 636
3 205 Premier shareholder funding 164
3 205 Investments at amortised cost 164
15 675 Total investments 800(1) Other Investments at 30 September 2020 comprises the Group’s equity and shareholder loans/PIK Facility investment in New Look and remaining private equity
fund investments.
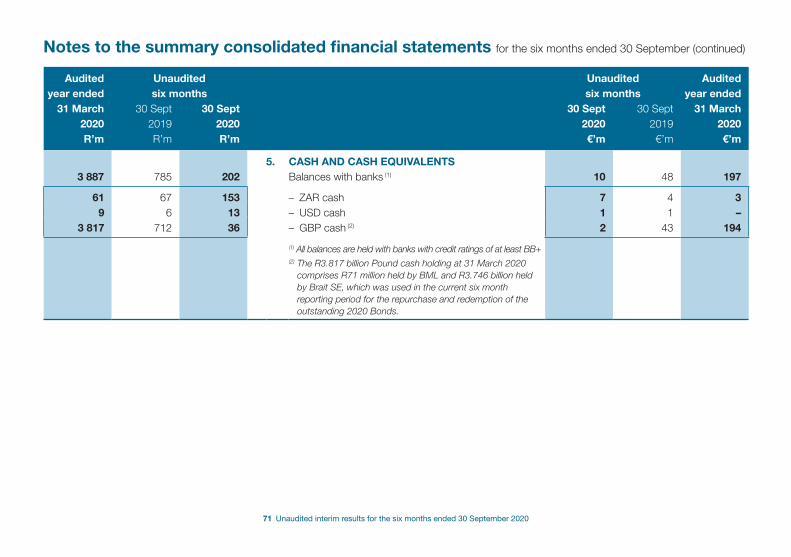
71 Unaudited interim results for the six months ended 30 September 2020
Notes to the summary consolidated financial statements for the six months ended 30 September (continued)
Audited Unaudited Unaudited Auditedyear ended six months six months year ended
31 March 30 Sept 30 Sept 30 Sept 30 Sept 31 March2020 2019 2020 2020 2019 2020R’m R’m R’m €’m €’m €’m
5. CASH AND CASH EQUIVALENTS3 887 785 202 Balances with banks (1) 10 48 197
61 67 153 – ZAR cash 7 4 39 6 13 – USD cash 1 1 –
3 817 712 36 – GBP cash (2) 2 43 194
(1) All balances are held with banks with credit ratings of at least BB+(2) The R3.817 billion Pound cash holding at 31 March 2020
comprises R71 million held by BML and R3.746 billion held by Brait SE, which was used in the current six month reporting period for the repurchase and redemption of the outstanding 2020 Bonds.
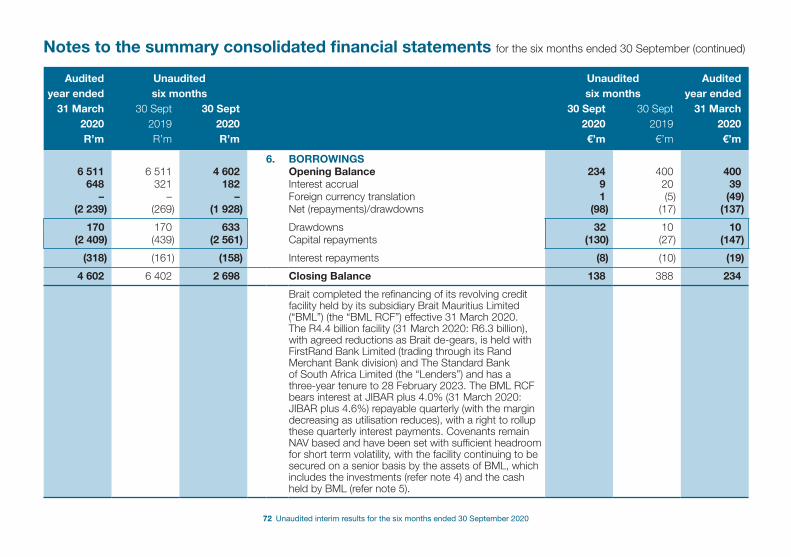
72 Unaudited interim results for the six months ended 30 September 2020
Notes to the summary consolidated financial statements for the six months ended 30 September (continued)
Audited Unaudited Unaudited Auditedyear ended six months six months year ended
31 March 30 Sept 30 Sept 30 Sept 30 Sept 31 March2020 2019 2020 2020 2019 2020R’m R’m R’m €’m €’m €’m
6. BORROWINGS6 511 6 511 4 602 Opening Balance 234 400 400
648 321 182 Interest accrual 9 20 39– – – Foreign currency translation 1 (5) (49)
(2 239) (269) (1 928) Net (repayments)/drawdowns (98) (17) (137)
170 170 633 Drawdowns 32 10 10(2 409) (439) (2 561) Capital repayments (130) (27) (147)
(318) (161) (158) Interest repayments (8) (10) (19)
4 602 6 402 2 698 Closing Balance 138 388 234
Brait completed the refinancing of its revolving credit facility held by its subsidiary Brait Mauritius Limited (“BML”) (the “BML RCF”) effective 31 March 2020. The R4.4 billion facility (31 March 2020: R6.3 billion), with agreed reductions as Brait de-gears, is held with FirstRand Bank Limited (trading through its Rand Merchant Bank division) and The Standard Bank of South Africa Limited (the “Lenders”) and has a three-year tenure to 28 February 2023. The BML RCF bears interest at JIBAR plus 4.0% (31 March 2020: JIBAR plus 4.6%) repayable quarterly (with the margin decreasing as utilisation reduces), with a right to rollup these quarterly interest payments. Covenants remain NAV based and have been set with sufficient headroom for short term volatility, with the facility continuing to be secured on a senior basis by the assets of BML, which includes the investments (refer note 4) and the cash held by BML (refer note 5).
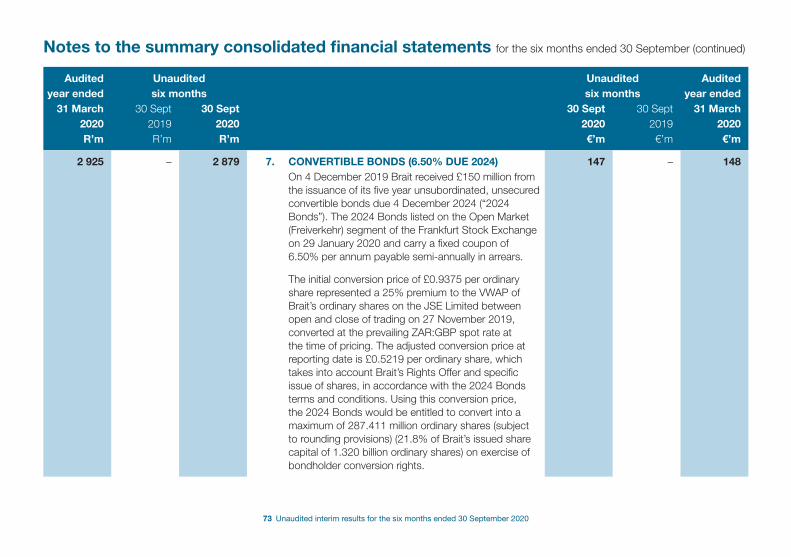
73 Unaudited interim results for the six months ended 30 September 2020
Notes to the summary consolidated financial statements for the six months ended 30 September (continued)
Audited Unaudited Unaudited Auditedyear ended six months six months year ended
31 March 30 Sept 30 Sept 30 Sept 30 Sept 31 March2020 2019 2020 2020 2019 2020R’m R’m R’m €’m €’m €’m
2 925 – 2 879 7. CONVERTIBLE BONDS (6.50% DUE 2024) 147 – 148On 4 December 2019 Brait received £150 million from the issuance of its five year unsubordinated, unsecured convertible bonds due 4 December 2024 (“2024 Bonds”). The 2024 Bonds listed on the Open Market (Freiverkehr) segment of the Frankfurt Stock Exchange on 29 January 2020 and carry a fixed coupon of 6.50% per annum payable semi-annually in arrears.
The initial conversion price of £0.9375 per ordinary share represented a 25% premium to the VWAP of Brait’s ordinary shares on the JSE Limited between open and close of trading on 27 November 2019, converted at the prevailing ZAR:GBP spot rate at the time of pricing. The adjusted conversion price at reporting date is £0.5219 per ordinary share, which takes into account Brait’s Rights Offer and specific issue of shares, in accordance with the 2024 Bonds terms and conditions. Using this conversion price, the 2024 Bonds would be entitled to convert into a maximum of 287.411 million ordinary shares (subject to rounding provisions) (21.8% of Brait’s issued share capital of 1.320 billion ordinary shares) on exercise of bondholder conversion rights.
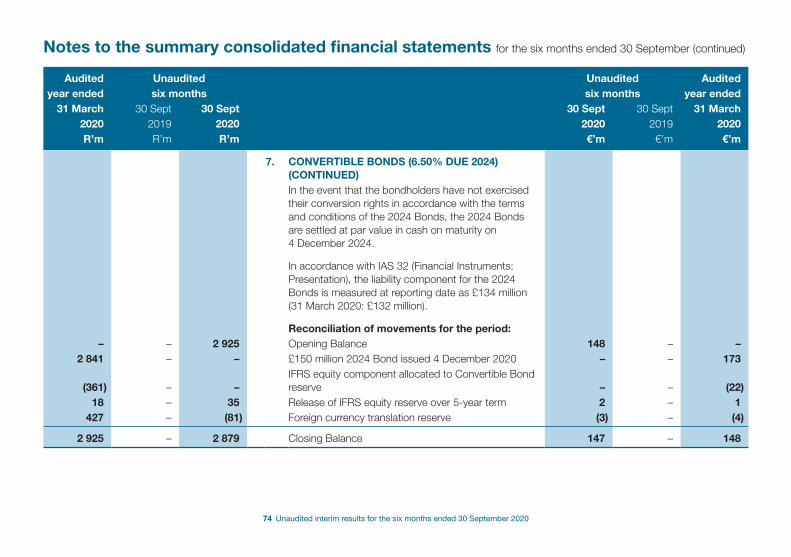
74 Unaudited interim results for the six months ended 30 September 2020
Notes to the summary consolidated financial statements for the six months ended 30 September (continued)
Audited Unaudited Unaudited Auditedyear ended six months six months year ended
31 March 30 Sept 30 Sept 30 Sept 30 Sept 31 March2020 2019 2020 2020 2019 2020R’m R’m R’m €’m €’m €’m
7. CONVERTIBLE BONDS (6.50% DUE 2024) (CONTINUED)In the event that the bondholders have not exercised their conversion rights in accordance with the terms and conditions of the 2024 Bonds, the 2024 Bonds are settled at par value in cash on maturity on 4 December 2024.
In accordance with IAS 32 (Financial Instruments: Presentation), the liability component for the 2024 Bonds is measured at reporting date as £134 million (31 March 2020: £132 million).
Reconciliation of movements for the period:– – 2 925 Opening Balance 148 – –
2 841 – – £150 million 2024 Bond issued 4 December 2020 – – 173
(361) – –IFRS equity component allocated to Convertible Bond reserve – – (22)
18 – 35 Release of IFRS equity reserve over 5-year term 2 – 1 427 – (81) Foreign currency translation reserve (3) – (4)
2 925 – 2 879 Closing Balance 147 – 148
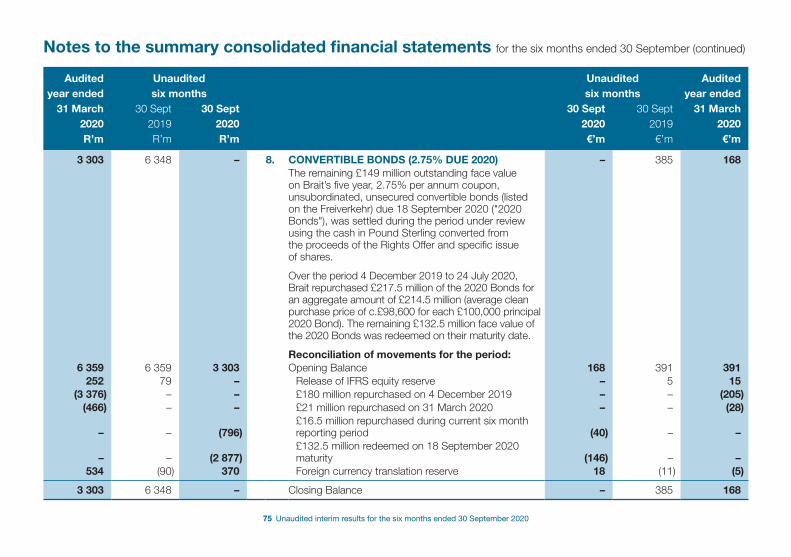
75 Unaudited interim results for the six months ended 30 September 2020
Notes to the summary consolidated financial statements for the six months ended 30 September (continued)
Audited Unaudited Unaudited Auditedyear ended six months six months year ended
31 March 30 Sept 30 Sept 30 Sept 30 Sept 31 March2020 2019 2020 2020 2019 2020R’m R’m R’m €’m €’m €’m
3 303 6 348 – 8. CONVERTIBLE BONDS (2.75% DUE 2020) – 385 168The remaining £149 million outstanding face value on Brait’s five year, 2.75% per annum coupon, unsubordinated, unsecured convertible bonds (listed on the Freiverkehr) due 18 September 2020 ("2020 Bonds"), was settled during the period under review using the cash in Pound Sterling converted from the proceeds of the Rights Offer and specific issue of shares.
Over the period 4 December 2019 to 24 July 2020, Brait repurchased £217.5 million of the 2020 Bonds for an aggregate amount of £214.5 million (average clean purchase price of c.£98,600 for each £100,000 principal 2020 Bond). The remaining £132.5 million face value of the 2020 Bonds was redeemed on their maturity date.
Reconciliation of movements for the period:6 359 6 359 3 303 Opening Balance 168 391 391
252 79 – Release of IFRS equity reserve – 5 15(3 376) – – £180 million repurchased on 4 December 2019 – – (205)
(466) – – £21 million repurchased on 31 March 2020 – – (28)
– – (796)£16.5 million repurchased during current six month reporting period (40) – –
– – (2 877)£132.5 million redeemed on 18 September 2020 maturity (146) – –
534 (90) 370 Foreign currency translation reserve 18 (11) (5)
3 303 6 348 – Closing Balance – 385 168
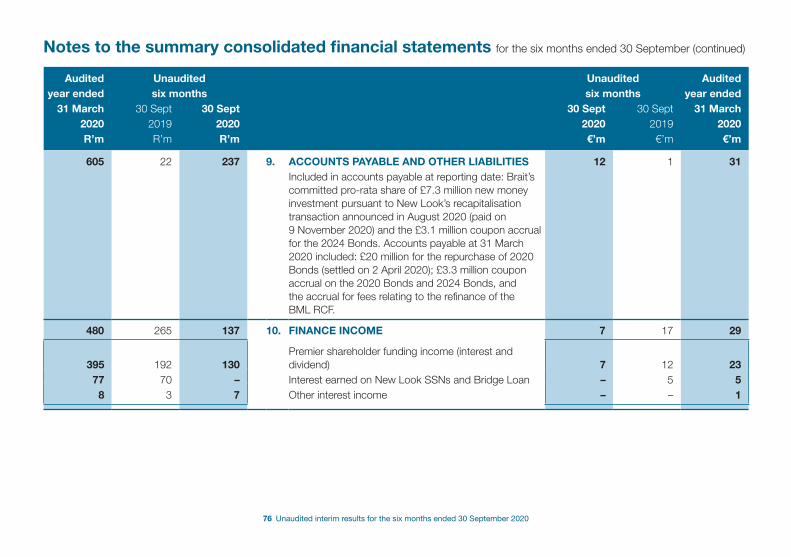
76 Unaudited interim results for the six months ended 30 September 2020
Notes to the summary consolidated financial statements for the six months ended 30 September (continued)
Audited Unaudited Unaudited Auditedyear ended six months six months year ended
31 March 30 Sept 30 Sept 30 Sept 30 Sept 31 March2020 2019 2020 2020 2019 2020R’m R’m R’m €’m €’m €’m
605 22 237 9. ACCOUNTS PAYABLE AND OTHER LIABILITIES 12 1 31Included in accounts payable at reporting date: Brait’s committed pro-rata share of £7.3 million new money investment pursuant to New Look’s recapitalisation transaction announced in August 2020 (paid on 9 November 2020) and the £3.1 million coupon accrual for the 2024 Bonds. Accounts payable at 31 March 2020 included: £20 million for the repurchase of 2020 Bonds (settled on 2 April 2020); £3.3 million coupon accrual on the 2020 Bonds and 2024 Bonds, and the accrual for fees relating to the refinance of the BML RCF.
480 265 137 10. FINANCE INCOME 7 17 29
395 192 130Premier shareholder funding income (interest and dividend) 7 12 23
77 70 – Interest earned on New Look SSNs and Bridge Loan – 5 58 3 7 Other interest income – – 1
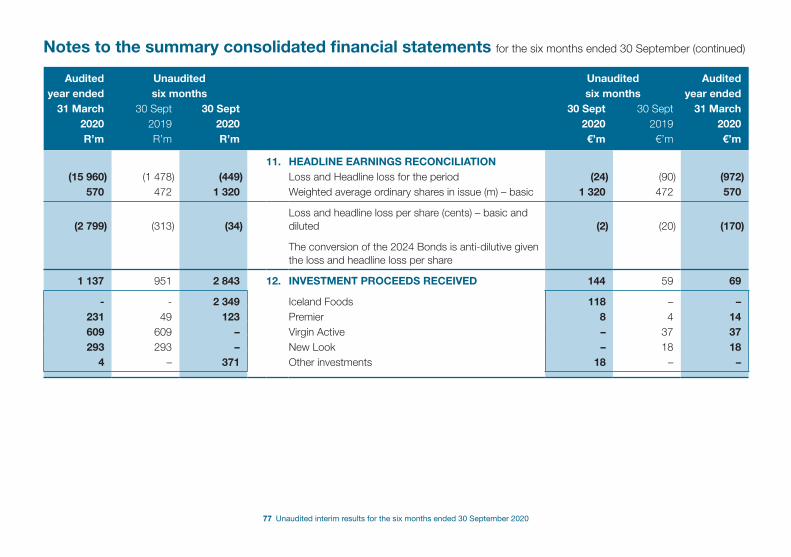
77 Unaudited interim results for the six months ended 30 September 2020
Notes to the summary consolidated financial statements for the six months ended 30 September (continued)
Audited Unaudited Unaudited Auditedyear ended six months six months year ended
31 March 30 Sept 30 Sept 30 Sept 30 Sept 31 March2020 2019 2020 2020 2019 2020R’m R’m R’m €’m €’m €’m
11. HEADLINE EARNINGS RECONCILIATION(15 960) (1 478) (449) Loss and Headline loss for the period (24) (90) (972)
570 472 1 320 Weighted average ordinary shares in issue (m) – basic 1 320 472 570
(2 799) (313) (34)Loss and headline loss per share (cents) – basic and diluted (2) (20) (170)
The conversion of the 2024 Bonds is anti-dilutive given the loss and headline loss per share
1 137 951 2 843 12. INVESTMENT PROCEEDS RECEIVED 144 59 69
- - 2 349 Iceland Foods 118 – –231 49 123 Premier 8 4 14609 609 – Virgin Active – 37 37293 293 – New Look – 18 18
4 – 371 Other investments 18 – –
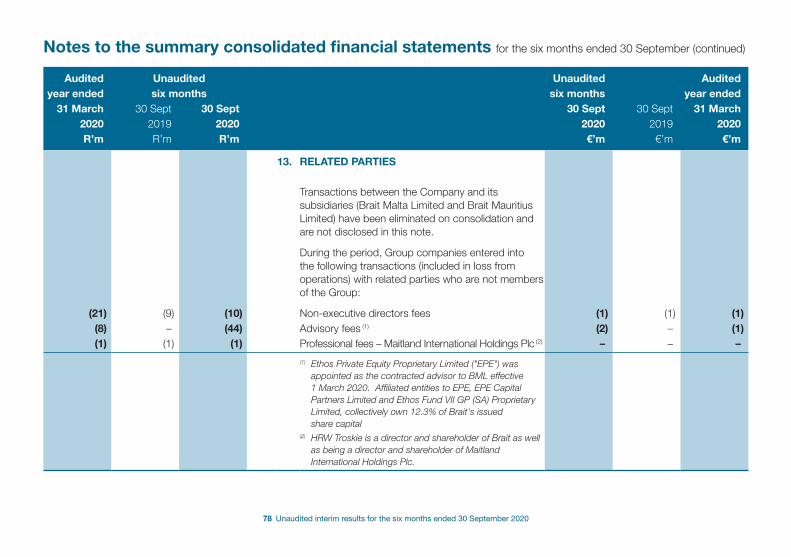
78 Unaudited interim results for the six months ended 30 September 2020
Notes to the summary consolidated financial statements for the six months ended 30 September (continued)
Audited Unaudited Unaudited Auditedyear ended six months six months year ended
31 March 30 Sept 30 Sept 30 Sept 30 Sept 31 March2020 2019 2020 2020 2019 2020R’m R’m R’m €’m €’m €’m
13. RELATED PARTIES
Transactions between the Company and its subsidiaries (Brait Malta Limited and Brait Mauritius Limited) have been eliminated on consolidation and are not disclosed in this note.
During the period, Group companies entered into the following transactions (included in loss from operations) with related parties who are not members of the Group:
(21) (9) (10) Non-executive directors fees (1) (1) (1)(8) – (44) Advisory fees (1) (2) – (1)(1) (1) (1) Professional fees – Maitland International Holdings Plc (2) – – –
(1) Ethos Private Equity Proprietary Limited ("EPE") was appointed as the contracted advisor to BML effective 1 March 2020. Affiliated entities to EPE, EPE Capital Partners Limited and Ethos Fund VII GP (SA) Proprietary Limited, collectively own 12.3% of Brait's issued share capital
(2) HRW Troskie is a director and shareholder of Brait as well as being a director and shareholder of Maitland International Holdings Plc.
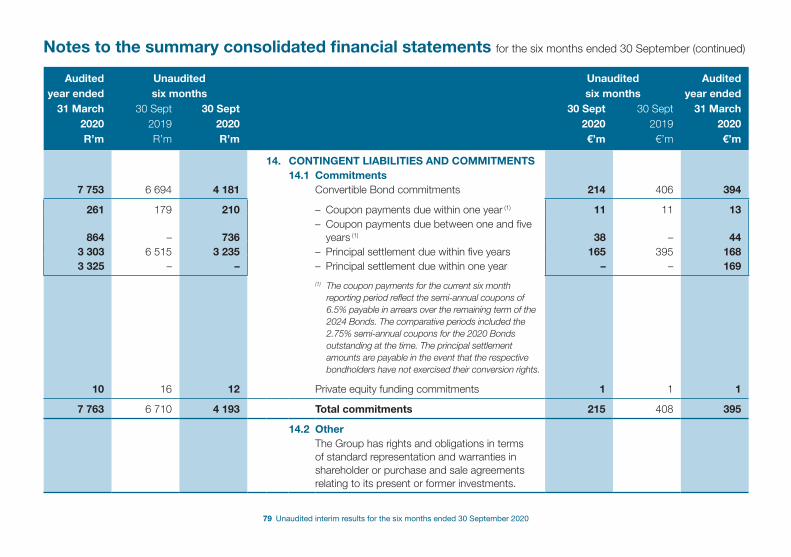
79 Unaudited interim results for the six months ended 30 September 2020
Notes to the summary consolidated financial statements for the six months ended 30 September (continued)
Audited Unaudited Unaudited Auditedyear ended six months six months year ended
31 March 30 Sept 30 Sept 30 Sept 30 Sept 31 March2020 2019 2020 2020 2019 2020R’m R’m R’m €’m €’m €’m
14. CONTINGENT LIABILITIES AND COMMITMENTS 14.1 Commitments
7 753 6 694 4 181 Convertible Bond commitments 214 406 394
261 179 210 – Coupon payments due within one year (1) 11 11 13
864 – 736– Coupon payments due between one and five
years (1) 38 – 443 303 6 515 3 235 – Principal settlement due within five years 165 395 1683 325 – – – Principal settlement due within one year – – 169
(1) The coupon payments for the current six month reporting period reflect the semi-annual coupons of 6.5% payable in arrears over the remaining term of the 2024 Bonds. The comparative periods included the 2.75% semi-annual coupons for the 2020 Bonds outstanding at the time. The principal settlement amounts are payable in the event that the respective bondholders have not exercised their conversion rights.
10 16 12 Private equity funding commitments 1 1 1
7 763 6 710 4 193 Total commitments 215 408 395
14.2 OtherThe Group has rights and obligations in terms of standard representation and warranties in shareholder or purchase and sale agreements relating to its present or former investments.
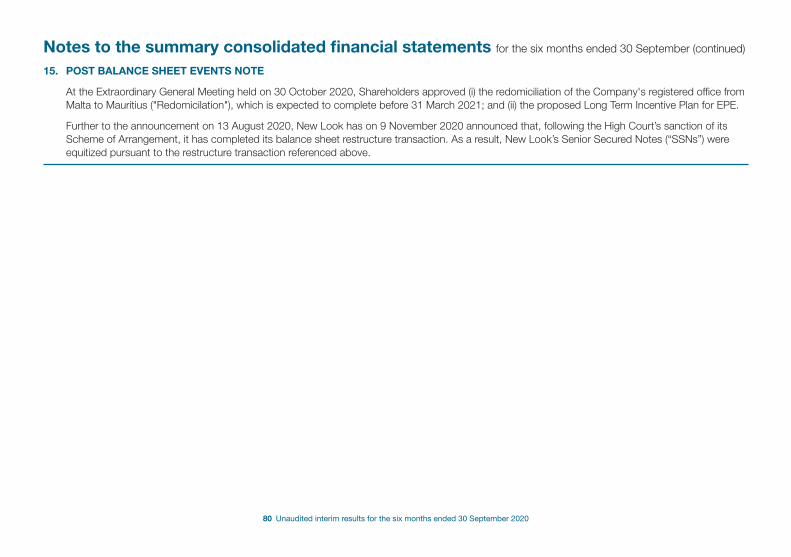
80 Unaudited interim results for the six months ended 30 September 2020
15. POST BALANCE SHEET EVENTS NOTE
At the Extraordinary General Meeting held on 30 October 2020, Shareholders approved (i) the redomiciliation of the Company's registered office from Malta to Mauritius ("Redomicilation"), which is expected to complete before 31 March 2021; and (ii) the proposed Long Term Incentive Plan for EPE.
Further to the announcement on 13 August 2020, New Look has on 9 November 2020 announced that, following the High Court’s sanction of its Scheme of Arrangement, it has completed its balance sheet restructure transaction. As a result, New Look’s Senior Secured Notes (“SSNs”) were equitized pursuant to the restructure transaction referenced above.
Notes to the summary consolidated financial statements for the six months ended 30 September (continued)
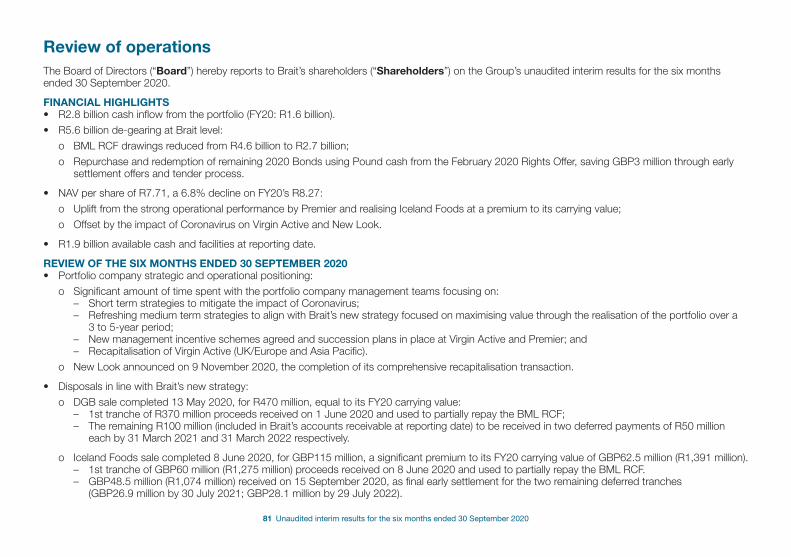
81 Unaudited interim results for the six months ended 30 September 2020
Review of operationsThe Board of Directors (“Board”) hereby reports to Brait’s shareholders (“Shareholders”) on the Group’s unaudited interim results for the six months ended 30 September 2020.
FINANCIAL HIGHLIGHTS• R2.8 billion cash inflow from the portfolio (FY20: R1.6 billion).
• R5.6 billion de-gearing at Brait level:
o BML RCF drawings reduced from R4.6 billion to R2.7 billion;
o Repurchase and redemption of remaining 2020 Bonds using Pound cash from the February 2020 Rights Offer, saving GBP3 million through early settlement offers and tender process.
• NAV per share of R7.71, a 6.8% decline on FY20’s R8.27:
o Uplift from the strong operational performance by Premier and realising Iceland Foods at a premium to its carrying value;
o Offset by the impact of Coronavirus on Virgin Active and New Look.
• R1.9 billion available cash and facilities at reporting date.
REVIEW OF THE SIX MONTHS ENDED 30 SEPTEMBER 2020 • Portfolio company strategic and operational positioning:
o Significant amount of time spent with the portfolio company management teams focusing on: – Short term strategies to mitigate the impact of Coronavirus; – Refreshing medium term strategies to align with Brait’s new strategy focused on maximising value through the realisation of the portfolio over a
3 to 5-year period; – New management incentive schemes agreed and succession plans in place at Virgin Active and Premier; and – Recapitalisation of Virgin Active (UK/Europe and Asia Pacific).
o New Look announced on 9 November 2020, the completion of its comprehensive recapitalisation transaction.
• Disposals in line with Brait’s new strategy:
o DGB sale completed 13 May 2020, for R470 million, equal to its FY20 carrying value: – 1st tranche of R370 million proceeds received on 1 June 2020 and used to partially repay the BML RCF; – The remaining R100 million (included in Brait’s accounts receivable at reporting date) to be received in two deferred payments of R50 million
each by 31 March 2021 and 31 March 2022 respectively.
o Iceland Foods sale completed 8 June 2020, for GBP115 million, a significant premium to its FY20 carrying value of GBP62.5 million (R1,391 million). – 1st tranche of GBP60 million (R1,275 million) proceeds received on 8 June 2020 and used to partially repay the BML RCF. – GBP48.5 million (R1,074 million) received on 15 September 2020, as final early settlement for the two remaining deferred tranches
(GBP26.9 million by 30 July 2021; GBP28.1 million by 29 July 2022).
82 Unaudited interim results for the six months ended 30 September 2020
Review of operations (continued)
• Governance:
o At the Annual General Meeting held in Malta on 13 August 2020 (“AGM”), Shareholders approved the appointment of the new Board of non-executive directors as proposed, comprising 5 new members (RA Nelson (British, Chairman of the Board); PG Joubert (Mauritian resident, Chairman of the Audit and Risk Committee); JM Grant (British, Chairman of the ESG Committee); Y Jekwa (South African) and PJ Roelofse (South African)) and 3 re-elected members (Dr CH Wiese (South African); HRW Troskie (Dutch, Chairman of the Remuneration and Nomination Committee); and Dr LL Porter (Malta resident, has indicated he will step down from the Board once the Redomiciliation from Malta to Mauritius has been completed)). Their respective biographies are available on Brait’s website at www.brait.com.
o At the Extraordinary General Meeting held in Malta on 30 October 2020, Shareholders approved: – The requisite resolutions for Brait’s registered office to be transferred from Malta to Mauritius, where the Company’s main investment
subsidiary, Brait Mauritius Limited (“BML”) is domiciled (the “Redomiciliation”). The Redomiciliation process, which is expected to complete by 31 March 2021, will not impact the Company’s primary listing on the Euro MTF Market of the LuxSE or its secondary listing on the JSE. No amendments will be required to the terms and conditions of the GBP150 million 6.5% Convertible Bonds due on 4 December 2024 (“2024 Bonds”). In addition, the share capital of the Company will not be affected.
– The Long Term Incentive Plan (“LTIP”) for Brait’s contracted advisor, Ethos Private Equity (the “Advisor”). The LTIP is a five-year structure designed to align the interests of the Advisor with those of Shareholders in delivering on Brait’s revised strategy of realising value from the portfolio over the medium term, whilst minimising dilution to Shareholders.
o In line with the Board’s focus on reducing costs:
– The proposed compensation for the new Board, at a significantly reduced level (c.50%), was approved by Shareholders at the AGM; – Estimated annualised savings to Brait’s cash costs of c.R508 million since 1 March 2020, which includes the benefit of a c.3% reduction in SA
Base Rates and 0.6% margin reduction on the BML RCF following repayments during the current period.
IMPACT OF CORONAVIRUSThe Coronavirus pandemic has materially impacted Virgin Active and New Look. The respective portfolio company management teams have taken appropriate measures to preserve liquidity, removing all but essential capital expenditure investments and making operating expense reductions where possible, including measures to defer and/or reduce rental expenses. As discussed below, Virgin Active’s shareholders contributed aggregate funding of GBP25 million in June 2020, which was matched by a further GBP25 million of new bank debt from the UK, Italy and Asia Pacific banking syndicate. A key concern remains the resurgence of a second Coronavirus wave and the restrictions imposed by governments across Europe. Whilst trading in all territories had improved significantly since the easing of the initial lockdown restrictions, the new government restrictions will impact the UK and European businesses. As with the first lockdown, management have reduced all expenditure in the underlying businesses and are benefitting from the government support that has been offered in both the UK and Italy.
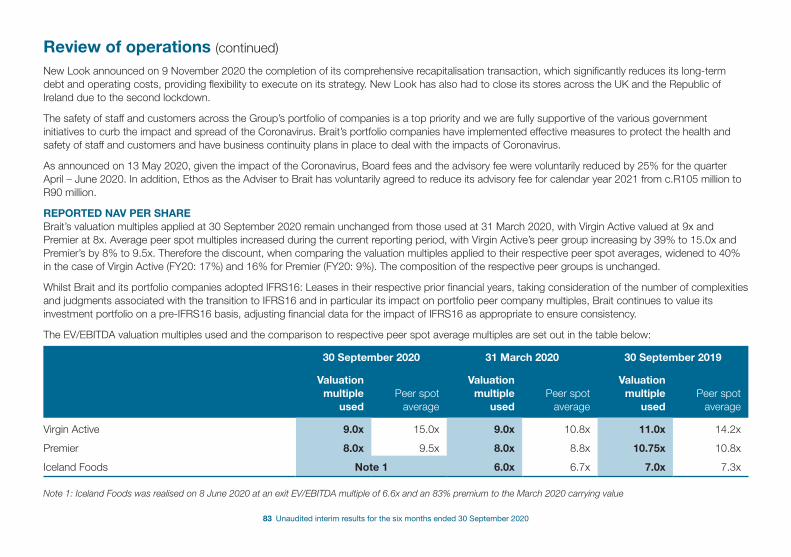
83 Unaudited interim results for the six months ended 30 September 2020
Review of operations (continued)
New Look announced on 9 November 2020 the completion of its comprehensive recapitalisation transaction, which significantly reduces its long-term debt and operating costs, providing flexibility to execute on its strategy. New Look has also had to close its stores across the UK and the Republic of Ireland due to the second lockdown.
The safety of staff and customers across the Group’s portfolio of companies is a top priority and we are fully supportive of the various government initiatives to curb the impact and spread of the Coronavirus. Brait’s portfolio companies have implemented effective measures to protect the health and safety of staff and customers and have business continuity plans in place to deal with the impacts of Coronavirus.
As announced on 13 May 2020, given the impact of the Coronavirus, Board fees and the advisory fee were voluntarily reduced by 25% for the quarter April – June 2020. In addition, Ethos as the Adviser to Brait has voluntarily agreed to reduce its advisory fee for calendar year 2021 from c.R105 million to R90 million.
REPORTED NAV PER SHARE Brait’s valuation multiples applied at 30 September 2020 remain unchanged from those used at 31 March 2020, with Virgin Active valued at 9x and Premier at 8x. Average peer spot multiples increased during the current reporting period, with Virgin Active’s peer group increasing by 39% to 15.0x and Premier’s by 8% to 9.5x. Therefore the discount, when comparing the valuation multiples applied to their respective peer spot averages, widened to 40% in the case of Virgin Active (FY20: 17%) and 16% for Premier (FY20: 9%). The composition of the respective peer groups is unchanged.
Whilst Brait and its portfolio companies adopted IFRS16: Leases in their respective prior financial years, taking consideration of the number of complexities and judgments associated with the transition to IFRS16 and in particular its impact on portfolio peer company multiples, Brait continues to value its investment portfolio on a pre-IFRS16 basis, adjusting financial data for the impact of IFRS16 as appropriate to ensure consistency.
The EV/EBITDA valuation multiples used and the comparison to respective peer spot average multiples are set out in the table below:
30 September 2020 31 March 2020 30 September 2019
Valuation multiple
usedPeer spot
average
Valuation multiple
usedPeer spot
average
Valuation multiple
usedPeer spot
average
Virgin Active 9.0x 15.0x 9.0x 10.8x 11.0x 14.2x
Premier 8.0x 9.5x 8.0x 8.8x 10.75x 10.8x
Iceland Foods Note 1 6.0x 6.7x 7.0x 7.3x
Note 1: Iceland Foods was realised on 8 June 2020 at an exit EV/EBITDA multiple of 6.6x and an 83% premium to the March 2020 carrying value
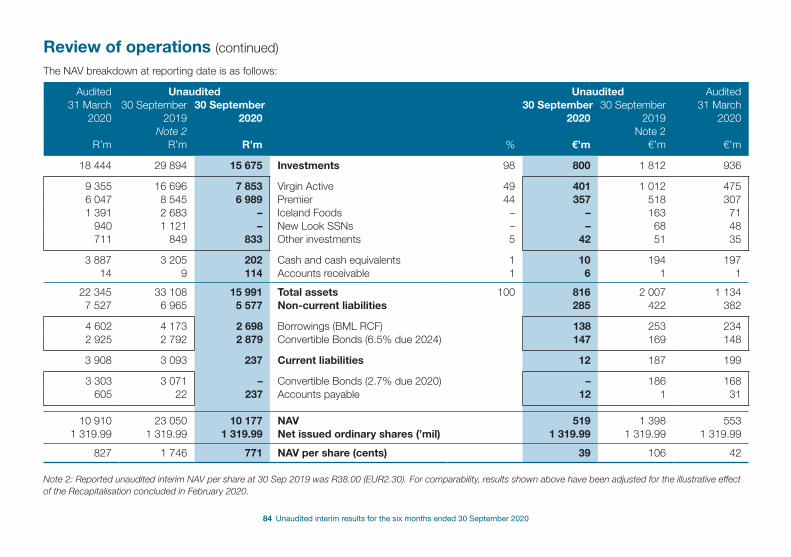
84 Unaudited interim results for the six months ended 30 September 2020
Review of operations (continued)
The NAV breakdown at reporting date is as follows:
Audited Unaudited Unaudited Audited31 March 30 September 30 September 30 September 30 September 31 March
2020 2019 2020 2020 2019 2020Note 2 Note 2
R’m R’m R’m % €’m €’m €’m
18 444 29 894 15 675 Investments 98 800 1 812 936
9 355 16 696 7 853 Virgin Active 49 401 1 012 4756 047 8 545 6 989 Premier 44 357 518 3071 391 2 683 – Iceland Foods – – 163 71
940 1 121 – New Look SSNs – – 68 48711 849 833 Other investments 5 42 51 35
3 887 3 205 202 Cash and cash equivalents 1 10 194 19714 9 114 Accounts receivable 1 6 1 1
22 345 33 108 15 991 Total assets 100 816 2 007 1 1347 527 6 965 5 577 Non-current liabilities 285 422 382
4 602 4 173 2 698 Borrowings (BML RCF) 138 253 2342 925 2 792 2 879 Convertible Bonds (6.5% due 2024) 147 169 148
3 908 3 093 237 Current liabilities 12 187 199
3 303 3 071 – Convertible Bonds (2.7% due 2020) – 186 168605 22 237 Accounts payable 12 1 31
10 910 23 050 10 177 NAV 519 1 398 5531 319.99 1 319.99 1 319.99 Net issued ordinary shares (’mil) 1 319.99 1 319.99 1 319.99
827 1 746 771 NAV per share (cents) 39 106 42
Note 2: Reported unaudited interim NAV per share at 30 Sep 2019 was R38.00 (EUR2.30). For comparability, results shown above have been adjusted for the illustrative effect of the Recapitalisation concluded in February 2020.
85 Unaudited interim results for the six months ended 30 September 2020
Review of operations (continued)
HIGHLIGHTS FOR THE GROUP’S INVESTMENT PORTFOLIOVirgin Active (49% of Brait’s total assets):• One of the leading international health club operators, Virgin Active’s results for the current reporting period have been significantly impacted by
the Coronavirus.
• Whilst group trading performance up to February 2020 was in line with budget and up from the prior year, in accordance with respective government directives to stop the spread of Coronavirus, health clubs in all territories were closed by 25 March 2020. During this closure period, Virgin Active implemented a “free membership freeze”, whereby memberships were retained without members having to make payment during the freeze period, resulting in no revenue generation for most territories. Since early February 2020, management took measures to preserve liquidity across all territories, removing all but essential capital expenditure investments and making operating expense reductions where possible, including measures to defer and/or reduce rental expenses. Broadly, including all mitigants in the form of government support programs and interventions by management, operating cost cash outflows for Virgin Active reduced by two thirds while clubs were closed during this period. Across the territories, management’s actions resulted in various improved operating efficiencies, particularly in reducing staff and rental costs.
• On 15 June 2020, shareholders contributed GBP20 million of new funding (Brait’s pro rata share being GBP16 million) by way of shareholder loans to enable the UK, Italy and Asia Pacific territories to navigate appropriately through the exceptional circumstances as a result of Coronavirus. In addition, Virgin Enterprises Limited agreed to defer and subordinate GBP5 million of royalties incurred during 2020 to beyond the maturity of Virgin Active’s UK, Italy and Asia Pacific banking facilities. This aggregate funding of GBP25m million was matched by a further GBP25 million of new bank debt from the UK, Italy and Asia Pacific banking syndicate, with the existing covenant package replaced by a liquidity-based covenant until December 2021.
• Developing and rolling out digital content globally has been a key part of Virgin Active’s strategy. This has been accelerated by the Coronavirus pandemic in order to enable Virgin Active to retain contact with its membership base and remain relevant.
• The health and safety of staff and members remain a key focus. Extensive cleaning and sanitisation procedures, as well as additional measures such as enforced social distancing through the reduction of class sizes and limiting attendance numbers, ensure that the clubs are a safe place for members and staff.
• Results in Pound Sterling for the nine months ended 30 September 2020, quoted using actual currency on a pre-IFRS16 basis:
o Group revenue of GBP224.7 million compared to the prior period of GBP450.8 million;
o Group EBITDA loss of GBP8.4 million compared to the prior comparative profit of GBP102.4 million;
• Pleasingly usage, levels gradually improved across all territories as member engagement increased pre the second European Coronavirus lockdown. On a group basis, total active members were down 33% since December 2019, due to terminations and members remaining on freeze.
86 Unaudited interim results for the six months ended 30 September 2020
Review of operations (continued)
• Territory update:
o Southern Africa: Clubs in South Africa re-opened on 24 August 2020, with Namibia and Botswana reopened in June 2020. Member engagement has seen usage increase from below 10% to above 57% as at October. A high percentage of members chose to remain on freeze, which is free until the end of October 2020.
o Italy: Re-opened in May 2020, with strong member engagement and usage levels exceeding 60%. Revolution (streaming of Virgin Active content to subscribing members) was successfully launched in September 2020, with more than 10,600 members already signed up. Italian clubs closed due to the second wave Coronavirus lockdown on 26 October until (at least) 24 November 2020.
o UK: Reopened later than expected, with 36 clubs opened on 26 July and 7 London clubs that have remained closed. Whilst member engagement and usage levels (62%) were pleasing, the region, especially in London, experienced higher than anticipated terminations and members on contract freeze, which has impacted yield and membership levels. The second Coronavirus wave has resulted in the closure of UK clubs from the beginning of November 2020 until the 2nd of December 2020.
o Asia Pacific: The region, with the exception of 3 clubs in Australia, reopened in June 2020. Australia benefitted from strong membership engagement and usage levels in excess of 80%, especially in suburban clubs. In Thailand, strong membership engagement resulted in low terminations / freeze. Despite a significant number of members on freeze, Singapore achieved high usage and membership engagement.
• Valuation as at 30 September 2020 (performed on a pre-IFRS16 basis):
o Maintainable EBITDA based on a look-through to a medium-term post Coronavirus sustainable level of GBP100 million (FY20: GBP108 million), which represents a 30% reduction from the GBP142 million actual EBITDA achieved for its financial year ended 31 December 2019.
o The valuation multiple has been maintained at 9.0x. The 39% increase in the peer average spot multiple to 15.0x (FY20: 10.8x), results in the level of discount increasing to 40% (FY20: 17%).
o Net debt of GBP358.5 million per the September 2020 management accounts (March 2020: GBP344.3 million) has been increased by GBP82.6 million (23% increase) to GBP441.1 million (FY20: GBP439.5 million). The adjustment applied takes consideration of the estimated effect of working capital and cost deferrals as a result of the impact of the Coronavirus.
o Brait’s participation in the carrying value of shareholder funding increased to 79.4% (FY20: 79.2%) as a result of the exercise of put agreements (GBP1.2 million) during the period with certain members of Virgin Active’s management team, with participation in equity value increasing to 72.1% (FY20: 71.9%).
o Brait’s resulting unrealised carrying value for its investment in Virgin Active at reporting date is R7,853 million, reflecting a 16% decrease for the six month period (FY20: R9,355 million), and comprising 49% of Brait’s total assets (FY20: 42%).
87 Unaudited interim results for the six months ended 30 September 2020
Review of operations (continued)
Premier (44% of Brait’s total assets)• A leading South African FMCG manufacturer, offering branded and private label solutions, Premier produced a pleasing performance during the six-
month period ended 30 September 2020. This was driven by a strong performance in its MillBake division relative to a weak comparable period and continued focus on operating cost containment, resulting in production costs (excluding cost of sales, Coronavirus related costs and provisions for incentives) increasing by only 4%.
• For the six months ended 30 September 2020, compared to 1HFY20 (quoted on a pre-IFRS16 basis):
o Revenue +14%
o EBITDA +21%
o EBITDA margin 9.7% (1HFY20: 9.1%)
• Premier’s national formal retail market shares, measured by AC Nielsen as at 30 September 2020:
o Bread: 20.8% (1HFY20: 20.9%)
o Maize: 16.8% (1HFY20: 15.5%)
o Sugar-based confectionary: 7.7% (1HFY20: 7.8%)
o SA feminine hygiene products: 15.8% (1HFY20: 18.3%)
• Divisional highlights for the six months ended 30 September 2020:
o Premier’s MillBake division (83% of group revenue) delivered a strong performance, resulting in revenue growth of 17% and EBITDA increasing by 26%. EBITDA margin, pre head office costs, was maintained at 12.8%:
– Bread: 13% revenue growth driven by strong performance during lockdown and the normalisation of operations at the Cape Town bakery following the prior year strike. Premier’s bakeries ran optimally with production costs benefitting from lower oven fuel prices.
– Wheat: Revenue increased by 23%, with strong volume growth and increased pricing due to an increase in input costs. Premier utilises between 50 – 60% of its wheat flour production internally.
– Maize: Revenue increased by 27%, benefitting from increased staple food sales volumes in retail and wholesale channels , with limited exposure to the hotels, restaurants and food services channels.
o Premier’s Groceries and International division (17% of group revenue) increased revenue by 2%, with EBITDA growth of 7% and EBITDA margin of 10.2%, pre head office costs (FY20: 10.5%):
– CIM: Premier’s Mozambican business (9% of group revenue) delivered a satisfactory performance under difficult Coronavirus induced trading conditions. Sales volumes remained in line with the comparative period, with revenue declining 3%. However, strong cost control and an increase in contribution margins delivered a 48% increase in local currency EBITDA (Rand EBITDA increased by 60%).
88 Unaudited interim results for the six months ended 30 September 2020
Review of operations (continued)
– Home and Personal Care (5% of group revenue): The pandemic-driven sales momentum slowed over the six months, with cost savings helping to mitigate the impact on EBITDA. Various initiatives are under way to stimulate volume growth.
– Confectionary and beverages (3% of group revenue): The new boiled candy line helped deliver 13% growth in revenue. Sales volumes in nutritional beverages have begun to return post the August lockdown, with seasonally higher summer month sales expected to benefit the remainder of the financial year.
• The challenging lockdown operating conditions resulted in additional costs of R76 million to maintain a safe work environment and support communities. Management continues to monitor the impact of the Coronavirus and are at the forefront of developing protocols to prevent and mitigate any impact to the business.
• Capital expenditure for the group of R213 million (FY20: R421 million) remains in line with guidance at 4% of revenue and includes expenditure on the inland bakery project.
• Premier demonstrated very strong cashflows during the six months with cashflow from operations of R570 million (1H20: R353 million) due to EBITDA growth and focused working capital management.
• Premier repaid Brait R123 million of shareholder loans during the current six month period (FY20: R231 million), increasing Brait’s share of realised proceeds received to date to R1,618 million. Premier’s leverage ratio for net debt owing to third parties is 1.9x (FY20: 2.2x).
• Valuation as at 30 September 2020 (performed on a pre-IFRS16 basis):
o Maintainable EBITDA of R1,110 million is based on Premier’s Last Twelve Months (“LTM”) EBITDA to 30 September 2020, reflecting a 10% increase on the R1,010 million achieved in Premier’s financial year ended 31 March 2020.
o The valuation multiple has been maintained at 8.0x. The increase in the peer average spot multiple to 9.5x (FY20: 8.8x), resulting in the level of discount increasing to 16% (FY20: 9%).
o Net debt of R1,829 million is based on Premier’s reported net third party debt of R2,140 million, adjusted largely for capex spent on new projects not yet generating EBITDA.
o Brait’s equity and shareholder funding participation remains unchanged at 98.5% and 100% respectively.
o Premier’s unrealised carrying value at the reporting date is R6,989 million, reflecting a 16% increase for the current six month reporting period (FY20: R6,047 million) and comprising 44% of Brait’s total assets (FY20: 27%).
New Look: • New Look is a UK based multichannel fashion brand, operating in the value segment of the clothing, footwear and accessories market. New Look’s
focus is delivering value for money and ‘newness’ with broad appeal ranges that cater for a broad spectrum of ages, from early teens to 45 and over, and is the number 2 UK womenswear retailer for ages 18 to 44 (Based on Kantar Worldpanel published data 12 weeks ended 20 Sept 2020; Womenswear by value). New Look also has as an online men’s range.
89 Unaudited interim results for the six months ended 30 September 2020
Review of operations (continued)
• New Look’s turnaround strategy to deliver financial and operational stability was yielding positive results prior to the UK government’s Coronavirus lockdown, which resulted in the closure of stores from 20 March 2020 to 1 June 2020. Stores reopened on a phased basis with all stores open by the start of September 2020. Given the omni-channel nature of the business, the impact of Coronavirus has been significant. During this lockdown period, management focused on cost optimization, maximising liquidity and progressing New Look’s online strategy. Online sales outperformed the prior period driven by increased conversion rates and units per transaction, underlining New Look’s strong brand, broad appeal product offering and improved availability. However, given the store closures, overall Q1 FY21 revenue was inevitably significantly lower than the prior year.
• For the stores that had reopened, up to 10 August 2020, store sales were down 38% on a like-for-like basis predominantly due to the impact of Coronavirus on footfall.
• On 13 August 2020, New Look announced a comprehensive recapitalisation transaction involving:
o A re-basing of UK leasehold obligations through a Company Voluntary Arrangement (“CVA”) resulting in a reduction in rental costs through a turnover-based model for a period of 3 years (thereafter reverting to the higher of the CVA rental or market rental), which fairly reflects the future performance of New Look and the wider retail market;
o A debt-for-equity conversion of the Senior Secured Notes (“SSNs”), reducing gross debt from GBP605 million to GBP165 million (including available operating facilities of GBP55 million) and significantly decreasing annual cash interest from GBP40 million to GBP6 million;
o An amendment and extension of the Operating Facility and RCF to June 2023 and June 2024, respectively; and
o An injection of GBP40 million of new capital, fully backstopped by certain holders of the SSNs, to support the three-year business plan.
• The CVA was voted on on 15 September 2020, with support from 81.6% of unsecured creditors. New Look is engaging with the four landlords challenging the CVA.
• On 16 October 2020, all holders of SSNs voted for their cancellation in exchange for a GBP40 million non-interest bearing shareholder loan and 20% of New Look’s share capital.
• On 9 November 2020, New Look announced the completion of its comprehensive recapitalisation transaction, which significantly reduces its long-term debt and operating costs, providing flexibility to execute on its strategy:
o Certain of the holders of SSNs injected GBP40 million of new money in the form of a payment-in-kind (“PIK”) facility, issued at a 5% discount, accruing PIK interest of 16.5% per annum. The new money providers received 80% of New Look’s share capital.
• Brait’s participation:
o As announced on 13 August 2020, Brait supported New Look’s recapitalisation transaction. Brait’s GBP7.3 million pro rata share of the GBP40 million new money injection, housed in accounts payable at reporting date, was paid on 9 November 2020. In aggregate Brait now holds 18.3% of the shareholder loans/PIK Facility and 18.3% of New Look’s equity (17.4% post dilution for management’s incentive plan)
90 Unaudited interim results for the six months ended 30 September 2020
Review of operations (continued)
• Valuation as at 30 September 2020:
o New Look’s SSNs were equitised on 9 November 2020, pursuant to the completion of the recapitalisation transaction. For the comparative periods, Brait’s 18.27% holding of SSNs were valued using closing quoted prices (30 September 2019: 0.772; 31 March 2020: 0.54915), together with accrued interest.
o Brait’s 18.3% holding of the shareholder loans/PIK Facility and 17.4% of New Look’s equity (valued post dilution for management’s incentive plan) have been valued at the reporting date using an earnings multiple basis, with the resulting carrying value included in the Other Investments portfolio.
Other Investments (5% of Brait’s total assets):• Brait realised its 91.3% shareholding in DGB for a total consideration equal to its March 2020 carrying value of R470 million. The first tranche of
proceeds of R370 million was received on 1 June 2020. The remaining R100 million, included in accounts receivable at the reporting date, is to be received in two deferred payments of R50 million each by 31 March 2021 and 31 March 2022 respectively.
• Following the equitization of New Look’s SSNs, Brait’s equity and shareholder loan investment in New Look, valued on a maintainable EBITDA multiple basis, is included in Other Investments at the reporting date.
• The remaining carrying value relates to Brait’s remaining private equity fund investments, mostly relating to Brait IV’s investment in Consol Glass, the largest manufacturer of glass packaging in Africa.
GROUP LIQUIDITY POSITION• Brait received R2,843 million investment proceeds from its portfolio during the current six- month reporting period
(FY20: R1,562 million), which included:
o R2,349 million realisation proceeds from the sale of Iceland Foods; R371 million from the other investments portfolio (initial tranche of realisation proceeds received from the sale of DGB) and R123 million shareholder funding repayments from Premier.
o The Iceland Foods and DGB proceeds received were applied to partially repay the BML RCF, with the Premier proceeds, mostly received at the end of September 2020, included in Brait’s closing cash balance.
• Repayment/redemption of 2020 Bonds
o The remaining GBP149 million outstanding principal amount on Brait’s five year, 2.75% per annum coupon, unsubordinated, unsecured convertible bonds listed on the Freiverkehr, due 18 September 2020 (“2020 Bonds”), was settled during the period under review using the cash in Pound Sterling converted from the proceeds of the February 2020 Rights Offer and specific issue of shares.
o Over the period 4 December 2019 to 24 July 2020, Brait repurchased GBP217.5 million of the 2020 Bonds for an aggregate amount of GBP214.5 million (average clean purchase price of c.GBP98,600 for each GBP100,000 principal 2020 Bond). The remaining GBP132.5 million principal amount of the 2020 Bonds were redeemed on their maturity date of 18 September 2020.
91 Unaudited interim results for the six months ended 30 September 2020
Review of operations (continued)
• R1,900 million available cash and facilities (FY20: R1,849 million)
o Brait repaid R2,719 million of its committed revolving credit facility (“BML RCF”) during the current six month period (FY20: R2,727 million repaid), resulting in the drawn amount outstanding at reporting date of R2,698 million (FY20: R4,602 million).
o In line with the BML RCF agreement, the reduction in utilisation resulted in the quantum of the facility decreasing from R6.3 billion to R4.4 billion, and the interest rate decreasing from JIBAR plus 4.6% to JIBAR plus 4.0%.
o Including the Group’s R202 million cash, this results in total cash and available facilities at reporting date of R1,900 million (FY20: total cash and available facilities of R5,595 million; R1,849 million excluding the cash held for the 2020 Bonds which were settled in September 2020).
• Compliance with debt covenants
Brait is in compliance with all covenants at reporting date:
o BML RCF covenants are NAV based and set with headroom for short term volatility.
o Per the terms of the 2024 Bonds, Brait’s ‘Tangible NAV/Net Debt’ ratio is required to be not less than 200%. The definition of ‘Net Debt’ per this covenant excludes the 2024 Bonds, with Tangible NAV referenced to Brait’s net asset value.
DIVIDEND POLICY Brait’s ability to return capital to Shareholders pursuant to its new strategy will depend upon its receiving realisations on loans and investments, dividends, other distributions or payments from its portfolio companies (which are under no obligation to pay dividends or make any other distributions to Brait). In addition, Brait’s ability to pay any dividends will depend upon distribution allowances under the terms of the BML RCF.
Ordinary dividends will be considered annually when the results for each year are published. The extent of any dividends will be determined relative to net operating cash flows and to the payments received on the realisation of loans and investments from time to time and which cash flows are not required for liquidity or earmarked for requirements at the portfolio company level, but always subject to distribution allowances permitted under the terms of the BML RCF.
To the extent that surplus cash becomes available at a future date for distribution, the Board will consider the potential for the distribution of such surplus cash by way of special dividend. Pursuant to the terms of the 2024 Bonds, before Brait is able to pay a special dividend to Shareholders, it will have to first make an offer to the holders of the 2024 Bonds to tender for repurchase an aggregate principal amount of the 2024 Bonds for an amount equal to such proposed special dividend at a price per Bond equal to its principal amount together with accrued interest.
ORDINARY SHARE CAPITALTotal issued ordinary share capital at 30 September 2020 is 1,319,992,804 shares of EUR0.22 each (FY20: 1,319,992,804 excluding treasury shares). Pursuant to the Shareholder approval obtained at the Extraordinary General Meeting held in Malta on 14 January 2020, the 54,091,259 treasury shares held for the vested benefit of the Group were cancelled during the current reporting period.
92 Unaudited interim results for the six months ended 30 September 2020
Review of operations (continued)
GROUP OUTLOOKBrait’s portfolio companies delivered a robust performance pre-Coronavirus, continuing to optimise their business models and key operational metrics in an ongoing challenging macro-environment. All of the portfolio company management teams have proactively implemented plans to address the unexpected and unprecedented impact of the Coronavirus, with a focus on health and safety of staff and customers, reducing costs, preserving cash and maximizing liquidity to manage their businesses though this difficult period. The extent and severity of the second Coronavirus wave and restrictions imposed by governments across Europe and the UK are uncertain and continue to evolve daily.
For and on behalf of the Board
RA NelsonNon-Executive Chairman
18 November 2020
Directors (all non-executive)
RA Nelson (Chairman)#, JM Grant#, Y Jekwa*, PG Joubert**, Dr LL Porter##, PJ Roelofse*, HRW Troskie^, Dr CH Wiese*
# British ## British, resident in Malta ^ Dutch * South African ** South African, resident in Mauritius
Brait’s primary listing is on the Euro MTF market of the Luxembourg Stock Exchange and its secondary listing is on the Johannesburg Stock Exchange.
SponsorRAND MERCHANT BANK (A division of FirstRand Bank Limited)

Administration and contact details
SUBSIDIARY OFFICEBrait Mauritius LimitedSuite 520, 5th Floor, Barkly WharfLe Caudan Waterfront, Port Louis MauritiusTel: +230 213 6909
ADVISOREthos Private Equity (Pty) Ltd35 Fricker Road, IllovoJohannesburg, 2196South AfricaTel: +27 11 328 7400
INVESTOR RELATIONSwww.brait.comEmail: [email protected]: +27 11 328 7400
LUXEMBOURG REGISTRAR AND TRANSFER AGENTMaitland Luxembourg SA58, rue Charles MartelL-2134 LuxembourgTel: +352 402 5051
SOUTH AFRICAN TRANSFER SECRETARIESComputershare Investor Services Pty LtdRosebank Towers, 15 Biermann AvenueRosebank, Johannesburg, 2196, South AfricaTel: +27 11 370 5000
JSE SPONSORRand Merchant Bank(A division of FirstRand Bank Limited)1 Merchant Place, Corner Fredman Drive and Rivonia Road, Sandton, 2196, South Africa
INDEPENDENT AUDITORSPricewaterhouseCoopers78 Mill Street, QormiQRM3101Malta
BRAIT SERegistration No: SE1
ISSUER NAME AND CODEIssuer long name – BRAIT SEIssuer code – BRAITShare code: BAT – ISIN: LU0011857645Bond code: • WKN: A2SBSU ISIN: XS2088760157LEI code: 549300VB8GBX4UO7WG59
COMPANY SECRETARY AND REGISTERED OFFICEAnjelica Camilleri de Marco4th Floor, Avantech BuildingSt. Julian’s Road, San Gwann,SGN 2805, MaltaTel: +356 2248 6203
COUNSELHarney Westwood & Riegels S.à r.l56, rue Charles MartelL-2134 LuxembourgTel: +352 2786 7102