Embed Size (px)
Citation preview

The Impact of Macroeconomic Surprises on Mergers & Acquisitions for Real Estate Investment Trusts
John Battinelli John Reid
Dr. Connel Fullenkamp, Faculty Advisor Dr. Kent Kimbrough, Fall Honors Seminar Advisor
Dr. Marjorie McElroy, Spring Honors Seminar Advisor
Honors Thesis submitted in partial fulfillment of the requirements for Graduation with Distinction in Economics in Trinity College of Duke University
Duke University
Durham, North Carolina 2013

2
Acknowledgements
We would like to first thank our advisor, Professor Connel Fullenkamp, for his guidance
throughout this process. His insight and experience proved to be invaluable by helping focus our
research and conduct in depth analysis of our data. We would also like to thank Professor Kent
Kimbrough, Professor Marjorie McElroy, and our peers in our honors seminar classes for
helping us construct and refine our topic. Finally, we would like to thank Mr. John Caccavale for
taking the time to help us during the initial stages of developing our research question and
Sophia Li for helping us with the econometrics and analysis of our study.

3
Abstract
This paper examines the impact of various macroeconomic and real estate specific surprises on M&A transactions involving Real Estate Investment Trusts. The 2008 financial crisis drastically affected merger & acquisition activity, especially within the real estate market. The number of M&A transactions involving Real Estate Investment Trusts was very volatile during this period of economic turmoil and it appeared that several economic factors contributed to changing patterns in M&A activity. Our study uses time series data to draw a connection between REIT-related M&A activity and quantifiable factors. From our results we find there to be a relationship between the macroeconomic environment and REIT-related M&A activity. ______________________________________________________________________________ JEL Classifications: G10; G14; G34 Keywords: Real Estate Investment Trust; Mergers & Acquisitions; Macroeconomic Surprises

4
Table of Contents
I. Introduction II. Literature Review III. Theoretical Framework IV. Empirical Specification V. Data VI. Results VII. Conclusion

5
I. Introduction
Corporate finance points out that there is a complex connection between various elements
of the economic environment and corporate decision-making. This study explores the unique
interconnectedness of relevant economic and financial conditions with mergers and acquisitions
(“M&A”) specifically for deals involving a real estate investment trust (“REIT”). Previous
literature in this field fails to properly address this idea and tends to focus more on shareholder
wealth surrounding the announcement of an M&A transaction, rather than the economic
environment that may have induced or predicated that transaction. Therein lies our research
question: What is the impact of macroeconomic surprises and real estate specific surprises on
REIT-related M&A activity in terms of quantity of transactions? This is an empirical study that
uses time-series data to draw a causal link between the volume of REIT-related M&A activity to
quantifiable factors of the macro economy and real estate market.
The 2008 Subprime Mortgage Crisis plagues the minds of all investors from the smallest
household to the largest institutional investors and money managers. The pervasive and global
impact of the housing, and subsequent, financial crisis that started in the United States and
spread throughout the world has had drastic effects on the economy, corporations, and
individuals. As represented by Graph 1, we saw Total Net Worth of Households and Charity
Organizations drop from an all-time high (at the time) of roughly $67.413 trillion in 2007Q3 to
$51.408 trillion in 2009Q1, a drop of over 20% in a little over a year (FRED). American
households struggled to make mortgage payments and subsequently, millions were forced into
foreclosure and banks repossessed their homes. This weighed in heavily on the balance sheets of
hundreds of banks and mortgage lenders that went bankrupt. Those financial institutions that
survived had to accept a massive government bailout to strengthen their balance sheet and avoid

6
bankruptcy. Credit markets froze, households stopped spending, stock markets crashed erasing
trillions of dollars of wealth and real GDP in the United States dropped from $13.326 trillion in
2007Q4 to $12.701 trillion in 2009Q2 (FRED). Theses figures give you a general understanding
of the depth of the crisis and the overwhelming shocks to the financial industry and economy that
the U.S. experienced in 2008-2009.
Graph 1. Total Net Worth: Households and Nonprofit Organizations (FRED)
“In the current macroeconomic environment characterized by a high degree of
uncertainty, modest growth, and low interest rates, investors are finding Real Estate Investment
Trusts attractive because of the trusts’ relatively high dividend yields, relatively stable and
predictable lease-based cash flows, and access to capital at favorable terms” (Seeking Alpha,
2012). Refer to Graph 2 and Graph 3. Investors who purchase shares of a REIT earn dividends,
derived from rental income and capital gains from sales of properties (real estate appreciation),
and capital gains from stock appreciation once sold. REITs operate similarly to mutual funds in
that they allow investors to pool their money together to invest in large-scale, income producing

7
real estate assets through the purchase and sale of liquid securities. Commercial real estate, the
underlying asset in a REIT, is a highly unique asset class that attracts long-term investors
because of relatively stable, predictable future cash flows and large potential upside with a
limited downside (limited to value of initial investment). Commercial real estate is a property
that is used solely for business purposes, including, but not limited to, office, residential/multi-
family, retail, hotels, industrial and medical sectors. Although each sector must take different
aspects of the real estate market into consideration, in a broad sense, they operate in a similar
fashion. Some investors also view real estate as an inflation hedge because the value of a
building will appreciate as inflation rises. REITs offer investors superior liquidity and a well-
diversified portfolio of real estate properties without the financial risks associated with real estate
acquisitions.
Graph 2. REIT Dividend Yields (Seeking Alpha)

8
Graph 3. REIT Total Returns (Seeking Alpha)
REITs were formed in 1960 after Congress passed The Real Estate Investment Trust Act
of 1960, in which a new tax code exempted REITs from corporate tax in the same manner as
regulated investment companies if they followed certain regulations. The primary regulations to
qualify as a REIT, a type of pass-through corporation, under U.S. tax rules are that they must pay
dividends of at least 90% of taxable income, have at least 75% of total assets invested in real
estate and cannot have more than 50% of its shares held by 5 or fewer individuals. This is of
particular importance to REITs because the federal government only taxes undistributed income,
while the distributed earnings of the company are taxed to the shareholders as ordinary income.
Therefore, because of the regulation mandating that having at least 90% of REIT earnings must
be distributed as dividends, REITs only pay corporate taxes on a fraction of their earnings.
Before this law was passed, investing in real estate assets was limited to very wealthy individuals
and institutions. This legislation made income-producing real estate available to the small-scale
investor through the purchase of equity as with any other security.
9
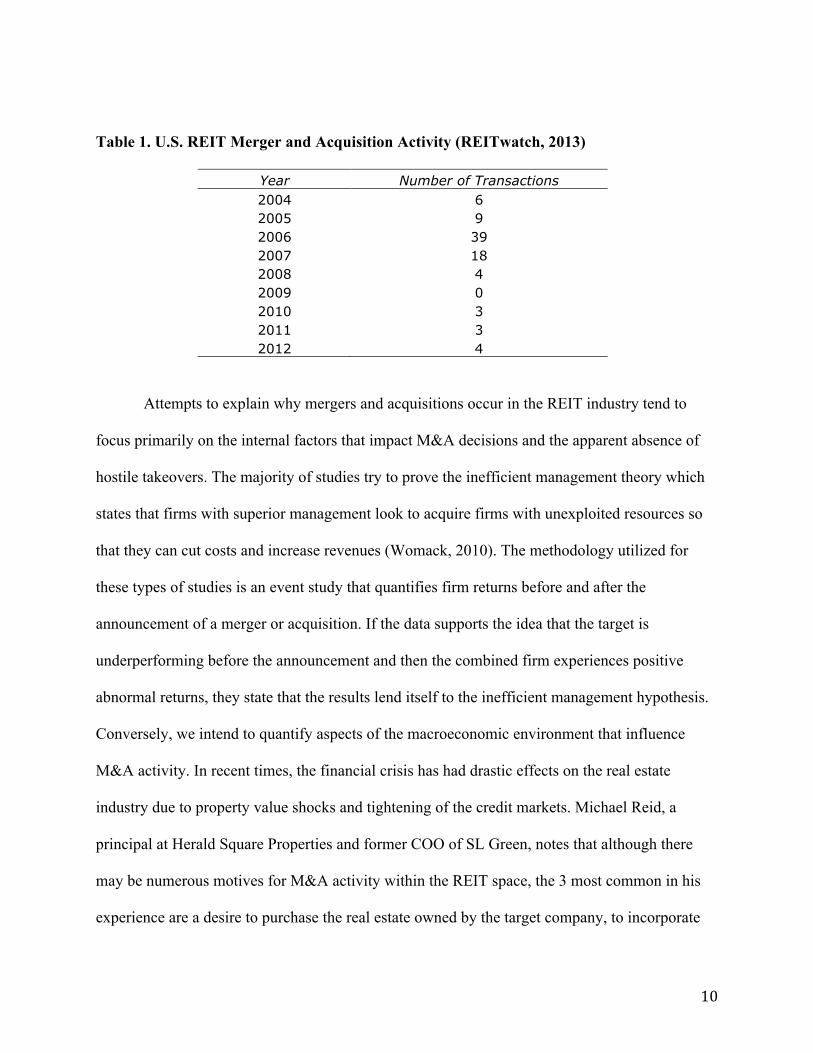
The objective of this study is to take a closer look at mergers and acquisitions that occur
within the REIT space. As explained earlier, the real estate industry is particularly interesting
because of the uniqueness of real estate assets and the role they take within the market. Beyond
just real estate assets, REITs are valuable pass-through corporations that give investors access to
income producing real estate that wasn’t possible for the average investor before. The motivation
for this study is drawn from the differences in the observed number of transactions surrounding
the financial crisis in 2008, i.e. 39 transactions occurred in 2006 compared to 0 in 2009 for
REITs included in the NAREIT Index1 (REITWatch, 2013). This difference is illustrated in
Table 1 along with A.1 and A.2 in the Appendix. This list of transactions is included for
illustrative purposes to demonstrate the casual observation that there are a high number of
transactions in some years whereas there are none in others. The focus will be on the
macroeconomic factors and general economic conditions that affect the number of transactions
that occur in any given quarter and determining what has the largest impact on REIT M&A.
While this data only includes publicly traded U.S. REITs, this example is intended to be a
microcosm that illustrates the potential impact that the macro-economy and real estate market
can have on M&A transactions over time.
______________________________________________________________________________
1NAREIT: National Association of Real Estate Investment Trusts. Data includes 172 publicly traded U.S. REITS
10
Table 1. U.S. REIT Merger and Acquisition Activity (REITwatch, 2013)
Year Number of Transactions 2004 6 2005 9 2006 39 2007 18 2008 4 2009 0 2010 3 2011 3 2012 4
Attempts to explain why mergers and acquisitions occur in the REIT industry tend to
focus primarily on the internal factors that impact M&A decisions and the apparent absence of
hostile takeovers. The majority of studies try to prove the inefficient management theory which
states that firms with superior management look to acquire firms with unexploited resources so
that they can cut costs and increase revenues (Womack, 2010). The methodology utilized for
these types of studies is an event study that quantifies firm returns before and after the
announcement of a merger or acquisition. If the data supports the idea that the target is
underperforming before the announcement and then the combined firm experiences positive
abnormal returns, they state that the results lend itself to the inefficient management hypothesis.
Conversely, we intend to quantify aspects of the macroeconomic environment that influence
M&A activity. In recent times, the financial crisis has had drastic effects on the real estate
industry due to property value shocks and tightening of the credit markets. Michael Reid, a
principal at Herald Square Properties and former COO of SL Green, notes that although there
may be numerous motives for M&A activity within the REIT space, the 3 most common in his
experience are a desire to purchase the real estate owned by the target company, to incorporate
11
and utilize the target firm’s operating platform and management team, and ultimately to increase
earnings2. Many of these decisions are made in consideration with the state of the macro
economy along with the real estate market and quantifying how these factors can affect number
of transactions lies at the core of our study.
There remains a gap in the literature that fails to address what market factors in the
economy affect M&A activity involving REITs. We intend to focus solely on macroeconomic
and industry specific factors that influence the number of M&A transactions. There are many
factors to consider when looking at which economic indicators impact the market for M&A
activity and identifying the factors most pertinent to the real estate sector. This study focuses on
surprises in real GDP growth, inflation, consumer sentiment, mortgage rates, fed funds rate and
REIT returns while also including Policy Dummies for 1986 and 1994. An explanation as to why
we choose these variables is outlined in the Empirical Specification section. Throughout history,
the macroeconomic environment has influenced corporate decisions and there tends to be a direct
correlation with the business cycle (Becketti, 1986). Since REIT M&A can only be tracked back
to 1960, we must be careful to differentiate between causation and correlation, and how this
might limit the robustness of our results.
Furthermore, as mentioned above, literature in the REIT M&A space focuses on
supporting the inefficient management hypothesis by utilizing an empirical methodology that
quantifies the underperformance of target returns prior to the announcement and then showing
positive combined firm performance post announcement. If this were in fact the case for the next
wave of M&A activity, we would witness a large amount of M&A deal flow in the post financial
_____________________________________________________________________________
2Herald Square Properties is a fully integrated investment & operating company focused on the Midtown Manhattan Office Market. SL Green Realty Corp is a NYSE listed REIT
12
crisis period. This makes sense intuitively because in the post financial crisis period, when
property shocks and a rise in delinquencies plagued REIT returns, REIT underperformance
would be/is quite prevalent and thus points toward a higher frequency of REIT M&A. However,
this is not the case in the post-crisis era as only 10 transactions occurred between 2008-2011
(REITwatch, 2013). This activity is shown in the appendix. With this in mind, we hone in on the
primary question that we intend to address: How have various macroeconomic factors along with
real estate specific factors influenced the volume of M&A transactions observed in the REIT
industry? With macro-economic conditions changing drastically during the financial crisis, we
are predicting that the large fluctuation in M&A activity can be in part attributed to these
changing conditions. The goal of our study is to determine which conditions play the largest
role. We examine a 30-year timeframe so as to not limit our study to solely the economic crisis
of 2008, but to also incorporate other economic shocks over the last 30 years.
The structure of the paper is outlined as followed: Section II provides a detailed overview
of the previous literature within REIT M&A; Section III describes the theoretical framework
used; Section IV discusses the empirical specification; Section V presents the relevant data used
to study the factors that influence M&A activity; Section VI details the regression results; and
Section VII is the conclusion.
II. Literature Review
The purpose of the literature review is to discuss previous research conducted and to place our
study within the relevant literature on our topic. We focus on two areas of importance: first,

13
starting with REITs in general and moving towards REIT M&A specifically; second,
macroeconomic impact on general M&A.
II.1 REIT M&A
In economic and finance literature, the motivation for merger and acquisition transactions
has been heavily studied and different theories have evolved. The goal of a majority of research
in the REIT M&A space has dealt with M&A motives by quantifying firm returns with an event
study framework. Campbell et al. (2009) examined a sample of 114 REIT merger
announcements from 1994-2001 where the sample included mergers in which the acquiror was a
publicly traded Equity REIT and the target was either public or private. They measured abnormal
shareholder returns over 1, 3, and 5-year periods. The results from the study were that the 60-
month BHAR for the combined portfolio of merging firms was -9.9% and is statistically
significant (Campbell, Giambona, and Sirmans, 2009).
In the framework of their study, Campbell et al. (2009) found it difficult to prepare an
accurate study that mitigated the affects of outside factors as they solely wanted to compare
returns based on merging firms and non-merging ones. Since this was an industry study, it does
not use a broader market index and is free from modeling problems that can accrue when the
sample firms are affected in an asymmetric manner by various pricing factors. Additionally, only
reference firms in the same industry as event firms were matched together to eliminate bias of
potential inaccuracies that could have arisen from comparing across industries. Our framework
includes deals across the various real estate industries, or property types. The issues with
comparing across industries that were presented indicated that it is important to consider deal

14
trends not only on an aggregate scale but also to potentially separate by property type through the
implementation of dummy variables.
In an effort to perform a more in depth analysis of real estate mergers and shareholder
performance following the announcement of the merger, Womack (2010) established new
evidence to distinguish why mergers occur in the real estate industry by quantifying the
combined firm return for nearly three decades of real estate mergers. Womack (2010) postulated
that the three dominant M&A theories are the empire-building hypothesis, the over-valued
information signal hypothesis, and the inefficient management hypothesis. Within the REIT
M&A space, a majority of the studies focused on the inefficient management hypothesis as the
motive for M&A transactions and use the almost complete absence of hostile takeovers as the
motivation for the study (Womack, 2010). “Findings from this study [were] consistent with the
notion that real estate mergers occur because firms with superior management acquire other
firms that possess unexploited opportunities to cut costs and increase earnings, the inefficient
management hypothesis” (Womack, 2010). By utilizing four different models, market model,
raw, net of market, and bid-ask average, and seven different event windows, Womack (2010)
concluded the data supported the inefficient management hypothesis and highlighted that real
estate mergers are generally wealth creating events in that shareholders at least break even but
can also experience modest gains. The results were consistent with the inefficient management
hypothesis in that superior management was able to realize greater abnormal returns, i.e. cut
costs and increased revenues. The validity and effect of this theory on reasons driving M&A
activity will be brought into question as the effects of macro and market factors are weighed in
our analysis.

15
Eichholtz and Kok (2008) examined the presence of the inefficient management
hypothesis during a recent takeover wave (1999-2004) using the complete global universe of
listed property companies. The methodology used to study this hypothesis first looked at the
relative underperformance of REIT targets prior to the announcement and then measured the
target returns post merger announcement to confirm the inefficient management hypothesis.
Their results were consistent with the inefficient management hypothesis and cited long-term
underperformance as the driver for M&A activity for REITs (Eichholtz and Kok, 2007).
Ratcliffe and Dimovski (2012) took a different approach to studying M&A in the market
of REITs by conducting a meta-analysis of 15 REIT studies to draw conclusions on the factors
influencing the returns by targets and bidders. Consistent with other industry studies, targets
enjoyed the majority of the gains in a merger. This study shed light on the conclusion in Andrade
et al. (2001) that “there are two main catalysts for M&A activity, mergers occur in waves and
second, within each wave, there is a strong clustering by industry” (Ratcliffe and Dimovski,
2012). This has strong implications on the focus of our study in that the global financial crisis
could be considered an industrial shock that causes the next wave of REIT M&A due to the
impact it had on property values and mortgage markets. Looking at structural changes in the
overall economy and within the real estate industry, potential market factors could facilitate
REIT M&A.
II.2 Macroeconomic influences on M&A
As it pertains to our study, a different set of literature has focused on macro factors that
influenced M&A activity but these studies focused on general M&A, not industry specific, and
few concentrated their study within the United States. H. Richard Nakamura (2002) focused on
16
selected macroeconomic factors and financial variables, and their influence on the pattern of
M&A observed in Japan. Nakamura (2002) concluded that he cannot not confidently say that
macro factors explain the pattern of M&A in Japan due to the relatively short time period
studied. However, he noted that there seems to be a correlation between economic business
cycles and waves of M&A. Nakamura’s study built off the work previously done by Ali-Yrkko
(2002), which focused on the history of Finnish M&A. Although Ali-Yrkko did not define the
effects as causal, he takes a three-step approach to addressing why M&A occurs. Based on his
results, Ali-Yrkko suggested that M&A decisions can be seen from a top down flow, where
macro level factors caused shocks on the industrial level, to which managers on a micro level
reacted and made decisions whether or not to engage in M&A activity (Nakamura, 2002).
Additionally, some studies focused on foreign direct investment by looking at the growth
in international production via cross-border mergers and acquisitions and the role of
macroeconomic influences on that activity. Li et al. (2003) studied the firm specific
characteristics that affect market timing in China and emphasized the importance of controlling
for environmental and situational factors. In the context of our study, this implies that
macroeconomic fluctuations impacted acquisition decisions, and acquisition timing in particular.
Building off the conclusions of Li et al., Uddin et al. (2011) looked at the macroeconomic
influence on cross-border M&A in the U.K.. Uddin and Boateng followed a similar methodology
to that of which this study is proposing by regressing the number of deals flowing into and out of
the U.K. against real GDP, interest rate, exchange rate, money supply, share price index, and
inflation. Uddin et al. found that GDP, exchange rate, interest rate and share prices had a
significant impact on the level of outward UK cross-border M&A, and GDP, money supply, and
17
share price had a statistically significant impact on the level of U.K. cross-border M&A inflows
(Uddin and Boateng, 2011).
Shifting focusing onto the U.S., Mitchell and Mulherin (1996) extensively studied the
issue of merger waves and their causes by looking at 51 industries during the 1980s. They
assumed that the structure of any industry, “including the number and size of firms, is a function
of a number of factors such as technology, government policies, and supply and demand
conditions.” Any major changes, or shocks, to these factors would cause a shift in that industry
that would incite a merger wave. Mitchell and Mulherin postulated that when a firm looked to
expand as a result of a shock, they tended to do so externally through takeovers, the least-cost
method.
Harford (2005) used the transaction value for all mergers from 1981 to 2004 from the
Securities Data Corporation (SDC) to measure merger activity. He suggested that mergers are
procyclical because firms were less financially constrained during economic peaks and thus had
more (or possibly cheaper) sources of capital. This would imply that we would see more activity
during peaks of the business cycle than during troughs. Dittmar and Dittmar (2008), used a
similar method and found that GDP growth is significant and positively correlated with mergers.
Finding that economic growth (GDP) represents positive stimulus for excess cash flows and thus
merger activity.
Furthermore, Harford (2005) built on the work of Mitchell and Mulherin (1996) by
modifying the neoclassical theory to include a necessary condition of capital liquidity to
accompany these industry shocks. He postulated and confirmed through his empirical study that
industrial shocks, whether they be technological, economics or regulatory, caused merger and
acquisition activity to cluster in time within an industry. However, not all shocks propagated

18
merger waves, a sufficient level of capital liquidity must be present to initiate an industry merger
wave.
Chan, Hendershott and Sanders (1990) demonstrated, using a multi-factor model, that the
excess returns to REITs observed using a simple CAPM framework evaporated when this
multifactor approach is utilized. They identified three key factors that drove both the equity
market and REIT returns: changes in risk term structures and unexpected inflation. Over macro
factors such as forward industrial production and expected inflation have a lesser impact or
switch between a positive and negative influence. They also found that impacts of macro factors
on real estate returns were consistently lower than impacts on general stock returns.
For the purpose of this study, we intend to focus more on the external factors that
influence M&A activity for the real estate industry. After a thorough analysis of previous
literature, we determined that testing motive hypotheses for M&A activity within the REIT space
by looking at firm specific factors and quantifying the target, bidder or combined returns limits
the robustness of our results. By focusing on the market factors, we can more confidently state
what drives M&A transactions. Given the 2008 & 2009 shocks in property values and mortgage
markets, we will investigate mergers occurring for reasons potentially unique relative to other
waves of M&A activity. Our goal is to apply some of the techniques and methodology from the
macro literature to study how the macroeconomic environment affects purely the aggregate
quantity of REIT-related M&A in the United States. REITs have become prominent players in
the acquisition of commercial real estate and we believe that REITs act as a good proxy to
represent the real estate sector as a whole. The importance of our study lies in the fact that
studies on the macro effect on M&A have never focused on the REIT industry nor used such an
extensive list of potential factors.

19
III. Theoretical Framework
III.1 Merger Wave Theory
Merger waves occur within industries and in the aggregate when multiple industries are
experiencing merger waves. Numerous studies have shown that there is no consensus on the
cause of these merger waves, but there are two leading theories: neoclassical, and behavioral &
agency. We are applying this theory uniquely as it is the first application for REITs (Harford,
2005).
III.2 Neoclassical Theories
Mergers occur mainly as a result of external shocks, either in the form of economic,
technological, financial, regulatory, or political shocks (Harford, 1999, 2005) and are made to
sustain or create competitive advantages (Jensen, 1988). Mergers are primarily motivated by
such shocks and are expected to lead to profit optimization and shareholder value creation;
assuming managers are aligned with shareholders’ interests (Martynova and Renneboog, 2008).
Under these assumptions, combined firms should be able to operate more efficiently than the
individual standalone entities through the realization of synergies (Anderson, Medla, Rottke and
Schiereck, 2012).
Any shocks to the structure of an industry would cause a shift in that industry that would
incite a merger wave. When a firm looks to expand as a result of a shock, they tend to do so
externally through takeovers, the least-cost method.
III.3 Behavioral and Agency Theories
The foundation of this set of theories lies within the classic motives of incentives, agency
costs, or information signaling (Womack, 2012).

20
• Empire building: managers have incentives to expand the corporation beyond its optimal
size, which increases the manager’s power through resource acquisition. It is also
associated with increases in manager’s compensation” (Jensen, 1986). Therefore, by
increasing the size of the firm, managers are increasing their own compensation. This
would then imply that managers are inclined by selfish, value-destroying motives, not
market conditions.
• Over-valued information signal: The fundamental assumption is that “financial markets
are inefficient, so some firms are valued incorrectly. In contrast, managers are
completely rational, understand stock market inefficiencies, and take advantage of them,
in part through merger decisions. Mergers in this model are a form of arbitrage by
rational managers operating in inefficient markets.” (Womack, 2012, pg. 449)
• Inefficient management: Firms with unexploited financial opportunities are natural
candidates for acquisition by other firms with better management, which in turn aims to
improve the target’s management and performance. Furthermore, greater
macroeconomic conditions would impact the frequency of mergers occurring when a
firm was previously underperforming and therefore, is more likely to be acquired by
superior management. This is conditional on managers operating in a fashion consistent
with the inefficient management hypothesis (Womack, 2012, pg. 450).
III.4 Arbitrage Pricing Theory
The expected return of an asset can be modeled as a linear function of various macro-economic
factors or theoretical market indices. Within this model, sensitivity to changes in various factors
is represented by a factor-specific beta coefficient. Based on the idea that an asset’s returns can
be predicted using the relationship between that same asset and many common risk factors. The

21
primary assumptions of APT are that a factor model can describe security returns, there are
sufficient securities to diversify away idiosyncratic risk, and well-functioning security markets
do no allow for the persistence of arbitrage opportunities (Geweke and Zhou, 1996).
IV. Empirical Specification
Our study focuses on two macro-regressions that include a comprehensive list of
variables with accompanying data as summarized in Table 2. Later in this section, we address
why we are choosing to include the variables in this list and also the reasoning behind variables
we do not plan to include.
Table 2. Variables
Variable Category Source Notes
Real GDP Growth (%) Macro-economy, Surprise FRED Seasonally Adjusted Annual Rate
Inflation Rate (%) Macro-economy, Surprise FRED Seas. Adj., % change of CPI for All Urban Cons.
U. Of Michigan: Consumer Sentiment (Index) Macro-economy, Surprise FRED Not Seasonally Adjusted
Federal Funds Effective Rate (%) Macro-economy, Surprise FRED
30-Year Conventional Mortgage Rate (%) Real Estate specific, Surprise FRED Not Seasonally Adjusted
FTSE NAREIT U.S. R.E Index Series Returns (%) Real Estate specific, Surprise NAREIT
Tax Reform Act (1986) Policy Dummy Regulatory/policy -
"Look-Through" Provision (1994) Policy Dummy Regulatory/policy -
Number of Transactions (acquiror as REIT) Dependent SDC
Number of Transactions (target as REIT) Dependent SDC
*FRED: Federal Reserve Bank of St. Louis, Economic Data
We focus on “surprises” in levels of variables as opposed to general levels. A surprise is
essentially a predicted value minus the observed historical value for the data points. The
methodology for obtaining predicted values for the regressors is outlined later in this section.
Rather than studying trends in levels of these variables, we find that our results are more robust
by focusing on surprises. A surprise can technically be either positive or negative and we
believe that this opens up a whole new way to view what drives M&A activity. For example,
22
one may think that activity will spike in strong economic times as good capital markets
conditions allow for attainable financing for transactions as firms aim to expand their portfolios.
On the contrary, in weak economic times, some firms may face a cash flow problem and may
want to consolidate with other firms to gain higher liquidity and a generally healthier financial
situation. Furthermore, by viewing the results of both positive and negative surprises, we are
able to see the effects of how unexpected changes in levels (both negative and positive) of
variables affect transaction activity for the two types of regressions.
Within the economic environment, we use the University of Michigan consumer
sentiment index to represent current consumer sentiment about the state of the economy.
Initially, we intended to incorporate future market sentiment as measured by the VIX Index,
along with CDS spreads to encompass different aspects of debt markets, however this data is not
available for the duration of the timeframe for M&A transactions and was unable to be
incorporated.
For industry specific variables, the two included are the 30-year conventional mortgage
rate along with a REIT return index. The 30-year conventional mortgage rate encompasses
contract interest rates on fixed-rate mortgages for commercial and residential real estate. The
REIT return index includes only public REITs, but it will serve as a sufficient proxy for general
REIT returns. Within the industry specific variables, we initially looked at total construction
spending, delinquency on commercial real estate loans/leases, and a commercial real estate price
index, however these are not being included due to restrictions in gathering the data for a long
enough time frame. While several variables were unable to be included due to data restrictions,
each of the variables we did include serve to represent an aspect of the macro-economy or real
estate market that could affect M&A activity. We include the federal funds rate as a proxy for

23
changes in monetary policy by the Federal Reserve. Historically, the Federal Reserve has
lowered the federal funds rate during recessions and slower economic times. Theoretically, a
lower rate will stimulate the economy by making money cheaper and easing credit markets. Real
estate owners are affected by the federal funds rate as the rate at which banks can lend each other
money will affect the rate that banks loan individuals money. Finally, we include two controls
for significant changes in regulations and policies within the real estate industry that we believe
will affect activity.
To explain the process of selecting and constructing the dummy variable controls for
regulation and policy changes, we have investigated a number of significant changes that have
occurred within our timeline and they potentially impact our study. We include dummy variables
for the policy actions enacted in 1986 and 1994 that will represent the aggregate of the more
recent policy changes because they all deal with ways REITs can improve income generation and
maintain their status as a REIT. These policies are summarized below:
Regulation & Policy Changes
The Tax Reform Act of 1986 (1986)
• Includes REIT simplification changes to take effect, including one that for the first time
allows REITs to be internally advised and managed.
• Reduced potential for real estate investment to generate tax shelter opportunities
o Limited deductibility of interest, lengthened depreciation period, and restricted
use of “passive losses” essentially meant that real estate investment needed to be
more income-oriented.
Five or Fewer “look-through” provision (1994)

24
• Provision that makes it easier for pension plans to invest in REITs. Mutual funds and
pension funds were no longer considered to be a single investor but rather a collection of
each individual investor that comprises that fund.
These policy changes are included because they all deal with ways REITs can improve income
generation and maintain their status as a REIT. Accounting for the policy changes in 1986 and
1994 would be, essentially, a control for merger waves. In recent literature, there has been some
focus on the apparent clustering of industries during waves of M&A activity. If these variables
are deemed to be statistically significant, we could confirm the results of previous studies while
also increasing the potential significance of our macroeconomic choice variables.
We would also like to point out that we considered using a third dummy variable to
encompass the REIT Simplification Act of 1997 along with the REIT Modernization Act of
1999. These two policy changes involve ways to improve income generation without
jeopardizing their status as a REIT. We ultimately decided to not include this final dummy
variable as these policy changes occurred shortly after the 1994 policies that we account for and
we don’t want to limit the robustness of our results by including too many variables.
We run two separate regressions that utilize two different data sets so as to see the
similarities and differences of the chosen variables on M&A transactions when the acquiring
firm is a REIT and on the contrary, when the target firm is a REIT. Given that these two
different types of transactions may differ in nature and motive for the acquiring and target firms,
we believe we can reach more meaningful conclusions by splitting up the regressions.
Furthermore, REITs and other types of firms may have different financial structures that are
affected by the state of the economy, as represented by the variables we use, and may act

25
differently as an acquiror or target depending on their financial health. The two regression along
with the variables are outlined below:
1. Uses data set where the acquiror is a REIT and the target can be any type of firm
2. Uses the data set where the target is a REIT and the acquiror can be any type of firm
• Dependent variable: number of transactions
• Independent variables: Real GDP growth (surprise), Inflation rate (surprise), University
of Michigan Consumer Sentiment Index (surprise), 30-year Conventional Mortgage Rate
(surprise), Federal Funds Effective Rate (surprise), REIT Return Index (surprise), and
regulatory/policy dummies (1986 & 1994)
Model
We run an Ordinary Least Squares regression for the model outlined below. Data for the
consumer sentiment index is only available up through 2012Q2 so we have chosen to end the
timeframe there. Additionally, with the 1 period ahead forecasts, we use 1983Q1 as the first
predictor and therefore our effective timeframe is 1983Q2 – 2012Q2.
V (# OF TRANSACTIONS) = X (MACRO-ECONOMY SURPRISES) + Y (REAL ESTATE SPECIFIC SURPRISES) + Z (REGULATORY/POLICY)
• X: Real GDP growth, inflation rate, consumer sentiment index, fed funds rate • Y: 30-year mortgage rate, REIT return index • Z: 1986 policy dummy, 1994 policy dummy
Vt = β0 + β1GDPSURPRISE t + β2INFLATIONSURPRISE t + β3SENTIMENTSURPRISE t +
β4FEDFUNDSSURPRISE t + β4MORTGAGESURPRISE t + β5REITRETURNSURPRISE t + β6DUMMY1986 t + β7DUMMY1994 t + εt
To measure surprises for certain variables, we utilize an Autoregressive Integrated
Moving Average (ARIMA) model, which is a generalized version of an Auto Regressive Moving
Average Model (ARMA). Since we do not integrate several time series, which is common in an

26
ARIMA model, we simply specify that we only use one time series. We fit this model to time
series data for real GDP growth, inflation, consumer sentiment, fed funds rate, 30-year mortgage
rate, and REIT return index, to forecast future points in the series. We use a 1-quarter lag period
as predictions generally become more inaccurate with further lag periods. Additionally, we use
two auto-regressive terms as is common in ARIMA models of similar nature. The basic equation
for the one-step ahead forecast is as follows: Yτ+1 = Xτβ, where one of the columns of X is Yτ.
Furthermore, the timing of a surprise is as follows: Surprise in t = (Predicted value as of t-1) –
(Observed value in t) where the predicted values are determined from the ARIMA model
specified above. From here, we take the difference of the predicted points and the observed
historical data to measure surprises. With this method, we are able to encompass both positive
and negative surprises, which as previously mentioned is advantageous. In forming the ARIMA
model along with the OLS model, we choose to not address seasonality for time constraint
reasons, however it would be interesting to pursue in the future. Looking at the graph of M&A
transactions located in the Appendix, there do not appear to be any seasonal effects present.
Additionally, A.4 tracks the surprises for each of the regressors and while the plots are somewhat
“noisy”, you can view the patterns in surprises for the regressors.
Our preliminary predictions for how the various independent variables will affect the
dependent variable (number of transactions) are found below in Table 3. At first glance we
predict Real GDP growth, consumer sentiment index, the REIT return index, the 1986 policy
dummy, and the 1994 policy dummy to interact positively with the dependent variable meaning
that increases in these variables and policies going into effect will increase the number of
transactions. The reason surprises might move transaction numbers is that they add new
information. A positive GDP surprise implies that the economy is doing better than expected

27
and this should lead to an increased number of transactions because there is “a tendency for
mergers to increase rapidly as the economy expands and to slow as the economy contracts
(Becketti, 1986, pg. 13). Further, consumer sentiment index generally aligns with the health of
the economy and it seems plausible that the consumer sentiment index will interact similarly as
consumers are generally confident and positive during strong economic times.
We believe that the REIT return index will interact differently depending on whether or
not the acquiror or target is a REIT. When the target is a REIT and REIT returns are decreasing,
we believe there could be more of an appeal for firms to acquire these REITs because when they
“are trading at distressed levels amid a continuing credit crunch, experts say the stage is set for
merger-and-acquisition plays, with stronger companies taking over weaker rivals” (Pruitt 1).
These distressed share prices, which are in part a reflection of REIT return, can be attractive
acquisition targets for firms who believe that they are undervalued. On the other hand, when the
acquiror is a REIT, positive REIT returns will lead to stronger cash flow and potential to finance
acquisitions.
At first glance, the two policy dummies should interact positively with M&A transaction
numbers. The first policy denotes that real estate investments will become more income-oriented
and this could theoretically spark potential buyers’ interest if they need to acquire other firms or
REITs to increase profitability if they are performing well. The 1994 policy allows for more
investment potential in REITs and could lead to more M&A activity from both the acquiror and
target perspective.
As mentioned in the introduction, many have proposed that REIT investments can be
utilized as a hedge against inflation. There are several academic papers that arrive at different
conclusions regarding real estate investment’s effectiveness as an inflation hedge, however it is

28
interesting to note that Chan, Hendershott, and Sanders (1990) conclude that REIT returns and
inflation are negatively correlated. While it appears difficult to predict how inflation will affect
real estate investment along with M&A transactions involving REITs due to conflicting literature
results, we predict that the effect will be opposite that of REIT returns due to the conclusion of
the Chan, Hendershott and Sanders literature. Therefore, we predict a negative relationship
when the acquiror is a REIT and a positive relationship when the target is a REIT. For the fed
funds rate, we predict a negative relationship with M&A transaction volume because, as
mentioned earlier in this section, the rate is often lowered in times of economic distress to ease
credit markets. While slower economic times could theoretically signify decreased M&A
activity, we believe that the appeal of “cheaper” money in credit markets will be very enticing
for real estate firms looking to consolidate or acquire other firms alike. We believe this effect
will be stronger for the regression where the acquiror is a REIT because they will be particularly
enticed by eased credit markets when financing transactions because of their cash flow
dependent nature. Similarly, we predict a negative relationship with the 30-year fixed mortgage
rate. Higher mortgage rates lead to lower cash flow for these firms engaging in M&A activity
and may not be able to access suitable financing for transactions that are required to pay high
mortgage rates.
Table 3. Predicted Coefficient Signs for Variables
Variable Category Prediction Real GDP growth Macro-economy, surprise + Inflation rate Macro-economy, surprise -/+ Consumer sentiment index Macro-economy, surprise + Fed funds rate Macro-economy, surprise - 30-year mortgage rate Real estate specific, surprise - REIT return index Real estate specific, surprise +/- 1986 policy dummy Regulatory/policy + 1994 policy dummy Regulatory/policy +
*Prediction: Increase in variable leads to predicted change in M&A volume

29
V. Data
In gathering a set of merger & acquisition transactions to use as a primary set of data, we
have been constantly developing this set of data to include a sufficient number of deals across a
broad time frame. We initially utilized the Zephyr M&A database along with REITwatch to
gather past deal information, however we were presented with an insufficient number of
transactions and faced a degrees of freedom problem. We ultimately used SDC Platinum and
have secured a list of M&A deals spanning from 1983-2013. Furthermore, to increase the
number of data points, we have divided deal activity quarterly. Given that the SDC output for
historical transactions was an undivided list, we manually sorted the data into quarters to
maximize data points. Since there are such a large number of transactions, this was a tedious
process from which we were able to gather summary statistics, which are located later in this
section. Consideration was given to separating transactions into monthly data, however there
would be several data months with 0 transactions and led us to believe that quarterly data was
more ideal. For analytical purposes, this wide data set is much more acceptable in terms of
creating meaningful regressions and being able to draw thoughtful conclusions from the results.
As mentioned in the Empirical Specification section, we are running two regressions –
one where the target firm must be a REIT and the acquiror can be a variety of different types of
organizations, and vice versa. At quick glance, some different types of organizations that are
involved in transactions with REITs include commercial banks, real estate management firms,
private equity firms, shopping centers, hotels, brokerage firms, office buildings, shopping
centers, hospitals, and casinos. In an attempt to keep the data set clean, we do not include
subsidiaries or joint ventures and search solely with the criteria that the target and acquiror must
be public or private.
30
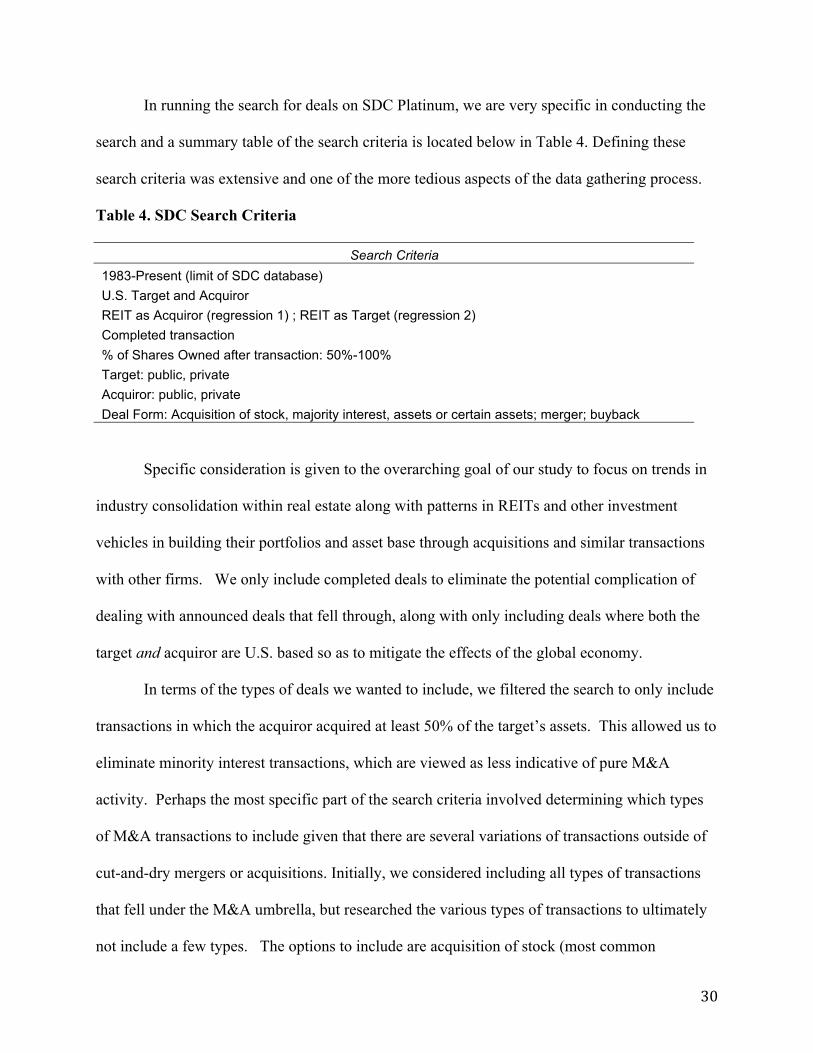
In running the search for deals on SDC Platinum, we are very specific in conducting the
search and a summary table of the search criteria is located below in Table 4. Defining these
search criteria was extensive and one of the more tedious aspects of the data gathering process.
Table 4. SDC Search Criteria
Search Criteria 1983-Present (limit of SDC database) U.S. Target and Acquiror REIT as Acquiror (regression 1) ; REIT as Target (regression 2) Completed transaction % of Shares Owned after transaction: 50%-100% Target: public, private Acquiror: public, private Deal Form: Acquisition of stock, majority interest, assets or certain assets; merger; buyback
Specific consideration is given to the overarching goal of our study to focus on trends in
industry consolidation within real estate along with patterns in REITs and other investment
vehicles in building their portfolios and asset base through acquisitions and similar transactions
with other firms. We only include completed deals to eliminate the potential complication of
dealing with announced deals that fell through, along with only including deals where both the
target and acquiror are U.S. based so as to mitigate the effects of the global economy.
In terms of the types of deals we wanted to include, we filtered the search to only include
transactions in which the acquiror acquired at least 50% of the target’s assets. This allowed us to
eliminate minority interest transactions, which are viewed as less indicative of pure M&A
activity. Perhaps the most specific part of the search criteria involved determining which types
of M&A transactions to include given that there are several variations of transactions outside of
cut-and-dry mergers or acquisitions. Initially, we considered including all types of transactions
that fell under the M&A umbrella, but researched the various types of transactions to ultimately
not include a few types. The options to include are acquisition of stock (most common

31
acquisition), acquisition of assets, acquisition of certain assets, merger, acquisition of majority
interest, buyback, recapitalization, and exchange offer. The obvious types of transactions to
include are mergers, acquisitions of stock, and acquisitions of assets & certain assets. An
acquisition of stock implies that the acquiror buys the stock of the legal entity that owns the
target’s assets whereas the acquisition of assets encompasses the acquiror owning each
individual asset of the company, which is very relevant for real estate given that REITs may
physically own buildings and certain real estate. To continue down the list of transactions,
acquisitions of majority interest are simply acquisitions of stock where greater than 50%, but less
than 100%, of stock is acquired. A buyback consists of a company buying back its equity
securities or securities convertible into equity, either on the open market, through privately
negotiated transactions, or through a tender offer. We include these types of transactions
because they represent a strategy used by companies to increase profits by reinvesting in
themselves when they believe their shares are undervalued. This strategy is similar to other
firms that acquire targets because they believe the target’s shares are undervalued. The same
general motivation applies and we believe that buybacks fit within the scope of transaction types
we want to include. While we believe that buybacks were accurately included in the dataset, one
shortcoming of the SDC output is that it does not allow you to specifically identify buyback
transactions.
The types of transactions that are not included are recapitalizations and exchange offers.
Recapitalizations are deals in which a company undergoes a shareholders leveraged
recapitalization by issuing a special one-time dividend to allow shareholders to retain an equity
interest in the company. These types of deals aim to reorganize a company’s capital structure by
changing amounts of debt and equity financing and do not encompass the type of M&A activity
32
that is relevant to our study. Finally, an exchange offer occurs when a company offers to
exchange new securities for its equity securities outstanding, securities convertible into equity, or
non-convertible debt securities. It also includes deals in which an existing loan is replaced with
a new facility during a debt restructuring. While one arm of exchange offers includes companies
placing bids on target companies using securities as consideration, relevant M&A activity to us,
they also more commonly include equity and debt reorganization within a firm which is not
relevant to us. Therefore, since we are unable to split the transactions labeled as exchange offers
into a subsector, these transactions have been eliminated from the data set.
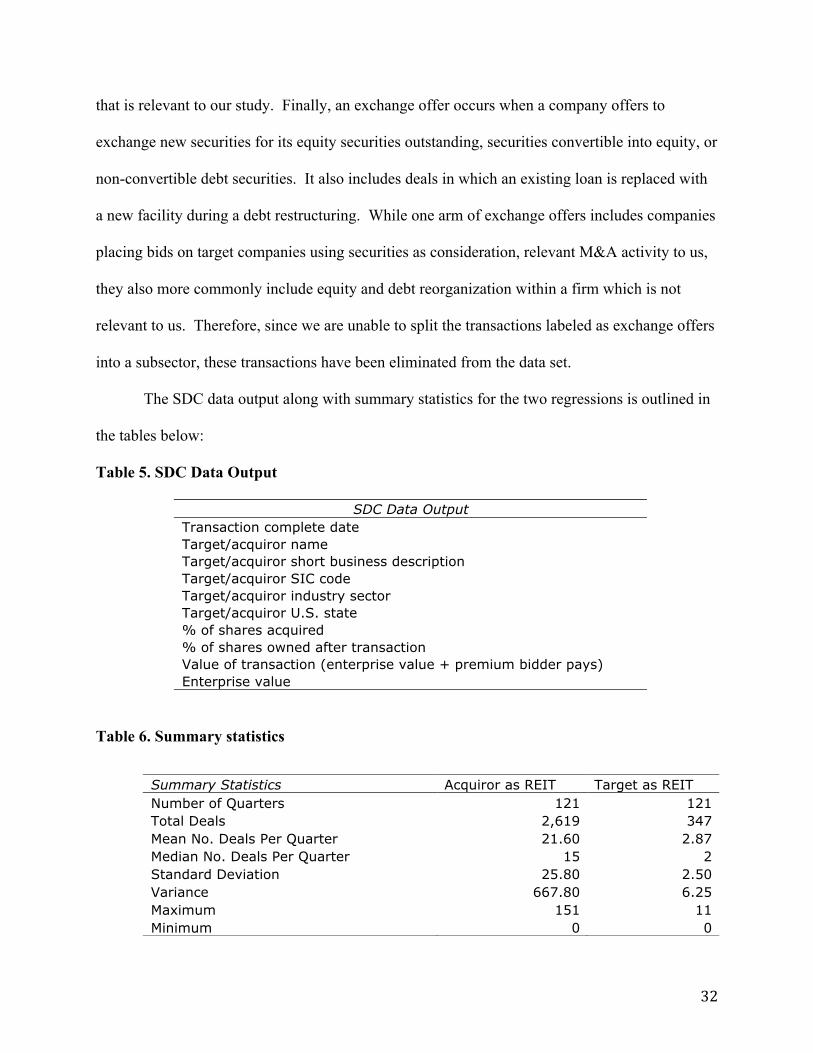
The SDC data output along with summary statistics for the two regressions is outlined in
the tables below:
Table 5. SDC Data Output
SDC Data Output Transaction complete date Target/acquiror name Target/acquiror short business description Target/acquiror SIC code Target/acquiror industry sector Target/acquiror U.S. state % of shares acquired % of shares owned after transaction Value of transaction (enterprise value + premium bidder pays) Enterprise value
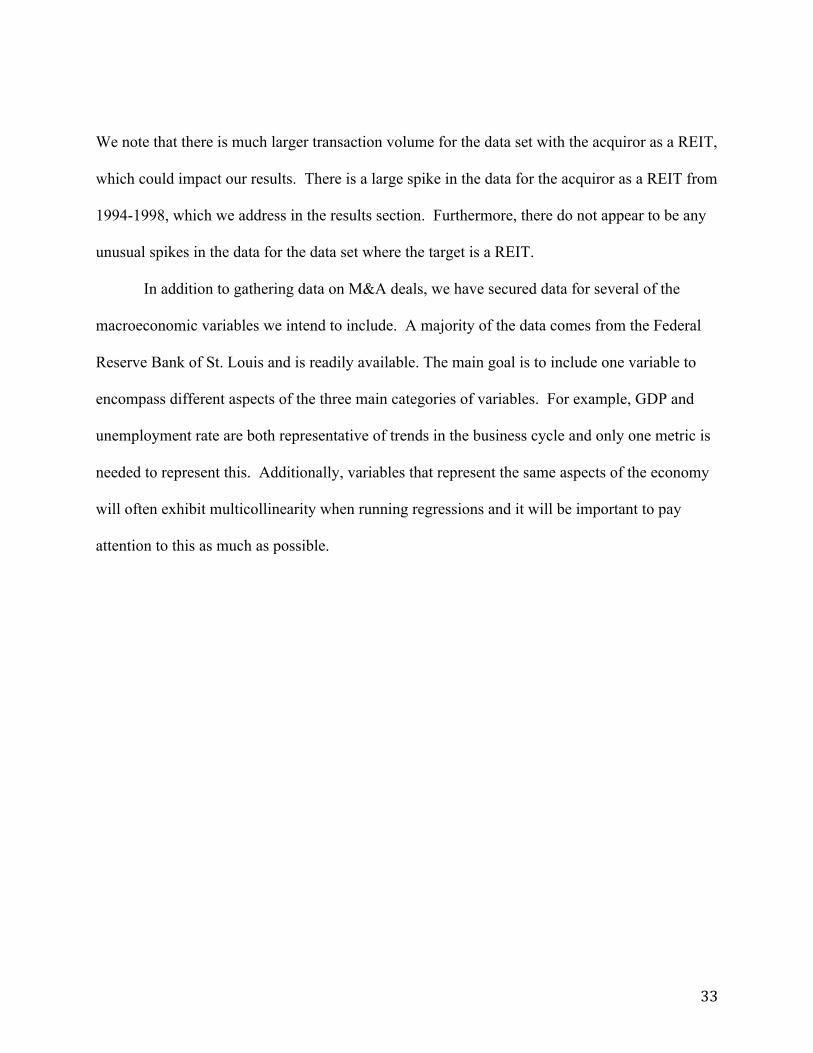
Table 6. Summary statistics
Summary Statistics Acquiror as REIT Target as REIT Number of Quarters 121 121 Total Deals 2,619 347 Mean No. Deals Per Quarter 21.60 2.87 Median No. Deals Per Quarter 15 2 Standard Deviation 25.80 2.50 Variance 667.80 6.25 Maximum 151 11 Minimum 0 0
33
We note that there is much larger transaction volume for the data set with the acquiror as a REIT,
which could impact our results. There is a large spike in the data for the acquiror as a REIT from
1994-1998, which we address in the results section. Furthermore, there do not appear to be any
unusual spikes in the data for the data set where the target is a REIT.
In addition to gathering data on M&A deals, we have secured data for several of the
macroeconomic variables we intend to include. A majority of the data comes from the Federal
Reserve Bank of St. Louis and is readily available. The main goal is to include one variable to
encompass different aspects of the three main categories of variables. For example, GDP and
unemployment rate are both representative of trends in the business cycle and only one metric is
needed to represent this. Additionally, variables that represent the same aspects of the economy
will often exhibit multicollinearity when running regressions and it will be important to pay
attention to this as much as possible.
34
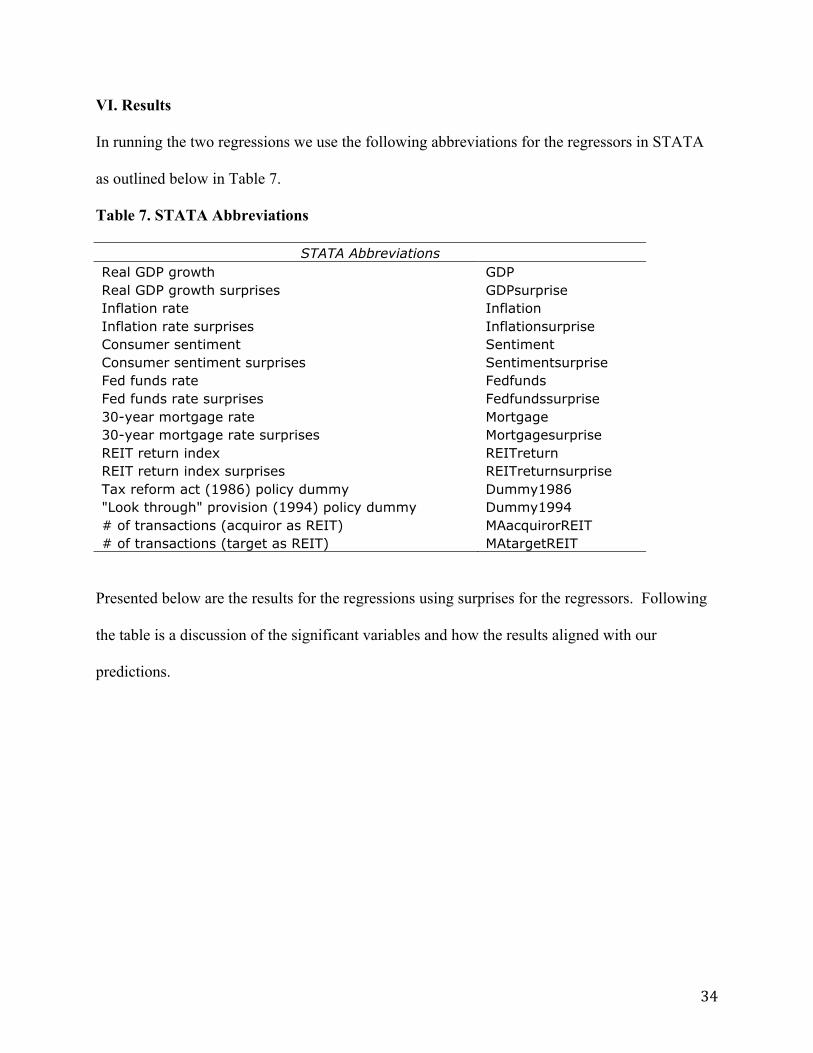
VI. Results
In running the two regressions we use the following abbreviations for the regressors in STATA
as outlined below in Table 7.
Table 7. STATA Abbreviations
STATA Abbreviations Real GDP growth GDP Real GDP growth surprises GDPsurprise Inflation rate Inflation Inflation rate surprises Inflationsurprise Consumer sentiment Sentiment Consumer sentiment surprises Sentimentsurprise Fed funds rate Fedfunds Fed funds rate surprises Fedfundssurprise 30-year mortgage rate Mortgage 30-year mortgage rate surprises Mortgagesurprise REIT return index REITreturn REIT return index surprises REITreturnsurprise Tax reform act (1986) policy dummy Dummy1986 "Look through" provision (1994) policy dummy Dummy1994 # of transactions (acquiror as REIT) MAacquirorREIT # of transactions (target as REIT) MAtargetREIT
Presented below are the results for the regressions using surprises for the regressors. Following
the table is a discussion of the significant variables and how the results aligned with our
predictions.

35
Table 8. Acquiror as REIT, Target as REIT regressed on surprises
Number of transactions Acquiror as REIT Target as REIT GDP surprise -0.143 0.201 (3.854) (0.357) Inflation surprise 0.990 0.914** (4.381) (.405) Consumer sentiment surprise 0.447 0.024 (0.471) (0.044) Fed funds rate surprise 2.640 -0.332 (5.775) (0.535) 30-year mortgage rate surprise -2.301 -0.235 (5.963) (0.552) REIT return surprise -1.138* -0.074 (0.670) (0.062) 1986 dummy 3.005 -0.187 (7.815) (0.723) 1994 dummy 27.955*** 3.293*** (4.691) (0.434) _cons 0.620 0.976 (6.770) (0.627) R-squared 0.308 0.400 Adjusted R-squared 0.257 0.354 N 117 117
* p<0.1; ** p<.05;***p<.01
From the results provided above, regression 1 yields two significant variables: REIT returns
surprise at the 10% level and the 1994 policy dummy at the 1% level. For the second regression,
inflation surprise is significant at the 5% level and the 1994 policy dummy is significant at the
1% level. R-squared and adjusted R-squared are fairly high for both regressions and the F
statistic is 0 for both. It is interesting to note that the coefficients were different signs for GDP
surprise, fed funds rate surprise, and 1986 policy dummy. Our initial predictions were fairly
accurate, but differed for GDP surprises for acquiror as REIT, inflation surprise for acquiror as
REIT, fed funds rate surprise for acquiror as REIT, REIT return surprise for acquiror as REIT,
and 1994 dummy for target as REIT.

36
It is interesting to note that there are very few significant variables for these two regressions and
that inflation surprise is significant for regression 2, but not regression 1. This result aligns with
several pieces of literature cited in the empirical specification section that concludes real estate
investments are a valuable hedge against inflation. Therefore, it makes sense that firms would
seek to acquire REITs and their assets. The 1994 policy dummy is likely significant with a high
positive coefficient because of the large spike in transaction activity from 1994-1999. We
checked the data to see if there was perhaps double-counting for firms that acquired separate
assets, but under the same parent corporation. There appears to be no extra listings in the data
and the spikes in transaction activity are accurately presented. The coefficients for the 1994
policy align with our prediction of a positive relationship. Given that this look-through provision
allowed for more potential investment in REITs, this allowed REITs to have more capital to
finance potential M&A activity.
We would also like to note that the coefficients are generally larger in magnitude for
regression 1 and this may likely be attributed to the much larger number of transactions for data
set 1 as opposed to data set 2. In an attempt to relate the results to the merger wave theory that is
outlined in the theoretical framework section, we looked at the raw surprises data and tried to
find trends. Our thought process was that after several quarters of all positive or all negative
surprises for certain variables, we would see a spike or a decline in deal activity as compared to
quarters shortly before and after. With a focus given on the variables deemed significant in the
results, we did not find any sort of consistent trend.
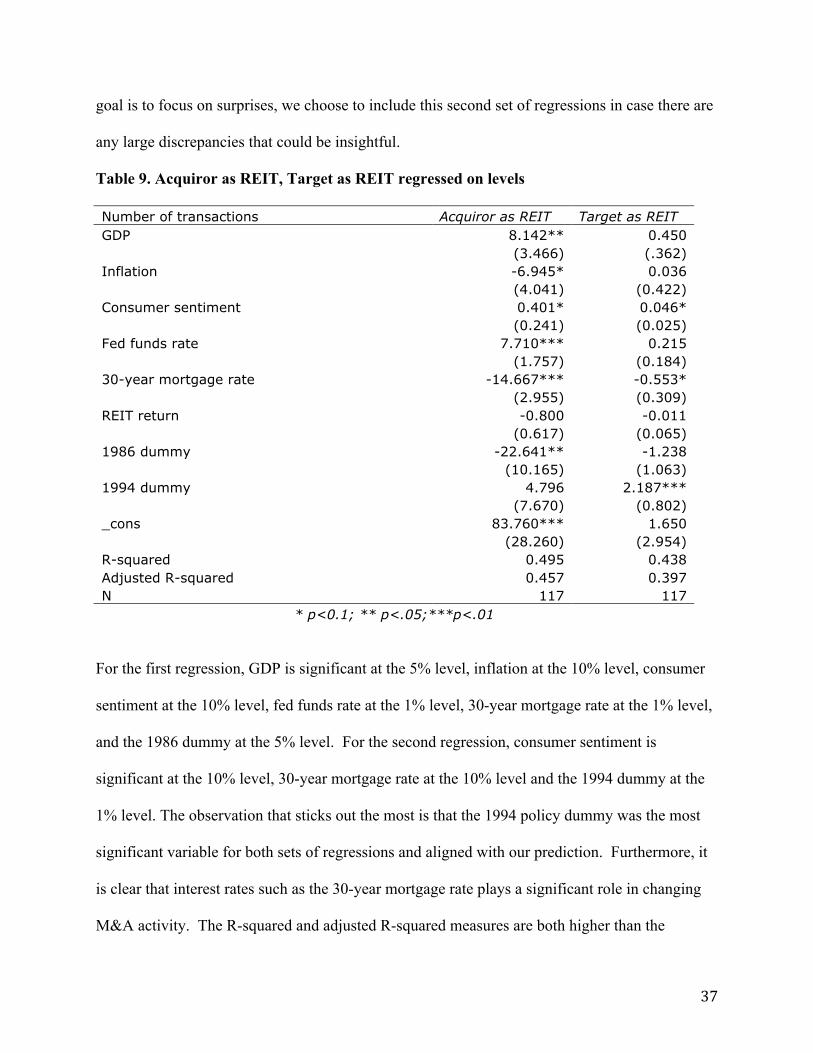
Moving on, we decided to run the same regressions but used level data for the regressors
as opposed to surprises and the results are presented below in Table 9. Even though our main
37
goal is to focus on surprises, we choose to include this second set of regressions in case there are
any large discrepancies that could be insightful.
Table 9. Acquiror as REIT, Target as REIT regressed on levels
Number of transactions Acquiror as REIT Target as REIT GDP 8.142** 0.450 (3.466) (.362) Inflation -6.945* 0.036 (4.041) (0.422) Consumer sentiment 0.401* 0.046* (0.241) (0.025) Fed funds rate 7.710*** 0.215 (1.757) (0.184) 30-year mortgage rate -14.667*** -0.553* (2.955) (0.309) REIT return -0.800 -0.011 (0.617) (0.065) 1986 dummy -22.641** -1.238 (10.165) (1.063) 1994 dummy 4.796 2.187*** (7.670) (0.802) _cons 83.760*** 1.650 (28.260) (2.954) R-squared 0.495 0.438 Adjusted R-squared 0.457 0.397 N 117 117
* p<0.1; ** p<.05;***p<.01
For the first regression, GDP is significant at the 5% level, inflation at the 10% level, consumer
sentiment at the 10% level, fed funds rate at the 1% level, 30-year mortgage rate at the 1% level,
and the 1986 dummy at the 5% level. For the second regression, consumer sentiment is
significant at the 10% level, 30-year mortgage rate at the 10% level and the 1994 dummy at the
1% level. The observation that sticks out the most is that the 1994 policy dummy was the most
significant variable for both sets of regressions and aligned with our prediction. Furthermore, it
is clear that interest rates such as the 30-year mortgage rate plays a significant role in changing
M&A activity. The R-squared and adjusted R-squared measures are both higher than the

38
respective regressions using surprises and the F-statistic is also 0. We next take a look at how
the coefficient signs relate for the corresponding variables for the two sets of regressions. While
the signs mostly aligned for the regressions with surprises compared to levels, they were
different for GDP, inflation, and the 1986 policy dummy for the acquiror as a REIT regression.
For the target as a REIT regression, the only discrepancy was with the fed funds rate. There are
several more significant variables when measuring the regressors with levels as opposed to
surprises. It is interesting to note that R-squared and adjusted R-squared are higher for
regression 1 using levels, which is the opposite of surprises. Given that the R-squared measures
are relatively high for both sets of regressions, we believe that several of the regressors are
related and so we decided to look at correlation matrices for the regressors presented as surprises
and as levels shown in Tables 10 and 11.
Table 10. Correlation matrix for surprises
GDP Inflation Sentiment Fed funds rate Mortgage rate REIT return GDP 1.00 0.23 0.26 0.20 0.22 0.14 Inflation 0.23 1.00 0.02 0.30 0.16 0.24 Sentiment 0.26 0.02 1.00 0.31 0.07 0.33 Fed funds rate 0.20 0.30 0.31 1.00 0.45 0.02 Mortgage rate 0.22 0.16 0.07 0.45 1.00 -0.08 REIT return 0.14 0.24 0.33 0.02 -0.08 1.00
Table 11. Correlation matrix for levels
GDP Inflation Sentiment Fed funds rate Mortgage rate REIT return GDP 1.00 0.25 0.51 0.35 0.38 0.19 Inflation 0.25 1.00 0.11 0.36 0.30 0.17 Sentiment 0.51 0.11 1.00 0.52 0.37 0.08 Fed funds rate 0.35 0.36 0.52 1.00 0.90 -0.08 Mortgage rate 0.38 0.30 0.37 0.90 1.00 -0.05 REIT return 0.19 0.17 0.08 -0.08 -0.05 1.00

39
At first glance, we notice a high correlation between the mortgage and fed funds rate.
While other variables have semi-high correlations, such as GDP and consumer sentiment, the
relationships are not too strong. One potential option was to re-run the regressions by
eliminating one variable at a time to eliminate some of this collinearity, however we ultimately
decided that it was not significant enough to merit this new model.
To slightly alter our model, we considered the idea of scaling the dependent variable by
dividing the number of deals per quarter by the total number of REITs. This would have been
valuable to see if there were trends in the number of REITs over time as related to the number of
deals. However, many of the firms listed in the data set are private REITs and there is no
measure on the exact number of REITs over time. From REITWatch we can track the number of
publicly traded REITs, but ultimately decided against using this scale as the trend in numbers of
publicly-traded REITs may not mirror the trend for private ones. Ultimately, we are somewhat
surprised that we did not yield more significant variables, but are still able to make meaningful
insight in the conclusion section.
VII. Conclusion
Real Estate Investment Trusts are valuable pass through entities that allow the common
investor access to real estate returns without going through the financial burden of purchasing
highly illiquid, yet durable, real estate properties. REITs have a similar corporate structure to
mutual funds in that they allow investors to pool together resources to acquire commercial real
estate properties without taking on the massive financial liability or having to worry about
managing and operating the building. REITs offer investors superior liquidity and a well-
diversified portfolio of real estate properties without the financial risks associated with real estate
40
acquisitions. Public REITs trade on major exchanges and investors who purchase shares of a
REIT earn income from dividend payments, derived from leasing activity and property
appreciation after sale, and stock appreciation. After their formation in 1960, REITs have
become popular investment vehicles and act a good proxy for the real estate industry as a whole
because of their accessibility and their active involvement in the commercial real estate industry.
Commercial real estate, the underlying asset, is highly influenced by the state of the general
macro economy and tends to be procyclical in its nature (Becketti, 1986). Furthermore, macro
conditions can affect corporate decision-making. After a thorough review of the literature, we
have determined that there is a lack of studies that focused on the economic environment that
may have induced or predicated merger and acquisition activity. Through the framework of this
study, we conduct a more in depth analysis of the connection between the macro economy and
REIT-related M&A.
Neoclassical theories of merger waves attempt to explain why M&A transactions tend to
cluster in time within an industry by citing that industry shocks, either in the form of economic,
technological, financial, regulatory, or political shocks, cause an industry to restructure through
M&A transactions (Harford, 2005). This study focuses primarily on economic shocks while
controlling for major policy changes. For the purpose of this study, we define economic shocks
as an economic “surprise, wherein we took the difference between the predicted level and the
observed level for real GDP growth rate, Inflation, the University of Michigan Consumer
Sentiment Index, 30-year Conventional Mortgage Rate and a REIT return Index. We regressed
these factors on the aggregate level of M&A when the target was a REIT and when the acquiror
was a REIT. By focusing on surprises, we incorporate the industry shock theory that leads us to

41
believe that industry shocks can lead to merger waves. We will make some casual inferences
below.
After reviewing the regression results, we were surprised that the regressions did not
yield more significant variables. While several of these macro-economic factors may have an
impact on decision making for REIT M&A, our results only indicate that the 1994 look through
provision was substantial in affecting M&A activity. The large spikes in transaction activity
begin in 1995 and last until the late 1990s. This implies that mutual funds, traditionally large
investors in REITs, potentially had a large and positive impact on activity. The high coefficient
for the regression with the acquiror as a REIT highlights the importance of cash flow and
adequate financing for M&A activity for REITs. Furthermore, we note the 1-year or so lag
period between the policy coming into affect and the upward wave of M&A activity. This leads
us to believe that timing might be a factor that contributed to the results we have. Corporate
decision making along with M&A transactions involve long and drawn out processes and
perhaps are slower to react to economic and real estate changes than on a quarter-by-quarter
basis. In this case, as mentioned in the results section, several quarters of positive or negative
surprises for the regressors did not lead to any significant increases or decreases in transaction
volume. As shown in the results, the model using levels for the regressors yielded several
significant variables, which indicates that macro-economic and external real-estate factors do in
fact affect M&A transaction activity. This leads us to believe that corporate decision makers
within the real estate market are less likely to consider unexpected movements in macro-
economic and real estate specific factors and transaction activity is more reflective of levels in
these factors as opposed to surprises. Additionally, although we feel that the ARIMA model was
the best option, it may not clearly reflect an actual surprise. For example, barring new legislation,

42
in the U.S. a series of automatic spending cuts will drastically impact the level of GDP. The
ARIMA model would most likely lead to an interpretation of a GDP surprise for that quarter
when, in fact, this drop is anticipated and not a surprise at the time. However, after significant
research on how to measure surprises, the ARIMA model ultimately proved to be the most
appropriate for the purposes of our study, but it is important to note that anomalies such as the
GDP example could be realities and are important to consider for future research.
While our initial motivation was sparked by public REIT M&A activity, which exhibited
clearly volatile transaction numbers surrounding the 2008 economic crisis, our data set from
SDC does not appear to indicate the same trends. The idea of an economic shock as
demonstrated by the 2008 crisis and general economic surprises supplemented with the merger
wave theory have not aligned with our findings in this study. Much of the M&A theory detailed
in previous sections focuses on internal motives for M&A activity and in this case those might
outweigh the external factors that we highlight in our study. Specifically in the real estate
market, strong cash flows and accessibility to financing in capital markets is absolutely crucial
for an M&A transaction to succeed, more so when the acquiring firm is a REIT based on our
results. The general state of these markets as compared to unexpected shocks seem to be more of
a driving factor in affecting transaction volume.
Corporate decision-making regarding M&A activity is driven by a combination of
internal and external factors. While it has proved difficult to quantify some of this internal
motivation, it would be interesting in the future to see how these motives compare to the external
factors we highlight in our study. Additionally, in consideration with the lag period noted
between the 1994 policy coming into effect and the large spike in activity, it would be insightful
to further study lag periods of M&A activity in response to external factors. The real estate
43
M&A market is often volatile and unpredictable and dissecting and quantifying the key drivers
has provided us with meaningful insight as discussed above.
With access to more information and data, future studies should look to address
differences in the geographic dispersion of the firms and could potentially delve into different
property types. Due to a lack of time and complete information, we are unable to fully explore
these topics. It could be the case that some regions and property types are more affected by
changes in the macro and industry specific environment or that there may be confounding effects
that limited our results. Ultimately, our study has started to address the connection between
M&A activity and quantifiable factors of the macro economy and industry for REITs that hasn’t
been studied as of this point. Future inquires could lead to more meaningful results that could
impact corporate decision-making processes.

44
References
Agrawal, A., & Jaffe, J. F. (2003). Do takeover targets underperform? Evidence from operating
and stock returns. Journal of Financial and Quantitative Analysis, 38, 721-746. Ali-Yrkkö, J. (2002). Mergers and acquisitions: Reasons and results. Helsinki: Etla. Anderson, Randy I., Henrik Medla, Nico B. Rottke, and Dirk Schiereck. Real Estate Merger
Motives: An Analytical Review of the Literature. Journal of Real Estate Literature, 20.1 (2012): 37-47. Print.
ARIMA forecast. (n.d.). Oklahoma State University Learn Econometrics. Retrieved April 11,
2013, from http://www.learneconometrics.com/class/5263/notes/ARIMA%20forecasts.pdf
Becketti, S. (1986). Corporate mergers and the business cycle. Economic Review, 13-26.
Retrieved March 14, 2013, from http://kansascityfed.org/Publicat/Econrev/EconRevArchive/1986/2q86beck.pdf
Brealey, R. A., & Myers, S. C. (1991). Principles of corporate finance. New York, NY:
McGraw-Hill. Campbell, R. D., Giambona, E., & Sirmans, C. F. (2009). The long-horizon performance of
REIT mergers. The Journal of Real Estate Finance and Economics, 38(2), 105-114. doi: 10.1007/s11146-007-9085-z
Chan, K.C., P.H. Hendershott, A.B. Sanders. (1990). Risk and return on real estate: Evidence
from equity reits. AREUEA Journal, 18(40, 431-452 Chen, Ming-Chi, Chi-Lu Peng, So-De Shyu, and Jhih-Hong Zeng. (2012). Market States and the
Effect on Equity REIT Returns Due to Changes in Monetary Policy Stance. The Journal of Real Estate Finance and Economics, 45, 364-82.
Deans G., Kroeger, F. and Zeisel, S (2002) Winning the Merger Endgame – A playbook for
profiting from industry consolidation, McGraw Hill, U.S. Deans, G., Kroeger, F. and Zeisel, S. (2003) How to win the consolidation game, Mergers and
acquisitions. Vol. 38, Iss. 3 Dittmar, A., & Dittmar, R. (2008). The timing of financing decisions: An examination of the
correlation in financing waves? Journal of Financial Economics, 90(1), 59-83. doi: 10.1016/j.jfineco.2007.11.007

45
Eichholtz, P. A., & Kok, N. (2008). How does the market for corporate control function for property companies? The Journal of Real Estate Finance and Economics, 36(2), 141-163. doi: 10.1007/s11146-007-9061-7
Federal Reserve Bank of St. Louis (2013) Historical Economic Data. Retrieved February 20th Forecasting in Stata: Tools and tricks. (n.d.). University of Wisconsin-Madison. Retrieved April
11, 2013, from http://www.ssc.wisc.edu/~bhansen/390/stata.pdf Geweke, J., & Zhou, G. (1996). Measuring the pricing error of the arbitrage pricing theory. The
Review of Financial Studies, 9(2), 557-587. Ghosh, Chinmoy, Milena Petrova, and Yihong Xiao. (2012). Do REITs use cash reserve
efficiently? Evidence from corporate acquisitions. Journal of International Money and Finance, n.
Harford, J. (1999). Corporate cash reserves and acquisitions. The Journal of Finance, 54(6),
1969-1997. doi: 10.1111/0022-1082.00179 Harford, J. (2005). What drives merger waves? Journal of Financial Economics, 77, pp. 529–
560 Jensen, M. C. (1986). Agency costs of free cash flow, corporate finance, and takeovers.
American Economic Review, 76, 323. Jensen, M. C. (1988). Takeovers: Their causes and consequences. Journal of Economic
Perspectives, 2, 21-48 Li, J., Lam, K. C. K., Karakowsky, L., & Qian, G. (2003). Firm resource and first mover
advantages: A case of foreign direct investment (FDI) in China. International Business Review, 12, 625–645.
Ling, D.C. and M.T. Petrova. (2011). Why do REITs go private? Differences in target
characteristics, acquirer motivations, and wealth effects in public and private acquisitions. Journal of Real Estate Finance and Economics, 43, 1, 99-129.
Martynova, M. and Renneboog, L. (2008). A Century of corporate takeovers: What have we
learned and where do we stand? Journal of Banking and Finance, 32:10, 2148-77 Mitchell, M., & Mulherin, J. H. (1996). The impact of industry shocks on takeover and
restructuring activity. Journal of Financial Economics, 41(2), 193-229. doi: 10.1016/0304-405X(95)00860-H
Nakamura, H. R. (2002). Mapping out the Japanese mergers & acquisitions pattern - The
influence of macro factors on m&as. 1-23.
46
Nilsson, C-H, C. Lindskog, and J. Brink. (2005). Industry consolidation - A case from the
consolidation process within the European industry. Swedish Network for European Studies in Economics. <http://www.snee.org/filer/papers/473.pdf>.
Pruitt, A. D. (2009, April 15). REIT sector is ripe for mergers and acquisitions. The Wall Street
Journal. Retrieved February 09, 2013, from http://online.wsj.com/article/SB123976057555719587.html
REITwatch: A monthly statistical report on the real estate investment trust industry. (2013,
March). National Association of Real Estate Investment Trusts. Retrieved April 11, 2013, from http://returns.reit.com/reitwatch/rw1303.pdf
REITs: investment options for a low-growth, low-interest rate environment. (2012). Seeking
Alpha. Retrieved April 11, 2013, from http://seekingalpha.com/article/803881-reits-investment-options-for-a-low-growth-low-interest-rate-environment
Ratcliffe, Christopher, and William Dimovski. (2012). REIT mergers and acquisitions: A meta-
analysis. The Journal of Property Investment and Finance, 30.3: n. page. Print. Shleifer, A., & Vishny, R. W. (2003). Stock market driven acquisitions. Journal of Financial
Economics, 70(3), 295-311. Stata: The language of choice for time-series analysis? (n.d.). The State Journal. Retrieved April
11, 2013, from http://www.stata-journal.com/sjpdf.html?articlenum=st008 Thomson SDC Platinum (2013) Mergers & Acquisitions database. Retrieved February 6th Uddin, Moshfique, and Agyenim Boateng. (2011) Explaining the trends in the UK cross-border
mergers & acquisitions: an analysis of macro-economic factors. International Business Review, 20: 547-56. Elsevier. Retrieved from <www.elsevier.com/locate/busrev>.
Womack, Kiplan S. (2010). Real estate mergers: Corporate control & shareholder wealth. The
Journal of Real Estate Finance and Economics, 44, 446-71.
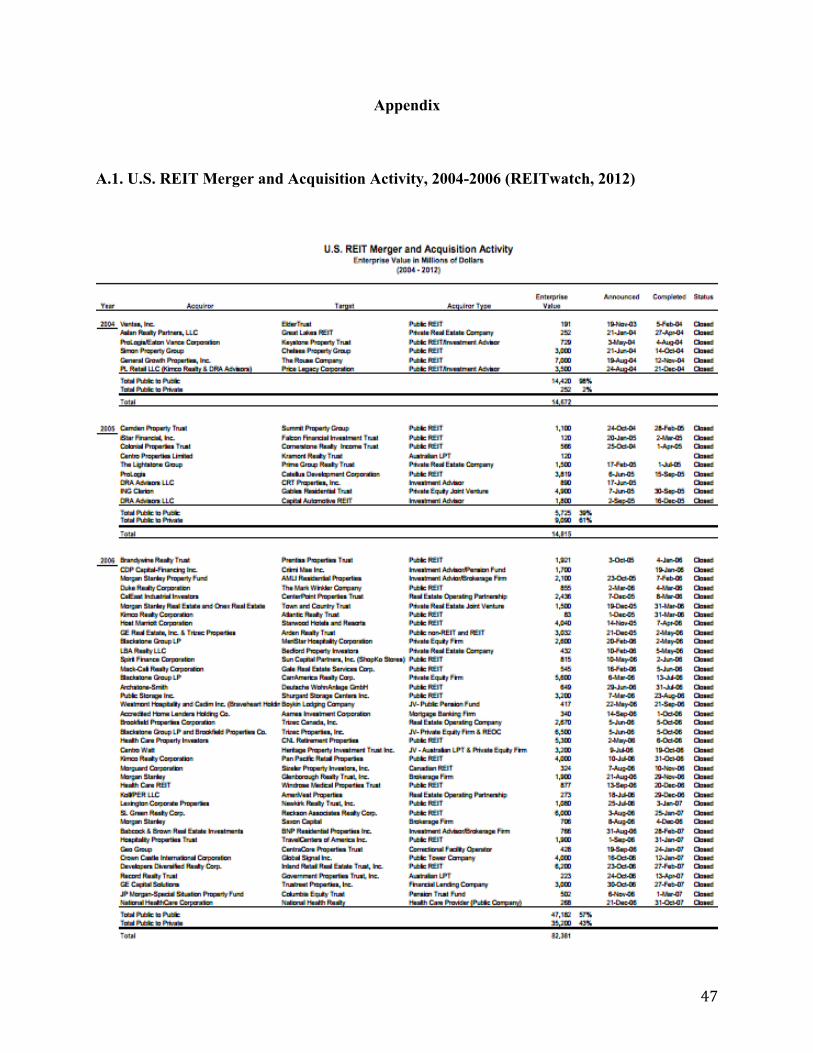
47
Appendix
A.1. U.S. REIT Merger and Acquisition Activity, 2004-2006 (REITwatch, 2012)
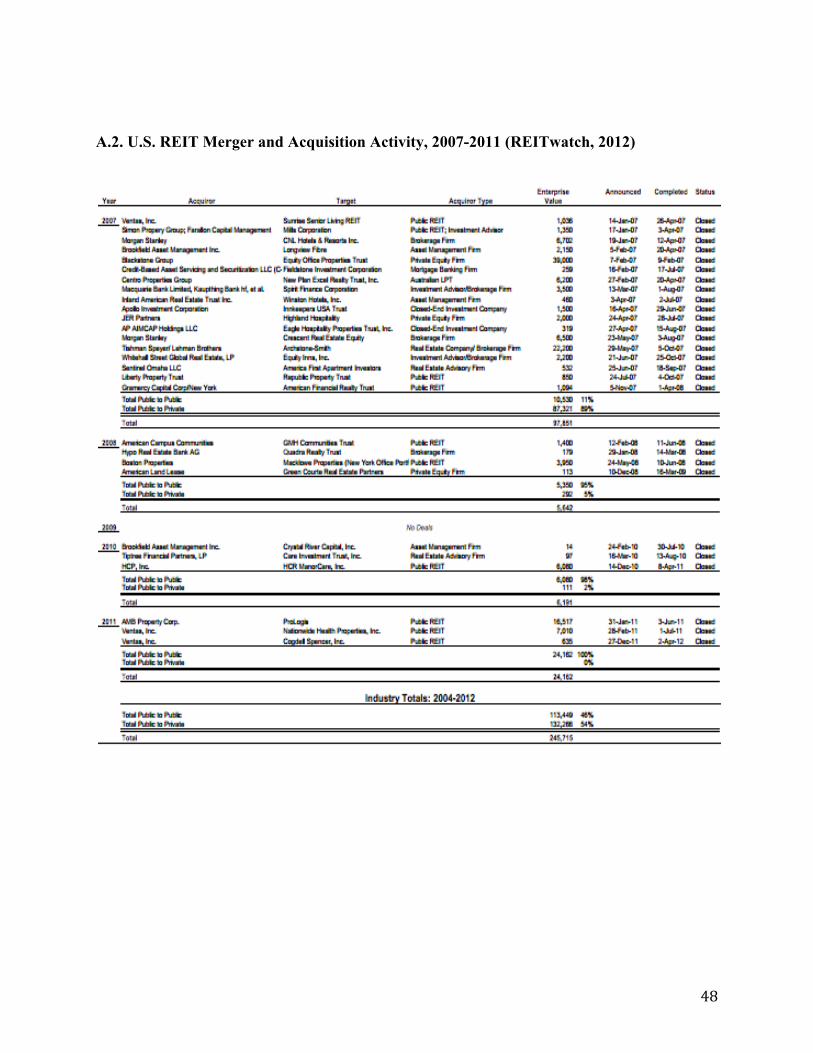
48
A.2. U.S. REIT Merger and Acquisition Activity, 2007-2011 (REITwatch, 2012)

49
A.3 M&A Activity

50
A.4 Time Series of Surprises