Embed Size (px)
Citation preview
John Hancock Disciplined Value International Fund
Portfolio management of the John Hancock Disciplined Value International Fund is provided by Robeco Boston Partners, a division of Robeco Investment Management, Inc., the Fund’s sub-adviser. John Hancock Funds, LLC is the Fund’s distributor.
THIS MATERIAL IS FOR INSTITUTIONAL/BROKER DEALER USE ONLY. NOT FOR DISTRIBUTION OR USE WITH THE PUBLIC
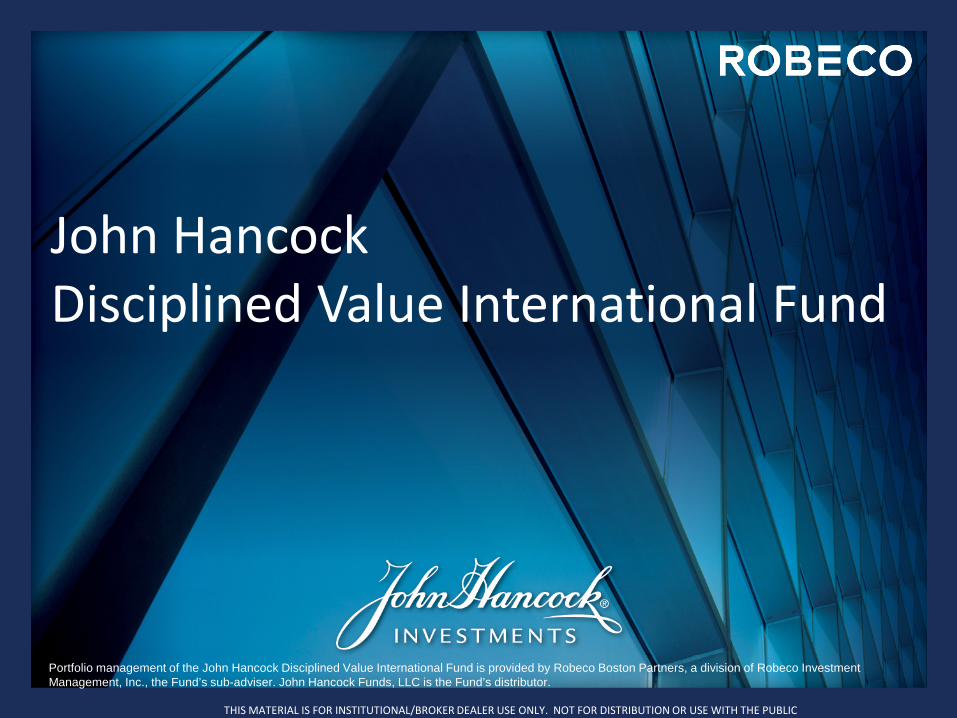
Robeco Boston Partners
As of December 31, 2014
1 Key investment professionals have worked together since the founding of Boston Partners in 1995 and years before at a prior firm, where the investment philosophy was established.
Investment Profile
Value equity expertise founded in the early 1980s¹
Consistent and repeatable investment philosophy across all disciplines
Integrated bottom-up, fundamental and quantitative research
Value equity investment expertise for Robeco, a global asset management firm with $300 billion in AUM (as of 9/30/14)
Expertise of a boutique with the depth of a global firm
$71.5 Billion in Assets Under Management
Strategies Assets ($M)
Large Cap Value $31,595
Premium Equity (All Cap Value) $12,212
Mid Cap Value $14,704
Small Cap /Small Cap II/ Small-Mid Cap $2,775
Domestic Long/Short $8,218
Global/International Value $1,517
Global Long/Short $509
2 THIS MATERIAL IS FOR INSTITUTIONAL/BROKER DEALER USE ONLY. NOT FOR DISTRIBUTION OR USE WITH THE PUBLIC
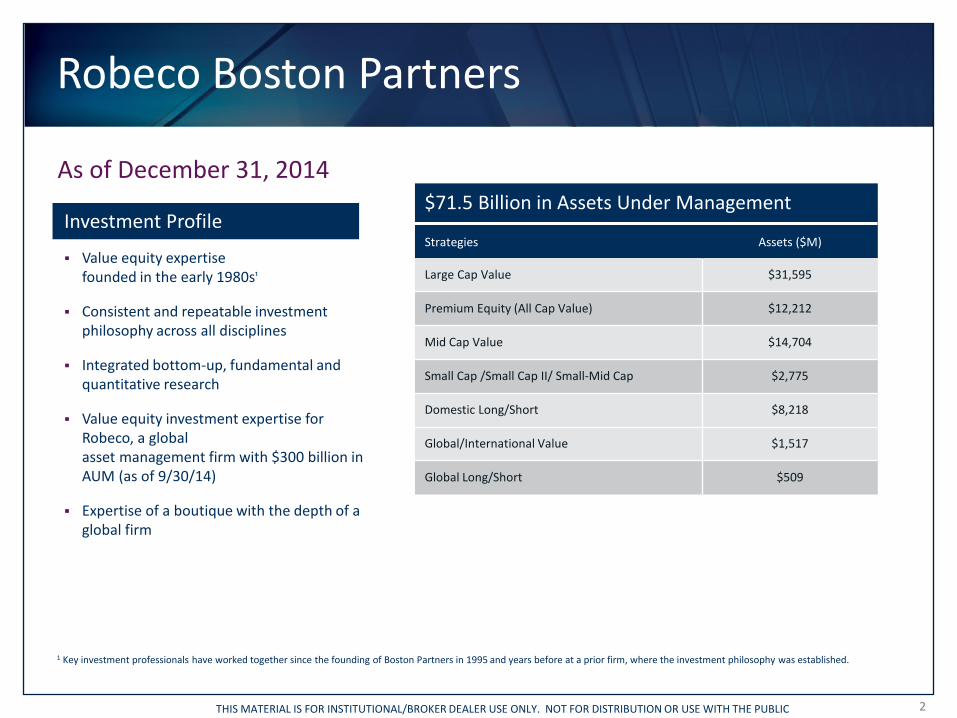
Robeco Boston Partners Equity Investment Team
Trading
Portfolio Managers Product Specialists
Research Analysts
Mark Kuzminskas Director of Equity Trading
Thomas Walsh Senior Equity Trader
Ian Sylvetsky Junior Equity Trader
Christopher Bowker Equity Trader
Duilio Ramallo, CFA Premium Equity
19 years experience
Steven Pollack, CFA Mid Cap Value Equity 30 years experience
David Dabora, CFA Small Cap Value Equity Alpha Blue Capital L.P.
27 years experience
George Gumpert, CFA Small Cap Value Equity
15 years experience
Robert Jones, CFA Long/Short Equity
26 years experience
Christopher Hart, CFA Global & International Equity
23 years experience
Mark Donovan, CFA Large Cap Value Equity
33 years experience
David Pyle, CFA Large Cap Value Equity
19 years experience
Joseph Feeney, Jr., CFA Chief Investment Officer
Long/Short Research Fund 29 years experience
Martin MacDonnell, CFA 130/30 Large Cap Value Equity
Quantitative Strategies 23 years experience
Harry Rosenbluth, CFA Senior Advisor - Global &
International Equity 33 years experience
Matthew Ender Portfolio Trading Assistant
Lawrence Chan, CFA Industrials & Capital Equipment, Internet Services,
Payment Services, Recreational Products
Stephanie McGirr Retailers, Restaurants & Apparel, Health Care Services, Property &
Casualty Insurance
Todd Knightly Director of Fundamental Research
Gaming, Lodging & Leisure
Jason Bartlett, CFA Quantitative Strategies
Maggy Pietropaolo, CFA Quantitative Strategies
Joseph Urick Quantitative Strategies
Carissa Wong, CFA Quantitative Analyst
Joshua White, CFA Consumer Durables, Chemicals,
Packaging, General Manufacturing Global Generalist
Ronald Young, CFA Aerospace & Defense, Asset Managers &
Exchanges, Life Insurance, Telecommunications Equipment & Services,
Cable
Eric Connerly, CFA Director of Quantitative Research
Scott Burgess, CFA Computer Equipment &
Services, Electronics Manufacturers & Distributors, Computer Software,
Semiconductors & SemiCap Equipment
Kevin Duggan, CFA Banks & Thrifts, Investment Banks, Brokers, Specialty
Lenders, Transportation
Derrick Bellinger, CFA Media, Advertising, Consumer Products, Tobacco, Agriculture, Business Services
Ali Motamed, CFA Long/Short Generalist and Associate
Portfolio Manager
Joshua Jones, CFA Energy, Metals & Mining, Associate Portfolio Manager
Global and International
David Hinton, CFA Small Cap Generalist
Brian Boyden, CFA Utilities, Generators & Pipelines,
Health Care, Property REITs
Ross Klein, CFA Associate Research Analyst
Bruce Wimberly Long/Short Generalist
Andrew Sherman Associate Research Analyst
Leo Fochtman Quantitative Strategies
Jessica Ballis Associate Research Analyst
Volkan Gulen, CFA Energy
David Gullen, CFA, CAIA 16 years experience
Carolyn Margiotti, CFA 20 years experience
John Forelli, CFA 30 years experience
Brad Brezinski 6 years experience
Brandon Smith, CFA, CAIA 8 years experience
3
William Pawson 14 years experience
Patricia Correa 19 years experience
Paul Donovan Associate Research Analyst
Paul Korngiebel, CFA Global Generalist
THIS MATERIAL IS FOR INSTITUTIONAL/BROKER DEALER USE ONLY. NOT FOR DISTRIBUTION OR USE WITH THE PUBLIC
Robeco Boston Partners
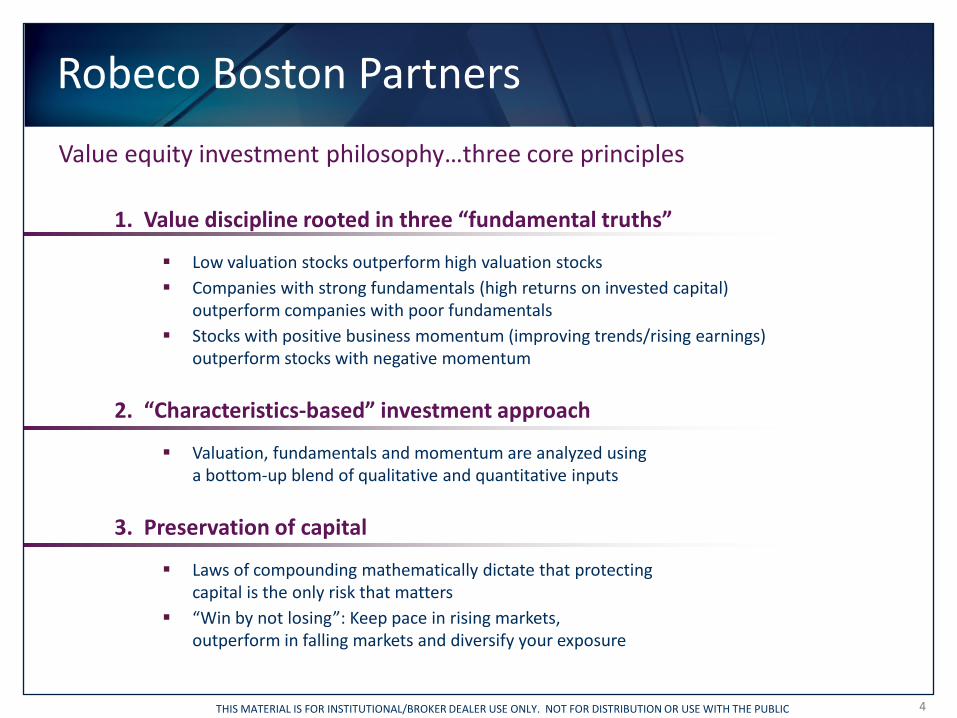
1. Value discipline rooted in three “fundamental truths”
Low valuation stocks outperform high valuation stocks Companies with strong fundamentals (high returns on invested capital)
outperform companies with poor fundamentals Stocks with positive business momentum (improving trends/rising earnings)
outperform stocks with negative momentum
2. “Characteristics-based” investment approach
Valuation, fundamentals and momentum are analyzed using a bottom-up blend of qualitative and quantitative inputs
3. Preservation of capital
Laws of compounding mathematically dictate that protecting capital is the only risk that matters
“Win by not losing”: Keep pace in rising markets, outperform in falling markets and diversify your exposure
Value equity investment philosophy…three core principles
4 THIS MATERIAL IS FOR INSTITUTIONAL/BROKER DEALER USE ONLY. NOT FOR DISTRIBUTION OR USE WITH THE PUBLIC
Robeco Boston Partners
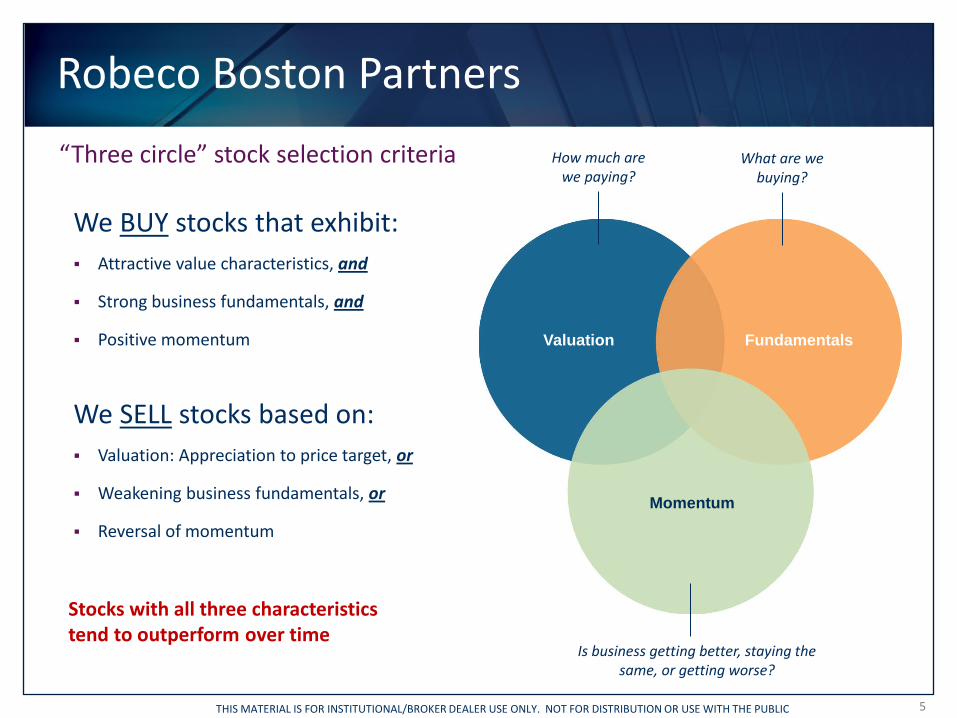
Stocks with all three characteristics tend to outperform over time
“Three circle” stock selection criteria
We BUY stocks that exhibit: Attractive value characteristics, and
Strong business fundamentals, and
Positive momentum
We SELL stocks based on: Valuation: Appreciation to price target, or
Weakening business fundamentals, or
Reversal of momentum
Fundamentals Valuation
Momentum
How much are we paying?
What are we buying?
Is business getting better, staying the same, or getting worse?
5 THIS MATERIAL IS FOR INSTITUTIONAL/BROKER DEALER USE ONLY. NOT FOR DISTRIBUTION OR USE WITH THE PUBLIC
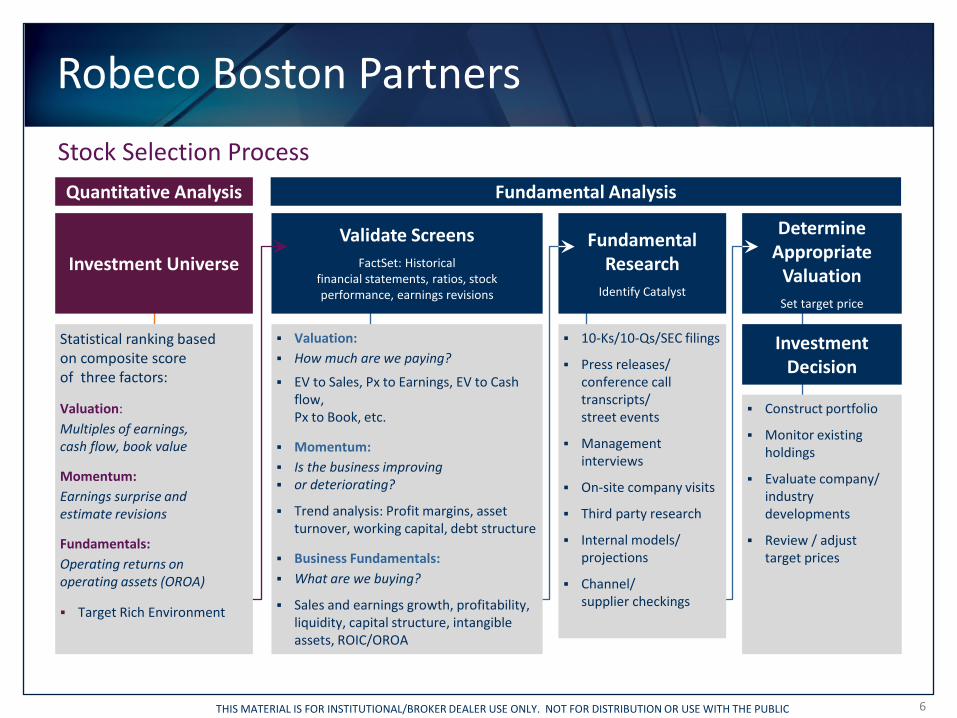
Robeco Boston Partners Stock Selection Process Quantitative Analysis Fundamental Analysis
Investment Universe Validate Screens
FactSet: Historical financial statements, ratios, stock performance, earnings revisions
Fundamental Research
Identify Catalyst
Determine Appropriate
Valuation Set target price
Investment Decision
Statistical ranking based on composite score of three factors:
Valuation: Multiples of earnings, cash flow, book value
Momentum: Earnings surprise and estimate revisions
Fundamentals: Operating returns on operating assets (OROA)
Target Rich Environment
Valuation: How much are we paying?
EV to Sales, Px to Earnings, EV to Cash flow, Px to Book, etc.
Momentum: Is the business improving or deteriorating?
Trend analysis: Profit margins, asset turnover, working capital, debt structure
Business Fundamentals: What are we buying?
Sales and earnings growth, profitability, liquidity, capital structure, intangible assets, ROIC/OROA
10-Ks/10-Qs/SEC filings
Press releases/ conference call transcripts/ street events
Management interviews
On-site company visits
Third party research
Internal models/ projections
Channel/ supplier checkings
Construct portfolio
Monitor existing holdings
Evaluate company/ industry developments
Review / adjust target prices
6 THIS MATERIAL IS FOR INSTITUTIONAL/BROKER DEALER USE ONLY. NOT FOR DISTRIBUTION OR USE WITH THE PUBLIC
Robeco Boston Partners
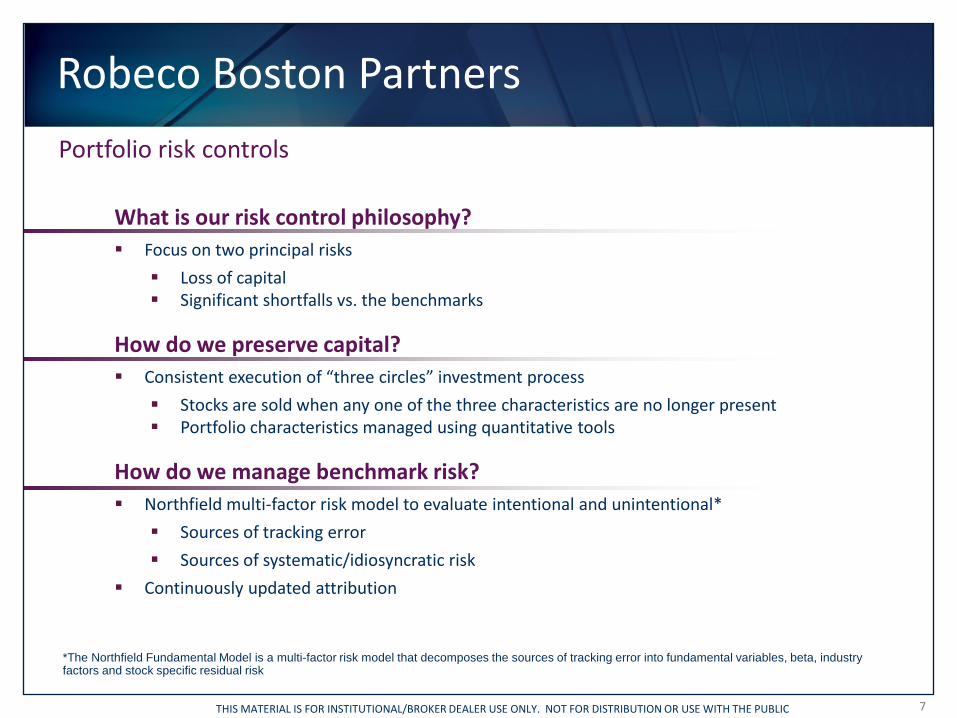
What is our risk control philosophy? Focus on two principal risks
Loss of capital Significant shortfalls vs. the benchmarks
How do we preserve capital? Consistent execution of “three circles” investment process
Stocks are sold when any one of the three characteristics are no longer present Portfolio characteristics managed using quantitative tools
How do we manage benchmark risk? Northfield multi-factor risk model to evaluate intentional and unintentional*
Sources of tracking error Sources of systematic/idiosyncratic risk
Continuously updated attribution
Portfolio risk controls
• *The Northfield Fundamental Model is a multi-factor risk model that decomposes the sources of tracking error into fundamental variables, beta, industry factors and stock specific residual risk
7 THIS MATERIAL IS FOR INSTITUTIONAL/BROKER DEALER USE ONLY. NOT FOR DISTRIBUTION OR USE WITH THE PUBLIC
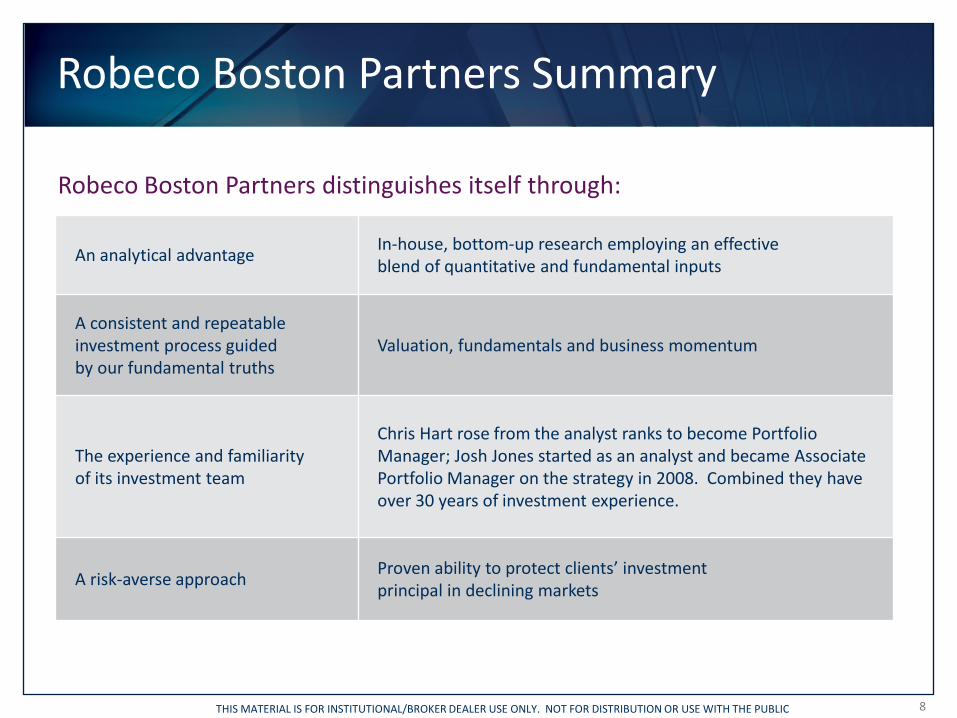
Robeco Boston Partners Summary
Robeco Boston Partners distinguishes itself through:
An analytical advantage In-house, bottom-up research employing an effective blend of quantitative and fundamental inputs
A consistent and repeatable investment process guided by our fundamental truths
Valuation, fundamentals and business momentum
The experience and familiarity of its investment team
Chris Hart rose from the analyst ranks to become Portfolio Manager; Josh Jones started as an analyst and became Associate Portfolio Manager on the strategy in 2008. Combined they have over 30 years of investment experience.
A risk-averse approach Proven ability to protect clients’ investment principal in declining markets
8 THIS MATERIAL IS FOR INSTITUTIONAL/BROKER DEALER USE ONLY. NOT FOR DISTRIBUTION OR USE WITH THE PUBLIC
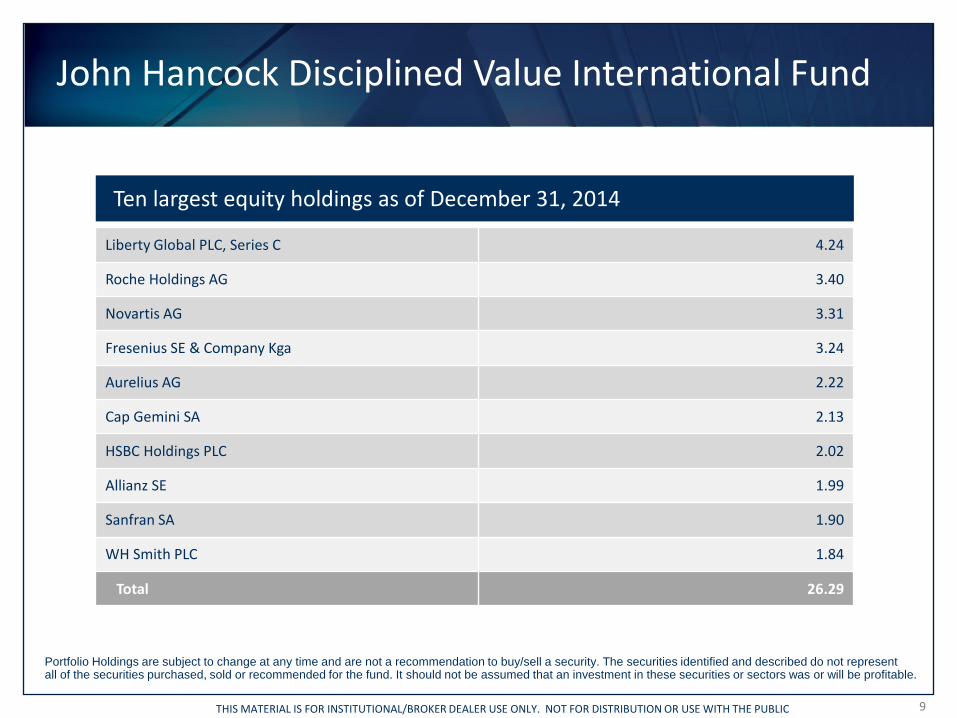
John Hancock Disciplined Value International Fund
Portfolio Holdings are subject to change at any time and are not a recommendation to buy/sell a security. The securities identified and described do not represent all of the securities purchased, sold or recommended for the fund. It should not be assumed that an investment in these securities or sectors was or will be profitable.
Liberty Global PLC, Series C 4.24
Roche Holdings AG 3.40
Novartis AG 3.31
Fresenius SE & Company Kga 3.24
Aurelius AG 2.22
Cap Gemini SA 2.13
HSBC Holdings PLC 2.02
Allianz SE 1.99
Sanfran SA 1.90
WH Smith PLC 1.84
Total 26.29
Ten largest equity holdings as of December 31, 2014
9 THIS MATERIAL IS FOR INSTITUTIONAL/BROKER DEALER USE ONLY. NOT FOR DISTRIBUTION OR USE WITH THE PUBLIC
John Hancock Disciplined Value International Fund
10
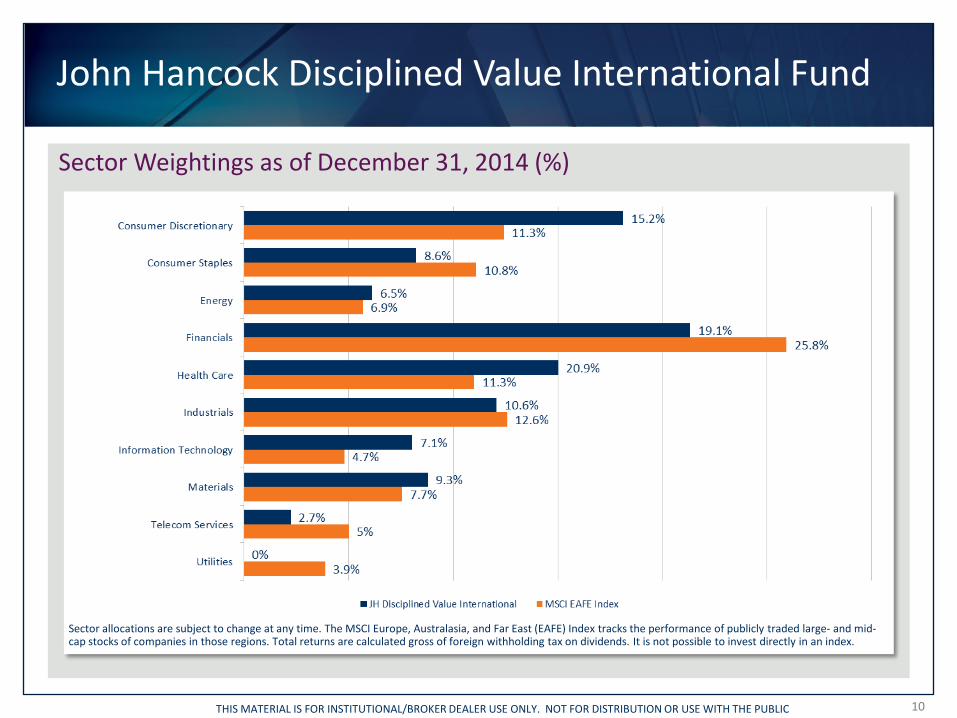
Sector allocations are subject to change at any time. The MSCI Europe, Australasia, and Far East (EAFE) Index tracks the performance of publicly traded large- and mid-cap stocks of companies in those regions. Total returns are calculated gross of foreign withholding tax on dividends. It is not possible to invest directly in an index.
Sector Weightings as of December 31, 2014 (%)
THIS MATERIAL IS FOR INSTITUTIONAL/BROKER DEALER USE ONLY. NOT FOR DISTRIBUTION OR USE WITH THE PUBLIC
John Hancock Disciplined Value International Fund
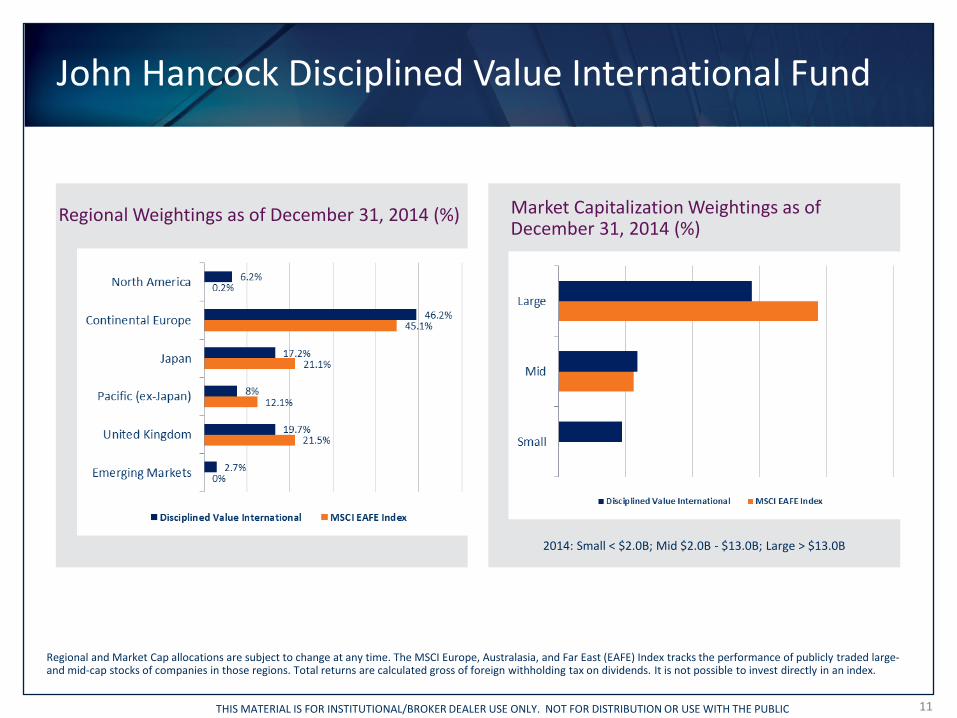
Regional and Market Cap allocations are subject to change at any time. The MSCI Europe, Australasia, and Far East (EAFE) Index tracks the performance of publicly traded large- and mid-cap stocks of companies in those regions. Total returns are calculated gross of foreign withholding tax on dividends. It is not possible to invest directly in an index.
Regional Weightings as of December 31, 2014 (%) Market Capitalization Weightings as of
2014: Small < $2.0B; Mid $2.0B - $13.0B; Large > $13.0B
December 31, 2014 (%)
11 THIS MATERIAL IS FOR INSTITUTIONAL/BROKER DEALER USE ONLY. NOT FOR DISTRIBUTION OR USE WITH THE PUBLIC
John Hancock Disciplined Value International Fund
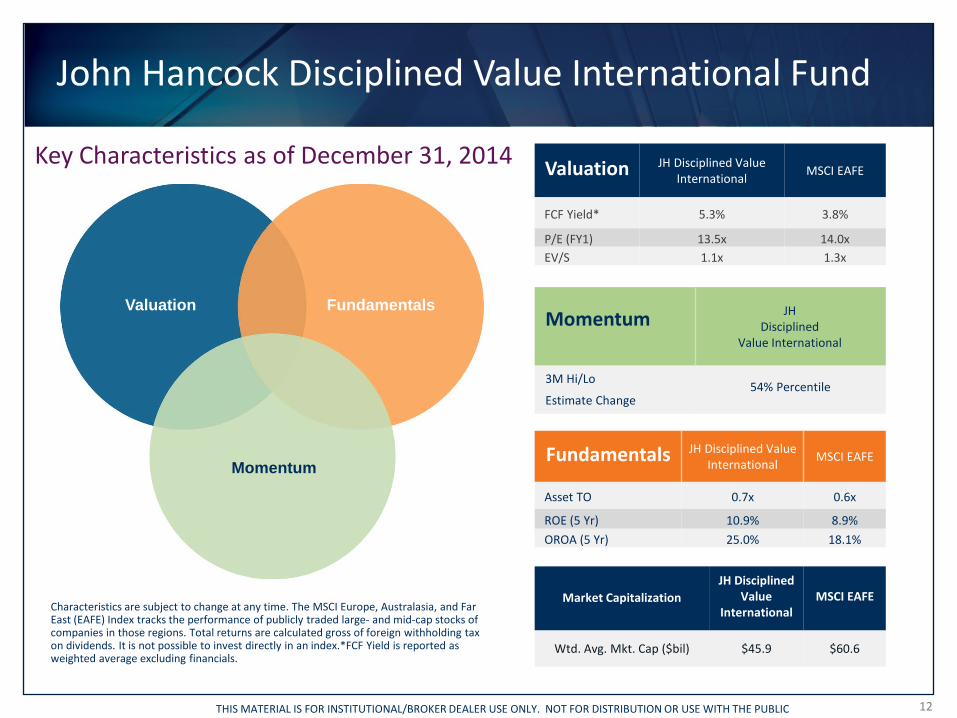
Characteristics are subject to change at any time. The MSCI Europe, Australasia, and Far East (EAFE) Index tracks the performance of publicly traded large- and mid-cap stocks of companies in those regions. Total returns are calculated gross of foreign withholding tax on dividends. It is not possible to invest directly in an index.*FCF Yield is reported as weighted average excluding financials.
Fundamentals Valuation
Momentum
Key Characteristics as of December 31, 2014 Valuation JH Disciplined Value International MSCI EAFE
FCF Yield* 5.3% 3.8%
P/E (FY1) 13.5x 14.0x EV/S 1.1x 1.3x
Fundamentals JH Disciplined Value International MSCI EAFE
Asset TO 0.7x 0.6x
ROE (5 Yr) 10.9% 8.9% OROA (5 Yr) 25.0% 18.1%
Momentum JH
Disciplined Value International
3M Hi/Lo 54% Percentile Estimate Change
Market Capitalization JH Disciplined
Value International
MSCI EAFE
Wtd. Avg. Mkt. Cap ($bil) $45.9 $60.6
12 THIS MATERIAL IS FOR INSTITUTIONAL/BROKER DEALER USE ONLY. NOT FOR DISTRIBUTION OR USE WITH THE PUBLIC
John Hancock Disciplined Value International Fund
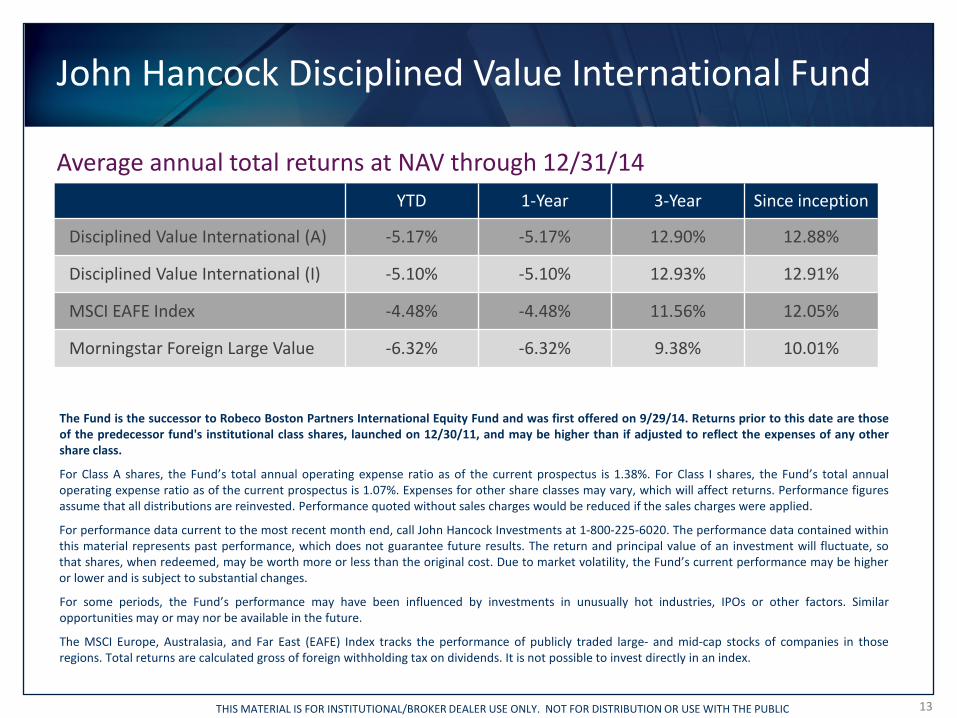
Average annual total returns at NAV through 12/31/14
The Fund is the successor to Robeco Boston Partners International Equity Fund and was first offered on 9/29/14. Returns prior to this date are those of the predecessor fund's institutional class shares, launched on 12/30/11, and may be higher than if adjusted to reflect the expenses of any other share class.
For Class A shares, the Fund’s total annual operating expense ratio as of the current prospectus is 1.38%. For Class I shares, the Fund’s total annual operating expense ratio as of the current prospectus is 1.07%. Expenses for other share classes may vary, which will affect returns. Performance figures assume that all distributions are reinvested. Performance quoted without sales charges would be reduced if the sales charges were applied.
For performance data current to the most recent month end, call John Hancock Investments at 1-800-225-6020. The performance data contained within this material represents past performance, which does not guarantee future results. The return and principal value of an investment will fluctuate, so that shares, when redeemed, may be worth more or less than the original cost. Due to market volatility, the Fund’s current performance may be higher or lower and is subject to substantial changes.
For some periods, the Fund’s performance may have been influenced by investments in unusually hot industries, IPOs or other factors. Similar opportunities may or may nor be available in the future.
The MSCI Europe, Australasia, and Far East (EAFE) Index tracks the performance of publicly traded large- and mid-cap stocks of companies in those regions. Total returns are calculated gross of foreign withholding tax on dividends. It is not possible to invest directly in an index.
YTD 1-Year 3-Year Since inception
Disciplined Value International (A) -5.17% -5.17% 12.90% 12.88%
Disciplined Value International (I) -5.10% -5.10% 12.93% 12.91%
MSCI EAFE Index -4.48% -4.48% 11.56% 12.05%
Morningstar Foreign Large Value -6.32% -6.32% 9.38% 10.01%
13 THIS MATERIAL IS FOR INSTITUTIONAL/BROKER DEALER USE ONLY. NOT FOR DISTRIBUTION OR USE WITH THE PUBLIC
Standardized Performance
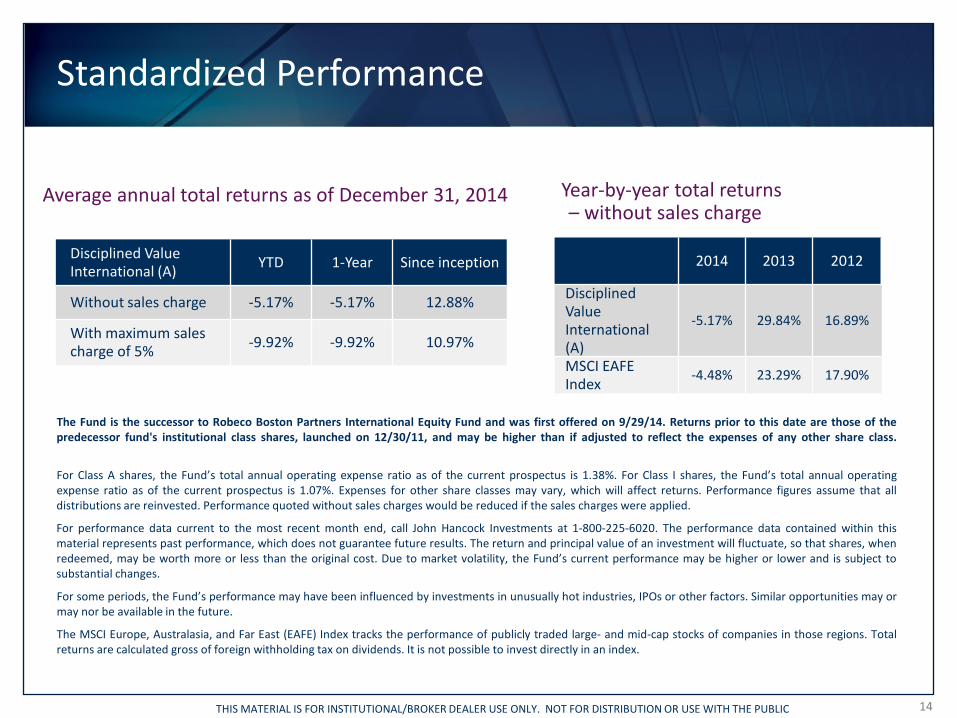
Average annual total returns as of December 31, 2014
Disciplined Value International (A) YTD 1-Year Since inception
Without sales charge -5.17% -5.17% 12.88%
With maximum sales charge of 5% -9.92% -9.92% 10.97%
2014 2013 2012
Disciplined Value International (A)
-5.17% 29.84% 16.89%
MSCI EAFE Index -4.48% 23.29% 17.90%
Year-by-year total returns
The Fund is the successor to Robeco Boston Partners International Equity Fund and was first offered on 9/29/14. Returns prior to this date are those of the predecessor fund's institutional class shares, launched on 12/30/11, and may be higher than if adjusted to reflect the expenses of any other share class.
For Class A shares, the Fund’s total annual operating expense ratio as of the current prospectus is 1.38%. For Class I shares, the Fund’s total annual operating expense ratio as of the current prospectus is 1.07%. Expenses for other share classes may vary, which will affect returns. Performance figures assume that all distributions are reinvested. Performance quoted without sales charges would be reduced if the sales charges were applied.
For performance data current to the most recent month end, call John Hancock Investments at 1-800-225-6020. The performance data contained within this material represents past performance, which does not guarantee future results. The return and principal value of an investment will fluctuate, so that shares, when redeemed, may be worth more or less than the original cost. Due to market volatility, the Fund’s current performance may be higher or lower and is subject to substantial changes.
For some periods, the Fund’s performance may have been influenced by investments in unusually hot industries, IPOs or other factors. Similar opportunities may or may nor be available in the future.
The MSCI Europe, Australasia, and Far East (EAFE) Index tracks the performance of publicly traded large- and mid-cap stocks of companies in those regions. Total returns are calculated gross of foreign withholding tax on dividends. It is not possible to invest directly in an index.
– without sales charge
14 THIS MATERIAL IS FOR INSTITUTIONAL/BROKER DEALER USE ONLY. NOT FOR DISTRIBUTION OR USE WITH THE PUBLIC

APPENDIX
15 THIS MATERIAL IS FOR INSTITUTIONAL/BROKER DEALER USE ONLY. NOT FOR DISTRIBUTION OR USE WITH THE PUBLIC
Biography Information
Christopher K. Hart, CFA Mr. Hart is an equity portfolio manager for Boston Partners Global Equity and International Equity products. Prior to this, he was an assistant portfolio manager for the Boston Partners Small Cap Value products for three years. Before that, he was a research analyst and specialized in conglomerates, engineering and construction, building, machinery, aerospace & defense, and REITs sectors of the equity market. He joined the firm from Fidelity Investments where he was a research analyst. Mr. Hart holds a B.S. degree in finance, with a concentration in corporate finance from Clemson University. He holds the Chartered Financial Analyst® designation. He has twenty-three years of investment experience.
Joshua Jones, CFA Mr. Jones is a research analyst with Robeco Boston Partners, specializing in the energy, metals and mining sectors of the equity market and is a global generalist. He is also an associate portfolio manager on Robeco Boston Partners Global and International products. He joined the firm from Cambridge Associates where he was a consulting associate specializing in hedge fund clients. Mr. Jones holds a B.A. degree in economics from Bowdoin College. He holds the Chartered Financial Analyst® designation. He has ten years of professional experience.
Joseph F. Feeney, Jr., CFA Mr. Feeney is Co-Chief Executive Officer and Chief Investment Officer for Robeco Investment Management. He is responsible for the firm’s strategic, financial and operating decisions, and all aspects of investment management including the firm’s fundamental and quantitative research groups. Prior to assuming these roles, he was Director of Research and a Portfolio Manager, also serving as a member of the Management Committee. Mr. Feeney joined the firm upon its inception in 1995 from Putnam Investments where he managed mortgage-backed securities portfolios. He began his career at the Bank of Boston where he was a loan officer specializing highly on leverage loan portfolios. Mr. Feeney holds a B.S. degree in finance (Summa Cum Laude, Phi Beta Kappa) from the University of New Hampshire and an M.B.A. with High Honors from the University of Chicago. He holds the Chartered Financial Analyst designation and is past President of the Fixed Income Management Society of Boston. He has twenty-nine years of investment experience.
PORTFOLIO MANAGEMENT TEAM
16 THIS MATERIAL IS FOR INSTITUTIONAL/BROKER DEALER USE ONLY. NOT FOR DISTRIBUTION OR USE WITH THE PUBLIC
MF 205565
Foreign investing, especially in emerging markets, has additional risks, such as currency and market volatility and political and social instability. Value stocks may decline in price. Hedging and other strategic transactions may increase volatility and result in losses if not successful. Large company stocks could fall out of favor, and illiquid securities may be difficult to sell at a price approximating their value. The stock prices of small and midsize companies can change more frequently and dramatically than those of large companies. The fund may invest its assets in a small number of issuers. Performance could suffer significantly from adverse events affecting these issuers. Please see the fund's prospectus for additional risks.
Clients should carefully consider a fund’s objectives, risks, charges and expenses before investing. The prospectus contains this and other important information about the fund. To obtain a prospectus, call John Hancock Investments at 1-800-225-6020 or visit our Web site at www.jhinvestments.com. Clients should read the prospectus carefully before investing or sending money.
John Hancock Disciplined Value International Fund
Class (A) JDIBX Class (C) JDICX Class (I) JDVIX Class (R6) JDIUX
Additional Information
17
John Hancock Funds, LLC • MEMBER FINRA|SIPC • 601 Congress Street, Boston, MA 02210-2805 • www.jhinvestments.com NOT FDIC INSURED. MAY LOSE VALUE. NO BANK GUARANTEE. NOT INSURED BY ANY GOVERNMENT AGENCY.
THIS MATERIAL IS FOR INSTITUTIONAL/BROKER DEALER USE ONLY. NOT FOR DISTRIBUTION OR USE WITH THE PUBLIC