Embed Size (px)
Citation preview
Extreme Weather, Climate Change, and Harvey
John W. Nielsen-Gammon, Texas A&M UniversityTexas State Climatologist
-8
-6
-4
-2
0
2
4
6
8
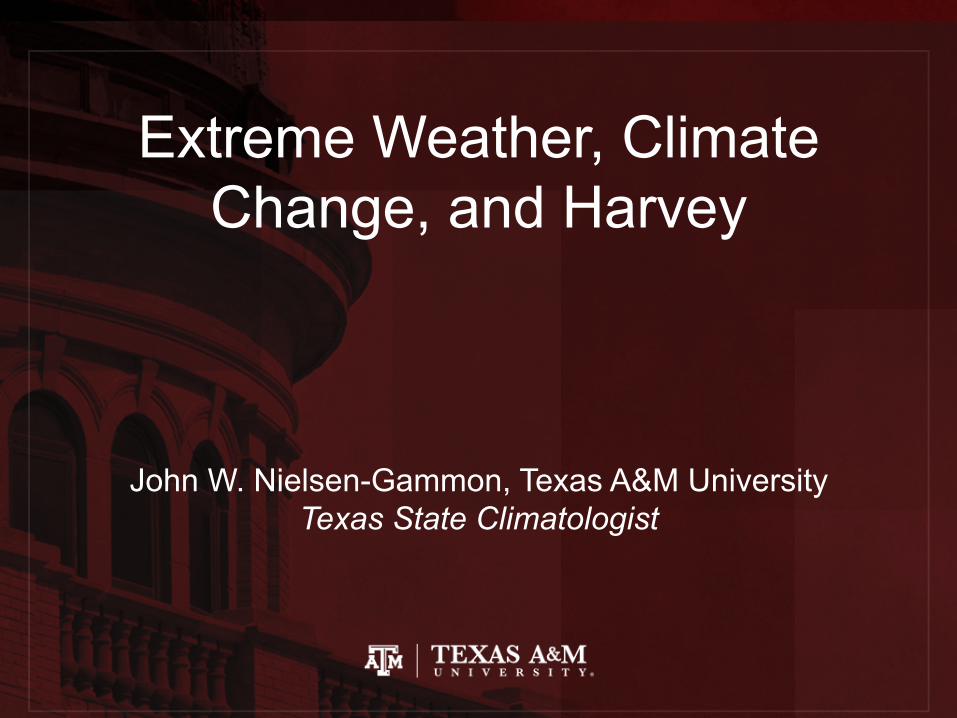
1895 1915 1935 1955 1975 1995 2015Diffe
rencefrom
20thCe
nturyAv
erage(°F)
UpperCoastSeasonalTemperatureAnomalies
Tmax+&solid,Tmin-&doGed
DJF MAM JJA SON DJF MAM JJA SON
DJF MAM JJA SON DJF MAM JJA SON

Basis of Climate Prediction
• Past observed changes• Climate model projections• Basic physical understanding of climate
system
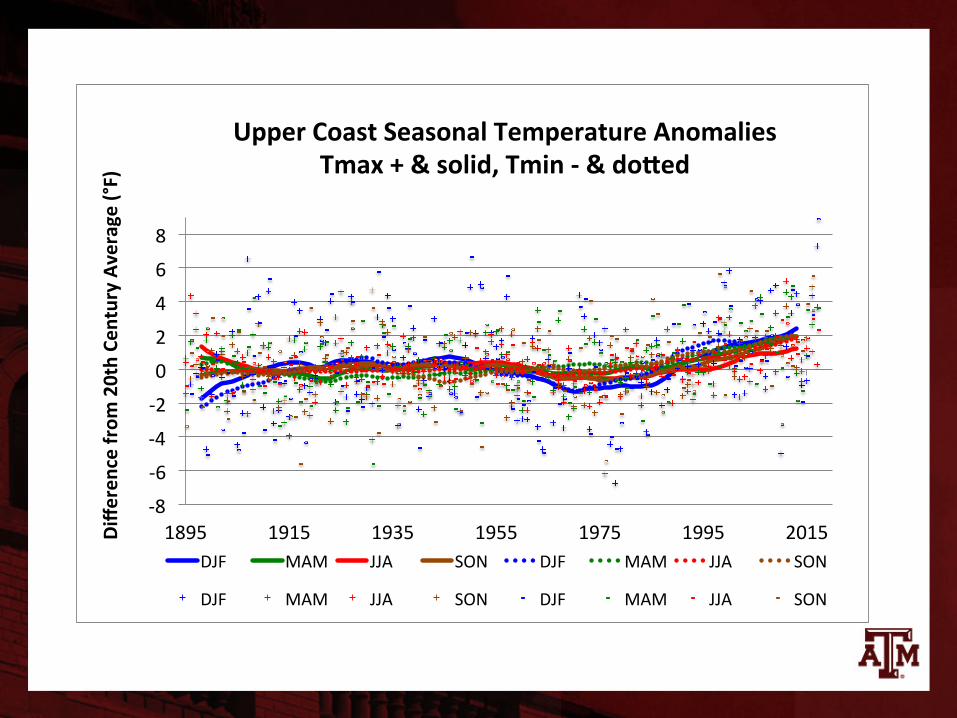
Three out of three
• Higher temperatures– More extreme highs– Fewer extreme lows
• Extreme rainfall– More extreme rain– More dry days, droughts
• Sea level rise
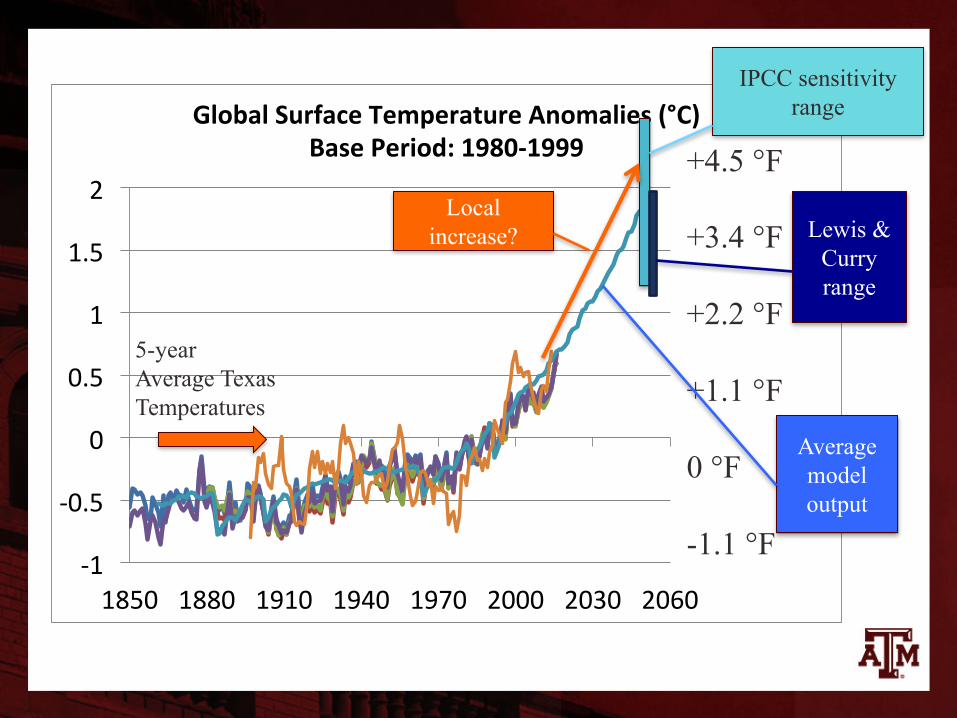
-1
-0.5
0
0.5
1
1.5
2
1850 1880 1910 1940 1970 2000 2030 2060
GlobalSurfaceTemperatureAnomalies(°C)BasePeriod:1980-1999
HadCRUTsurface
GISTEMPsurface
NGTsurface
BESTsurface
RCP8.5avg
Texas5yr
+4.5 °F
+3.4 °F
+2.2 °F
+1.1 °F
0 °F
-1.1 °F
IPCC sensitivity range
Lewis & Curry range
Average model output
Local increase?
5-year Average Texas Temperatures

John Nielsen-Gammon, Texas A&M University 6
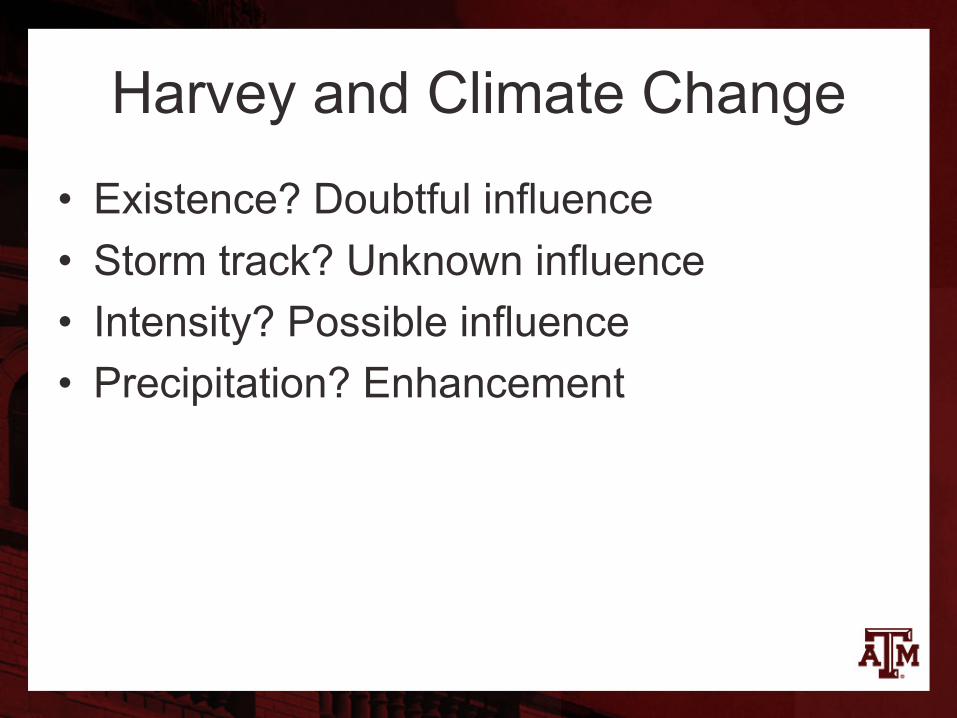
Harvey and Climate Change
• Existence? Doubtful influence• Storm track? Unknown influence• Intensity? Possible influence• Precipitation? Enhancement
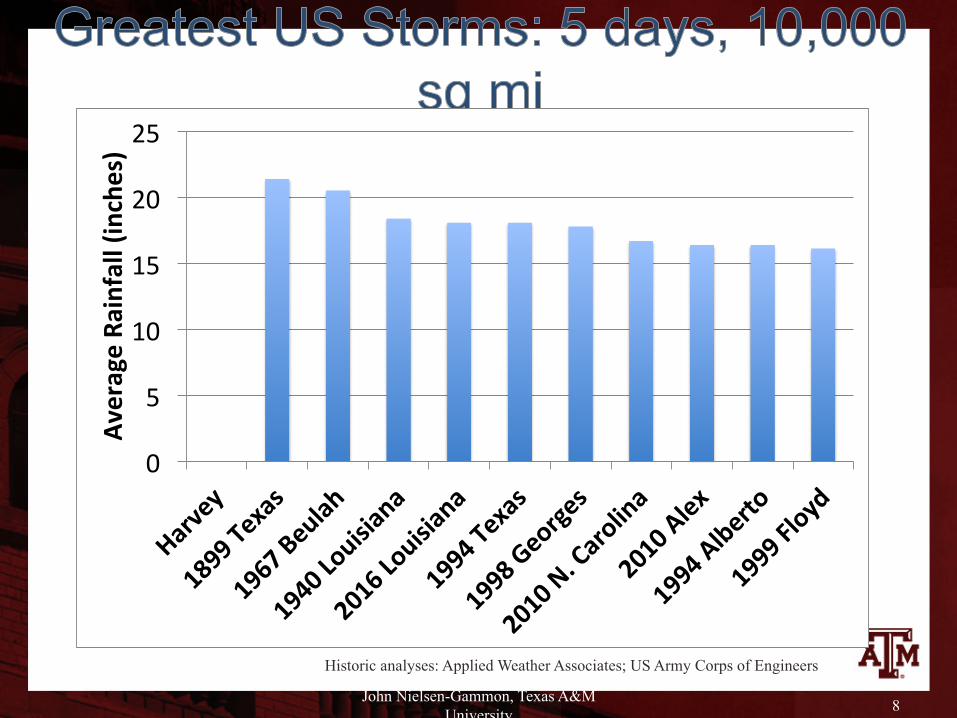
0
5
10
15
20
25Av
erageRa
infall(in
ches)
Historic analyses: Applied Weather Associates; US Army Corps of Engineers
John Nielsen-Gammon, Texas A&M University 8
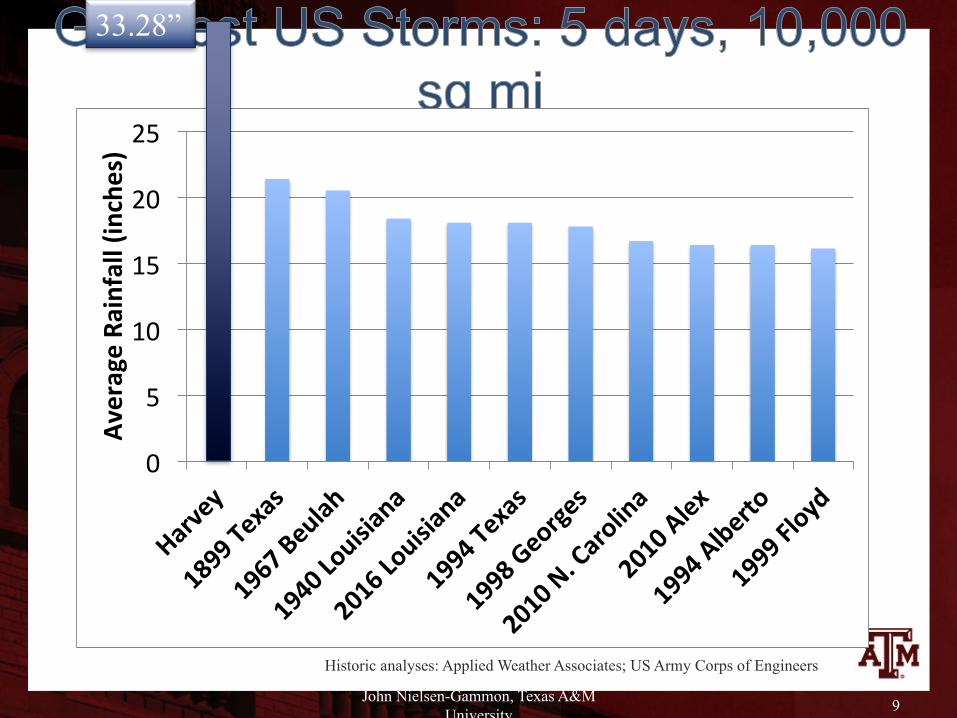
0
5
10
15
20
25Av
erageRa
infall(in
ches)
33.28”
Historic analyses: Applied Weather Associates; US Army Corps of Engineers
John Nielsen-Gammon, Texas A&M University 9
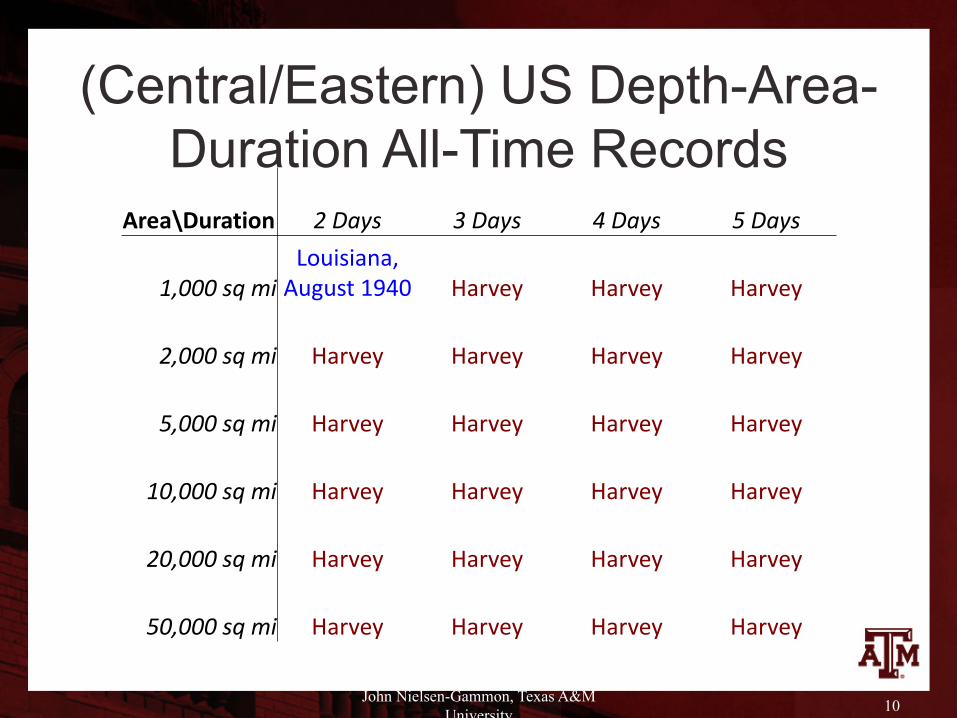
Area\Duration 2Days 3Days 4Days 5Days
1,000sq miLouisiana,August1940 Harvey Harvey Harvey
2,000sq mi Harvey Harvey Harvey Harvey
5,000sq mi Harvey Harvey Harvey Harvey
10,000sq mi Harvey Harvey Harvey Harvey
20,000sq mi Harvey Harvey Harvey Harvey
50,000sq mi Harvey Harvey Harvey Harvey
(Central/Eastern) US Depth-Area-Duration All-Time Records
John Nielsen-Gammon, Texas A&M University 10

0
5
10
15
20
25
30
AverageRa
infall(in
ches)
Historic analyses: Applied Weather AssociatesJohn Nielsen-Gammon, Texas A&M University
11

0
5
10
15
20
25
30
AverageRa
infall(in
ches)
Historic analyses: Applied Weather AssociatesJohn Nielsen-Gammon, Texas A&M University
12
Climate change rainfall contribution?

0
5
10
15
20
25
30
AverageRa
infall(in
ches)
Historic analyses: Applied Weather AssociatesJohn Nielsen-Gammon, Texas A&M University
13
Climate change rainfall contribution?100,000 homes?
10,000 homes?
1,000 homes?