Embed Size (px)
Citation preview

8/14/2019 JOHNSON COUNTY - Godley ISD - 2007 Texas School Survey of Drug and Alcohol Use
http://slidepdf.com/reader/full/johnson-county-godley-isd-2007-texas-school-survey-of-drug-and-alcohol 1/71
Godley
Spring 2007
Table T-1: How recently, if ever, have you used ..
Past
Month
School
Year
Ever
Used
Never
Used
Any tobacco product
All 10.9% 17.8% 35.7% 64.3%Grade 8 9.5% 17.1% 36.2% 63.8%
Grade 9 12.4% 18.6% 35.1% 64.9%
Cigarettes
All 9.1% 14.1% 29.8% 70.2%
Grade 8 9.8% 12.7% 28.4% 71.6%
Grade 9 8.3% 15.6% 31.3% 68.8%
Smokeless tobacco
All 4.0% 9.0% 16.9% 83.1%
Grade 8 2.9% 10.5% 18.1% 81.9%
Grade 9 5.2% 7.3% 15.6% 84.4%
Table T-2: How often do you normally use ..
Never
Used
Every
Day
Several
Times a
Week
Several
Times a
Month
About
Once a
Month
About
Once a
Year
Less than
Once a
Year
Any tobacco product?
All 68.3% 3.4% 3.5% 2.5% 4.0% 6.9% 11.4%
Grade 8 67.6% 1.9% 4.8% 1.9% 5.7% 6.7% 11.4%
Grade 9 69.1% 5.2% 2.1% 3.1% 2.1% 7.2% 11.3%
Cigarettes?
All 73.5% 2.0% 4.1% 2.1% 3.1% 5.6% 9.7%
Grade 8 75.5% 1.0% 4.9% 2.9% 2.9% 4.9% 7.8%Grade 9 71.3% 3.2% 3.2% 1.1% 3.2% 6.4% 11.7%
Smokeless tobacco?
All 83.0% 1.5% 0.5% 2.6% 1.6% 4.7% 6.2%
Grade 8 82.5% 1.0% 1.0% 1.0% 2.9% 5.8% 5.8%
Grade 9 83.5% 2.2% 0.0% 4.4% 0.0% 3.3% 6.6%
T-3: In the past 30 days, how many cigarettes have you smoked?
None <1 Per Day 1-9 Per Day
10 but < Pack
Per Day
1 Pack but <2
Packs Per Day
>2 Packs Per
Day
All 87.7% 7.4% 3.4% 1.0% 0.0% 0.5%
Grade 8 87.9% 9.3% 1.9% 0.9% 0.0% 0.0%
Grade 9 87.6% 5.2% 5.2% 1.0% 0.0% 1.0%
Secondary Report-Page

8/14/2019 JOHNSON COUNTY - Godley ISD - 2007 Texas School Survey of Drug and Alcohol Use
http://slidepdf.com/reader/full/johnson-county-godley-isd-2007-texas-school-survey-of-drug-and-alcohol 2/71
Godley
Spring 2007
Table T-4: Average age of first use of:
Grade 8 Grade 9
Tobacco
11.2 11.7
Table T-5: If you wanted some, how difficult would it be to get...
Never
Heard Of Impossible
Very
Difficult
Somewhat
Difficult
Somewhat
Easy Very Easy
Cigarettes?
All 7.8% 21.8% 8.3% 14.0% 21.2% 26.9%
Grade 8 9.1% 26.3% 12.1% 14.1% 18.2% 20.2%
Grade 9 6.4% 17.0% 4.3% 13.8% 24.5% 34.0%
Smokeless Tobacco?
All 11.5% 25.7% 11.1% 17.3% 11.0% 23.5%
Grade 8 12.0% 32.0% 16.0% 17.0% 8.0% 15.0%
Grade 9 11.0% 18.7% 5.5% 17.6% 14.3% 33.0%
Table T-6: About how many of your close friends...
None A Few Some Most ALL
Use any tobacco product?
All 43.4% 33.4% 14.6% 7.1% 1.5%
Grade 8 43.1% 38.2% 11.8% 5.9% 1.0%
Grade 9 43.8% 28.1% 17.7% 8.3% 2.1%
Smoke cigarettes?
All 56.7% 26.0% 10.7% 5.6% 1.0%
Grade 8 63.4% 23.8% 6.9% 5.0% 1.0%
Grade 9 49.5% 28.4% 14.7% 6.3% 1.1%
Use a smokeless tobacco product?
All 59.4% 26.2% 10.7% 2.0% 1.5%
Grade 8 55.4% 33.7% 8.9% 1.0% 1.0%
Grade 9 63.8% 18.1% 12.8% 3.2% 2.1%
Secondary Report-Page

8/14/2019 JOHNSON COUNTY - Godley ISD - 2007 Texas School Survey of Drug and Alcohol Use
http://slidepdf.com/reader/full/johnson-county-godley-isd-2007-texas-school-survey-of-drug-and-alcohol 3/71
Godley
Spring 2007
Table T-7: How do your parents feel about kids your age smoking cigarettes?
Strongly
Disapprove
Mildly
Disapprove Neither
Mildly
Approve
Strongly
Approve Don't know
All 82.7% 9.1% 3.1% 0.5% 0.5% 4.1%
Grade 8 83.5% 5.8% 2.9% 0.0% 1.0% 6.8%
Grade 9 81.7% 12.9% 3.2% 1.1% 0.0% 1.1%
Table T-8: How dangerous do you think it is for kids your age to use tobacco?
Very
Dangerous
Somewhat
Dangerous
Not very
Dangerous
Not at All
Dangerous Do Not Know
All 44.3% 33.6% 14.9% 4.9% 2.2%
Grade 8 51.6% 26.9% 17.2% 2.2% 2.2%
Grade 9 36.4% 40.9% 12.5% 8.0% 2.3%
Secondary Report-Page

8/14/2019 JOHNSON COUNTY - Godley ISD - 2007 Texas School Survey of Drug and Alcohol Use
http://slidepdf.com/reader/full/johnson-county-godley-isd-2007-texas-school-survey-of-drug-and-alcohol 4/71
Godley
Spring 2007
Table A-1: How recently, if ever, have you used...
Past
Month
School
Year
Ever
Used
Never
Used
Any alcohol product
All 23.6% 34.4% 68.4% 31.6%
Grade 8 17.0% 30.2% 66.0% 34.0%
Grade 9 30.9% 39.2% 71.1% 28.9%Beer
All 20.1% 29.7% 54.5% 45.5%
Grade 8 12.7% 24.5% 47.1% 52.9%
Grade 9 28.1% 35.4% 62.5% 37.5%
Wine coolers
All 11.8% 21.0% 44.5% 55.5%
Grade 8 8.9% 15.8% 35.6% 64.4%
Grade 9 14.9% 26.6% 54.3% 45.7%
Wine
All 5.7% 13.9% 41.9% 58.1%
Grade 8 4.0% 10.0% 36.0% 64.0%
Grade 9 7.5% 18.3% 48.4% 51.6%
Liquor
All 17.1% 25.2% 44.8% 55.2%
Grade 8 12.6% 18.4% 36.9% 63.1%
Grade 9 22.1% 32.6% 53.7% 46.3%
Secondary Report-Page
8/14/2019 JOHNSON COUNTY - Godley ISD - 2007 Texas School Survey of Drug and Alcohol Use
http://slidepdf.com/reader/full/johnson-county-godley-isd-2007-texas-school-survey-of-drug-and-alcohol 5/71
Godley
Spring 2007
Table A-2: How often do you normally use...
Never
Used
Every
Day
Several
Times a
Week
Several
Times a
Month
About
Once a
Month
About
Once a
Year
Less than
Once a
Year
Any alcohol product?
All 36.6% 0.0% 5.0% 4.5% 17.0% 18.5% 18.5%
Grade 8 43.3% 0.0% 3.8% 2.9% 16.3% 17.3% 16.3%Grade 9 29.2% 0.0% 6.3% 6.3% 17.7% 19.8% 20.8%
Beer?
All 46.8% 0.0% 4.6% 3.1% 14.8% 15.4% 15.4%
Grade 8 53.5% 0.0% 4.0% 2.0% 10.9% 14.9% 14.9%
Grade 9 39.4% 0.0% 5.3% 4.3% 19.1% 16.0% 16.0%
Wine coolers?
All 55.1% 0.0% 1.6% 2.1% 12.4% 13.5% 15.4%
Grade 8 65.3% 0.0% 2.0% 2.0% 10.9% 12.9% 6.9%
Grade 9 43.5% 0.0% 1.1% 2.2% 14.1% 14.1% 25.0%
Wine?
All 56.2% 0.0% 1.0% 1.6% 8.9% 15.2% 17.2%
Grade 8 68.0% 0.0% 1.0% 1.0% 6.2% 13.4% 10.3%
Grade 9 43.6% 0.0% 1.1% 2.1% 11.7% 17.0% 24.5%
Liquor?
All 57.6% 0.0% 3.1% 4.1% 11.7% 12.3% 11.3%
Grade 8 68.6% 0.0% 2.9% 2.0% 7.8% 9.8% 8.8%
Grade 9 45.2% 0.0% 3.2% 6.5% 16.1% 15.1% 14.0%
Secondary Report-Page
8/14/2019 JOHNSON COUNTY - Godley ISD - 2007 Texas School Survey of Drug and Alcohol Use
http://slidepdf.com/reader/full/johnson-county-godley-isd-2007-texas-school-survey-of-drug-and-alcohol 6/71
Godley
Spring 2007
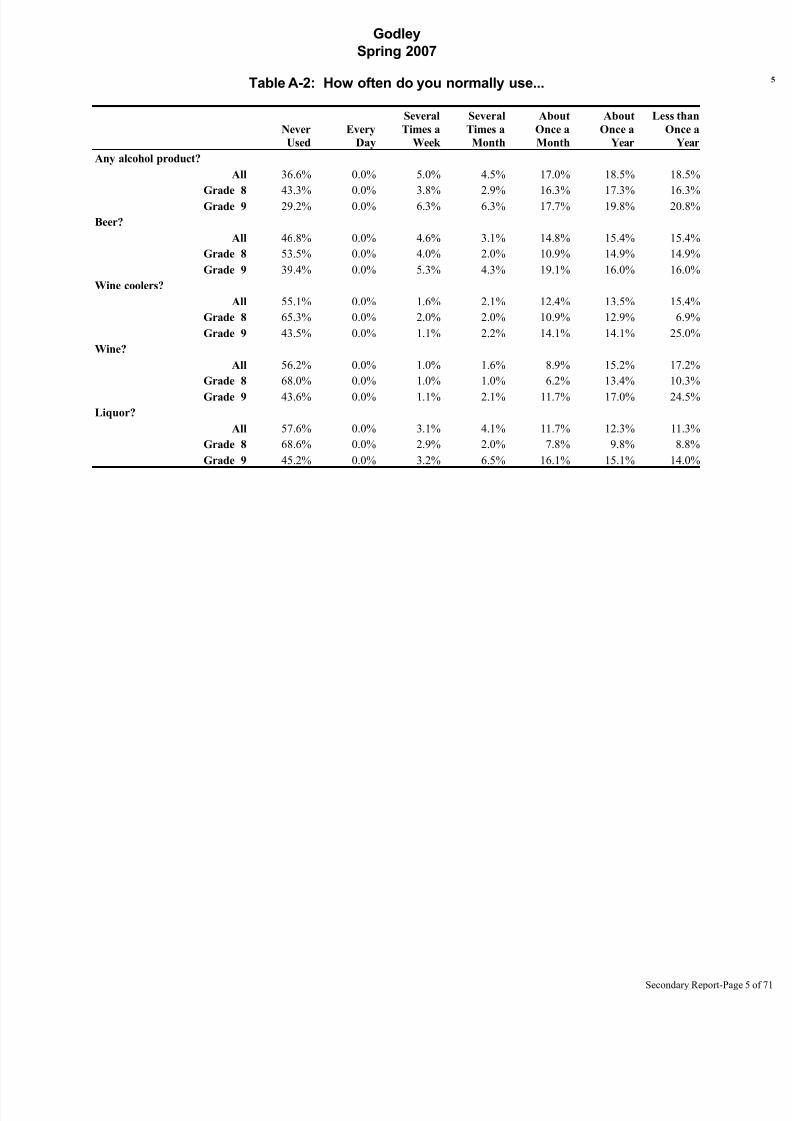
Table A-3: When you drink the following alcoholic beverages, how many drinks doyou usually have at one time, on average?
Never Ever 5 or More 1 to 4 Less than 1
Beer
All 47.3% 52.7% 10.0% 27.6% 15.1%
Grade 8 55.2% 44.8% 3.8% 24.8% 16.2%
Grade 9 38.3% 61.7% 17.0% 30.9% 13.8%Wine Coolers
All 54.2% 45.8% 7.7% 23.7% 14.4%
Grade 8 63.7% 36.3% 5.9% 19.6% 10.8%
Grade 9 43.5% 56.5% 9.8% 28.3% 18.5%
Wine
All 58.1% 41.9% 3.6% 17.4% 21.0%
Grade 8 68.0% 32.0% 1.0% 12.6% 18.4%
Grade 9 46.7% 53.3% 6.5% 22.8% 23.9%
Liquor
All 58.6% 41.4% 6.6% 23.5% 11.3%
Grade 8 70.6% 29.4% 3.9% 16.7% 8.8%
Grade 9 45.2% 54.8% 9.7% 31.2% 14.0%
Table A-4: During the past 30 days, on how many days have you had five or moredrinks of alcohol at one time?
Never/None 1 day 2 days 3 to 5 days 6 to 9 days
10 or
more days
Alcohol
All 85.8% 6.4% 3.4% 2.5% 0.5% 1.5%
Grade 8 88.8% 5.6% 2.8% 2.8% 0.0% 0.0%
Grade 9 82.5% 7.2% 4.1% 2.1% 1.0% 3.1%
Table A-5: Average age of first use of:
Grade 8 Grade 9
Alcohol
11.5 12.4
Beer
11.5 12.6
Wine Coolers
11.8 12.7
Wine
11.8 13.0
Liquor
12.1 13.0
Secondary Report-Page
8/14/2019 JOHNSON COUNTY - Godley ISD - 2007 Texas School Survey of Drug and Alcohol Use
http://slidepdf.com/reader/full/johnson-county-godley-isd-2007-texas-school-survey-of-drug-and-alcohol 7/71
Godley
Spring 2007
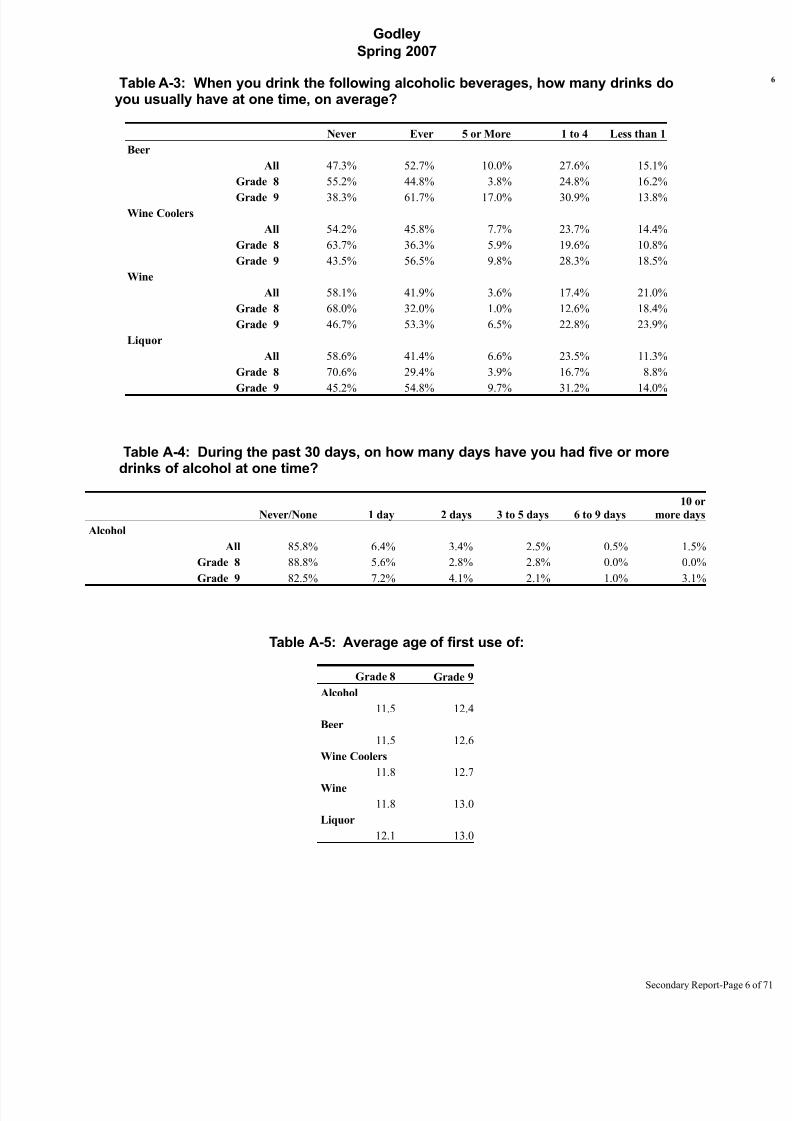
Table A-6: If you wanted some, how difficult would it be to get...
Never
Heard Of Impossible
Very
Difficult
Somewhat
Difficult
Somewhat
Easy Very Easy
Beer?
All 5.4% 17.7% 8.0% 15.0% 19.2% 34.7%
Grade 8 6.1% 22.4% 8.2% 18.4% 17.3% 27.6%
Grade 9 4.5% 12.4% 7.9% 11.2% 21.3% 42.7%Wine coolers?
All 14.6% 21.8% 9.9% 15.6% 14.5% 23.7%
Grade 8 18.8% 27.7% 10.9% 16.8% 13.9% 11.9%
Grade 9 9.8% 15.2% 8.7% 14.1% 15.2% 37.0%
Wine?
All 9.4% 26.0% 11.4% 13.0% 17.6% 22.7%
Grade 8 13.7% 32.4% 11.8% 12.7% 14.7% 14.7%
Grade 9 4.4% 18.7% 11.0% 13.2% 20.9% 31.9%
Liquor?
All 7.7% 26.3% 8.7% 12.3% 18.4% 26.6%
Grade 8 9.9% 36.6% 9.9% 8.9% 14.9% 19.8%
Grade 9 5.3% 14.9% 7.4% 16.0% 22.3% 34.0%
Table A-7: Since school began in the fall, on how many days (if any) have you...
None 1-3 Times 4-9 Times 10+ Times
Attended class while drunk on alcohol?
All 92.9% 5.1% 0.5% 1.5%
Grade 8 94.3% 3.8% 0.0% 1.9%
Grade 9 91.2% 6.6% 1.1% 1.1%
Gotten into trouble with teachers because of your drinking?
All 99.0% 1.0% 0.0% 0.0%
Grade 8 99.0% 1.0% 0.0% 0.0%
Grade 9 98.9% 1.1% 0.0% 0.0%
Secondary Report-Page
8/14/2019 JOHNSON COUNTY - Godley ISD - 2007 Texas School Survey of Drug and Alcohol Use
http://slidepdf.com/reader/full/johnson-county-godley-isd-2007-texas-school-survey-of-drug-and-alcohol 8/71
Godley
Spring 2007
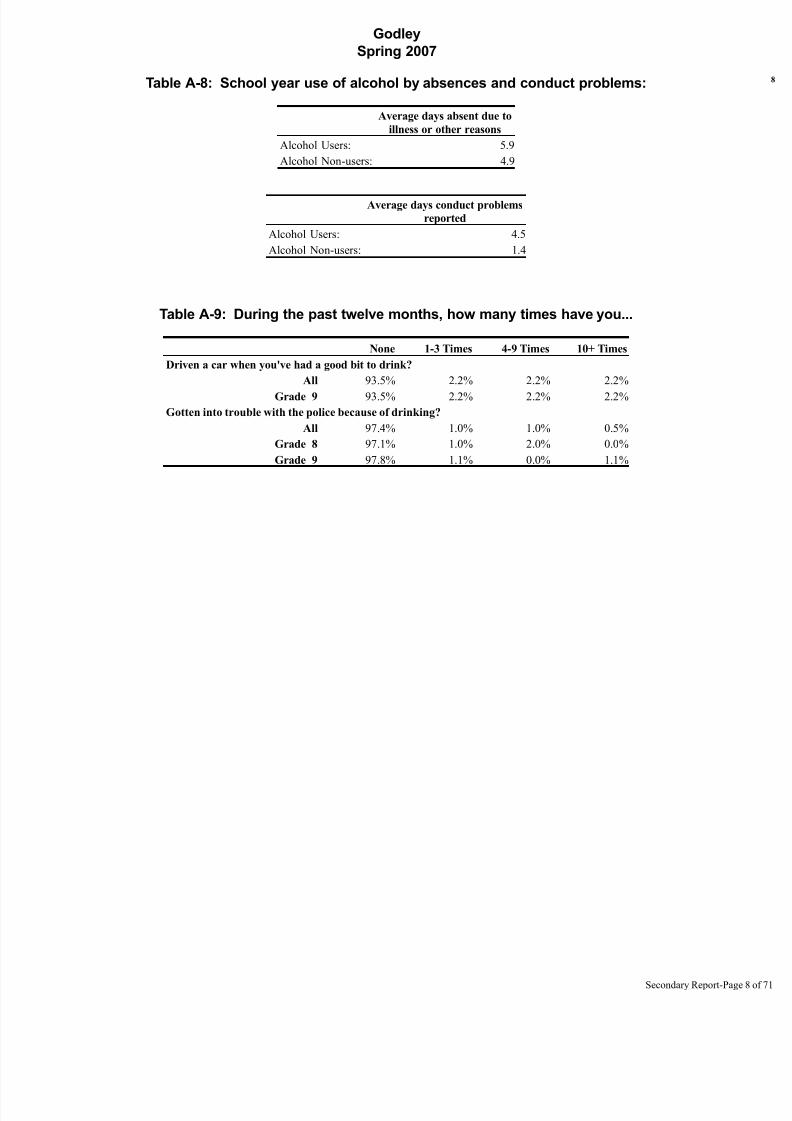
Table A-8: School year use of alcohol by absences and conduct problems:
Average days absent due to
illness or other reasons
Alcohol Users: 5.9
Alcohol Non-users: 4.9
Average days conduct problems
reported
Alcohol Users: 4.5
Alcohol Non-users: 1.4
Table A-9: During the past twelve months, how many times have you...
None 1-3 Times 4-9 Times 10+ Times
Driven a car when you've had a good bit to drink?
All 93.5% 2.2% 2.2% 2.2%
Grade 9 93.5% 2.2% 2.2% 2.2%
Gotten into trouble with the police because of drinking?
All 97.4% 1.0% 1.0% 0.5%
Grade 8 97.1% 1.0% 2.0% 0.0%
Grade 9 97.8% 1.1% 0.0% 1.1%
Secondary Report-Page

8/14/2019 JOHNSON COUNTY - Godley ISD - 2007 Texas School Survey of Drug and Alcohol Use
http://slidepdf.com/reader/full/johnson-county-godley-isd-2007-texas-school-survey-of-drug-and-alcohol 9/71
Godley
Spring 2007
Table A-10: About how many of your close friends use...
None A Few Some Most ALL
Any alcohol product?
All 26.1% 33.0% 18.5% 16.9% 5.5%
Grade 8 35.6% 33.7% 17.3% 10.6% 2.9%
Grade 9 15.6% 32.3% 19.8% 24.0% 8.3%
Beer?All 29.8% 34.4% 16.6% 13.5% 5.7%
Grade 8 41.6% 34.7% 13.9% 6.9% 3.0%
Grade 9 16.5% 34.1% 19.8% 20.9% 8.8%
Wine coolers?
All 51.5% 24.0% 14.1% 7.3% 3.1%
Grade 8 62.6% 20.2% 11.1% 5.1% 1.0%
Grade 9 39.1% 28.3% 17.4% 9.8% 5.4%
Wine?
All 59.3% 23.5% 7.8% 6.2% 3.1%
Grade 8 71.7% 17.2% 6.1% 3.0% 2.0%
Grade 9 45.7% 30.4% 9.8% 9.8% 4.3%
Liquor?All 45.1% 21.7% 15.6% 12.6% 5.0%
Grade 8 56.9% 19.6% 13.7% 6.9% 2.9%
Grade 9 32.3% 24.0% 17.7% 18.8% 7.3%
Table A-11: During the past twelve months, how many times have you...
None 1-3 Times 4-9 Times 10+ Times
Had difficulties of any kind with your friends because of your drinking?
All 91.3% 6.1% 2.0% 0.5%
Grade 8 90.4% 7.7% 1.9% 0.0%
Grade 9 92.4% 4.3% 2.2% 1.1%
Been criticized by someone you were dating because of drinking?
All 93.2% 5.2% 0.5% 1.1%
Grade 8 94.0% 4.0% 1.0% 1.0%
Grade 9 92.2% 6.7% 0.0% 1.1%
Secondary Report-Page

8/14/2019 JOHNSON COUNTY - Godley ISD - 2007 Texas School Survey of Drug and Alcohol Use
http://slidepdf.com/reader/full/johnson-county-godley-isd-2007-texas-school-survey-of-drug-and-alcohol 10/71
Godley
Spring 2007
Table A-12: Thinking of parties you attended this school year, how often wasalcohol used?
Never Seldom
Half
the Time
Most
of the Time Always Don't know
Didn't
attend
All 38.6% 17.5% 5.5% 9.9% 10.9% 2.5% 15.0%
Grade 8 50.0% 20.8% 3.8% 4.7% 5.7% 2.8% 12.3%
Grade 9 25.5% 13.8% 7.4% 16.0% 17.0% 2.1% 18.1%
Table A-13: How often, if ever, do you get alcoholic beverages from..
Do Not Drink Never Seldom
Most of
the Time Always
At home
All 44.0% 23.2% 26.2% 5.0% 1.5%
Grade 8 50.0% 23.1% 20.2% 4.8% 1.9%
Grade 9 37.2% 23.4% 33.0% 5.3% 1.1%
From friends
All 38.6% 26.1% 20.3% 8.3% 6.7%
Grade 8 43.7% 28.2% 16.5% 6.8% 4.9%
Grade 9 32.6% 23.6% 24.7% 10.1% 9.0%
From a store
All 41.2% 52.4% 4.8% 1.1% 0.5%
Grade 8 42.4% 51.5% 4.0% 1.0% 1.0%
Grade 9 39.8% 53.4% 5.7% 1.1% 0.0%
At parties
All 36.9% 24.1% 17.0% 10.2% 11.7%
Grade 8 38.8% 26.2% 20.4% 8.7% 5.8%
Grade 9 34.8% 21.7% 13.0% 12.0% 18.5%
Other source
All 38.9% 31.9% 16.4% 6.9% 5.8%Grade 8 43.0% 33.0% 13.0% 7.0% 4.0%
Grade 9 34.1% 30.7% 20.5% 6.8% 8.0%
Secondary Report-Page

8/14/2019 JOHNSON COUNTY - Godley ISD - 2007 Texas School Survey of Drug and Alcohol Use
http://slidepdf.com/reader/full/johnson-county-godley-isd-2007-texas-school-survey-of-drug-and-alcohol 11/71
Godley
Spring 2007
Table A-14: How do your parents feel about kids your age drinking beer?
Strongly
Disapprove
Mildly
Disapprove Neither
Mildly
Approve
Strongly
Approve Don't know
All 62.3% 16.3% 9.1% 6.1% 0.5% 5.7%
Grade 8 65.0% 15.5% 4.9% 4.9% 1.0% 8.7%
Grade 9 59.1% 17.2% 14.0% 7.5% 0.0% 2.2%
Table A-15: How dangerous do you think it is for kids your age to use alcohol?
Very
Dangerous
Somewhat
Dangerous
Not very
Dangerous
Not at All
Dangerous Do Not Know
All 39.1% 37.9% 17.0% 4.4% 1.6%
Grade 8 48.5% 34.0% 13.4% 3.1% 1.0%
Grade 9 28.2% 42.4% 21.2% 5.9% 2.4%
Secondary Report-Page
8/14/2019 JOHNSON COUNTY - Godley ISD - 2007 Texas School Survey of Drug and Alcohol Use
http://slidepdf.com/reader/full/johnson-county-godley-isd-2007-texas-school-survey-of-drug-and-alcohol 12/71
Godley
Spring 2007
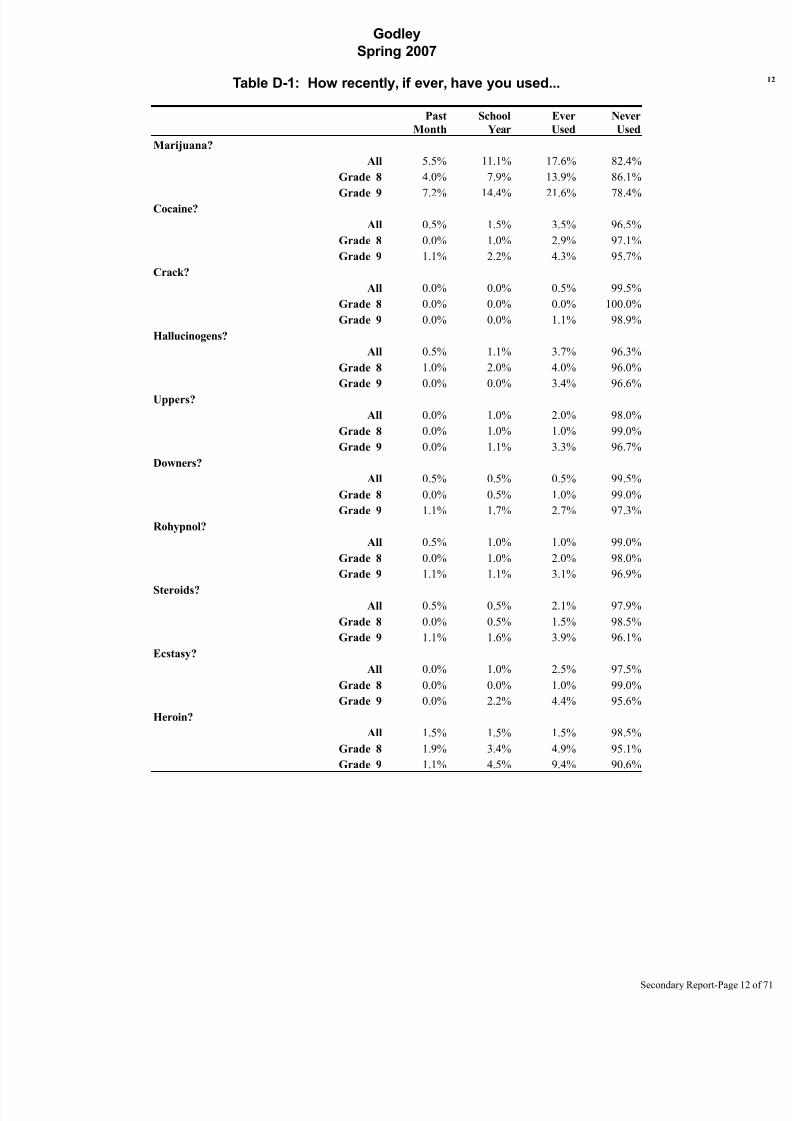
Table D-1: How recently, if ever, have you used...
Past
Month
School
Year
Ever
Used
Never
Used
Marijuana?
All 5.5% 11.1% 17.6% 82.4%
Grade 8 4.0% 7.9% 13.9% 86.1%
Grade 9 7.2% 14.4% 21.6% 78.4%Cocaine?
All 0.5% 1.5% 3.5% 96.5%
Grade 8 0.0% 1.0% 2.9% 97.1%
Grade 9 1.1% 2.2% 4.3% 95.7%
Crack?
All 0.0% 0.0% 0.5% 99.5%
Grade 8 0.0% 0.0% 0.0% 100.0%
Grade 9 0.0% 0.0% 1.1% 98.9%
Hallucinogens?
All 0.5% 1.1% 3.7% 96.3%
Grade 8 1.0% 2.0% 4.0% 96.0%
Grade 9 0.0% 0.0% 3.4% 96.6%
Uppers?
All 0.0% 1.0% 2.0% 98.0%
Grade 8 0.0% 1.0% 1.0% 99.0%
Grade 9 0.0% 1.1% 3.3% 96.7%
Downers?
All 0.5% 0.5% 0.5% 99.5%
Grade 8 0.0% 0.5% 1.0% 99.0%
Grade 9 1.1% 1.7% 2.7% 97.3%
Rohypnol?
All 0.5% 1.0% 1.0% 99.0%
Grade 8 0.0% 1.0% 2.0% 98.0%
Grade 9 1.1% 1.1% 3.1% 96.9%
Steroids?All 0.5% 0.5% 2.1% 97.9%
Grade 8 0.0% 0.5% 1.5% 98.5%
Grade 9 1.1% 1.6% 3.9% 96.1%
Ecstasy?
All 0.0% 1.0% 2.5% 97.5%
Grade 8 0.0% 0.0% 1.0% 99.0%
Grade 9 0.0% 2.2% 4.4% 95.6%
Heroin?
All 1.5% 1.5% 1.5% 98.5%
Grade 8 1.9% 3.4% 4.9% 95.1%
Grade 9 1.1% 4.5% 9.4% 90.6%
Secondary Report-Page

8/14/2019 JOHNSON COUNTY - Godley ISD - 2007 Texas School Survey of Drug and Alcohol Use
http://slidepdf.com/reader/full/johnson-county-godley-isd-2007-texas-school-survey-of-drug-and-alcohol 13/71
Godley
Spring 2007
Table D-2: How often do you normally use...
Never
Used
Every
Day
Several
Times a
Week
Several
Times a
Month
About
Once a
Month
About
Once a
Year
Less than
Once a
Year
Marijuana?
All 84.0% 1.0% 2.1% 2.1% 2.1% 2.1% 6.7%
Grade 8 88.2% 0.0% 1.0% 2.9% 2.0% 2.9% 2.9%Grade 9 79.1% 2.2% 3.3% 1.1% 2.2% 1.1% 11.0%
Cocaine?
All 97.3% 0.0% 0.0% 0.0% 0.5% 0.0% 2.1%
Grade 8 99.0% 0.0% 0.0% 0.0% 0.0% 0.0% 1.0%
Grade 9 95.3% 0.0% 0.0% 0.0% 1.2% 0.0% 3.5%
Crack?
All 99.5% 0.0% 0.0% 0.0% 0.0% 0.0% 0.5%
Grade 8 100.0% 0.0% 0.0% 0.0% 0.0% 0.0% 0.0%
Grade 9 98.9% 0.0% 0.0% 0.0% 0.0% 0.0% 1.1%
Hallucinogens?
All 97.4% 0.0% 0.5% 0.0% 0.0% 0.5% 1.6%
Grade 8 98.0% 0.0% 1.0% 0.0% 0.0% 1.0% 0.0%
Grade 9 96.6% 0.0% 0.0% 0.0% 0.0% 0.0% 3.4%
Uppers?
All 97.3% 0.0% 0.0% 0.5% 0.0% 0.5% 1.6%
Grade 8 99.0% 0.0% 0.0% 0.0% 0.0% 0.0% 1.0%
Grade 9 95.3% 0.0% 0.0% 1.2% 0.0% 1.2% 2.3%
Downers?
All 99.0% 0.0% 0.0% 0.5% 0.0% 0.0% 0.5%
Grade 8 100.0% 0.0% 0.0% 0.0% 0.0% 0.0% 0.0%
Grade 9 97.7% 0.0% 0.0% 1.2% 0.0% 0.0% 1.2%
Rohypnol?
All 99.5% 0.0% 0.0% 0.0% 0.0% 0.5% 0.0%
Grade 8 99.0% 0.0% 0.0% 0.0% 0.0% 1.0% 0.0%
Grade 9 100.0% 0.0% 0.0% 0.0% 0.0% 0.0% 0.0%Steroids?
All 99.5% 0.0% 0.0% 0.0% 0.0% 0.5% 0.0%
Grade 8 100.0% 0.0% 0.0% 0.0% 0.0% 0.0% 0.0%
Grade 9 98.9% 0.0% 0.0% 0.0% 0.0% 1.1% 0.0%
Ecstasy?
All 99.5% 0.0% 0.0% 0.0% 0.5% 0.0% 0.0%
Grade 8 100.0% 0.0% 0.0% 0.0% 0.0% 0.0% 0.0%
Grade 9 98.9% 0.0% 0.0% 0.0% 1.1% 0.0% 0.0%
Heroin?
All 100.0% 0.0% 0.0% 0.0% 0.0% 0.0% 0.0%
Grade 8 100.0% 0.0% 0.0% 0.0% 0.0% 0.0% 0.0%
Grade 9 100.0% 0.0% 0.0% 0.0% 0.0% 0.0% 0.0%
Secondary Report-Page

8/14/2019 JOHNSON COUNTY - Godley ISD - 2007 Texas School Survey of Drug and Alcohol Use
http://slidepdf.com/reader/full/johnson-county-godley-isd-2007-texas-school-survey-of-drug-and-alcohol 14/71
Godley
Spring 2007
Table D-3: Average age of first use of:
Grade 8 Grade 9
Marijuana
12.4 13.1
Cocaine
* *
Crack * *
Hallucinogens
* *
Uppers
* *
Downers
* *
Rohypnol
* *
Steroids
* *
Ecstasy* *
Heroin
* *
Table D-4: Age of first use of marijuana by family situation:
Never 9/Under 10 to 11 12 to 13 14 to 15 16 to 17 Over 17
Two parent family
All 91.2% 0.0% 1.0% 2.9% 4.8% 0.0% 0.0%
Grade 8 95.2% 0.0% 1.6% 3.2% 0.0% 0.0% 0.0%
Grade 9 84.6% 0.0% 0.0% 2.6% 12.8% 0.0% 0.0%
Other family situation
All 69.9% 0.0% 6.0% 19.3% 4.8% 0.0% 0.0%
Grade 8 68.6% 0.0% 5.7% 22.9% 2.9% 0.0% 0.0%
Grade 9 70.8% 0.0% 6.3% 16.7% 6.3% 0.0% 0.0%
Secondary Report-Page

8/14/2019 JOHNSON COUNTY - Godley ISD - 2007 Texas School Survey of Drug and Alcohol Use
http://slidepdf.com/reader/full/johnson-county-godley-isd-2007-texas-school-survey-of-drug-and-alcohol 15/71
Godley
Spring 2007
Table D-5: If you wanted some, how difficult would it be to get..
Never
Heard Of Impossible
Very
Difficult
Somewhat
Difficult
Somewhat
Easy Very Easy
Marijuana?
All 13.0% 43.7% 7.5% 11.3% 9.1% 15.5%
Grade 8 17.2% 57.0% 3.2% 9.7% 5.4% 7.5%
Grade 9 8.6% 30.1% 11.8% 12.9% 12.9% 23.7%Cocaine?
All 11.6% 57.3% 14.7% 8.2% 4.9% 3.3%
Grade 8 15.5% 69.1% 5.2% 5.2% 3.1% 2.1%
Grade 9 7.1% 43.5% 25.9% 11.8% 7.1% 4.7%
Crack?
All 12.9% 59.5% 14.3% 5.9% 4.2% 3.2%
Grade 8 17.2% 69.7% 5.1% 4.0% 2.0% 2.0%
Grade 9 8.0% 47.7% 25.0% 8.0% 6.8% 4.5%
Hallucinogens?
All 42.0% 35.1% 10.9% 5.7% 2.1% 4.2%
Grade 8 51.0% 38.0% 3.0% 5.0% 0.0% 3.0%
Grade 9 31.9% 31.9% 19.8% 6.6% 4.4% 5.5%
Uppers?
All 50.9% 31.5% 4.4% 3.9% 3.3% 6.1%
Grade 8 57.6% 33.3% 1.0% 3.0% 1.0% 4.0%
Grade 9 42.7% 29.3% 8.5% 4.9% 6.1% 8.5%
Downers?
All 51.1% 31.3% 4.6% 3.6% 3.6% 5.7%
Grade 8 57.7% 33.7% 1.0% 2.9% 1.0% 3.8%
Grade 9 43.2% 28.4% 9.1% 4.5% 6.8% 8.0%
Rohypnol?
All 55.4% 27.2% 7.4% 3.7% 2.7% 3.7%
Grade 8 63.6% 29.3% 1.0% 3.0% 2.0% 1.0%
Grade 9 46.1% 24.7% 14.6% 4.5% 3.4% 6.7%
Steroids?All 18.5% 51.7% 12.1% 10.0% 3.7% 4.2%
Grade 8 23.3% 57.3% 8.7% 6.8% 1.9% 1.9%
Grade 9 12.6% 44.8% 16.1% 13.8% 5.7% 6.9%
Ecstasy?
All 29.8% 46.4% 10.3% 4.2% 2.6% 6.7%
Grade 8 40.8% 49.5% 1.9% 3.9% 1.9% 1.9%
Grade 9 16.9% 42.7% 20.2% 4.5% 3.4% 12.4%
Heroin?
All 20.3% 55.2% 15.0% 3.5% 2.5% 3.5%
Grade 8 24.8% 62.9% 5.7% 3.8% 0.0% 2.9%
Grade 9 15.1% 46.2% 25.8% 3.2% 5.4% 4.3%
Secondary Report-Page

8/14/2019 JOHNSON COUNTY - Godley ISD - 2007 Texas School Survey of Drug and Alcohol Use
http://slidepdf.com/reader/full/johnson-county-godley-isd-2007-texas-school-survey-of-drug-and-alcohol 16/71
Godley
Spring 2007
Table D-6: Since school began in the fall, on how many days (if any) have you..
None 1-3 Times 4-9 Times 10+ Times
Attended class while high from marijuana use?
All 95.5% 1.0% 1.5% 2.0%
Grade 8 98.1% 0.0% 0.0% 1.9%
Grade 9 92.5% 2.2% 3.2% 2.2%
Attended class while high from use of some other drug?All 94.5% 4.5% 0.0% 1.0%
Grade 8 97.2% 0.9% 0.0% 1.9%
Grade 9 91.5% 8.5% 0.0% 0.0%
Gotten into trouble with teachers because of your drug use?
All 98.5% 1.5% 0.0% 0.0%
Grade 8 100.0% 0.0% 0.0% 0.0%
Grade 9 96.8% 3.2% 0.0% 0.0%
Secondary Report-Page

8/14/2019 JOHNSON COUNTY - Godley ISD - 2007 Texas School Survey of Drug and Alcohol Use
http://slidepdf.com/reader/full/johnson-county-godley-isd-2007-texas-school-survey-of-drug-and-alcohol 17/71
Godley
Spring 2007
Table D-7: School year use of marijuana by absences and conduct problems:
Average days absent due to
illness or other reasons
Marijuana Users: 6.5
Marijuana Non-users: 5.1
Average days conduct problems
reported
Marijuana Users: 8.0
Marijuana Non-users: 1.8
Table D-8: During the past twelve months, how many times have you..
None 1-3 Times 4-9 Times 10+ Times
Driven a car when you've felt high from drugs?
All 95.6% 1.1% 1.1% 2.2%
Grade 9 95.6% 1.1% 1.1% 2.2%
Gotten into trouble with the police because of drug use?
All 98.5% 1.0% 0.0% 0.5%
Grade 8 100.0% 0.0% 0.0% 0.0%
Grade 9 96.7% 2.2% 0.0% 1.1%
Table D-9: About how many of your close friends use marijuana?
None A Few Some Most ALL
All 65.0% 16.5% 10.5% 6.0% 2.0%Grade 8 76.0% 10.6% 6.7% 5.8% 1.0%
Grade 9 52.6% 23.2% 14.7% 6.3% 3.2%
Secondary Report-Page

8/14/2019 JOHNSON COUNTY - Godley ISD - 2007 Texas School Survey of Drug and Alcohol Use
http://slidepdf.com/reader/full/johnson-county-godley-isd-2007-texas-school-survey-of-drug-and-alcohol 18/71
Godley
Spring 2007
Table D-10: During the past twelve months, how many times have you..
None 1-3 Times 4-9 Times 10+ Times
Had difficulties of any kind with your friends because of your drug use?
All 95.8% 2.6% 1.1% 0.5%
Grade 8 97.0% 2.0% 1.0% 0.0%
Grade 9 94.5% 3.3% 1.1% 1.1%
Been criticized by someone you were dating because of drug use?All 97.3% 1.6% 0.5% 0.5%
Grade 8 95.9% 3.1% 1.0% 0.0%
Grade 9 98.9% 0.0% 0.0% 1.1%
Table D-11: Thinking of parties you attended this school year, how often weremarijuana and/or other drugs used?
Never Seldom
Half
the Time
Most
of the Time Always Don't know
Didn't
attend
All 60.8% 8.9% 4.5% 3.5% 3.5% 4.0% 14.9%Grade 8 71.7% 4.7% 2.8% 2.8% 2.8% 2.8% 12.3%
Grade 9 48.4% 13.7% 6.3% 4.2% 4.2% 5.3% 17.9%
Secondary Report-Page
8/14/2019 JOHNSON COUNTY - Godley ISD - 2007 Texas School Survey of Drug and Alcohol Use
http://slidepdf.com/reader/full/johnson-county-godley-isd-2007-texas-school-survey-of-drug-and-alcohol 19/71
Godley
Spring 2007
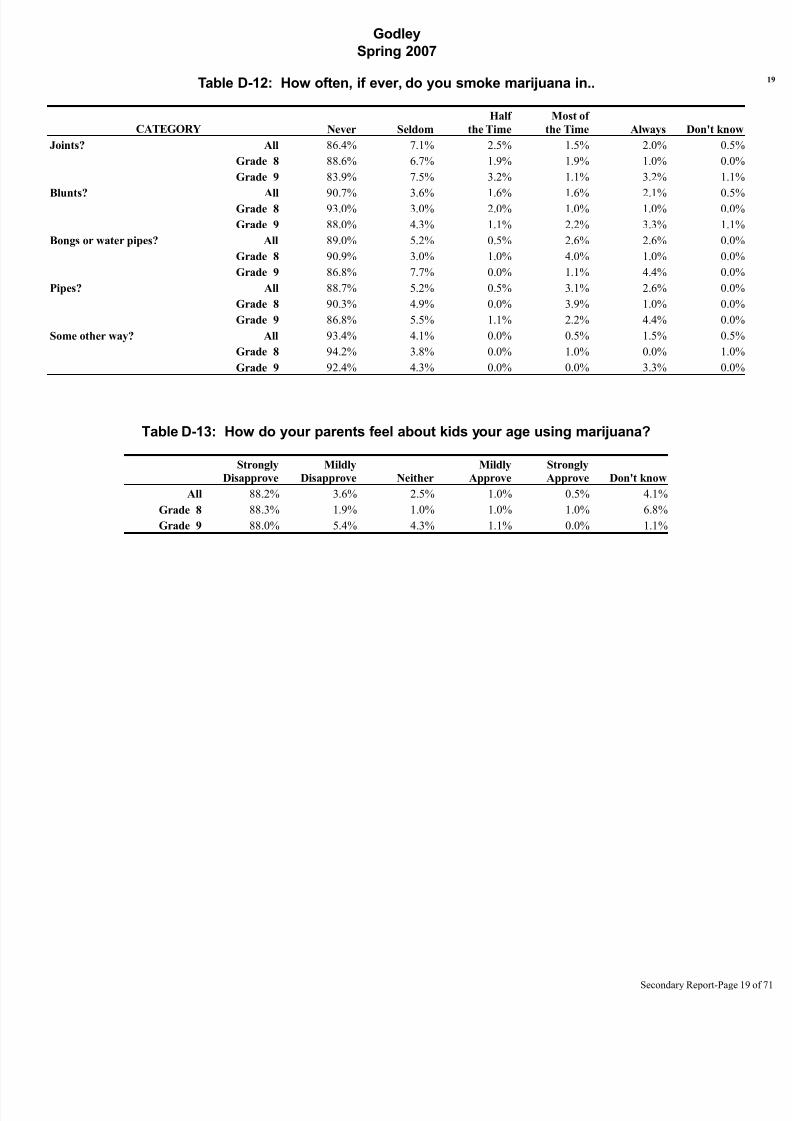
Table D-12: How often, if ever, do you smoke marijuana in..
CATEGORY Never Seldom
Half
the Time
Most of
the Time Always Don't know
Joints? All 86.4% 7.1% 2.5% 1.5% 2.0% 0.5%
Grade 8 88.6% 6.7% 1.9% 1.9% 1.0% 0.0%
Grade 9 83.9% 7.5% 3.2% 1.1% 3.2% 1.1%
Blunts? All 90.7% 3.6% 1.6% 1.6% 2.1% 0.5%Grade 8 93.0% 3.0% 2.0% 1.0% 1.0% 0.0%
Grade 9 88.0% 4.3% 1.1% 2.2% 3.3% 1.1%
Bongs or water pipes? All 89.0% 5.2% 0.5% 2.6% 2.6% 0.0%
Grade 8 90.9% 3.0% 1.0% 4.0% 1.0% 0.0%
Grade 9 86.8% 7.7% 0.0% 1.1% 4.4% 0.0%
Pipes? All 88.7% 5.2% 0.5% 3.1% 2.6% 0.0%
Grade 8 90.3% 4.9% 0.0% 3.9% 1.0% 0.0%
Grade 9 86.8% 5.5% 1.1% 2.2% 4.4% 0.0%
Some other way? All 93.4% 4.1% 0.0% 0.5% 1.5% 0.5%
Grade 8 94.2% 3.8% 0.0% 1.0% 0.0% 1.0%
Grade 9 92.4% 4.3% 0.0% 0.0% 3.3% 0.0%
Table D-13: How do your parents feel about kids your age using marijuana?
Strongly
Disapprove
Mildly
Disapprove Neither
Mildly
Approve
Strongly
Approve Don't know
All 88.2% 3.6% 2.5% 1.0% 0.5% 4.1%
Grade 8 88.3% 1.9% 1.0% 1.0% 1.0% 6.8%
Grade 9 88.0% 5.4% 4.3% 1.1% 0.0% 1.1%
Secondary Report-Page
8/14/2019 JOHNSON COUNTY - Godley ISD - 2007 Texas School Survey of Drug and Alcohol Use
http://slidepdf.com/reader/full/johnson-county-godley-isd-2007-texas-school-survey-of-drug-and-alcohol 20/71
Godley
Spring 2007
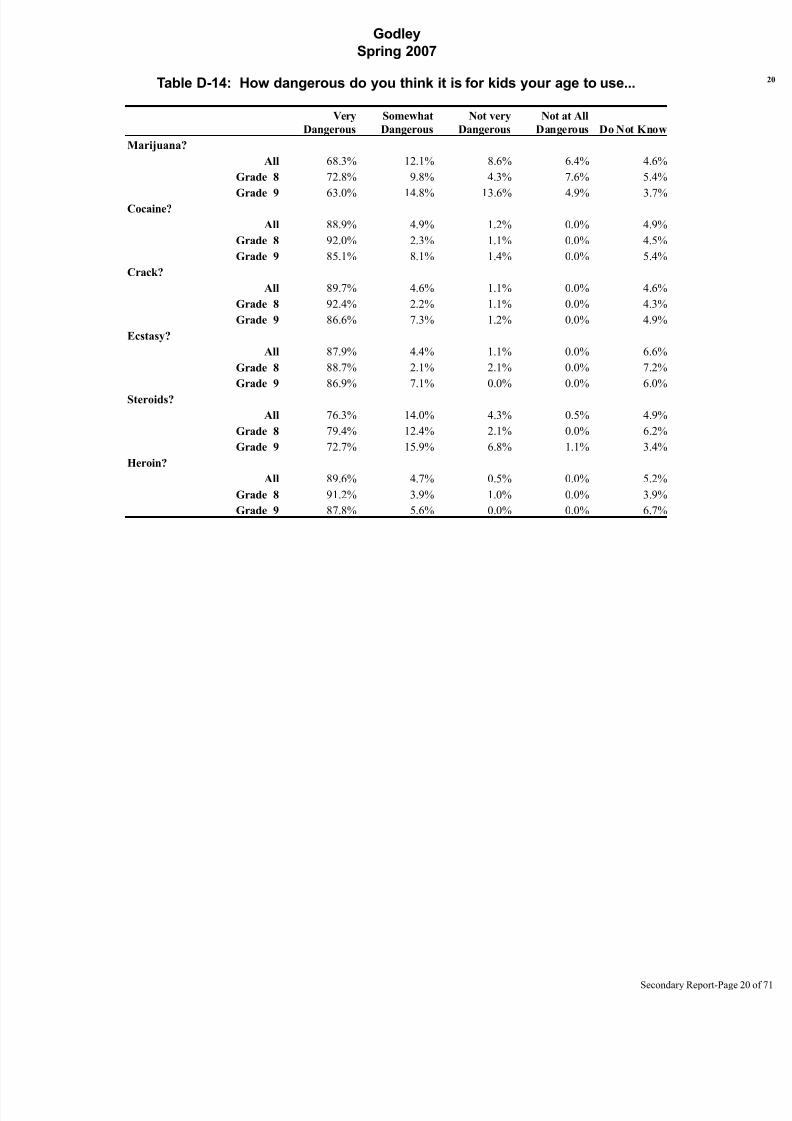
Table D-14: How dangerous do you think it is for kids your age to use...
Very
Dangerous
Somewhat
Dangerous
Not very
Dangerous
Not at All
Dangerous Do Not Know
Marijuana?
All 68.3% 12.1% 8.6% 6.4% 4.6%
Grade 8 72.8% 9.8% 4.3% 7.6% 5.4%
Grade 9 63.0% 14.8% 13.6% 4.9% 3.7%Cocaine?
All 88.9% 4.9% 1.2% 0.0% 4.9%
Grade 8 92.0% 2.3% 1.1% 0.0% 4.5%
Grade 9 85.1% 8.1% 1.4% 0.0% 5.4%
Crack?
All 89.7% 4.6% 1.1% 0.0% 4.6%
Grade 8 92.4% 2.2% 1.1% 0.0% 4.3%
Grade 9 86.6% 7.3% 1.2% 0.0% 4.9%
Ecstasy?
All 87.9% 4.4% 1.1% 0.0% 6.6%
Grade 8 88.7% 2.1% 2.1% 0.0% 7.2%
Grade 9 86.9% 7.1% 0.0% 0.0% 6.0%
Steroids?
All 76.3% 14.0% 4.3% 0.5% 4.9%
Grade 8 79.4% 12.4% 2.1% 0.0% 6.2%
Grade 9 72.7% 15.9% 6.8% 1.1% 3.4%
Heroin?
All 89.6% 4.7% 0.5% 0.0% 5.2%
Grade 8 91.2% 3.9% 1.0% 0.0% 3.9%
Grade 9 87.8% 5.6% 0.0% 0.0% 6.7%
Secondary Report-Page

8/14/2019 JOHNSON COUNTY - Godley ISD - 2007 Texas School Survey of Drug and Alcohol Use
http://slidepdf.com/reader/full/johnson-county-godley-isd-2007-texas-school-survey-of-drug-and-alcohol 21/71
Godley
Spring 2007
Table D-15: How recently, if ever, have you taken...
Past
Month
School
Year
Ever
Used
Never
Used
DXM, Triple C?
All 1.5% 2.0% 3.6% 96.4%
Grade 8 1.0% 1.9% 4.9% 95.1%
Grade 9 2.1% 2.1% 2.1% 97.9%Codeine?
All 1.5% 2.5% 3.1% 96.9%
Grade 8 1.0% 1.9% 2.9% 97.1%
Grade 9 2.2% 3.3% 3.3% 96.7%
Secondary Report-Page

8/14/2019 JOHNSON COUNTY - Godley ISD - 2007 Texas School Survey of Drug and Alcohol Use
http://slidepdf.com/reader/full/johnson-county-godley-isd-2007-texas-school-survey-of-drug-and-alcohol 22/71
Godley
Spring 2007
Table I-1: How recently, if ever, have you used...
Past
Month
School
Year
Ever
Used
Never
Used
Any inhalant?
All 4.4% 6.9% 14.3% 85.7%
Grade 8 4.7% 6.6% 16.0% 84.0%
Grade 9 4.1% 7.2% 12.4% 87.6%Liquid or spray paint?
All 0.0% 1.5% 6.5% 93.5%
Grade 8 0.0% 1.0% 7.6% 92.4%
Grade 9 0.0% 2.1% 5.3% 94.7%
Whiteout, correction fld?
All 0.0% 2.5% 6.5% 93.5%
Grade 8 0.0% 2.8% 8.5% 91.5%
Grade 9 0.0% 2.1% 4.3% 95.7%
Gasoline?
All 1.0% 2.0% 4.5% 95.5%
Grade 8 0.0% 1.0% 4.8% 95.2%
Grade 9 2.2% 3.2% 4.3% 95.7%
Freon?
All 0.5% 1.0% 1.6% 98.4%
Grade 8 0.0% 1.0% 2.0% 98.0%
Grade 9 1.1% 1.1% 1.1% 98.9%
Poppers, Locker Room?
All 0.5% 0.5% 1.5% 98.5%
Grade 8 0.0% 0.5% 1.5% 98.5%
Grade 9 1.1% 1.6% 2.7% 97.3%
Glue?
All 1.0% 1.6% 2.6% 97.4%
Grade 8 1.0% 1.9% 3.8% 96.2%
Grade 9 1.1% 1.1% 1.1% 98.9%
Paint,lacquer thinner?All 0.0% 0.5% 2.6% 97.4%
Grade 8 0.0% 0.0% 1.9% 98.1%
Grade 9 0.0% 1.1% 3.3% 96.7%
Nitrous oxide?
All 3.1% 3.1% 6.2% 93.8%
Grade 8 3.8% 6.9% 9.8% 90.2%
Grade 9 2.2% 9.1% 12.5% 87.5%
Octane booster?
All 1.5% 1.5% 1.5% 98.5%
Grade 8 1.9% 3.4% 5.0% 95.0%
Grade 9 1.1% 4.5% 9.5% 90.5%
Other sprays?All 0.0% 1.0% 4.6% 95.4%
Grade 8 0.0% 1.9% 7.7% 92.3%
Grade 9 0.0% 0.0% 1.1% 98.9%
Other inhalants?
All 1.0% 4.0% 9.1% 90.9%
Grade 8 1.0% 2.9% 10.5% 89.5%
Grade 9 1.1% 5.3% 7.4% 92.6%
Secondary Report-Page
8/14/2019 JOHNSON COUNTY - Godley ISD - 2007 Texas School Survey of Drug and Alcohol Use
http://slidepdf.com/reader/full/johnson-county-godley-isd-2007-texas-school-survey-of-drug-and-alcohol 23/71
Godley
Spring 2007
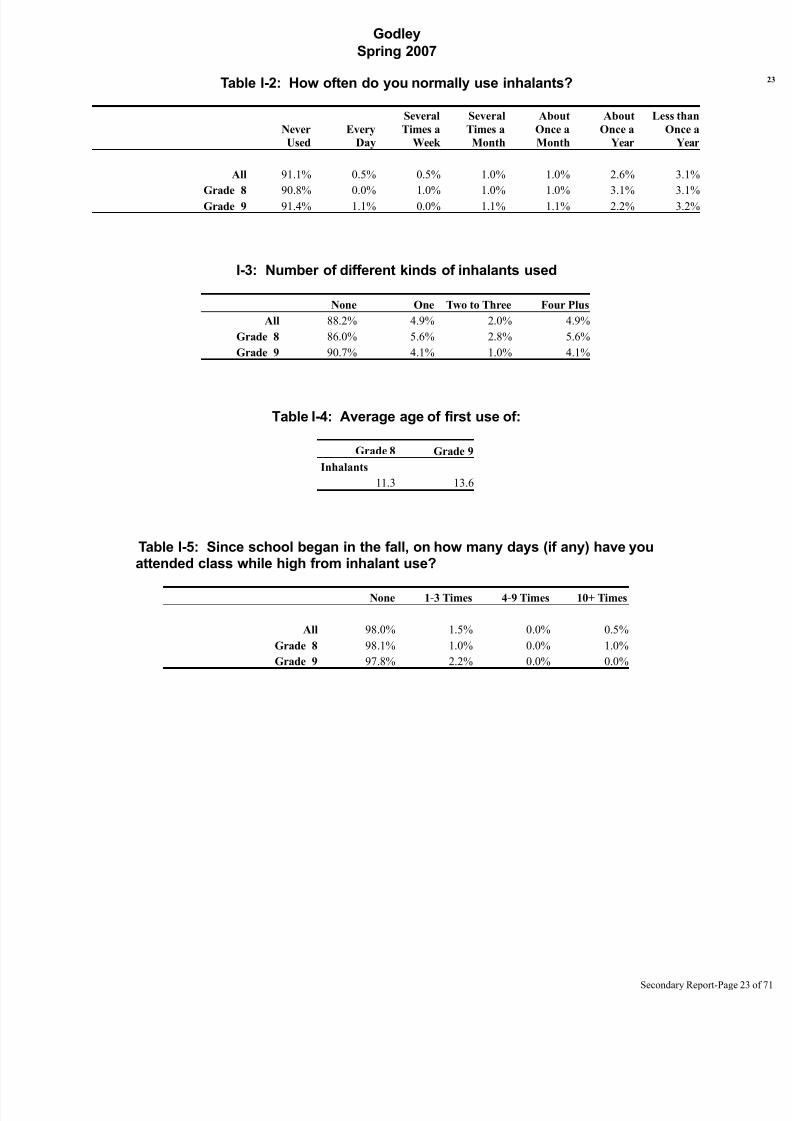
Table I-2: How often do you normally use inhalants?
Never
Used
Every
Day
Several
Times a
Week
Several
Times a
Month
About
Once a
Month
About
Once a
Year
Less than
Once a
Year
All 91.1% 0.5% 0.5% 1.0% 1.0% 2.6% 3.1%
Grade 8 90.8% 0.0% 1.0% 1.0% 1.0% 3.1% 3.1%Grade 9 91.4% 1.1% 0.0% 1.1% 1.1% 2.2% 3.2%
I-3: Number of different kinds of inhalants used
None One Two to Three Four Plus
All 88.2% 4.9% 2.0% 4.9%
Grade 8 86.0% 5.6% 2.8% 5.6%
Grade 9 90.7% 4.1% 1.0% 4.1%
Table I-4: Average age of first use of:
Grade 8 Grade 9
Inhalants
11.3 13.6
Table I-5: Since school began in the fall, on how many days (if any) have youattended class while high from inhalant use?
None 1-3 Times 4-9 Times 10+ Times
All 98.0% 1.5% 0.0% 0.5%
Grade 8 98.1% 1.0% 0.0% 1.0%
Grade 9 97.8% 2.2% 0.0% 0.0%
Secondary Report-Page

8/14/2019 JOHNSON COUNTY - Godley ISD - 2007 Texas School Survey of Drug and Alcohol Use
http://slidepdf.com/reader/full/johnson-county-godley-isd-2007-texas-school-survey-of-drug-and-alcohol 24/71
Godley
Spring 2007
Table I-6: School year use of inhalants by absences and conduct problems:
Average days absent due to
illness or other reasons
Inhalants Users: 6.2
Inhalants Non-users: 5.2
Average days conduct problems
reported
Inhalants Users: 6.1
Inhalants Non-users: 2.2
Table I-7: About how many of your close friends use inhalants?
None A Few Some Most ALL
All 88.1% 6.7% 3.6% 1.0% 0.5%
Grade 8 87.1% 5.9% 5.0% 2.0% 0.0%
Grade 9 89.2% 7.5% 2.2% 0.0% 1.1%
Table I-8: How dangerous do you think it is for kids your age to use inhalants?
Very
Dangerous
Somewhat
Dangerous
Not very
Dangerous
Not at All
Dangerous Do Not Know
All 82.7% 13.0% 1.9% 0.0% 2.5%
Grade 8 86.0% 7.0% 3.5% 0.0% 3.5%
Grade 9 78.7% 20.0% 0.0% 0.0% 1.3%
Secondary Report-Page

8/14/2019 JOHNSON COUNTY - Godley ISD - 2007 Texas School Survey of Drug and Alcohol Use
http://slidepdf.com/reader/full/johnson-county-godley-isd-2007-texas-school-survey-of-drug-and-alcohol 25/71
Godley
Spring 2007
Table X-1: Since school began in the fall, have you gotten any informationon drugs or alcohol from the following sources?
CATEGORY Yes
A school health class All 29.1%
Grade 8 31.1%
Grade 9 26.8%
An assembly program All 58.5%Grade 8 61.1%
Grade 9 55.6%
Guidance counselor All 43.2%
Grade 8 62.5%
Grade 9 22.0%
Science class All 21.9%
Grade 8 22.7%
Grade 9 21.0%
Social studies class All 20.2%
Grade 8 23.3%
Grade 9 16.5%
Student group session All 11.9%Grade 8 11.4%
Grade 9 12.5%
An invited school guest All 51.5%
Grade 8 54.5%
Grade 9 48.1%
Another source at school All 36.1%
Grade 8 34.4%
Grade 9 38.0%
Any school source All 70.2%
Grade 8 76.6%
Grade 9 62.9%
Secondary Report-Page

8/14/2019 JOHNSON COUNTY - Godley ISD - 2007 Texas School Survey of Drug and Alcohol Use
http://slidepdf.com/reader/full/johnson-county-godley-isd-2007-texas-school-survey-of-drug-and-alcohol 26/71
Godley
Spring 2007
Table X-2: If you had a drug or alcohol problem and needed help, who would you go to?
CATEGORY Yes
A counselor or program in All 36.8%
Grade 8 45.7%
Grade 9 26.6%
Another adult in school ( All 29.3%
Grade 8 31.1%Grade 9 27.2%
A counselor or program ou All 36.6%
Grade 8 36.0%
Grade 9 37.4%
Your parents All 71.9%
Grade 8 77.9%
Grade 9 64.8%
A medical doctor All 42.7%
Grade 8 41.6%
Grade 9 44.0%
Your friends All 74.5%
Grade 8 72.8%Grade 9 76.3%
Another adult (a relative All 69.6%
Grade 8 70.2%
Grade 9 68.9%
Table X-3: Since school began in the fall, have you sought help, other thanfrom family or friends, for problems in any way connected with your use of alcohol, marijuana, or other drugs?
CATEGORY Yes
Seek Help All 4.8%
Grade 8 4.0%
Grade 9 5.7%
Secondary Report-Page
8/14/2019 JOHNSON COUNTY - Godley ISD - 2007 Texas School Survey of Drug and Alcohol Use
http://slidepdf.com/reader/full/johnson-county-godley-isd-2007-texas-school-survey-of-drug-and-alcohol 27/71
Godley
Spring 2007
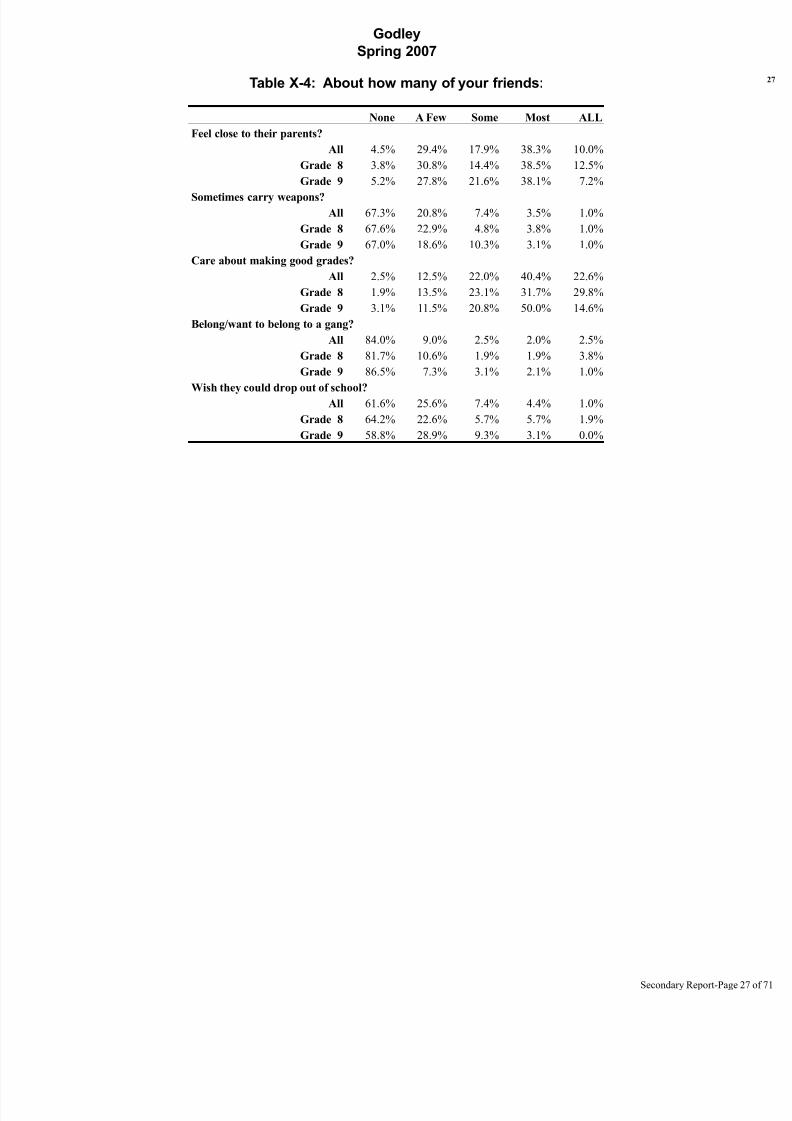
Table X-4: About how many of your friends:
None A Few Some Most ALL
Feel close to their parents?
All 4.5% 29.4% 17.9% 38.3% 10.0%
Grade 8 3.8% 30.8% 14.4% 38.5% 12.5%
Grade 9 5.2% 27.8% 21.6% 38.1% 7.2%
Sometimes carry weapons?All 67.3% 20.8% 7.4% 3.5% 1.0%
Grade 8 67.6% 22.9% 4.8% 3.8% 1.0%
Grade 9 67.0% 18.6% 10.3% 3.1% 1.0%
Care about making good grades?
All 2.5% 12.5% 22.0% 40.4% 22.6%
Grade 8 1.9% 13.5% 23.1% 31.7% 29.8%
Grade 9 3.1% 11.5% 20.8% 50.0% 14.6%
Belong/want to belong to a gang?
All 84.0% 9.0% 2.5% 2.0% 2.5%
Grade 8 81.7% 10.6% 1.9% 1.9% 3.8%
Grade 9 86.5% 7.3% 3.1% 2.1% 1.0%
Wish they could drop out of school?All 61.6% 25.6% 7.4% 4.4% 1.0%
Grade 8 64.2% 22.6% 5.7% 5.7% 1.9%
Grade 9 58.8% 28.9% 9.3% 3.1% 0.0%
Secondary Report-Page

8/14/2019 JOHNSON COUNTY - Godley ISD - 2007 Texas School Survey of Drug and Alcohol Use
http://slidepdf.com/reader/full/johnson-county-godley-isd-2007-texas-school-survey-of-drug-and-alcohol 28/71
Godley
Spring 2007
Table X-5: How safe do you feel when you are:
Very Safe
Somewha
t Safe
Not Very
Safe
Not Safe
at All
Don't
Know
In your home?
All 81.7% 15.3% 0.5% 1.0% 1.5%
Grade 8 83.0% 14.2% 0.9% 0.9% 0.9%
Grade 9 80.2% 16.7% 0.0% 1.0% 2.1%Out in your neighbourhood
All 41.6% 48.0% 4.0% 3.5% 3.0%
Grade 8 39.6% 48.1% 4.7% 3.8% 3.8%
Grade 9 43.8% 47.9% 3.1% 3.1% 2.1%
At school
All 50.5% 37.6% 4.5% 3.5% 4.0%
Grade 8 48.1% 35.8% 5.7% 4.7% 5.7%
Grade 9 53.1% 39.6% 3.1% 2.1% 2.1%
Table X-6: Since school began in the fall, have you gotten any informationon drugs or alcohol from the following sources?
CATEGORY Yes
A website or online chat All 19.4%
Grade 8 11.9%
Grade 9 28.1%
Books, magazines, poster All 57.7%
Grade 8 54.8%
Grade 9 61.1%
TV, radio, or other audi All 54.1%
Grade 8 46.7%
Grade 9 63.2%
Your parents All 54.9%
Grade 8 53.8%
Grade 9 56.2%
Secondary Report-Page

8/14/2019 JOHNSON COUNTY - Godley ISD - 2007 Texas School Survey of Drug and Alcohol Use
http://slidepdf.com/reader/full/johnson-county-godley-isd-2007-texas-school-survey-of-drug-and-alcohol 29/71
Godley
Spring 2007
Table B1: Prevalence and recency of use of selected substances by gradeAll students
Past
Month
School
Year
Ever
Used
Never
Used
Tobacco
All 10.9% 17.8% 35.7% 64.3%
Grade 8 9.5% 17.1% 36.2% 63.8%Grade 9 12.4% 18.6% 35.1% 64.9%
Alcohol
All 23.6% 34.4% 68.4% 31.6%
Grade 8 17.0% 30.2% 66.0% 34.0%
Grade 9 30.9% 39.2% 71.1% 28.9%
Inhalants
All 4.4% 6.9% 14.3% 85.7%
Grade 8 4.7% 6.6% 16.0% 84.0%
Grade 9 4.1% 7.2% 12.4% 87.6%
Any Illicit Drug
All 7.3% 13.2% 19.1% 80.9%
Grade 8 4.7% 10.3% 14.0% 86.0%
Grade 9 10.3% 16.5% 24.7% 75.3%
Marijuana
All 5.5% 11.1% 17.6% 82.4%
Grade 8 4.0% 7.9% 13.9% 86.1%
Grade 9 7.2% 14.4% 21.6% 78.4%
Marijuana Only
All 3.4% 6.4% 10.3% 89.7%
Grade 8 2.8% 4.7% 7.5% 92.5%
Grade 9 4.1% 8.2% 13.4% 86.6%
Cocaine or Crack
All 0.5% 1.5% 4.0% 96.0%
Grade 8 0.0% 0.9% 2.8% 97.2%
Grade 9 1.1% 2.1% 5.3% 94.7%Cocaine
All 0.5% 1.5% 3.5% 96.5%
Grade 8 0.0% 1.0% 2.9% 97.1%
Grade 9 1.1% 2.2% 4.3% 95.7%
Crack
All 0.0% 0.0% 0.5% 99.5%
Grade 8 0.0% 0.0% 0.0% 100.0%
Grade 9 0.0% 0.0% 1.1% 98.9%
Hallucinogens
All 0.5% 1.1% 3.7% 96.3%
Grade 8 1.0% 2.0% 4.0% 96.0%
Grade 9 0.0% 0.0% 3.4% 96.6%Uppers
All 0.0% 1.0% 2.0% 98.0%
Grade 8 0.0% 1.0% 1.0% 99.0%
Grade 9 0.0% 1.1% 3.3% 96.7%
Downers
All 0.5% 0.5% 0.5% 99.5%
Grade 8 0.0% 0.0% 0.0% 100.0%
Grade 9 1.1% 1.1% 1.1% 98.9%
Secondary Report-Page

8/14/2019 JOHNSON COUNTY - Godley ISD - 2007 Texas School Survey of Drug and Alcohol Use
http://slidepdf.com/reader/full/johnson-county-godley-isd-2007-texas-school-survey-of-drug-and-alcohol 30/71
Godley
Spring 2007
Table B1: Prevalence and recency of use of selected substances by gradeAll students(Continued)
Past
Month
School
Year
Ever
Used
Never
Used
Rohypnol
All 0.5% 1.0% 1.0% 99.0%
Grade 8 0.0% 1.0% 1.0% 99.0%
Grade 9 1.1% 1.1% 1.1% 98.9%
Steroids
All 0.5% 0.5% 2.1% 97.9%
Grade 8 0.0% 0.0% 1.0% 99.0%
Grade 9 1.1% 1.1% 3.4% 96.6%
Ecstasy
All 0.0% 1.0% 2.5% 97.5%
Grade 8 0.0% 0.0% 1.0% 99.0%
Grade 9 0.0% 2.2% 4.4% 95.6%
Heroin
All 1.5% 1.5% 1.5% 98.5%
Grade 8 1.9% 1.9% 1.9% 98.1%Grade 9 1.1% 1.1% 1.1% 98.9%
Secondary Report-Page

8/14/2019 JOHNSON COUNTY - Godley ISD - 2007 Texas School Survey of Drug and Alcohol Use
http://slidepdf.com/reader/full/johnson-county-godley-isd-2007-texas-school-survey-of-drug-and-alcohol 31/71
Godley
Spring 2007
Table B2: Prevalence and recency of use of selected substances by gradeMale students
Past
Month
School
Year
Ever
Used
Never
Used
Tobacco
All 9.9% 19.1% 33.7% 66.3%
Grade 8 5.6% 18.5% 37.0% 63.0%Grade 9 14.3% 19.6% 30.4% 69.6%
Alcohol
All 19.9% 28.2% 60.9% 39.1%
Grade 8 14.8% 29.6% 59.3% 40.7%
Grade 9 25.0% 26.8% 62.5% 37.5%
Inhalants
All 4.6% 6.4% 11.8% 88.2%
Grade 8 5.6% 7.4% 11.1% 88.9%
Grade 9 3.6% 5.4% 12.5% 87.5%
Any Illicit Drug
All 6.3% 10.9% 17.2% 82.8%
Grade 8 1.9% 7.4% 9.3% 90.7%
Grade 9 10.7% 14.3% 25.0% 75.0%
Marijuana
All 5.6% 9.3% 16.7% 83.3%
Grade 8 2.0% 5.9% 9.8% 90.2%
Grade 9 8.9% 12.5% 23.2% 76.8%
Marijuana Only
All 2.7% 4.5% 9.0% 91.0%
Grade 8 0.0% 0.0% 1.9% 98.1%
Grade 9 5.4% 8.9% 16.1% 83.9%
Cocaine or Crack
All 0.0% 1.9% 1.9% 98.1%
Grade 8 0.0% 1.9% 1.9% 98.1%
Grade 9 0.0% 1.9% 1.9% 98.1%Cocaine
All 0.0% 1.9% 1.9% 98.1%
Grade 8 0.0% 1.9% 1.9% 98.1%
Grade 9 0.0% 1.9% 1.9% 98.1%
Crack
All 0.0% 0.0% 0.0% 100.0%
Grade 8 0.0% 0.0% 0.0% 100.0%
Grade 9 0.0% 0.0% 0.0% 100.0%
Hallucinogens
All 1.0% 1.0% 4.1% 95.9%
Grade 8 2.0% 2.0% 4.1% 95.9%
Grade 9 0.0% 0.0% 4.1% 95.9%Uppers
All 0.0% 1.0% 1.9% 98.1%
Grade 8 0.0% 1.9% 1.9% 98.1%
Grade 9 0.0% 0.0% 2.0% 98.0%
Downers
All 0.0% 0.0% 0.0% 100.0%
Grade 8 0.0% 0.0% 0.0% 100.0%
Grade 9 0.0% 0.0% 0.0% 100.0%
Secondary Report-Page

8/14/2019 JOHNSON COUNTY - Godley ISD - 2007 Texas School Survey of Drug and Alcohol Use
http://slidepdf.com/reader/full/johnson-county-godley-isd-2007-texas-school-survey-of-drug-and-alcohol 32/71
Godley
Spring 2007
Table B2: Prevalence and recency of use of selected substances by gradeMale students(Continued)
Past
Month
School
Year
Ever
Used
Never
Used
Rohypnol
All 0.0% 1.0% 1.0% 99.0%
Grade 8 0.0% 1.9% 1.9% 98.1%
Grade 9 0.0% 0.0% 0.0% 100.0%
Steroids
All 0.9% 0.9% 2.9% 97.1%
Grade 8 0.0% 0.0% 1.9% 98.1%
Grade 9 2.0% 2.0% 4.0% 96.0%
Ecstasy
All 0.0% 1.0% 2.9% 97.1%
Grade 8 0.0% 0.0% 0.0% 100.0%
Grade 9 0.0% 2.0% 5.9% 94.1%
Heroin
All 1.9% 1.9% 1.9% 98.1%
Grade 8 1.9% 1.9% 1.9% 98.1%Grade 9 2.0% 2.0% 2.0% 98.0%
Secondary Report-Page

8/14/2019 JOHNSON COUNTY - Godley ISD - 2007 Texas School Survey of Drug and Alcohol Use
http://slidepdf.com/reader/full/johnson-county-godley-isd-2007-texas-school-survey-of-drug-and-alcohol 33/71

8/14/2019 JOHNSON COUNTY - Godley ISD - 2007 Texas School Survey of Drug and Alcohol Use
http://slidepdf.com/reader/full/johnson-county-godley-isd-2007-texas-school-survey-of-drug-and-alcohol 34/71
Godley
Spring 2007
Table B3: Prevalence and recency of use of selected substances by gradeFemale students(Continued)
Past
Month
School
Year
Ever
Used
Never
Used
Rohypnol
All 1.1% 1.1% 1.1% 98.9%
Grade 8 0.0% 0.0% 0.0% 100.0%
Grade 9 2.6% 2.6% 2.6% 97.4%
Steroids
All 0.0% 0.0% 1.1% 98.9%
Grade 8 0.0% 0.0% 0.0% 100.0%
Grade 9 0.0% 0.0% 2.6% 97.4%
Ecstasy
All 0.0% 1.1% 2.1% 97.9%
Grade 8 0.0% 0.0% 1.9% 98.1%
Grade 9 0.0% 2.5% 2.5% 97.5%
Heroin
All 1.1% 1.1% 1.1% 98.9%
Grade 8 1.9% 1.9% 1.9% 98.1%Grade 9 0.0% 0.0% 0.0% 100.0%
Secondary Report-Page

8/14/2019 JOHNSON COUNTY - Godley ISD - 2007 Texas School Survey of Drug and Alcohol Use
http://slidepdf.com/reader/full/johnson-county-godley-isd-2007-texas-school-survey-of-drug-and-alcohol 35/71
Godley
Spring 2007
Table B4: Prevalence and recency of use of selected substances by gradeWhite students
Past
Month
School
Year
Ever
Used
Never
Used
Tobacco
All 11.0% 19.6% 39.9% 60.1%
Grade 8 9.8% 19.5% 41.5% 58.5%Grade 9 12.3% 19.8% 38.3% 61.7%
Alcohol
All 24.9% 37.1% 70.1% 29.9%
Grade 8 18.1% 32.5% 65.1% 34.9%
Grade 9 32.1% 42.0% 75.3% 24.7%
Inhalants
All 4.9% 6.7% 13.4% 86.6%
Grade 8 4.8% 6.0% 14.5% 85.5%
Grade 9 4.9% 7.4% 12.3% 87.7%
Any Illicit Drug
All 6.6% 13.9% 19.9% 80.1%
Grade 8 3.6% 10.7% 15.5% 84.5%
Grade 9 9.9% 17.3% 24.7% 75.3%
Marijuana
All 4.9% 11.1% 18.0% 82.0%
Grade 8 2.5% 7.5% 15.0% 85.0%
Grade 9 7.4% 14.8% 21.0% 79.0%
Marijuana Only
All 3.0% 6.6% 10.9% 89.1%
Grade 8 1.2% 3.6% 7.1% 92.9%
Grade 9 4.9% 9.9% 14.8% 85.2%
Cocaine or Crack
All 0.0% 1.2% 4.3% 95.7%
Grade 8 0.0% 1.2% 3.6% 96.4%
Grade 9 0.0% 1.3% 5.0% 95.0%Cocaine
All 0.0% 1.2% 3.7% 96.3%
Grade 8 0.0% 1.2% 3.6% 96.4%
Grade 9 0.0% 1.3% 3.8% 96.2%
Crack
All 0.0% 0.0% 0.6% 99.4%
Grade 8 0.0% 0.0% 0.0% 100.0%
Grade 9 0.0% 0.0% 1.3% 98.8%
Hallucinogens
All 0.7% 1.3% 4.0% 96.0%
Grade 8 1.3% 2.5% 5.1% 94.9%
Grade 9 0.0% 0.0% 2.7% 97.3%Uppers
All 0.0% 1.3% 2.5% 97.5%
Grade 8 0.0% 1.2% 1.2% 98.8%
Grade 9 0.0% 1.3% 3.9% 96.1%
Downers
All 0.6% 0.6% 0.6% 99.4%
Grade 8 0.0% 0.0% 0.0% 100.0%
Grade 9 1.4% 1.4% 1.4% 98.6%
Secondary Report-Page

8/14/2019 JOHNSON COUNTY - Godley ISD - 2007 Texas School Survey of Drug and Alcohol Use
http://slidepdf.com/reader/full/johnson-county-godley-isd-2007-texas-school-survey-of-drug-and-alcohol 36/71
Godley
Spring 2007
Table B4: Prevalence and recency of use of selected substances by gradeWhite students(Continued)
Past
Month
School
Year
Ever
Used
Never
Used
Rohypnol
All 0.6% 1.3% 1.3% 98.7%
Grade 8 0.0% 1.2% 1.2% 98.8%
Grade 9 1.3% 1.3% 1.3% 98.7%
Steroids
All 0.6% 0.6% 1.9% 98.1%
Grade 8 0.0% 0.0% 0.0% 100.0%
Grade 9 1.3% 1.3% 4.0% 96.0%
Ecstasy
All 0.0% 0.6% 1.9% 98.1%
Grade 8 0.0% 0.0% 1.2% 98.8%
Grade 9 0.0% 1.3% 2.6% 97.4%
Heroin
All 1.9% 1.9% 1.9% 98.1%
Grade 8 2.4% 2.4% 2.4% 97.6%Grade 9 1.3% 1.3% 1.3% 98.7%
Secondary Report-Page

8/14/2019 JOHNSON COUNTY - Godley ISD - 2007 Texas School Survey of Drug and Alcohol Use
http://slidepdf.com/reader/full/johnson-county-godley-isd-2007-texas-school-survey-of-drug-and-alcohol 37/71
Godley
Spring 2007
Table B5: Prevalence and recency of use of selected substances by gradeBlack students
Table skipped because an insufficient number of cases.
Secondary Report-Page
8/14/2019 JOHNSON COUNTY - Godley ISD - 2007 Texas School Survey of Drug and Alcohol Use
http://slidepdf.com/reader/full/johnson-county-godley-isd-2007-texas-school-survey-of-drug-and-alcohol 38/71
Godley
Spring 2007
Table B5: Prevalence and recency of use of selected substances by gradeBlack students(Continued)
Table skipped because an insufficient number of cases.
Secondary Report-Page

8/14/2019 JOHNSON COUNTY - Godley ISD - 2007 Texas School Survey of Drug and Alcohol Use
http://slidepdf.com/reader/full/johnson-county-godley-isd-2007-texas-school-survey-of-drug-and-alcohol 39/71
Godley
Spring 2007
Table B6: Prevalence and recency of use of selected substances by gradeMexican/American students
Past
Month
School
Year
Ever
Used
Never
Used
Tobacco
All 9.1% 9.1% 15.2% 84.8%
Grade 8 10.0% 10.0% 20.0% 80.0%Grade 9 7.7% 7.7% 7.7% 92.3%
Alcohol
All 18.1% 24.2% 60.8% 39.2%
Grade 8 10.0% 20.0% 75.0% 25.0%
Grade 9 30.8% 30.8% 38.5% 61.5%
Inhalants
All 3.1% 9.1% 18.3% 81.7%
Grade 8 5.0% 10.0% 25.0% 75.0%
Grade 9 0.0% 7.7% 7.7% 92.3%
Any Illicit Drug
All 12.1% 12.1% 15.1% 84.9%
Grade 8 10.0% 10.0% 10.0% 90.0%
Grade 9 15.4% 15.4% 23.1% 76.9%
Marijuana
All 9.4% 12.5% 15.6% 84.4%
Grade 8 10.5% 10.5% 10.5% 89.5%
Grade 9 7.7% 15.4% 23.1% 76.9%
Marijuana Only
All 6.1% 6.1% 9.1% 90.9%
Grade 8 10.0% 10.0% 10.0% 90.0%
Grade 9 0.0% 0.0% 7.7% 92.3%
Cocaine or Crack
All 3.0% 3.0% 3.0% 97.0%
Grade 8 0.0% 0.0% 0.0% 100.0%
Grade 9 7.7% 7.7% 7.7% 92.3%Cocaine
All 3.1% 3.1% 3.1% 96.9%
Grade 8 0.0% 0.0% 0.0% 100.0%
Grade 9 7.7% 7.7% 7.7% 92.3%
Crack
All 0.0% 0.0% 0.0% 100.0%
Grade 8 0.0% 0.0% 0.0% 100.0%
Grade 9 0.0% 0.0% 0.0% 100.0%
Hallucinogens
All 0.0% 0.0% 3.1% 96.9%
Grade 8 0.0% 0.0% 0.0% 100.0%
Grade 9 0.0% 0.0% 7.7% 92.3%Uppers
All 0.0% 0.0% 0.0% 100.0%
Grade 8 0.0% 0.0% 0.0% 100.0%
Grade 9 0.0% 0.0% 0.0% 100.0%
Downers
All 0.0% 0.0% 0.0% 100.0%
Grade 8 0.0% 0.0% 0.0% 100.0%
Grade 9 0.0% 0.0% 0.0% 100.0%
Secondary Report-Page

8/14/2019 JOHNSON COUNTY - Godley ISD - 2007 Texas School Survey of Drug and Alcohol Use
http://slidepdf.com/reader/full/johnson-county-godley-isd-2007-texas-school-survey-of-drug-and-alcohol 40/71
Godley
Spring 2007
Table B6: Prevalence and recency of use of selected substances by gradeMexican/American students(Continued)
Past
Month
School
Year
Ever
Used
Never
Used
Rohypnol
All 0.0% 0.0% 0.0% 100.0%
Grade 8 0.0% 0.0% 0.0% 100.0%
Grade 9 0.0% 0.0% 0.0% 100.0%
Steroids
All 0.0% 0.0% 3.2% 96.8%
Grade 8 0.0% 0.0% 5.0% 95.0%
Grade 9 0.0% 0.0% 0.0% 100.0%
Ecstasy
All 0.0% 3.1% 3.1% 96.9%
Grade 8 0.0% 0.0% 0.0% 100.0%
Grade 9 0.0% 8.3% 8.3% 91.7%
Heroin
All 0.0% 0.0% 0.0% 100.0%
Grade 8 0.0% 0.0% 0.0% 100.0%Grade 9 0.0% 0.0% 0.0% 100.0%
Secondary Report-Page

8/14/2019 JOHNSON COUNTY - Godley ISD - 2007 Texas School Survey of Drug and Alcohol Use
http://slidepdf.com/reader/full/johnson-county-godley-isd-2007-texas-school-survey-of-drug-and-alcohol 41/71
Godley
Spring 2007
Table B7: Prevalence and recency of use of selected substances by gradeStudents reporting A grades
Past
Month
School
Year
Ever
Used
Never
Used
Tobacco
All 1.6% 4.7% 20.6% 79.4%
Grade 8 3.6% 3.6% 17.9% 82.1%Grade 9 0.0% 5.7% 22.9% 77.1%
Alcohol
All 22.1% 30.0% 64.8% 35.2%
Grade 8 10.7% 14.3% 42.9% 57.1%
Grade 9 31.4% 42.9% 82.9% 17.1%
Inhalants
All 1.6% 4.7% 9.5% 90.5%
Grade 8 3.6% 3.6% 7.1% 92.9%
Grade 9 0.0% 5.7% 11.4% 88.6%
Any Illicit Drug
All 3.1% 7.9% 12.6% 87.4%
Grade 8 0.0% 7.1% 7.1% 92.9%
Grade 9 5.7% 8.6% 17.1% 82.9%
Marijuana
All 3.1% 6.3% 11.1% 88.9%
Grade 8 0.0% 3.6% 7.1% 92.9%
Grade 9 5.7% 8.6% 14.3% 85.7%
Marijuana Only
All 1.6% 4.7% 7.9% 92.1%
Grade 8 0.0% 3.6% 3.6% 96.4%
Grade 9 2.9% 5.7% 11.4% 88.6%
Cocaine or Crack
All 0.0% 0.0% 3.2% 96.8%
Grade 8 0.0% 0.0% 3.6% 96.4%
Grade 9 0.0% 0.0% 2.9% 97.1%Cocaine
All 0.0% 0.0% 1.6% 98.4%
Grade 8 0.0% 0.0% 3.6% 96.4%
Grade 9 0.0% 0.0% 0.0% 100.0%
Crack
All 0.0% 0.0% 1.6% 98.4%
Grade 8 0.0% 0.0% 0.0% 100.0%
Grade 9 0.0% 0.0% 2.9% 97.1%
Hallucinogens
All 0.0% 1.7% 3.5% 96.5%
Grade 8 0.0% 3.8% 3.8% 96.2%
Grade 9 0.0% 0.0% 3.1% 96.9%Uppers
All 0.0% 0.0% 0.0% 100.0%
Grade 8 0.0% 0.0% 0.0% 100.0%
Grade 9 0.0% 0.0% 0.0% 100.0%
Downers
All 0.0% 0.0% 0.0% 100.0%
Grade 8 0.0% 0.0% 0.0% 100.0%
Grade 9 0.0% 0.0% 0.0% 100.0%
Secondary Report-Page
8/14/2019 JOHNSON COUNTY - Godley ISD - 2007 Texas School Survey of Drug and Alcohol Use
http://slidepdf.com/reader/full/johnson-county-godley-isd-2007-texas-school-survey-of-drug-and-alcohol 42/71
Godley
Spring 2007
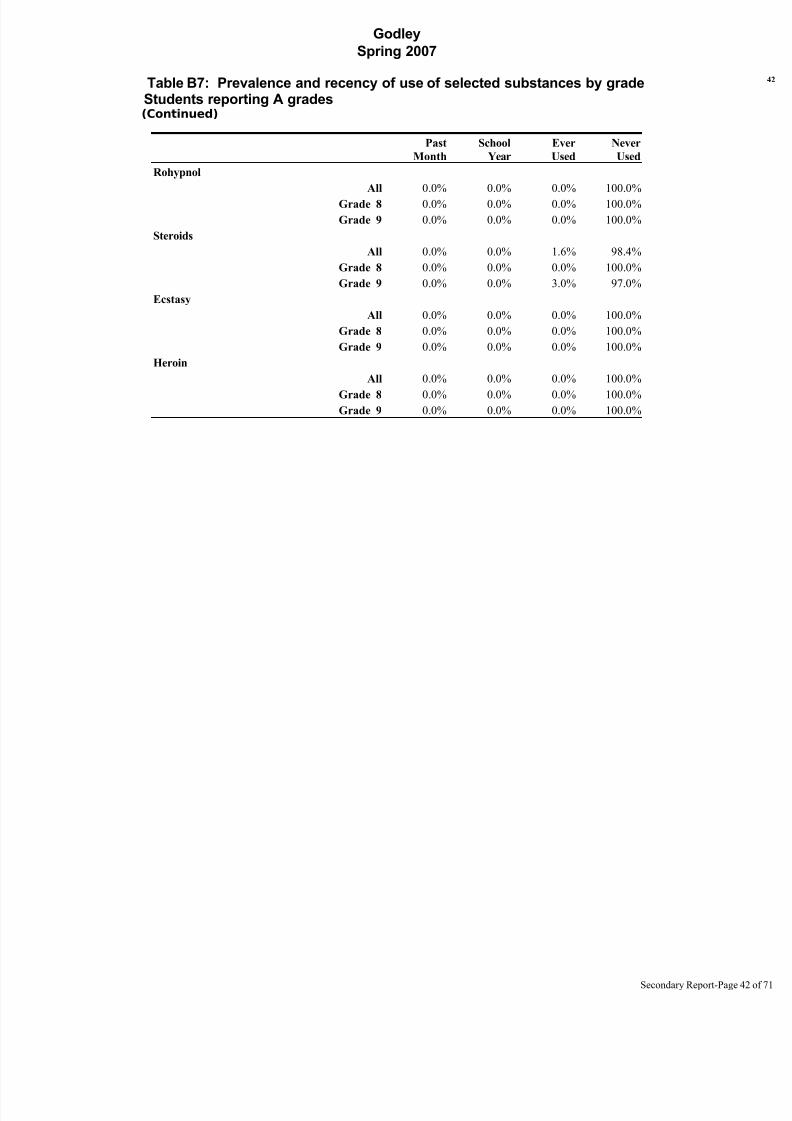
Table B7: Prevalence and recency of use of selected substances by gradeStudents reporting A grades(Continued)
Past
Month
School
Year
Ever
Used
Never
Used
Rohypnol
All 0.0% 0.0% 0.0% 100.0%
Grade 8 0.0% 0.0% 0.0% 100.0%
Grade 9 0.0% 0.0% 0.0% 100.0%
Steroids
All 0.0% 0.0% 1.6% 98.4%
Grade 8 0.0% 0.0% 0.0% 100.0%
Grade 9 0.0% 0.0% 3.0% 97.0%
Ecstasy
All 0.0% 0.0% 0.0% 100.0%
Grade 8 0.0% 0.0% 0.0% 100.0%
Grade 9 0.0% 0.0% 0.0% 100.0%
Heroin
All 0.0% 0.0% 0.0% 100.0%
Grade 8 0.0% 0.0% 0.0% 100.0%Grade 9 0.0% 0.0% 0.0% 100.0%
Secondary Report-Page

8/14/2019 JOHNSON COUNTY - Godley ISD - 2007 Texas School Survey of Drug and Alcohol Use
http://slidepdf.com/reader/full/johnson-county-godley-isd-2007-texas-school-survey-of-drug-and-alcohol 43/71
Godley
Spring 2007
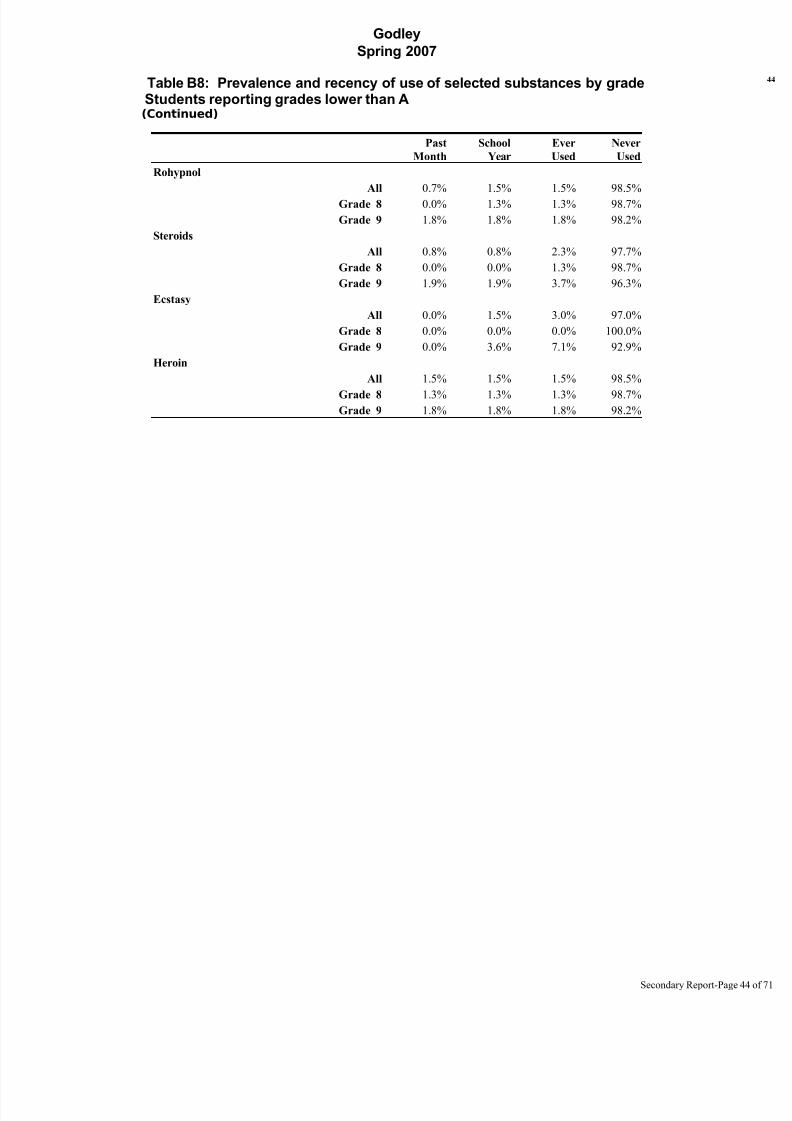
Table B8: Prevalence and recency of use of selected substances by gradeStudents reporting grades lower than A
Past
Month
School
Year
Ever
Used
Never
Used
Tobacco
All 15.2% 23.9% 42.8% 57.2%
Grade 8 11.7% 22.1% 42.9% 57.1%Grade 9 19.7% 26.2% 42.6% 57.4%
Alcohol
All 24.4% 36.7% 69.8% 30.2%
Grade 8 19.2% 35.9% 74.4% 25.6%
Grade 9 31.1% 37.7% 63.9% 36.1%
Inhalants
All 5.7% 7.9% 16.6% 83.4%
Grade 8 5.1% 7.7% 19.2% 80.8%
Grade 9 6.6% 8.2% 13.1% 86.9%
Any Illicit Drug
All 8.6% 15.0% 20.8% 79.2%
Grade 8 5.1% 10.3% 15.4% 84.6%
Grade 9 13.1% 21.3% 27.9% 72.1%
Marijuana
All 6.7% 13.4% 20.1% 79.9%
Grade 8 5.5% 9.6% 16.4% 83.6%
Grade 9 8.2% 18.0% 24.6% 75.4%
Marijuana Only
All 4.3% 7.2% 10.8% 89.2%
Grade 8 3.8% 5.1% 9.0% 91.0%
Grade 9 4.9% 9.8% 13.1% 86.9%
Cocaine or Crack
All 0.7% 2.2% 4.4% 95.6%
Grade 8 0.0% 1.3% 2.6% 97.4%
Grade 9 1.7% 3.4% 6.9% 93.1%Cocaine
All 0.7% 2.2% 4.5% 95.5%
Grade 8 0.0% 1.3% 2.6% 97.4%
Grade 9 1.8% 3.5% 7.0% 93.0%
Crack
All 0.0% 0.0% 0.0% 100.0%
Grade 8 0.0% 0.0% 0.0% 100.0%
Grade 9 0.0% 0.0% 0.0% 100.0%
Hallucinogens
All 0.8% 0.8% 3.1% 96.9%
Grade 8 1.4% 1.4% 2.7% 97.3%
Grade 9 0.0% 0.0% 3.6% 96.4%Uppers
All 0.0% 1.5% 3.0% 97.0%
Grade 8 0.0% 1.3% 1.3% 98.7%
Grade 9 0.0% 1.8% 5.3% 94.7%
Downers
All 0.8% 0.8% 0.8% 99.2%
Grade 8 0.0% 0.0% 0.0% 100.0%
Grade 9 1.9% 1.9% 1.9% 98.1%
Secondary Report-Page
8/14/2019 JOHNSON COUNTY - Godley ISD - 2007 Texas School Survey of Drug and Alcohol Use
http://slidepdf.com/reader/full/johnson-county-godley-isd-2007-texas-school-survey-of-drug-and-alcohol 44/71
Godley
Spring 2007
Table B8: Prevalence and recency of use of selected substances by gradeStudents reporting grades lower than A(Continued)
Past
Month
School
Year
Ever
Used
Never
Used
Rohypnol
All 0.7% 1.5% 1.5% 98.5%
Grade 8 0.0% 1.3% 1.3% 98.7%
Grade 9 1.8% 1.8% 1.8% 98.2%
Steroids
All 0.8% 0.8% 2.3% 97.7%
Grade 8 0.0% 0.0% 1.3% 98.7%
Grade 9 1.9% 1.9% 3.7% 96.3%
Ecstasy
All 0.0% 1.5% 3.0% 97.0%
Grade 8 0.0% 0.0% 0.0% 100.0%
Grade 9 0.0% 3.6% 7.1% 92.9%
Heroin
All 1.5% 1.5% 1.5% 98.5%
Grade 8 1.3% 1.3% 1.3% 98.7%Grade 9 1.8% 1.8% 1.8% 98.2%
Secondary Report-Page

8/14/2019 JOHNSON COUNTY - Godley ISD - 2007 Texas School Survey of Drug and Alcohol Use
http://slidepdf.com/reader/full/johnson-county-godley-isd-2007-texas-school-survey-of-drug-and-alcohol 45/71
Godley
Spring 2007
Table B9: Prevalence and recency of use of selected substances by gradeStudents living with two parents
Past
Month
School
Year
Ever
Used
Never
Used
Tobacco
All 5.3% 9.8% 21.4% 78.6%
Grade 8 4.5% 10.4% 22.4% 77.6%Grade 9 6.7% 8.9% 20.0% 80.0%
Alcohol
All 18.7% 25.8% 60.7% 39.3%
Grade 8 14.9% 22.4% 59.7% 40.3%
Grade 9 24.4% 31.1% 62.2% 37.8%
Inhalants
All 0.9% 1.8% 10.7% 89.3%
Grade 8 1.5% 1.5% 11.9% 88.1%
Grade 9 0.0% 2.2% 8.9% 91.1%
Any Illicit Drug
All 2.7% 5.3% 9.7% 90.3%
Grade 8 1.5% 3.0% 4.5% 95.5%
Grade 9 4.4% 8.9% 17.8% 82.2%
Marijuana
All 2.8% 5.5% 9.2% 90.8%
Grade 8 1.6% 3.2% 4.8% 95.2%
Grade 9 4.4% 8.9% 15.6% 84.4%
Marijuana Only
All 2.7% 5.3% 8.9% 91.1%
Grade 8 1.5% 3.0% 4.5% 95.5%
Grade 9 4.4% 8.9% 15.6% 84.4%
Cocaine or Crack
All 0.0% 0.0% 0.9% 99.1%
Grade 8 0.0% 0.0% 0.0% 100.0%
Grade 9 0.0% 0.0% 2.3% 97.7%Cocaine
All 0.0% 0.0% 0.0% 100.0%
Grade 8 0.0% 0.0% 0.0% 100.0%
Grade 9 0.0% 0.0% 0.0% 100.0%
Crack
All 0.0% 0.0% 0.9% 99.1%
Grade 8 0.0% 0.0% 0.0% 100.0%
Grade 9 0.0% 0.0% 2.3% 97.7%
Hallucinogens
All 0.0% 0.0% 0.0% 100.0%
Grade 8 0.0% 0.0% 0.0% 100.0%
Grade 9 0.0% 0.0% 0.0% 100.0%Uppers
All 0.0% 0.0% 0.0% 100.0%
Grade 8 0.0% 0.0% 0.0% 100.0%
Grade 9 0.0% 0.0% 0.0% 100.0%
Downers
All 0.0% 0.0% 0.0% 100.0%
Grade 8 0.0% 0.0% 0.0% 100.0%
Grade 9 0.0% 0.0% 0.0% 100.0%
Secondary Report-Page

8/14/2019 JOHNSON COUNTY - Godley ISD - 2007 Texas School Survey of Drug and Alcohol Use
http://slidepdf.com/reader/full/johnson-county-godley-isd-2007-texas-school-survey-of-drug-and-alcohol 46/71
Godley
Spring 2007
Table B9: Prevalence and recency of use of selected substances by gradeStudents living with two parents(Continued)
Past
Month
School
Year
Ever
Used
Never
Used
Rohypnol
All 0.0% 0.0% 0.0% 100.0%
Grade 8 0.0% 0.0% 0.0% 100.0%
Grade 9 0.0% 0.0% 0.0% 100.0%
Steroids
All 0.0% 0.0% 2.7% 97.3%
Grade 8 0.0% 0.0% 1.5% 98.5%
Grade 9 0.0% 0.0% 4.7% 95.3%
Ecstasy
All 0.0% 0.0% 0.0% 100.0%
Grade 8 0.0% 0.0% 0.0% 100.0%
Grade 9 0.0% 0.0% 0.0% 100.0%
Heroin
All 0.0% 0.0% 0.0% 100.0%
Grade 8 0.0% 0.0% 0.0% 100.0%Grade 9 0.0% 0.0% 0.0% 100.0%
Secondary Report-Page

8/14/2019 JOHNSON COUNTY - Godley ISD - 2007 Texas School Survey of Drug and Alcohol Use
http://slidepdf.com/reader/full/johnson-county-godley-isd-2007-texas-school-survey-of-drug-and-alcohol 47/71
Godley
Spring 2007
Table B10: Prevalence and recency of use of selected substances by gradeStudents not living with two parents
Past
Month
School
Year
Ever
Used
Never
Used
Tobacco
All 17.8% 27.8% 53.4% 46.6%
Grade 8 18.4% 28.9% 60.5% 39.5%Grade 9 17.3% 26.9% 48.1% 51.9%
Alcohol
All 29.6% 45.0% 78.0% 22.0%
Grade 8 20.5% 43.6% 76.9% 23.1%
Grade 9 36.5% 46.2% 78.8% 21.2%
Inhalants
All 8.8% 13.2% 18.7% 81.3%
Grade 8 10.3% 15.4% 23.1% 76.9%
Grade 9 7.7% 11.5% 15.4% 84.6%
Any Illicit Drug
All 13.0% 22.8% 30.4% 69.6%
Grade 8 10.0% 22.5% 30.0% 70.0%
Grade 9 15.4% 23.1% 30.8% 69.2%
Marijuana
All 8.9% 17.8% 27.8% 72.2%
Grade 8 7.9% 15.8% 28.9% 71.1%
Grade 9 9.6% 19.2% 26.9% 73.1%
Marijuana Only
All 4.4% 7.6% 12.0% 88.0%
Grade 8 5.0% 7.5% 12.5% 87.5%
Grade 9 3.8% 7.7% 11.5% 88.5%
Cocaine or Crack
All 1.1% 3.4% 7.9% 92.1%
Grade 8 0.0% 2.6% 7.7% 92.3%
Grade 9 2.0% 4.0% 8.0% 92.0%Cocaine
All 1.1% 3.4% 8.0% 92.0%
Grade 8 0.0% 2.6% 7.7% 92.3%
Grade 9 2.0% 4.1% 8.2% 91.8%
Crack
All 0.0% 0.0% 0.0% 100.0%
Grade 8 0.0% 0.0% 0.0% 100.0%
Grade 9 0.0% 0.0% 0.0% 100.0%
Hallucinogens
All 1.2% 2.4% 8.4% 91.6%
Grade 8 2.6% 5.3% 10.5% 89.5%
Grade 9 0.0% 0.0% 6.5% 93.5%Uppers
All 0.0% 2.3% 4.6% 95.4%
Grade 8 0.0% 2.6% 2.6% 97.4%
Grade 9 0.0% 2.1% 6.3% 93.8%
Downers
All 1.2% 1.2% 1.2% 98.8%
Grade 8 0.0% 0.0% 0.0% 100.0%
Grade 9 2.2% 2.2% 2.2% 97.8%
Secondary Report-Page

8/14/2019 JOHNSON COUNTY - Godley ISD - 2007 Texas School Survey of Drug and Alcohol Use
http://slidepdf.com/reader/full/johnson-county-godley-isd-2007-texas-school-survey-of-drug-and-alcohol 48/71
Godley
Spring 2007
Table B10: Prevalence and recency of use of selected substances by gradeStudents not living with two parents(Continued)
Past
Month
School
Year
Ever
Used
Never
Used
Rohypnol
All 1.1% 2.3% 2.3% 97.7%
Grade 8 0.0% 2.6% 2.6% 97.4%
Grade 9 2.1% 2.1% 2.1% 97.9%
Steroids
All 1.2% 1.2% 1.2% 98.8%
Grade 8 0.0% 0.0% 0.0% 100.0%
Grade 9 2.2% 2.2% 2.2% 97.8%
Ecstasy
All 0.0% 2.3% 5.7% 94.3%
Grade 8 0.0% 0.0% 2.6% 97.4%
Grade 9 0.0% 4.2% 8.3% 91.7%
Heroin
All 3.5% 3.5% 3.5% 96.5%
Grade 8 5.1% 5.1% 5.1% 94.9%Grade 9 2.1% 2.1% 2.1% 97.9%
Secondary Report-Page

8/14/2019 JOHNSON COUNTY - Godley ISD - 2007 Texas School Survey of Drug and Alcohol Use
http://slidepdf.com/reader/full/johnson-county-godley-isd-2007-texas-school-survey-of-drug-and-alcohol 49/71
Godley
Spring 2007
Table B11: Prevalence and recency of use of selected substances by gradeStudents would seek help from adults for substance abuse problems
Past
Month
School
Year
Ever
Used
Never
Used
Tobacco
All 9.0% 15.8% 33.9% 66.1%
Grade 8 8.3% 16.7% 35.4% 64.6%Grade 9 9.9% 14.8% 32.1% 67.9%
Alcohol
All 21.3% 32.5% 67.9% 32.1%
Grade 8 14.4% 28.9% 64.9% 35.1%
Grade 9 29.6% 37.0% 71.6% 28.4%
Inhalants
All 3.4% 5.1% 10.7% 89.3%
Grade 8 3.1% 5.2% 13.4% 86.6%
Grade 9 3.7% 4.9% 7.4% 92.6%
Any Illicit Drug
All 6.2% 11.2% 15.7% 84.3%
Grade 8 4.1% 8.2% 11.3% 88.7%
Grade 9 8.6% 14.8% 21.0% 79.0%
Marijuana
All 5.8% 10.4% 16.1% 83.9%
Grade 8 4.3% 6.5% 12.0% 88.0%
Grade 9 7.4% 14.8% 21.0% 79.0%
Marijuana Only
All 3.9% 5.6% 8.9% 91.1%
Grade 8 3.1% 3.1% 5.2% 94.8%
Grade 9 4.9% 8.6% 13.6% 86.4%
Cocaine or Crack
All 0.6% 1.7% 4.0% 96.0%
Grade 8 0.0% 1.0% 3.1% 96.9%
Grade 9 1.3% 2.6% 5.1% 94.9%Cocaine
All 0.6% 1.7% 4.0% 96.0%
Grade 8 0.0% 1.0% 3.1% 96.9%
Grade 9 1.3% 2.6% 5.1% 94.9%
Crack
All 0.0% 0.0% 0.0% 100.0%
Grade 8 0.0% 0.0% 0.0% 100.0%
Grade 9 0.0% 0.0% 0.0% 100.0%
Hallucinogens
All 0.6% 1.2% 3.0% 97.0%
Grade 8 1.1% 2.2% 3.3% 96.7%
Grade 9 0.0% 0.0% 2.7% 97.3%Uppers
All 0.0% 1.2% 1.7% 98.3%
Grade 8 0.0% 1.1% 1.1% 98.9%
Grade 9 0.0% 1.3% 2.6% 97.4%
Downers
All 0.0% 0.0% 0.0% 100.0%
Grade 8 0.0% 0.0% 0.0% 100.0%
Grade 9 0.0% 0.0% 0.0% 100.0%
Secondary Report-Page

8/14/2019 JOHNSON COUNTY - Godley ISD - 2007 Texas School Survey of Drug and Alcohol Use
http://slidepdf.com/reader/full/johnson-county-godley-isd-2007-texas-school-survey-of-drug-and-alcohol 50/71
Godley
Spring 2007
Table B11: Prevalence and recency of use of selected substances by gradeStudents would seek help from adults for substance abuse problems(Continued)
Past
Month
School
Year
Ever
Used
Never
Used
Rohypnol
All 0.6% 1.2% 1.2% 98.8%
Grade 8 0.0% 1.0% 1.0% 99.0%
Grade 9 1.3% 1.3% 1.3% 98.7%
Steroids
All 0.0% 0.0% 1.2% 98.8%
Grade 8 0.0% 0.0% 1.0% 99.0%
Grade 9 0.0% 0.0% 1.4% 98.6%
Ecstasy
All 0.0% 0.6% 1.7% 98.3%
Grade 8 0.0% 0.0% 0.0% 100.0%
Grade 9 0.0% 1.3% 3.9% 96.1%
Heroin
All 0.6% 0.6% 0.6% 99.4%
Grade 8 1.0% 1.0% 1.0% 99.0%Grade 9 0.0% 0.0% 0.0% 100.0%
Secondary Report-Page

8/14/2019 JOHNSON COUNTY - Godley ISD - 2007 Texas School Survey of Drug and Alcohol Use
http://slidepdf.com/reader/full/johnson-county-godley-isd-2007-texas-school-survey-of-drug-and-alcohol 51/71
Godley
Spring 2007
Table B12: Prevalence and recency of use of selected substances by gradeStudents wouldn''t seek help from adults for substance abuse problems
Past
Month
School
Year
Ever
Used
Never
Used
Tobacco
All 27.3% 31.8% 50.0% 50.0%
Grade 8 999.0% 999.0% 998.0% -19898Grade 9 28.6% 35.7% 50.0% 50.0%
Alcohol
All 45.5% 50.0% 72.9% 27.1%
Grade 8 999.0% 999.0% 998.0% -19898
Grade 9 42.9% 50.0% 64.3% 35.7%
Inhalants
All 13.7% 22.7% 41.0% 59.0%
Grade 8 999.0% 999.0% 998.0% -19898
Grade 9 7.1% 21.4% 35.7% 64.3%
Any Illicit Drug
All 17.3% 26.2% 43.5% 56.5%
Grade 8 999.0% 998.0% 997.0% -29897
Grade 9 21.4% 21.4% 42.9% 57.1%
Marijuana
All 4.5% 13.7% 27.4% 72.6%
Grade 8 0.0% 999.0% 998.0% -19898
Grade 9 7.1% 7.1% 21.4% 78.6%
Marijuana Only
All 0.0% 8.8% 17.5% 82.5%
Grade 8 0.0% 999.0% 998.0% -19898
Grade 9 0.0% 0.0% 7.1% 92.9%
Cocaine or Crack
All 0.0% 0.0% 4.5% 95.5%
Grade 8 0.0% 0.0% 0.0% 100.0%
Grade 9 0.0% 0.0% 7.1% 92.9%Cocaine
All 0.0% 0.0% 0.0% 100.0%
Grade 8 0.0% 0.0% 0.0% 100.0%
Grade 9 0.0% 0.0% 0.0% 100.0%
Crack
All 0.0% 0.0% 4.5% 95.5%
Grade 8 0.0% 0.0% 0.0% 100.0%
Grade 9 0.0% 0.0% 7.1% 92.9%
Hallucinogens
All 0.0% 0.0% 10.0% 90.0%
Grade 8 * * * *
Grade 9 0.0% 0.0% 8.3% 91.7%Uppers
All 0.0% 0.0% 5.0% 95.0%
Grade 8 0.0% 0.0% 0.0% 100.0%
Grade 9 0.0% 0.0% 8.3% 91.7%
Downers
All 4.7% 4.7% 4.7% 95.3%
Grade 8 0.0% 0.0% 0.0% 100.0%
Grade 9 7.7% 7.7% 7.7% 92.3%
Secondary Report-Page

8/14/2019 JOHNSON COUNTY - Godley ISD - 2007 Texas School Survey of Drug and Alcohol Use
http://slidepdf.com/reader/full/johnson-county-godley-isd-2007-texas-school-survey-of-drug-and-alcohol 52/71
Godley
Spring 2007
Table B12: Prevalence and recency of use of selected substances by gradeStudents wouldn''t seek help from adults for substance abuse problems(Continued)
Past
Month
School
Year
Ever
Used
Never
Used
Rohypnol
All 0.0% 0.0% 0.0% 100.0%
Grade 8 0.0% 0.0% 0.0% 100.0%
Grade 9 0.0% 0.0% 0.0% 100.0%
Steroids
All 5.0% 5.0% 9.9% 90.1%
Grade 8 0.0% 0.0% 0.0% 100.0%
Grade 9 8.3% 8.3% 16.7% 83.3%
Ecstasy
All 0.0% 4.5% 9.1% 90.9%
Grade 8 * * * *
Grade 9 0.0% 7.7% 7.7% 92.3%
Heroin
All 9.1% 9.1% 9.1% 90.9%
Grade 8 * * * *Grade 9 7.7% 7.7% 7.7% 92.3%
Secondary Report-Page
8/14/2019 JOHNSON COUNTY - Godley ISD - 2007 Texas School Survey of Drug and Alcohol Use
http://slidepdf.com/reader/full/johnson-county-godley-isd-2007-texas-school-survey-of-drug-and-alcohol 53/71
Godley
Spring 2007
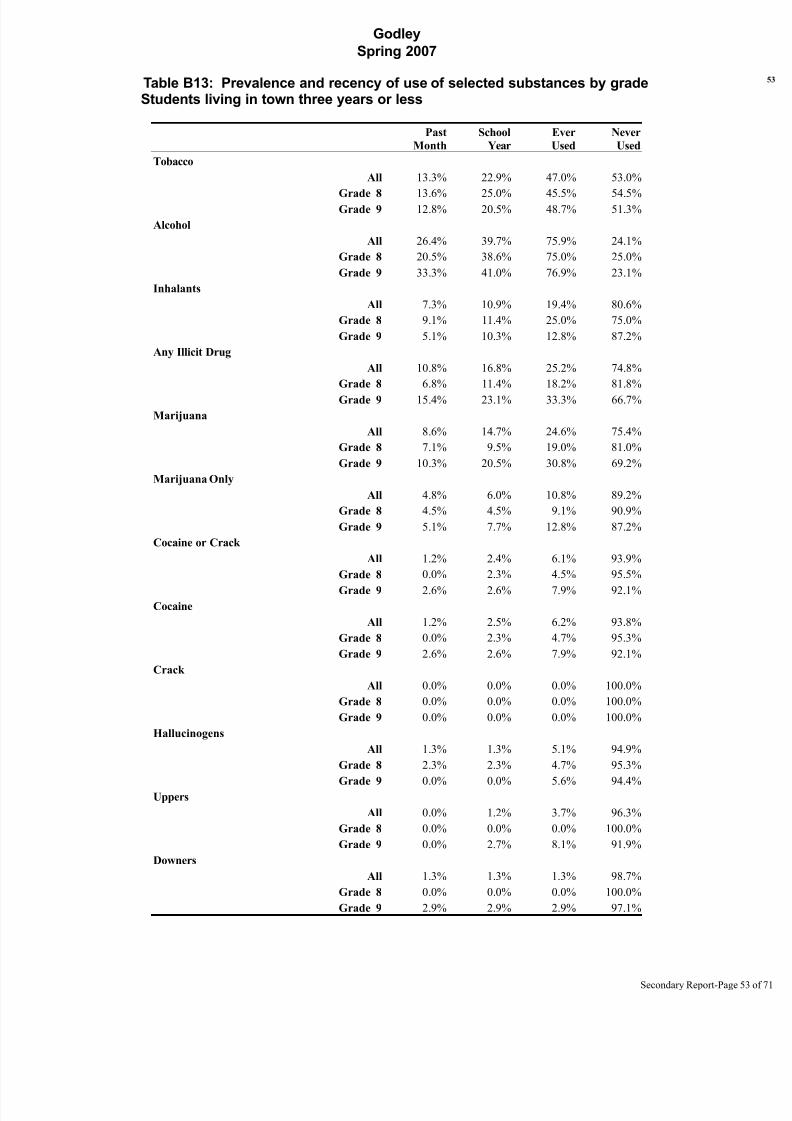
Table B13: Prevalence and recency of use of selected substances by gradeStudents living in town three years or less
Past
Month
School
Year
Ever
Used
Never
Used
Tobacco
All 13.3% 22.9% 47.0% 53.0%
Grade 8 13.6% 25.0% 45.5% 54.5%Grade 9 12.8% 20.5% 48.7% 51.3%
Alcohol
All 26.4% 39.7% 75.9% 24.1%
Grade 8 20.5% 38.6% 75.0% 25.0%
Grade 9 33.3% 41.0% 76.9% 23.1%
Inhalants
All 7.3% 10.9% 19.4% 80.6%
Grade 8 9.1% 11.4% 25.0% 75.0%
Grade 9 5.1% 10.3% 12.8% 87.2%
Any Illicit Drug
All 10.8% 16.8% 25.2% 74.8%
Grade 8 6.8% 11.4% 18.2% 81.8%
Grade 9 15.4% 23.1% 33.3% 66.7%
Marijuana
All 8.6% 14.7% 24.6% 75.4%
Grade 8 7.1% 9.5% 19.0% 81.0%
Grade 9 10.3% 20.5% 30.8% 69.2%
Marijuana Only
All 4.8% 6.0% 10.8% 89.2%
Grade 8 4.5% 4.5% 9.1% 90.9%
Grade 9 5.1% 7.7% 12.8% 87.2%
Cocaine or Crack
All 1.2% 2.4% 6.1% 93.9%
Grade 8 0.0% 2.3% 4.5% 95.5%
Grade 9 2.6% 2.6% 7.9% 92.1%Cocaine
All 1.2% 2.5% 6.2% 93.8%
Grade 8 0.0% 2.3% 4.7% 95.3%
Grade 9 2.6% 2.6% 7.9% 92.1%
Crack
All 0.0% 0.0% 0.0% 100.0%
Grade 8 0.0% 0.0% 0.0% 100.0%
Grade 9 0.0% 0.0% 0.0% 100.0%
Hallucinogens
All 1.3% 1.3% 5.1% 94.9%
Grade 8 2.3% 2.3% 4.7% 95.3%
Grade 9 0.0% 0.0% 5.6% 94.4%Uppers
All 0.0% 1.2% 3.7% 96.3%
Grade 8 0.0% 0.0% 0.0% 100.0%
Grade 9 0.0% 2.7% 8.1% 91.9%
Downers
All 1.3% 1.3% 1.3% 98.7%
Grade 8 0.0% 0.0% 0.0% 100.0%
Grade 9 2.9% 2.9% 2.9% 97.1%
Secondary Report-Page

8/14/2019 JOHNSON COUNTY - Godley ISD - 2007 Texas School Survey of Drug and Alcohol Use
http://slidepdf.com/reader/full/johnson-county-godley-isd-2007-texas-school-survey-of-drug-and-alcohol 54/71
Godley
Spring 2007
Table B13: Prevalence and recency of use of selected substances by gradeStudents living in town three years or less(Continued)
Past
Month
School
Year
Ever
Used
Never
Used
Rohypnol
All 1.2% 2.5% 2.5% 97.5%
Grade 8 0.0% 2.3% 2.3% 97.7%
Grade 9 2.9% 2.9% 2.9% 97.1%
Steroids
All 0.0% 0.0% 2.6% 97.4%
Grade 8 0.0% 0.0% 2.3% 97.7%
Grade 9 0.0% 0.0% 2.9% 97.1%
Ecstasy
All 0.0% 1.2% 2.5% 97.5%
Grade 8 0.0% 0.0% 0.0% 100.0%
Grade 9 0.0% 2.8% 5.6% 94.4%
Heroin
All 1.3% 1.3% 1.3% 98.7%
Grade 8 2.3% 2.3% 2.3% 97.7%Grade 9 0.0% 0.0% 0.0% 100.0%
Secondary Report-Page

8/14/2019 JOHNSON COUNTY - Godley ISD - 2007 Texas School Survey of Drug and Alcohol Use
http://slidepdf.com/reader/full/johnson-county-godley-isd-2007-texas-school-survey-of-drug-and-alcohol 55/71
Godley
Spring 2007
Table B14: Prevalence and recency of use of selected substances by gradeStudents living in town more than three years
Past
Month
School
Year
Ever
Used
Never
Used
Tobacco
All 8.6% 13.8% 27.6% 72.4%
Grade 8 5.2% 10.3% 29.3% 70.7%Grade 9 12.1% 17.2% 25.9% 74.1%
Alcohol
All 21.3% 30.7% 63.2% 36.8%
Grade 8 13.6% 23.7% 59.3% 40.7%
Grade 9 29.3% 37.9% 67.2% 32.8%
Inhalants
All 1.7% 3.4% 10.2% 89.8%
Grade 8 0.0% 1.7% 8.5% 91.5%
Grade 9 3.4% 5.2% 12.1% 87.9%
Any Illicit Drug
All 5.1% 10.1% 14.4% 85.6%
Grade 8 3.3% 8.3% 10.0% 90.0%
Grade 9 6.9% 12.1% 19.0% 81.0%
Marijuana
All 3.5% 8.8% 12.2% 87.8%
Grade 8 1.8% 7.1% 8.9% 91.1%
Grade 9 5.2% 10.3% 15.5% 84.5%
Marijuana Only
All 2.5% 6.8% 10.1% 89.9%
Grade 8 1.7% 5.0% 6.7% 93.3%
Grade 9 3.4% 8.6% 13.8% 86.2%
Cocaine or Crack
All 0.0% 0.9% 1.7% 98.3%
Grade 8 0.0% 0.0% 0.0% 100.0%
Grade 9 0.0% 1.8% 3.6% 96.4%Cocaine
All 0.0% 0.9% 0.9% 99.1%
Grade 8 0.0% 0.0% 0.0% 100.0%
Grade 9 0.0% 1.8% 1.8% 98.2%
Crack
All 0.0% 0.0% 0.9% 99.1%
Grade 8 0.0% 0.0% 0.0% 100.0%
Grade 9 0.0% 0.0% 1.8% 98.2%
Hallucinogens
All 0.0% 0.0% 1.9% 98.1%
Grade 8 0.0% 0.0% 1.8% 98.2%
Grade 9 0.0% 0.0% 1.9% 98.1%Uppers
All 0.0% 0.9% 0.9% 99.1%
Grade 8 0.0% 1.7% 1.7% 98.3%
Grade 9 0.0% 0.0% 0.0% 100.0%
Downers
All 0.0% 0.0% 0.0% 100.0%
Grade 8 0.0% 0.0% 0.0% 100.0%
Grade 9 0.0% 0.0% 0.0% 100.0%
Secondary Report-Page

8/14/2019 JOHNSON COUNTY - Godley ISD - 2007 Texas School Survey of Drug and Alcohol Use
http://slidepdf.com/reader/full/johnson-county-godley-isd-2007-texas-school-survey-of-drug-and-alcohol 56/71
Godley
Spring 2007
Table B14: Prevalence and recency of use of selected substances by gradeStudents living in town more than three years(Continued)
Past
Month
School
Year
Ever
Used
Never
Used
Rohypnol
All 0.0% 0.0% 0.0% 100.0%
Grade 8 0.0% 0.0% 0.0% 100.0%
Grade 9 0.0% 0.0% 0.0% 100.0%
Steroids
All 0.9% 0.9% 1.8% 98.2%
Grade 8 0.0% 0.0% 0.0% 100.0%
Grade 9 1.9% 1.9% 3.7% 96.3%
Ecstasy
All 0.0% 0.9% 2.6% 97.4%
Grade 8 0.0% 0.0% 1.7% 98.3%
Grade 9 0.0% 1.8% 3.6% 96.4%
Heroin
All 1.7% 1.7% 1.7% 98.3%
Grade 8 1.7% 1.7% 1.7% 98.3%Grade 9 1.8% 1.8% 1.8% 98.2%
Secondary Report-Page

8/14/2019 JOHNSON COUNTY - Godley ISD - 2007 Texas School Survey of Drug and Alcohol Use
http://slidepdf.com/reader/full/johnson-county-godley-isd-2007-texas-school-survey-of-drug-and-alcohol 57/71
Godley
Spring 2007
The FREQ Procedure
GENDER
q1 Frequency Percent
Female 94 46.12
Male 110 53.88
GRADE
q2 Frequency Percent
Grade 8 108 53.06
Grade 9 96 46.94
LIVE WITH BOTH
PARENTS
q3 Frequency Percent
No 92 45.00
Yes 112 55.00
AGE
q4 Frequency Percent
13 25 12.40
14 85 41.50
15 76 37.38
16 18 8.72
ETHNICITY
q5 Frequency Percent
African/American 1 0.50
Mexican/American 33 16.21
Native/American 2 0.97
Other 3 1.48
White 165 80.85
ON AVERAGE WHAT
GRADES DO YOU GET
q6 Frequency Percent
Mostly A's 63 31.13
Mostly B's 99 49.02
Mostly C's 33 16.36
Mostly D's 2 1.00
Mostly F's 5 2.49
Frequency Missing = 1.9988005608
LENGTH OF TIME IN
THIS DISTRICT
q7 Frequency Percent
<1 year 44 21.92
2-3 years 39 19.39
>4 years 118 58.69
Frequency Missing = 3.0349036811
DO YOU HAVE A JOB
q8 Frequency Percent
No 156 77.25
Yes 46 22.75
Frequency Missing = 2.0232691207
DO YOU GET AN
ALLOWANCE
q9 Frequency Percent
No 149 73.73
Yes 53 26.27
Frequency Missing = 2.0232691207
EITHER PARENT COLLEGE
GRADUATE
q10 Frequency Percent
Don't Know 39 19.23
No 88 43.05Yes 77 37.72
QUALIFY FOR
FREE/REDUCED PRICE
LUNCH
q11 Frequency Percent
Don't Know 10 4.95
No 116 57.17
Yes 77 37.88
Frequency Missing = 1.0116345604
PARTICIPATE IN
SCHOOL ATHLETICS
q12a Frequency Percent
No 72 38.27
Yes 116 61.73
Frequency Missing = 16.0393416
PARTICIPATE IN
SCHOOL
BAND/ORCHESTRA
q12b Frequency PercentNo 129 80.59
Yes 31 19.41
Frequency Missing = 43.8023324
PARTICIPATE IN
SCHOOL CHOIR
q12c Frequency Percent
No 146 100.00
Frequency Missing = 57.8184049
PARTICIPATE IN
DRAMA/SPEECH/ART
CLUBS
q12d Frequency Percent
No 137 92.00
Yes 12 8.00
Frequency Missing = 54.7835012
PARTICIPATE IN DRILL
TEAM/CHEERLEADING
q12e Frequency Percent
No 133 88.03
Yes 18 11.97
Frequency Missing = 52.8581063
PARTICIPATE IN
STUDENT
GOVERNMENTq12f Frequency Percent
No 142 96.58
Yes 5 3.42
Frequency Missing = 56.7578332
The frequencies have been weighted so that the
analysis reflects the distribution of students by grade
level in the district
Page

8/14/2019 JOHNSON COUNTY - Godley ISD - 2007 Texas School Survey of Drug and Alcohol Use
http://slidepdf.com/reader/full/johnson-county-godley-isd-2007-texas-school-survey-of-drug-and-alcohol 58/71

8/14/2019 JOHNSON COUNTY - Godley ISD - 2007 Texas School Survey of Drug and Alcohol Use
http://slidepdf.com/reader/full/johnson-county-godley-isd-2007-texas-school-survey-of-drug-and-alcohol 59/71
Godley
Spring 2007
HOW MANY FRIENDS
BELONG TO A GANG
q14d Frequency Percent
None 168 83.97
A Few 18 9.02
Some 5 2.49
Most 4 2.00
All 5 2.52
Frequency Missing = 4.0220696815
FRIENDS WISHING TO
DROP OUT OF SCHOOL
q14e Frequency Percent
None 125 61.61
A Few 52 25.58
Some 15 7.37
Most 9 4.45
All 2 1.00
Frequency Missing = 1.0116345604
PARENTS ATTEND
PTA/SCHOOL OPEN
HOUSES
q15 Frequency Percent
No 60 31.56
Yes 130 68.44
Frequency Missing = 14.065009605
EVER INHALED SPRAY PAINT FOR
KICKS
q16a Frequency Percent
Never Heard/Used 186 93.45
In Your Lifetime 10 5.05
Since School Began 3 1.50
Frequency Missing = 4.984767122
EVER INHALED WHITEOUT FOR
KICKS
q16b Frequency Percent
Never Heard/Used 187 93.47
In Your Lifetime 8 4.02
Since School Began 5 2.50
Frequency Missing = 3.9731325616
EVER INHALED GASOLINE FOR
KICKS
q16c Frequency Percent
Never Heard/Used 189 95.45
In Your Lifetime 5 2.54
Since School Began 2 1.01
In the Past Month 2 1.00
Frequency Missing = 5.9719331224
EVER INHALED FREON FOR
KICKS
q16d Frequency Percent
Never Heard/Used 189 98.43
In Your Lifetime 1 0.53
Since School Began 1 0.53
In the Past Month 1 0.51
Frequency Missing = 11.968334805
EVER INHALED POPPERS, ETC.
FOR KICKS
q16e Frequency Percent
Never Heard/Used 192 98.47
In Your Lifetime 2 1.02
In the Past Month 1 0.51
Frequency Missing = 8.9823682436
EVER INHALED GLUE FOR KICKS
q16f Frequency Percent
Never Heard/Used 188 97.39
In Your Lifetime 2 1.05
Since School Began 1 0.52
In the Past Month 2 1.04
Frequency Missing = 10.907763125
EVER INHALED PAINT THINNERS
FOR KICKS
q16g Frequency Percent
Never Heard/Used 188 97.42
In Your Lifetime 4 2.07
Since School Began 1 0.51
Frequency Missing = 10.9567002
EVER INHALED NITROUS OX
FOR KIC
q16h Frequency Per
Never Heard/Used 183 9In Your Lifetime 6
In the Past Month 6
Frequency Missing = 8.93343112
EVER INHALED OCTA
BOOSTER FOR KIC
q16i Frequency Per
Never Heard/Used 194 9
In the Past Month 3
Frequency Missing = 6.95909912
EVER INHALED OTHER SPRA
FOR KIC
q16j Frequency Per
Never Heard/Used 188 9
In Your Lifetime 7
Since School Began 2
Frequency Missing = 6.98356768
EVER INHALED OTH
INHALANTS FOR KIC
q16k Frequency Per
Never Heard/Used 181 9
In Your Lifetime 10
Since School Began 6
In the Past Month 2
Frequency Missing = 4.9847671
RECENT CIGARETTE
q17a Frequency Per
Never Heard/Used 139 7
In Your Lifetime 31 1
Since School Began 10
In the Past Month 18
The frequencies have been weighted so that the
analysis reflects the distribution of students by grade
level in the district
Page
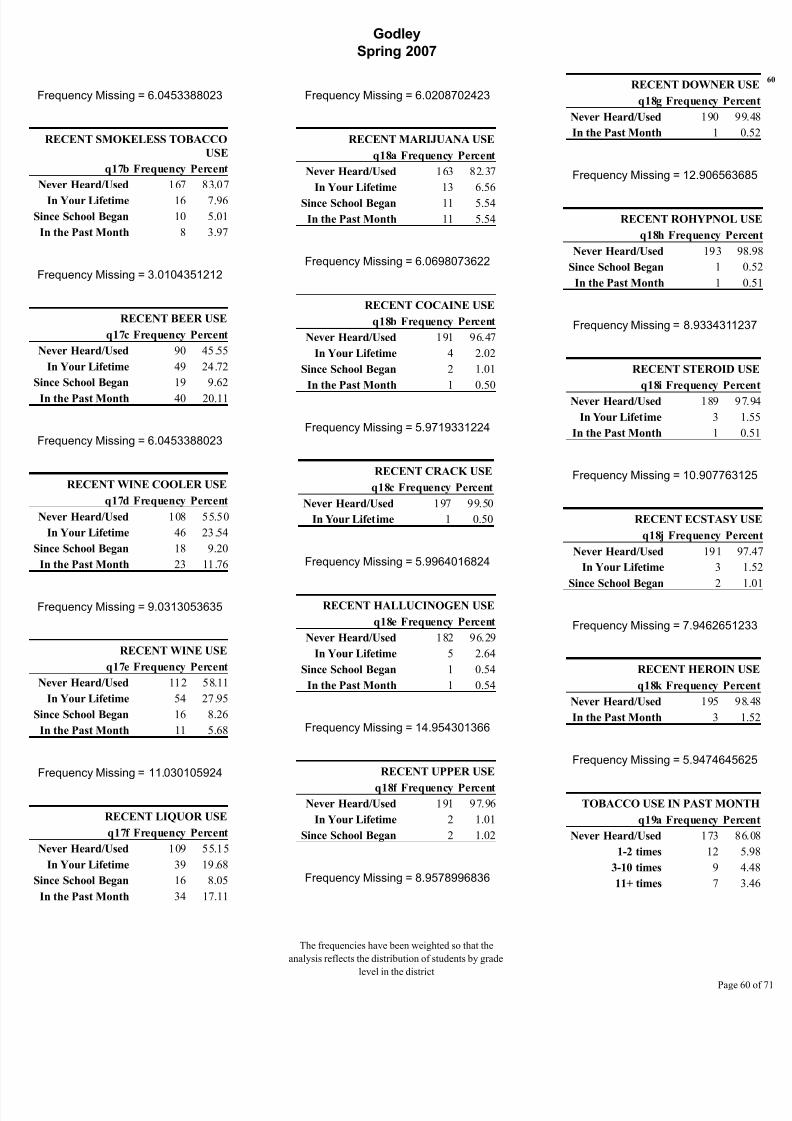
8/14/2019 JOHNSON COUNTY - Godley ISD - 2007 Texas School Survey of Drug and Alcohol Use
http://slidepdf.com/reader/full/johnson-county-godley-isd-2007-texas-school-survey-of-drug-and-alcohol 60/71
Godley
Spring 2007
Frequency Missing = 6.0453388023
RECENT SMOKELESS TOBACCO
USE
q17b Frequency Percent
Never Heard/Used 167 83.07
In Your Lifetime 16 7.96
Since School Began 10 5.01
In the Past Month 8 3.97
Frequency Missing = 3.0104351212
RECENT BEER USE
q17c Frequency Percent
Never Heard/Used 90 45.55
In Your Lifetime 49 24.72
Since School Began 19 9.62
In the Past Month 40 20.11
Frequency Missing = 6.0453388023
RECENT WINE COOLER USE
q17d Frequency Percent
Never Heard/Used 108 55.50
In Your Lifetime 46 23.54
Since School Began 18 9.20
In the Past Month 23 11.76
Frequency Missing = 9.0313053635
RECENT WINE USE
q17e Frequency Percent
Never Heard/Used 112 58.11
In Your Lifetime 54 27.95
Since School Began 16 8.26
In the Past Month 11 5.68
Frequency Missing = 11.030105924
RECENT LIQUOR USE
q17f Frequency Percent
Never Heard/Used 109 55.15
In Your Lifetime 39 19.68
Since School Began 16 8.05
In the Past Month 34 17.11
Frequency Missing = 6.0208702423
RECENT MARIJUANA USE
q18a Frequency Percent
Never Heard/Used 163 82.37
In Your Lifetime 13 6.56
Since School Began 11 5.54
In the Past Month 11 5.54
Frequency Missing = 6.0698073622
RECENT COCAINE USE
q18b Frequency Percent
Never Heard/Used 191 96.47
In Your Lifetime 4 2.02
Since School Began 2 1.01
In the Past Month 1 0.50
Frequency Missing = 5.9719331224
RECENT CRACK USE
q18c Frequency Percent
Never Heard/Used 197 99.50
In Your Lifetime 1 0.50
Frequency Missing = 5.9964016824
RECENT HALLUCINOGEN USE
q18e Frequency Percent
Never Heard/Used 182 96.29
In Your Lifetime 5 2.64
Since School Began 1 0.54
In the Past Month 1 0.54
Frequency Missing = 14.954301366
RECENT UPPER USE
q18f Frequency Percent
Never Heard/Used 191 97.96
In Your Lifetime 2 1.01
Since School Began 2 1.02
Frequency Missing = 8.9578996836
RECENT DOWNER U
q18g Frequency Per
Never Heard/Used 190 9
In the Past Month 1
Frequency Missing = 12.9065636
RECENT ROHYPNOL
q18h Frequency Per
Never Heard/Used 193 9
Since School Began 1
In the Past Month 1
Frequency Missing = 8.93343112
RECENT STEROID U
q18i Frequency Per
Never Heard/Used 189 9
In Your Lifetime 3
In the Past Month 1
Frequency Missing = 10.9077631
RECENT ECSTASY
q18j Frequency Per
Never Heard/Used 191 9
In Your Lifetime 3
Since School Began 2
Frequency Missing = 7.94626512
RECENT HEROIN U
q18k Frequency Per
Never Heard/Used 195 9
In the Past Month 3
Frequency Missing = 5.94746456
TOBACCO USE IN PAST MON
q19a Frequency Per
Never Heard/Used 173 8
1-2 times 12
3-10 times 9
11+ times 7
The frequencies have been weighted so that the
analysis reflects the distribution of students by grade
level in the district
Page

8/14/2019 JOHNSON COUNTY - Godley ISD - 2007 Texas School Survey of Drug and Alcohol Use
http://slidepdf.com/reader/full/johnson-county-godley-isd-2007-texas-school-survey-of-drug-and-alcohol 61/71
Godley
Spring 2007
Frequency Missing = 2.9859665612
ALCOHOL USE IN PAST MONTH
q19b Frequency Percent
Never Heard/Used 131 65.55
1-2 times 50 24.98
3-10 times 12 6.01
11+ times 7 3.47
Frequency Missing = 4.0220696815
INHALANT USE IN PAST MONTH
q19c Frequency Percent
Never Heard/Used 189 95.94
1-2 times 5 2.54
3-10 times 2 1.01
11+ times 1 0.50
Frequency Missing = 6.9835676828
MARIJUANA USE IN PAST MONTH
q19d Frequency Percent
Never Heard/Used 181 92.38
1-2 times 9 4.58
3-10 times 3 1.52
11+ times 3 1.51
Frequency Missing = 8.0196708031
COCAINE USE IN PAST MONTH
q19e Frequency Percent
Never Heard/Used 195 99.50
1-2 times 1 0.50
Frequency Missing = 7.9952022431
CRACK USE IN PAST MONTH
q19f Frequency Percent
Never Heard/Used 198 100.00
Frequency Missing = 5.9719331224
CLOSE FRIENDS USE
CIGARETTES
q20a Frequency Percent
Never heard/None 111 56.72
A few 51 25.99
Some 21 10.67
Most 11 5.60
All 2 1.02
Frequency Missing = 8.044139363
CLOSE FRIENDS USE
SMOKELESS TOBACCO
q20b Frequency Percent
Never heard/None 116 59.44
A few 51 26.25
Some 21 10.75
Most 4 2.04
All 3 1.53
Frequency Missing = 9.0313053635
CLOSE FRIENDS USE BEER
q20c Frequency Percent
Never heard/None 57 29.84
A few 66 34.38
Some 32 16.63
Most 26 13.46
All 11 5.69
Frequency Missing = 11.992803365
CLOSE FRIENDS USE WINE
COOLERS
q20d Frequency Percent
Never heard/None 98 51.45
A few 46 24.03
Some 27 14.10
Most 14 7.30
All 6 3.11
Frequency Missing = 13.028906485
CLOSE FRIENDS USE WI
q20e Frequency Perc
Never heard/None 113 5
A few 45 23
Some 15 7
Most 12 6
All 6 3
Frequency Missing = 13.0289064
CLOSE FRIENDS USE LIQU
q20f Frequency Perc
Never heard/None 89 4
A few 43 2
Some 31 1
Most 25 12
All 10
Frequency Missing = 6.04533880
CLOSE FRIENDS USE INHALAN
q20g Frequency Perc
Never heard/None 171 8
A few 13 6
Some 7 3
Most 2
All 1 0
Frequency Missing = 10.0184713
CLOSE FRIENDS U
MARIJUA
q20h Frequency Perc
Never heard/None 129 6
A few 33 16
Some 21 10
Most 12 6
All 4 2
Frequency Missing = 5.00923568
The frequencies have been weighted so that the
analysis reflects the distribution of students by grade
level in the district
Page
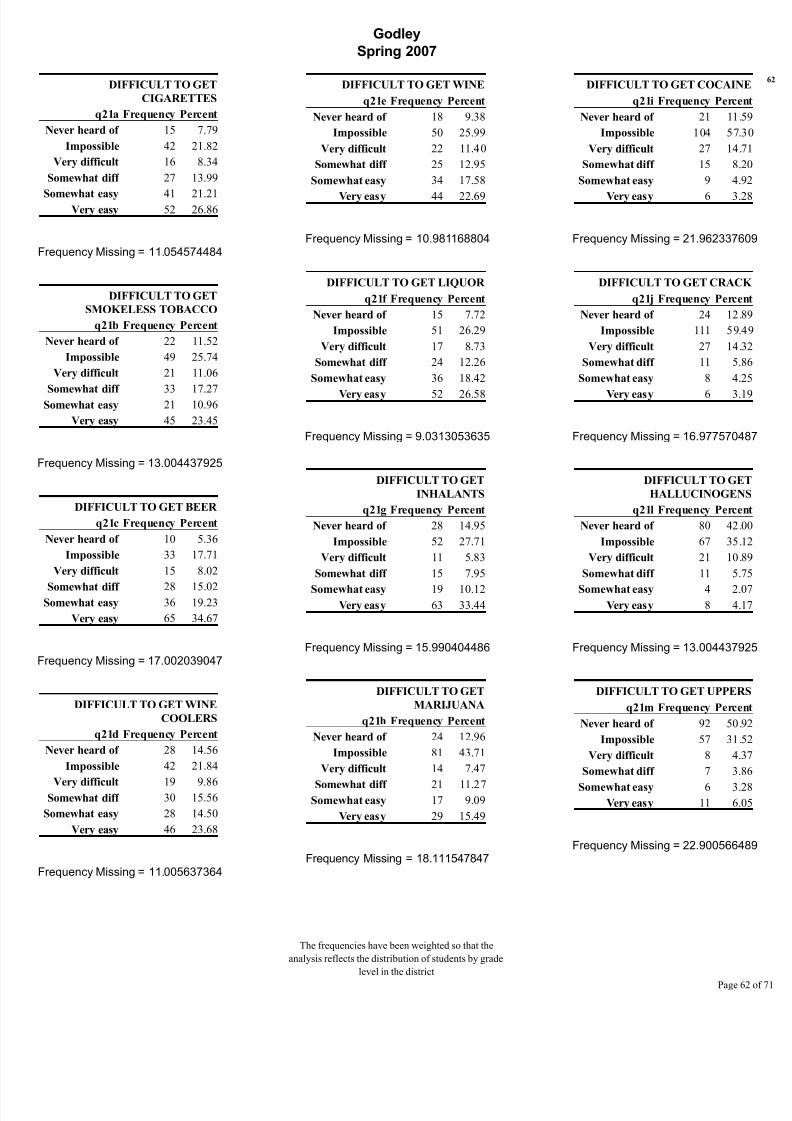
8/14/2019 JOHNSON COUNTY - Godley ISD - 2007 Texas School Survey of Drug and Alcohol Use
http://slidepdf.com/reader/full/johnson-county-godley-isd-2007-texas-school-survey-of-drug-and-alcohol 62/71
Godley
Spring 2007
DIFFICULT TO GET
CIGARETTES
q21a Frequency Percent
Never heard of 15 7.79
Impossible 42 21.82
Very difficult 16 8.34
Somewhat diff 27 13.99
Somewhat easy 41 21.21Very easy 52 26.86
Frequency Missing = 11.054574484
DIFFICULT TO GET
SMOKELESS TOBACCO
q21b Frequency Percent
Never heard of 22 11.52
Impossible 49 25.74
Very difficult 21 11.06
Somewhat diff 33 17.27Somewhat easy 21 10.96
Very easy 45 23.45
Frequency Missing = 13.004437925
DIFFICULT TO GET BEER
q21c Frequency Percent
Never heard of 10 5.36
Impossible 33 17.71
Very difficult 15 8.02
Somewhat diff 28 15.02Somewhat easy 36 19.23
Very easy 65 34.67
Frequency Missing = 17.002039047
DIFFICULT TO GET WINE
COOLERS
q21d Frequency Percent
Never heard of 28 14.56
Impossible 42 21.84
Very difficult 19 9.86Somewhat diff 30 15.56
Somewhat easy 28 14.50
Very easy 46 23.68
Frequency Missing = 11.005637364
DIFFICULT TO GET WINE
q21e Frequency Percent
Never heard of 18 9.38
Impossible 50 25.99
Very difficult 22 11.40
Somewhat diff 25 12.95
Somewhat easy 34 17.58
Very easy 44 22.69
Frequency Missing = 10.981168804
DIFFICULT TO GET LIQUOR
q21f Frequency Percent
Never heard of 15 7.72
Impossible 51 26.29
Very difficult 17 8.73
Somewhat diff 24 12.26
Somewhat easy 36 18.42
Very easy 52 26.58
Frequency Missing = 9.0313053635
DIFFICULT TO GET
INHALANTS
q21g Frequency Percent
Never heard of 28 14.95
Impossible 52 27.71
Very difficult 11 5.83
Somewhat diff 15 7.95
Somewhat easy 19 10.12Very easy 63 33.44
Frequency Missing = 15.990404486
DIFFICULT TO GET
MARIJUANA
q21h Frequency Percent
Never heard of 24 12.96
Impossible 81 43.71
Very difficult 14 7.47
Somewhat diff 21 11.27Somewhat easy 17 9.09
Very easy 29 15.49
Frequency Missing = 18.111547847
DIFFICULT TO GET COCAIN
q21i Frequency Perce
Never heard of 21 11.
Impossible 104 57.
Very difficult 27 14.
Somewhat diff 15 8.
Somewhat easy 9 4.
Very easy 6 3.
Frequency Missing = 21.9623376
DIFFICULT TO GET CRAC
q21j Frequency Perce
Never heard of 24 12.
Impossible 111 59.
Very difficult 27 14.
Somewhat diff 11 5.
Somewhat easy 8 4.
Very easy 6 3.
Frequency Missing = 16.9775704
DIFFICULT TO GE
HALLUCINOGEN
q21l Frequency Perce
Never heard of 80 42.
Impossible 67 35.
Very difficult 21 10.
Somewhat diff 11 5.
Somewhat easy 4 2.Very easy 8 4.
Frequency Missing = 13.0044379
DIFFICULT TO GET UPPER
q21m Frequency Perce
Never heard of 92 50.
Impossible 57 31.
Very difficult 8 4.
Somewhat diff 7 3.
Somewhat easy 6 3.Very easy 11 6.
Frequency Missing = 22.9005664
The frequencies have been weighted so that the
analysis reflects the distribution of students by grade
level in the district
Page

8/14/2019 JOHNSON COUNTY - Godley ISD - 2007 Texas School Survey of Drug and Alcohol Use
http://slidepdf.com/reader/full/johnson-county-godley-isd-2007-texas-school-survey-of-drug-and-alcohol 63/71
Godley
Spring 2007
DIFFICULT TO GET DOWNERS
q21n Frequency Percent
Never heard of 98 51.13
Impossible 60 31.28
Very difficult 9 4.64
Somewhat diff 7 3.64
Somewhat easy 7 3.61
Very easy 11 5.70
Frequency Missing = 11.919397685
DIFFICULT TO GET
ROHYPNOL
q21o Frequency Percent
Never heard of 104 55.43
Impossible 51 27.16
Very difficult 14 7.36
Somewhat diff 7 3.71
Somewhat easy 5 2.65Very easy 7 3.69
Frequency Missing = 15.990404486
DIFFICULT TO GET STEROIDS
q21p Frequency Percent
Never heard of 35 18.49
Impossible 98 51.65
Very difficult 23 12.06
Somewhat diff 19 9.96
Somewhat easy 7 3.66Very easy 8 4.18
Frequency Missing = 13.918198246
DIFFICULT TO GET ECSTASY
q21q Frequency Percent
Never heard of 57 29.83
Impossible 89 46.40
Very difficult 20 10.31
Somewhat diff 8 4.16
Somewhat easy 5 2.60Very easy 13 6.71
Frequency Missing = 11.943866245
DIFFICULT TO GET HEROIN
q21r Frequency Percent
Never heard of 40 20.26
Impossible 109 55.15
Very difficult 30 15.03
Somewhat diff 7 3.54
Somewhat easy 5 2.49
Very easy 7 3.53
Frequency Missing = 5.9719331224
AGE WHEN FIRST USED
CIGARETTES
q22a Frequency Percent
9 or younger 19 29.18
10 years old 4 6.16
11 years old 4 6.19
12 years old 12 18.58
13 years old 12 18.5414 years old 11 16.79
15 years old 3 4.56
Frequency Missing = 139.05121605
AGE WHEN FIRST USED
SMOKELESS TOBACCO
q22b Frequency Percent
9 or younger 6 16.59
10 years old 5 13.98
11 years old 3 8.2912 years old 7 19.47
13 years old 11 30.64
14 years old 1 2.81
15 years old 2 5.48
16 years old 1 2.74
Frequency Missing = 167.99712135
AGE WHEN FIRST USED
BEER
q22c Frequency Percen
9 or younger 21 18.9
10 years old 7 6.3
11 years old 8 7.2
12 years old 22 19.8
13 years old 24 21.714 years old 19 16.9
15 years old 9 8.0
16 years old 1 0.8
Frequency Missing = 93.1277402
AGE WHEN FIRST USED
WINE COOLER
q22d Frequency Percen
9 or younger 9 9.8
10 years old 7 7.611 years old 12 13.1
12 years old 18 19.5
13 years old 20 21.8
14 years old 18 19.4
15 years old 8 8.6
Frequency Missing = 112.250922
AGE WHEN FIRST USED
WINE
q22e Frequency Percen9 or younger 10 10.8
10 years old 8 8.6
11 years old 8 8.6
12 years old 15 16.1
13 years old 19 20.4
14 years old 22 23.5
15 years old 8 8.5
16 years old 3 3.1
Frequency Missing = 111.214819
The frequencies have been weighted so that the
analysis reflects the distribution of students by grade
level in the district
Page

8/14/2019 JOHNSON COUNTY - Godley ISD - 2007 Texas School Survey of Drug and Alcohol Use
http://slidepdf.com/reader/full/johnson-county-godley-isd-2007-texas-school-survey-of-drug-and-alcohol 64/71
Godley
Spring 2007
AGE WHEN FIRST USED
LIQUOR
q22f Frequency Percent
9 or younger 8 9.64
10 years old 2 2.45
11 years old 7 8.50
12 years old 13 15.66
13 years old 26 31.3814 years old 19 22.82
15 years old 8 9.55
Frequency Missing = 121.28222805
AGE WHEN FIRST USED
INHALANTS
q22g Frequency Percent
9 or younger 3 15.93
10 years old 1 5.31
11 years old 1 5.3112 years old 6 31.61
13 years old 2 10.62
14 years old 5 26.04
15 years old 1 5.18
Frequency Missing = 184.95022327
AGE WHEN FIRST USED
MARIJUANA
q22h Frequency Percent
10 years old 3 8.7311 years old 3 8.95
12 years old 7 20.67
13 years old 12 35.37
14 years old 4 11.72
15 years old 5 14.56
Frequency Missing = 170.09379615
AGE WHEN FIRST USED
COCAINE
q22i Frequency Percent
12 years old 3 50.41
14 years old 1 16.53
15 years old 2 33.06
Frequency Missing = 198.02806688
AGE WHEN FIRST
USED CRACK
q22j Frequency Percent
Frequency Missing = 204
AGE WHEN FIRST USED
HALLUCINOGENS
q22l Frequency Percent
12 years old 1 19.90
13 years old 1 20.39
14 years old 3 59.70
Frequency Missing = 199.03970144
AGE WHEN FIRST USED
UPPERSq22m Frequency Percent
12 years old 2 39.80
13 years old 1 20.39
14 years old 1 19.90
16 years old 1 19.90
Frequency Missing = 199.03970144
AGE WHEN FIRST USED
DOWNERS
q22n Frequency Percent12 years old 1 50.00
16 years old 1 50.00
Frequency Missing = 202.025668
AGE WHEN FIRST USED
ROHYPNOL
q22o Frequency Percent
12 years old 1 33.06
13 years old 2 66.94
Frequency Missing = 201.01403344
AGE WHEN FIRST USED
STEROIDS
q22p Frequency Percen
10 years old 1 50.61
15 years old 1 49.39
Frequency Missing = 202.001199
AGE WHEN FIRST USED
ECSTASY
q22q Frequency Percen
12 years old 1 50.00
15 years old 1 50.00
Frequency Missing = 202.02566
AGE WHEN FIRST USED
HEROINq22r Frequency Percen
10 years old 1 100.00
Frequency Missing = 202.988365
HOW OFTEN NORMALLY U
CIGARETT
q23a Frequency Per
Every day 4
Several times/wk 8
Several times/mo 4 About once/month 6
About once/year 11
< once/year 19
Never used 144 7
Frequency Missing = 8.01967080
HOW OFTEN NORMALLY U
SMOKELESS TOBAC
q23b Frequency Per
Every day 3 Several times/wk 1
Several times/mo 5
About once/month 3
About once/year 9
< once/year 12
Never used 161 8
The frequencies have been weighted so that the
analysis reflects the distribution of students by grade
level in the district
Page

8/14/2019 JOHNSON COUNTY - Godley ISD - 2007 Texas School Survey of Drug and Alcohol Use
http://slidepdf.com/reader/full/johnson-county-godley-isd-2007-texas-school-survey-of-drug-and-alcohol 65/71
Godley
Spring 2007
Frequency Missing = 9.969534244
HOW OFTEN NORMALLY USE
BEER
q23c Frequency Percent
Several times/wk 9 4.61
Several times/mo 6 3.06
About once/month 29 14.82
About once/year 30 15.38
< once/year 30 15.38
Never used 91 46.75
Frequency Missing = 9.0313053635
HOW OFTEN NORMALLY USE
WINE COOLERS
q23d Frequency Percent
Several times/wk 3 1.56
Several times/mo 4 2.07
About once/month 24 12.42
About once/year 26 13.46
< once/year 30 15.43
Never used 106 55.06
Frequency Missing = 11.005637364
HOW OFTEN NORMALLY USE
WINE
q23e Frequency Percent
Several times/wk 2 1.05
Several times/mo 3 1.56
About once/month 17 8.87
About once/year 29 15.16
< once/year 33 17.19
Never used 107 56.17
Frequency Missing = 13.077843605
HOW OFTEN NORMALLY USE
LIQUOR
q23f Frequency Percent
Several times/wk 6 3.08
Several times/mo 8 4.08
About once/month 23 11.74
About once/year 24 12.28
< once/year 22 11.25
Never used 112 57.58
Frequency Missing = 9.0068368035
HOW OFTEN NORMALLY USE
INHALANTS
q23g Frequency Percent
Every day 1 0.52
Several times/wk 1 0.53
Several times/mo 2 1.05
About once/month 2 1.05
About once/year 5 2.62
< once/year 6 3.14
Never used 174 91.10
Frequency Missing = 13.053375045
HOW OFTEN NORMALLY USE
MARIJUANA
q23h Frequency Percent
Every day 2 1.02
Several times/wk 4 2.06
Several times/mo 4 2.08
About once/month 4 2.07
About once/year 4 2.08
< once/year 13 6.69
Never used 162 83.99
Frequency Missing = 10.981168804
HOW OFTEN NORMALLY USE
COCAINE
q23i Frequency Percent
About once/month 1 0.53
< once/year 4 2.12
Never used 182 97.35
Frequency Missing = 16.904164807
HOW OFTEN NORMALLY
USE CRACK
q23j Frequency Percent
< once/year 1 0.52
Never used 190 99.48
Frequency Missing = 12.979969365
HOW OFTEN NORMALLY U
HALLUCINOGE
q23l Frequency Perc
Several times/wk 1 0
About once/year 1 0
< once/year 3 1
Never used 184 97
Frequency Missing = 14.9787699
HOW OFTEN NORMALLY U
UPPE
q23m Frequency Perc
Several times/mo 1 0
About once/year 1 0
< once/year 3 1
Never used 181 97
Frequency Missing = 17.9402679
HOW OFTEN NORMALLY U
DOWNE
q23n Frequency Perc
Several times/mo 1 0
< once/year 1 0
Never used 187 98
Frequency Missing = 14.9053642
HOW OFTEN NORMALLY U
ROHYPNO
q23o Frequency Perc
About once/year 1 0
Never used 187 99
Frequency Missing = 15.9904044
HOW OFTEN NORMALLY U
STEROI
q23p Frequency PercAbout once/year 1 0
Never used 180 99
Frequency Missing = 23.0229092
The frequencies have been weighted so that the
analysis reflects the distribution of students by grade
level in the district
Page

8/14/2019 JOHNSON COUNTY - Godley ISD - 2007 Texas School Survey of Drug and Alcohol Use
http://slidepdf.com/reader/full/johnson-county-godley-isd-2007-texas-school-survey-of-drug-and-alcohol 66/71
Godley
Spring 2007
HOW OFTEN NORMALLY USE
ECSTASY
q23q Frequency Percent
About once/month 1 0.54
Never used 182 99.46
Frequency Missing = 21.024108728
HOW OFTEN NORMALLY
USE HEROIN
q23r Frequency Percent
Never used 187 100.00
Frequency Missing = 16.928633367
HOW MANY CIGARETTES IN
PAST 30 DAYS
q24 Frequency PercentNone 179 87.75
Less than 1 15 7.38
> 1 and < 10 7 3.41
> 10 and < 1pk 2 0.98
More than 2pks 1 0.48
AMOUNT OF BEER AT ONE
TIME
q25a Frequency Percent
Never drink this 94 47.34
12+ drinks 6 2.99
9-11 drinks 4 2.00
5-8 drinks 10 4.98
3-4 drinks 16 8.03
2 drinks 11 5.51
1 drink 28 14.06
< 1 drink 30 15.09
Frequency Missing = 4.984767122
AMOUNT OF WINE COOLERS
AT ONE TIME
q25b Frequency Percent
Never drink this 105 54.25
12+ drinks 4 2.06
9-11 drinks 3 1.53
5-8 drinks 8 4.12
3-4 drinks 14 7.192 drinks 8 4.15
1 drink 24 12.33
< 1 drink 28 14.39
Frequency Missing = 9.9940028039
AMOUNT OF WINE AT ONE
TIME
q25c Frequency Percent
Never drink this 113 58.08
12+ drinks 2 1.019-11 drinks 4 2.04
5-8 drinks 1 0.51
3-4 drinks 5 2.57
2 drinks 8 4.09
1 drink 21 10.72
< 1 drink 41 20.99
Frequency Missing = 8.9823682436
AMOUNT OF LIQUOR AT ONE
TIMEq25d Frequency Percent
Never drink this 114 58.62
12+ drinks 4 2.03
9-11 drinks 2 1.01
5-8 drinks 7 3.59
3-4 drinks 18 9.16
2 drinks 13 6.66
1 drink 15 7.68
< 1 drink 22 11.25
Frequency Missing = 9.0068368035
ALCOHO
q26a Frequency Perc
Never 5+ at time 105 51
None 70 34
1 day 13 6
2 days 7 3
3 to 5 days 5 2
6 to 9 days 1 010 or more days 3 1
GET ALCOHOLIC BEVERAG
FROM HOM
q27a Frequency Perc
Do not Drink 87 44
Never 46 23
Seldom 52 26
Most of the Time 10 5
Always 3 1
Frequency Missing = 5.99640168
GET ALCOHOLIC BEVERAG
FROM FRIEN
q27b Frequency Perc
Do not Drink 74 38
Never 50 26
Seldom 39 20
Most of the Time 16 8
Always 13 6
Frequency Missing = 11.9438662
GET ALCOHOLIC BEVERAG
FROM A STO
q27c Frequency Perc
Do not Drink 77 41
Never 98 52
Seldom 9 4
Most of the Time 2 1
Always 1 0
Frequency Missing = 16.9775704
The frequencies have been weighted so that the
analysis reflects the distribution of students by grade
level in the district
Page

8/14/2019 JOHNSON COUNTY - Godley ISD - 2007 Texas School Survey of Drug and Alcohol Use
http://slidepdf.com/reader/full/johnson-county-godley-isd-2007-texas-school-survey-of-drug-and-alcohol 67/71
Godley
Spring 2007
GET ALCOHOLIC BEVERAGES
AT PARTIES
q27d Frequency Percent
Do not Drink 72 36.95
Never 47 24.13
Seldom 33 16.97
Most of the Time 20 10.24
Always 23 11.72
Frequency Missing = 8.9823682436
GET ALCOHOLIC BEVERAGES
FROM OTHER
q27e Frequency Percent
Do not Drink 73 38.88
Never 60 31.93
Seldom 31 16.44
Most of the Time 13 6.92
Always 11 5.83
Frequency Missing = 15.965935926
USE MARIJUANA AS JOINTS
q28a Frequency Percent
Never 171 86.39
Seldom 14 7.07
Half the time 5 2.52
Most of the time 3 1.52
Always 4 2.01
Don't know 1 0.50
Frequency Missing = 5.9719331224
USE MARIJUANA AS BLUNTS
q28b Frequency Percent
Never 174 90.66
Seldom 7 3.64
Half the time 3 1.57
Most of the time 3 1.56
Always 4 2.07
Don't know 1 0.51
Frequency Missing = 12.017271925
USE MARIJUANA IN BONGS OR
WATER PIPES
q28c Frequency Percent
Never 169 88.97
Seldom 10 5.23
Half the time 1 0.53
Most of the time 5 2.65
Always 5 2.61
Frequency Missing = 14.016072485
USE MARIJUANA IN PIPES
q28d Frequency Percent
Never 172 88.68
Seldom 10 5.15
Half the time 1 0.51
Most of the time 6 3.10
Always 5 2.56
Frequency Missing = 9.969534244
USE MARIJUANA OTHER WAYS
q28e Frequency Percent
Never 183 93.38
Seldom 8 4.08
Most of the time 1 0.52
Always 3 1.51
Don't know 1 0.52
Frequency Missing = 7.9707336832
TAKE DXM, TRIPLE C'S, ETC. TO
GET HIGH
q29a Frequency Percent
Never heard/used 190 96.43
At least once/month 1 0.51
At least once/year 3 1.52
At least once/life 3 1.54
Frequency Missing = 7.0080362427
TAKE CODEINE COUGH SYRUP
GET H
q29b Frequency Per
Never heard/used 190 9
At least once/month 2
At least once/year 3
At least once/life 1
Frequency Missing = 7.97073368
DANGEROUS FOR KIDS TO
USE TOBACCO
q30a Frequency Percen
Very 80 44.29
Somewhat 61 33.62
Not very 27 14.95
Not at all 9 4.94
Don't know 4 2.21
Frequency Missing = 23.0473778
DANGEROUS FOR KIDS TO
USE ALCOHOL
q30b Frequency Percen
Very 71 39.13
Somewhat 69 37.86
Not very 31 16.99
Not at all 8 4.38
Don't know 3 1.64
Frequency Missing = 21.9623376
DANGEROUS FOR KIDS TO
USE INHALANTS
q30c Frequency Percen
Very 133 82.65
Somewhat 21 12.96
Not very 3 1.88
Don't know 4 2.50
Frequency Missing = 42.9619777
The frequencies have been weighted so that the
analysis reflects the distribution of students by grade
level in the district
Page
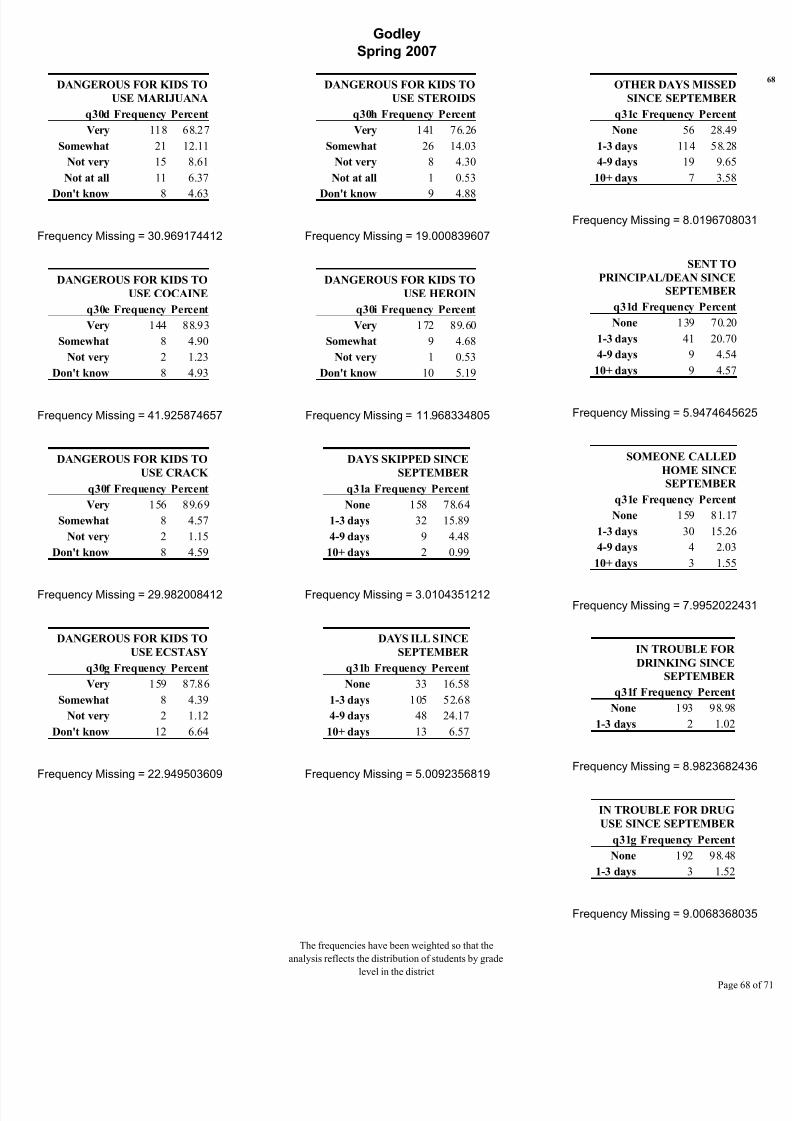
8/14/2019 JOHNSON COUNTY - Godley ISD - 2007 Texas School Survey of Drug and Alcohol Use
http://slidepdf.com/reader/full/johnson-county-godley-isd-2007-texas-school-survey-of-drug-and-alcohol 68/71
Godley
Spring 2007
DANGEROUS FOR KIDS TO
USE MARIJUANA
q30d Frequency Percent
Very 118 68.27
Somewhat 21 12.11
Not very 15 8.61
Not at all 11 6.37
Don't know 8 4.63
Frequency Missing = 30.969174412
DANGEROUS FOR KIDS TO
USE COCAINE
q30e Frequency Percent
Very 144 88.93
Somewhat 8 4.90
Not very 2 1.23
Don't know 8 4.93
Frequency Missing = 41.925874657
DANGEROUS FOR KIDS TO
USE CRACK
q30f Frequency Percent
Very 156 89.69
Somewhat 8 4.57
Not very 2 1.15
Don't know 8 4.59
Frequency Missing = 29.982008412
DANGEROUS FOR KIDS TO
USE ECSTASY
q30g Frequency Percent
Very 159 87.86
Somewhat 8 4.39
Not very 2 1.12
Don't know 12 6.64
Frequency Missing = 22.949503609
DANGEROUS FOR KIDS TO
USE STEROIDS
q30h Frequency Percent
Very 141 76.26
Somewhat 26 14.03
Not very 8 4.30
Not at all 1 0.53
Don't know 9 4.88
Frequency Missing = 19.000839607
DANGEROUS FOR KIDS TO
USE HEROIN
q30i Frequency Percent
Very 172 89.60
Somewhat 9 4.68
Not very 1 0.53
Don't know 10 5.19
Frequency Missing = 11.968334805
DAYS SKIPPED SINCE
SEPTEMBER
q31a Frequency Percent
None 158 78.64
1-3 days 32 15.89
4-9 days 9 4.48
10+ days 2 0.99
Frequency Missing = 3.0104351212
DAYS ILL SINCE
SEPTEMBER
q31b Frequency Percent
None 33 16.58
1-3 days 105 52.68
4-9 days 48 24.17
10+ days 13 6.57
Frequency Missing = 5.0092356819
OTHER DAYS MISSED
SINCE SEPTEMBER
q31c Frequency Percent
None 56 28.49
1-3 days 114 58.28
4-9 days 19 9.65
10+ days 7 3.58
Frequency Missing = 8.01967080
SENT TO
PRINCIPAL/DEAN SINCE
SEPTEMBER
q31d Frequency Percent
None 139 70.20
1-3 days 41 20.70
4-9 days 9 4.54
10+ days 9 4.57
Frequency Missing = 5.94746456
SOMEONE CALLED
HOME SINCE
SEPTEMBER
q31e Frequency Percent
None 159 81.17
1-3 days 30 15.26
4-9 days 4 2.03
10+ days 3 1.55
Frequency Missing = 7.99520224
IN TROUBLE FOR
DRINKING SINCE
SEPTEMBER
q31f Frequency Percent
None 193 98.98
1-3 days 2 1.02
Frequency Missing = 8.98236824
IN TROUBLE FOR DRUG
USE SINCE SEPTEMBER
q31g Frequency Percent
None 192 98.48
1-3 days 3 1.52
Frequency Missing = 9.00683680
The frequencies have been weighted so that the
analysis reflects the distribution of students by grade
level in the district
Page

8/14/2019 JOHNSON COUNTY - Godley ISD - 2007 Texas School Survey of Drug and Alcohol Use
http://slidepdf.com/reader/full/johnson-county-godley-isd-2007-texas-school-survey-of-drug-and-alcohol 69/71
Godley
Spring 2007
TROUBLE WITH FRIENDS
BECAUSE OF DRINKING
q32a Frequency Percent
None 179 91.31
1-3 times 12 6.14
4-9 times 4 2.04
10+ times 1 0.50
Frequency Missing = 7.9707336832
DRIVEN A CAR AFTER A
GOOD BIT TO DRINK
q32b Frequency Percent
None 187 94.94
1-3 times 5 2.54
4-9 times 3 1.52
10+ times 2 1.00
Frequency Missing = 6.9835676828
CRITICIZED BY DATE
BECAUSE OF DRINKING
q32c Frequency Percent
None 177 93.17
1-3 times 10 5.25
4-9 times 1 0.53
10+ times 2 1.05
Frequency Missing = 13.991603926
TROUBLE WITH POLICE
BECAUSE OF DRINKING
q32d Frequency Percent
None 188 97.40
1-3 times 2 1.04
4-9 times 2 1.05
10+ times 1 0.51
Frequency Missing = 10.981168804
TROUBLE WITH FRIENDS
BECAUSE OF DRUG USE
q32e Frequency Percent
None 182 95.80
1-3 times 5 2.62
4-9 times 2 1.05
10+ times 1 0.52
Frequency Missing = 14.016072485
DRIVEN A CAR WHILE
HIGH FROM DRUGS
q32f Frequency Percent
None 179 95.72
1-3 times 3 1.61
4-9 times 1 0.53
10+ times 4 2.14
Frequency Missing = 17.026507607
CRITICIZED BY DATE
BECAUSE OF DRUG USE
q32g Frequency Percent
None 182 97.31
1-3 times 3 1.62
4-9 times 1 0.54
10+ times 1 0.53
Frequency Missing = 17.002039047
TROUBLE WITH POLICE
BECAUSE OF DRUG USE
q32h Frequency Percent
None 191 98.47
1-3 times 2 1.02
10+ times 1 0.51
Frequency Missing = 9.9940028039
CLASS DAYS DRUNK ONALCOHOL SINCE SEPT
q33a Frequency Percent
None 182 92.88
1-3 days 10 5.09
4-9 days 1 0.50
10+ days 3 1.54
Frequency Missing = 7.94626512
CLASS DAYS HIGH ON
MARIJUANA SINCE SEPT
q33b Frequency Percent
None 189 95.49
1-3 days 2 1.00
4-9 days 3 1.50
10+ days 4 2.02
Frequency Missing = 5.97193312
CLASS DAYS HIGH ON
INHALANTS SINCE SEPT
q33c Frequency Percent
None 192 97.96
1-3 days 3 1.52
10+ days 1 0.52
Frequency Missing = 7.97073368
CLASS DAYS HIGH ON
OTHER DRUG(S)
q33d Frequency Percent
None 189 94.53
1-3 days 9 4.45
10+ days 2 1.01
Frequency Missing = 3.97313256
ALCOHOL USE AT PARTI
THIS SCHOOL YEA
q34a Frequency Perc
Never 77 38
Seldom 35 17
Half the time 11 5
Most of the time 20 9
Always 22 10
Don't know 5 2
Didn't attend 30 14
Frequency Missing = 3.97313256
The frequencies have been weighted so that the
analysis reflects the distribution of students by grade
level in the district
Page

8/14/2019 JOHNSON COUNTY - Godley ISD - 2007 Texas School Survey of Drug and Alcohol Use
http://slidepdf.com/reader/full/johnson-county-godley-isd-2007-texas-school-survey-of-drug-and-alcohol 70/71
Godley
Spring 2007
DRUG USE AT PARTIES THIS
SCHOOL YEAR
q34b Frequency Percent
Never 122 60.84
Seldom 18 8.90
Half the time 9 4.46
Most of the time 7 3.47
Always 7 3.47Don't know 8 3.97
Didn't attend 30 14.89
Frequency Missing = 2.9859665612
SOUGHT HELP FOR
DRUG/ALCOHOL
PROBLEM
q35 Frequency Percent
No 177 95.17
Yes 9 4.83
Frequency Missing = 17.964736487
WOULD SEEK HELP
FROM SCHOOL
COUNSELOR
q36a Frequency Percent
No 126 63.20
Yes 73 36.80
Frequency Missing = 4.984767122
WOULD SEEK HELP
OUTSIDE OF SCHOOL
q36b Frequency Percent
No 138 70.75
Yes 57 29.25
Frequency Missing = 8.9823682436
WOULD SEEK HELPFROM OTHER
COUNSELOR
q36c Frequency Percent
No 121 63.36
Yes 70 36.64
Frequency Missing = 13.004437925
WOULD SEEK HELP
FROM PARENTS
q36d Frequency Percent
No 55 28.13
Yes 140 71.87
Frequency Missing = 8.9578996836
WOULD SEEK HELP
FROM A MEDICAL
DOCTOR
q36e Frequency Percent
No 110 57.31
Yes 82 42.69
Frequency Missing = 11.992803365
WOULD SEEK HELP
FROM FRIENDS
q36f Frequency Percent
No 50 25.53
Yes 146 74.47
Frequency Missing = 7.9952022431
WOULD SEEK HELP
FROM ANOTHER
ADULT
q36g Frequency Percent
No 59 30.40
Yes 135 69.60
Frequency Missing = 9.945065684
WOULD NOT SEEK
HELP
q36h Frequency Percent
No 171 87.70
Yes 24 12.30
Frequency Missing = 8.9823682436
DRUG/ALCOHOL
INFO--SCHOOL
HEALTH CLASS
q37a Frequency Percent
No 122 70.90
Yes 50 29.10
Frequency Missing = 32.0052775
DRUG/ALCOHOL
INFO--SCHOOL
ASSEMBLY PROGRAM
q37b Frequency Percent
No 71 41.49
Yes 100 58.51
Frequency Missing = 32.9924435
DRUG/ALCOHOL
INFO--SCHOOL
GUIDANCE
COUNSELOR
q37c Frequency Percent
No 97 56.81
Yes 73 43.19
Frequency Missing = 34.0285466
DRUG/ALCOHOL
INFO--SCIENCE CLASS
q37d Frequency Percent
No 132 78.10
Yes 37 21.90
Frequency Missing = 35.0157126
DRUG/ALCOHOL
INFO--SOCIAL
STUDIES CLASS
q37e Frequency Percent
No 135 79.84Yes 34 20.16
Frequency Missing = 34.9667755
The frequencies have been weighted so that the
analysis reflects the distribution of students by grade
level in the district
Page

8/14/2019 JOHNSON COUNTY - Godley ISD - 2007 Texas School Survey of Drug and Alcohol Use
http://slidepdf.com/reader/full/johnson-county-godley-isd-2007-texas-school-survey-of-drug-and-alcohol 71/71
Godley
Spring 2007
DRUG/ALCOHOL
INFO--SCHOOL
STUDENT GROUP OR
CLUB
q37f Frequency Percent
No 148 88.10
Yes 20 11.90
Frequency Missing = 36.002878654
DRUG/ALCOHOL
INFO--INVITED
SCHOOL GUEST
q37g Frequency Percent
No 82 48.48
Yes 87 51.52
Frequency Missing = 35.015712654
DRUG/ALCOHOL
INFO--ANOTHER
SCHOOL SOURCE
q37h Frequency Percent
No 108 63.93
Yes 61 36.07
Frequency Missing = 34.966775534
DRUG/ALCOHOL INFO--
WEBSITE/ONLINE CHAT
GROUP
q38a Frequency Percent
No 153 80.63
Yes 37 19.37
Frequency Missing = 13.967135366
DRUG/ALCOHOL INFO--
BOOKS/MAGAZINES/POSTERS/PA
MPHLETS
q38b FrequencyN 82
DRUG/ALCOHOL INFO--
BOOKS/MAGAZINES/POSTERS/PA
MPHLETS
q38b Percent
No 42.31
Yes 57.69
Frequency Missing = 9.945065684
DRUG/ALCOHOL INFO--
TV/RADIO/OTHER
AUDIO/VIDEO
q38c Frequency Percent
No 88 45.93
Yes 104 54.07
Frequency Missing = 11.894929125
DRUG/ALCOHOL
INFO--PARENTS
q38d Frequency Percent
No 87 45.09
Yes 106 54.91
Frequency Missing = 10.932231684
PARENTS FEEL ABOUT KIDS
SMOKING CIGARET
q39a Frequency Percent
Strong disapprove 162 82.66
Mild disapprove 18 9.14
Neither 6 3.06
Mildly approve 1 0.50
Strongly approve 1 0.52
Don't know 8 4.12
Frequency Missing = 7.9952022431
PARENTS FEEL ABOUT KIDS
DRINKING BEER
q39b Frequency Percent
Frequency Missing = 7.99520224
PARENTS FEEL ABOUT K
USING MARIJUA
q39c Frequency Per
Strong disapprove 172 8Mild disapprove 7
Neither 5
Mildly approve 2
Strongly approve 1
Don't know 8
Frequency Missing = 8.98236824
TESTED FOR DRUG
USE AT SCHOOL
q40 Frequency PercentNo 85 42.51
Yes 115 57.49
Frequency Missing = 3.97313256
PURCHASED
LOTTERY TICKET IN
PAST YEAR
q41 Frequency Percent
No 184 92.47
Yes 15 7.53
Frequency Missing = 4.9602985