Embed Size (px)
Citation preview
JOHNSON COUNTY
SOLID WASTE MANAGEMENT PLAN, 2007 EDITION
Submitted to:
The Kansas Department of Health and Environment
By:
The Johnson County Board of County Commissioners and The Johnson County Solid Waste Management Committee
January 3, 2008
Acknowledgements The Johnson County Board of County Commissioners would not have been able to undertake this planning effort without the enthusiastic commitment and assistance of many organizations. The Commissioners acknowledge the support of the following organizations and groups in developing the Johnson County Solid Waste Management Plan, 2007 Edition.
• Johnson County Solid Waste Management Committee • Johnson County Ad Hoc Solid Waste Stakeholders Group • Kansas Department of Health and Environment/Bureau of Waste Management • Mid-America Regional Council • Engineering Solutions & Design, Inc. • Franklin Associates, Division of ERG • Carol Nalbandian Consulting • Deffenbaugh Industries, Inc. • APAC – KS, Inc. • City of Olathe, KS • N.R. Hamm Quarry, Inc. • Johnson County Environmental Department
CLIENTS\JOCO\KC081858 01.03.08 3607.00.001.001
iii
Table of Contents EXECUTIVE SUMMARY JOHNSON COUNTY SOLID WASTE MANAGEMENT PLAN ..............ES-1
BACKGROUND ..................................................................................................................................ES-1 DRIVING FORCE FOR A NEW PLAN..............................................................................................ES-1 THE CURRENT SOLID WASTE MANAGEMENT SYSTEM .........................................................ES-2 SOLID WASTE MANAGEMENT PLAN DEVELOPMENT PROCESS ..........................................ES-3 KEY THEMES IN THE NEW PLAN..................................................................................................ES-4 KEY RECOMMENDATIONS IN THE NEW PLAN .........................................................................ES-4 KEY STRATEGIES FOR IMPLEMENTING PLAN RECOMMENDATIONS ................................ES-6 IMPACTS OF IMPLEMENTING RECOMMENDATIONS AND STRATEGIES............................ES-7
Solid Waste Generation, Recovery, and Disposal in Johnson County, 2005...................................ES-7 Projected Municipal Solid Waste Generation, Recovery, and Disposal ..........................................ES-9
RESOURCES NEEDED TO IMPLEMENT THE NEW PLAN........................................................ES-12 SUMMARY........................................................................................................................................ES-12
CHAPTER 1 – INTRODUCTION AND GENERAL COUNTY INFORMATION .................................. 1-1
INTRODUCTION .................................................................................................................................. 1-1 GENERAL COUNTY DESCRIPTION ................................................................................................. 1-1
Geographical and Geological Characteristics .................................................................................... 1-2 Population .......................................................................................................................................... 1-4 Housing.............................................................................................................................................. 1-4 Population Projections ....................................................................................................................... 1-7 Employment....................................................................................................................................... 1-7 Employment Projections .................................................................................................................... 1-8 Current Waste Management Administration in Johnson County....................................................... 1-8
NEED FOR NEW SOLID WASTE MANAGEMENT PLAN (SWMP) ............................................. 1-11 CHAPTER 1 REFERENCES ............................................................................................................... 1-13
CHAPTER 2 – STATE AND LOCAL LEGISLATIVE/REGULATORY REVIEW................................. 2-1
INTRODUCTION .................................................................................................................................. 2-1 KANSAS ................................................................................................................................................ 2-1 JOHNSON COUNTY ............................................................................................................................ 2-3 CITY ORDINANCES AND CODES..................................................................................................... 2-3
DeSoto ............................................................................................................................................... 2-4 Edgerton............................................................................................................................................. 2-4 Fairway .............................................................................................................................................. 2-4 Gardner .............................................................................................................................................. 2-4 Leawood............................................................................................................................................. 2-5 Lenexa................................................................................................................................................ 2-5 Merriam ............................................................................................................................................. 2-5 Mission .............................................................................................................................................. 2-5 Mission Hills...................................................................................................................................... 2-5 Olathe................................................................................................................................................. 2-6 Overland Park .................................................................................................................................... 2-6 Prairie Village .................................................................................................................................... 2-6 Roeland Park...................................................................................................................................... 2-6 Shawnee............................................................................................................................................. 2-6 Spring Hill.......................................................................................................................................... 2-7 Westwood .......................................................................................................................................... 2-7 Westwood Hills.................................................................................................................................. 2-7
SUMMARY............................................................................................................................................ 2-7 CHAPTER 2 REFERENCES ............................................................................................................... 2-10
CLIENTS\JOCO\KC081858 01.03.08 3607.00.001.001
iv
Table of Contents (Cont'd) CHAPTER 3 – CURRENT SOLID WASTE MANAGEMENT SYSTEM................................................ 3-1
INTRODUCTION .................................................................................................................................. 3-1 COLLECTION AND TRANSPORTATION SERVICES ..................................................................... 3-1
Residential MSW............................................................................................................................... 3-1 Non-Residential MSW....................................................................................................................... 3-5 MSW Special Wastes......................................................................................................................... 3-5 Other Solid Waste .............................................................................................................................. 3-9 Solid Waste Collection Firms .......................................................................................................... 3-12
SOLID WASTE MANAGEMENT FACILITIES................................................................................ 3-13 Recycling and Composting Facilities for MSW .............................................................................. 3-13 Solid Waste Disposal Facilities........................................................................................................ 3-16
SUMMARY.......................................................................................................................................... 3-19 CHAPTER 3 REFERENCES ............................................................................................................... 3-25
CHAPTER 4 – CURRENT COSTS OF SOLID WASTE MANAGEMENT............................................. 4-1
INTRODUCTION .................................................................................................................................. 4-1 RESIDENTIAL MSW............................................................................................................................ 4-1 COMMERCIAL MSW........................................................................................................................... 4-3 MSW LANDFILL TIP FEES................................................................................................................. 4-5 CONSTRUCTION AND DEMOLITION DEBRIS............................................................................... 4-6 SUMMARY............................................................................................................................................ 4-6 CHAPTER 4 REFERENCES ................................................................................................................. 4-8
CHAPTER 5 – WASTE CHARACTERIZATION..................................................................................... 5-1
INTRODUCTION .................................................................................................................................. 5-1 MSW DISPOSAL................................................................................................................................... 5-1
Johnson County MSW Composition.................................................................................................. 5-1 Johnson County MSW Disposed ....................................................................................................... 5-3
JOHNSON COUNTY MSW RECOVERY BY RECYCLING AND COMPOSTING......................... 5-4 JOHNSON COUNTY MSW GENERATION ....................................................................................... 5-5 JOHNSON COUNTY CONSTRUCTION AND DEMOLITION DEBRIS DISPOSAL ...................... 5-6
Johnson County C&D Composition................................................................................................... 5-6 Johnson County C&D Disposed ........................................................................................................ 5-9
JOHNSON COUNTY C&D GENERATION ........................................................................................ 5-9 JOHNSON COUNTY OTHER WASTE DISPOSAL.......................................................................... 5-11 SUMMARY.......................................................................................................................................... 5-12 CHAPTER 5 REFERENCES ............................................................................................................... 5-13
CHAPTER 6 – PROJECTIONS.................................................................................................................. 6-1
INTRODUCTION .................................................................................................................................. 6-1 PROJECTIONS OF SOLID WASTE GENERATION .......................................................................... 6-1
Municipal Solid Waste....................................................................................................................... 6-1 Construction and Demolition Debris ................................................................................................. 6-2
PROJECTIONS OF MSW RECOVERY ............................................................................................... 6-3 Baseline Scenario............................................................................................................................... 6-3 Recovery Scenario A ......................................................................................................................... 6-4 Recovery Scenario B.......................................................................................................................... 6-5 Summary............................................................................................................................................ 6-6
CHAPTER 6 REFERENCES ................................................................................................................. 6-7
CLIENTS\JOCO\KC081858 01.03.08 3607.00.001.001
v
Table of Contents (Cont'd) CHAPTER 7 – SOLID WASTE REDUCTION AND DISPOSAL OPTIONS .......................................... 7-1
INTRODUCTION .................................................................................................................................. 7-1 SOLID WASTE REDUCTION.............................................................................................................. 7-1
MSW Reduction ................................................................................................................................ 7-2 Construction and Demolition Debris Reduction ................................................................................ 7-6 Waste Reduction Infrastructure Needs............................................................................................... 7-7
SOLID WASTE DISPOSAL.................................................................................................................. 7-8 Landfill Disposal................................................................................................................................ 7-8 Waste Transfer for Disposal Outside Johnson County .................................................................... 7-11 Mixed Waste Processing.................................................................................................................. 7-14 MSW Composting ........................................................................................................................... 7-17 Combustion With Energy Recovery ................................................................................................ 7-19 Alternative Technologies ................................................................................................................. 7-22
CHAPTER 7 REFERENCES ............................................................................................................... 7-26
CHAPTER 8 – PUBLIC PARTICIPATION............................................................................................... 8-1
INTRODUCTION .................................................................................................................................. 8-1 STAKEHOLDER GROUP FUNCTION AND GOALS........................................................................ 8-1 STAKEHOLDER MEETING FORMAT............................................................................................... 8-2 STAKEHOLDER GROUP SESSION 1................................................................................................. 8-4
Session 1 Educational Presentation.................................................................................................... 8-4 Session 1 Stakeholder Group Feedback Summary ............................................................................ 8-4
STAKEHOLDER GROUP SESSION 2................................................................................................. 8-8 Session 2 Educational Presentation.................................................................................................... 8-8 Session 2 Summary............................................................................................................................ 8-8
STAKEHOLDER GROUP SESSION 3............................................................................................... 8-10 Session 3 Educational Presentation.................................................................................................. 8-10 Session 3 Summary.......................................................................................................................... 8-11
STAKEHOLDER PROCESS SUMMARY ......................................................................................... 8-14 CHAPTER 9 – JOHNSON COUNTY POTENTIAL SOLID WASTE MANAGEMENT MEASURES, STRATEGIES, AND SCENARIOS .................................................................................... 9-1
INTRODUCTION .................................................................................................................................. 9-1 SOLID WASTE REDUCTION.............................................................................................................. 9-1 LONG-TERM DISPOSAL CAPACITY................................................................................................ 9-9 COUNTY ROLE IN SOLID WASTE MANAGEMENT.................................................................... 9-11 SUMMARY.......................................................................................................................................... 9-13
CHAPTER 10 – JOHNSON COUNTY FUTURE SOLID WASTE MANAGEMENT SYSTEM RECOMMENDATIONS, STRATEGIES, IMPLEMENTATION SCHEDULE, AND COUNTY COSTS ...................................................................................................................................................... 10-1
INTRODUCTION ................................................................................................................................ 10-1 SOLID WASTE REDUCTION............................................................................................................ 10-1
Residential Municipal Solid Waste.................................................................................................. 10-1 Commercial and Multi-Family Residential Municipal Solid Waste ................................................ 10-4 Other Solid Wastes .......................................................................................................................... 10-5
SOLID WASTE DISPOSAL................................................................................................................ 10-6 COUNTY ROLE AND OPERATIONS............................................................................................... 10-7
CLIENTS\JOCO\KC081858 01.03.08 3607.00.001.001
vi
Table of Contents (Cont'd)
SUMMARY.......................................................................................................................................... 10-9 Solid Waste Reduction................................................................................................................... 10-10 Solid Waste Disposal ..................................................................................................................... 10-11 County Role And Operations......................................................................................................... 10-11
APPENDICES APPENDIX A DEFINITIONS OF TERMS USED IN THIS DOCUMENT APPENDIX B ACRONYMS USED IN THIS DOCUMENT APPENDIX C DOMINATE SOILS FOR SANITARY FACILITIES APPENDIX D LOCAL EMERGENCY OPERATIONS PLAN APPENDIX E SUPPLEMENTAL SOLID WASTE FLOW MAPS APPENDIX F EXECUTIVE SUMMARY JOHNSON COUNTY SOLID WASTE ANALYSIS FINAL
REPORT APPENDIX G PRODUCTS INCLUDED IN MATERIAL CATEGORIES APPENDIX H JOHNSON COUNTY SOLID WASTE MANAGEMENT COMMITTEE MEMBERS APPENDIX I JOHNSON COUNTY AD HOC SOLID WASTE MANAGEMENT STAKEHOLDERS
GROUP PARTICIPANTS APPENDIX J JOHNSON COUNTY AD HOC SOLID WASTE STAKEHOLDER GROUP
PRESENTATIONS APPENDIX K PUBLIC HEARING NOTIFICATION APPENDIX L JOHNSON COUNTY PLANNING DEPARTMENT REVIEW APPENDIX M JOHNSON COUNTY CHRONOLOGY APPENDIX N JOHNSON COUNTY BOARD OF COUNTY COMMISSIONERS ADOPTION
RESOLUTION NO. 090-07 APPENDIX O KANSAS DEPARTMENT OF HEALTH AND ENVIRONMENT SOLID WASTE
MANAGEMENT PLAN FIVE-YEAR WORKSHEET APPENDIX P UTILITIES SERVING JOHNSON COUNTY
List of Tables Table ES-1 Generation of Solid Waste in Johnson County, 2005 ..........................................................ES-8 Table ES-2 Johnson County Municipal Solid Waste (MSW) Generation, Recovery, and
Disposal, 2005......................................................................................................................ES-8 Table ES-3 MSW Generation, Recovery, and Disposal 2005 Baseline Rates ......................................ES-10 Table ES-4 MSW Generation, Recovery, and Disposal Aggressive Waste Diversion Scenario ..........ES-11 Table 1-1 Johnson County Population Growth 2000 to 2005 ................................................................ 1-5 Table 1-2 Johnson County Housing Characteristics............................................................................... 1-6 Table 1-3 Employment in Johnson County ............................................................................................ 1-9 Table 2-1 City Codes/Ordinances .......................................................................................................... 2-8 Table 3-1 Residential Municipal Solid Waste Management Services in Johnson County ..................... 3-3 Table 3-2 Residential Recyclable Materials and Yard Waste Collection Services in Johnson
County.................................................................................................................................... 3-4 Table 3-3 Residential Solid Waste Haulers Operating in Johnson County by City.............................. 3-12 Table 3-4 Solid Waste Haulers Licensed in Overland Park ................................................................. 3-13 Table 3-5 Johnson and Wyandotte Counties Recovery Facilities ........................................................ 3-15 Table 3-6 Johnson County Waste Disposal Facilities .......................................................................... 3-17 Table 3-7 Solid Waste Disposed at the Olathe Transfer Station .......................................................... 3-20
CLIENTS\JOCO\KC081858 01.03.08 3607.00.001.001
vii
Table 3-8 MSW Landfills Within 60 Miles of Johnson County........................................................... 3-21 List of Tables (Cont’d)
Table 3-9 Solid Waste Disposed at the Johnson County Landfill ........................................................ 3-23 Table 3-10 C&D Landfills in Kansas City Region, 2005....................................................................... 3-24 Table 4-1 Charges for Municipal Solid Waste Household Collection in Johnson County..................... 4-4 Table 4-2 MSW Landfill Tipping Fees Within 60 Miles of Johnson County ........................................ 4-6 Table 4-3 Estimated Management Costs for Disposed MSW and C&D Debris from Johnson
County.................................................................................................................................... 4-7 Table 5-1 Fall 2006 and Spring 2007 (Combined) Waste Sorting Events Weight Data Summary
for the Johnson County Waste Stream ................................................................................... 5-3 Table 5-2 Estimated Johnson County MSW Disposed, 2005................................................................. 5-4 Table 5-3 Estimated Johnson County MSW Recovery by Recycling and Composting, 2005 ............... 5-5 Table 5-4 Estimated Johnson County MSW Generation, 2005.............................................................. 5-7 Table 5-5 Fall 2006 and Spring 2007 (Combined) Waste Sorting Events at the APAC-Reno C&D
Landfill................................................................................................................................... 5-8 Table 5-6 Fall 2006 and Spring 2007 (Combined) Waste Sorting Events Project Origin of Sampled
Loads at the APAC-Reno C&D Landfill ............................................................................... 5-9 Table 5-7 Quantities Received at Johnson County Construction and Demolition Landfills, 2005 ...... 5-10 Table 5-8 Estimated Johnson County Other Wastes Disposed, 2005................................................... 5-11 Table 5-9 Per Capita Waste Disposal Factors ...................................................................................... 5-12 Table 6-1 Projected Generation of MSW in Johnson County, 2005 – 2027 .......................................... 6-2 Table 6-2 Projected Generation of Construction & Demolition (C&D) Debris in Johnson County,
2005 – 2027............................................................................................................................ 6-2 Table 6-3 Baseline Scenario for Generation, Recovery, and Disposal of MSW in Johnson County ..... 6-3 Table 6-4 Increased MSW Recovery Scenario A for Johnson County .................................................. 6-4 Table 6-5 Increased MSW Recovery Scenario B for Johnson County................................................... 6-5 Table 6-6 Summary of Scenarios for Generation, Recovery, and Disposal of MSW in Johnson
County.................................................................................................................................... 6-6 Table 9-1 Curbside Recyclable Materials Collection and Participation Scenarios................................. 9-6 Table 9-2 Curbside Yard Waste Collection for Composting and Participation Scenarios and a
Volume-based Fee Structure Scenario ................................................................................... 9-7 Table 9-3 Commercial Recyclable Materials Collection Scenarios ....................................................... 9-8 Table 9-4 Curbside Collection of Recyclable Materials and Yard Waste and Commercial Recyclable
Materials Collection Scenarios .............................................................................................. 9-8 Table 10-1 Residential Municipal Solid Waste Targeted Measures & Strategies.................................. 10-2 Table 10-2 Commercial and Multi-Family Residential Municipal Solid Waste Targeted Measures
& Strategies.......................................................................................................................... 10-4 Table 10-3 Other Solid Wastes Targeted Measures & Strategies........................................................... 10-5 Table 10-4 Solid Waste Disposal Targeted Measures & Strategies ....................................................... 10-6 Table 10-5 County Role and Operations Targeted Measures & Strategies ............................................ 10-7
CLIENTS\JOCO\KC081858 01.03.08 3607.00.001.001
viii
List of Figures Figure ES-1 Composition of Disposed Johnson County Solid Waste...................................................... ES-3 Figure ES-2 Generation of Solid Waste in Johnson County, 2005 .......................................................... ES-7 Figure ES-3 Johnson County Residential, Commercial, and Total MSW Recovery and
Disposal, 2005...................................................................................................................... ES-9 Figure ES-4 MSW Generation, Recovery, and Disposal Projections (2005 Baseline Rates)................. ES-10 Figure ES-5 MSW Generation, Recovery, and Disposal Projections (Aggressive Waste Diversion
Scenario) ............................................................................................................................ ES-11 Figure ES-6 Projected Impact of Aggressive Recycling and Composting on Quantity of Johnson
County MSW Disposed ..................................................................................................... ES-11 Figure 1-1 Johnson County Population Projections..................................................................................1-7 Figure 1-2 Employment Forecast by Total Employment for Johnson County .......................................1-10 Figure 1-3 Employment Forecast by Industry Sector for Johnson County 2000 to 2030.......................1-10 Figure 1-4 Johnson County Organization Chart Current Solid Waste Management Functions .............1-12 Figure 3-1 Regional MSW Landfills ......................................................................................................3-22 Figure 8-1 Johnson County Solid Waste Management Plan Stakeholder’s Group Process......................8-7
Executive Summary Johnson County Solid Waste Management Plan
CLIENTS\JOCO\KC081858 01.03.08 3607.00.001.001
ES-1
EXECUTIVE SUMMARY
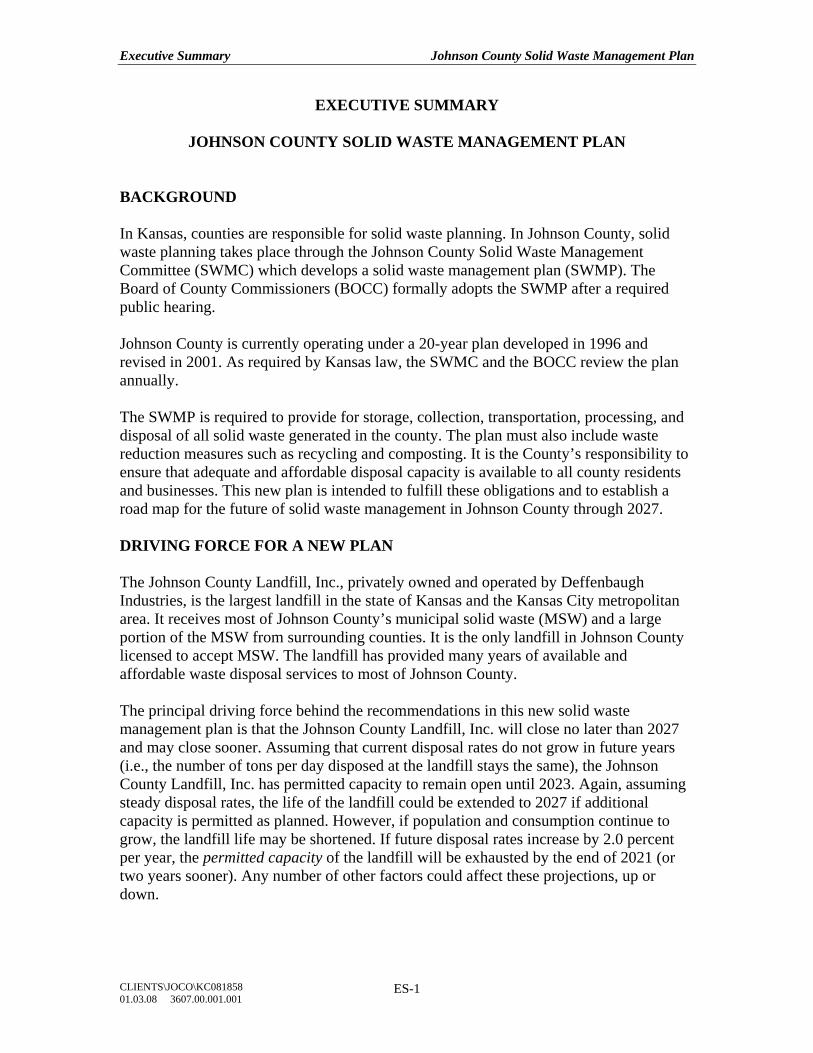
JOHNSON COUNTY SOLID WASTE MANAGEMENT PLAN BACKGROUND In Kansas, counties are responsible for solid waste planning. In Johnson County, solid waste planning takes place through the Johnson County Solid Waste Management Committee (SWMC) which develops a solid waste management plan (SWMP). The Board of County Commissioners (BOCC) formally adopts the SWMP after a required public hearing. Johnson County is currently operating under a 20-year plan developed in 1996 and revised in 2001. As required by Kansas law, the SWMC and the BOCC review the plan annually. The SWMP is required to provide for storage, collection, transportation, processing, and disposal of all solid waste generated in the county. The plan must also include waste reduction measures such as recycling and composting. It is the County’s responsibility to ensure that adequate and affordable disposal capacity is available to all county residents and businesses. This new plan is intended to fulfill these obligations and to establish a road map for the future of solid waste management in Johnson County through 2027. DRIVING FORCE FOR A NEW PLAN The Johnson County Landfill, Inc., privately owned and operated by Deffenbaugh Industries, is the largest landfill in the state of Kansas and the Kansas City metropolitan area. It receives most of Johnson County’s municipal solid waste (MSW) and a large portion of the MSW from surrounding counties. It is the only landfill in Johnson County licensed to accept MSW. The landfill has provided many years of available and affordable waste disposal services to most of Johnson County. The principal driving force behind the recommendations in this new solid waste management plan is that the Johnson County Landfill, Inc. will close no later than 2027 and may close sooner. Assuming that current disposal rates do not grow in future years (i.e., the number of tons per day disposed at the landfill stays the same), the Johnson County Landfill, Inc. has permitted capacity to remain open until 2023. Again, assuming steady disposal rates, the life of the landfill could be extended to 2027 if additional capacity is permitted as planned. However, if population and consumption continue to grow, the landfill life may be shortened. If future disposal rates increase by 2.0 percent per year, the permitted capacity of the landfill will be exhausted by the end of 2021 (or two years sooner). Any number of other factors could affect these projections, up or down.
Executive Summary Johnson County Solid Waste Management Plan
CLIENTS\JOCO\KC081858 01.03.08 3607.00.001.001
ES-2
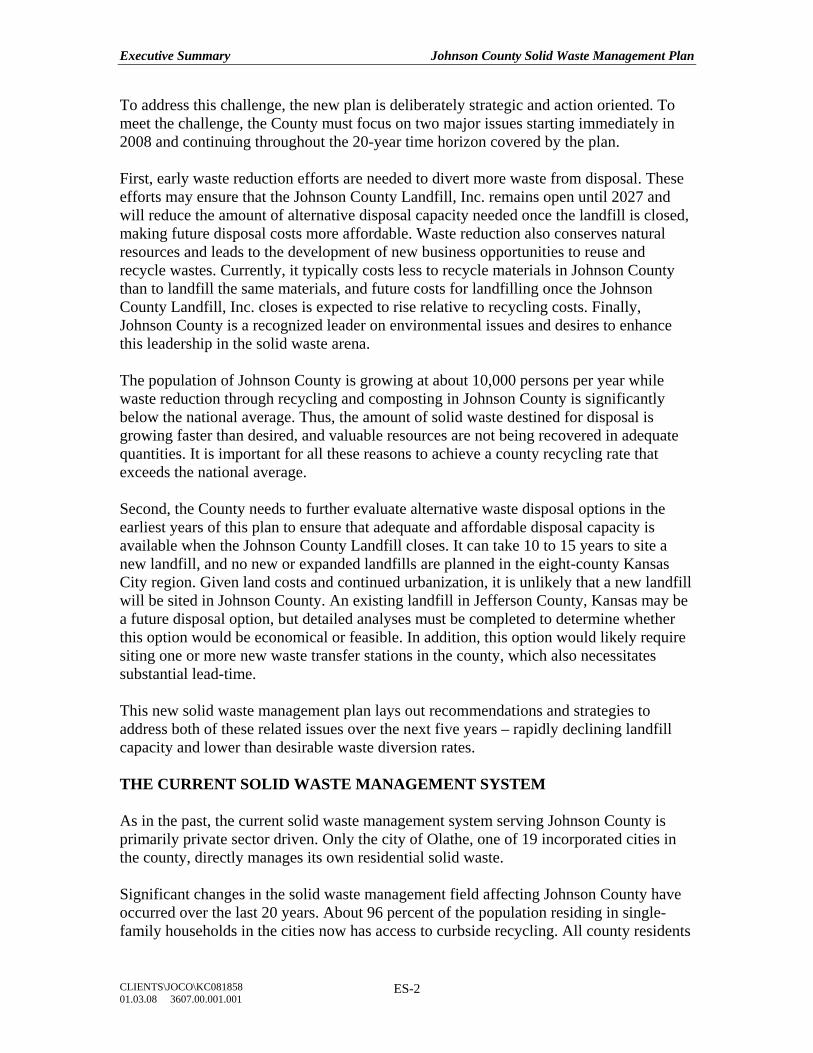
To address this challenge, the new plan is deliberately strategic and action oriented. To meet the challenge, the County must focus on two major issues starting immediately in 2008 and continuing throughout the 20-year time horizon covered by the plan. First, early waste reduction efforts are needed to divert more waste from disposal. These efforts may ensure that the Johnson County Landfill, Inc. remains open until 2027 and will reduce the amount of alternative disposal capacity needed once the landfill is closed, making future disposal costs more affordable. Waste reduction also conserves natural resources and leads to the development of new business opportunities to reuse and recycle wastes. Currently, it typically costs less to recycle materials in Johnson County than to landfill the same materials, and future costs for landfilling once the Johnson County Landfill, Inc. closes is expected to rise relative to recycling costs. Finally, Johnson County is a recognized leader on environmental issues and desires to enhance this leadership in the solid waste arena. The population of Johnson County is growing at about 10,000 persons per year while waste reduction through recycling and composting in Johnson County is significantly below the national average. Thus, the amount of solid waste destined for disposal is growing faster than desired, and valuable resources are not being recovered in adequate quantities. It is important for all these reasons to achieve a county recycling rate that exceeds the national average. Second, the County needs to further evaluate alternative waste disposal options in the earliest years of this plan to ensure that adequate and affordable disposal capacity is available when the Johnson County Landfill closes. It can take 10 to 15 years to site a new landfill, and no new or expanded landfills are planned in the eight-county Kansas City region. Given land costs and continued urbanization, it is unlikely that a new landfill will be sited in Johnson County. An existing landfill in Jefferson County, Kansas may be a future disposal option, but detailed analyses must be completed to determine whether this option would be economical or feasible. In addition, this option would likely require siting one or more new waste transfer stations in the county, which also necessitates substantial lead-time. This new solid waste management plan lays out recommendations and strategies to address both of these related issues over the next five years – rapidly declining landfill capacity and lower than desirable waste diversion rates. THE CURRENT SOLID WASTE MANAGEMENT SYSTEM As in the past, the current solid waste management system serving Johnson County is primarily private sector driven. Only the city of Olathe, one of 19 incorporated cities in the county, directly manages its own residential solid waste. Significant changes in the solid waste management field affecting Johnson County have occurred over the last 20 years. About 96 percent of the population residing in single-family households in the cities now has access to curbside recycling. All county residents
Executive Summary Johnson County Solid Waste Management Plan
CLIENTS\JOCO\KC081858 01.03.08 3607.00.001.001
ES-3
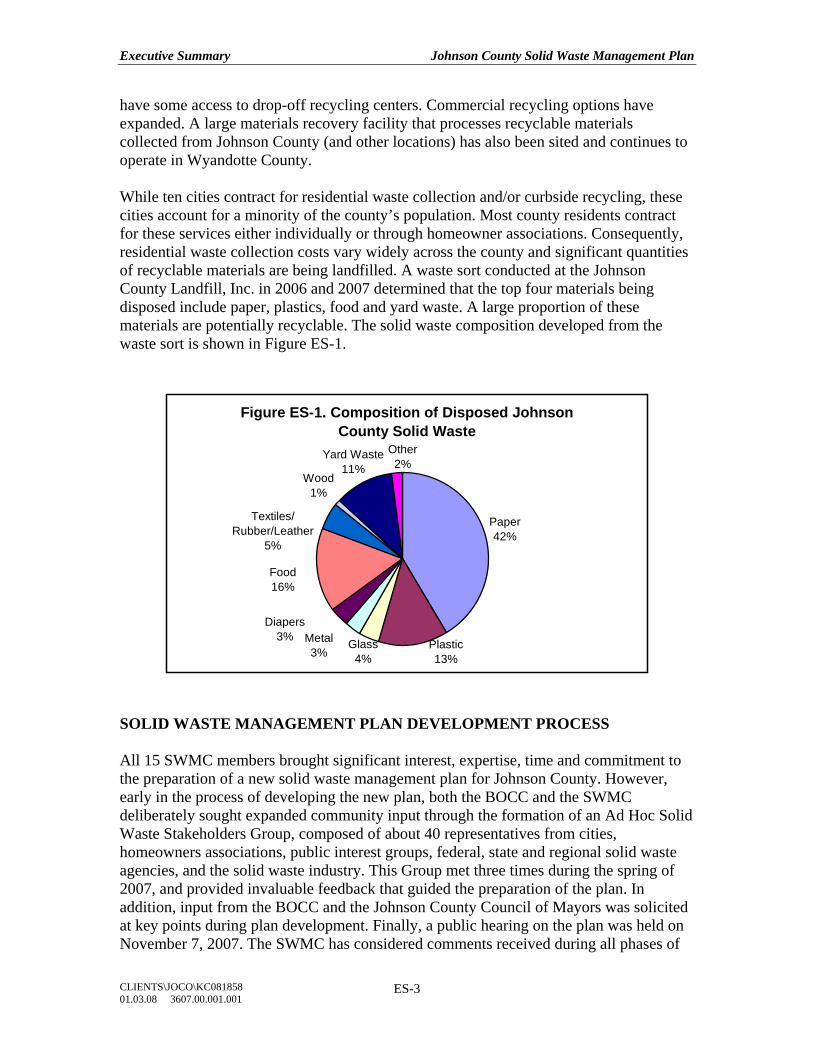
have some access to drop-off recycling centers. Commercial recycling options have expanded. A large materials recovery facility that processes recyclable materials collected from Johnson County (and other locations) has also been sited and continues to operate in Wyandotte County. While ten cities contract for residential waste collection and/or curbside recycling, these cities account for a minority of the county’s population. Most county residents contract for these services either individually or through homeowner associations. Consequently, residential waste collection costs vary widely across the county and significant quantities of recyclable materials are being landfilled. A waste sort conducted at the Johnson County Landfill, Inc. in 2006 and 2007 determined that the top four materials being disposed include paper, plastics, food and yard waste. A large proportion of these materials are potentially recyclable. The solid waste composition developed from the waste sort is shown in Figure ES-1.
Figure ES-1. Composition of Disposed Johnson County Solid Waste
Paper42%
Wood1%
Plastic13%
Glass4%
Metal3%
Diapers3%
Food16%
Textiles/Rubber/Leather
5%
Other2%
Yard Waste11%
SOLID WASTE MANAGEMENT PLAN DEVELOPMENT PROCESS All 15 SWMC members brought significant interest, expertise, time and commitment to the preparation of a new solid waste management plan for Johnson County. However, early in the process of developing the new plan, both the BOCC and the SWMC deliberately sought expanded community input through the formation of an Ad Hoc Solid Waste Stakeholders Group, composed of about 40 representatives from cities, homeowners associations, public interest groups, federal, state and regional solid waste agencies, and the solid waste industry. This Group met three times during the spring of 2007, and provided invaluable feedback that guided the preparation of the plan. In addition, input from the BOCC and the Johnson County Council of Mayors was solicited at key points during plan development. Finally, a public hearing on the plan was held on November 7, 2007. The SWMC has considered comments received during all phases of
Executive Summary Johnson County Solid Waste Management Plan
CLIENTS\JOCO\KC081858 01.03.08 3607.00.001.001
ES-4
preparing the plan. As a result, the plan represents a broad consensus across many sectors of the community regarding how best to address the solid waste challenges facing Johnson County over the next 20 years. KEY THEMES IN THE NEW PLAN While the time horizon for the new plan is 20 years, the next five years are critical to success in achieving the plan’s recommendations. General plan themes include:
(1) Ensuring adequate and affordable disposal capacity for county waste depends on success in reducing waste requiring disposal. Therefore, more aggressive waste reduction efforts are needed.
(2) More consistency in the scope and cost of solid waste services across the county is desirable.
(3) Close collaboration among the County, cities, businesses, homeowners associations and the solid waste industry is essential to success.
(4) Complexity and urgency call for a stronger County role. (5) Imposing some public control over waste flow may be necessary to ensure
adequate and affordable disposal capacity in the future. (6) Coordination with nearby county and regional partners may expand
solutions and reduce costs to the county, and should be further investigated.
(7) Landfilling is probably the most affordable future disposal option – but other emerging technologies should be followed and considered.
(8) A new transfer station(s) is likely needed somewhere in the county due to the distance to haul to other landfill(s).
(9) Johnson County is an unlikely site for a new landfill. KEY RECOMMENDATIONS IN THE NEW PLAN The plan recommends the following to achieve solid waste reduction in Johnson County:
(1) The County should strive to increase solid waste reduction through aggressive countywide education, promotion, and implementation of cost effective source reduction, recycling, and composting measures. Results, based on a per capita disposal rate, should be measured and reported annually. Educational, promotional, and implementation efforts should target a municipal solid waste (MSW) recovery rate that, at a minimum, exceeds the national average, which was 32 percent in 2005.
(2) The County should work with the cities, homeowners associations, and the private sector to increase residential participation in source reduction, curbside and drop-off recyclable materials collection, and composting of yard waste. The County should work with the cities, homeowners associations, and the private sector towards countywide consistency in residential waste reduction service levels including materials collected for recycling and recycling fees charged. In order
Executive Summary Johnson County Solid Waste Management Plan
CLIENTS\JOCO\KC081858 01.03.08 3607.00.001.001
ES-5
to effectively mitigate the need for and cost of providing future disposal capacity, the County should assume a more centralized role in implementing waste reduction efforts, in close coordination and consultation with the cities, homeowners associations and the private sector.
(3) The County should promote expansion of the existing commercial recycling infrastructure through education and awareness. The County should also investigate methods to expand commercial recycling to small sized companies currently not served by the existing system. Finally, the County should encourage the private sector to provide more convenient recycling opportunities for multi-family residential buildings, particularly apartment complexes.
(4) The County should investigate methods for increasing reuse and reducing the generation of construction and demolition (C&D) waste materials, and implement those methods that are shown to be most practical and promising. The County should monitor other non-MSW waste streams to identify potential areas where waste reduction can be achieved.
The plan recommends the following to provide for adequate and affordable capacity for solid waste generated for disposal in Johnson County.
The County should reduce the amount of solid waste requiring disposal by implementing waste reduction measures. The County should enter into discussions with local and regional waste haulers, processors, and disposal facility operators to better understand the private sector needs and any future private sector plans to provide additional disposal capacity. The County should evaluate the costs and benefits of meeting the County’s future disposal needs by exerting more control over waste flow both within and through Johnson County. The County should investigate whether Johnson County’s future disposal needs would be best served through development of regional solutions.
The plan recommends the following County role and County operations to achieve solid waste reduction in Johnson County.
The County should assume a leadership role for solid waste reduction in the county by acting as a coordinator, consensus builder, and educator through interaction with the cities and homeowners associations. The County should work with representatives of the existing solid waste management infrastructure to expand solid waste reduction opportunities. The County should lead by example by reviewing County operations to identify and implement waste reduction opportunities. The County should coordinate with other nearby county and regional partners in evaluating and implementing waste reduction strategies. As necessary to ensure adequate and affordable disposal capacity for waste generated in the county, the County should assume a more centralized role in implementing waste reduction efforts, in close coordination and consultation with the cities,
Executive Summary Johnson County Solid Waste Management Plan
CLIENTS\JOCO\KC081858 01.03.08 3607.00.001.001
ES-6
homeowners associations and the private sector, and should restrict the disposal of specific wastes at facilities located in the county when recycling or reuse alternatives are widely available.
KEY STRATEGIES FOR IMPLEMENTING PLAN RECOMMENDATIONS The plan lays out an implementation schedule for specific strategies needed to make progress towards the recommendations. Action on both fronts – waste reduction and waste disposal – are essential during the next five years, but some strategies will take longer to implement and others are staged later in the 20 year plan horizon to further evaluate their necessity and feasibility. Key solid waste reduction strategies include:
(1) Strive toward a county recycling rate that exceeds the national average (ongoing)
(2) Increase curbside recycling services, participation and quantities of materials collected (ongoing)
(3) Increase recycling in commercial and multi-family residential sectors (ongoing)
(4) Eliminate disposal of yard waste in landfill (by 2011) a. Establish widely available disposal alternatives (composting,
mulching mowers, curb-side segregation and pickup) b. Implement a countywide ban on yard waste going to the landfill
once alternatives are in place (5) Work towards implementing a countywide volume-based waste collection
rate structure (i.e., pay-as-you-throw) (by 2013-2017) (6) Promote better education about waste reduction (ongoing) (7) Implement countywide recycling of residential electronic waste (by 2008);
and evaluate ways to expand household hazardous waste collection opportunities for Johnson County residents (by 2009)
(8) Promote reuse and reduction of construction and demolition waste (ongoing)
(9) Lead by example by eliminating waste for disposal within County Government operations (ongoing)
The plan recognizes that additional investigation and analysis of waste disposal options must occur over the next five years prior to identifying the specific option(s) that represents the best disposal future for the county. Key solid waste disposal strategies in the plan include:
(1) Discuss Johnson County’s disposal needs with landfill owners and operators, and determine private sector plans for any new waste disposal or processing facilities (by 2010)
Executive Summary Johnson County Solid Waste Management Plan
CLIENTS\JOCO\KC081858 01.03.08 3607.00.001.001
ES-7
(2) Investigate and evaluate methods of establishing more public control over wastes generated in the county in order to provide for more affordable and adequate disposal capacity (by 2012)
(3) Explore whether multi-jurisdictional agreements may provide benefits to Johnson County (ongoing)
(4) Sponsor feasibility studies on processing and disposal options such as composting facilities and transfer stations (ongoing)
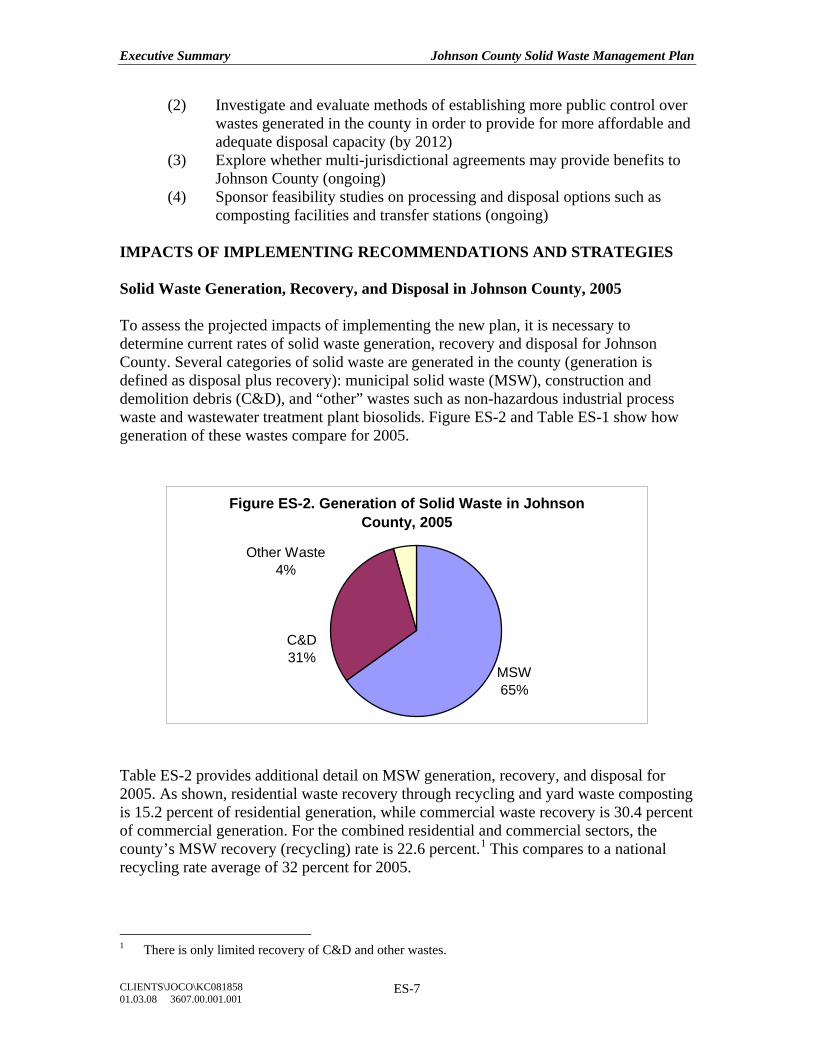
IMPACTS OF IMPLEMENTING RECOMMENDATIONS AND STRATEGIES Solid Waste Generation, Recovery, and Disposal in Johnson County, 2005 To assess the projected impacts of implementing the new plan, it is necessary to determine current rates of solid waste generation, recovery and disposal for Johnson County. Several categories of solid waste are generated in the county (generation is defined as disposal plus recovery): municipal solid waste (MSW), construction and demolition debris (C&D), and “other” wastes such as non-hazardous industrial process waste and wastewater treatment plant biosolids. Figure ES-2 and Table ES-1 show how generation of these wastes compare for 2005.
Figure ES-2. Generation of Solid Waste in Johnson County, 2005
MSW65%
C&D31%
Other Waste 4%
Table ES-2 provides additional detail on MSW generation, recovery, and disposal for 2005. As shown, residential waste recovery through recycling and yard waste composting is 15.2 percent of residential generation, while commercial waste recovery is 30.4 percent of commercial generation. For the combined residential and commercial sectors, the county’s MSW recovery (recycling) rate is 22.6 percent.1 This compares to a national recycling rate average of 32 percent for 2005.
1 There is only limited recovery of C&D and other wastes.
Executive Summary Johnson County Solid Waste Management Plan
CLIENTS\JOCO\KC081858 01.03.08 3607.00.001.001
ES-8
For 2005, residential waste generation is 3.15 pounds per person per day, of which 0.48 pounds per person per day is recovered (recycled) and 2.67 pounds per person per day is disposed. The commercial sector generates 2.96 pounds of waste per person per day, of which 0.90 pounds per person per day is recovered (recycled) and 2.06 pounds per person per day is disposed.
Table ES-1 Generation of Solid Waste in Johnson County, 2005
(In tons and pounds per person per day)
Solid Waste Category Quantity (tons) Percent of Total Pounds per Person per
Day (1) MSW (2) 565,473 65.0 6.12 C&D 267,178 30.7 2.89 Other Waste 37,243 4.3 0.40
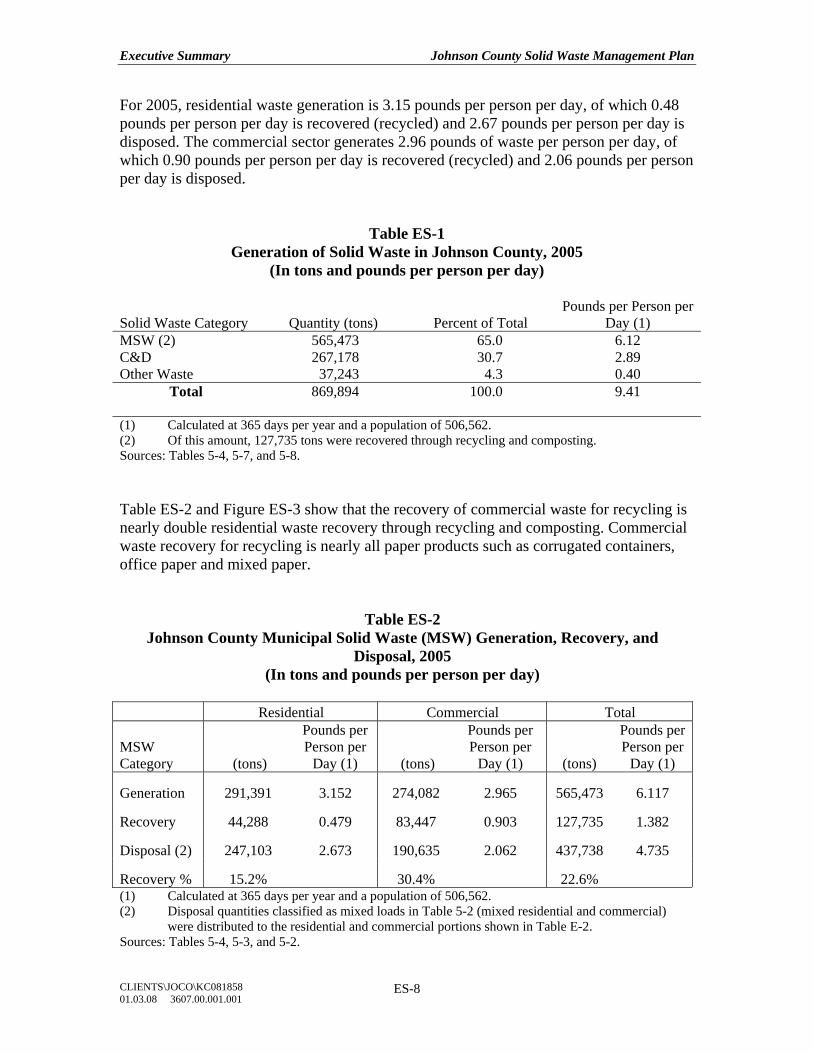
Total 869,894 100.0 9.41 (1) Calculated at 365 days per year and a population of 506,562. (2) Of this amount, 127,735 tons were recovered through recycling and composting. Sources: Tables 5-4, 5-7, and 5-8. Table ES-2 and Figure ES-3 show that the recovery of commercial waste for recycling is nearly double residential waste recovery through recycling and composting. Commercial waste recovery for recycling is nearly all paper products such as corrugated containers, office paper and mixed paper.
Table ES-2 Johnson County Municipal Solid Waste (MSW) Generation, Recovery, and
Disposal, 2005 (In tons and pounds per person per day)
Residential Commercial Total
MSW Category (tons)
Pounds per Person per
Day (1) (tons)
Pounds per Person per
Day (1)
(tons)
Pounds per Person per
Day (1)
Generation 291,391 3.152 274,082 2.965 565,473 6.117
Recovery 44,288 0.479 83,447 0.903 127,735 1.382
Disposal (2) 247,103 2.673 190,635 2.062 437,738 4.735
Recovery % 15.2% 30.4% 22.6% (1) Calculated at 365 days per year and a population of 506,562. (2) Disposal quantities classified as mixed loads in Table 5-2 (mixed residential and commercial)
were distributed to the residential and commercial portions shown in Table E-2. Sources: Tables 5-4, 5-3, and 5-2.
Executive Summary Johnson County Solid Waste Management Plan
CLIENTS\JOCO\KC081858 01.03.08 3607.00.001.001
ES-9
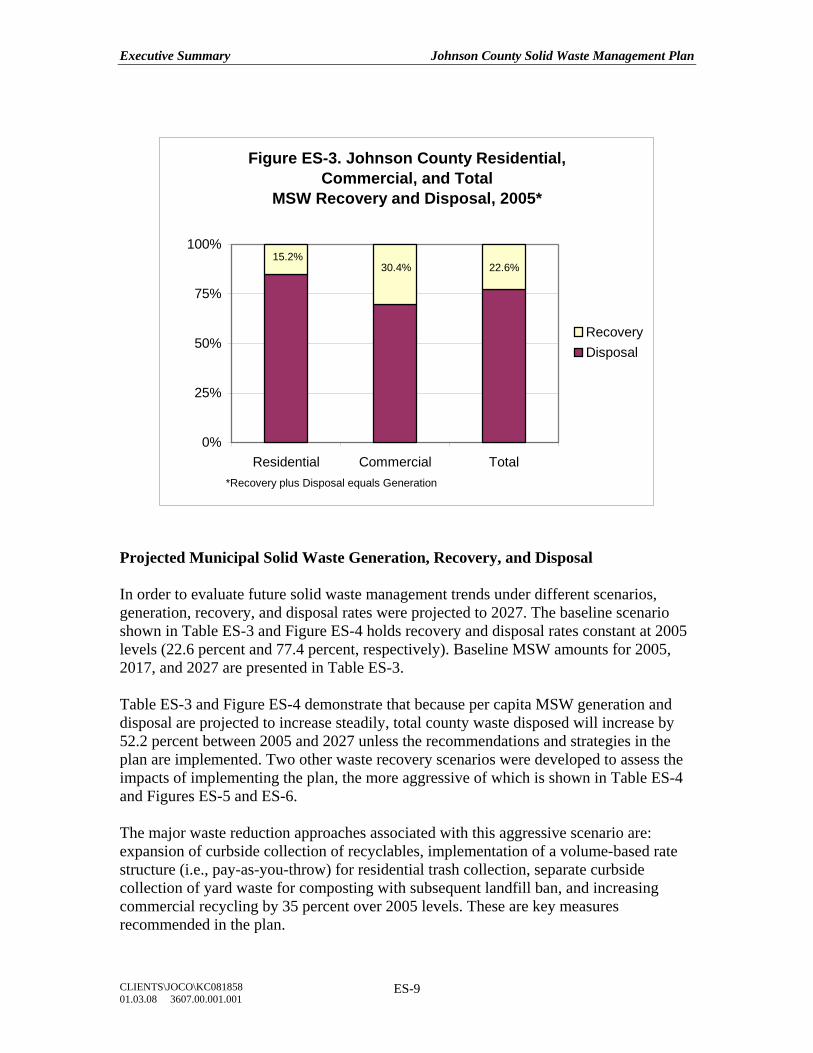
Figure ES-3. Johnson County Residential, Commercial, and Total
MSW Recovery and Disposal, 2005*
0%
25%
50%
75%
100%
Residential Commercial Total*Recovery plus Disposal equals Generation
RecoveryDisposal
15.2%30.4% 22.6%
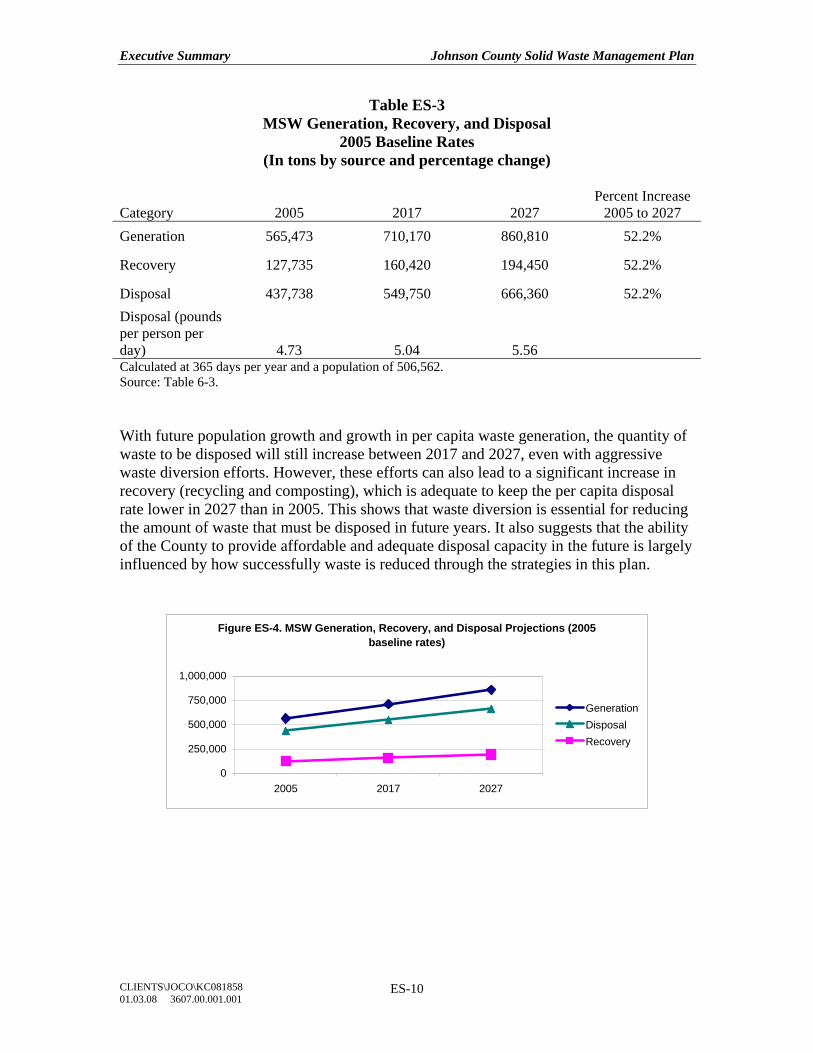
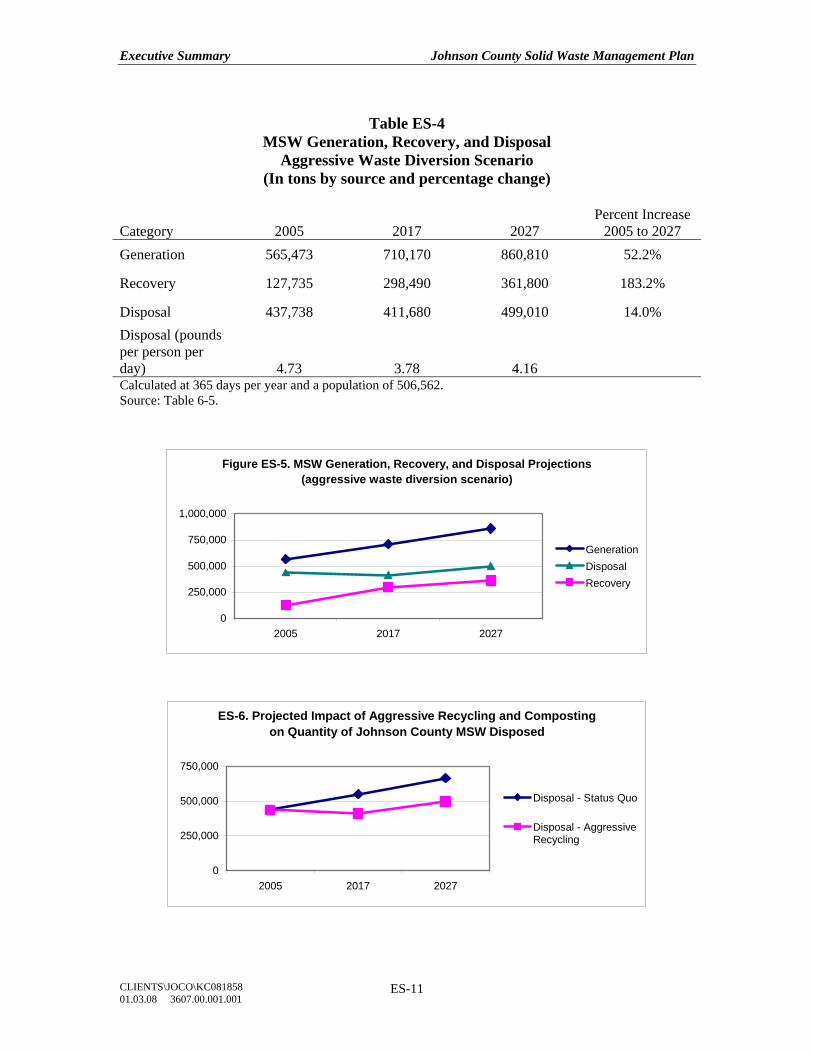
Projected Municipal Solid Waste Generation, Recovery, and Disposal In order to evaluate future solid waste management trends under different scenarios, generation, recovery, and disposal rates were projected to 2027. The baseline scenario shown in Table ES-3 and Figure ES-4 holds recovery and disposal rates constant at 2005 levels (22.6 percent and 77.4 percent, respectively). Baseline MSW amounts for 2005, 2017, and 2027 are presented in Table ES-3. Table ES-3 and Figure ES-4 demonstrate that because per capita MSW generation and disposal are projected to increase steadily, total county waste disposed will increase by 52.2 percent between 2005 and 2027 unless the recommendations and strategies in the plan are implemented. Two other waste recovery scenarios were developed to assess the impacts of implementing the plan, the more aggressive of which is shown in Table ES-4 and Figures ES-5 and ES-6. The major waste reduction approaches associated with this aggressive scenario are: expansion of curbside collection of recyclables, implementation of a volume-based rate structure (i.e., pay-as-you-throw) for residential trash collection, separate curbside collection of yard waste for composting with subsequent landfill ban, and increasing commercial recycling by 35 percent over 2005 levels. These are key measures recommended in the plan.
Executive Summary Johnson County Solid Waste Management Plan
CLIENTS\JOCO\KC081858 01.03.08 3607.00.001.001
ES-10
Table ES-3 MSW Generation, Recovery, and Disposal
2005 Baseline Rates (In tons by source and percentage change)
Category 2005 2017 2027 Percent Increase
2005 to 2027 Generation 565,473 710,170 860,810 52.2%
Recovery 127,735 160,420 194,450 52.2%
Disposal 437,738 549,750 666,360 52.2% Disposal (pounds per person per day) 4.73 5.04 5.56 Calculated at 365 days per year and a population of 506,562. Source: Table 6-3. With future population growth and growth in per capita waste generation, the quantity of waste to be disposed will still increase between 2017 and 2027, even with aggressive waste diversion efforts. However, these efforts can also lead to a significant increase in recovery (recycling and composting), which is adequate to keep the per capita disposal rate lower in 2027 than in 2005. This shows that waste diversion is essential for reducing the amount of waste that must be disposed in future years. It also suggests that the ability of the County to provide affordable and adequate disposal capacity in the future is largely influenced by how successfully waste is reduced through the strategies in this plan.
Figure ES-4. MSW Generation, Recovery, and Disposal Projections (2005 baseline rates)
0
250,000
500,000
750,000
1,000,000
2005 2017 2027
GenerationDisposalRecovery
Executive Summary Johnson County Solid Waste Management Plan
CLIENTS\JOCO\KC081858 01.03.08 3607.00.001.001
ES-11
Table ES-4
MSW Generation, Recovery, and Disposal Aggressive Waste Diversion Scenario
(In tons by source and percentage change)
Category 2005 2017 2027 Percent Increase
2005 to 2027 Generation 565,473 710,170 860,810 52.2%
Recovery 127,735 298,490 361,800 183.2%
Disposal 437,738 411,680 499,010 14.0% Disposal (pounds per person per day) 4.73 3.78 4.16
Calculated at 365 days per year and a population of 506,562. Source: Table 6-5.
Figure ES-5. MSW Generation, Recovery, and Disposal Projections(aggressive waste diversion scenario)
0
250,000
500,000
750,000
1,000,000
2005 2017 2027
GenerationDisposalRecovery
ES-6. Projected Impact of Aggressive Recycling and Composting on Quantity of Johnson County MSW Disposed
0
250,000
500,000
750,000
2005 2017 2027
Disposal - Status Quo
Disposal - AggressiveRecycling
Executive Summary Johnson County Solid Waste Management Plan
CLIENTS\JOCO\KC081858 01.03.08 3607.00.001.001
ES-12
RESOURCES NEEDED TO IMPLEMENT THE NEW PLAN Implementing the new plan within the timeframes necessary to adequately prepare the county for the future solid waste challenges will require the commitment of additional resources, starting in 2009 and continuing throughout the 20-year plan horizon. It is anticipated that an annual investment of about $340,000 will be needed which would cover the cost of two new full time County staff, educational and outreach materials, and consulting assistance. The County should begin immediately to consider and commit appropriate funding sources. SUMMARY In Kansas, counties, through their Boards of County Commissioners and Solid Waste Management Committees, are responsible for developing and implementing plans that provide adequate solid waste management services to all residents and businesses. In light of the prospect that the Johnson County Landfill, Inc. will close during the 20 year horizon of this Plan, it recommends a number of strategies to assure that Johnson County residents and businesses will continue to have access to cost effective solid waste management services in the future. Technical studies completed for this Plan show that significant quantities of potentially recyclable materials from Johnson County sources are being disposed in landfills. Johnson County’s recycling rate is about 23 percent, considerably lower than the national recycling rate of 32 percent. In response, the Plan recommends aggressive waste reduction strategies, including (among other things) composting rather than landfilling of yard waste and implementing volume-based rate structures for residential trash collection to increase material recycling and reduce waste disposal. These actions are necessary to prepare the community for the increasing costs of disposal once the Johnson County Landfill, Inc. closes and to minimize impacts on natural resources. Full implementation of the waste reduction strategies recommended in the Plan are projected to reduce disposal rates from 4.73 pounds per person per day in 2005 to 4.16 pounds per person per day in 2027. Disposal rates are projected to grow to 5.56 pounds per person per day in 2027 without additional waste reduction efforts. Higher disposal rates will require more disposal capacity at higher cost to the Johnson County community. The Plan recognizes that despite aggressive waste reduction efforts, disposal capacity for the county’s remaining waste must be found prior to the closure of the Johnson County Landfill, Inc. Therefore, the Plan recommends further evaluation of various disposal options to determine their feasibility and cost-effectiveness. With 19 municipalities, hundreds of homeowners associations and a largely privatized solid waste service sector, successfully implementing the strategies recommended in the Plan will be complex and challenging. Therefore, the Plan calls for the County to play a leadership role by acting as a coordinator, consensus builder, and educator through close interaction with the cities, homeowners associations and the business community. It also recommends that the County assume a centralized role in assuring that adequate and
Executive Summary Johnson County Solid Waste Management Plan
CLIENTS\JOCO\KC081858 01.03.08 3607.00.001.001
ES-13
affordable disposal capacity is available to Johnson County residents and businesses once the Johnson County Landfill, Inc. closes. Implementing the Plan will require the commitment of additional County resources estimated to be about $340,000 per year. Efforts should begin immediately to identify appropriate funding sources.
Executive Summary Johnson County Solid Waste Management Plan
CLIENTS\JOCO\KC081858 01.03.08 3607.00.001.001
ES-14
THIS PAGE LEFT BLANK INTENTIONALLY
Chapter 1 Introduction and General County Information
CLIENTS\JOCO\KC081858 01.03.08 3607.00.001.001
1-1
CHAPTER 1
INTRODUCTION AND GENERAL COUNTY INFORMATION INTRODUCTION The purpose of this Solid Waste Management Plan (SWMP) is to evaluate the current Johnson County solid waste management system and to identify recommendations for improving and updating the management system based on projections for 20 years. This plan will provide guidance and direction for the management, handling, reduction through reuse, recycling and composting, and the disposal of solid waste in Johnson County. This document is intended to satisfy the state requirement under K.S.A. 65-3405 that all counties adopt a SWMP. This document consists of a review of the existing solid waste management system in Johnson County, a review of potential management options, and recommendations for future solid waste management in the county. It has been adopted by the Johnson County Solid Waste Management Committee (SWMC) and the Board of County Commissioners. Definitions and acronyms used in this document can be found in Appendices A and B. GENERAL COUNTY DESCRIPTION Johnson County is located in northeastern Kansas. It borders Jackson and Cass counties in Missouri on the east, Wyandotte and Leavenworth counties on the north, Douglas County on the west, and Miami County on the south. It is part of the eight-county Mid-America Regional Council (MARC) metropolitan region. MARC is comprised of the Missouri counties of Jackson, Cass, Ray, Clay, and Platte; and the Kansas counties of Johnson, Wyandotte, and Leavenworth. According to the U.S. Census Bureau, the county has a total area of 480 square miles (477 square miles land; 3 square miles water). In 2003, it was estimated by the U.S. Department of Agriculture that 28.7 percent of the county’s area was used for field crops, 17.9 percent for pastureland, 8.1 percent was woodlands, and 24.4 percent was considered urbanized. Roads, water areas, and other miscellaneous uses made up the remainder. Most residential, commercial, and industrial development in the county is located within incorporated city boundaries. The unincorporated areas of the county have scattered residential development and encompass about 50 percent of the total land area. Residents living in the unincorporated areas have a strong desire to maintain the “rural character” of their surroundings.
Chapter 1 Introduction and General County Information
CLIENTS\JOCO\KC081858 01.03.08 3607.00.001.001
1-2
The county is served by an excellent system of highways and thoroughfares. Interstates 35, 435, and 635 and U.S. Highways 50, 56, 69, and 169 cross the county. Johnson County strives for a transportation system that allows for safe, convenient, and efficient travel. In 1999, by action of the Board of County Commissioners, the Comprehensive Arterial Road Network Plan (CARNP) process was adopted. The mission of this planning process is “to achieve a community consensus for maximizing the utility of the County’s existing arterial road network to meet anticipated perimeter transportation needs.” CARNP recommends the development of transportation systems that interconnect the county’s system and the surrounding regional roadway network. An extensive network of railroads also serves Johnson County. The four railroads serving the county include the Burlington Northern and Santa Fe; the St. Louis and San Francisco (Frisco); the Missouri, Kansas, and Texas (Katy); and the Missouri Pacific. Geographical and Geological Characteristics The following information was extracted directly from the “Soil Survey of Johnson County, Kansas”2 and the “Geology and Ground-water Resources of Johnson County, Northeastern Kansas”3 without significant modification. Johnson County is in the Central Lowland province of the Interior Plains. The Kansas River has cut a wide valley along the western half of the northern boundary of the county. The western part of Johnson County is made up of gently rolling and undulating uplands. The eastern part of the county consists of the valley of the Blue River and its tributaries and gently rolling and undulating uplands. The southwestern part of the county consists of the upper waters of the Marais Des Cygnes River, including Bull Creek, Little Bull Creek, and Martin Creek.2 Hydrology. North-flowing streams to the Kansas River, such as Kill Creek, Cedar Creek, Mill Creek, have steeper gradients and greater local relief than east-flowing and south-flowing streams. Relief of 150 to 250 feet is common within a mile of the north-flowing streams in their more hilly parts. Local relief along the east-flowing tributaries of the Missouri River and the south-flowing tributaries of the Marais des Cygnes River within a mile of the stream generally is less than 150 feet.2 The flood plain ranges from about 0.2 to 0.5 miles in width along the principal streams, except along the Kansas River where it ranges from 1 to 2 miles in width.2
2 “Soil Survey of Johnson County, Kansas.” United States Department of Agriculture, Natural
Resources Conservation Service, in cooperation with the Kansas Agricultural Experiment Station. http://soildatamart.nrcs.usda.gov/Manuscripts/KS091/0/Johnson_KS.pdf
3 “Geology and Ground-water Resources of Johnson County, Northeastern Kansas.” Kansas Geological Survey. Howard G. O'Connor. Originally published in 1971. http://www.kgs.ku.edu/General/Geology/Johnson/index.html
Chapter 1 Introduction and General County Information
CLIENTS\JOCO\KC081858 01.03.08 3607.00.001.001
1-3
Elevation. The highest point in the county, about 1,134 feet above mean sea level, is in the southeastern part (secs. 17 and 18, T. 15 S., R. 25 E., Bucyrus topographic quadrangle) and the lowest point, about 742 feet, is along the Kansas River where the river flows eastward into Wyandotte County. Maximum relief in the county is about 392 feet.2 Rock Formation. Sedimentary rocks of Cambrian, Ordovician, Devonian, Mississippian, Pennsylvanian, Cretaceous, and Quaternary age overlie the Precambrian basement in Johnson County. The thickness of Paleozoic rocks ranges from about 2,150 feet near Kenneth in southeastern Johnson County to about 2,550 feet near Edgerton in southwestern Johnson County.2 Fault Areas. Faults have been mapped in only two small areas of Johnson County, in the town of Shawnee and near Cedar. One or more faults strike approximately northeast along an intermittent stream to Nieman Road (east side SE 1/4 SW 1/4 sec. 11, T. 12 S., R. 24 E.) and have a throw of as much as 30 feet. Another fault trends south-southeast from Nieman Road (SW 1/4 SE 1/4 sec. 11, T. 12 S., R. 24 E.) across Switzer Road to Interstate Highway 35 at 75th Street (SE 1/4 NW 1/4 sec. 24, T. 12 S., R. 24 E.) and has a throw of as much as 35 feet. Both faults affect the exposed rocks of the Kansas City and Lansing Groups, but little is known about the effects of the faults on older rocks. Rocks exposed along the faults and in nearby areas of secs. 11 and 14, T. 12 S., R. 24 E., locally have dips of 5 to 10 degrees, and the SW cor. SE 1/4 sec. 11, T. 12 S., R. 24 E., seems to be the locus of a structural depression associated with the faulting (fig. 15, pl. 1). Three small faults, across Quivira Road just south of 67th Street (west side NW 1/4 SW 1/4 sec. 14, T. 12 S., R. 24 E.) in Shawnee, were first noted by State Highway Commission geologists.2 Soils. The “Soil Survey of Johnson County, Kansas”2 provides soils information for planning land uses related to urban development and to water management. Soils are rated for various uses, and the most limiting features are identified. The information provided by the soil survey, and presented in this document, is not site specific and does not eliminate the need for onsite investigation of the soils or for testing and analysis by personnel experienced in the design and construction of engineering works. Government ordinances and regulations that restrict certain land uses or impose specific design criteria were not considered in preparing the survey information presented here. Appendix C is a data table reprinted from the soils survey (source table 14b). This table shows the soil type and the degree and kind of soil limitations that affect sanitary landfills and daily cover for landfills. Rating class terms indicate the extent to which the soils are limited by all of the soil features that affect these uses. For example, “Very limited” indicates that the soil has one or more features that are unfavorable for the specified use.
Chapter 1 Introduction and General County Information
CLIENTS\JOCO\KC081858 01.03.08 3607.00.001.001
1-4
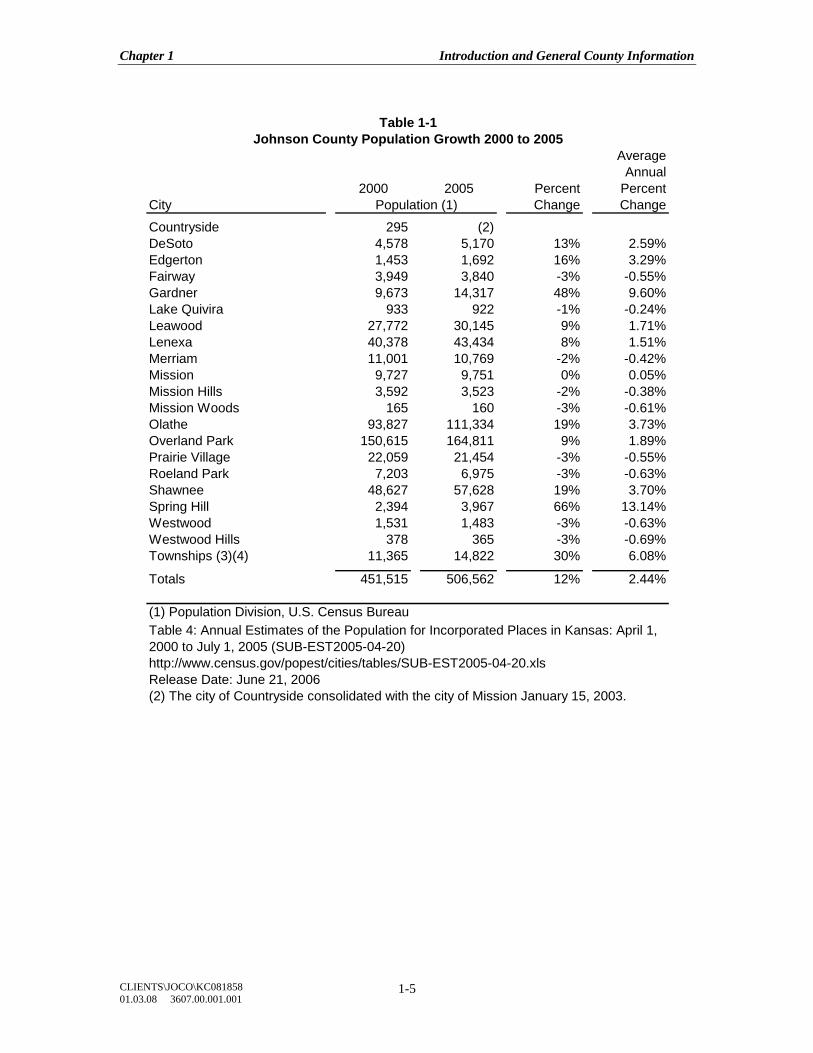
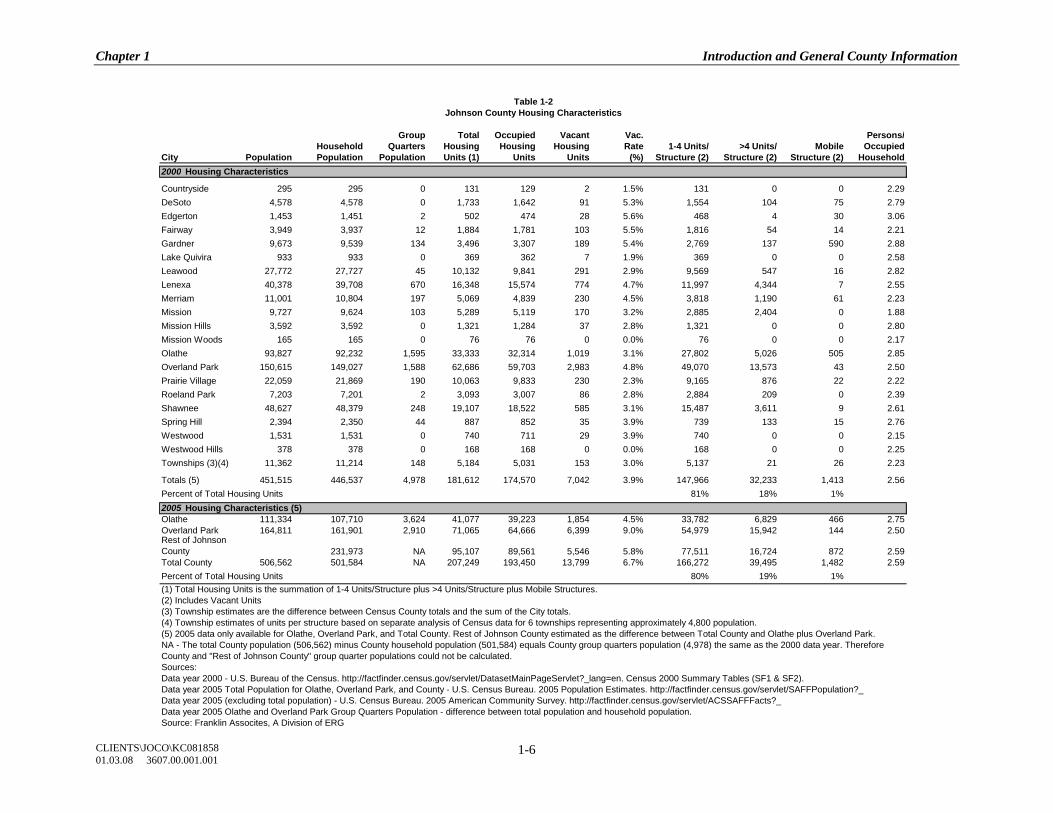
The limitations generally cannot be overcome without major soil reclamation, special design, or expensive installation procedures. Poor performance and high maintenance can be expected.1 Additional soils information can be found in the full soils survey report and supplemental mapping of site-specific soils data.4 Population Johnson County population grew from 270,269 in 1980 to 355,054 in 1990 and 506,562 in 2005. According to MARC population data, Johnson County has experienced at least a 23 percent population growth rate every decade since the 1970s. Table 1-1 shows a 12 percent growth rate between 2000 and 2005 (2.44 percent average annual change). However, MARC forecasts a slowing in this growth after 2010. A 17 percent growth is forecast for 2010 to 2020, followed by a 14 percent growth the following decade. The county consists of 19 incorporated cities5 and nine rural unincorporated townships. About 50 percent of the land area is in the unincorporated townships, but the townships contain less than five percent of the county’s population. Over 50 percent of the county’s population lives in the two largest cities, Overland Park and Olathe. Shawnee, Lenexa, and Leawood account for almost 26 percent. The population growths for each of the municipalities in Johnson County are shown in Table 1-1. Between 2000 and 2005, Gardner and Spring Hill led with growths of 48 and 66 percent, respectively, while some of the smaller cities in the northeast part of the county lost population slightly in the same period. Housing A summary of Johnson County housing characteristics is shown in Table 1-2. According to the 2000 census, there were 181,162 housing units in Johnson County. Four percent of these were vacant, leaving 174,570 occupied housing units, for an average of 2.56 persons per occupied unit. Eighty-one percent of the households live in buildings with one to four units per structure. Eighteen percent live in multi-family housing of five or more units per structure and one percent live in mobile homes. About one percent of the county’s population lives in group quarters such as nursing homes, schools and hospitals for the handicapped, and other non-household living facilities. 2005 housing characteristic data were only available for Olathe, Overland Park, and the Total County. Housing characteristics for the rest of Johnson County shown at the bottom of Table 1-2 represent the difference between Total County and the sum of Olathe and Overland Park. As of 2005, it is estimated that 80 percent of the households lived in buildings with one to four units per structure and 19 percent lived in multi-family housing of five or more units per structure. The average persons per occupied household in 2005 was slightly higher than 2000, at 2.59 persons.
4 “Soil Survey of Johnson County, Kansas.”
http://soildatamart.nrcs.usda.gov/Manuscripts/KS091/0/maps/index.pdf 5 The city of Countryside consolidated with the city of Mission January 15, 2003.
Chapter 1 Introduction and General County Information
CLIENTS\JOCO\KC081858 01.03.08 3607.00.001.001
1-5
AverageAnnual
2000 2005 Percent PercentCity Change Change
Countryside 295 (2)DeSoto 4,578 5,170 13% 2.59%Edgerton 1,453 1,692 16% 3.29%Fairway 3,949 3,840 -3% -0.55%Gardner 9,673 14,317 48% 9.60%Lake Quivira 933 922 -1% -0.24%Leawood 27,772 30,145 9% 1.71%Lenexa 40,378 43,434 8% 1.51%Merriam 11,001 10,769 -2% -0.42%Mission 9,727 9,751 0% 0.05%Mission Hills 3,592 3,523 -2% -0.38%Mission Woods 165 160 -3% -0.61%Olathe 93,827 111,334 19% 3.73%Overland Park 150,615 164,811 9% 1.89%Prairie Village 22,059 21,454 -3% -0.55%Roeland Park 7,203 6,975 -3% -0.63%Shawnee 48,627 57,628 19% 3.70%Spring Hill 2,394 3,967 66% 13.14%Westwood 1,531 1,483 -3% -0.63%Westwood Hills 378 365 -3% -0.69%Townships (3)(4) 11,365 14,822 30% 6.08%
Totals 451,515 506,562 12% 2.44%
(1) Population Division, U.S. Census Bureau
http://www.census.gov/popest/cities/tables/SUB-EST2005-04-20.xlsRelease Date: June 21, 2006(2) The city of Countryside consolidated with the city of Mission January 15, 2003.
Table 1-1Johnson County Population Growth 2000 to 2005
Table 4: Annual Estimates of the Population for Incorporated Places in Kansas: April 1, 2000 to July 1, 2005 (SUB-EST2005-04-20)
Population (1)
Chapter 1 Introduction and General County Information
CLIENTS\JOCO\KC081858 01.03.08 3607.00.001.001
1-6
Group Total Occupied Vacant Vac. Persons/Household Quarters Housing Housing Housing Rate 1-4 Units/ >4 Units/ Mobile Occupied
City Population Population Population Units (1) Units Units (%) Structure (2) Structure (2) Structure (2) Household2000 Housing Characteristics
Countryside 295 295 0 131 129 2 1.5% 131 0 0 2.29DeSoto 4,578 4,578 0 1,733 1,642 91 5.3% 1,554 104 75 2.79Edgerton 1,453 1,451 2 502 474 28 5.6% 468 4 30 3.06Fairway 3,949 3,937 12 1,884 1,781 103 5.5% 1,816 54 14 2.21Gardner 9,673 9,539 134 3,496 3,307 189 5.4% 2,769 137 590 2.88Lake Quivira 933 933 0 369 362 7 1.9% 369 0 0 2.58Leawood 27,772 27,727 45 10,132 9,841 291 2.9% 9,569 547 16 2.82Lenexa 40,378 39,708 670 16,348 15,574 774 4.7% 11,997 4,344 7 2.55Merriam 11,001 10,804 197 5,069 4,839 230 4.5% 3,818 1,190 61 2.23Mission 9,727 9,624 103 5,289 5,119 170 3.2% 2,885 2,404 0 1.88Mission Hills 3,592 3,592 0 1,321 1,284 37 2.8% 1,321 0 0 2.80Mission Woods 165 165 0 76 76 0 0.0% 76 0 0 2.17Olathe 93,827 92,232 1,595 33,333 32,314 1,019 3.1% 27,802 5,026 505 2.85Overland Park 150,615 149,027 1,588 62,686 59,703 2,983 4.8% 49,070 13,573 43 2.50Prairie Village 22,059 21,869 190 10,063 9,833 230 2.3% 9,165 876 22 2.22Roeland Park 7,203 7,201 2 3,093 3,007 86 2.8% 2,884 209 0 2.39Shawnee 48,627 48,379 248 19,107 18,522 585 3.1% 15,487 3,611 9 2.61Spring Hill 2,394 2,350 44 887 852 35 3.9% 739 133 15 2.76Westwood 1,531 1,531 0 740 711 29 3.9% 740 0 0 2.15Westwood Hills 378 378 0 168 168 0 0.0% 168 0 0 2.25Townships (3)(4) 11,362 11,214 148 5,184 5,031 153 3.0% 5,137 21 26 2.23
Totals (5) 451,515 446,537 4,978 181,612 174,570 7,042 3.9% 147,966 32,233 1,413 2.56Percent of Total Housing Units 81% 18% 1%2005 Housing Characteristics (5)Olathe 111,334 107,710 3,624 41,077 39,223 1,854 4.5% 33,782 6,829 466 2.75Overland Park 164,811 161,901 2,910 71,065 64,666 6,399 9.0% 54,979 15,942 144 2.50Rest of Johnson County 231,973 NA 95,107 89,561 5,546 5.8% 77,511 16,724 872 2.59Total County 506,562 501,584 NA 207,249 193,450 13,799 6.7% 166,272 39,495 1,482 2.59Percent of Total Housing Units 80% 19% 1%(1) Total Housing Units is the summation of 1-4 Units/Structure plus >4 Units/Structure plus Mobile Structures.(2) Includes Vacant Units(3) Township estimates are the difference between Census County totals and the sum of the City totals.(4) Township estimates of units per structure based on separate analysis of Census data for 6 townships representing approximately 4,800 population.(5) 2005 data only available for Olathe, Overland Park, and Total County. Rest of Johnson County estimated as the difference between Total County and Olathe plus Overland Park.
Sources: Data year 2000 - U.S. Bureau of the Census. http://factfinder.census.gov/servlet/DatasetMainPageServlet?_lang=en. Census 2000 Summary Tables (SF1 & SF2).Data year 2005 Total Population for Olathe, Overland Park, and County - U.S. Census Bureau. 2005 Population Estimates. http://factfinder.census.gov/servlet/SAFFPopulation?_Data year 2005 (excluding total population) - U.S. Census Bureau. 2005 American Community Survey. http://factfinder.census.gov/servlet/ACSSAFFFacts?_Data year 2005 Olathe and Overland Park Group Quarters Population - difference between total population and household population.Source: Franklin Assocites, A Division of ERG
NA - The total County population (506,562) minus County household population (501,584) equals County group quarters population (4,978) the same as the 2000 data year. Therefore County and "Rest of Johnson County" group quarter populations could not be calculated.
Table 1-2Johnson County Housing Characteristics
Chapter 1 Introduction and General County Information
CLIENTS\JOCO\KC081858 01.03.08 3607.00.001.001
1-7
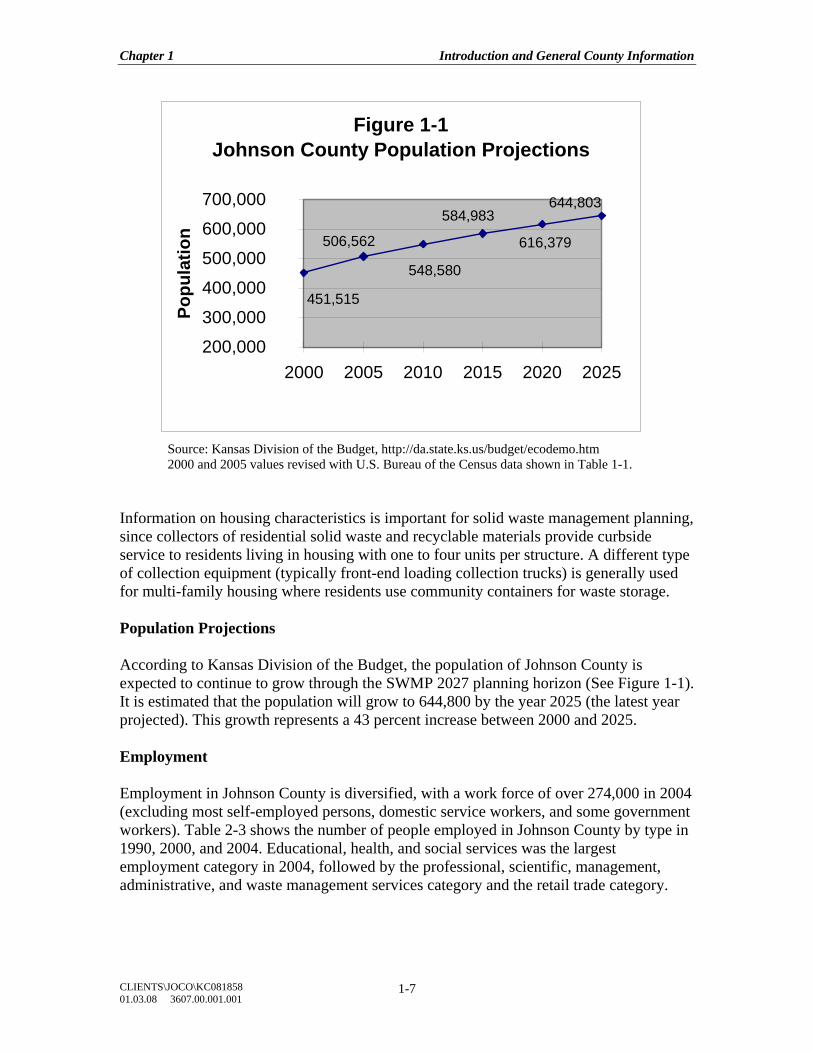
Source: Kansas Division of the Budget, http://da.state.ks.us/budget/ecodemo.htm 2000 and 2005 values revised with U.S. Bureau of the Census data shown in Table 1-1.
Information on housing characteristics is important for solid waste management planning, since collectors of residential solid waste and recyclable materials provide curbside service to residents living in housing with one to four units per structure. A different type of collection equipment (typically front-end loading collection trucks) is generally used for multi-family housing where residents use community containers for waste storage. Population Projections According to Kansas Division of the Budget, the population of Johnson County is expected to continue to grow through the SWMP 2027 planning horizon (See Figure 1-1). It is estimated that the population will grow to 644,800 by the year 2025 (the latest year projected). This growth represents a 43 percent increase between 2000 and 2025. Employment Employment in Johnson County is diversified, with a work force of over 274,000 in 2004 (excluding most self-employed persons, domestic service workers, and some government workers). Table 2-3 shows the number of people employed in Johnson County by type in 1990, 2000, and 2004. Educational, health, and social services was the largest employment category in 2004, followed by the professional, scientific, management, administrative, and waste management services category and the retail trade category.
Figure 1-1Johnson County Population Projections
616,379
644,803 584,983
548,580
506,562
451,515
200,000
300,000
400,000
500,000
600,000
700,000
2000 2005 2010 2015 2020 2025
Popu
latio
n
Chapter 1 Introduction and General County Information
CLIENTS\JOCO\KC081858 01.03.08 3607.00.001.001
1-8
Table 1-3 shows four employment categories with double digit growth between 2000 and 2004: construction; finance, insurance, real estate, and rental and leasing; professional, scientific, management, administrative, and waste management services; and other services, except public administration. Total county employment grew ten percent between 2000 and 2004. Employment Projections MARC employment forecasts, shown in Figures 1-2 and 1-3, predict that the greatest growth will occur in the College Boulevard/Blue Valley portions of the county. Growth is anticipated to trend slightly upward for other areas of the county except for a flattening in the North Shawnee Mission area. By industry sector (Figure 1-3), the service industries will continue to employ the most workers. Increased employment growth is predicted for all sectors shown. Current Waste Management Administration in Johnson County The 1972, 1996, and 2001 Johnson County SWMPs delegated the collection, storage, and transportation of solid waste to cities, while the County maintained waste processing and disposal responsibilities. The 1982 Memorandum of Understanding between the County and the Kansas Department of Health and Environment (KDHE) states that the County is responsible for monitoring and enforcing all non-hazardous solid waste management activities within their boundaries, including storage, collection, transportation, and disposal. The exception is the non-hazardous waste disposal well at Johnson County Landfill, Inc. for which KDHE retains authority. The current Johnson County organization chart for solid waste management is shown in Figure 1-4. The County’s SWMP is administered through the Johnson County Environmental Department (JCED) which is under the direction of the County Manager’s Office. The County Manager serves at the direction of the 7-member Board of County Commissioners (BOCC). As shown in the organization chart, the incorporated cities manage collection, storage, and transportation within their respective boundaries, and JCED is directly responsible for the unincorporated areas. The Solid Waste Management Committee (SWMC), appointed by the BOCC and the Council of Mayors and staffed by JCED, is responsible for developing the SWMP. The BOCC is responsible for adopting the SWMP before submittal to KDHE.
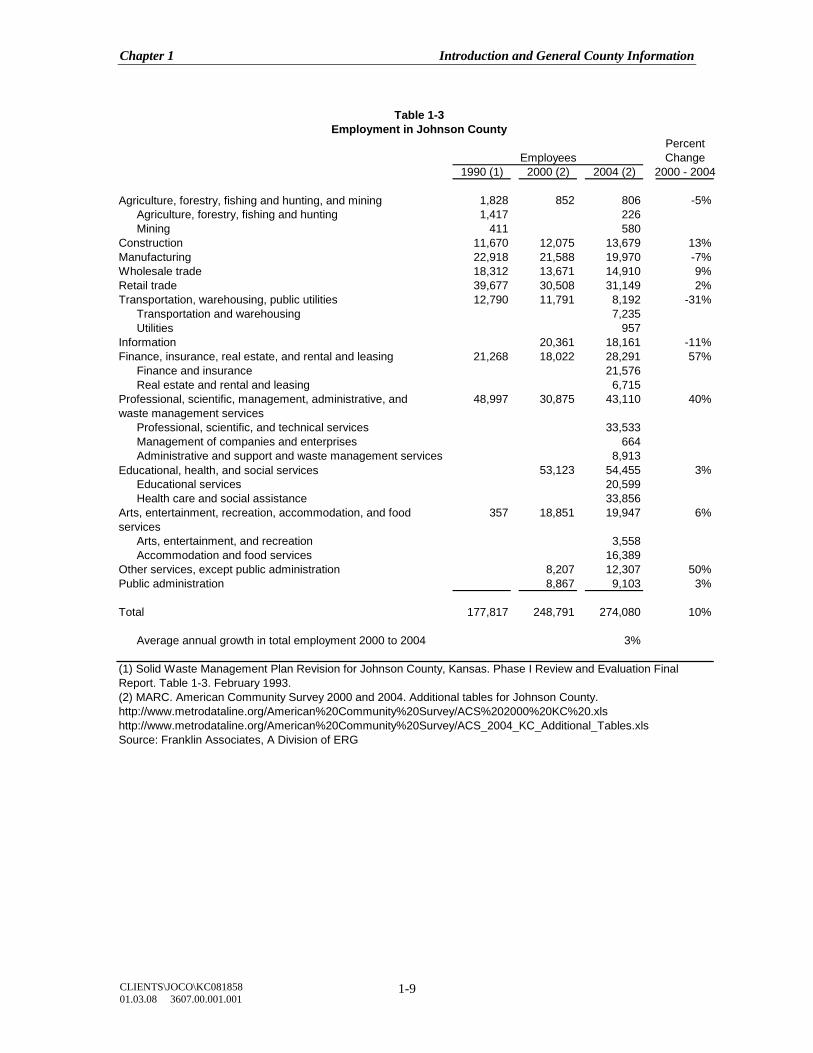
Chapter 1 Introduction and General County Information
CLIENTS\JOCO\KC081858 01.03.08 3607.00.001.001
1-9
PercentChange
1990 (1) 2000 (2) 2004 (2) 2000 - 2004
Agriculture, forestry, fishing and hunting, and mining 1,828 852 806 -5%Agriculture, forestry, fishing and hunting 1,417 226Mining 411 580
Construction 11,670 12,075 13,679 13%Manufacturing 22,918 21,588 19,970 -7%Wholesale trade 18,312 13,671 14,910 9%Retail trade 39,677 30,508 31,149 2%Transportation, warehousing, public utilities 12,790 11,791 8,192 -31%
Transportation and warehousing 7,235Utilities 957
Information 20,361 18,161 -11%Finance, insurance, real estate, and rental and leasing 21,268 18,022 28,291 57%
Finance and insurance 21,576Real estate and rental and leasing 6,715
48,997 30,875 43,110 40%
Professional, scientific, and technical services 33,533Management of companies and enterprises 664Administrative and support and waste management services 8,913
Educational, health, and social services 53,123 54,455 3%Educational services 20,599Health care and social assistance 33,856
357 18,851 19,947 6%
Arts, entertainment, and recreation 3,558Accommodation and food services 16,389
Other services, except public administration 8,207 12,307 50%Public administration 8,867 9,103 3%
Total 177,817 248,791 274,080 10%
Average annual growth in total employment 2000 to 2004 3%
(2) MARC. American Community Survey 2000 and 2004. Additional tables for Johnson County.http://www.metrodataline.org/American%20Community%20Survey/ACS%202000%20KC%20.xlshttp://www.metrodataline.org/American%20Community%20Survey/ACS_2004_KC_Additional_Tables.xlsSource: Franklin Associates, A Division of ERG
Arts, entertainment, recreation, accommodation, and food services
(1) Solid Waste Management Plan Revision for Johnson County, Kansas. Phase I Review and Evaluation Final Report. Table 1-3. February 1993.
Table 1-3Employment in Johnson County
Employees
Professional, scientific, management, administrative, and waste management services
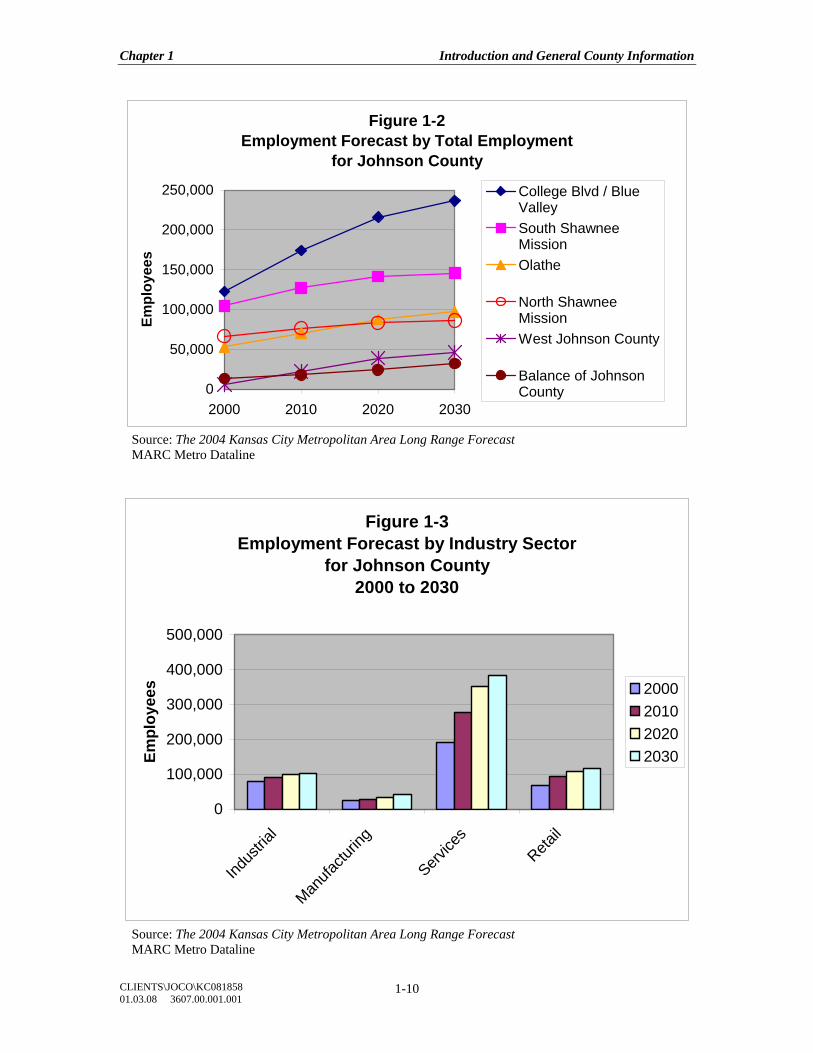
Chapter 1 Introduction and General County Information
CLIENTS\JOCO\KC081858 01.03.08 3607.00.001.001
1-10
Figure 1-2Employment Forecast by Total Employment
for Johnson County
0
50,000
100,000
150,000
200,000
250,000
2000 2010 2020 2030
Empl
oyee
s
College Blvd / BlueValleySouth ShawneeMissionOlathe
North ShawneeMissionWest Johnson County
Balance of JohnsonCounty
Source: The 2004 Kansas City Metropolitan Area Long Range Forecast MARC Metro Dataline
Figure 1-3Employment Forecast by Industry Sector
for Johnson County2000 to 2030
0
100,000
200,000
300,000
400,000
500,000
Indus
trial
Manufa
cturin
g
Service
sReta
il
Empl
oyee
s 2000201020202030
Source: The 2004 Kansas City Metropolitan Area Long Range Forecast MARC Metro Dataline
Chapter 1 Introduction and General County Information
CLIENTS\JOCO\KC081858 01.03.08 3607.00.001.001
1-11
NEED FOR NEW SOLID WASTE MANAGEMENT PLAN (SWMP) Solid waste management planning is required by all counties in Kansas under K.S.A. 65-3405, which, as revised by House Bill (HB) 2801, reads as follows: “Each county of this state, or a designated city, shall submit to the secretary a workable plan for the management of solid waste in such county.”6 Johnson County is currently operating under a 20-year plan developed in 1996 and revised in 2001. As required by Kansas law, the SWMC reviews the plan annually and reports to the BOCC. There have been some significant changes in the solid waste management field affecting Johnson County in the last 20 years. About 96 percent of the population residing in single-family households in the incorporated cities has access to curbside recycling. All county residents have access to limited drop-off recycling options. Commercial recycling options have also expanded. A materials recovery facility (MRF) that processes recyclable materials collected from Johnson County has also been sited and continues to operate in Wyandotte County. Most significantly, the Johnson County Landfill, Inc., the only landfill in the county licensed to accept municipal solid waste (MSW), began construction of the site’s final permitted disposal cell in 2007. The City of Shawnee has stipulated that the landfill can no longer accept solid waste after 2027. Assuming that current disposal rates do not grow in future years (i.e., the number of tons per day disposed at the landfill stays the same), the Johnson County Landfill, Inc. has permitted capacity to remain open until 2023. Again, assuming steady disposal rates, the life of the landfill could be extended to 2027 if additional capacity is permitted as planned. However, if population and consumption continue to grow, the landfill life may be shortened. If future disposal rates increase by 2.0 percent per year, the permitted capacity of the landfill will be exhausted by the end of 2021 (or two years sooner). Any number of other factors could affect these projections, up or down. For all these reasons, a new SWMP is needed for Johnson County. This document represents that plan.
6 Kansas Statutes Annotated 65-3405 (a).
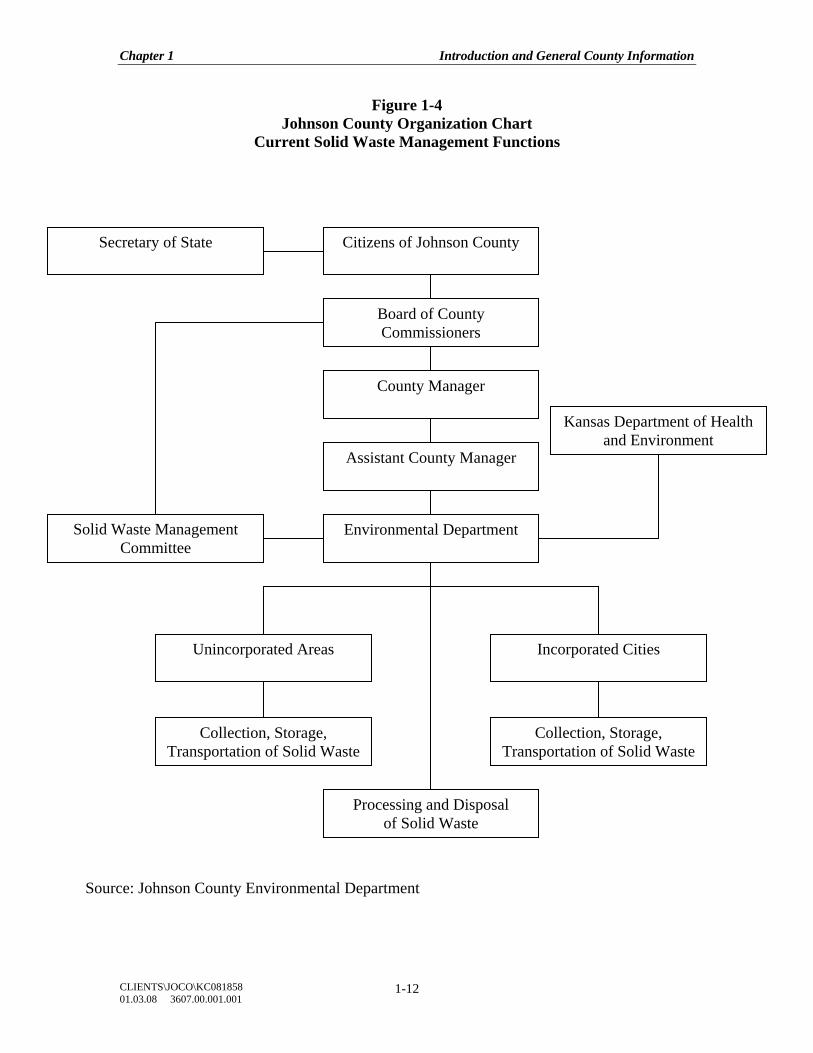
Chapter 1 Introduction and General County Information
CLIENTS\JOCO\KC081858 01.03.08 3607.00.001.001
1-12
Figure 1-4 Johnson County Organization Chart
Current Solid Waste Management Functions
Secretary of State Citizens of Johnson County
Board of County Commissioners
County Manager
Assistant County Manager
Environmental Department Solid Waste Management Committee
Kansas Department of Health and Environment
Incorporated Cities
Collection, Storage, Transportation of Solid Waste
Collection, Storage, Transportation of Solid Waste
Processing and Disposal of Solid Waste
Source: Johnson County Environmental Department
Unincorporated Areas
Chapter 1 Introduction and General County Information
CLIENTS\JOCO\KC081858 01.03.08 3607.00.001.001
1-13
CHAPTER 1 REFERENCES
Johnson County, Kansas. “The Rural Comprehensive Plan A Plan for the Unincorporated Area of Johnson County, Kansas.” Adopted June 3, 2004. http://planning.jocogov.org/special.htm Johnson County, Kansas. “2006 Federal Legislative Platform.” Adopted December 1, 2005. http://cmo.jocogov.org/reports/FINAL%202006%20Federal%20Platform.pdf Johnson County, Kansas. “Solid Waste Management Plan Revision for Johnson County, Kansas. Phase I Review and Evaluation Final Report.” Table 1-3. February 1993. Kansas Geological Survey. “Geology and Ground-water Resources of Johnson County, Northeastern Kansas.” Howard G. O'Connor. Originally published in 1971. http://www.kgs.ku.edu/General/Geology/Johnson/index.html Kansas Statistical Abstract Enhanced Online Edition. Figure 1-1: Original source citation - Kansas Division of the Budget, http://da.state.ks.us/budget/ecodemo.htm (accessed July 12, 2006). http://www.ipsr.ku.edu/ksdata/ksah/population/2pop17.xls http://www.ipsr.ku.edu/ksdata/ksah/ksa34.shtml Mid-America Regional Council. American Community Survey 2000 and 2004. Additional tables for Johnson County. http://www.metrodataline.org/American%20Community%20Survey/ACS%202000%20KC%20.xls Mid-America Regional Council. “Population History and Forecast by County and Community Analysis Area (CAA).” www.marc.org U.S. Department of Agriculture in cooperation with Kansas Agricultural Experiment Station. “Soil Survey of Johnson County, Kansas.” http://soildatamart.nrcs.usda.gov/Manuscripts/KS091/0/Johnson_KS.pdf http://soildatamart.nrcs.usda.gov/Manuscripts/KS091/0/maps/index.pdf
Chapter 1 Introduction and General County Information
CLIENTS\JOCO\KC081858 01.03.08 3607.00.001.001
1-14
U.S. Bureau of the Census Population Division. Table 1-1 data: “Table 4: Annual Estimates of the Population for Incorporated Places in Kansas: April 1, 2000 to July 1, 2005” (SUB-EST2005-04-20) http://www.census.gov/popest/cities/tables/SUB-EST2005-04-20.xls Table 1-2, 2000 data: “Summary Tables (SF1 & SF2).” http://factfinder.census.gov/servlet/DatasetMainPageServlet?_lang=en. Census 2000 Table 1-2, 2005 data: 2005 Population Estimates. http://factfinder.census.gov/servlet/SAFFPopulation?_ and 2005 American Community Survey. http://factfinder.census.gov/servlet/ACSSAFFFacts?_ http://www.metrodataline.org/American%20Community%20Survey/ACS_2004_KC_Additional_Tables.xls
Chapter 2 State and Local Legislative Regulatory Review
CLIENTS\JOCO\KC081858 01.03.08 3607.00.001.001
2-1
CHAPTER 2
STATE AND LOCAL LEGISLATIVE/REGULATORY REVIEW
INTRODUCTION Chapter 2 presents an overview of relevant solid waste regulations that govern the solid waste management system in Johnson County. On the state level, K.S.A. Chapter 65, Public Health Article 34, titled Solid Waste, was reviewed (July 2006 version). K.S.A. 65-3405 specifically addresses the solid waste management planning process. The County signed a Memorandum of Understanding (MOU) with Kansas Department of Health & Environment (KDHE) January 11, 1982, which assigned specific responsibilities to the County for solid waste management. On the local level, current solid waste ordinances and/or codes pertaining to the storage, collection, processing and disposal of solid waste were requested from all incorporated Johnson County cities and analyzed. KANSAS House Bill No. 2801 amended K.S.A. Chapter 65 – Public Health July 1, 1992 and provides for the safe and sanitary disposal of solid wastes in the state. K.S.A. 65-3405 states that each county of the state shall submit a workable plan for the management of solid waste within that county and the plan shall be adopted by the governing body of that county. The plan must provide for an adequate solid waste management system consistent with the needs of the county and in a manner that will not constitute a public nuisance. The solid waste management system defined in the plan must include adequate, safe and sanitary disposal of solid waste. K.S.A. 65-3405 further requires the county to establish a solid waste management committee to be responsible for the preparation of the solid waste management plan (SWMP), conduct annual reviews of the plan, and comprehensively review the plan every five years. At least one public hearing on the SWMP is required during the comprehensive review. As provided in K.S.A. 65-3405(b), the solid waste management committee should not exceed 30 members and shall include:
(1) Representatives of incorporated cities located in the county or counties, not to exceed five members representing any cities of the first class, three members representing any cities of the second class and one member representing any cities of the third class; *
(2) One representative of unincorporated areas of the county or counties;
Chapter 2 State and Local Legislative Regulatory Review
CLIENTS\JOCO\KC081858 01.03.08 3607.00.001.001
2-2
(3) Representatives of the general public, citizen organizations, private industry, any private solid waste management industry operating in the county or counties and any private recycling or scrap material processing industry operating in the county or counties;
(4) The recycling coordinator, if any, of the county or counties; and (5) Any other persons deemed appropriate by the county or counties or
designated city or cities including, but not limited to, county commissioners, county engineers, county health officers and county planners.
* The word “any” means “all” in this case. A county or regional committee is limited to one member to represent all third class cities.
HB 2801 does not impose mandatory waste reduction or recycling goals on the counties but requires the solid waste management committee, through the SWMP, to establish future solid waste management goals including a schedule for the reduction of waste volumes. Examples of possible goals include: reorganization of a region or partnership; studying or implementing a volume-based cost structure (i.e., pay-as-you-throw); implementing a “Buy Recycled” initiative; establishing a recycling or diversion rate or increasing an existing recycling or diversion rate with a numeric or qualitative goal. K.S.A. 65-3405(j) requires that the SWMP include a waste reduction implementation schedule for a ten-year planning horizon that includes necessary action steps and designates the party(ies) responsible for completion. Waste reduction action steps should take into consideration the following:
• Source reduction • Reuse, recycling, composting • Land disposal
In order to meet the minimum requirements for the SWMP, the waste reduction implementation schedule must contain one or more strategies to achieve a reduced waste disposal rate and a schedule for evaluating these strategies. The SWMP shall also consider the development of specific management programs for certain wastes, including lead acid batteries, household hazardous wastes, small quantities of hazardous waste, white goods containing chlorofluorocarbons, pesticides and pesticides containers, motor oil, consumer electronics, medical wastes, construction and demolition waste, seasonal clean-up wastes, wastes generated by natural disasters, and yard waste.
Chapter 2 State and Local Legislative Regulatory Review
CLIENTS\JOCO\KC081858 01.03.08 3607.00.001.001
2-3
JOHNSON COUNTY The Memorandum of Understanding (MOU) that the County signed with KDHE assigned specific responsibilities to the County for solid waste management. This agreement is designed to implement as effectively as possible KDHE’s responsibility under the Solid Waste Management Act through the cooperative efforts of KDHE and Johnson County. The MOU delegates to the County monitoring of all solid waste management activities including storage, collection, transportation, and disposal of the solid wastes in the county except the Johnson County Landfill, Inc. disposal well. The Johnson County Environmental Department Rules and Regulations provide for the storage of solid wastes by the generator. Also included are design, construction, maintenance, and operating regulations for any solid waste processing facility and disposal area. The specific areas covered include the control of vectors, odors, particulates, gas, and water pollution. The County Rules and Regulations are scheduled to be revised and updated in 2008-2009. The MOU also states that KDHE will issue permits for solid waste management processing and disposal facilities only after the applicant has secured certification by the County that the application is consistent with the approved Johnson County Solid Waste Management Plan or any amendments to the Plan. CITY ORDINANCES AND CODES Each municipality in Johnson County was asked to provide a copy of city codes or ordinances pertaining to the storage, collection, processing and disposal of solid waste. Codes or ordinances addressing solid waste nuisances, such as open burning and illegal dumping, were also requested. In some cases, municipalities had codes and ordinances available on their websites. Information on local codes and ordinances was received from 17 of the 19 municipalities in Johnson County (Lake Quivira and Mission Woods are missing). Copies of this information are on file in the Johnson County Environmental Department. In past solid waste management plans, Countryside was listed as a municipality. However, it is now part of Mission, so no separate information was collected from Countryside. Only limited information on the codes and ordinances for Gardner and Mission Hills was available. The City of Gardner reported that City codes are currently under review. The document provided by Gardner addresses solid waste as a health nuisance and open burning of solid waste. Mission Hills has three codes pertaining to solid waste (specifically, anti-scavenger, littering, and open burning regulations) and two codes pertaining to nuisances. These codes and ordinances do not establish any additional requirements for homeowners or solid waste collectors.
Chapter 2 State and Local Legislative Regulatory Review
CLIENTS\JOCO\KC081858 01.03.08 3607.00.001.001
2-4
Table 2-1 summarizes the information received from the municipalities. The solid waste management codes and ordinances are listed in column 2. Column 3 lists the specific section dealing with solid waste management or nuisances. Nuisances specific to solid waste are sometimes covered in separate codes or ordinances (e.g., open burning might be discussed in the fire protection code). Columns 4 and 5 show the date of the latest revision and the source of the information. Also, the information provided by Edgerton, Fairway, Roeland Park, Spring Hill, and Westwood Hills does not indicate the date when the code or ordinance revisions were last made. Highlights of the available individual city codes and ordinances are discussed below. DeSoto The solid waste regulations for DeSoto are in Chapter 15, Article 4 of its city codes and ordinances. There are 12 regulations pertaining to solid waste. The most recent revision to these codes and ordinances was made in 1998. The regulations cover the types of containers that may be used to store solid waste prior to collection, collection requirements, collection vehicles, licensing requirements for collectors, bulky waste, hazardous waste, and prohibited acts. Edgerton The solid waste regulations for Edgerton are in Chapter 8, Article 5 of its city codes and ordinances. There are 10 regulations that pertain to solid waste. The regulations cover the types of containers that may be used to store solid waste prior to collection, collection requirements, prohibited acts such as dumping or littering, and enforcement. Fairway The solid waste regulations for Fairway are in Chapter 6, Articles 1 and 2 of its city codes and ordinances. There are 16 regulations that pertain to solid waste. The regulations cover the types of containers that may be used to store solid waste prior to collection, collection requirements, licensing requirements for collectors, prohibited acts, nuisances, and enforcement. Gardner The solid waste regulations for Gardner are in Chapter 9, Articles 2 and 4 of its city codes and ordinances. The City is in the process of reviewing the codes. Article 2 addresses solid waste as a public health nuisance, and Article 4 regulates open burning.
Chapter 2 State and Local Legislative Regulatory Review
CLIENTS\JOCO\KC081858 01.03.08 3607.00.001.001
2-5
Leawood The solid waste regulations for Leawood are in Chapter 15, Article 4 and Chapter 8, Articles 2 and 3 of its city codes and ordinances. The most recent revision to chapters 15 and 8 were in 2004. There are 25 regulations that pertain to solid waste. The regulations cover the types of containers that may be used to store solid waste prior to collection, collection requirements, licensing requirements for collectors, anti-scavenger rules, prohibited acts, nuisances, public education, and enforcement. Lenexa The solid waste regulations for Lenexa are in Chapter 2, Article 11 and Chapter 3, Article 5 of its city codes and ordinances. The most recent revision to these codes and ordinances was made in 1994. There are 29 regulations that pertain to solid waste. The regulations cover the types of containers that may be used to store solid waste prior to collection, collection requirements, licensing requirements for collectors, composting, yard waste, recycling, anti-scavenger rules, prohibited acts, nuisances, public education, and enforcement. Merriam The solid waste regulations for Merriam are in Chapter 23 of its city codes and ordinances. The most recent revision to these codes and ordinances was made in 1999. There are 18 regulations that pertain to solid waste. The regulations cover the types of containers that may be used to store solid waste prior to collection, collection requirements, licensing requirements for collectors, composting, yard waste, recycling, anti-scavenger rules, prohibited acts, nuisances, public education, and enforcement. Mission The solid waste regulations for Mission are in Chapter 235 of its city codes and ordinances. The most recent revision to these codes and ordinances was made in 2000. There are 33 regulations that pertain to solid waste. The regulations cover the types of containers that may be used to store solid waste prior to collection, collection requirements, licensing requirements for collectors, composting, yard waste, C&D waste, hazardous materials, recycling, prohibited acts, nuisances, public education, and enforcement. Mission Hills The solid waste regulations for Mission Hills are in Chapter 4, Article 1 and Chapter 6, Article 1 of its city codes and ordinances. The most recent revision to these codes and ordinances was made in 2006. There are five regulations that pertain to solid waste. The regulations cover anti-scavenger rules, littering, nuisances, and open burning.
Chapter 2 State and Local Legislative Regulatory Review
CLIENTS\JOCO\KC081858 01.03.08 3607.00.001.001
2-6
Olathe The solid waste regulations for Olathe are in Title 6, Chapter 6 of its city codes and ordinances. The most recent revision to these codes and ordinances was made in 2006. There are 12 regulations that pertain to solid waste. The regulations cover the storage of solid waste prior to collection, yard waste, bulky waste, funding for solid waste management, and enforcement. Overland Park The solid waste regulations for Overland Park are in Chapter 7 of its city codes and ordinances. The most recent revision to these codes and ordinances was made in 1992. There are 20 regulations that pertain to solid waste. The regulations cover the storage of solid waste prior to collection, collection vehicles, permits and licensing for collectors, responsibilities of home associations, prohibited acts, and enforcement. Prairie Village The solid waste regulations for Prairie Village are in Chapter 15, Article 3 of its city codes and ordinances. There are 32 regulations that pertain to solid waste. The regulations cover the storage of solid waste prior to collection, collection vehicles, collection hours, permits and licensing for collectors, responsibilities of home associations, anti-scavenger rules, yard waste, prohibited acts, enforcement, and funding for solid waste management. Roeland Park The solid waste regulations for Roeland Park are in Chapter 15, Article 1 of its city codes and ordinances. There are 16 regulations that pertain to solid waste. The regulations cover the storage of solid waste prior to collection, collection, permits and licensing for collectors, composting, public dumpsters, prohibited acts, enforcement, and public education. Shawnee The solid waste regulations for Shawnee are in Chapter 8, Article 1 of its city codes and ordinances. The most recent revision to these codes and ordinances was made in 2005. There are 17 regulations that pertain to solid waste. The regulations cover the storage of solid waste prior to collection, collection, permits and licensing for collectors, final disposal of solid waste, enforcement, and recycling.
Chapter 2 State and Local Legislative Regulatory Review
CLIENTS\JOCO\KC081858 01.03.08 3607.00.001.001
2-7
Spring Hill The solid waste regulations for Spring Hill are in Chapter 7, Articles 2 and 3 of its city codes and ordinances. The most recent revision to these codes and ordinances was made in 2005. There are 35 regulations that pertain to solid waste. The regulations cover the storage of solid waste prior to collection, collection, permits and licensing for collectors, rates, final disposal of solid waste, burning, annual cleanup, and enforcement. Westwood The solid waste regulations for Westwood are in Chapter 8, Articles 3 and 5 of its city codes and ordinances. The most recent revision to these codes and ordinances was made in 1993. There are 15 regulations that pertain to solid waste. The regulations cover the storage of solid waste prior to collection, collection vehicles, prohibited acts, burning, and weight. Westwood Hills The solid waste regulations for Westwood are in Chapter 4, Articles 5 and Chapter 10, Article 2 of its city codes and ordinances. There are eight regulations that pertain to solid waste. The regulations cover the storage of solid waste prior to collection, collection hours, yard waste, and enforcement. SUMMARY All codes and ordinances for Johnson County cities and the unincorporated areas address solid waste in the context of protecting human health and safety. Most codes and ordinances govern the storage of solid waste prior to collection, regulate prohibited acts such as open burning, dumping, and scavenging, and license or permit haulers. For cities that contract for collection of solid waste, recyclables and/or yard waste, the ordinances also typically address these waste streams (see Chapter 3, Table 3-1). Some cities regulate additional solid waste activities. For example, Prairie Village and Roeland Park regulate residential composting. The Shawnee ordinance requires the recyclable materials hauler to provide each residential unit with a recycling bin and stipulates that the recycling bins become the property of the city. Shawnee also mandates that all residents must share the costs of the residential curbside recycling program, with exemptions based on special circumstances. Lenexa has an extensive list of requirements pertaining to solid waste including those pertaining to composting and curbside separation of recyclable materials.7
7 http://www.ci.lenexa.ks.us/legal/citycodes.html
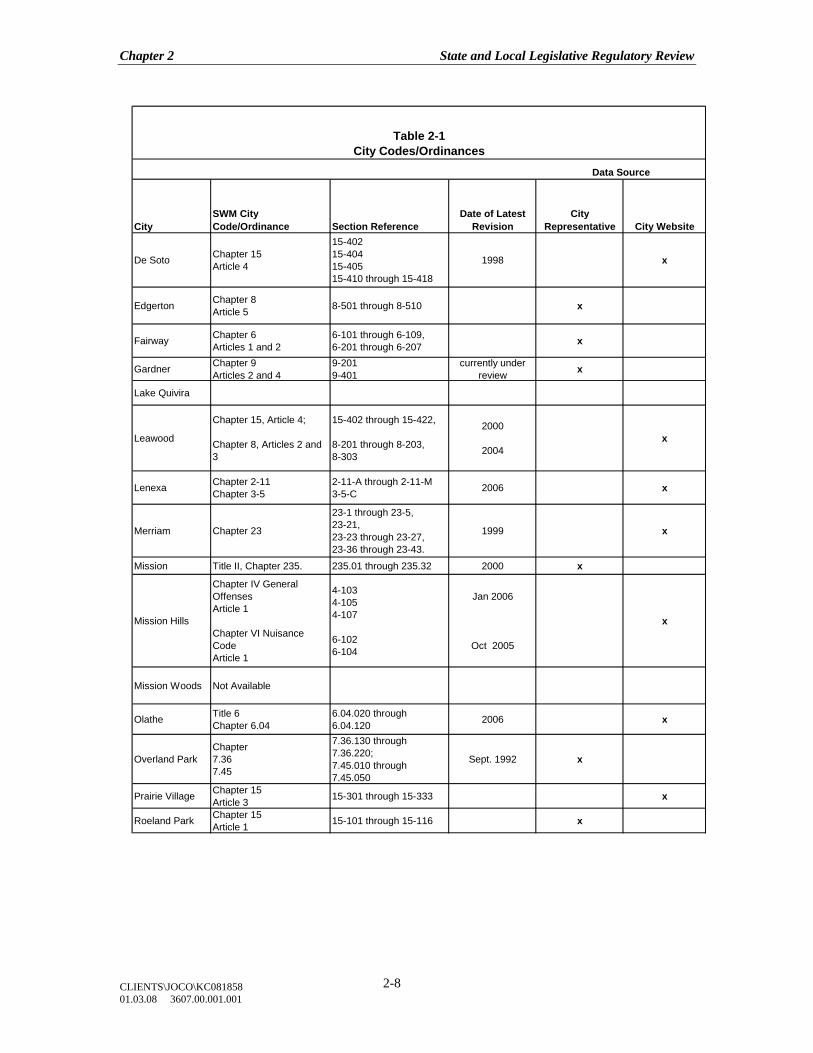
Chapter 2 State and Local Legislative Regulatory Review
CLIENTS\JOCO\KC081858 01.03.08 3607.00.001.001
2-8
Table 2-1City Codes/Ordinances
Data Source
CitySWM City Code/Ordinance Section Reference
Date of Latest Revision
City Representative City Website
De Soto Chapter 15Article 4
15-40215-40415-40515-410 through 15-418
1998 x
Edgerton Chapter 8Article 5 8-501 through 8-510 x
Fairway Chapter 6Articles 1 and 2
6-101 through 6-109,6-201 through 6-207 x
Gardner Chapter 9Articles 2 and 4
9-2019-401
currently under review x
Lake Quivira
Leawood
Chapter 15, Article 4;
Chapter 8, Articles 2 and 3
15-402 through 15-422,
8-201 through 8-203,8-303
2000
2004x
Lenexa Chapter 2-11Chapter 3-5
2-11-A through 2-11-M3-5-C 2006 x
Merriam Chapter 23
23-1 through 23-5,23-21,23-23 through 23-27,23-36 through 23-43.
1999 x
Mission Title II, Chapter 235. 235.01 through 235.32 2000 x
Mission Hills
Chapter IV General OffensesArticle 1
Chapter VI Nuisance CodeArticle 1
4-1034-1054-107
6-1026-104
Jan 2006
Oct 2005
x
Mission Woods Not Available
Olathe Title 6Chapter 6.04
6.04.020 through 6.04.120 2006 x
Overland ParkChapter7.367.45
7.36.130 through 7.36.220;7.45.010 through 7.45.050
Sept. 1992 x
Prairie Village Chapter 15Article 3 15-301 through 15-333 x
Roeland Park Chapter 15Article 1 15-101 through 15-116 x
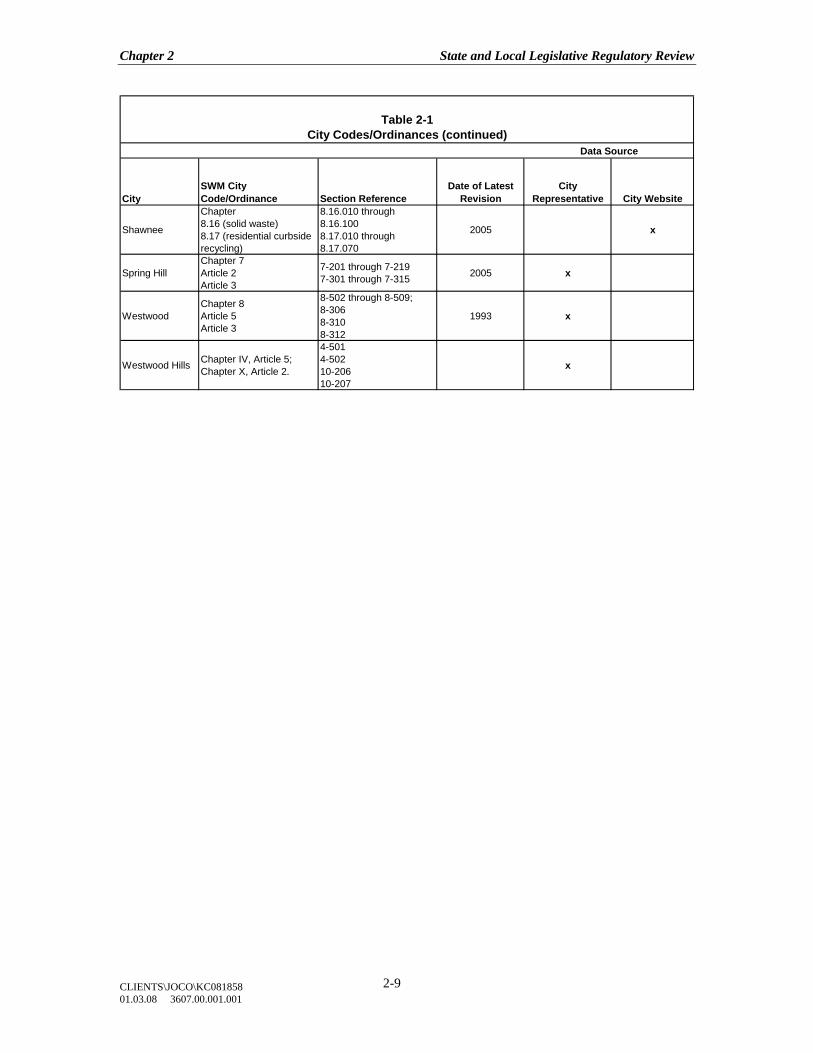
Chapter 2 State and Local Legislative Regulatory Review
CLIENTS\JOCO\KC081858 01.03.08 3607.00.001.001
2-9
Table 2-1City Codes/Ordinances (continued)
Data Source
CitySWM City Code/Ordinance Section Reference
Date of Latest Revision
City Representative City Website
Shawnee
Chapter8.16 (solid waste)8.17 (residential curbside recycling)
8.16.010 through 8.16.1008.17.010 through 8.17.070
2005 x
Spring HillChapter 7Article 2Article 3
7-201 through 7-2197-301 through 7-315 2005 x
WestwoodChapter 8Article 5Article 3
8-502 through 8-509;8-3068-3108-312
1993 x
Westwood Hills Chapter IV, Article 5;Chapter X, Article 2.
4-5014-50210-20610-207
x
Chapter 2 State and Local Legislative Regulatory Review
CLIENTS\JOCO\KC081858 01.03.08 3607.00.001.001
2-10
CHAPTER 2 REFERENCES
Johnson County Environmental Department. “Solid Waste Management Plan Revision, Phase I Review and Evaluation Final Report”. February 1993. Kansas Department of Health and Environment Bureau of Waste Management. “Establishing Waste Reduction Schedules in Solid Waste Management Plans”. Technical Guidance Document SW 06-01. December 04, 2006. Kansas Department of Health and Environment Bureau of Waste Management. “Guidelines for Five Year Solid Waste Management Plan Reviews.” December 3, 2003.
Chapter 3 Current Solid Waste Management System
CLIENTS\JOCO\KC081858 01.03.08 3607.00.001.001
3-1
CHAPTER 3
CURRENT SOLID WASTE MANAGEMENT SYSTEM INTRODUCTION Solid waste management in Johnson County, as it currently exists, is described in this chapter. The chapter is divided into discussions on collection and transportation services, and the solid waste management facilities used in the processing and disposal of these wastes. Greater emphasis is given to detailing the management of municipal solid waste (MSW) than other solid waste generated in the county. MSW is generated from both residential and commercial sources. COLLECTION AND TRANSPORTATION SERVICES Residential MSW Approximately 193,500 occupied households exist in Johnson County. These dwelling units have solid waste collection service provided at least weekly. Eighty percent of the households in the county live in buildings of four household units or less (single-family) and receive separate (or individual) collection service. Ninety-six percent of the single-family households in the incorporated cities have access to curbside collection of recyclable materials. In addition, single-family households in some Johnson County communities have access to separate collection of yard waste for composting. Individual household collection of waste to be disposed (i.e., trash) is typically accomplished with rear-loading packer trucks of 20- to 30-cubic yards capacity. Two- or three-person crews with these trucks are common, driver included. The driver occasionally assists in loading household trash, which is usually stored in 30-gallon bags or containers of similar size. The City of Olathe is the exception. Beginning in 2004, Olathe conducted an automated trash collection pilot study with 1,000 households. Based on the pilot study results, the city council approved a citywide automated trash collection system. Olathe residents are supplied a 95-gallon cart (smaller sizes are available upon request) that is collected curbside by trucks equipped with automated lifting devices. Most waste in the county is collected at the curb (i.e., alongside the street) although a few households have collection next to the house. The collected trash is disposed in landfills located both in and out of the county. Similar to trash collection, commingled recyclable materials and separated yard waste are collected in rear-loading packer trucks with two- or three-person crews. The commingled recyclable materials are transported out of the county for processing. Yard waste is composted in as well as out of the county.
Chapter 3 Current Solid Waste Management System
CLIENTS\JOCO\KC081858 01.03.08 3607.00.001.001
3-2
A summary of waste management services for households in the county is shown in Table 3-1. Waste management services and responsibility for contracting for those services are shown for each city with the exception of Mission Woods. In addition to the Mission Woods data gap, information on service level and contracting responsibility is also missing for the townships. A central contact or collection point for township waste management service data does not exist. Highlights from Table 3-1 include the following:
• Residents in 15 cities have access to curbside collection of recyclable materials.
• Residents in six cities (or parts of cities) have separate collection of yard waste for composting.
• Eight cities contract directly for citywide trash collection. • Two cities contract for citywide curbside collection of recyclable
materials. • One city contracts for citywide curbside collection of yard waste for
disposal. • One city owns and operates their own collection system (trash,
recyclables, yard waste). • All county residents have the option of contracting with private haulers on
an as-needed basis for the collection of bulky waste. Five cities and some homeowner associations have bulky item pick up built into solid waste contracts. In addition, nine cities reported periodic city-sponsored drop-off or curbside collection of bulky items for their residents. In some cases, there is an additional charge for appliances. One city, using city crews for collection, charges for bulky item pick up.
Table 3-2 displays details on the responsibility of payment for residential recyclable materials and yard waste collection. Data gaps for Table 3-2 include Mission Woods and the townships. Table 3-2 highlights include the following:
• Four cities have mandatory pay for residential curbside collection of recyclable materials, five cities have a voluntary pay system, and six cities pay the haulers directly.
• Two cities own and operate drop-off collection sites, while private companies own and operate drop-offs in 12 cities.
• Separate yard waste curbside collection for composting is available in six cities (or parts of cities). Two have voluntary pay and four cities pay directly.
• There are three city-owned yard waste drop-off collection sites in the county (DeSoto, Olathe, Spring Hill). However, Spring Hill collects the yard waste for burning and not composting.
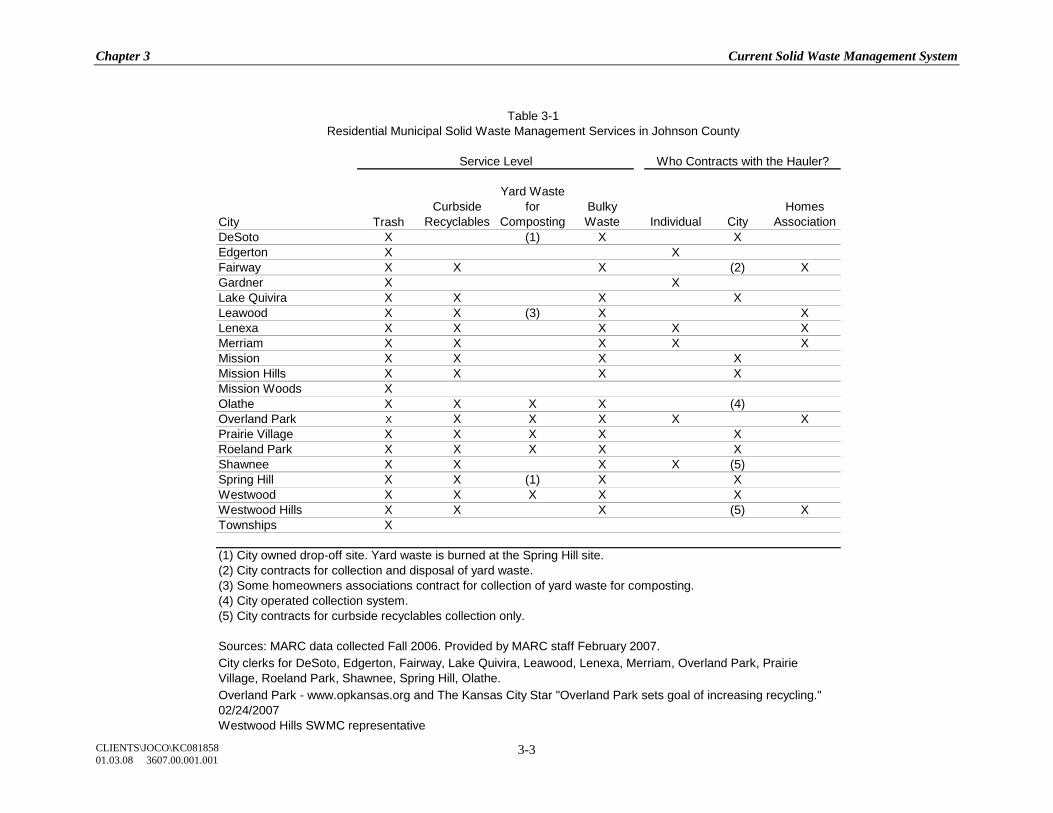
Chapter 3 Current Solid Waste Management System
CLIENTS\JOCO\KC081858 01.03.08 3607.00.001.001
3-3
City TrashCurbside
Recyclables
Yard Waste for
CompostingBulky Waste Individual City
Homes Association
DeSoto X (1) X XEdgerton X XFairway X X X (2) XGardner X XLake Quivira X X X XLeawood X X (3) X XLenexa X X X X XMerriam X X X X XMission X X X XMission Hills X X X XMission Woods XOlathe X X X X (4)Overland Park X X X X X XPrairie Village X X X X XRoeland Park X X X X XShawnee X X X X (5)Spring Hill X X (1) X XWestwood X X X X XWestwood Hills X X X (5) XTownships X
(1) City owned drop-off site. Yard waste is burned at the Spring Hill site.(2) City contracts for collection and disposal of yard waste.(3) Some homeowners associations contract for collection of yard waste for composting.(4) City operated collection system.(5) City contracts for curbside recyclables collection only.
Westwood Hills SWMC representative
Table 3-1Residential Municipal Solid Waste Management Services in Johnson County
Sources: MARC data collected Fall 2006. Provided by MARC staff February 2007.
Overland Park - www.opkansas.org and The Kansas City Star "Overland Park sets goal of increasing recycling." 02/24/2007
City clerks for DeSoto, Edgerton, Fairway, Lake Quivira, Leawood, Lenexa, Merriam, Overland Park, Prairie Village, Roeland Park, Shawnee, Spring Hill, Olathe.
Service Level Who Contracts with the Hauler?
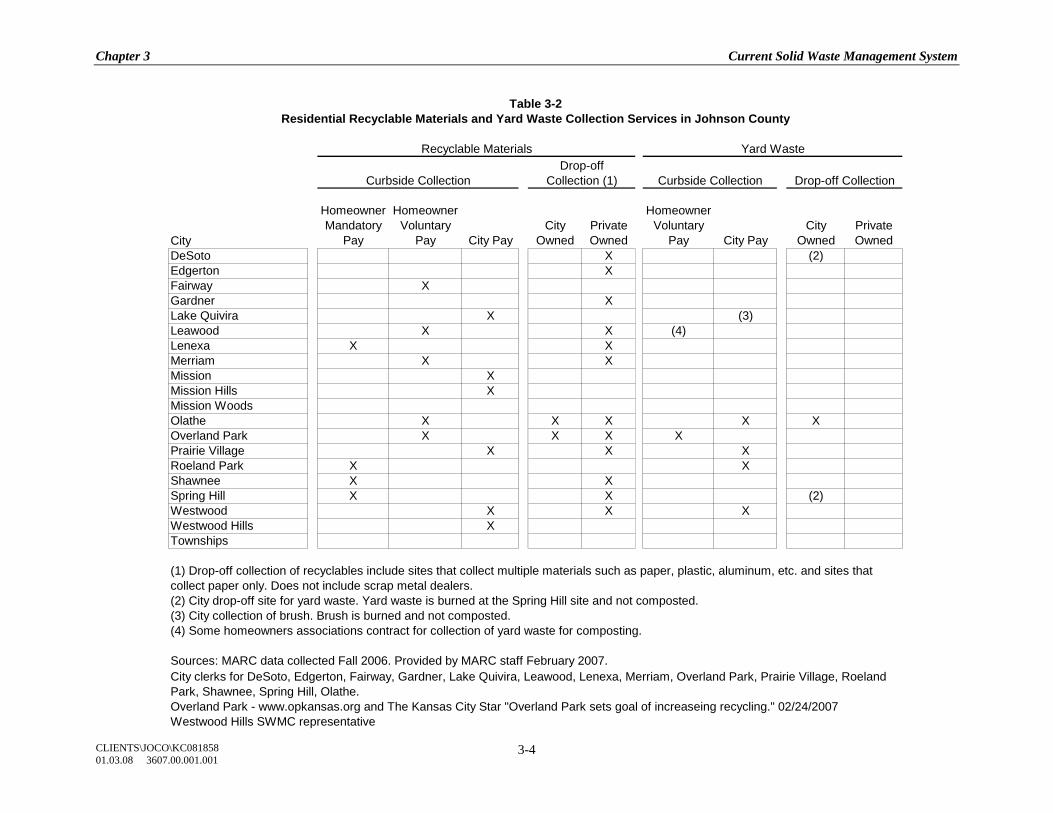
Chapter 3 Current Solid Waste Management System
CLIENTS\JOCO\KC081858 01.03.08 3607.00.001.001
3-4
City
Homeowner Mandatory
Pay
Homeowner Voluntary
Pay City PayCity
OwnedPrivate Owned
Homeowner Voluntary
Pay City PayCity
OwnedPrivate Owned
DeSoto X (2)Edgerton XFairway XGardner XLake Quivira X (3)Leawood X X (4)Lenexa X XMerriam X XMission XMission Hills XMission WoodsOlathe X X X X XOverland Park X X X XPrairie Village X X XRoeland Park X XShawnee X XSpring Hill X X (2)Westwood X X XWestwood Hills XTownships
(2) City drop-off site for yard waste. Yard waste is burned at the Spring Hill site and not composted.(3) City collection of brush. Brush is burned and not composted.(4) Some homeowners associations contract for collection of yard waste for composting.
Sources: MARC data collected Fall 2006. Provided by MARC staff February 2007.
Overland Park - www.opkansas.org and The Kansas City Star "Overland Park sets goal of increaseing recycling." 02/24/2007Westwood Hills SWMC representative
Residential Recyclable Materials and Yard Waste Collection Services in Johnson CountyTable 3-2
City clerks for DeSoto, Edgerton, Fairway, Gardner, Lake Quivira, Leawood, Lenexa, Merriam, Overland Park, Prairie Village, Roeland Park, Shawnee, Spring Hill, Olathe.
(1) Drop-off collection of recyclables include sites that collect multiple materials such as paper, plastic, aluminum, etc. and sites that collect paper only. Does not include scrap metal dealers.
Drop-offCollection (1) Drop-off Collection
Recyclable Materials
Curbside Collection
Yard Waste
Curbside Collection
Chapter 3 Current Solid Waste Management System
CLIENTS\JOCO\KC081858 01.03.08 3607.00.001.001
3-5
Non-Residential MSW Wholesale and retail establishments, offices, and institutional establishments generate most of the non-residential MSW in Johnson County. Commercially generated MSW to be disposed is generally stored in two to eight cubic yard dumpster containers (same as used in multi-family housing) or in larger roll-off containers. The smaller dumpster containers are collected with front-loading packer trucks. Enclosed roll-off containers of 20 to 40 cubic yards capacity are used by some establishments generating large quantities of waste – certain department stores, grocery stores, etc. Roll-off containers are loaded onto truck beds and their contents unloaded at the disposal site. Several private haulers collect commercial MSW in Johnson County. Disposal occurs at landfills both in and outside the county. Commercial establishments generating substantial quantities of old corrugated containers (OCC) often bale the material and have it collected separately for recycling. This is common at grocery stores and large department stores. Smaller establishments may have access to slotted OCC recycling bins sited at the dock areas or, in the case of some smaller shopping centers and office complexes, in a common area designated for trash and OCC collection. The other major recyclable material from commercial establishments is office paper. White ledger paper (high-grade office paper) has the greatest value. Mixed office paper, a lower-value grade, is often collected separately from the high-grade paper. Both are collected from many Johnson County businesses and institutional establishments. The recycling division of Deffenbaugh Industries, Inc. has announced plans to site additional bins at commercial establishments, including multi-family apartment complexes. They will also start accepting additional materials such as plastic and aluminum from existing as well as new commercial customers. Much of the separately collected office paper and OCC in Johnson County are marketed through area paper dealers such as Deffenbaugh Recycling and Smurfit-Stone Company in Kansas City, Kansas, and Batliner Company in Kansas City, Missouri. These companies, as well as other smaller paper dealers, process the materials for shipment to end-user markets outside the Kansas City area. MSW Special Wastes The Kansas Department of Health and Environment’s (KDHE) “Solid Waste Management Plan Five-Year Worksheet” highlights the following special wastes for separate consideration. Lead Acid Batteries. Lead acid batteries from automobiles and other vehicle types are not considered hazardous waste as long as they are intact and recycled. Due to the sulfuric acid and lead contents, split or broken batteries must be handled as hazardous waste.
Chapter 3 Current Solid Waste Management System
CLIENTS\JOCO\KC081858 01.03.08 3607.00.001.001
3-6
Automotive maintenance and repair shops recycle the batteries they obtain through their operations. In addition, many of these shops accept batteries from the public for recycling at no charge. The Philip J. Wittek Household Hazardous Materials Collection Facility (HMCF), owned by Johnson County, also accepts vehicle batteries from county residents and small commercial and industrial facilities through their small quantity hazardous waste generator program for business waste. Used Oil. Used oil must be disposed of in an environmentally sound manner. An established infrastructure exists for the recovery of this waste. Local automobile maintenance and repair shops have ongoing contracts with recycling companies to collect the waste oil from their operations. Many of these establishments accept waste oil, free of charge, from the public. Oil filters are also being recycled by many of the maintenance and repair shops in the county. The County-owned hazardous waste facility accepts waste oil from county residents and small commercial and industrial facilities through their small quantity hazardous waste generator program for business waste. Scrap Tires. KDHE has a waste tire program that requires waste tire collectors, processors, and transporters to be permitted by the state. The state also promotes beneficial uses of scrap tires. For example, whole tires may be used as part of the landfill leachate collection systems, and cut tire chips may be used as daily landfill cover material. Other beneficial uses must be approved by KDHE. Deffenbaugh Industries, Inc. has active permits for a tire processing facility and a tire monofill located at the Johnson County Landfill, Inc. In Leavenworth County, a private company holds active permits for tire processing, transporting, and monofilling. There is also an active permit for a tire processing facility in Wyandotte County. Scrap tires in Johnson County are collected for recycling (including retreading) and disposal. County retail tire dealers and vehicle maintenance shops report recycling the tires generated from their operations. Many of these establishments accept scrap tires from the public for a fee. Scrap tires collected for recycling are transported outside of the county. The scrap tires not transported for recycling are either disposed in or out of the county, transported out of the county to be processed into an alternative fuel for electric generation, or combusted whole by cement production facilities located out of the county. KDHE reports two Kansas cement plants (one in Chanute and another in Humboldt) that use whole tires for fuel. According to Kansas’ solid waste regulations, scrap tires generated for disposal must be processed before being disposed in landfills. Processing requirements can be found in Kansas Administrative Regulations 28-29-29(4)(b).
Chapter 3 Current Solid Waste Management System
CLIENTS\JOCO\KC081858 01.03.08 3607.00.001.001
3-7
Household Hazardous Waste and Small Quantities of Hazardous Waste. Household hazardous waste (HHW) represents a small part (less than ½ percent) of the residential waste stream. Small quantities of hazardous waste (less than 55 pounds per month) are generated at small commercial and industrial establishments8. Johnson County has established the Philip J. Wittek Hazardous Materials Collection Facility to handle hazardous wastes from county residents and small quantity generators (SQG). The collection service is free for county residents; a fee-based system is in place for SQGs. To ensure staff availability and public safety, the County requires residents and SQGs to schedule an appointment before coming to the facility. Approximately 90 percent of the materials collected by the County-owned facility get a “second life.” Used motor oil is recycled. Flammable liquids are blended with virgin fuel and burned as fuel at cement kilns. Car batteries and rechargeable batteries are recycled. Reusable items are placed in a reuse area and are available to the public. Corrosive liquids are neutralized and pesticides are disposed of as hazardous waste. The City of Olathe also has established a household hazardous waste collection site for city residents. The facility is opened the second Saturday of the month from 8 a.m. until noon year-round. Residents can also bring some HHW products at other times by scheduling an appointment with Olathe’s Customer Service Division. Hazardous wastes are materials specifically listed as hazardous by the U.S. EPA or those that would fail one of the characteristic hazardous tests for toxicity, ignitability, corrositivity, or reactivity. Typical materials accepted at the County hazardous materials collection facility are listed below.
• Adhesives • Insecticides • Arts and Crafts Materials • Kerosene • Brake Fluid • Motor Oil • Car Batteries • Paint Solvents • Cleaning Products • Photo Chemicals • Compact Fluorescent Light
Bulbs • Pool Chemicals
• Disinfectants • Wood Preservatives • Gasoline • 1-3 lb. Propane Cylinders • Herbicides • Insecticides
Latex paint is also accepted at the County collection facility. Usable paint is re-blended into several colors and made available to the public for exterior painting at no charge.
8 According to Kansas regulations, a small quantity generator (SQG) must meet the following
conditions: the facility generates 55 lbs or less of hazardous waste or no more than 2.2 lbs of acutely hazardous waste in a calendar month and the facility accumulates no more than 2,200 lbs. of hazardous waste, no more than 2.2 lbs. of acutely hazardous waste, or no more than 55 lbs. of debris and contaminated materials from the clean up of spillage of acutely hazardous waste.
Chapter 3 Current Solid Waste Management System
CLIENTS\JOCO\KC081858 01.03.08 3607.00.001.001
3-8
The County reports that from 1993 to July 2007, they had recycled 81,148 gallons (or 485 tons) of latex paint. Hazardous wastes generated by a SQG facility are accepted at the site through a fee-based program. Waste typically collected through the SQG program include the following:
• Acids • Motor Oil* • Aerosols • Paint and Thinners • Alkaline Wastes • Pesticides • Fertilizers • Pool Chemicals • Latex Paint* • Solvents • Lead Acid Batteries** • Degreasers
* Motor oil is not considered hazardous waste as long as it is recycled for energy or material recovery. It is not included in the monthly generation rate calculation. Latex paint is not hazardous waste and is not included in the monthly rate calculation. ** Lead acid batteries are not considered hazardous waste if recycled and are not included in the monthly rate calculation.9
White Goods. Major appliances in MSW, including refrigerators, washing machines, and water heaters, are often called “white goods”. Appliances that contain coolants, such as refrigerators and freezers, must be handled separately from other appliances. Environmental regulations require that appliances containing chlorofluorocarbon (CFC) coolants must have the coolant evacuated before disposal by a certified recycler with certified equipment. White goods passing through the Johnson County Landfill, Inc. and the Olathe transfer station are clearly segregated and tagged for CFC removal. Routine compliance inspections are conducted by the Johnson County Environmental Department and KDHE. Pesticides and Pesticide Containers. Pesticides and their containers are accepted at the County’s hazardous materials collection facility. Pesticides are disposed of as hazardous waste through a hazardous waste contractor. City and County public works and parks departments take some of the pesticides for use on government property. Distribution to the general public is not allowed under the Federal Insecticide, Fungicide, and Rodenticide Act (FIFRA). Many large agricultural users of pesticides utilize the farmers’ cooperative association service that applies mixed pesticides from bulk containers, which eliminate excess chemicals or empty containers requiring disposal.
9 Johnson County Environmental Department website.
http://jced.jocogov.org/hazardous_materials/business/hhw_sqg.htm
Chapter 3 Current Solid Waste Management System
CLIENTS\JOCO\KC081858 01.03.08 3607.00.001.001
3-9
Consumer Electronics. Although some consumer electronics are being managed through personal and community reuse channels such as Surplus Exchange, the majority of consumer electronics are currently being collected for disposal by landfilling. An exception is that Overland Park accepts cell phones and pagers at their drop-off recycling facility operated by Bridging The Gap. The city of Olathe also accepts some computer equipment from city residents at their household hazardous waste collection site for a fee. At least one private Johnson County company, Securus Midwest, accepts office electronics from the commercial sector. The County will be adding residential electronics recycling at their household hazardous waste collection facility starting in 2008. Other Solid Waste Other solid wastes managed in Johnson County include industrial process wastes, construction and demolition debris (C&D), street sweepings, wastewater sludges, grease trap/interceptor waste, medical waste, trees and brush, seasonal clean up waste, natural disaster waste, agricultural wastes, and abandoned automobiles. Non-Hazardous Industrial Process Waste. Industrial process waste generated in the county for disposal is stored in either roll-off containers or smaller dumpsters that are collected with front-loading packer trucks. Disposal is primarily in MSW landfills. The Johnson County Environmental Department requires the Johnson County Landfill, Inc. to record the type and quantity of each load of industrial process waste10 entering the landfill. Due to the value of industrial process wastes, this waste is collected for recovery whenever possible. The 1993 Johnson County SWMP Phase 1 report estimated recovery of non-hazardous industrial process waste at 80 percent of generation, but there is limited data upon which to base any current estimate. Construction and Demolition Debris. Construction and demolition debris (C&D) includes products and materials such as bricks, concrete, soils, rock, wood, and drywall. C&D results from the construction, renovation, and demolition of residential and non-residential structures. C&D is also generated from city, county, and state road and bridge work. The building-related C&D waste stream is mostly disposed (with limited recovery) in landfills located in Johnson County. Recovery of building-related C&D (especially from renovations and demolitions) is more difficult due to the mixed nature of the materials. There is some indication that portions of the C&D debris from large building projects, such as the demolition and reconstruction of the Mission Mall, may by recovered from the construction site through recycling. No active recycling or recovery of C&D is currently being conducted on-site at any of the landfills in Johnson County.
10 Non-hazardous industrial process wastes are classified as special waste for landfill disposal reporting
and must be permitted for disposal at the Johnson County Landfill, Inc. by the Johnson County Environmental Department.
Chapter 3 Current Solid Waste Management System
CLIENTS\JOCO\KC081858 01.03.08 3607.00.001.001
3-10
C&D from road and bridge construction is a “cleaner” waste stream and therefore easier and more economical to recover. Old asphalt from roads is milled, crushed, and remelted for use in new asphalt. The recovery rate for this high-value material is expected to be over 50 percent in Johnson County. Kansas Department of Transportation (DOT) estimated in 2005 that DOT contractors recovered asphalt at 85 to 90 percent on state highway projects. Concrete from road and bridge work is often recovered and processed into aggregate. However, this processing can increase the cost above natural sourced aggregate, which is a disincentive for recovery in areas of the country with plentiful aggregate supplies like the Kansas City area. Street Sweepings. Collection of street sweepings occurs in most of the larger cities in Johnson County. Although this is a year-round activity, much of the activity occurs after the use of sand and salt on roads during winter storms. Special collection vehicles with sweepers are used to clean streets and private companies are often hired to perform some or all of a city’s street sweeping service. The material collected is generally quite heavy and often goes to C&D landfills. Wastewater Sludges. Septic haulers are licensed through the Johnson County Environmental Department and deliver waste to the County wastewater treatment plants. A portion of the de-watered sludge from the County’s wastewater treatment plants is being disposed through landfilling and another portion is land applied by a private company in Miami County, Kansas. The City of Olathe composts their wastewater treatment plant sludge at a permitted biosolids composting site located at the City’s closed landfill. The finished compost is used as a soil amendment on City projects. Grease Trap/Interceptor Waste. The restaurant and food manufacturers grease trap interceptor waste generated in Johnson County is collected by private haulers in pumper trucks and taken to the Kaw Point wastewater treatment facility. This facility, located in Wyandotte County, is owned by the Unified Government of Wyandotte County and Kansas City, Kansas. Anticipated upgrades to Johnson County’s Middle Basin wastewater treatment plant will provide for an in-county disposal option. Future upgrade plans provide for the addition of a grease trap/interceptor waste receiving station. This waste will be processed with anaerobic sludge digestion for methane recovery and on-site energy use. Medical Wastes. Medical wastes are collected by licensed medical waste haulers and most of the medical waste is hauled to a special storage and transport facility located at Johnson County Landfill, Inc. The medical waste is hauled to a facility in Newton, Kansas and autoclaved. The autoclaved waste is then hauled as MSW to an MSW landfill in Harper County, Kansas. There is also a newly permitted medical waste transfer station owned by Enserv Midwest, LLC located in Wyandotte County.
Chapter 3 Current Solid Waste Management System
CLIENTS\JOCO\KC081858 01.03.08 3607.00.001.001
3-11
Trees and Brush. Most of this waste stream in Johnson County is from utility trimming around power lines, city crews (such as parks and recreation), and land clearing for new development. The City of DeSoto has a permitted tree and brush disposal site for city and DeSoto residents only. Asplundh Tree Service Company performs the trimming service in the county for Kansas City Power & Light Company (KCP&L). Asplundh chips the collected waste and hauls it to KCP&L sites. Materials generated by city crews may be chipped for mulch, disposed on City property, or landfilled. In Johnson County, land clearing brush and trees are most often chipped or burned, which requires an open burning exemption from the Johnson County Environmental Department and the local fire department. Seasonal Cleanup Wastes. Seasonal cleanup waste, in a typical weather year, is managed through normal solid waste collection and disposal options. In years with weather events that generate large quantities of vegetative debris (i.e., limbs and branches), the cities designate temporary collection sites where residents deliver the storm debris. Equipment is transported to the temporary site for chipping and mulching of the debris. Cities usually allow residents to remove the processed debris for personal use. However, if a weather event creates debris that may contain harmful materials, then the clean up of such debris would be considered hazardous and would require more oversight as allowed for in the County’s emergency operations plan (see section on Natural Disaster Waste). Natural Disaster Waste. The Johnson County Local Emergency Operations Plan, Annex O (LEOP) states that the “Johnson County Public Works Department is responsible for coordinating debris removal and disposal in the unincorporated areas of the county. For the incorporated areas, the cities are responsible for this coordination, with the county providing secondary support if needed and available. In emergency situations, where limited local resources may require centralized coordination and prioritization, the Public Works Group in the County Emergency Operations Center (EOC) will assume this responsibility.” The County Engineer maintains current listings of local resources available for debris removal and disposal. Annex O of the LEOP is included as Appendix D to this report. Agricultural Wastes. The Natural Resource Conservation Service (NRCS) of Johnson County states that the majority of agricultural waste is from swine and cattle operations. Liquid wastes from these operations are land injected and the manures are land applied or tilled. Food scraps are used as feed at some swine operations and dairies have reported using bread scraps as feed. Abandoned Automobiles. Abandoned automobiles are not an issue in Johnson County.
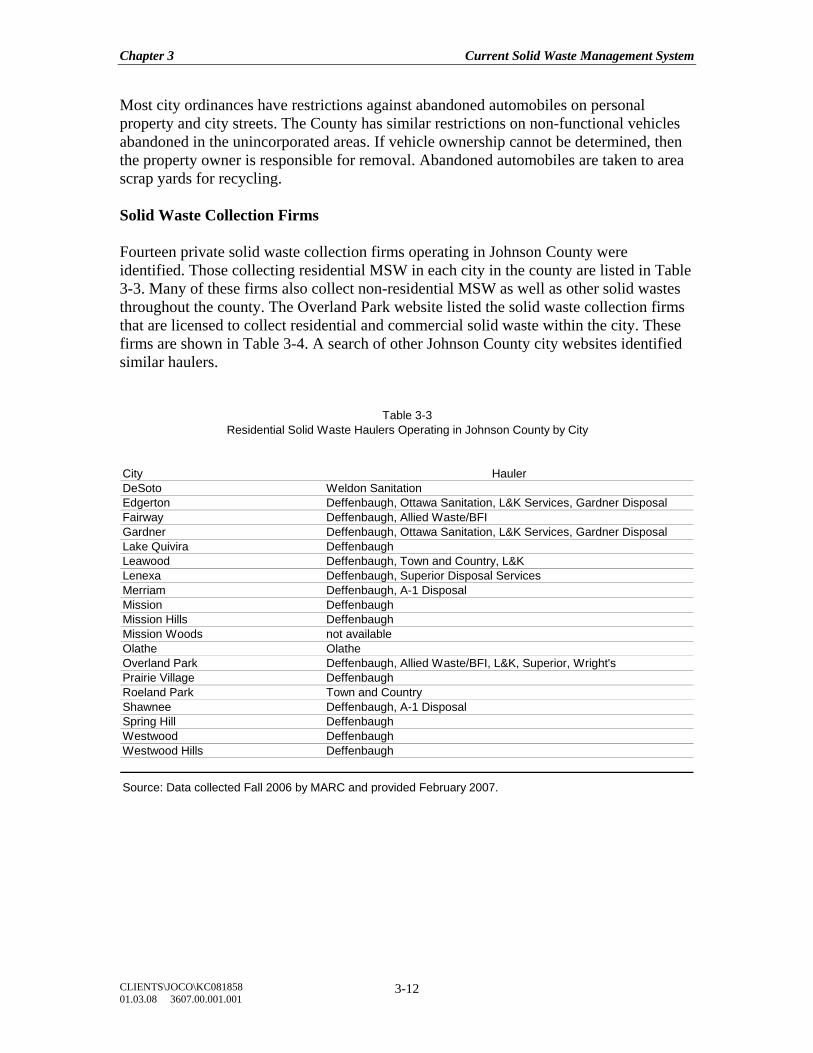
Chapter 3 Current Solid Waste Management System
CLIENTS\JOCO\KC081858 01.03.08 3607.00.001.001
3-12
Most city ordinances have restrictions against abandoned automobiles on personal property and city streets. The County has similar restrictions on non-functional vehicles abandoned in the unincorporated areas. If vehicle ownership cannot be determined, then the property owner is responsible for removal. Abandoned automobiles are taken to area scrap yards for recycling. Solid Waste Collection Firms Fourteen private solid waste collection firms operating in Johnson County were identified. Those collecting residential MSW in each city in the county are listed in Table 3-3. Many of these firms also collect non-residential MSW as well as other solid wastes throughout the county. The Overland Park website listed the solid waste collection firms that are licensed to collect residential and commercial solid waste within the city. These firms are shown in Table 3-4. A search of other Johnson County city websites identified similar haulers.
City HaulerDeSoto Weldon SanitationEdgerton Deffenbaugh, Ottawa Sanitation, L&K Services, Gardner DisposalFairway Deffenbaugh, Allied Waste/BFIGardner Deffenbaugh, Ottawa Sanitation, L&K Services, Gardner DisposalLake Quivira DeffenbaughLeawood Deffenbaugh, Town and Country, L&KLenexa Deffenbaugh, Superior Disposal ServicesMerriam Deffenbaugh, A-1 DisposalMission DeffenbaughMission Hills DeffenbaughMission Woods not availableOlathe OlatheOverland Park Deffenbaugh, Allied Waste/BFI, L&K, Superior, Wright'sPrairie Village DeffenbaughRoeland Park Town and CountryShawnee Deffenbaugh, A-1 DisposalSpring Hill DeffenbaughWestwood DeffenbaughWestwood Hills Deffenbaugh
Source: Data collected Fall 2006 by MARC and provided February 2007.
Residential Solid Waste Haulers Operating in Johnson County by CityTable 3-3
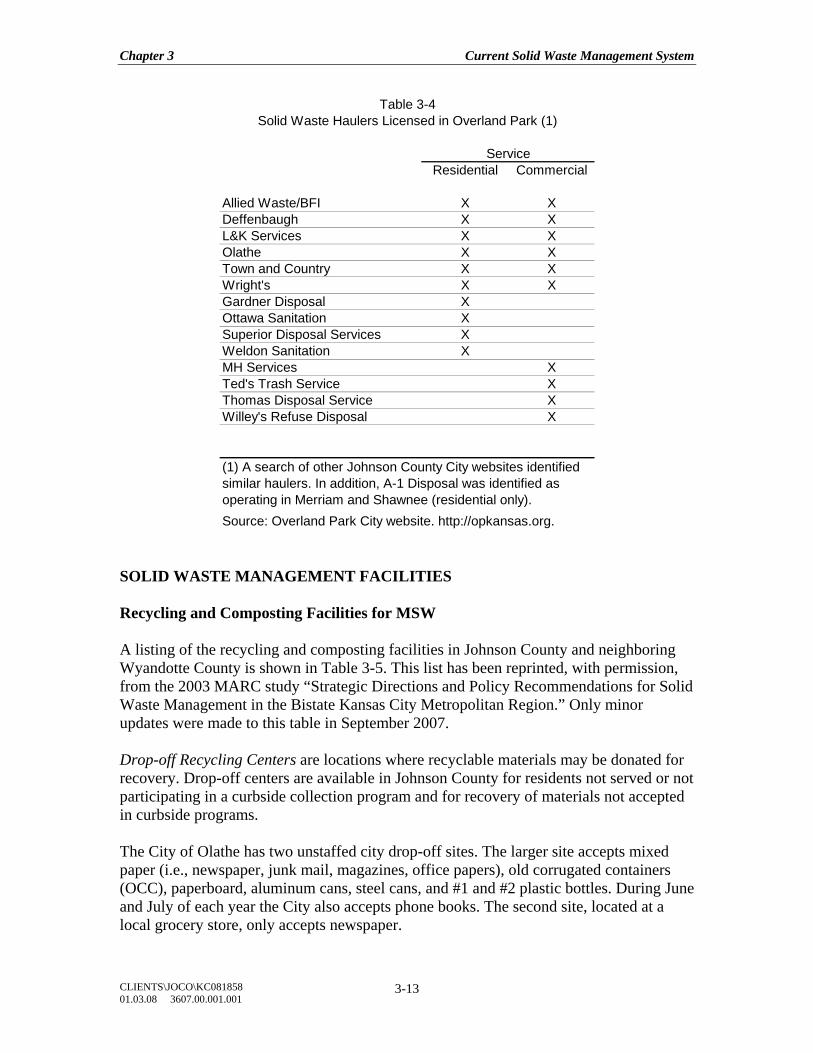
Chapter 3 Current Solid Waste Management System
CLIENTS\JOCO\KC081858 01.03.08 3607.00.001.001
3-13
Residential Commercial
Allied Waste/BFI X XDeffenbaugh X XL&K Services X XOlathe X XTown and Country X XWright's X XGardner Disposal XOttawa Sanitation XSuperior Disposal Services XWeldon Sanitation XMH Services XTed's Trash Service XThomas Disposal Service XWilley's Refuse Disposal X
Source: Overland Park City website. http://opkansas.org.
Service
(1) A search of other Johnson County City websites identified similar haulers. In addition, A-1 Disposal was identified as operating in Merriam and Shawnee (residential only).
Table 3-4Solid Waste Haulers Licensed in Overland Park (1)
SOLID WASTE MANAGEMENT FACILITIES Recycling and Composting Facilities for MSW A listing of the recycling and composting facilities in Johnson County and neighboring Wyandotte County is shown in Table 3-5. This list has been reprinted, with permission, from the 2003 MARC study “Strategic Directions and Policy Recommendations for Solid Waste Management in the Bistate Kansas City Metropolitan Region.” Only minor updates were made to this table in September 2007. Drop-off Recycling Centers are locations where recyclable materials may be donated for recovery. Drop-off centers are available in Johnson County for residents not served or not participating in a curbside collection program and for recovery of materials not accepted in curbside programs. The City of Olathe has two unstaffed city drop-off sites. The larger site accepts mixed paper (i.e., newspaper, junk mail, magazines, office papers), old corrugated containers (OCC), paperboard, aluminum cans, steel cans, and #1 and #2 plastic bottles. During June and July of each year the City also accepts phone books. The second site, located at a local grocery store, only accepts newspaper.
Chapter 3 Current Solid Waste Management System
CLIENTS\JOCO\KC081858 01.03.08 3607.00.001.001
3-14
In 2007, the City of Overland Park opened a new staffed drop-off facility in the southern part of the city operated by Bridging The Gap (the old site located at 79th and Metcalf Ave. was closed). The new site is open from 9:30 to 5:30 Tuesday through Friday and from 8:00 to 4:00 on Saturday. The materials currently accepted are shown below. Additional materials may be added to this list in the future.
• Aluminum foil • Newspaper • Aluminum and steel food
and beverage cans • Office paper • Paperboard
• Cell phones and pagers • Phone books • Clothing • Rechargeable batteries • Corrugated containers
(OCC) • Scrap metal
• Glass food and beverage containers
• Toner/inkjet cartridges
• Household items - small • # 1 plastic containers • Magazines and catalogs • # 2 plastic containers with a
neck The center does not accept yogurt containers, margarine tubs, automotive product containers such as those from motor oil and gas treatments, or bottles which contained hazardous materials, such as pesticides or herbicides. Many of the drop-off centers in Johnson County are materials specific. Private haulers have sited paper recycling containers at public institutions such as schools and churches. These programs typically return some of the profits from selling the recovered paper to the institution where the recycling containers are located. Some area retailers have materials specific recycling containers within their establishments. Many department stores and grocery stores provide bins for plastic bag recovery, dry cleaners recover wire hangers, and mail stores accept used packing peanuts. As mentioned previously in this chapter, many automobile maintenance and repair shops accept used oil and vehicle batteries free of charge and accept used tires for a fee. Buy-back Recycling Centers are private businesses that accept recyclable materials from individuals, organizations, and drop-off centers. Buy-back centers pay for materials based on market conditions.
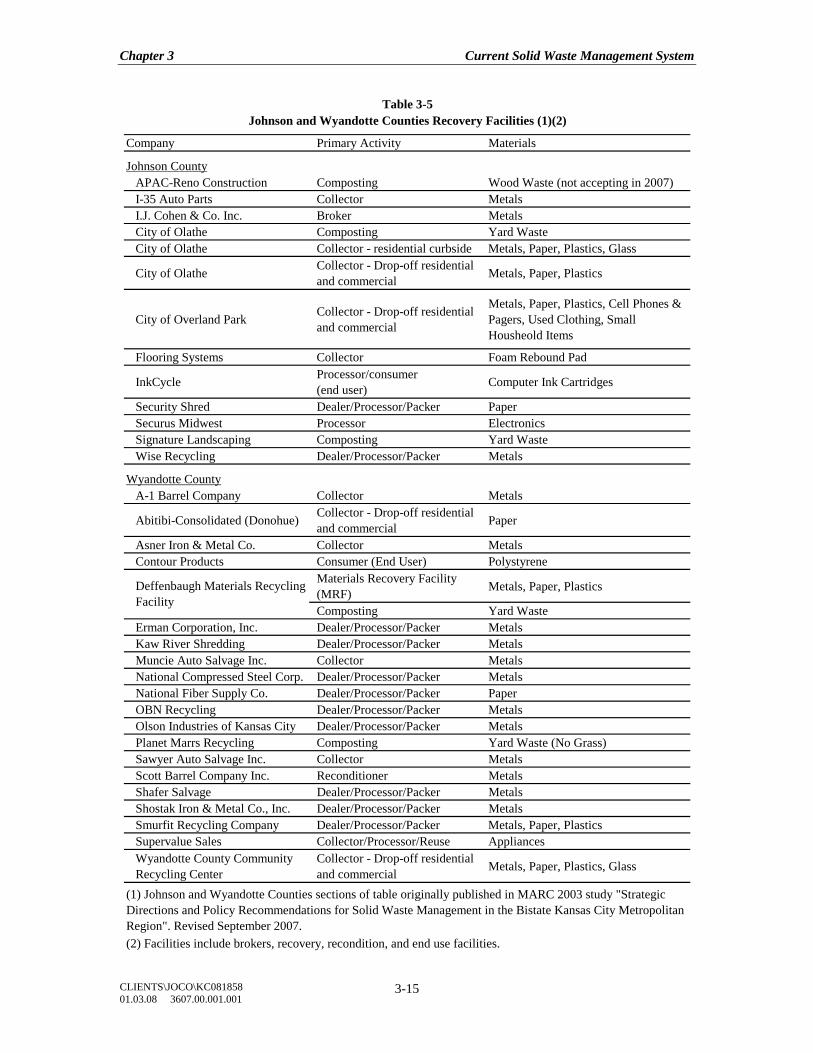
Chapter 3 Current Solid Waste Management System
CLIENTS\JOCO\KC081858 01.03.08 3607.00.001.001
3-15
Company Primary Activity Materials
Johnson CountyAPAC-Reno Construction Composting Wood Waste (not accepting in 2007)I-35 Auto Parts Collector MetalsI.J. Cohen & Co. Inc. Broker MetalsCity of Olathe Composting Yard WasteCity of Olathe Collector - residential curbside Metals, Paper, Plastics, Glass
City of Olathe Collector - Drop-off residential and commercial Metals, Paper, Plastics
City of Overland Park Collector - Drop-off residential and commercial
Metals, Paper, Plastics, Cell Phones & Pagers, Used Clothing, Small Housheold Items
Flooring Systems Collector Foam Rebound Pad
InkCycle Processor/consumer(end user) Computer Ink Cartridges
Security Shred Dealer/Processor/Packer PaperSecurus Midwest Processor ElectronicsSignature Landscaping Composting Yard WasteWise Recycling Dealer/Processor/Packer Metals
Wyandotte County A-1 Barrel Company Collector Metals
Abitibi-Consolidated (Donohue) Collector - Drop-off residential and commercial Paper
Asner Iron & Metal Co. Collector MetalsContour Products Consumer (End User) Polystyrene
Materials Recovery Facility (MRF) Metals, Paper, Plastics
Composting Yard Waste Erman Corporation, Inc. Dealer/Processor/Packer MetalsKaw River Shredding Dealer/Processor/Packer MetalsMuncie Auto Salvage Inc. Collector MetalsNational Compressed Steel Corp. Dealer/Processor/Packer MetalsNational Fiber Supply Co. Dealer/Processor/Packer PaperOBN Recycling Dealer/Processor/Packer MetalsOlson Industries of Kansas City Dealer/Processor/Packer MetalsPlanet Marrs Recycling Composting Yard Waste (No Grass)Sawyer Auto Salvage Inc. Collector MetalsScott Barrel Company Inc. Reconditioner MetalsShafer Salvage Dealer/Processor/Packer MetalsShostak Iron & Metal Co., Inc. Dealer/Processor/Packer MetalsSmurfit Recycling Company Dealer/Processor/Packer Metals, Paper, PlasticsSupervalue Sales Collector/Processor/Reuse AppliancesWyandotte County Community Recycling Center
Collector - Drop-off residential and commercial Metals, Paper, Plastics, Glass
(2) Facilities include brokers, recovery, recondition, and end use facilities.
Table 3-5Johnson and Wyandotte Counties Recovery Facilities (1)(2)
(1) Johnson and Wyandotte Counties sections of table originally published in MARC 2003 study "Strategic Directions and Policy Recommendations for Solid Waste Management in the Bistate Kansas City Metropolitan Region". Revised September 2007.
Deffenbaugh Materials Recycling Facility
Chapter 3 Current Solid Waste Management System
CLIENTS\JOCO\KC081858 01.03.08 3607.00.001.001
3-16
Recyclable Materials Processing Centers are facilities that prepare recyclable materials for sale to end-user markets. The processing may include sorting, shredding, crushing, baling, etc. Buy-back recycling centers are often processing centers, as well. Recyclable paper grades are the most frequently processed material. Metals and different types of containers are also commonly processed. End users often purchase waste paper and metals directly from processing centers. Deffenbaugh Industries, Inc., located in Wyandotte County, is the largest processor of MSW recyclable materials in the Kansas City area. Composting in Johnson County is limited to yard waste and wastewater treatment plant sludge. Limited food waste composting is occurring across the state line in Missouri. Composting of mixed MSW does not exist in the Kansas City area. As listed in Table 3-5, three yard waste composting sites exist in Johnson County – at the Johnson County Landfill (Deffenbaugh Industries, Inc), the Olathe closed landfill, and Signature Landscaping. The Olathe site is the largest and serves Olathe residents. The other two sites are small in comparison. The APAC-Reno construction and demolition landfill has composted wood debris in the past, but is not currently accepting this material. Solid Waste Disposal Facilities Table 3-6 lists the permitted solid waste disposal facilities located in Johnson County. Household Hazardous Waste (HHW) Facilities serve as a safe and secure option for the collection and disposal of hazardous materials in an environmentally sound manner. The collection of HHW in Johnson County is limited to the publicly owned Johnson County and Olathe facilities. The operations of these facilities were discussed earlier in this chapter. The quantities of materials collected at the Johnson County facility were 144 tons in 2005 and 131 tons in 2006. Since the program started in 1993 through July 2007, 1,600 tons have been collected. Transfer Stations are facilities that serve as the link between solid waste collection and, most typically, disposal. They serve the purpose of consolidating waste from multiple collection vehicles into larger, high-volume vehicles for economical transfer to distant facilities. Two city-owned transfer stations are located in Johnson County – Olathe and Lenexa. The Olathe facility transfers approximately 220 tons of MSW per day to the Hamm Landfill located in Jefferson County. The Lenexa transfer station only transfers city-crew generated waste for disposal in the Johnson County Landfill, Inc. or one of the construction and demolition landfills located in the county. However, the site is permitted as a public use transfer station on specified days for large item drop-off from Lenexa residents. Detailed data for the Olathe transfer station are shown in Table 3-7. The quantity of MSW transferred to the Hamm Landfill has decreased from about 85,000 tons in 2004 to
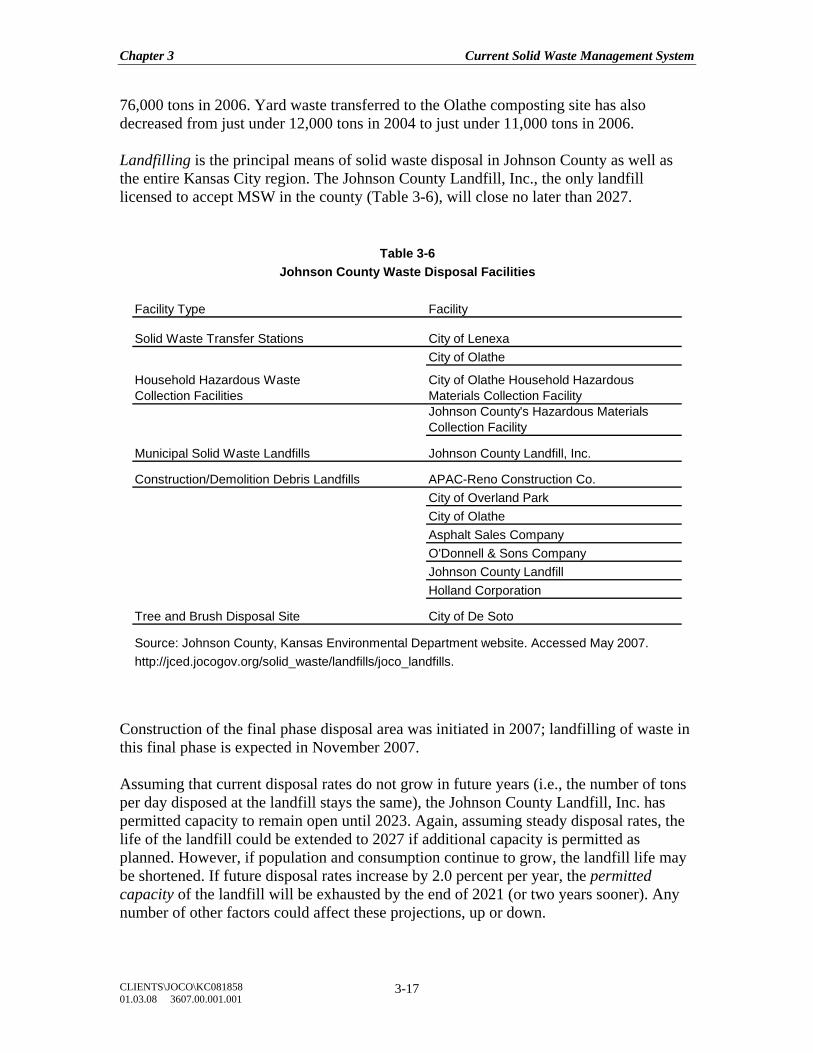
Chapter 3 Current Solid Waste Management System
CLIENTS\JOCO\KC081858 01.03.08 3607.00.001.001
3-17
76,000 tons in 2006. Yard waste transferred to the Olathe composting site has also decreased from just under 12,000 tons in 2004 to just under 11,000 tons in 2006. Landfilling is the principal means of solid waste disposal in Johnson County as well as the entire Kansas City region. The Johnson County Landfill, Inc., the only landfill licensed to accept MSW in the county (Table 3-6), will close no later than 2027. Construction of the final phase disposal area was initiated in 2007; landfilling of waste in this final phase is expected in November 2007. Assuming that current disposal rates do not grow in future years (i.e., the number of tons per day disposed at the landfill stays the same), the Johnson County Landfill, Inc. has permitted capacity to remain open until 2023. Again, assuming steady disposal rates, the life of the landfill could be extended to 2027 if additional capacity is permitted as planned. However, if population and consumption continue to grow, the landfill life may be shortened. If future disposal rates increase by 2.0 percent per year, the permitted capacity of the landfill will be exhausted by the end of 2021 (or two years sooner). Any number of other factors could affect these projections, up or down.
Facility Type Facility
Solid Waste Transfer Stations City of LenexaCity of Olathe
Household Hazardous WasteCollection Facilities
City of Olathe Household Hazardous Materials Collection FacilityJohnson County's Hazardous Materials Collection Facility
Municipal Solid Waste Landfills Johnson County Landfill, Inc.
Construction/Demolition Debris Landfills APAC-Reno Construction Co.City of Overland ParkCity of OlatheAsphalt Sales CompanyO'Donnell & Sons CompanyJohnson County LandfillHolland Corporation
Tree and Brush Disposal Site City of De Soto
Source: Johnson County, Kansas Environmental Department website. Accessed May 2007.http://jced.jocogov.org/solid_waste/landfills/joco_landfills.
Table 3-6Johnson County Waste Disposal Facilities
Chapter 3 Current Solid Waste Management System
CLIENTS\JOCO\KC081858 01.03.08 3607.00.001.001
3-18
In addition to the Johnson County Landfill, Inc. there are six other MSW landfills within 60 miles of Johnson County (Table 3-8). A seventh landfill, the Forest View landfill located in Kansas City, Kansas, closed December 2006. Figure 3-1 shows the quantities of solid waste received by these landfills in 2005. The Johnson County Landfill, Inc. received about 1.8 million tons in 2005. This figure also shows that 688,000 tons of MSW from Missouri were landfilled in Kansas landfills in 2005. Additional facility and waste flow maps are included in Appendix E. Detailed disposal data for the Johnson County Landfill, Inc. are shown in Table 3-9. Eighty-two percent is classified as solid waste, which most closely matches the MSW definition used in this document. The daily tonnage received in 2006 is shown at 4,858 tons per day (4,234 tons classified as MSW plus 624 tons C&D). Since the closing of the Forest View Landfill in Kansas City, Kansas, the daily tonnages at the Johnson County Landfill, Inc. have increased to an estimated 5,000 tons. There are seven permitted construction and demolition landfills (C&D) in Johnson County (there are only eight in the entire Kansas City region). Five of the landfills located in the county are privately owned and two are city owned. Olathe and Overland Park have small C&D landfills for use only by city crews (Table 3-10). C&D landfills are allowed by Kansas’s environmental regulations to accept the following materials for disposal.11
• Wood pallets • Trees, brush, and sod • Street sweepings • Untreated Wood and Sawdust
from any source • Floor tile resulting from
C&D activities • Metal scrap • Motor vehicle window glass
• Siding resulting from C&D activities
• Furniture (excludes certain products)
• Roofing tile resulting from C&D activities
• Incidental quantities of leaves and grass from land clearing activities
• Brick, concrete, rock, soil, wall board, and other materials generated at construction sites
• Incidental MSW generated at construction sites
Table 3-10 shows these landfills, their location, the tons received in 2005, and the anticipated life of each landfill. The Johnson County Landfill, Inc. received the largest quantity of C&D (206,360 tons), followed by the APAC-Reno facility in southern
11 Note of caution – this is a simplified list. For full explanations, definitions, and restrictions, see the
KDHE website for complete Kansas regulations. www.kdheks.gov
Chapter 3 Current Solid Waste Management System
CLIENTS\JOCO\KC081858 01.03.08 3607.00.001.001
3-19
Overland Park (115,400). These two landfills account for over 50 percent of the C&D disposed in the county. In addition to the C&D landfills, there is one permitted tree and brush disposal site in the county located on the northwest side of DeSoto for use by city crews and city residents only. On-site Industrial Waste Disposal. A search of the KDHE online solid waste disposal facility database identified one active industrial waste disposal facility owned by the City of Olathe. The City uses the monofill site to dispose of the lime sludge from their water treatment plant. A closed site at the Sunflower Army Ammunition Plant located in DeSoto was identified. A private company also previously operated an on-site industrial landfill that closed in early 2000s. Incinerators. There are no MSW incineration units operating at this time in Johnson County. A search of the KDHE online solid waste disposal facility database did not identify any active permits for incinerators in Johnson County. SUMMARY There are adequate disposal and recycling services available for most solid waste streams generated by Johnson County sources. Service levels and service costs vary considerably among Johnson County cities and subdivisions within cities due in part to the large number of different entities contracting for solid waste management services and the predominant role of the private sector in providing those services. Olathe is the only city that directly manages the collection and processing of its own residential solid waste. Although nine cities have city-wide solid waste collection contracts, most county residents either rely on their homes associations or contract directly with private haulers for residential waste collection and curbside recycling services, leading to a wide range in fees and inconsistencies in materials collected at curbside for recycling. Separate yard waste collection for composting is available in six cities (or parts of cities). Approximately 96 percent of county residents living in single-family homes have access to curbside recycling. Residents in three of the smaller cities currently do not have any access to curbside recycling services. Commercial recycling options have continued to expand in the county. The siting of a large privately-owned materials recycling facility in nearby Wyandotte County has greatly expanded commercial and residential recycling opportunities in the county as well as the Kansas City region. Recycling services for the C&D waste stream are currently very limited. Composting services for yard waste are also very limited.
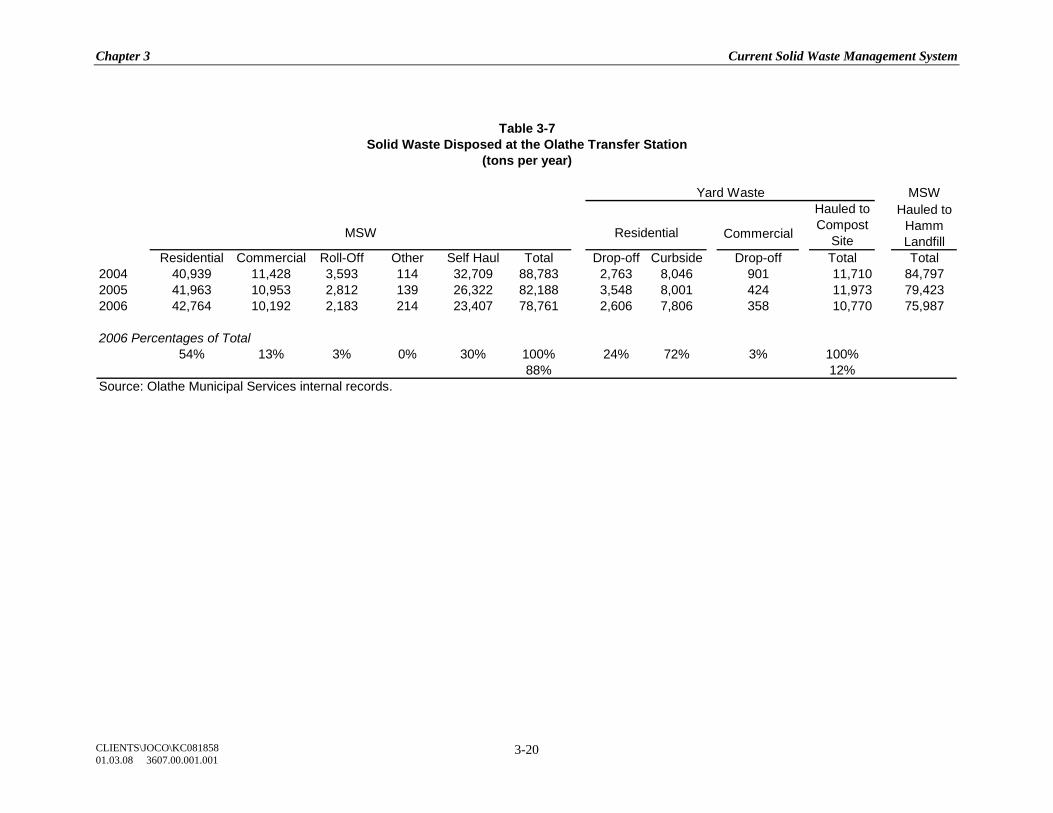
Chapter 3 Current Solid Waste Management System
CLIENTS\JOCO\KC081858 01.03.08 3607.00.001.001
3-20
MSW
Commercial
Residential Commercial Roll-Off Other Self Haul Total Drop-off Curbside Drop-off Total Total2004 40,939 11,428 3,593 114 32,709 88,783 2,763 8,046 901 11,710 84,7972005 41,963 10,953 2,812 139 26,322 82,188 3,548 8,001 424 11,973 79,4232006 42,764 10,192 2,183 214 23,407 78,761 2,606 7,806 358 10,770 75,987
2006 Percentages of Total54% 13% 3% 0% 30% 100% 24% 72% 3% 100%
88% 12%Source: Olathe Municipal Services internal records.
Table 3-7Solid Waste Disposed at the Olathe Transfer Station
(tons per year)
MSW Residential
Yard WasteHauled to
Hamm Landfill
Hauled to Compost
Site
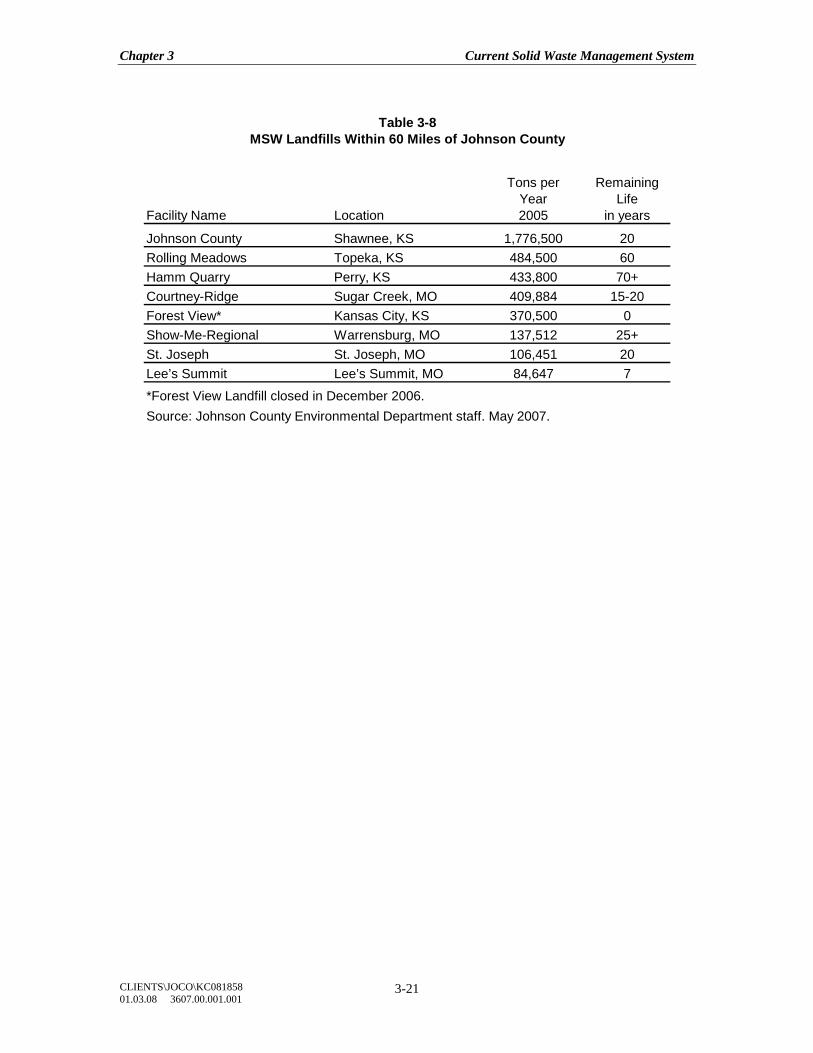
Chapter 3 Current Solid Waste Management System
CLIENTS\JOCO\KC081858 01.03.08 3607.00.001.001
3-21
Facility Name Location
Johnson County Shawnee, KS 1,776,500 20Rolling Meadows Topeka, KS 484,500 60Hamm Quarry Perry, KS 433,800 70+Courtney-Ridge Sugar Creek, MO 409,884 15-20Forest View* Kansas City, KS 370,500 0Show-Me-Regional Warrensburg, MO 137,512 25+St. Joseph St. Joseph, MO 106,451 20Lee’s Summit Lee’s Summit, MO 84,647 7
*Forest View Landfill closed in December 2006.Source: Johnson County Environmental Department staff. May 2007.
Remaining Life
in years
Table 3-8MSW Landfills Within 60 Miles of Johnson County
Tons perYear2005
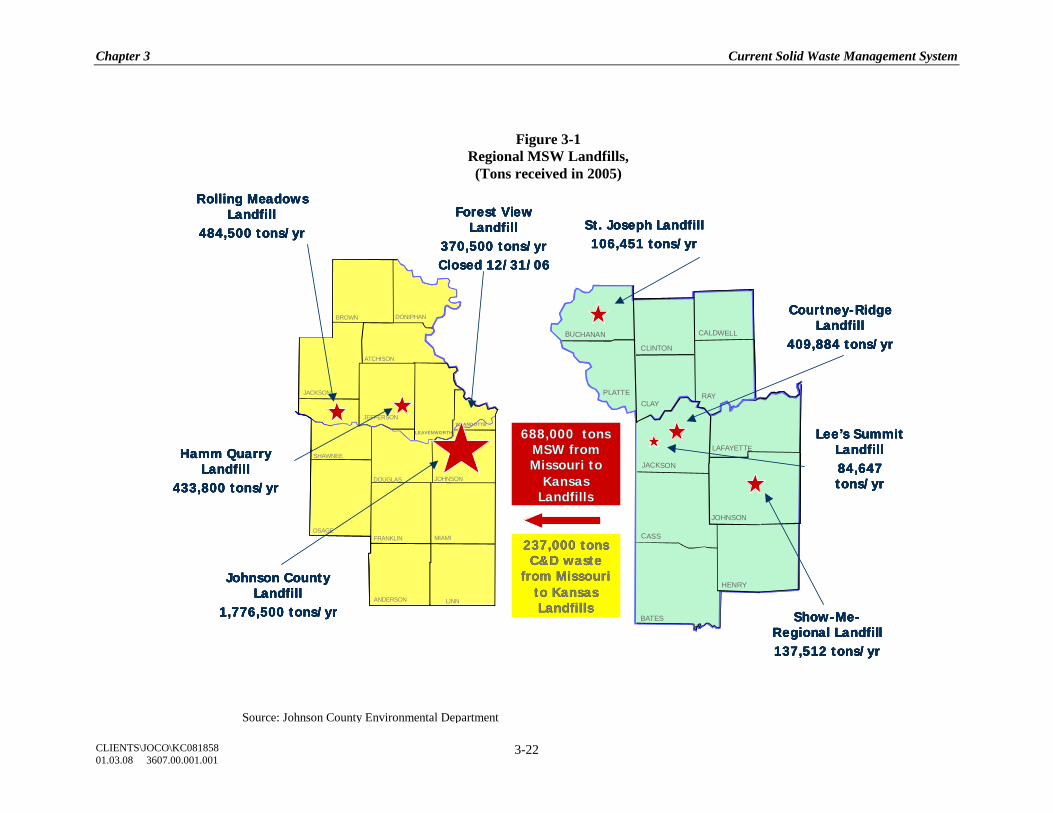
Chapter 3 Current Solid Waste Management System
CLIENTS\JOCO\KC081858 01.03.08 3607.00.001.001
3-22
Figure 3-1 Regional MSW Landfills, (Tons received in 2005)
Source: Johnson County Environmental Department
BUCHANAN
PLATTE
CLINTON
JOHNSON
LAFAYETTE
CALDWELL
JACKSON
CASS
BATES
HENRY
RAYCLAY
BUCHANAN
PLATTE
CLINTON
JOHNSON
LAFAYETTE
CALDWELL
JACKSON
CASS
BATES
HENRY
RAYCLAY
LINNANDERSON
MIAMIFRANKLIN
JOHNSONDOUGLAS
DONIPHAN
ATCHISON
BROWN
JEFFERSON
LEAVENWORTH
SHAWNEE
OSAGE
WYANDOTTE
JACKSON
LINNANDERSON
MIAMIFRANKLIN
JOHNSONDOUGLAS
DONIPHAN
ATCHISON
BROWN
JEFFERSON
LEAVENWORTH
SHAWNEE
OSAGE
WYANDOTTE
JACKSON
Lee’s Summit Lee’s Summit LandfillLandfill84,647 84,647 tons/yrtons/yr
Lee’s Summit Lee’s Summit LandfillLandfill84,647 84,647 tons/yrtons/yr
Hamm Quarry Hamm Quarry LandfillLandfill
433,800 tons/yr433,800 tons/yr
Hamm Quarry Hamm Quarry LandfillLandfill
433,800 tons/yr433,800 tons/yr
Rolling Meadows Rolling Meadows LandfillLandfill
484,500 tons/yr484,500 tons/yr
Rolling Meadows Rolling Meadows LandfillLandfill
484,500 tons/yr484,500 tons/yr
Johnson County Johnson County LandfillLandfill
1,776,500 tons/yr1,776,500 tons/yr
Johnson County Johnson County LandfillLandfill
1,776,500 tons/yr1,776,500 tons/yr ShowShow--MeMe--Regional LandfillRegional Landfill137,512 tons/yr137,512 tons/yr
ShowShow--MeMe--Regional LandfillRegional Landfill137,512 tons/yr137,512 tons/yr
CourtneyCourtney--Ridge Ridge LandfillLandfill
409,884 tons/yr409,884 tons/yr
CourtneyCourtney--Ridge Ridge LandfillLandfill
409,884 tons/yr409,884 tons/yr
St. Joseph Landfill St. Joseph Landfill 106,451 tons/yr106,451 tons/yr
St. Joseph Landfill St. Joseph Landfill 106,451 tons/yr106,451 tons/yr
688,000688,000 tons tons MSW from MSW from Missouri to Missouri to
Kansas Kansas LandfillsLandfills
688,000688,000 tons tons MSW from MSW from Missouri to Missouri to
Kansas Kansas LandfillsLandfills
Forest View Forest View LandfillLandfill
370,500 tons/yr370,500 tons/yrClosed 12/31/06Closed 12/31/06
Forest View Forest View LandfillLandfill
370,500 tons/yr370,500 tons/yrClosed 12/31/06Closed 12/31/06
237,000 tons 237,000 tons C&D waste C&D waste
from Missouri from Missouri to Kansas to Kansas LandfillsLandfills
237,000 tons 237,000 tons C&D waste C&D waste
from Missouri from Missouri to Kansas to Kansas LandfillsLandfills
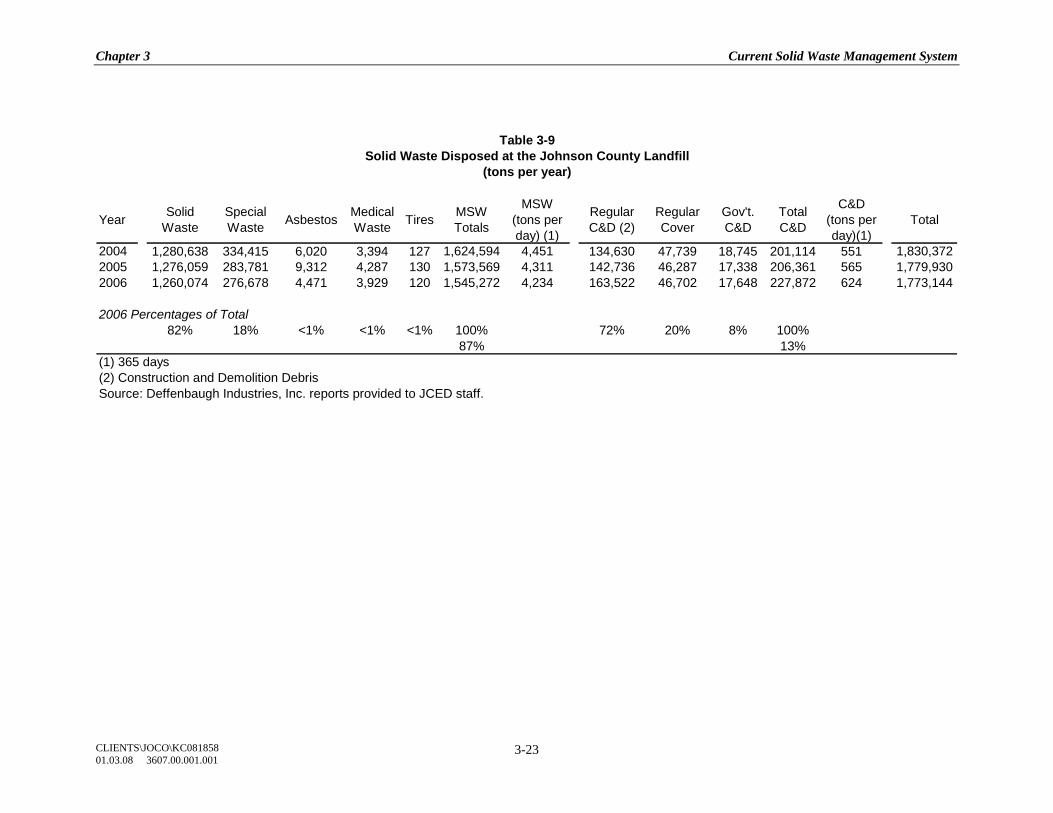
Chapter 3 Current Solid Waste Management System
CLIENTS\JOCO\KC081858 01.03.08 3607.00.001.001
3-23
Year Solid Waste
Special Waste Asbestos Medical
Waste Tires MSW Totals
MSW (tons per day) (1)
Regular C&D (2)
Regular Cover
Gov't. C&D
Total C&D
C&D(tons per day)(1)
Total
2004 1,280,638 334,415 6,020 3,394 127 1,624,594 4,451 134,630 47,739 18,745 201,114 551 1,830,3722005 1,276,059 283,781 9,312 4,287 130 1,573,569 4,311 142,736 46,287 17,338 206,361 565 1,779,9302006 1,260,074 276,678 4,471 3,929 120 1,545,272 4,234 163,522 46,702 17,648 227,872 624 1,773,144
2006 Percentages of Total82% 18% <1% <1% <1% 100% 72% 20% 8% 100%
87% 13%(1) 365 days(2) Construction and Demolition DebrisSource: Deffenbaugh Industries, Inc. reports provided to JCED staff.
Table 3-9Solid Waste Disposed at the Johnson County Landfill
(tons per year)
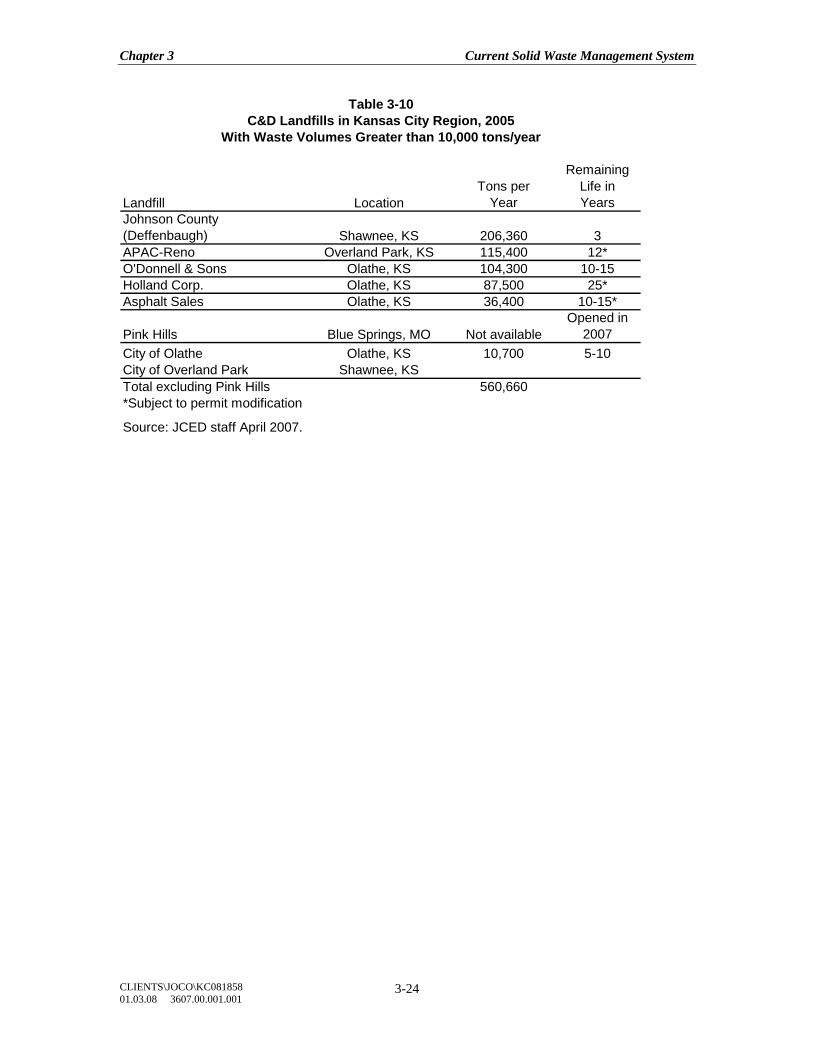
Chapter 3 Current Solid Waste Management System
CLIENTS\JOCO\KC081858 01.03.08 3607.00.001.001
3-24
Landfill LocationTons per
Year
Remaining Life inYears
Johnson County(Deffenbaugh) Shawnee, KS 206,360 3APAC-Reno Overland Park, KS 115,400 12*O'Donnell & Sons Olathe, KS 104,300 10-15Holland Corp. Olathe, KS 87,500 25*Asphalt Sales Olathe, KS 36,400 10-15*
Pink Hills Blue Springs, MO Not availableOpened in
2007City of OlatheCity of Overland Park
Olathe, KSShawnee, KS
10,700 5-10
Total excluding Pink Hills 560,660*Subject to permit modification
Source: JCED staff April 2007.
Table 3-10C&D Landfills in Kansas City Region, 2005
With Waste Volumes Greater than 10,000 tons/year
Chapter 3 Current Solid Waste Management System
CLIENTS\JOCO\KC081858 01.03.08 3607.00.001.001
3-25
CHAPTER 3 REFERENCES
Deffenbaugh Industries, Inc. Disposal data provided to Johnson County Environmental Department staff. August 2007. Johnson County Environmental Department website. “Hazardous Materials Collection Facility.” http://jced.jocogov.org/hazardous_materials/hhw_index.htm Johnson County Environmental Department website. http://jced.jocogov.org/solid_waste/landfills/joco_landfills Johnson County Environmental Department. “Solid Waste Management Plan Revision, Phase I Review and Evaluation Final Report”. February 1993. Johnson County Emergency Management & Homeland Security. Local Emergency Operations Plan. Annex O - Debris Removal & Disposal. July 2005. Johnson County K-State Research & Extension Office. Personal communication with Dan Lekie. September 2007. Kansas Department of Health and Environment. Bureau of Waste Management. Kansas Administrative Regulations Agency 28, Article 29 – Solid Waste Management. July 2006. Kansas Department of Health and Environment. Bureau of Waste Management. Online solid waste facility database. Accessed September 2007. http://public1.kdhe.state.ks.us/Landfills/Landfills.nsf?Opendatabase Kansas Department of Health and Environment. Bureau of Waste Management. “Solid Waste Management Plan Five-Year Worksheet.” December 12, 2004. Kansas Department of Transportation (DOT). Electronic communication with Rick Miller. October 2005. Kansas State University Pollution Prevention Institute. “Pollution Prevention for Auto Maintenance and Repair Shops.” http://www.sbeap.org/publications/AutoMaintFactSheet.pdf MARC solid waste collection data collected Fall 2006. Provided by MARC staff February 2007. MARC “Strategic Directions and Policy Recommendations for Solid Waste Management in the Bistate Kansas City Metropolitan Region.” 2003.
Chapter 3 Current Solid Waste Management System
CLIENTS\JOCO\KC081858 01.03.08 3607.00.001.001
3-26
Olathe Municipal Services. Internal working papers for the Olathe transfer facility. Received June 2007. Overland Park, Kansas. City website. www.opkansas.org Personal communication with city clerks for DeSoto, Edgerton, Fairway, Lake Quivira, Leawood, Lenexa, Merriam, Overland Park, Prairie Village, Roeland Park, Shawnee, Spring Hill, and Olathe. March 2007. The Kansas City Star. "Overland Park sets goal of increasing recycling." February 24, 2007. United States Department of Agriculture. Natural Resource Conservation Service Olathe Service Center. Personal communication with Debbie Sumner. September 2007. United States Environmental Protection Agency. Region 7 solid waste program website. http://www.epa.gov/region07/waste/tires/state_links.htm#kansas
Chapter 4 Current Costs of Solid Waste Management
CLIENTS\JOCO\KC081858 01.03.08 3607.00.001.001
4-1
CHAPTER 4
CURRENT COSTS OF SOLID WASTE MANAGEMENT INTRODUCTION Current costs to manage Johnson County’s solid waste are presented in this chapter. Costs covered include: residential and commercial municipal solid waste (MSW) landfilling; separate curbside collection of household recyclable materials; MSW landfill tipping fees12; and construction and demolition debris landfilling. The solid waste management costs shown in this chapter were largely supplied by the Mid-America Regional Council (MARC), city and county officials, and landfill operators in Johnson County. The cost data are presented below for each waste stream on a “per ton” and “total cost” basis. Household costs are shown for those residents in cities where data were available. Data in this chapter represent current costs. Insufficient data were available to project future costs. RESIDENTIAL MSW Most residential MSW is generated from households with curbside collection service. Solid waste collection from these households usually involves a monthly charge to each household to cover the cost of collection, transportation, and disposal. For some residents, the cost for these services is paid annually through homeowner association dues or is included with property tax assessments. Residential solid waste service fees, shown on a monthly basis, are summarized in Table 4-1. In some cases, the costing data were separated by service level (i.e., trash separate from curbside recycling). The Xs in the table represent a service that is covered by the total fee. Data gaps exist for the cities of Gardner, Merriam, Mission Hills, Mission Woods, Shawnee, and the unincorporated Townships. Where data are available, the monthly charge for residential trash service ranges from $6.53 to $21.00; the monthly charge for curbside recycling ranges from $1.60 to $2.85. Overland Park and Westwood provided monthly household costs for yard waste collected for composting at $2.95 and $3.97, respectively. Westwood has implemented a pay-as-you throw fee structure for trash collection. Residents pay for trash service through a special property tax assessment. Annually, residents are provided 104 stickers that they place on the trash containers each week prior to trash collection. Residents needing additional stickers purchase the stickers from a local retailer for $0.25 per sticker. 12 Tipping fees, also called gate fees, are the charges for disposing wastes at a facility.
Chapter 4 Current Costs of Solid Waste Management
CLIENTS\JOCO\KC081858 01.03.08 3607.00.001.001
4-2
The cost for periodic bulky waste collection is often included in the total cost of service. Lenexa provides their residents with three fee-based drop-off events each year at the city-owned transfer station. Overland Park conducts free bulky item pickup for residents on an every-other-year schedule. Olathe residents pay city crews for bulky item pickup on an as-needed basis. In the City of Mission, the city-wide contract provides for pickup of bulky items on the first collection day of each month. In other cities, residents contract directly with private haulers to collect bulky waste for a fee. Using the trash only fees shown in Table 4-1, the weighted average13 monthly cost of collection, transportation, and disposal of residential MSW is about $10.30 per household. This translates to about $98 per ton of MSW disposed based on an estimated single-family household average of 49 pounds of MSW collected weekly. Yard waste increases this average weight during the growing months; other times of the year, the quantity collected will be less than 49 pounds. Lower amounts of MSW are generated from households located in apartment complexes and other multi-family housing units where individual household waste collection does not exist. MSW disposed from these households is usually collected from large containers used by multiple households living in the same complex. These households are typically smaller and generate less yard waste compared to single-family households. MSW from these households is frequently considered commercial waste due to the manner in which it is collected. Total residential MSW generated in Johnson County is estimated at 291,390 tons in 2005. Of this amount, 247,100 tons are disposed in landfills. At $98 per ton for collection, transportation, and disposal, the total annual cost to manage the county’s residential MSW is about $24.2 million. If the cost for disposal alone is $44 per ton14, then the collection and transportation costs equals $54 per ton ($98 minus $44) or about $13.3 million which is 55 percent of total costs to manage the county’s residential MSW. Recognizing that the cost to collect and transport residential curbside recyclables varies from one section of the county to another, a weighted average residential monthly cost of $2.22 was calculated from the data shown in Table 4-1. This translates to about $91 per ton for collection and transportation (excluding cost of processing) of recyclable materials. Processing of residential recyclables is estimated to cost somewhere between $35 and $65 per ton depending on the materials collected and the type of processing (i.e., manual versus automatic). A general rule-of-thumb is that collection and transportation equals two-thirds of the total cost. Using this assumption, the total cost for curbside collection, transportation and processing of recyclable materials is approximately $136 per ton ($91/0.67). Since revenues from the sale of recovered materials partially or wholly offset
13 Weighted by population. 14 Published gate fee (tipping fee) at Johnson County Landfill, Inc. Table 4-2.
Chapter 4 Current Costs of Solid Waste Management
CLIENTS\JOCO\KC081858 01.03.08 3607.00.001.001
4-3
these processing costs, it generally costs less to recycle a ton of recyclables ($91) than to landfill the same ton ($98). Approximately 17,560 tons of recyclable materials were collected through county residential curbside recycling programs in 2005. These materials were transported to local materials recovery facilities for processing and subsequent sale. Assuming $91 per ton, the total cost of curbside recycling collection and transportation (excluding processing) in Johnson County is estimated to be $1.6 million. This total cost assumes that the revenue received from the sale of the recovered materials offsets the cost of processing. If the recovered material revenues decline, the cost of this service may increase. Management system costs for yard waste collected for composting was more difficult to estimate from the data currently available. Most of the yard waste collected for composting in the county is collected from Olathe residents. Olathe’s budget for all yard waste operations for 2008 is $850,000. Every household is charged $1.95 per month to cover this cost. The 1993 Johnson County Solid Waste Management Plan Phase 1 report estimated the cost of yard waste collection at about 60 percent of curbside collection of recyclable materials. Assuming this same percentage, a ballpark estimate of yard waste collection costs for composting would be $81.60 per ton (0.6 x $136). In 2005, 17,690 tons of yard waste were collected for composting in Johnson County, which translates into about $1.4 million for the total system cost. A second cost estimate can be calculated from Olathe’s data on the quantity of yard waste collected for composting. Since Olathe accounts for 68 percent of the total yard waste collected for composting countywide (Table 5-3) and the City’s composting budget is $850,000 per year or $71 per ton in 2005 ($850,000 / 11,973 tons), adjusting the budget amount upward to account for the remaining 32 percent results in an estimated cost of $1.3 million for countywide yard waste collection with composting. COMMERCIAL MSW Non-residential MSW is collected primarily from commercial establishments, including wholesale, retail, office, and institutional establishments, but also from some industrial, manufacturing, bottling, and food manufacturing facilities. Multifamily MSW is typically considered part of the commercial collection system due to the manner in which it is collected. Collection of commercial MSW for disposal is from dumpster containers of two to eight cubic yards capacity or much larger roll-off containers of 20 to 40 cubic yards capacity. The dumpster containers are typically emptied into front-loading packer trucks that compact the loose material to maximize each load. The roll-off containers are often equipped with compaction equipment and are rolled onto a truck bed for transport to the landfill.
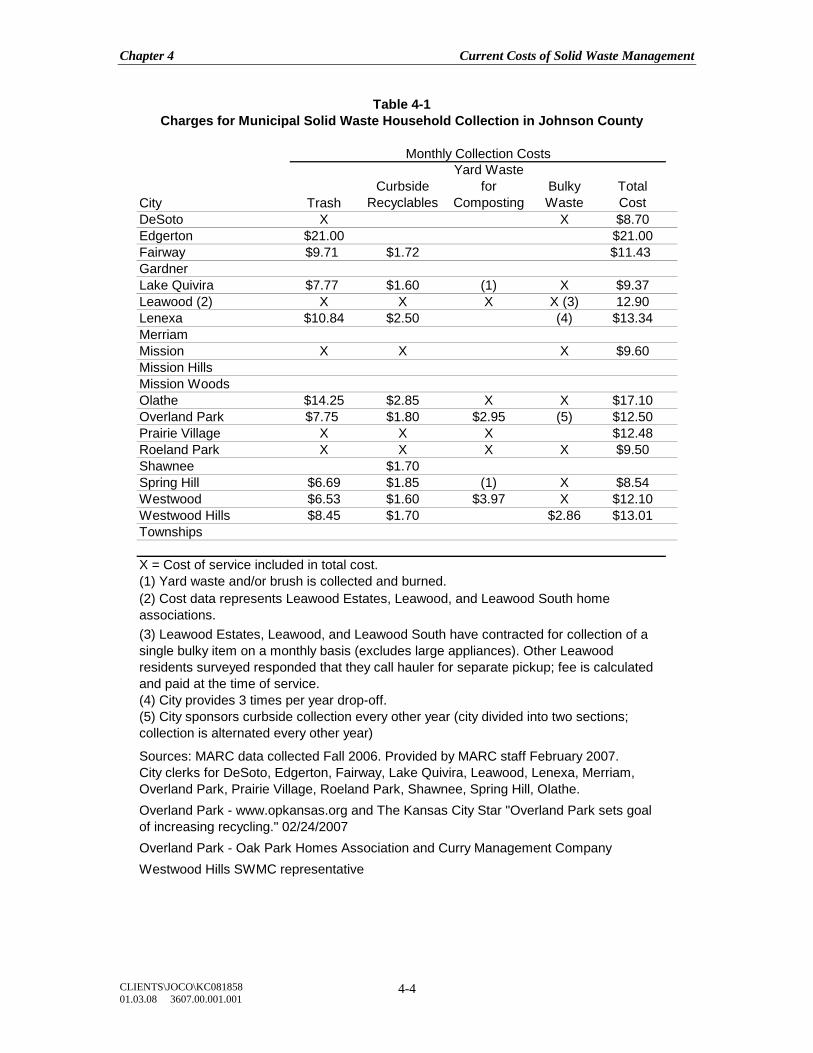
Chapter 4 Current Costs of Solid Waste Management
CLIENTS\JOCO\KC081858 01.03.08 3607.00.001.001
4-4
City TrashCurbside
Recyclables
Yard Waste for
CompostingBulky Waste
TotalCost
DeSoto X X $8.70Edgerton $21.00 $21.00Fairway $9.71 $1.72 $11.43GardnerLake Quivira $7.77 $1.60 (1) X $9.37Leawood (2) X X X X (3) 12.90Lenexa $10.84 $2.50 (4) $13.34MerriamMission X X X $9.60Mission HillsMission WoodsOlathe $14.25 $2.85 X X $17.10Overland Park $7.75 $1.80 $2.95 (5) $12.50Prairie Village X X X $12.48Roeland Park X X X X $9.50Shawnee $1.70Spring Hill $6.69 $1.85 (1) X $8.54Westwood $6.53 $1.60 $3.97 X $12.10Westwood Hills $8.45 $1.70 $2.86 $13.01Townships
X = Cost of service included in total cost.(1) Yard waste and/or brush is collected and burned.
(4) City provides 3 times per year drop-off.
Sources: MARC data collected Fall 2006. Provided by MARC staff February 2007.
Overland Park - Oak Park Homes Association and Curry Management CompanyWestwood Hills SWMC representative
Table 4-1Charges for Municipal Solid Waste Household Collection in Johnson County
Monthly Collection Costs
(2) Cost data represents Leawood Estates, Leawood, and Leawood South home associations.(3) Leawood Estates, Leawood, and Leawood South have contracted for collection of a single bulky item on a monthly basis (excludes large appliances). Other Leawood residents surveyed responded that they call hauler for separate pickup; fee is calculated and paid at the time of service.
(5) City sponsors curbside collection every other year (city divided into two sections; collection is alternated every other year)
City clerks for DeSoto, Edgerton, Fairway, Lake Quivira, Leawood, Lenexa, Merriam, Overland Park, Prairie Village, Roeland Park, Shawnee, Spring Hill, Olathe.Overland Park - www.opkansas.org and The Kansas City Star "Overland Park sets goal of increasing recycling." 02/24/2007
Chapter 4 Current Costs of Solid Waste Management
CLIENTS\JOCO\KC081858 01.03.08 3607.00.001.001
4-5
Commercial establishments pay for trash service according to the size of the dumpster and the number of pick ups (pulls) required each week. Limited data are available on commercial waste collection charges in Johnson County due to the proprietary nature of the data. Charges escalate as the size of the container and the number of pulls per week increase. However, on a per cubic yard basis, the cost decreases as the container size increases because the efficiency of collection and transportation improves as the quantity increases. For example, published commercial rates for Olathe range from $47 for a two cubic yard dumpster requiring one pull per week to $75 for an eight cubic yard dumpster with the same number of pulls. However, on a per cubic yard basis, the smaller container costs $23.50 per cubic yard and the larger size is $9.38 per cubic yard. Assuming 450 pounds per cubic yard for uncompacted commercial MSW in a two cubic yard dumpster, the per ton fee would equal about $104 per ton, which is slightly higher than residential curbside MSW collection. The larger eight cubic yards dumpster with a fee of $9.38 per cubic yard equals about $42 per ton. It is anticipated that the larger 20 or 40 cubic yards capacity containers have even lower per ton costs. The 1993 Johnson County Solid Waste Management Plan Phase 1 report estimated the cost for a two cubic yard container at $100 per ton (similar to the analysis above) and the cost for a 40 cubic yard roll-off between $30 to $40 per ton. In 2005, an estimated 190,600 tons of commercial MSW were collected for disposal from Johnson County sources. Assuming that most of the commercial MSW is collected from larger sized containers with a $42 per ton fee, total commercial MSW collection, transportation and disposal costs are estimated at $8.0 million. These commercial waste management costs do not account for the collection of recyclable materials. No data could be found to estimate the costs to collect commercial recyclable materials for recovery. MSW LANDFILL TIP FEES Table 4-2 shows the published tipping fees for area MSW landfills. A customer may also sometimes negotiate a lower cost for larger quantities of waste. Current MSW landfill tipping fees in the Kansas City Metropolitan Region range from $30 per ton to $54 per ton. According to the 1993 Johnson County Solid Waste Management Plan Phase 1 report, the Johnson County Landfill tipping fee was $16.50 per ton in 1992. More stringent environmental regulations are one factor affecting landfill tipping fees since the early 1990s.
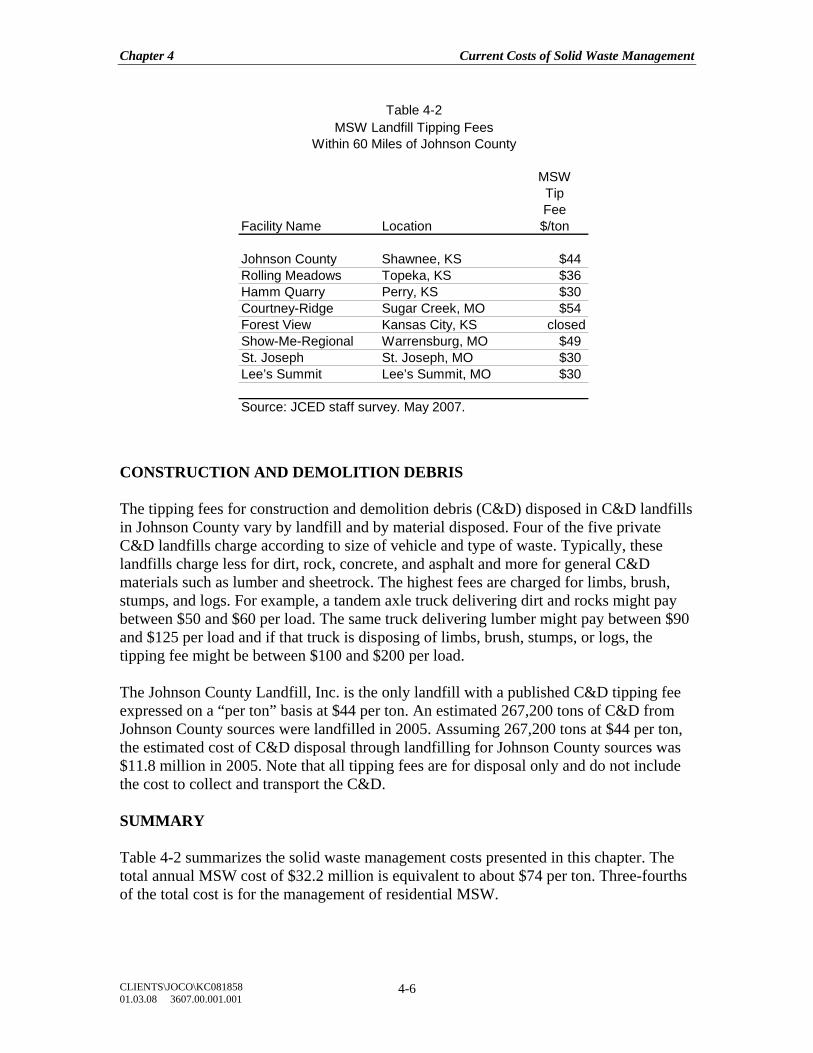
Chapter 4 Current Costs of Solid Waste Management
CLIENTS\JOCO\KC081858 01.03.08 3607.00.001.001
4-6
CONSTRUCTION AND DEMOLITION DEBRIS The tipping fees for construction and demolition debris (C&D) disposed in C&D landfills in Johnson County vary by landfill and by material disposed. Four of the five private C&D landfills charge according to size of vehicle and type of waste. Typically, these landfills charge less for dirt, rock, concrete, and asphalt and more for general C&D materials such as lumber and sheetrock. The highest fees are charged for limbs, brush, stumps, and logs. For example, a tandem axle truck delivering dirt and rocks might pay between $50 and $60 per load. The same truck delivering lumber might pay between $90 and $125 per load and if that truck is disposing of limbs, brush, stumps, or logs, the tipping fee might be between $100 and $200 per load. The Johnson County Landfill, Inc. is the only landfill with a published C&D tipping fee expressed on a “per ton” basis at $44 per ton. An estimated 267,200 tons of C&D from Johnson County sources were landfilled in 2005. Assuming 267,200 tons at $44 per ton, the estimated cost of C&D disposal through landfilling for Johnson County sources was $11.8 million in 2005. Note that all tipping fees are for disposal only and do not include the cost to collect and transport the C&D. SUMMARY Table 4-2 summarizes the solid waste management costs presented in this chapter. The total annual MSW cost of $32.2 million is equivalent to about $74 per ton. Three-fourths of the total cost is for the management of residential MSW.
MSWTipFee
Facility Name Location $/ton
Johnson County Shawnee, KS $44Rolling Meadows Topeka, KS $36Hamm Quarry Perry, KS $30Courtney-Ridge Sugar Creek, MO $54Forest View Kansas City, KS closedShow-Me-Regional Warrensburg, MO $49St. Joseph St. Joseph, MO $30Lee’s Summit Lee’s Summit, MO $30
Source: JCED staff survey. May 2007.
Table 4-2MSW Landfill Tipping Fees
Within 60 Miles of Johnson County
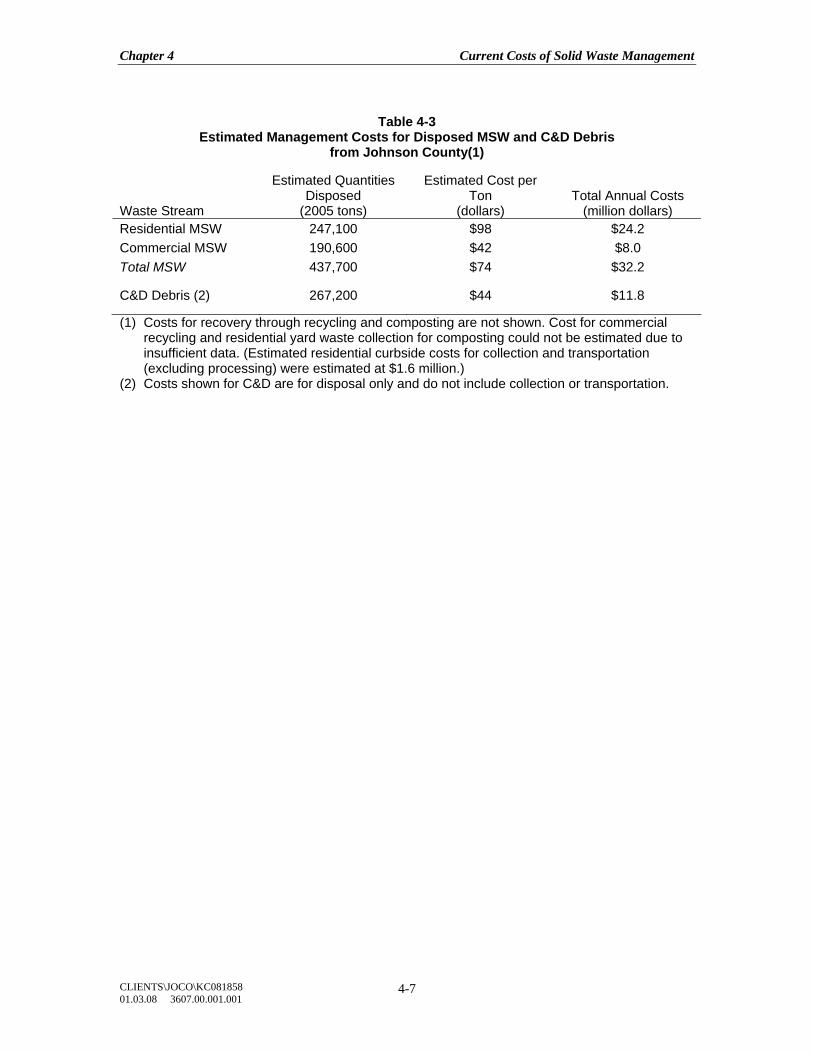
Chapter 4 Current Costs of Solid Waste Management
CLIENTS\JOCO\KC081858 01.03.08 3607.00.001.001
4-7
Table 4-3
Estimated Management Costs for Disposed MSW and C&D Debris from Johnson County(1)
Waste Stream
Estimated Quantities Disposed
(2005 tons)
Estimated Cost per Ton
(dollars)
Total Annual Costs
(million dollars) Residential MSW 247,100 $98 $24.2 Commercial MSW 190,600 $42 $8.0 Total MSW 437,700 $74 $32.2
C&D Debris (2) 267,200 $44 $11.8
(1) Costs for recovery through recycling and composting are not shown. Cost for commercial recycling and residential yard waste collection for composting could not be estimated due to insufficient data. (Estimated residential curbside costs for collection and transportation (excluding processing) were estimated at $1.6 million.)
(2) Costs shown for C&D are for disposal only and do not include collection or transportation.
Chapter 4 Current Costs of Solid Waste Management
CLIENTS\JOCO\KC081858 01.03.08 3607.00.001.001
4-8
CHAPTER 4 REFERENCES
City clerks for the following cities: DeSoto, Edgerton, Fairway, Lake Quivira, Leawood, Lenexa, Merriam, Overland Park, Prairie Village, Roeland Park, Shawnee, Spring Hill, Olathe. Landfill tipping fees provided by landfill operators. Johnson County Environmental Department. “Solid Waste Management Plan Revision, Phase I Review and Evaluation Final Report”. February 1993. MARC solid waste collection data collected Fall 2006. Provided by MARC staff February 2007. City of Overland Park website. www.opkansas.org. Personal communication with representatives of the Oak Park Homes Association (located in Lenexa, KS), and Curry Management Company, and the Westwood Hills SWMC representative. The Kansas City Star. "Overland Park sets goal of increasing recycling." 02/24/2007
Chapter 5 Waste Characterization
CLIENTS\JOCO\KC081858 01.03.08 3607.00.001.001
5-1
CHAPTER 5
WASTE CHARACTERIZATION INTRODUCTION Identifying the composition and quantity of the municipal solid waste (MSW) stream is an important step toward addressing the management of this waste stream. The information summarized in this chapter will be useful for setting a baseline for evaluating future solid waste management options and measuring the results of future programs. The solid waste sort completed at Johnson County disposal facilities during 2006 and 2007 provided the composition data described in this chapter. Olathe city staff, private landfill operators, and private area recyclers supplied Johnson County specific data used to estimate the quantity of MSW disposed and the quantity recovered through recycling and composting. In addition to the MSW stream, construction and demolition debris (C&D), and other non-MSW wastes are discussed. Per capita disposal rates are also shown for the Johnson County disposed wastes quantified in this chapter. MSW DISPOSAL The composition and quantity of MSW disposed reflects the MSW stream after recovery through recycling and composting has occurred. MSW includes durable goods15 (except vehicles and other mobile equipment), nondurable goods16, food waste, yard waste, and miscellaneous inorganic wastes. Examples of MSW wastes include appliances, tires, newspapers, disposable diapers, clothing, corrugated boxes, beverage containers, and grass clippings and leaves. Johnson County MSW Composition Engineering Solutions & Design, Inc. (ES&D) was retained by the Johnson County Environmental Department and the Mid-America Regional Council to perform a series of waste sorts at the Johnson County Landfill, Inc., the City of Olathe Transfer Station, and the APAC-Reno Construction and Demolition Debris Landfill. Two seasonal sorts were conducted – the first in October 2006 and the second in late March and April 2007. This section presents summary data contained in the waste sort report dated September 15, 2007. The executive summary to the waste sort final report is included in Appendix F of
15 Durable goods are defined as products having a lifetime of three or more years such as appliances,
furniture, carpets, tires, lead-acid batteries, luggage, electronics, etc. 16 Nondurable goods are defined as products having a lifetime of less than three years such as newspapers
and other paper products, plastic plates & cups, trash bags, disposable diapers, containers and packaging, etc.
Chapter 5 Waste Characterization
CLIENTS\JOCO\KC081858 01.03.08 3607.00.001.001
5-2
this document. Additional waste sort methodology and results can be reviewed in the full documents referenced at the end of this chapter. Only data on Johnson County disposed waste from the two MSW facilities (Johnson County Landfill, Inc. and the Olathe Transfer Station) are shown in this section. Randomly selected packer trucks and roll-off containers were sampled to estimate the percentage composition of MSW entering the facilities. A total of 132 loads were sampled at the Johnson County Landfill, Inc. and 44 loads were sampled at the Olathe Transfer Station. Of the total 176 sampled loads (132 + 44), 115 loads contained waste generated in Johnson County. The percentages shown in Table 5-1 represent the 115 Johnson County sampled loads only. Paper is the largest category for both residential and commercial MSW – over 36 percent and 51 percent respectively. Although the category “other paper” is the largest fraction of the residential paper category, newspapers, office papers, and corrugated paper (corrugated containers) are also significant fractions. An estimated 12.6 percent of the residential stream is composed of plastics (including plastic garbage bags). Residential food and yard waste are both estimated at about 16 percent. In the commercial sector, plastics and food are the next largest categories after paper at 15 percent and 20 percent, respectively. As expected, yard waste is a smaller component of the commercial sector (1.4 percent) than the residential sector (15.8 percent). Much of the waste being disposed at the MSW facilities, especially paper, represents recoverable products. At the point of disposal, other wastes have contaminated many of these products; however, recovery of these products prior to disposal would ensure clean, valuable materials. It should be noted that the results of the waste sort displayed in Table 5-1 reflect an analysis of, for the most part, bagged waste. In addition to bagged waste, other MSW products that are landfilled include bulky items (durable goods) such as furniture, mattresses, small appliances, carpet waste, etc. Bulky wastes were recorded for the waste sort, but because one large item would excessively skew the data, they were not included in the analysis and are not shown in Table 5-1. Although including these products in Table 5-1 would alter the percentages, the overall results for the materials listed would not change (i.e., there is a much higher percentage of paper, plastic, food waste and yard waste going to disposal).
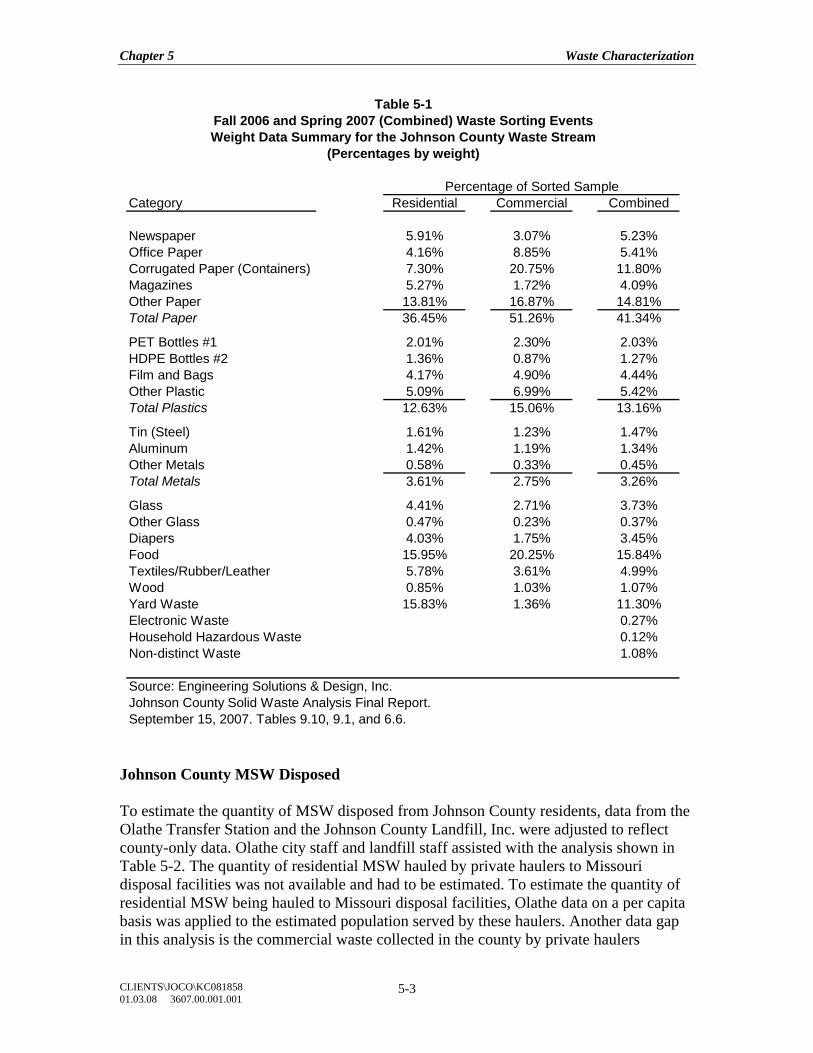
Chapter 5 Waste Characterization
CLIENTS\JOCO\KC081858 01.03.08 3607.00.001.001
5-3
Category Residential Commercial Combined
Newspaper 5.91% 3.07% 5.23%Office Paper 4.16% 8.85% 5.41%Corrugated Paper (Containers) 7.30% 20.75% 11.80%Magazines 5.27% 1.72% 4.09%Other Paper 13.81% 16.87% 14.81%Total Paper 36.45% 51.26% 41.34%
PET Bottles #1 2.01% 2.30% 2.03%HDPE Bottles #2 1.36% 0.87% 1.27%Film and Bags 4.17% 4.90% 4.44%Other Plastic 5.09% 6.99% 5.42%Total Plastics 12.63% 15.06% 13.16%
Tin (Steel) 1.61% 1.23% 1.47%Aluminum 1.42% 1.19% 1.34%Other Metals 0.58% 0.33% 0.45%Total Metals 3.61% 2.75% 3.26%
Glass 4.41% 2.71% 3.73%Other Glass 0.47% 0.23% 0.37%Diapers 4.03% 1.75% 3.45%Food 15.95% 20.25% 15.84%Textiles/Rubber/Leather 5.78% 3.61% 4.99%Wood 0.85% 1.03% 1.07%Yard Waste 15.83% 1.36% 11.30%Electronic Waste 0.27%Household Hazardous Waste 0.12%Non-distinct Waste 1.08%
Source: Engineering Solutions & Design, Inc. Johnson County Solid Waste Analysis Final Report. September 15, 2007. Tables 9.10, 9.1, and 6.6.
Percentage of Sorted Sample
Table 5-1Fall 2006 and Spring 2007 (Combined) Waste Sorting EventsWeight Data Summary for the Johnson County Waste Stream
(Percentages by weight)
Johnson County MSW Disposed To estimate the quantity of MSW disposed from Johnson County residents, data from the Olathe Transfer Station and the Johnson County Landfill, Inc. were adjusted to reflect county-only data. Olathe city staff and landfill staff assisted with the analysis shown in Table 5-2. The quantity of residential MSW hauled by private haulers to Missouri disposal facilities was not available and had to be estimated. To estimate the quantity of residential MSW being hauled to Missouri disposal facilities, Olathe data on a per capita basis was applied to the estimated population served by these haulers. Another data gap in this analysis is the commercial waste collected in the county by private haulers
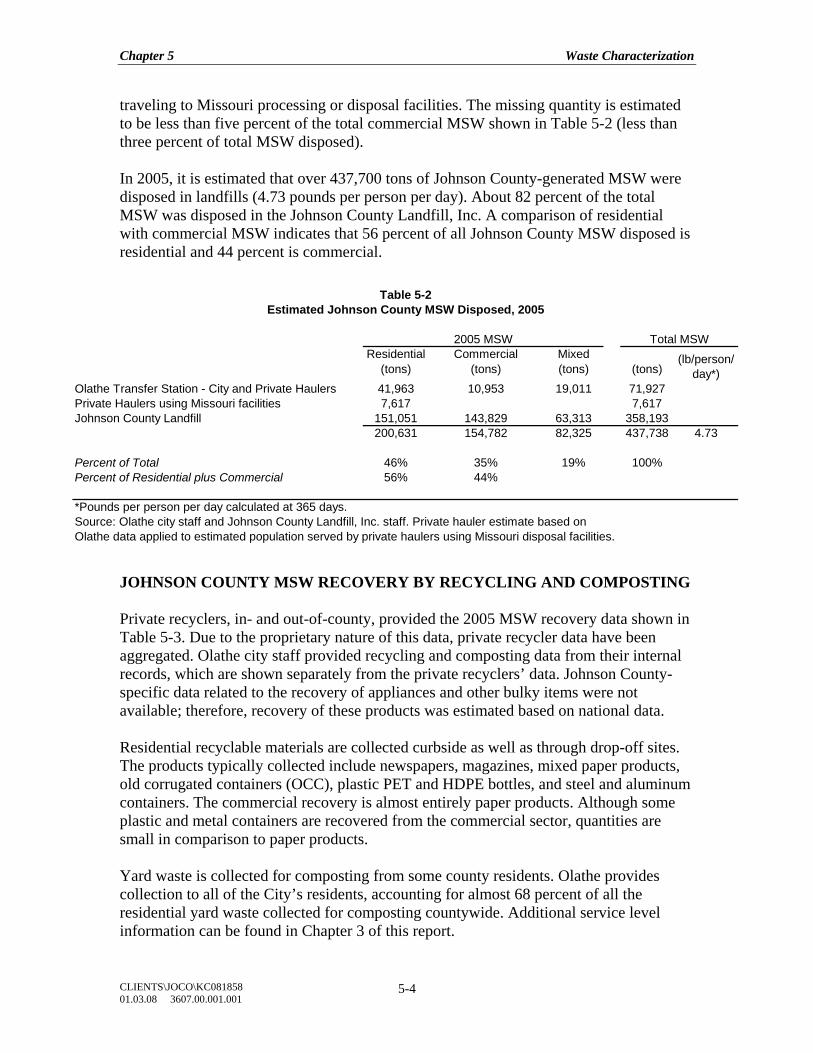
Chapter 5 Waste Characterization
CLIENTS\JOCO\KC081858 01.03.08 3607.00.001.001
5-4
traveling to Missouri processing or disposal facilities. The missing quantity is estimated to be less than five percent of the total commercial MSW shown in Table 5-2 (less than three percent of total MSW disposed). In 2005, it is estimated that over 437,700 tons of Johnson County-generated MSW were disposed in landfills (4.73 pounds per person per day). About 82 percent of the total MSW was disposed in the Johnson County Landfill, Inc. A comparison of residential with commercial MSW indicates that 56 percent of all Johnson County MSW disposed is residential and 44 percent is commercial. JOHNSON COUNTY MSW RECOVERY BY RECYCLING AND COMPOSTING Private recyclers, in- and out-of-county, provided the 2005 MSW recovery data shown in Table 5-3. Due to the proprietary nature of this data, private recycler data have been aggregated. Olathe city staff provided recycling and composting data from their internal records, which are shown separately from the private recyclers’ data. Johnson County-specific data related to the recovery of appliances and other bulky items were not available; therefore, recovery of these products was estimated based on national data. Residential recyclable materials are collected curbside as well as through drop-off sites. The products typically collected include newspapers, magazines, mixed paper products, old corrugated containers (OCC), plastic PET and HDPE bottles, and steel and aluminum containers. The commercial recovery is almost entirely paper products. Although some plastic and metal containers are recovered from the commercial sector, quantities are small in comparison to paper products. Yard waste is collected for composting from some county residents. Olathe provides collection to all of the City’s residents, accounting for almost 68 percent of all the residential yard waste collected for composting countywide. Additional service level information can be found in Chapter 3 of this report.
Residential Commercial Mixed(tons) (tons) (tons) (tons)
Olathe Transfer Station - City and Private Haulers 41,963 10,953 19,011 71,927Private Haulers using Missouri facilities 7,617 7,617Johnson County Landfill 151,051 143,829 63,313 358,193
200,631 154,782 82,325 437,738 4.73
Percent of Total 46% 35% 19% 100%Percent of Residential plus Commercial 56% 44%
*Pounds per person per day calculated at 365 days.Source: Olathe city staff and Johnson County Landfill, Inc. staff. Private hauler estimate based on Olathe data applied to estimated population served by private haulers using Missouri disposal facilities.
Total MSW
Table 5-2Estimated Johnson County MSW Disposed, 2005
2005 MSW
(lb/person/day*)
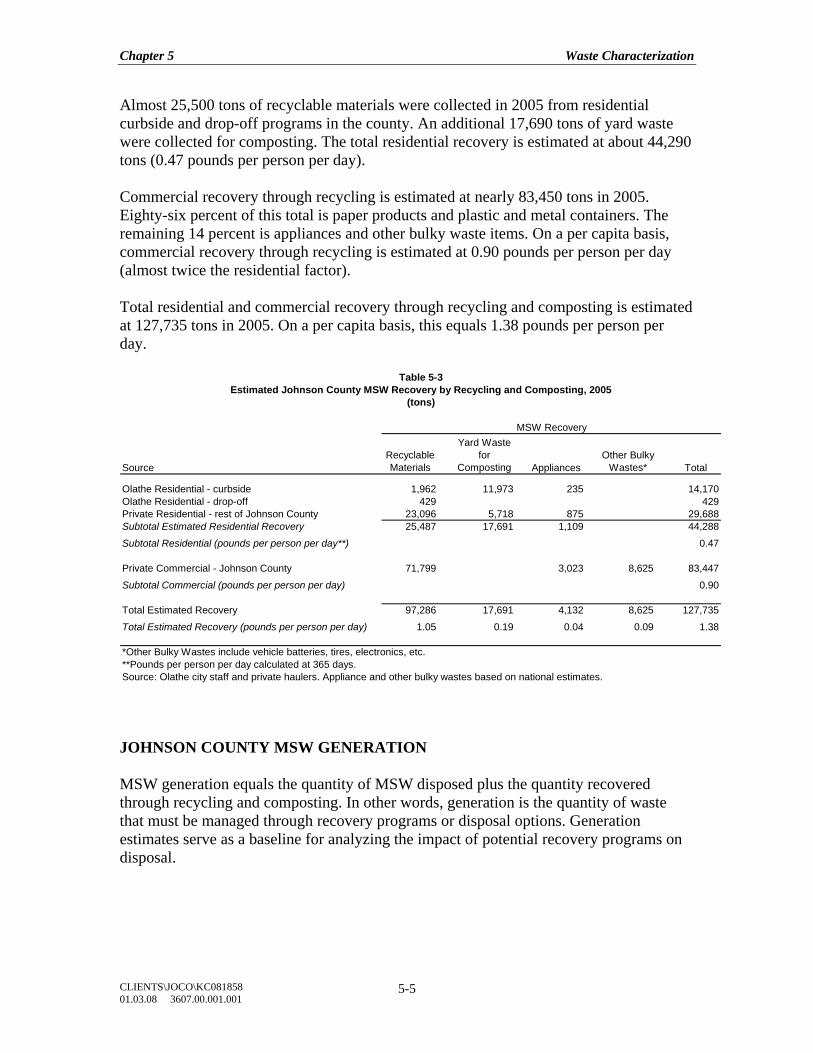
Chapter 5 Waste Characterization
CLIENTS\JOCO\KC081858 01.03.08 3607.00.001.001
5-5
Almost 25,500 tons of recyclable materials were collected in 2005 from residential curbside and drop-off programs in the county. An additional 17,690 tons of yard waste were collected for composting. The total residential recovery is estimated at about 44,290 tons (0.47 pounds per person per day). Commercial recovery through recycling is estimated at nearly 83,450 tons in 2005. Eighty-six percent of this total is paper products and plastic and metal containers. The remaining 14 percent is appliances and other bulky waste items. On a per capita basis, commercial recovery through recycling is estimated at 0.90 pounds per person per day (almost twice the residential factor). Total residential and commercial recovery through recycling and composting is estimated at 127,735 tons in 2005. On a per capita basis, this equals 1.38 pounds per person per day. JOHNSON COUNTY MSW GENERATION MSW generation equals the quantity of MSW disposed plus the quantity recovered through recycling and composting. In other words, generation is the quantity of waste that must be managed through recovery programs or disposal options. Generation estimates serve as a baseline for analyzing the impact of potential recovery programs on disposal.
SourceRecyclable Materials
Yard Waste for
Composting AppliancesOther Bulky
Wastes* Total
Olathe Residential - curbside 1,962 11,973 235 14,170Olathe Residential - drop-off 429 429Private Residential - rest of Johnson County 23,096 5,718 875 29,688Subtotal Estimated Residential Recovery 25,487 17,691 1,109 44,288
Subtotal Residential (pounds per person per day**) 0.47
Private Commercial - Johnson County 71,799 3,023 8,625 83,447
Subtotal Commercial (pounds per person per day) 0.90
Total Estimated Recovery 97,286 17,691 4,132 8,625 127,735
Total Estimated Recovery (pounds per person per day) 1.05 0.19 0.04 0.09 1.38
*Other Bulky Wastes include vehicle batteries, tires, electronics, etc.**Pounds per person per day calculated at 365 days.Source: Olathe city staff and private haulers. Appliance and other bulky wastes based on national estimates.
MSW Recovery
Table 5-3Estimated Johnson County MSW Recovery by Recycling and Composting, 2005
(tons)
Chapter 5 Waste Characterization
CLIENTS\JOCO\KC081858 01.03.08 3607.00.001.001
5-6
Disposal and recovery factors were developed from the data shown in Tables 5-2 and 5-3 and used to develop the generation factor (disposal plus recovery equals generation). The residential generation factor (3.15 pounds per person per day shown on the bottom of Tables 5-4 equals 2.67 pounds per person per day disposal plus 0.479 pounds per person per day recovery) was then applied to 2005 city populations. The estimated commercial generation, which could not be distributed by population, is shown as a total for the county. Johnson County generated an estimated 565,500 tons of MSW (6.12 pounds per person per day) in 2005. Fifty-two percent came from the residential sector and 48 percent from the commercial sector. Residential, commercial, and total generations shown in Table 5-4 are used as baselines for the MSW projections in Chapter 6 of this document. JOHNSON COUNTY CONSTRUCTION AND DEMOLITION DEBRIS DISPOSAL Construction and demolition debris (C&D) is generated from the construction, renovation, and demolition of buildings and other structures, roads and bridges, and site conversions. Johnson County C&D Composition The C&D composition data presented here are from the ES&D two-season Johnson County waste sort. The waste sort was conducted at the APAC-Reno Construction and Demolition Landfill. This section describes summary data as presented in the final 2007 waste sort report. Additional C&D waste sort methodology and results can be reviewed in the full documents referenced at the end of this chapter. The waste sort study reported that the C&D loads delivered to the site were relatively clean with little contamination. During the sort, the landfill controlled the disposal of unacceptable waste by using two spotters that inspected every load. The waste sort at the C&D landfill was a visual inspection, which differed from the picking and weighing sorts conducted at the MSW facilities. The percentages shown in Table 5-5 are based on visual inspections, not weight of materials. In other words, the percentage is the number of C&D loads in which an item was observed as a percent of total loads. The item most frequently observed was scrap lumber (93 percent of the loads). Other items observed in 40 percent or more of the loads included metals, corrugated containers, wood pallets, and drywall.
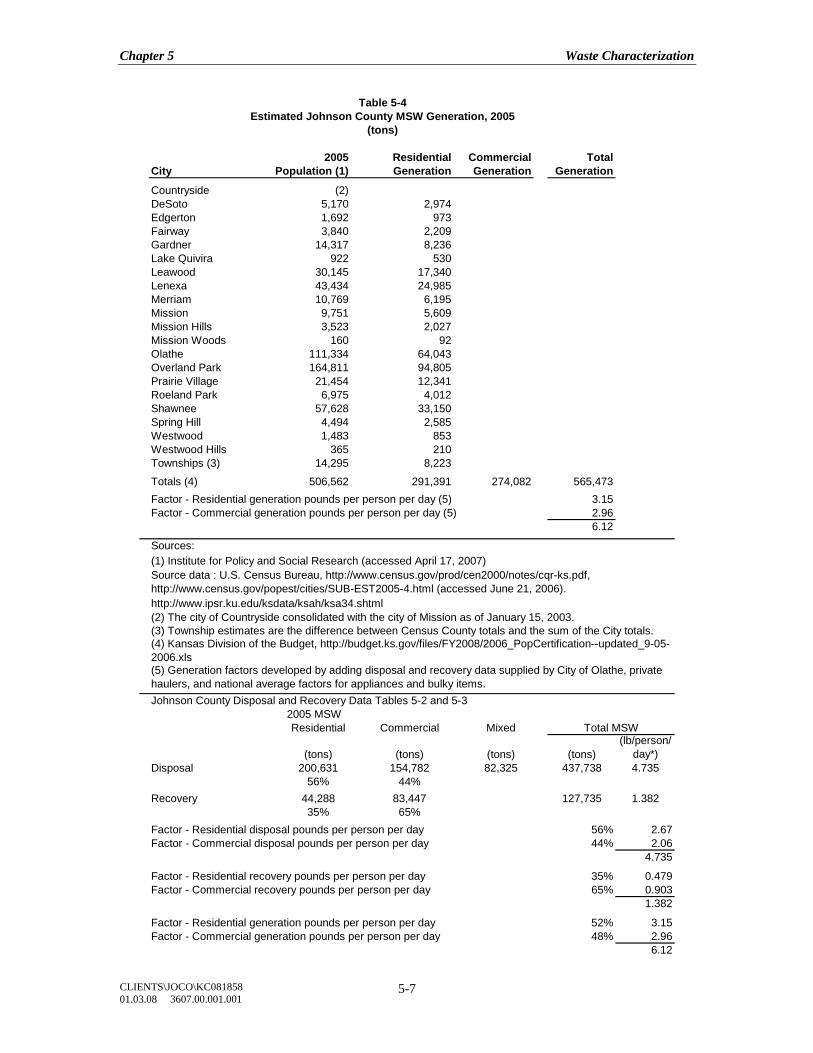
Chapter 5 Waste Characterization
CLIENTS\JOCO\KC081858 01.03.08 3607.00.001.001
5-7
2005 Residential Commercial TotalCity Population (1) Generation Generation Generation
Countryside (2)DeSoto 5,170 2,974Edgerton 1,692 973Fairway 3,840 2,209Gardner 14,317 8,236Lake Quivira 922 530Leawood 30,145 17,340Lenexa 43,434 24,985Merriam 10,769 6,195Mission 9,751 5,609Mission Hills 3,523 2,027Mission Woods 160 92Olathe 111,334 64,043Overland Park 164,811 94,805Prairie Village 21,454 12,341Roeland Park 6,975 4,012Shawnee 57,628 33,150Spring Hill 4,494 2,585Westwood 1,483 853Westwood Hills 365 210Townships (3) 14,295 8,223
Totals (4) 506,562 291,391 274,082 565,473Factor - Residential generation pounds per person per day (5) 3.15Factor - Commercial generation pounds per person per day (5) 2.96
6.12
Sources: (1) Institute for Policy and Social Research (accessed April 17, 2007)
http://www.ipsr.ku.edu/ksdata/ksah/ksa34.shtml(2) The city of Countryside consolidated with the city of Mission as of January 15, 2003.(3) Township estimates are the difference between Census County totals and the sum of the City totals.
Johnson County Disposal and Recovery Data Tables 5-2 and 5-32005 MSWResidential Commercial Mixed
(tons) (tons) (tons) (tons)(lb/person/
day*)Disposal 200,631 154,782 82,325 437,738 4.735
56% 44%Recovery 44,288 83,447 127,735 1.382
35% 65%Factor - Residential disposal pounds per person per day 56% 2.67Factor - Commercial disposal pounds per person per day 44% 2.06
4.735
Factor - Residential recovery pounds per person per day 35% 0.479Factor - Commercial recovery pounds per person per day 65% 0.903
1.382
Factor - Residential generation pounds per person per day 52% 3.15Factor - Commercial generation pounds per person per day 48% 2.96
6.12
Total MSW
Source data : U.S. Census Bureau, http://www.census.gov/prod/cen2000/notes/cqr-ks.pdf, http://www.census.gov/popest/cities/SUB-EST2005-4.html (accessed June 21, 2006).
(5) Generation factors developed by adding disposal and recovery data supplied by City of Olathe, private haulers, and national average factors for appliances and bulky items.
Table 5-4Estimated Johnson County MSW Generation, 2005
(tons)
(4) Kansas Division of the Budget, http://budget.ks.gov/files/FY2008/2006_PopCertification--updated_9-05-2006.xls
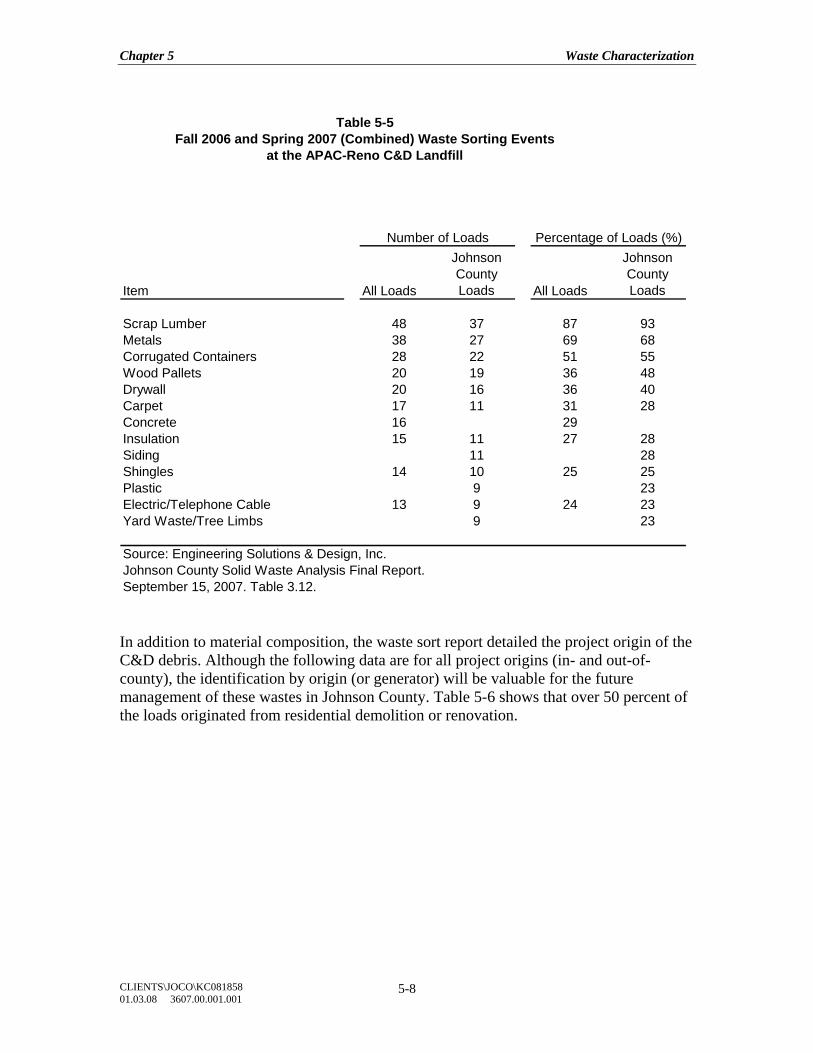
Chapter 5 Waste Characterization
CLIENTS\JOCO\KC081858 01.03.08 3607.00.001.001
5-8
Item All Loads
Johnson County Loads All Loads
Johnson County Loads
Scrap Lumber 48 37 87 93Metals 38 27 69 68Corrugated Containers 28 22 51 55Wood Pallets 20 19 36 48Drywall 20 16 36 40Carpet 17 11 31 28Concrete 16 29Insulation 15 11 27 28Siding 11 28Shingles 14 10 25 25Plastic 9 23Electric/Telephone Cable 13 9 24 23Yard Waste/Tree Limbs 9 23
Source: Engineering Solutions & Design, Inc. Johnson County Solid Waste Analysis Final Report.September 15, 2007. Table 3.12.
Number of Loads Percentage of Loads (%)
Table 5-5Fall 2006 and Spring 2007 (Combined) Waste Sorting Events
at the APAC-Reno C&D Landfill
In addition to material composition, the waste sort report detailed the project origin of the C&D debris. Although the following data are for all project origins (in- and out-of-county), the identification by origin (or generator) will be valuable for the future management of these wastes in Johnson County. Table 5-6 shows that over 50 percent of the loads originated from residential demolition or renovation.
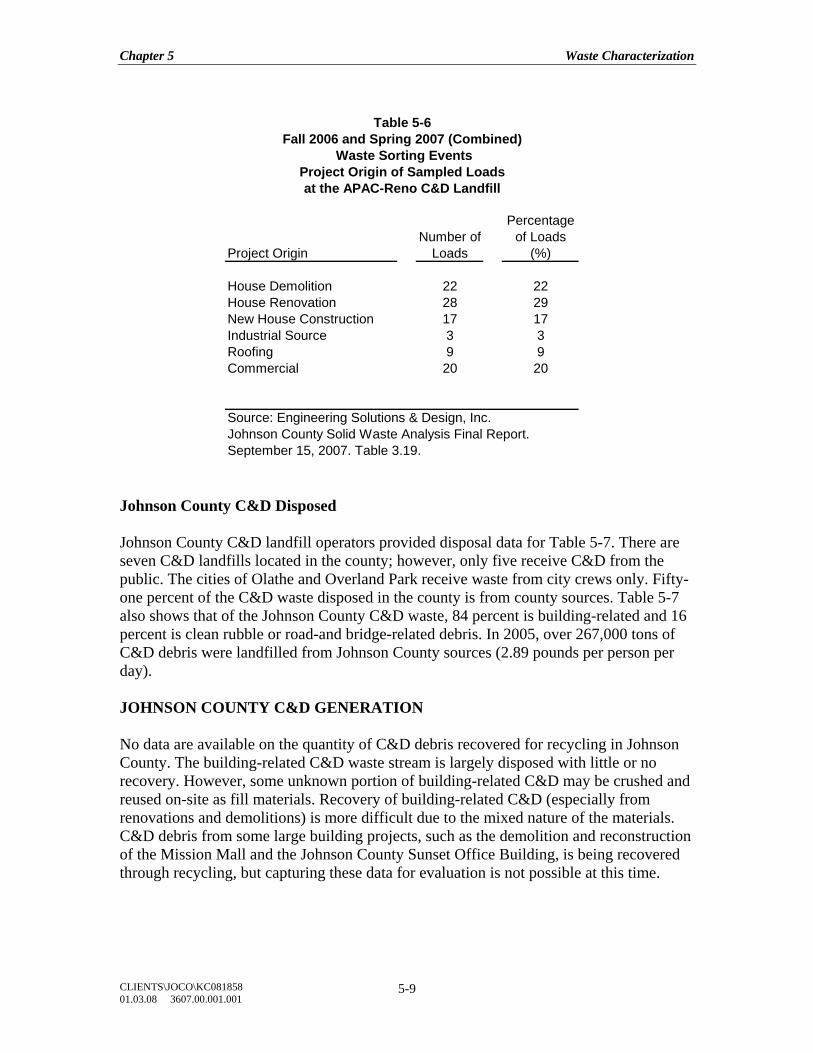
Chapter 5 Waste Characterization
CLIENTS\JOCO\KC081858 01.03.08 3607.00.001.001
5-9
Project Origin
House Demolition 22 22House Renovation 28 29New House Construction 17 17Industrial Source 3 3Roofing 9 9Commercial 20 20
Source: Engineering Solutions & Design, Inc. Johnson County Solid Waste Analysis Final Report.September 15, 2007. Table 3.19.
Number of Loads
Percentage of Loads
(%)
Table 5-6Fall 2006 and Spring 2007 (Combined)
Project Origin of Sampled Loadsat the APAC-Reno C&D Landfill
Waste Sorting Events
Johnson County C&D Disposed Johnson County C&D landfill operators provided disposal data for Table 5-7. There are seven C&D landfills located in the county; however, only five receive C&D from the public. The cities of Olathe and Overland Park receive waste from city crews only. Fifty-one percent of the C&D waste disposed in the county is from county sources. Table 5-7 also shows that of the Johnson County C&D waste, 84 percent is building-related and 16 percent is clean rubble or road-and bridge-related debris. In 2005, over 267,000 tons of C&D debris were landfilled from Johnson County sources (2.89 pounds per person per day). JOHNSON COUNTY C&D GENERATION No data are available on the quantity of C&D debris recovered for recycling in Johnson County. The building-related C&D waste stream is largely disposed with little or no recovery. However, some unknown portion of building-related C&D may be crushed and reused on-site as fill materials. Recovery of building-related C&D (especially from renovations and demolitions) is more difficult due to the mixed nature of the materials. C&D debris from some large building projects, such as the demolition and reconstruction of the Mission Mall and the Johnson County Sunset Office Building, is being recovered through recycling, but capturing these data for evaluation is not possible at this time.
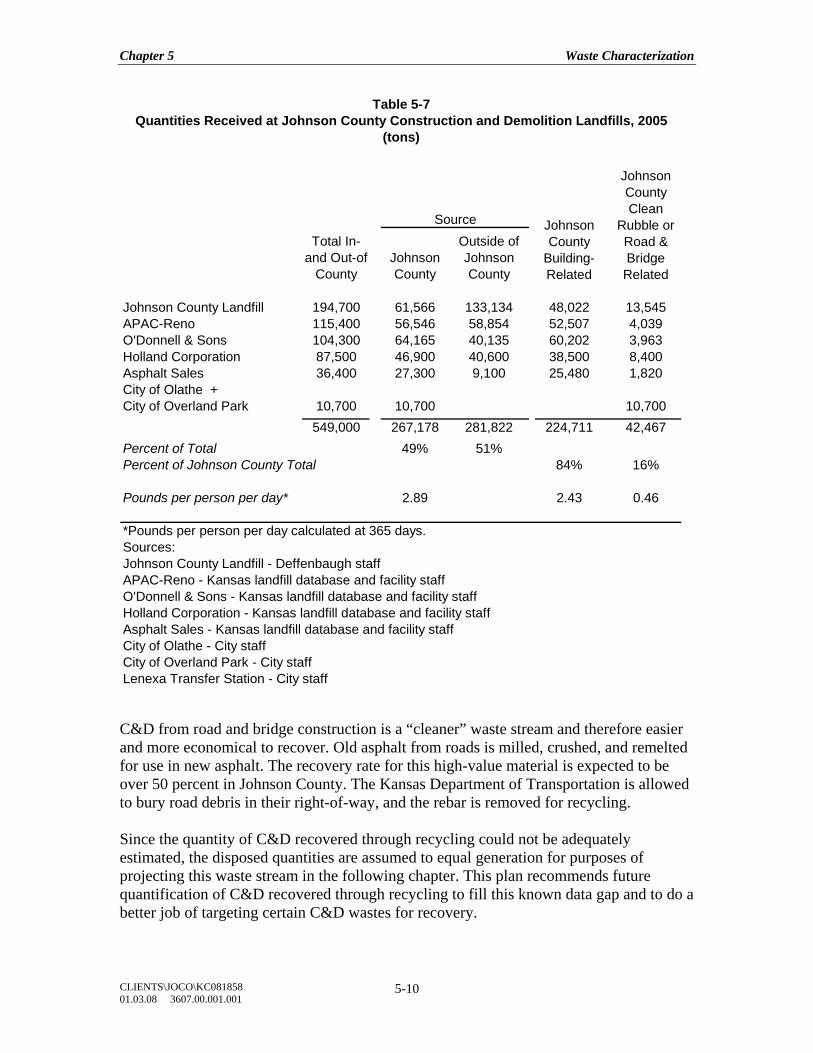
Chapter 5 Waste Characterization
CLIENTS\JOCO\KC081858 01.03.08 3607.00.001.001
5-10
C&D from road and bridge construction is a “cleaner” waste stream and therefore easier and more economical to recover. Old asphalt from roads is milled, crushed, and remelted for use in new asphalt. The recovery rate for this high-value material is expected to be over 50 percent in Johnson County. The Kansas Department of Transportation is allowed to bury road debris in their right-of-way, and the rebar is removed for recycling. Since the quantity of C&D recovered through recycling could not be adequately estimated, the disposed quantities are assumed to equal generation for purposes of projecting this waste stream in the following chapter. This plan recommends future quantification of C&D recovered through recycling to fill this known data gap and to do a better job of targeting certain C&D wastes for recovery.
Total In- and Out-of-
CountyJohnson County
Outside of Johnson County
Johnson County Landfill 194,700 61,566 133,134 48,022 13,545APAC-Reno 115,400 56,546 58,854 52,507 4,039O'Donnell & Sons 104,300 64,165 40,135 60,202 3,963Holland Corporation 87,500 46,900 40,600 38,500 8,400Asphalt Sales 36,400 27,300 9,100 25,480 1,820City of Olathe +City of Overland Park 10,700 10,700 10,700
549,000 267,178 281,822 224,711 42,467Percent of Total 49% 51%Percent of Johnson County Total 84% 16%
Pounds per person per day* 2.89 2.43 0.46
*Pounds per person per day calculated at 365 days.Sources:Johnson County Landfill - Deffenbaugh staffAPAC-Reno - Kansas landfill database and facility staffO'Donnell & Sons - Kansas landfill database and facility staffHolland Corporation - Kansas landfill database and facility staffAsphalt Sales - Kansas landfill database and facility staffCity of Olathe - City staffCity of Overland Park - City staffLenexa Transfer Station - City staff
Table 5-7Quantities Received at Johnson County Construction and Demolition Landfills, 2005
(tons)
Source
Johnson County Clean
Rubble or Road & Bridge Related
Johnson County
Building-Related
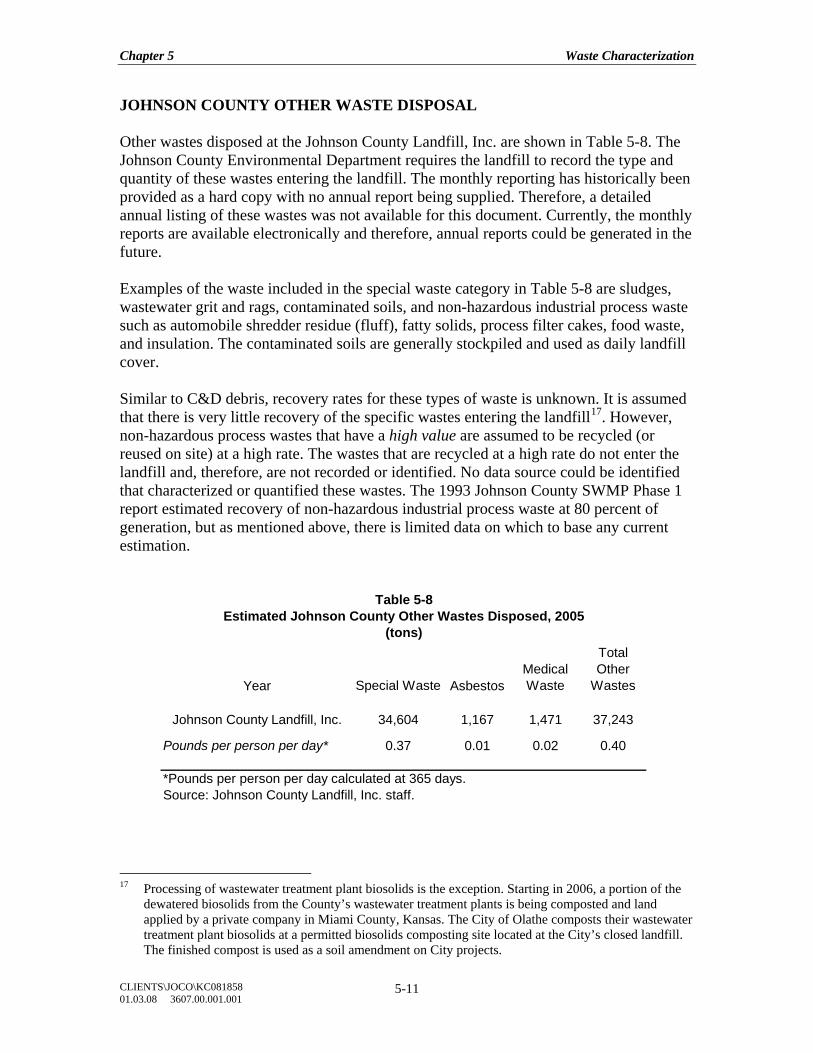
Chapter 5 Waste Characterization
CLIENTS\JOCO\KC081858 01.03.08 3607.00.001.001
5-11
JOHNSON COUNTY OTHER WASTE DISPOSAL Other wastes disposed at the Johnson County Landfill, Inc. are shown in Table 5-8. The Johnson County Environmental Department requires the landfill to record the type and quantity of these wastes entering the landfill. The monthly reporting has historically been provided as a hard copy with no annual report being supplied. Therefore, a detailed annual listing of these wastes was not available for this document. Currently, the monthly reports are available electronically and therefore, annual reports could be generated in the future. Examples of the waste included in the special waste category in Table 5-8 are sludges, wastewater grit and rags, contaminated soils, and non-hazardous industrial process waste such as automobile shredder residue (fluff), fatty solids, process filter cakes, food waste, and insulation. The contaminated soils are generally stockpiled and used as daily landfill cover. Similar to C&D debris, recovery rates for these types of waste is unknown. It is assumed that there is very little recovery of the specific wastes entering the landfill17. However, non-hazardous process wastes that have a high value are assumed to be recycled (or reused on site) at a high rate. The wastes that are recycled at a high rate do not enter the landfill and, therefore, are not recorded or identified. No data source could be identified that characterized or quantified these wastes. The 1993 Johnson County SWMP Phase 1 report estimated recovery of non-hazardous industrial process waste at 80 percent of generation, but as mentioned above, there is limited data on which to base any current estimation.
Year Special Waste AsbestosMedical Waste
Total Other
Wastes
Johnson County Landfill, Inc. 34,604 1,167 1,471 37,243
Pounds per person per day* 0.37 0.01 0.02 0.40
*Pounds per person per day calculated at 365 days.Source: Johnson County Landfill, Inc. staff.
Table 5-8Estimated Johnson County Other Wastes Disposed, 2005
(tons)
17 Processing of wastewater treatment plant biosolids is the exception. Starting in 2006, a portion of the
dewatered biosolids from the County’s wastewater treatment plants is being composted and land applied by a private company in Miami County, Kansas. The City of Olathe composts their wastewater treatment plant biosolids at a permitted biosolids composting site located at the City’s closed landfill. The finished compost is used as a soil amendment on City projects.
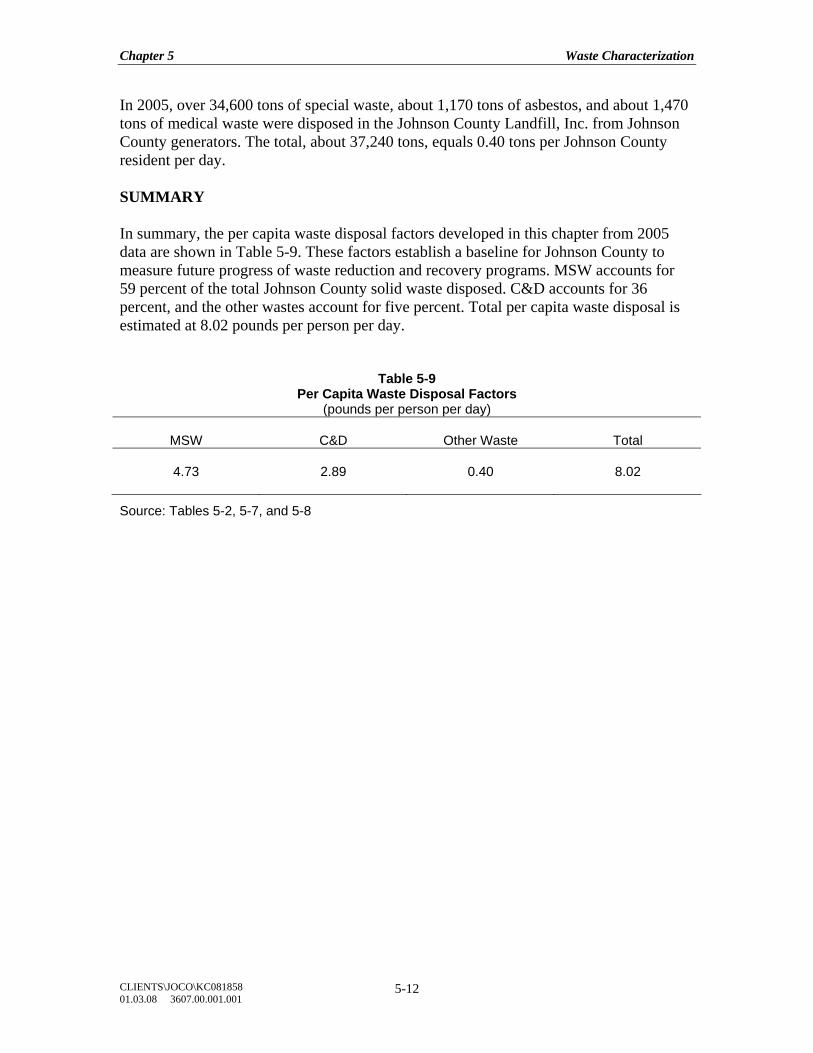
Chapter 5 Waste Characterization
CLIENTS\JOCO\KC081858 01.03.08 3607.00.001.001
5-12
In 2005, over 34,600 tons of special waste, about 1,170 tons of asbestos, and about 1,470 tons of medical waste were disposed in the Johnson County Landfill, Inc. from Johnson County generators. The total, about 37,240 tons, equals 0.40 tons per Johnson County resident per day. SUMMARY In summary, the per capita waste disposal factors developed in this chapter from 2005 data are shown in Table 5-9. These factors establish a baseline for Johnson County to measure future progress of waste reduction and recovery programs. MSW accounts for 59 percent of the total Johnson County solid waste disposed. C&D accounts for 36 percent, and the other wastes account for five percent. Total per capita waste disposal is estimated at 8.02 pounds per person per day.
Table 5-9 Per Capita Waste Disposal Factors
(pounds per person per day)
MSW C&D Other Waste Total
4.73 2.89 0.40 8.02
Source: Tables 5-2, 5-7, and 5-8
Chapter 5 Waste Characterization
CLIENTS\JOCO\KC081858 01.03.08 3607.00.001.001
5-13
CHAPTER 5 REFERENCES
Engineering Solutions & Design, Inc. “Johnson County Solid Waste Analysis Series One Interim Report”. November 30, 2006. http://jced.jocogov.org Engineering Solutions & Design, Inc. “Johnson County Solid Waste Analysis Series Two Interim Report”. May 24, 2007. http://jced.jocogov.org Engineering Solutions & Design, Inc. “Johnson County Solid Waste Analysis Final Report”. September 15, 2007. http://jced.jocogov.org Institute for Policy and Social Research. http://www.ipsr.ku.edu/ksdata/ksah/ksa34.shtml Johnson County Environmental Department. “Solid Waste Management Plan Revision, Phase I Review and Evaluation Final Report”. February 1993. Kansas Division of the Budget. http://budget.ks.gov/files/FY2008/2006_PopCertification--updated_9-05-2006.xls Personal contact with city staff from Olathe, Overland Park, and Lenexa. Personal contact with staff from the Johnson County Landfill, Inc., the C&D landfills, and private recyclers. U.S. Environmental Protection Agency. “Municipal Solid Waste Generation, Recycling, and Disposal in the United States: 2005 Facts and Figures.” http://www.epa.gov/epaoswer/non-hw/muncpl/msw99.htm
Chapter 5 Waste Characterization
CLIENTS\JOCO\KC081858 01.03.08 3607.00.001.001
5-14
THIS PAGE LEFT BLANK INTENTIONALLY
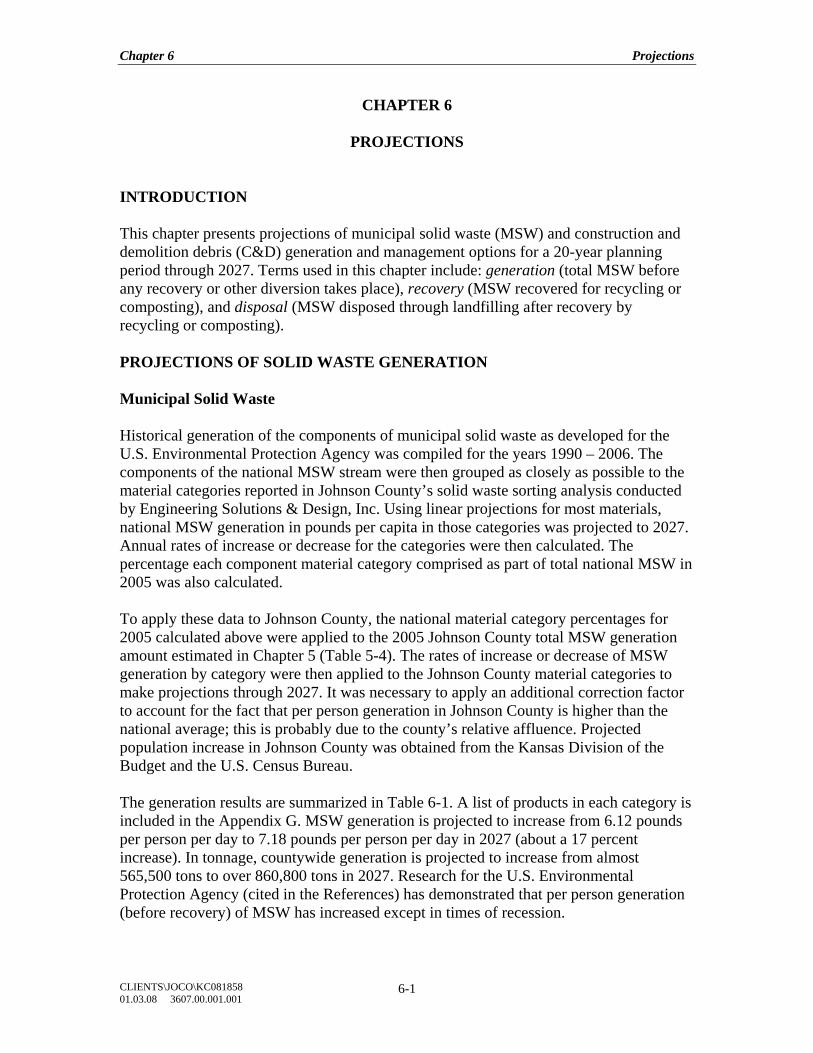
Chapter 6 Projections
CLIENTS\JOCO\KC081858 01.03.08 3607.00.001.001
6-1
CHAPTER 6
PROJECTIONS INTRODUCTION This chapter presents projections of municipal solid waste (MSW) and construction and demolition debris (C&D) generation and management options for a 20-year planning period through 2027. Terms used in this chapter include: generation (total MSW before any recovery or other diversion takes place), recovery (MSW recovered for recycling or composting), and disposal (MSW disposed through landfilling after recovery by recycling or composting). PROJECTIONS OF SOLID WASTE GENERATION Municipal Solid Waste Historical generation of the components of municipal solid waste as developed for the U.S. Environmental Protection Agency was compiled for the years 1990 – 2006. The components of the national MSW stream were then grouped as closely as possible to the material categories reported in Johnson County’s solid waste sorting analysis conducted by Engineering Solutions & Design, Inc. Using linear projections for most materials, national MSW generation in pounds per capita in those categories was projected to 2027. Annual rates of increase or decrease for the categories were then calculated. The percentage each component material category comprised as part of total national MSW in 2005 was also calculated. To apply these data to Johnson County, the national material category percentages for 2005 calculated above were applied to the 2005 Johnson County total MSW generation amount estimated in Chapter 5 (Table 5-4). The rates of increase or decrease of MSW generation by category were then applied to the Johnson County material categories to make projections through 2027. It was necessary to apply an additional correction factor to account for the fact that per person generation in Johnson County is higher than the national average; this is probably due to the county’s relative affluence. Projected population increase in Johnson County was obtained from the Kansas Division of the Budget and the U.S. Census Bureau. The generation results are summarized in Table 6-1. A list of products in each category is included in the Appendix G. MSW generation is projected to increase from 6.12 pounds per person per day to 7.18 pounds per person per day in 2027 (about a 17 percent increase). In tonnage, countywide generation is projected to increase from almost 565,500 tons to over 860,800 tons in 2027. Research for the U.S. Environmental Protection Agency (cited in the References) has demonstrated that per person generation (before recovery) of MSW has increased except in times of recession.
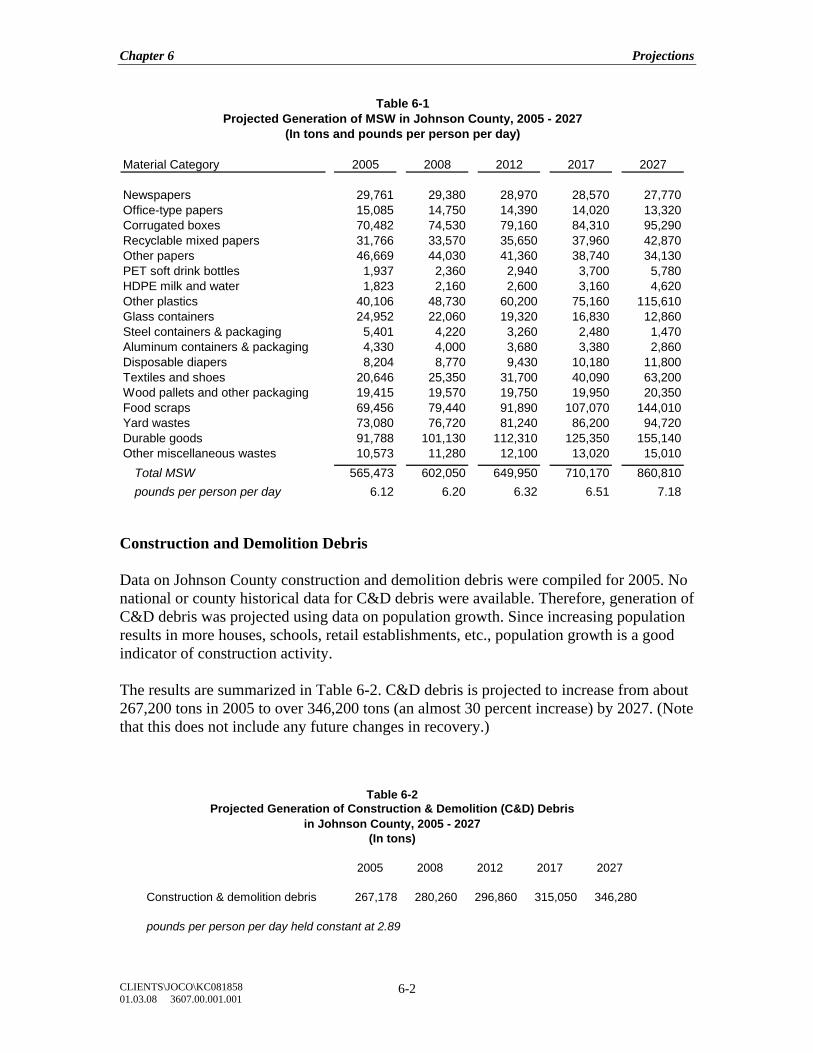
Chapter 6 Projections
CLIENTS\JOCO\KC081858 01.03.08 3607.00.001.001
6-2
Material Category 2005 2008 2012 2017 2027
Newspapers 29,761 29,380 28,970 28,570 27,770Office-type papers 15,085 14,750 14,390 14,020 13,320Corrugated boxes 70,482 74,530 79,160 84,310 95,290Recyclable mixed papers 31,766 33,570 35,650 37,960 42,870Other papers 46,669 44,030 41,360 38,740 34,130PET soft drink bottles 1,937 2,360 2,940 3,700 5,780HDPE milk and water 1,823 2,160 2,600 3,160 4,620Other plastics 40,106 48,730 60,200 75,160 115,610Glass containers 24,952 22,060 19,320 16,830 12,860Steel containers & packaging 5,401 4,220 3,260 2,480 1,470Aluminum containers & packaging 4,330 4,000 3,680 3,380 2,860Disposable diapers 8,204 8,770 9,430 10,180 11,800Textiles and shoes 20,646 25,350 31,700 40,090 63,200Wood pallets and other packaging 19,415 19,570 19,750 19,950 20,350Food scraps 69,456 79,440 91,890 107,070 144,010Yard wastes 73,080 76,720 81,240 86,200 94,720Durable goods 91,788 101,130 112,310 125,350 155,140Other miscellaneous wastes 10,573 11,280 12,100 13,020 15,010
Total MSW 565,473 602,050 649,950 710,170 860,810pounds per person per day 6.12 6.20 6.32 6.51 7.18
Table 6-1
(In tons and pounds per person per day)Projected Generation of MSW in Johnson County, 2005 - 2027
Construction and Demolition Debris Data on Johnson County construction and demolition debris were compiled for 2005. No national or county historical data for C&D debris were available. Therefore, generation of C&D debris was projected using data on population growth. Since increasing population results in more houses, schools, retail establishments, etc., population growth is a good indicator of construction activity. The results are summarized in Table 6-2. C&D debris is projected to increase from about 267,200 tons in 2005 to over 346,200 tons (an almost 30 percent increase) by 2027. (Note that this does not include any future changes in recovery.)
2005 2008 2012 2017 2027
Construction & demolition debris 267,178 280,260 296,860 315,050 346,280
pounds per person per day held constant at 2.89
Table 6-2Projected Generation of Construction & Demolition (C&D) Debris
in Johnson County, 2005 - 2027(In tons)
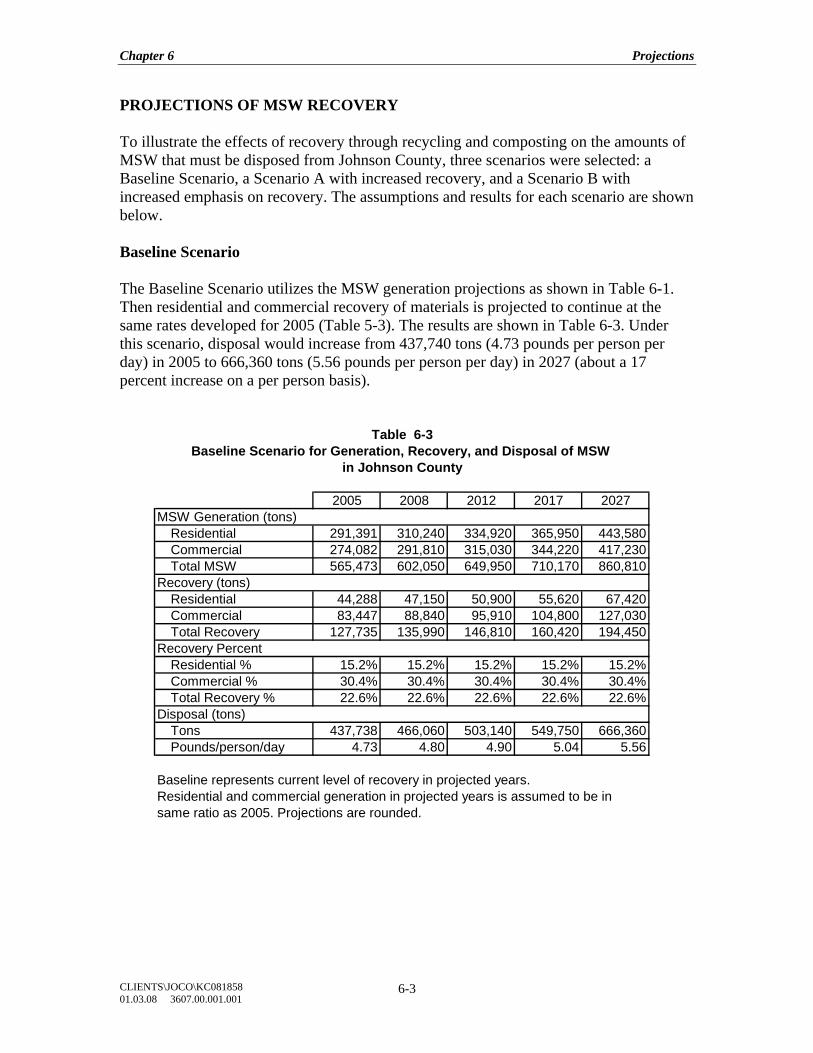
Chapter 6 Projections
CLIENTS\JOCO\KC081858 01.03.08 3607.00.001.001
6-3
PROJECTIONS OF MSW RECOVERY To illustrate the effects of recovery through recycling and composting on the amounts of MSW that must be disposed from Johnson County, three scenarios were selected: a Baseline Scenario, a Scenario A with increased recovery, and a Scenario B with increased emphasis on recovery. The assumptions and results for each scenario are shown below. Baseline Scenario The Baseline Scenario utilizes the MSW generation projections as shown in Table 6-1. Then residential and commercial recovery of materials is projected to continue at the same rates developed for 2005 (Table 5-3). The results are shown in Table 6-3. Under this scenario, disposal would increase from 437,740 tons (4.73 pounds per person per day) in 2005 to 666,360 tons (5.56 pounds per person per day) in 2027 (about a 17 percent increase on a per person basis).
2005 2008 2012 2017 2027MSW Generation (tons)
Residential 291,391 310,240 334,920 365,950 443,580Commercial 274,082 291,810 315,030 344,220 417,230Total MSW 565,473 602,050 649,950 710,170 860,810
Recovery (tons)Residential 44,288 47,150 50,900 55,620 67,420Commercial 83,447 88,840 95,910 104,800 127,030Total Recovery 127,735 135,990 146,810 160,420 194,450
Recovery PercentResidential % 15.2% 15.2% 15.2% 15.2% 15.2%Commercial % 30.4% 30.4% 30.4% 30.4% 30.4%Total Recovery % 22.6% 22.6% 22.6% 22.6% 22.6%
Disposal (tons)Tons 437,738 466,060 503,140 549,750 666,360Pounds/person/day 4.73 4.80 4.90 5.04 5.56
Baseline represents current level of recovery in projected years.Residential and commercial generation in projected years is assumed to be insame ratio as 2005. Projections are rounded.
Table 6-3Baseline Scenario for Generation, Recovery, and Disposal of MSW
in Johnson County
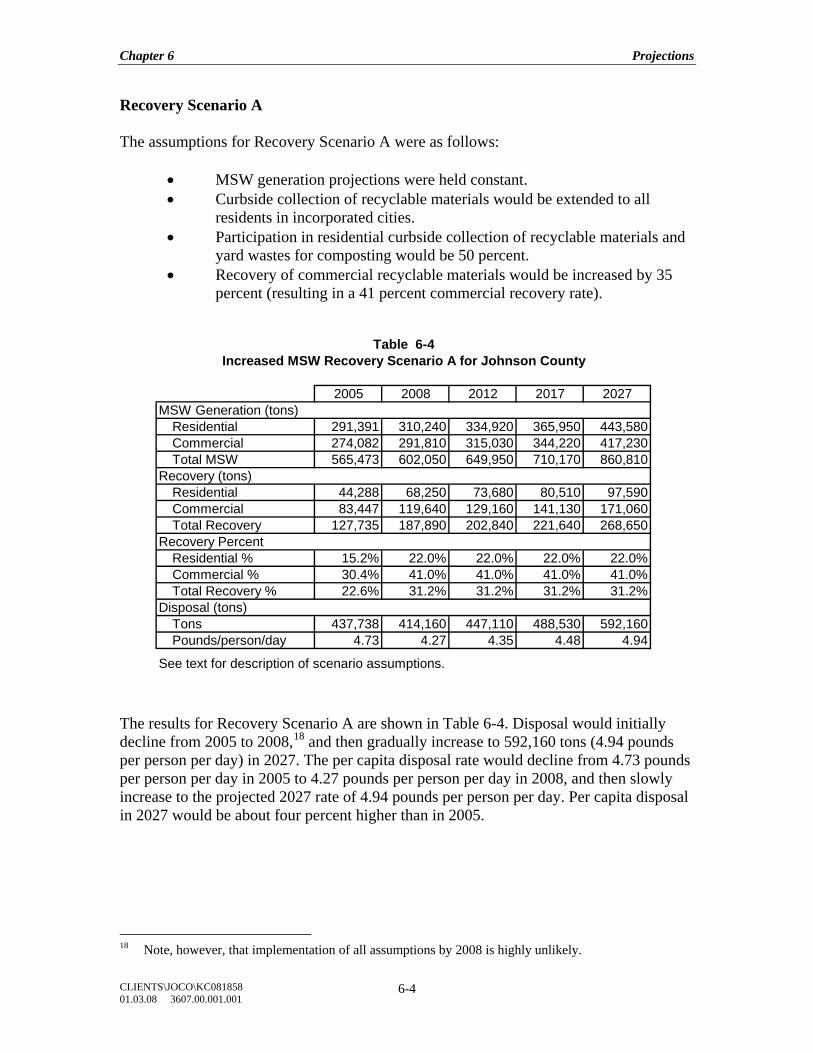
Chapter 6 Projections
CLIENTS\JOCO\KC081858 01.03.08 3607.00.001.001
6-4
Recovery Scenario A The assumptions for Recovery Scenario A were as follows:
• MSW generation projections were held constant. • Curbside collection of recyclable materials would be extended to all
residents in incorporated cities. • Participation in residential curbside collection of recyclable materials and
yard wastes for composting would be 50 percent. • Recovery of commercial recyclable materials would be increased by 35
percent (resulting in a 41 percent commercial recovery rate).
2005 2008 2012 2017 2027MSW Generation (tons)
Residential 291,391 310,240 334,920 365,950 443,580Commercial 274,082 291,810 315,030 344,220 417,230Total MSW 565,473 602,050 649,950 710,170 860,810
Recovery (tons)Residential 44,288 68,250 73,680 80,510 97,590Commercial 83,447 119,640 129,160 141,130 171,060Total Recovery 127,735 187,890 202,840 221,640 268,650
Recovery PercentResidential % 15.2% 22.0% 22.0% 22.0% 22.0%Commercial % 30.4% 41.0% 41.0% 41.0% 41.0%Total Recovery % 22.6% 31.2% 31.2% 31.2% 31.2%
Disposal (tons)Tons 437,738 414,160 447,110 488,530 592,160Pounds/person/day 4.73 4.27 4.35 4.48 4.94
See text for description of scenario assumptions.
Table 6-4Increased MSW Recovery Scenario A for Johnson County
The results for Recovery Scenario A are shown in Table 6-4. Disposal would initially decline from 2005 to 2008,18 and then gradually increase to 592,160 tons (4.94 pounds per person per day) in 2027. The per capita disposal rate would decline from 4.73 pounds per person per day in 2005 to 4.27 pounds per person per day in 2008, and then slowly increase to the projected 2027 rate of 4.94 pounds per person per day. Per capita disposal in 2027 would be about four percent higher than in 2005.
18 Note, however, that implementation of all assumptions by 2008 is highly unlikely.
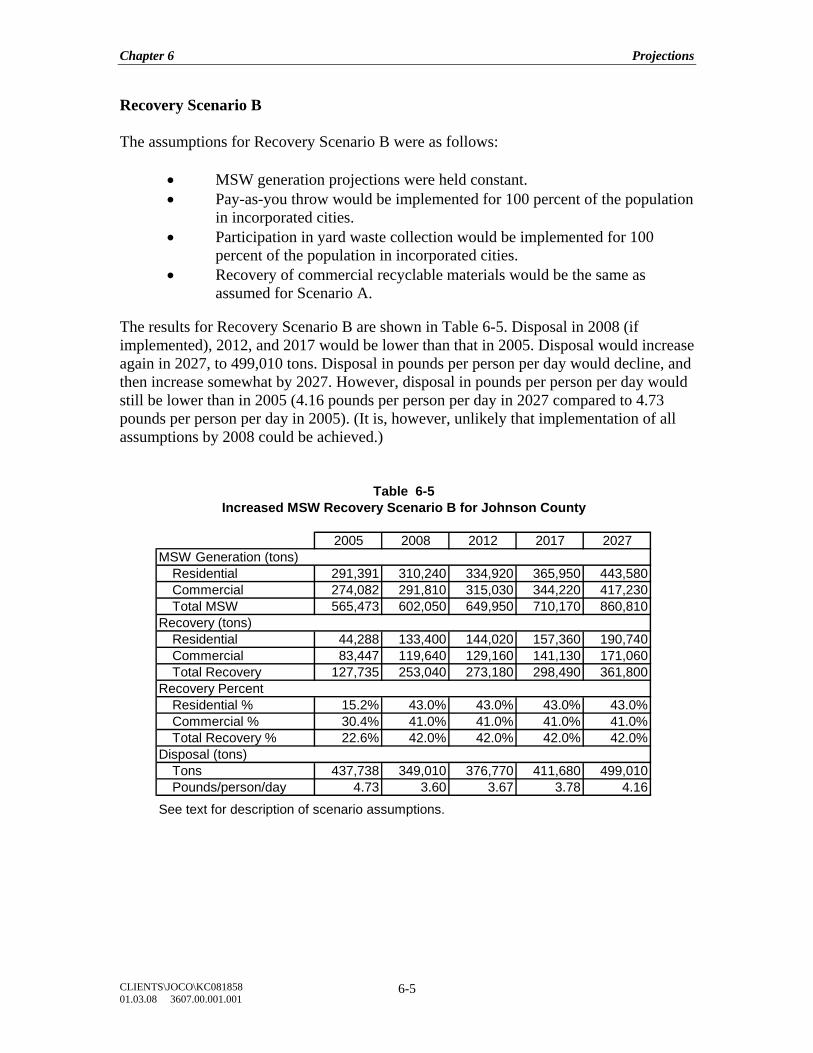
Chapter 6 Projections
CLIENTS\JOCO\KC081858 01.03.08 3607.00.001.001
6-5
Recovery Scenario B The assumptions for Recovery Scenario B were as follows:
• MSW generation projections were held constant. • Pay-as-you throw would be implemented for 100 percent of the population
in incorporated cities. • Participation in yard waste collection would be implemented for 100
percent of the population in incorporated cities. • Recovery of commercial recyclable materials would be the same as
assumed for Scenario A. The results for Recovery Scenario B are shown in Table 6-5. Disposal in 2008 (if implemented), 2012, and 2017 would be lower than that in 2005. Disposal would increase again in 2027, to 499,010 tons. Disposal in pounds per person per day would decline, and then increase somewhat by 2027. However, disposal in pounds per person per day would still be lower than in 2005 (4.16 pounds per person per day in 2027 compared to 4.73 pounds per person per day in 2005). (It is, however, unlikely that implementation of all assumptions by 2008 could be achieved.)
2005 2008 2012 2017 2027MSW Generation (tons)
Residential 291,391 310,240 334,920 365,950 443,580Commercial 274,082 291,810 315,030 344,220 417,230Total MSW 565,473 602,050 649,950 710,170 860,810
Recovery (tons)Residential 44,288 133,400 144,020 157,360 190,740Commercial 83,447 119,640 129,160 141,130 171,060Total Recovery 127,735 253,040 273,180 298,490 361,800
Recovery PercentResidential % 15.2% 43.0% 43.0% 43.0% 43.0%Commercial % 30.4% 41.0% 41.0% 41.0% 41.0%Total Recovery % 22.6% 42.0% 42.0% 42.0% 42.0%
Disposal (tons)Tons 437,738 349,010 376,770 411,680 499,010Pounds/person/day 4.73 3.60 3.67 3.78 4.16
See text for description of scenario assumptions.
Table 6-5Increased MSW Recovery Scenario B for Johnson County
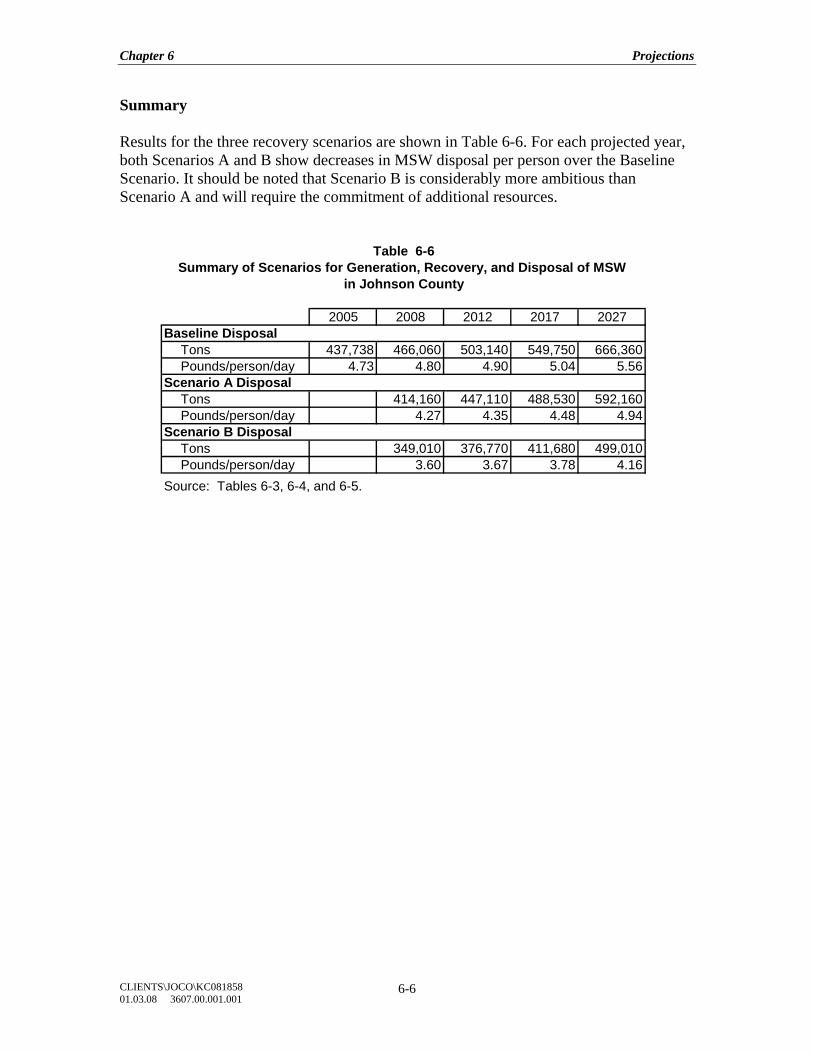
Chapter 6 Projections
CLIENTS\JOCO\KC081858 01.03.08 3607.00.001.001
6-6
Summary Results for the three recovery scenarios are shown in Table 6-6. For each projected year, both Scenarios A and B show decreases in MSW disposal per person over the Baseline Scenario. It should be noted that Scenario B is considerably more ambitious than Scenario A and will require the commitment of additional resources.
2005 2008 2012 2017 2027Baseline Disposal
Tons 437,738 466,060 503,140 549,750 666,360Pounds/person/day 4.73 4.80 4.90 5.04 5.56
Scenario A DisposalTons 414,160 447,110 488,530 592,160Pounds/person/day 4.27 4.35 4.48 4.94
Scenario B DisposalTons 349,010 376,770 411,680 499,010Pounds/person/day 3.60 3.67 3.78 4.16
Source: Tables 6-3, 6-4, and 6-5.
Table 6-6Summary of Scenarios for Generation, Recovery, and Disposal of MSW
in Johnson County
Chapter 6 Projections
CLIENTS\JOCO\KC081858 01.03.08 3607.00.001.001
6-7
CHAPTER 6 REFERENCES
Engineering Solutions & Design, Inc. “Johnson County Solid Waste Analysis: Final Report.” June 11, 2007. Franklin Associates, A Division of ERG. Internal working papers for the U.S. EPA “Characterization of Municipal solid Waste in the United States: 2006 Facts and Figures.” Tables and Figures. Unpublished as of October 2007. Franklin Associates, Ltd. “Characterization of Municipal Solid Waste in the United States: 1994 Update.” U.S. Environmental Protection Agency 530-R-94-042. 1994. Kansas Division of the Budget. http://da.state.ks.us/budget/ecodemo.htm. Accessed July 12, 2006. 2005 value revised with U.S. Bureau of the Census data.
Chapter 6 Projections
CLIENTS\JOCO\KC081858 01.03.08 3607.00.001.001
6-8
THIS PAGE LEFT BLANK INTENTIONALLY
Chapter 7 Solid Waste Reduction and Disposal Options
CLIENTS\JOCO\KC081858 01.03.08 3607.00.001.001
7-1
CHAPTER 7
SOLID WASTE REDUCTION AND DISPOSAL OPTIONS INTRODUCTION As illustrated in Chapter 6, even with aggressive recycling and composting programs, there will still be a need for solid waste disposal for Johnson County waste once the Johnson County Landfill, Inc. closes. The county’s future disposal capacity needs will depend upon the extent to which future waste reduction efforts are successful, but some disposal will still be required for the foreseeable future. This chapter discusses general solid waste reduction options through recycling and composting followed by more specific waste disposal options. More emphasis has been placed on solid waste disposal in this chapter since the Johnson County Landfill, Inc. will be closing and alternative options must be considered. More specific information about potential waste reduction measures and strategies that might be implemented in Johnson County is presented in Chapter 9. SOLID WASTE REDUCTION Reducing solid waste not only conserves disposal capacity, but also conserves natural resources. A 2005 Mid-America Regional Council (MARC) survey of residents in the eight-county area found that 93 percent of Johnson County residents surveyed felt that recycling was important. Creating solid waste reduction habits today will also help mitigate future costs of waste disposal after the closure of the Johnson County Landfill, Inc. Improving the waste reduction infrastructure in Johnson County during the early years of the planning period will help meet future solid waste management needs. Development and implementation of solid waste reduction programs will vary depending upon the source of the waste. Programs that target municipal solid waste (MSW) in the residential sector will differ from commercial sector programs. Programs that target the construction and demolition (C&D) waste stream will differ from the residential and commercial sector programs. However, reducing all of these waste streams is important for the future of solid waste management in Johnson County. There have been some significant changes to Johnson County’s recycling infrastructure in the last 20 years. About 96 percent of the population residing in single-family households in the incorporated cities has access to curbside collection of recyclable materials. All county residents have access to limited drop-off recycling options. Commercial recycling options have also expanded. A materials recovery facility (MRF) that processes recyclable materials collected from Johnson County has also been sited and continues to operate in Wyandotte County. Residents in six cities (or parts of cities) have access to separate curbside collection of yard waste for composting.
Chapter 7 Solid Waste Reduction and Disposal Options
CLIENTS\JOCO\KC081858 01.03.08 3607.00.001.001
7-2
Even with past changes to the recycling infrastructure, the percentage of MSW recovered for recycling and composting (22.6 percent19) in 2005 is still below the national average of 32 percent. Based on background data used in this document, the participation rate in the county’s residential curbside recycling programs is estimated to be about 38 percent. Expansion of existing recycling and composting programs could raise the waste recovery rate to 31 percent within the next five years. More aggressive recycling and composting strategies could raise the recovery rate to 42 percent.20 MSW Reduction Residential and commercial recycling infrastructures are well established in Johnson County, and it is assumed in this plan that these systems will not only continue, but could expand to accommodate more types and larger quantities of recovered materials. Curbside collection of residential yard waste for composting is particularly limited in Johnson County. The following discussion focuses on options to increase MSW reduction through existing county recycling and composting infrastructures. Increasing reduction of MSW through recycling and composting programs requires that more residents and commercial establishments participate in the existing programs and that more materials are collected from each participant. In other words, for the residential sector, there needs to be more recycling bins at the curb with more material in each bin. In 2006 and 2007, the Johnson County Environmental Department and MARC hired a consultant to perform a series of waste sorts at Johnson County solid waste disposal facilities. The results of the waste sorts concluded that over 36 percent of the MSW being landfilled from Johnson County residents is paper products, almost 16 percent is yard waste, and over 12 percent is plastic products21. It is clear from the waste sort analyses that considerable amounts of potentially recyclable materials are being disposed in landfills. Increasing waste reduction will require increased participation in recycling and composting programs. Increased participation can be accomplished through several approaches:
• Public education and awareness to encourage behavioral changes • Financial incentives to encourage behavioral changes • Contractual or licensing methods to encourage behavioral changes • Regulatory methods to require behavioral changes.
Public education and awareness to encourage behavioral changes. Seventy-two percent of the Johnson County residents responding to the 2005 MARC survey had not seen or heard any promotional information about recycling during the past year. Despite the
19 See Chapter 6, Table 6-3. 20 See Chapter 6, Tables 6-4 and 6-5. 21 See Chapter 5, Table 5-1.
Chapter 7 Solid Waste Reduction and Disposal Options
CLIENTS\JOCO\KC081858 01.03.08 3607.00.001.001
7-3
widespread availability of curbside recycling, there is a need to increase awareness among Johnson County residents. Measuring the impact of public education and awareness campaigns can be difficult. The Curbside Value Partnership (CVP) is a national organization created to increase residential participation and the quantity of materials collected in existing recycling programs. The CVP, an association of curbside recycling communities and stakeholders, has measured the impact of educational campaigns in member communities. Brevard County, Florida, increased residential recyclable material quantities by 9.5 percent after a low-cost marketing campaign consisting of fliers, bin stickers, and magnets, combined with media coverage and events. Brevard County took advantage of existing community events and partnered with community organizations. Data were collected and the success of the program was publicized. In addition, strong local political support contributed to the success of the program. Another member community, Denver, Colorado, partnered with the CVP to help communicate changes to the curbside collection system and realized a 12 percent increase in participation as a result. Denver residents were reached by news coverage, a television public service announcement campaign featuring the city’s mayor, direct mailings, advertisements in community publications, and a revamped website. Additionally, the recycling trucks served as rolling billboards promoting the recycling program. Both the Brevard County and Denver programs developed campaign slogans; “Take it to the Curb!” in Brevard County and “ReThink Recycling” in Denver. The CVP could be a resource for Johnson County. Increasing commercial sector participation in existing recycling programs through educational efforts requires coordination with the private sector. Commercial sector recycling is handled almost exclusively by the private sector. Although many commercial establishments have recycling containers on-site, there are significant opportunities for additional containers to be sited. The recycling division of Deffenbaugh Industries, Inc. has announced plans to site additional bins at commercial establishments, including multi-family apartment complexes. They will also start accepting additional materials such as plastic and aluminum from existing as well as new commercial customers. Financial incentives to encourage behavioral changes. An increasing number of communities are encouraging participation in recycling programs by rewarding the participants. Morehead City, North Carolina, randomly selects ten addresses each month to see if the residents at those addresses are recycling. The first one caught recycling is awarded a fifty-dollar cash voucher that is credited toward their solid waste bill. Annually, the city draws one winner from the monthly winners to receive a five hundred dollar cash prize. The Morehead City residential curbside collection program achieves an 80 percent participation rate. RecycleBank, a Philadelphia, Pennsylvania, company, has developed a national rewards program that motivates residents to recycle. The company measures the amount of
Chapter 7 Solid Waste Reduction and Disposal Options
CLIENTS\JOCO\KC081858 01.03.08 3607.00.001.001
7-4
material recycled in each home, then issues RecycleBank “dollars” that can be used at participating businesses to purchase goods or services. Currently, RecycleBank is available in cities in Pennsylvania, New Jersey, Delaware, Vermont, Massachusetts and New York, and has more than 300 business partners including Coke, Patagonia, Whole Foods, Timberland and many others that accept residents’ RecycleBank “dollars.” Coca-Cola has recently announced an investment of $2 million dollars to help RecycleBank expand into more communities. Scott Vitters, director of sustainable packaging for Coca-Cola, believes "… this program will revolutionize the way consumers view their trash, from disposables to valuable reusables.” Another financial incentive that increases participation in curbside recycling programs is a volume-based residential trash collection fee structure often referred to as “pay-as-you-throw” (PAYT). Traditionally, residents pay for waste collection through property taxes or a fixed monthly or annual fee, regardless of how much—or how little—trash they generate. Volume-based fee structures treat trash services like other utilities such as electricity and gas. Materials set out for recycling and composting are collected for “free.” This creates a direct incentive for residents to reduce the amount of trash they throw away and to increase the amount they recycle and compost. Over 6,000 U.S. communities have implemented some form of volume-based fee structures on trash collection. Examples of successful programs include:
• Gainesville, Florida, reduced solid waste collection by 18 percent and increased its recycling rate by about 25 percent.
• Worcester, Massachusetts, increased its recycling rate from three percent to 36 percent.
• San Jose, California, increased its recycling rate from 28 percent to 43 percent in the first year of its program.
• Falmouth, Maine, reduced solid waste collection by 35 percent and increased its recycling rate by more than 50 percent.
In December 2005, Kansas City, Missouri, completed a phased in implementation of a citywide volume-based fee structure on residential trash. A 2005 survey by Kansas City, Missouri, asked urban residents how their trash disposal habits had changed since implementation of the volume-based fee structure program. The following is a list of the responses and the percentage recorded for each response (the total adds to more than 100 percent because multiple responses were allowed).
• Recycling more and disposing less trash (32 percent) • Disposing about the same amount of trash (51 percent) • More careful about their purchases to minimize the amount of trash they
dispose (16 percent) • Occasionally dumping trash in other places (10 percent).

Chapter 7 Solid Waste Reduction and Disposal Options
CLIENTS\JOCO\KC081858 01.03.08 3607.00.001.001
7-5
The City of Westwood has implemented a volume-based fee structure for curbside trash collection. Annually, residents are provided 104 stickers (residents pay for the service through an assessment on property taxes). Each container of trash placed at the curb requires a sticker be attached. Additional stickers can be purchased from a local retailer for $0.25 each. The City provides for citywide collection of residential recyclable materials and yard waste for composting. Contractual or licensing methods to encourage behavioral changes. Through contracts or licensing requirements, recyclable haulers could be required to collect materials that they may not be currently collecting. For example, some residential recyclable haulers operating in Johnson County do not collect corrugated containers at curbside. Curbside collection of yard waste for composting is another service that could be required in hauling contracts. For example, the city of Prairie Village requires that yard waste be collected separately for composting. Two of the largest cities in Johnson County, Overland Park and Olathe, provide for residential collection of recyclable materials through subscription services. Residents of Overland Park also have the option to request curbside collection of yard waste for composting. These subscription services only charge the residents who have signed up for the service. Changing to a system that requires all homeowners to pay for recycling and yard waste collection might encourage higher participation. Regulatory methods to require behavioral changes. Regulatory methods have been used by many states to reduce the quantity of solid waste landfilled. Twenty-five states representing nearly 50 percent of the U.S. population have passed some type of yard waste legislation. Missouri is one of the states that has implemented a landfill ban on yard waste. Minnesota and Wisconsin have both banned recyclable materials from landfilling (in addition to yard waste). In Johnson County, Olathe requires residents to separate yard waste from trash for separate collection and composting at the City composting site. Requiring participation in recycling programs is another regulatory option. If recyclable materials are discovered in trash, violators may be fined or trash collection refused. Fennimore, Wisconsin, uses mandatory recycling to achieve 100 percent participation in the city’s recycling program. The program, established in 1989 by a city ordinance, requires residents and commercial establishments to separate their recyclables from the trash. Residents are required to use clear bags for their trash. This allows haulers to easily determine if recyclable materials have not been separated. If recyclable materials are discovered in the trash, the trash is not collected and a note is left with an explanation. Although Fennimore’s ordinance allows for the assessment of fines ranging from $10-$100 for each offense, leaving the trash is nearly always effective in obtaining compliance.
Chapter 7 Solid Waste Reduction and Disposal Options
CLIENTS\JOCO\KC081858 01.03.08 3607.00.001.001
7-6
Collier County, Florida, adopted a mandatory commercial recycling ordinance in 2004. The ordinance requires commercial establishments to recycle more than one item, but the intent is to encourage businesses to recycle as many materials as practical. The ordinance also established a publicly funded educational and promotional campaign. Mandatory commercial recycling regulations may also require action on the part of the hauler and/or building owners. The recyclable materials haulers may be required to collect the materials, but the building owners may also be required to provide the space to site the recycling containers for their tenants use. Construction and Demolition Debris Reduction Similar to MSW reduction options, county and city governments can impact reduction of construction and demolition debris (C&D) through economic incentives and local ordinances aimed at the private sector. Financial incentives to encourage behavioral changes. Communities can encourage C&D recycling by sponsoring grants and other financial incentive programs. One option might be to offer rebates to contractors for delivery of C&D waste to a recycling facility. The rebates could be funded from deposits paid during the permitting process or by public funds. San Jose, California, implemented a deposit program that requires a fee from the contractors at the time of permitting. The fee, assessed on a square foot basis, is returned to any contractor who provides proof that at least 50 percent of the project’s C&D waste was diverted from landfilling to a city certified recycling or reuse facility. In the 1990s, Alameda County, California, promoted the development of a C&D recycling infrastructure by offering a $10 per ton rebate for county contractors delivering mixed C&D to certified recycling facilities. This program provided a financial incentive that encouraged growth of the C&D recycling infrastructure. A review of Alameda County’s most recent Source Reduction and Recycling Plan shows that the infrastructure is developed to the point that the county is now encouraging the cities to mandate C&D recycling in all projects over a certain size. As of August 2005, 10 cities (representing about 70 percent of the county’s population) have adopted mandatory C&D recycling ordinances. Regulatory methods to require or encourage behavioral changes. Although effective, mandating C&D recycling is not the only regulatory option available. Cities could use their permitting powers to encourage behavioral changes. Through the permitting process, city governments could “reward” contractors with fast track permitting if the contractors provide a C&D recycling plan at the time of application.
Chapter 7 Solid Waste Reduction and Disposal Options
CLIENTS\JOCO\KC081858 01.03.08 3607.00.001.001
7-7
Another permitting program that reduces the C&D waste stream is used by the City of Mission. Mission provides renovation contractors a longer project completion time frame if the contractors agree to divert as much material as possible to the Habitat for Humanity’s ReStore facility.22 Portland, Oregon, requires that contractors submit a recycling plan as part of the permitting process for projects over $50,000. Portland has reported a 50 percent C&D recycling rate. Waste Reduction Infrastructure Needs Many of the waste reduction options discussed above would largely build upon existing programs and current infrastructure to expand recycling. However, adequate infrastructure to support countywide yard waste collection for composting and large-scale recovery of construction and demolition debris (C&D) does not exist in Johnson County. Two large composting facilities are currently operating in Johnson County. The City of Olathe composts about 11,000 tons per year of residential yard waste collected from its residents. The Johnson County Landfill, Inc. composts about 5,700 tons of yard waste per year. There is also a large regional compost facility located on about 1,700 acres in the northeastern part of the metro region. A compost industry representative estimated that a compost facility large enough to compost all of Johnson County’s yard waste would require 10 to 20 acres for the receiving and composting areas, the retention ponds, and the office building. In addition, a sufficient buffer zone between the facility and the surrounding neighborhood would be needed. Capital costs, excluding transportation and the land purchase, would most likely exceed $4 million dollars. Only limited recycling of building-related C&D from construction, renovation and demolition is occurring in Johnson County. Recycling of building-related C&D is more difficult due to the mixed nature of the materials. While some C&D could be separated on the job site, training employees from the different contractors involved in a project is challenging. The C&D industry, in general, favors the approach of taking mixed C&D debris off-site for processing. The trend in the industry is to develop C&D processing facilities that can handle the mixed C&D waste stream. Operators of a C&D materials recovery facility (MRF), similar to a MRF that processes MSW recyclable materials, sort the incoming waste stream by material type. Materials with a high economic value are sold; other non-marketable materials are landfilled.
22 Habitat ReStore is a building materials center that accepts donations of new and used building
materials and then offers those materials for sale to the general public at deeply discounted prices. All proceeds from sales then benefit Habitat for Humanity Kansas City.
Chapter 7 Solid Waste Reduction and Disposal Options
CLIENTS\JOCO\KC081858 01.03.08 3607.00.001.001
7-8
A 2005 feasibility study conducted for the North Central Texas Council of Governments, modeled a 580 tons per day (150,800 tons per year)23 C&D MRF that employed between 24 and 35 employees. The study concluded that 60 percent of the incoming materials could be recycled. The model facility, situated on seven acres, had an anticipated capital cost from $6.9 to $9.5 million. The estimated annual operating costs (including debt service on the capital costs) ranged from $2.5 to $3.4 million. The annual costs, on a per ton basis, ranged from $23.60 to $31.50 (not including any revenue for materials sold). A small C&D recycler in Wichita, Kansas, reportedly recycles 80 percent of their incoming waste stream. The Wichita area, unlike the Kansas City region, does not have a plentiful supply of natural aggregate, which improves the economics of recycling the concrete portion of the waste stream. It will be important for Johnson County to reduce both the yard waste and the C&D waste streams to conserve landfill disposal capacity. Further investigation of potential processing facilities as well as end user markets will be necessary. SOLID WASTE DISPOSAL The following section reviews potential solid waste disposal options. A general description of each option is followed by advantages and disadvantages. To illustrate the magnitude of costs for each option, cost information from other locations is also included. The disposal options examined in this section include the following:
• Landfill disposal inside or outside Johnson County • Waste transfer for disposal outside of Johnson County • Mixed waste processing • MSW composting • Combustion with energy recovery • Alternative technologies
Landfill Disposal The Johnson County Landfill, Inc., the only landfill in the county licensed to accept MSW, will close no later than 2027 under agreement with the City of Shawnee. Construction of the final disposal area of the landfill was initiated in 2007. Assuming that current disposal rates do not grow in future years (i.e., the number of tons per day disposed at the landfill stays the same), the Johnson County Landfill, Inc. has permitted capacity to remain open until 2023. Again, assuming steady disposal rates, the life of the landfill could be extended to 2027 if additional capacity is permitted as planned. However, if population and consumption continue to grow, the landfill life may
23 About 267,000 tons of Johnson County C&D was disposed in 2005 (Chapter 5 Table 5-7).
Chapter 7 Solid Waste Reduction and Disposal Options
CLIENTS\JOCO\KC081858 01.03.08 3607.00.001.001
7-9
be shortened. If future disposal rates increase by 2.0 percent per year, the permitted capacity of the landfill will be exhausted by the end of 2021 (or two years sooner). Any number of other factors could affect these projections, up or down. Solid waste entering the landfill from Johnson County sources is estimated at 1,300 tons per day (or about 24 percent of all waste disposed in this landfill). These tonnages include both municipal solid waste (MSW) and non-MSW such as industrial process waste and construction and demolition (C&D) debris. Reducing the quantity of solid waste entering the Johnson County Landfill, Inc. by restricting waste flow from other counties and other states is not an option for ensuring that the landfill remains open until 2027 to accept Johnson County waste. The U.S. Supreme Court has defined waste to be an article of interstate commerce and therefore, the flow of waste into private facilities cannot be restricted. A Supreme Court ruling recently upheld a solid waste plan adopted by two New York counties (Oneida and Herkimer). Under the plan, haulers operating in these counties must take residential solid waste to the designated county-owned landfills. In this situation, the counties contracted for the collection of residential solid waste and the use of the public landfills was a condition of the bidding process. A majority of the Supreme Court found that the county ordinances grant a benefit on a public disposal facility rather than a private one, and that the ordinances treated all private companies the same. This decision will most likely continue to be challenged by the waste industry. Since the Johnson County Landfill, Inc. is privately owned and operated, this decision does not provide any new authority to restrict waste flow to the landfill from other jurisdictions. There are approximately 1,800 MSW landfills in the United States. This is down from about 2,000 MSW landfills in 2000 and 2,400 in 1996. Although there are fewer landfills, overall disposal capacity has not decreased. Newer landfills are larger and more regional in scope. Advantages and Disadvantages Stricter environmental regulations have made landfills more expensive to construct and operate. Nonetheless, landfills are still the most common method of waste disposal. In 2006, an estimated 80 percent of the MSW disposed, on a national level, was landfilled. Advantages and disadvantages of future disposal of the county’s waste through landfilling are listed in the following table. Advantages Disadvantages Proven technology Difficult to site new facility Lower operational costs Large land requirement Lower user fees High capital costs
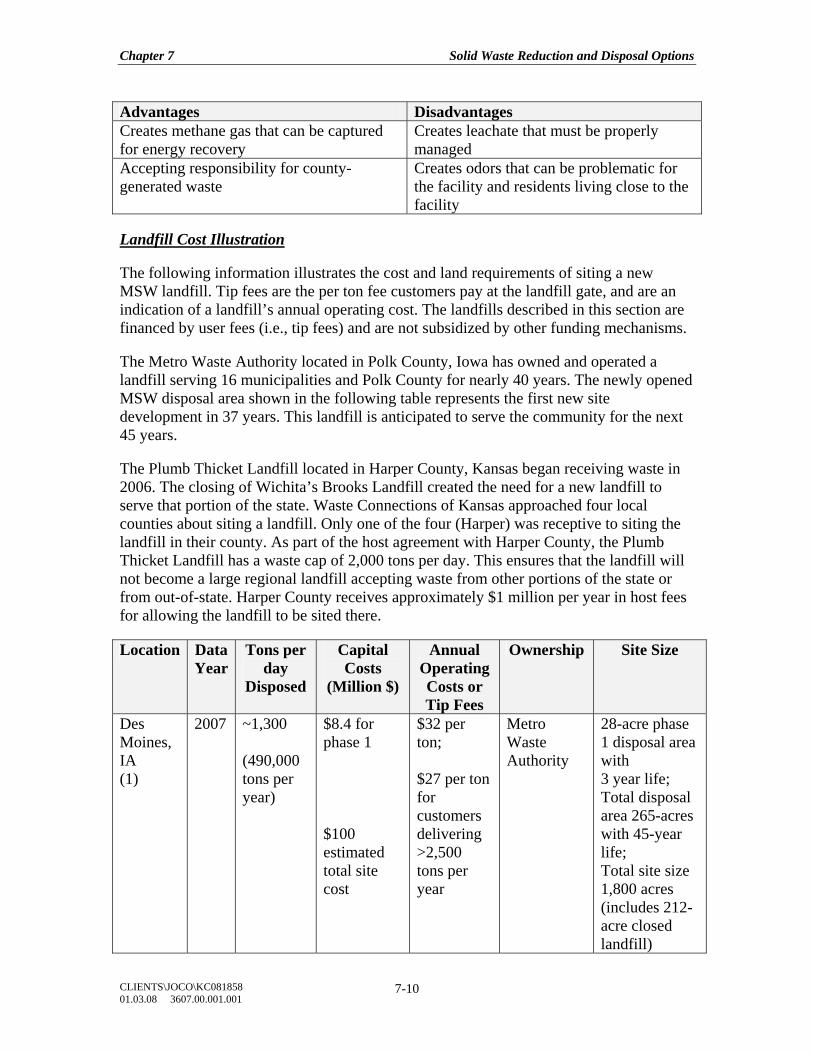
Chapter 7 Solid Waste Reduction and Disposal Options
CLIENTS\JOCO\KC081858 01.03.08 3607.00.001.001
7-10
Advantages Disadvantages Creates methane gas that can be captured for energy recovery
Creates leachate that must be properly managed
Accepting responsibility for county- generated waste
Creates odors that can be problematic for the facility and residents living close to the facility
Landfill Cost Illustration The following information illustrates the cost and land requirements of siting a new MSW landfill. Tip fees are the per ton fee customers pay at the landfill gate, and are an indication of a landfill’s annual operating cost. The landfills described in this section are financed by user fees (i.e., tip fees) and are not subsidized by other funding mechanisms. The Metro Waste Authority located in Polk County, Iowa has owned and operated a landfill serving 16 municipalities and Polk County for nearly 40 years. The newly opened MSW disposal area shown in the following table represents the first new site development in 37 years. This landfill is anticipated to serve the community for the next 45 years. The Plumb Thicket Landfill located in Harper County, Kansas began receiving waste in 2006. The closing of Wichita’s Brooks Landfill created the need for a new landfill to serve that portion of the state. Waste Connections of Kansas approached four local counties about siting a landfill. Only one of the four (Harper) was receptive to siting the landfill in their county. As part of the host agreement with Harper County, the Plumb Thicket Landfill has a waste cap of 2,000 tons per day. This ensures that the landfill will not become a large regional landfill accepting waste from other portions of the state or from out-of-state. Harper County receives approximately $1 million per year in host fees for allowing the landfill to be sited there. Location Data
Year Tons per
day Disposed
Capital Costs
(Million $)
Annual Operating Costs or Tip Fees
Ownership Site Size
Des Moines, IA (1)
2007 ~1,300 (490,000 tons per year)
$8.4 for phase 1 $100 estimated total site cost
$32 per ton; $27 per ton for customers delivering >2,500 tons per year
Metro Waste Authority
28-acre phase 1 disposal area with 3 year life; Total disposal area 265-acres with 45-year life; Total site size 1,800 acres (includes 212- acre closed landfill)
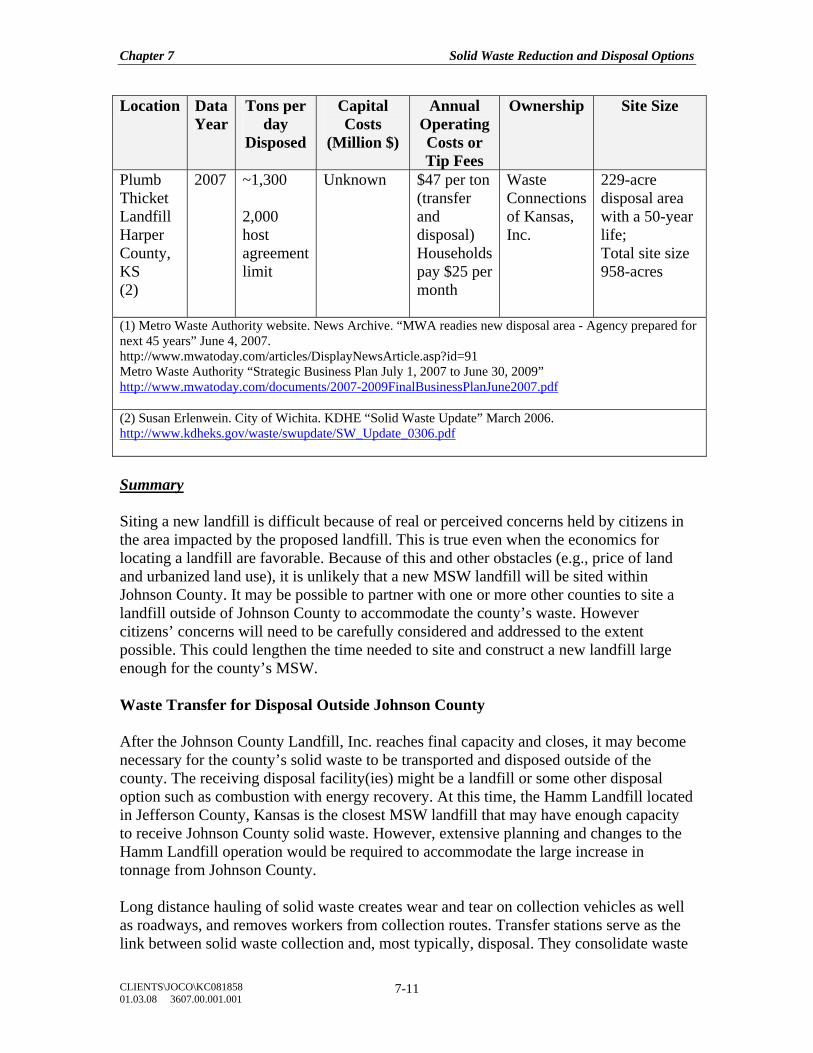
Chapter 7 Solid Waste Reduction and Disposal Options
CLIENTS\JOCO\KC081858 01.03.08 3607.00.001.001
7-11
Location Data Year
Tons per day
Disposed
Capital Costs
(Million $)
Annual Operating Costs or Tip Fees
Ownership Site Size
Plumb Thicket Landfill Harper County, KS (2)
2007 ~1,300 2,000 host agreement limit
Unknown $47 per ton (transfer and disposal) Households pay $25 per month
Waste Connections of Kansas, Inc.
229-acre disposal area with a 50-year life; Total site size 958-acres
(1) Metro Waste Authority website. News Archive. “MWA readies new disposal area - Agency prepared for next 45 years” June 4, 2007. http://www.mwatoday.com/articles/DisplayNewsArticle.asp?id=91 Metro Waste Authority “Strategic Business Plan July 1, 2007 to June 30, 2009” http://www.mwatoday.com/documents/2007-2009FinalBusinessPlanJune2007.pdf (2) Susan Erlenwein. City of Wichita. KDHE “Solid Waste Update” March 2006. http://www.kdheks.gov/waste/swupdate/SW_Update_0306.pdf Summary Siting a new landfill is difficult because of real or perceived concerns held by citizens in the area impacted by the proposed landfill. This is true even when the economics for locating a landfill are favorable. Because of this and other obstacles (e.g., price of land and urbanized land use), it is unlikely that a new MSW landfill will be sited within Johnson County. It may be possible to partner with one or more other counties to site a landfill outside of Johnson County to accommodate the county’s waste. However citizens’ concerns will need to be carefully considered and addressed to the extent possible. This could lengthen the time needed to site and construct a new landfill large enough for the county’s MSW. Waste Transfer for Disposal Outside Johnson County After the Johnson County Landfill, Inc. reaches final capacity and closes, it may become necessary for the county’s solid waste to be transported and disposed outside of the county. The receiving disposal facility(ies) might be a landfill or some other disposal option such as combustion with energy recovery. At this time, the Hamm Landfill located in Jefferson County, Kansas is the closest MSW landfill that may have enough capacity to receive Johnson County solid waste. However, extensive planning and changes to the Hamm Landfill operation would be required to accommodate the large increase in tonnage from Johnson County. Long distance hauling of solid waste creates wear and tear on collection vehicles as well as roadways, and removes workers from collection routes. Transfer stations serve as the link between solid waste collection and, most typically, disposal. They consolidate waste
Chapter 7 Solid Waste Reduction and Disposal Options
CLIENTS\JOCO\KC081858 01.03.08 3607.00.001.001
7-12
from multiple collection vehicles into larger, high-volume transfer vehicles for economical transfer to more distant disposal facilities. The high-volume transfer can be over-the-road in tractor-trailers or longer haul by rail. The primary reason to utilize transfer stations is to reduce the cost of transporting waste to a disposal facility. The hauling distance at which it becomes more economical to utilize a transfer station will vary by location, but an industry representative estimated the break even point to transfer solid waste over-the-road in tractor-trailers to be between 18 and 30 miles to the disposal facility. If the haul distance to the disposal facility is 200 miles or greater, then rail haul of the solid waste may be more economical. In their simplest form, transfer stations have a receiving area where collection vehicles unload their waste. The waste is then compacted and loaded into tractor-trailers or intermodal containers. No long-term waste storage occurs at a transfer station; waste is quickly consolidated and moved off site within a few hours. An area to receive self-hauled waste from individuals may or may not be included in the transfer station design. Although some waste screening for hazardous materials, other banned materials, or recyclable materials can occur at a transfer station, the time allowed for such screening is typically limited. The construction of a transfer station with the flexibility to more carefully screen and remove these materials should include the necessary space to hold wastes for a longer period of time. Storage of waste on-site will require planning to mitigate problem odors as well as vectors. If segregated waste streams such as yard waste, construction and demolition debris, or industrial wastes are handled by a transfer station, additional facility space for unloading and loading may be required, particularly if these wastes are transported to different facilities. Advantages and Disadvantages Transfer stations have the advantage of proven technology, but like other solid waste facilities, can be difficult to site. Citizens are typically concerned about how a new transfer station will impact their quality of life. Advantages Disadvantages Proven technology Difficult to site new facility Lower capital and operating costs Increased neighborhood truck traffic Decreased truck traffic on interstate system Concentrated neighborhood air emissions Opportunity to inspect the waste for additional processing before disposal
Safety concerns for residents living in the immediate area
Opportunity to redirect waste to multiple disposal facilities
Creates odors that can be problematic for the facility and residents living close to the facility
Small land requirement Sending Johnson County waste to someone else’s back yard
Chapter 7 Solid Waste Reduction and Disposal Options
CLIENTS\JOCO\KC081858 01.03.08 3607.00.001.001
7-13
Transfer Station Cost Illustration The Olathe transfer station, located on less than 20 acres, accepts 220 tons of MSW per day. Olathe is currently investigating whether to expand the daily throughput. Olathe’s agreement with Hamm Landfill specifies that Olathe owns the land where the transfer station is located, and is in charge of the gate. Hamm owns and staffs the facility. At the end of the 20-year contract in 2015, ownership of the facility will transfer to the City. The cost to construct a transfer station the size of Olathe’s is estimated at $2.3 million. The operating costs can range from $4 to $8 per ton (or $300,000 to $600,000 annually for a 220-ton per day facility). Current total costs for the City of Olathe are about $28 per ton, which includes the cost of the facility, transfer of the waste into tractor-trailers, and over-the-road haul to and disposal in the Hamm Landfill24. The transfer station employs 2.5 full time equivalent Olathe staff and two Hamm employees. Wichita, Kansas is served by two private transfer stations; one is located north of the city and the other is on the south side. Each facility is situated on approximately 20 acres. Together, the two facilities handle 1,250 tons solid waste per day. Neither capital costs nor operating costs were available for these facilities. Current tipping fees are $47 per ton which includes the cost of the facility, transfer of the waste into tractor-trailers, and over-the-road haul to and disposal in the Plumb Thicket Landfill in Harper County. Prior to the opening of the Plumb Thicket Landfill, Wichita’s solid waste was being transferred to a landfill in central Oklahoma. The Olathe and Wichita transfer stations are designed to accept and consolidate solid waste for rapid transport without storage or further processing. There are additional local as well as regional transfer stations currently being used to manage solid waste. It is not presently known whether these facilities could be expanded to serve Johnson County’s future waste transfer needs. In addition to the Olathe transfer station, Lenexa has one used by the city’s public works department. The Lenexa station is only open to Lenexa citizens for three city clean-up events per year. In 2005 and 2006, 180 and 214 tons respectively passed through the Lenexa facility which was hauled to the Johnson County Landfill, Inc. According to 2006 MARC Solid Waste Management District data, two additional Kansas facilities and five Missouri facilities (plus two under construction) are located in the Kansas City Metropolitan Region. The two Kansas facilities are a transfer station/composting facility located in Leavenworth County and a medical waste transfer station in Wyandotte County. The Kansas Department of Health and Environment (KDHE) online database of waste 24 The current tipping fee (gate fee) for haulers transporting waste to the Olathe Transfer Station is $35
per ton.
Chapter 7 Solid Waste Reduction and Disposal Options
CLIENTS\JOCO\KC081858 01.03.08 3607.00.001.001
7-14
management facilities reports that about 38,000 tons of waste were managed by the Leavenworth transfer station in 2006. The Wyandotte County transfer station managed 128 tons of medical waste in the second quarter of 2007. Two transfer stations located in Kansas City, Missouri were permitted in 2006. The Manchester Transfer and Recycle Facility and Willey’s Material Recovery and Transfer Station both collect MSW, recyclables and C&D debris. The C&D debris is segregated at the transfer station and hauled to C&D landfills in Johnson County. The MSW is hauled to various landfills, and the recyclables are sent to various end-use markets. A third transfer station located in Bucker, Missouri, called the Recycle Transfer Station accepts MSW and recyclables. The MSW is hauled to a landfill in Sedalia, Missouri and the recyclables are sent to various end-use markets. There are two transfer stations in Harrisonville, Missouri. Town & Country Disposal transfer station was permitted in January, 2006 and accepts MSW and C&D debris. The MSW is hauled to the Show-Me Landfill in Warrensburg, Missouri and the C&D debris is segregated at the transfer station and hauled to a C&D landfill in Johnson County. The other transfer station is the Roll-Off Service which accepts MSW and recyclables (cardboard only) and hauls to various MSW landfills and end-use markets. Summary The design of any transfer station(s) to manage Johnson County waste should take into consideration the type of waste to be managed, the throughput quantities, the location, the mode of transport, and the destination (i.e., landfill, waste to energy combustion, or further processing to recovery recyclables). One large or several small transfer stations could serve Johnson County. Management of a single stream (for example, MSW) or multiple streams (MSW, C&D, industrial) will impact the design requirements, land requirements, and cost. Even additional processing of a single stream such as MSW to recover any remaining marketable materials in the waste stream will impact these requirements as well as the cost. Mixed Waste Processing Mixed waste processing (MWP) is a term used to describe the process of removing recyclables from a waste stream. Aggressive curbside recycling programs are typically not a component of a solid waste management system that includes mixed waste processing. To be economically viable, MWP facilities require high value recyclables passing through the facility to capture the revenue from the sale of these materials. A MWP facility manages an unsegregated waste stream and can act as a stand-alone facility or act as the front-end for additional solid waste management system components. A MWP facility can take many forms and is generally tailored to meet the needs of a specific community.
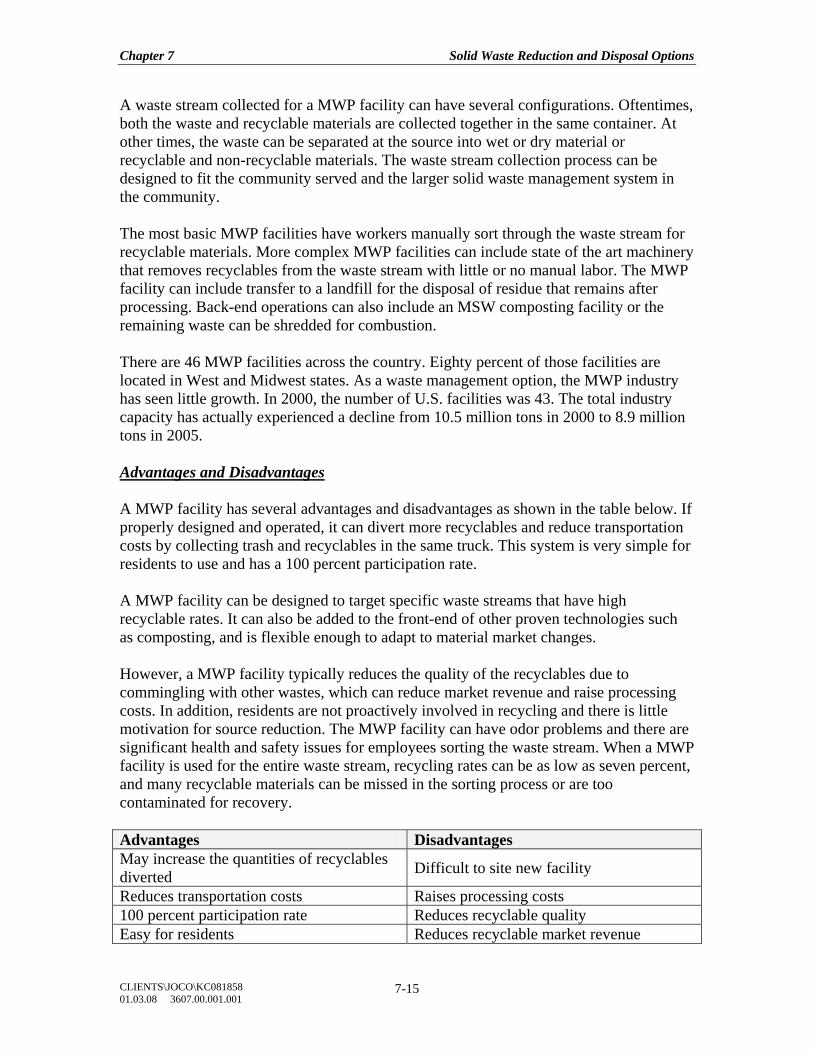
Chapter 7 Solid Waste Reduction and Disposal Options
CLIENTS\JOCO\KC081858 01.03.08 3607.00.001.001
7-15
A waste stream collected for a MWP facility can have several configurations. Oftentimes, both the waste and recyclable materials are collected together in the same container. At other times, the waste can be separated at the source into wet or dry material or recyclable and non-recyclable materials. The waste stream collection process can be designed to fit the community served and the larger solid waste management system in the community. The most basic MWP facilities have workers manually sort through the waste stream for recyclable materials. More complex MWP facilities can include state of the art machinery that removes recyclables from the waste stream with little or no manual labor. The MWP facility can include transfer to a landfill for the disposal of residue that remains after processing. Back-end operations can also include an MSW composting facility or the remaining waste can be shredded for combustion. There are 46 MWP facilities across the country. Eighty percent of those facilities are located in West and Midwest states. As a waste management option, the MWP industry has seen little growth. In 2000, the number of U.S. facilities was 43. The total industry capacity has actually experienced a decline from 10.5 million tons in 2000 to 8.9 million tons in 2005. Advantages and Disadvantages A MWP facility has several advantages and disadvantages as shown in the table below. If properly designed and operated, it can divert more recyclables and reduce transportation costs by collecting trash and recyclables in the same truck. This system is very simple for residents to use and has a 100 percent participation rate. A MWP facility can be designed to target specific waste streams that have high recyclable rates. It can also be added to the front-end of other proven technologies such as composting, and is flexible enough to adapt to material market changes. However, a MWP facility typically reduces the quality of the recyclables due to commingling with other wastes, which can reduce market revenue and raise processing costs. In addition, residents are not proactively involved in recycling and there is little motivation for source reduction. The MWP facility can have odor problems and there are significant health and safety issues for employees sorting the waste stream. When a MWP facility is used for the entire waste stream, recycling rates can be as low as seven percent, and many recyclable materials can be missed in the sorting process or are too contaminated for recovery. Advantages Disadvantages May increase the quantities of recyclables diverted Difficult to site new facility
Reduces transportation costs Raises processing costs 100 percent participation rate Reduces recyclable quality Easy for residents Reduces recyclable market revenue
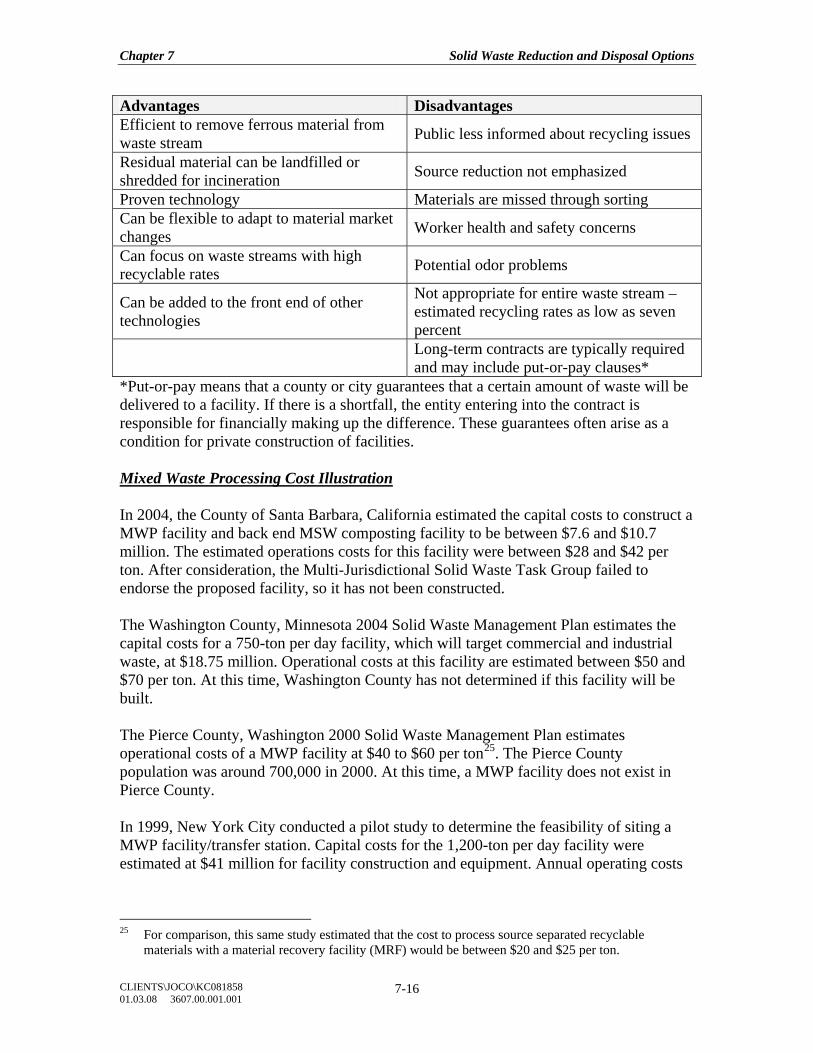
Chapter 7 Solid Waste Reduction and Disposal Options
CLIENTS\JOCO\KC081858 01.03.08 3607.00.001.001
7-16
Advantages Disadvantages Efficient to remove ferrous material from waste stream Public less informed about recycling issues
Residual material can be landfilled or shredded for incineration Source reduction not emphasized
Proven technology Materials are missed through sorting Can be flexible to adapt to material market changes Worker health and safety concerns
Can focus on waste streams with high recyclable rates Potential odor problems
Can be added to the front end of other technologies
Not appropriate for entire waste stream – estimated recycling rates as low as seven percent
Long-term contracts are typically required and may include put-or-pay clauses*
*Put-or-pay means that a county or city guarantees that a certain amount of waste will be delivered to a facility. If there is a shortfall, the entity entering into the contract is responsible for financially making up the difference. These guarantees often arise as a condition for private construction of facilities. Mixed Waste Processing Cost Illustration In 2004, the County of Santa Barbara, California estimated the capital costs to construct a MWP facility and back end MSW composting facility to be between $7.6 and $10.7 million. The estimated operations costs for this facility were between $28 and $42 per ton. After consideration, the Multi-Jurisdictional Solid Waste Task Group failed to endorse the proposed facility, so it has not been constructed. The Washington County, Minnesota 2004 Solid Waste Management Plan estimates the capital costs for a 750-ton per day facility, which will target commercial and industrial waste, at $18.75 million. Operational costs at this facility are estimated between $50 and $70 per ton. At this time, Washington County has not determined if this facility will be built. The Pierce County, Washington 2000 Solid Waste Management Plan estimates operational costs of a MWP facility at $40 to $60 per ton25. The Pierce County population was around 700,000 in 2000. At this time, a MWP facility does not exist in Pierce County. In 1999, New York City conducted a pilot study to determine the feasibility of siting a MWP facility/transfer station. Capital costs for the 1,200-ton per day facility were estimated at $41 million for facility construction and equipment. Annual operating costs
25 For comparison, this same study estimated that the cost to process source separated recyclable
materials with a material recovery facility (MRF) would be between $20 and $25 per ton.
Chapter 7 Solid Waste Reduction and Disposal Options
CLIENTS\JOCO\KC081858 01.03.08 3607.00.001.001
7-17
were estimated at $9 million (or about $21 per ton). The pilot study indicated that the net residential waste recovery rate would increase from about 11 percent to 18 percent. Capital costs for five MWP facilities were reported in the September 1993 issue of the Resource Recycling Magazine. This included a 400 ton per day MWP facility in Canal Winchester, OH that cost $14.1 million; a 400 ton per day MWP facility in Medina, OH that cost $6.7 million; a 100 ton per day MWP facility in Folsom, CA that cost $4.2 million; a 200 ton per day MWP facility in Gallatin, TN that cost $4.1 million; and a 840 ton per day facility that cost $15 million. Capital and operational costs for a MWP facility can vary greatly depending on several factors including, but not limited to, the size of the facility, type of equipment utilized, amount of manual labor required, and facility configuration. Summary Past performance suggests that a MWP facility may work best as part of a larger solid waste management system, where it can target commercial or industrial waste. This waste stream typically has a high concentration of recyclable material including wood, mixed paper, corrugated containers, and ferrous material. In these cases, a MWP facility has achieved recycling rates as high as 50 percent. MWP facilities that target the entire waste stream may have a lower recovery rate. As mentioned previously, the recovery rate could be as low as seven percent. A 2006 Solid Waste Management Plan for Clallam County, Washington estimated that a MWP facility could divert 30 percent of the MSW stream. However, this same plan concluded that a MWP facility could not compete economically with other solid waste management options in the county. MSW Composting MSW composting is a waste management option that takes mixed MSW through a series of processing steps to produce a compost product. In 2006, there were 14 MSW composting facilities with an annual capacity of 417,000 tons. Reported 2006 throughput was 304,000 tons (or 73 percent of capacity). Similar to MWP, this industry has experienced little growth. In 1996, there were 17 operating facilities with an annual capacity of 400,000 tons. In 2000, 15 facilities existed with a reported annual capacity of 402,000 tons. Individual facility capacity ranges from 1,800 to 73,000 tons per year. Paper, food scraps, wood waste, and yard waste make up the compostable portion of MSW. However, because MSW also includes non-biodegradable products such as glass, plastic and metal containers, the quality of the final compost depends upon the degree to which these non-compostable products are removed. Removal of these products can occur on the front-end of the process through manual or mechanical separation or by back-end screening. Generally, separating these non-
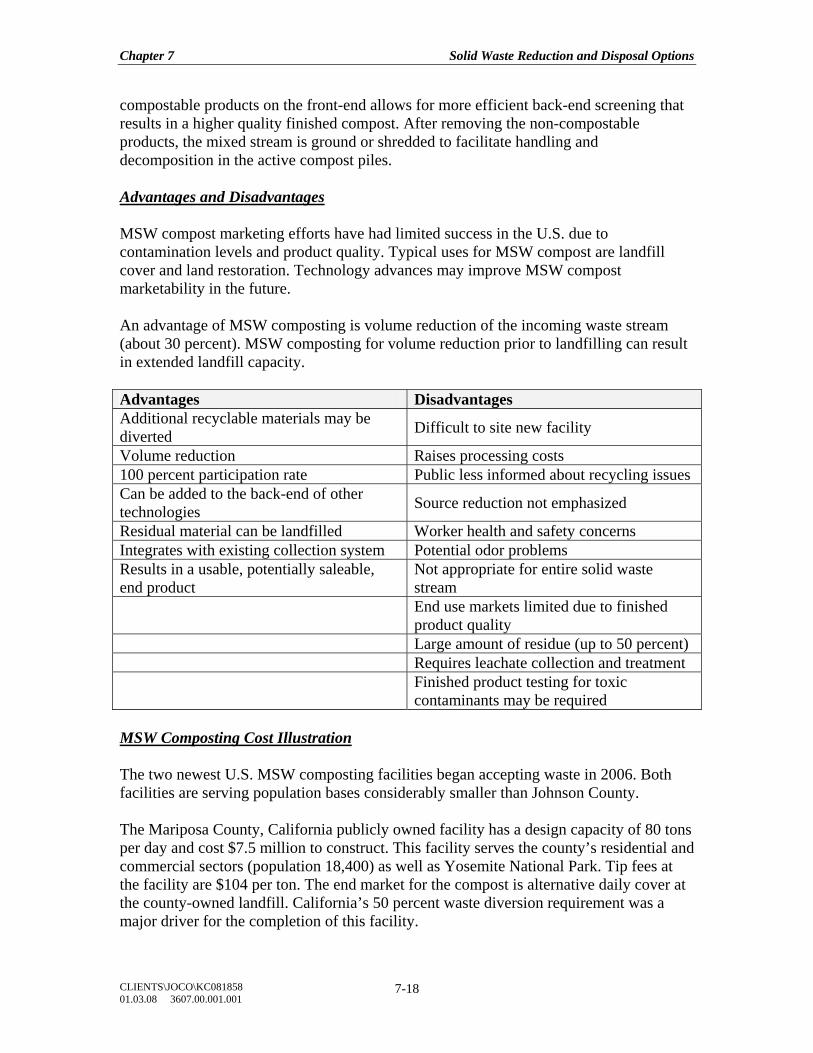
Chapter 7 Solid Waste Reduction and Disposal Options
CLIENTS\JOCO\KC081858 01.03.08 3607.00.001.001
7-18
compostable products on the front-end allows for more efficient back-end screening that results in a higher quality finished compost. After removing the non-compostable products, the mixed stream is ground or shredded to facilitate handling and decomposition in the active compost piles. Advantages and Disadvantages MSW compost marketing efforts have had limited success in the U.S. due to contamination levels and product quality. Typical uses for MSW compost are landfill cover and land restoration. Technology advances may improve MSW compost marketability in the future. An advantage of MSW composting is volume reduction of the incoming waste stream (about 30 percent). MSW composting for volume reduction prior to landfilling can result in extended landfill capacity. Advantages Disadvantages Additional recyclable materials may be diverted Difficult to site new facility
Volume reduction Raises processing costs 100 percent participation rate Public less informed about recycling issues Can be added to the back-end of other technologies Source reduction not emphasized
Residual material can be landfilled Worker health and safety concerns Integrates with existing collection system Potential odor problems Results in a usable, potentially saleable, end product
Not appropriate for entire solid waste stream
End use markets limited due to finished product quality
Large amount of residue (up to 50 percent) Requires leachate collection and treatment
Finished product testing for toxic contaminants may be required
MSW Composting Cost Illustration The two newest U.S. MSW composting facilities began accepting waste in 2006. Both facilities are serving population bases considerably smaller than Johnson County. The Mariposa County, California publicly owned facility has a design capacity of 80 tons per day and cost $7.5 million to construct. This facility serves the county’s residential and commercial sectors (population 18,400) as well as Yosemite National Park. Tip fees at the facility are $104 per ton. The end market for the compost is alternative daily cover at the county-owned landfill. California’s 50 percent waste diversion requirement was a major driver for the completion of this facility.
Chapter 7 Solid Waste Reduction and Disposal Options
CLIENTS\JOCO\KC081858 01.03.08 3607.00.001.001
7-19
The second MSW composting facility that began operating in 2006 is located in Delaware County, New York. This fully enclosed facility co-composts MSW and wastewater biosolids. It cost $20 million to construct and serves 50,000 residents. The design capacity is 100 tons per day of MSW plus 20 tons per day of wastewater treatment plant sludge (biosolids). Planning for the facility started 15 years before actual start up. One driver for the project was New York State’s 60 percent recycling goal. This public/private partnership venture only accepts MSW generated within the county. The county has not established end markets for the compost and is looking for ways to improve the quality of the product, particularly ways to reduce glass fragments. Summary MSW composting does not exist in Johnson County or the surrounding region. According to KDHE staff, two MSW composting operations have been initiated in the state. Harvey County conducted a few trial runs, but then decided to abandon the idea of a county-owned MSW composting facility. A private company started an MSW composting facility on the landfill located outside Coffeeville in 1993. The intended purpose of the composting facility was waste volume reduction. The compost produced by the facility was landfilled on-site. This facility was eventually closed due, in part, to lack of operational knowledge. The MSW composting industry has struggled to become a viable solid waste management option. In some cases, the only “end markets” are waste volume reduction with disposal in a landfill or use as landfill alternative daily cover. The main stumbling blocks are the ability to produce a high value finished product and processing costs that are higher than other disposal options, in particular landfilling. Combustion With Energy Recovery A waste-to-energy (WTE) facility burns waste to generate steam, electricity, super-heated water, or a combination of these. Electricity is the most common form of energy produced and sold to utility companies from WTE facilities. Steam is used widely in industrial WTE applications. It can be used to drive machinery, for space heating, or for generating electricity. Institutional complexes such as hospital can also be an end use option. Since steam cannot usually be economically transported more than one or two miles, the end user needs to be located in close proximity to the combustion unit. There were 98 operational WTE facilities in the U.S. in 2002. Sixty-nine facilities (70 percent) are located in the Northeast and Southern regions of the country. Total design capacity is over 94,000 tons of waste per day (34 million tons per year). Most WTE facilities range from 500 to 3,000 tons of waste per day. According to the Integrated Waste Services Association’s (IWSA) 2002 directory, neither Kansas nor Missouri has a permitted WTE facility.
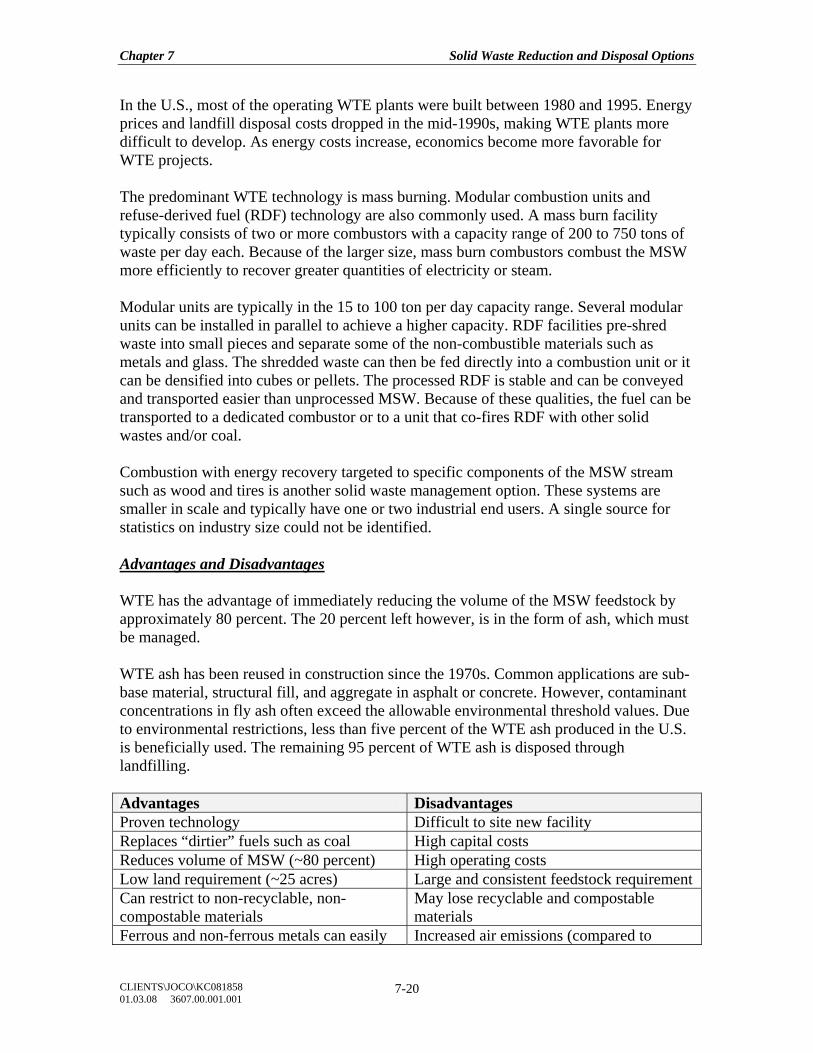
Chapter 7 Solid Waste Reduction and Disposal Options
CLIENTS\JOCO\KC081858 01.03.08 3607.00.001.001
7-20
In the U.S., most of the operating WTE plants were built between 1980 and 1995. Energy prices and landfill disposal costs dropped in the mid-1990s, making WTE plants more difficult to develop. As energy costs increase, economics become more favorable for WTE projects. The predominant WTE technology is mass burning. Modular combustion units and refuse-derived fuel (RDF) technology are also commonly used. A mass burn facility typically consists of two or more combustors with a capacity range of 200 to 750 tons of waste per day each. Because of the larger size, mass burn combustors combust the MSW more efficiently to recover greater quantities of electricity or steam. Modular units are typically in the 15 to 100 ton per day capacity range. Several modular units can be installed in parallel to achieve a higher capacity. RDF facilities pre-shred waste into small pieces and separate some of the non-combustible materials such as metals and glass. The shredded waste can then be fed directly into a combustion unit or it can be densified into cubes or pellets. The processed RDF is stable and can be conveyed and transported easier than unprocessed MSW. Because of these qualities, the fuel can be transported to a dedicated combustor or to a unit that co-fires RDF with other solid wastes and/or coal. Combustion with energy recovery targeted to specific components of the MSW stream such as wood and tires is another solid waste management option. These systems are smaller in scale and typically have one or two industrial end users. A single source for statistics on industry size could not be identified. Advantages and Disadvantages WTE has the advantage of immediately reducing the volume of the MSW feedstock by approximately 80 percent. The 20 percent left however, is in the form of ash, which must be managed. WTE ash has been reused in construction since the 1970s. Common applications are sub-base material, structural fill, and aggregate in asphalt or concrete. However, contaminant concentrations in fly ash often exceed the allowable environmental threshold values. Due to environmental restrictions, less than five percent of the WTE ash produced in the U.S. is beneficially used. The remaining 95 percent of WTE ash is disposed through landfilling. Advantages Disadvantages Proven technology Difficult to site new facility Replaces “dirtier” fuels such as coal High capital costs Reduces volume of MSW (~80 percent) High operating costs Low land requirement (~25 acres) Large and consistent feedstock requirement Can restrict to non-recyclable, non-compostable materials
May lose recyclable and compostable materials
Ferrous and non-ferrous metals can easily Increased air emissions (compared to
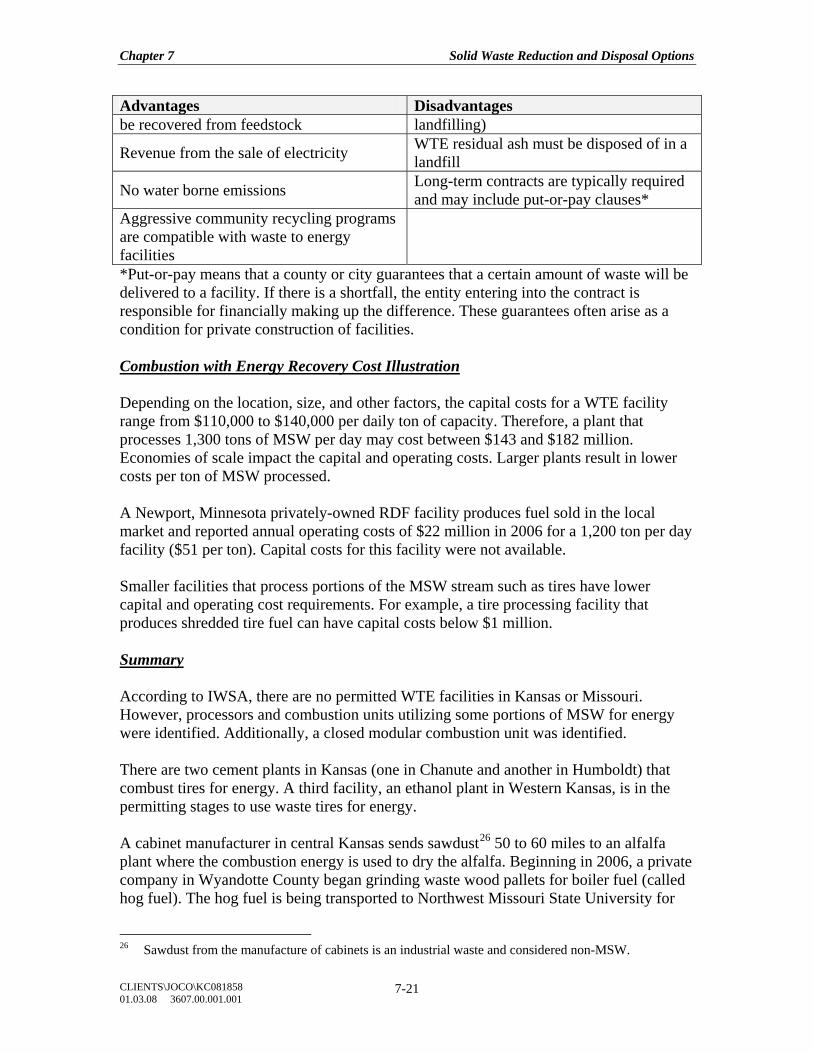
Chapter 7 Solid Waste Reduction and Disposal Options
CLIENTS\JOCO\KC081858 01.03.08 3607.00.001.001
7-21
Advantages Disadvantages be recovered from feedstock landfilling)
Revenue from the sale of electricity WTE residual ash must be disposed of in a landfill
No water borne emissions Long-term contracts are typically required and may include put-or-pay clauses*
Aggressive community recycling programs are compatible with waste to energy facilities
*Put-or-pay means that a county or city guarantees that a certain amount of waste will be delivered to a facility. If there is a shortfall, the entity entering into the contract is responsible for financially making up the difference. These guarantees often arise as a condition for private construction of facilities. Combustion with Energy Recovery Cost Illustration Depending on the location, size, and other factors, the capital costs for a WTE facility range from $110,000 to $140,000 per daily ton of capacity. Therefore, a plant that processes 1,300 tons of MSW per day may cost between $143 and $182 million. Economies of scale impact the capital and operating costs. Larger plants result in lower costs per ton of MSW processed. A Newport, Minnesota privately-owned RDF facility produces fuel sold in the local market and reported annual operating costs of $22 million in 2006 for a 1,200 ton per day facility ($51 per ton). Capital costs for this facility were not available. Smaller facilities that process portions of the MSW stream such as tires have lower capital and operating cost requirements. For example, a tire processing facility that produces shredded tire fuel can have capital costs below $1 million. Summary According to IWSA, there are no permitted WTE facilities in Kansas or Missouri. However, processors and combustion units utilizing some portions of MSW for energy were identified. Additionally, a closed modular combustion unit was identified. There are two cement plants in Kansas (one in Chanute and another in Humboldt) that combust tires for energy. A third facility, an ethanol plant in Western Kansas, is in the permitting stages to use waste tires for energy. A cabinet manufacturer in central Kansas sends sawdust26 50 to 60 miles to an alfalfa plant where the combustion energy is used to dry the alfalfa. Beginning in 2006, a private company in Wyandotte County began grinding waste wood pallets for boiler fuel (called hog fuel). The hog fuel is being transported to Northwest Missouri State University for
26 Sawdust from the manufacture of cabinets is an industrial waste and considered non-MSW.
Chapter 7 Solid Waste Reduction and Disposal Options
CLIENTS\JOCO\KC081858 01.03.08 3607.00.001.001
7-22
use in their campus boilers. KDHE reported that a second private company is considering a similar wood grinding operation in the Kansas City region. In November 2007, a regional shredding facility will begin accepting industrial waste for processing into fuel for the Lafarge Cement plant located in Sugar Creek, Missouri. The alternative fuel will replace dirtier fuel such as coal, resulting in reduced air emissions from the plant. Although the shredder facility will initially be targeting high energy value industrial scrap such as plastic and paper, it is possible that as the processing matures the shredder facility will investigate the use of mixed MSW for alternative fuel. One closed WTE was identified in Kansas. Prior to March 2003, Norton County, Kansas, used a modular combustion unit without energy recovery for volume reduction of their MSW. This county-owned facility struggled to meet the federal air emission standards and was eventually discontinued. Per KDHE staff, this particular type of combustion unit cannot meet federal air emission standards. A WTE facility that receives MSW and combusts it into energy has high capital and operating costs. To be cost-effective for Johnson County, a WTE facility of this type would need to be regional in scope with the support of surrounding counties. Due to the need for large consistent feedstock quantities, guaranteed waste flows are required (guarantee may be made through put-or-pay contracts). The new shredder facility at Sugar Creek could potentially provide an outlet for Johnson County MSW. Although this facility is not classified as an RDF facility, it serves a similar purpose. Alternative Technologies The alternative technologies discussed below include processes that thermally, chemically, or biologically manipulate waste to make usable and/or saleable products. Management of mixed MSW with these technologies is, for the most part, unproven in the U.S. Thermal conversion of waste to energy by a WTE facility is a well-proven technology and is not included in this section. Thermal processes use heat to convert waste into usable products such as gases and fuels. Gasification and pyrolysis are similar thermal processes; each converts waste to gases, liquids, and ash or char. The gasification process allows a small amount of air, steam, or oxygen into the conversion process. Residual ash that must be disposed by landfilling can be eight to 15 percent of the incoming feedstock weight. Pyrolysis is the thermal decomposition of waste in the complete absence of oxygen. Unlike gasification, pyrolysis uses an external source of heat to sustain the internal process. Besides the gases and liquids, pyrolysis also produces char, which consists of carbon and inert materials. Char is typically a non-hazardous product with a heating value of around 7,000 Btus per pound.
Chapter 7 Solid Waste Reduction and Disposal Options
CLIENTS\JOCO\KC081858 01.03.08 3607.00.001.001
7-23
Plasma waste conversion is a process that utilizes a plasma reactor to convert waste to inert slag and gases. The gases, called “syngas,” can be used as an energy source in a boiler or turbine. The plasma reactor is an enclosed chamber containing plasma torches. These torches heat the gases in the chamber to 3,000 degrees C or higher. The process reaction can be either without oxygen (pyrolysis) or have oxygen introduced into the chamber (gasification). These high temperatures convert organic materials into gas and inorganic materials into a glassy slag substance. The slag is formed from the glass, soil, minerals and metals in MSW. Chemical processing refers to turning organic wastes into fuel (typically ethanol) by passing it through a series of refining processes to release, ferment, and distill the available sugars. Production of ethanol through acid hydrolysis is a proven technology for some feedstocks such as corn and other agriculture products or byproducts. However, it is not a proven MSW management technology. Depolymerization is the breakdown of complex organic materials into smaller ones. The process uses chemicals, temperature, and pressure to convert wastes into energy products such as light crude oil. Thermo-depolymerization is a patented process developed by Changing World Technologies, Inc27. The process uses chemical conversion plus pressure and heat to decompose long chain polymers of hydrogen, oxygen, and carbon into short chain petroleum hydrocarbons. This technology is on line at a plant operated by Renewable Environmental Solutions, LLC in Carthage, Missouri. The facility, a joint venture with Changing World Technologies, Inc. and Con-Agra Foods, Inc. uses turkey offal and grease from Con-Agra’s turkey processing plant. According to Changing World’s website, the facility, operating at 30 percent capacity, shipped 6,000 barrels of renewable diesel fuel in April 2006. Biological treatment through anaerobic digestion is a process that degrades organic material in the absence of oxygen. In general, anaerobic digestion systems are best suited for wastes high in organic concentrations and have not been demonstrated as an effective management option for mixed MSW in the U.S. Advantages and Disadvantages The following table lists some the advantages and disadvantages of the alternative technologies discussed in this document. Advantages Disadvantages THERMAL PROCESSES Additional recyclable materials may be diverted Unproven technologies
27 Changing World Technologies, Inc. website currently promotes “thermal conversion process” TCP
that incorporates a depolymerization step. http://www.changingworldtech.com/what/tcp_process.pdf
Chapter 7 Solid Waste Reduction and Disposal Options
CLIENTS\JOCO\KC081858 01.03.08 3607.00.001.001
7-24
Advantages Disadvantages Better public acceptance than combustion Difficult to site new facility Potential for high waste diversion (up to 90 percent) Up-front processing raises costs
Gas products may have a higher energy value than recovered landfill gas High capital costs
High process temperatures may create flexibility on types of wastes processed High operating costs
Integrates with existing collection system Gasification systems may be sensitive to non-organic material
Results in a usable, potentially saleable, end product
Gasification can produce an ash that must be disposed
Plasma technology provides superior thermal destruction with limited pollution
Recovered gas may contain large amounts of particulate materials and chemicals that can reduce marketability
CHEMICAL AND BIOLOGICAL PROCESSES Additional recyclable materials may be diverted
Unproven technologies for mixed MSW management
Use of wastes to produce ethanol is encouraged by the Federal Government Difficult to site new facility
Results in a usable, potentially saleable, end product Potentially high capital costs
Anaerobic digestion relatively low capital costs compared to thermal processes Potentially high operating costs
Anaerobic digestion is an enclosed process, which reduces environmental impacts to air and water
Separation of non-organic materials may be required, which increases operating costs
Potential odor nuisance Alternative Technology Cost Illustration Since the alternative technologies profiled here have had limited success in full-scale MSW operations, cost comparisons were difficult to find. St. Lucie County, Florida is planning to site a $425 million plasma arc facility; the first in the U.S. Planned start up of the 100,000 square foot plant is scheduled for 2008. The county plans to not only process current quantities of MSW, but also to eventually process their entire existing landfill (estimated to contain 4.3 million tons of compacted MSW). The combustible gas produced will be used to run turbines to create electricity to be sold back to the grid. In addition to MSW, the county’s wastewater treatment plant sludge will also be processed.
Chapter 7 Solid Waste Reduction and Disposal Options
CLIENTS\JOCO\KC081858 01.03.08 3607.00.001.001
7-25
The Masada OxyNol acid hydrolysis system converts waste to ethanol. Several communities in New York State have been reviewing this MSW management option for over 10 years. The original capital cost estimate of $100 million escalated to $285 million by 2005. As of 2006, this technology was still being considered. It is anticipated that the facility, if built, would handle 230,000 tons of MSW per year (630 tons per day), 422,000 tons of wastewater treatment plant sludge per year, and 32,000 tons of waste paper per year (684,000 total tons per year). It would produce up to 7.1 million gallons of ethanol. In addition to ethanol, recyclables, gypsum, and carbon dioxide will also be recovered. The thermal depolymerization facility in Carthage, Missouri reportedly cost $20 million to construct, plus private investors provided $40 million to develop the process and EPA provided an additional $12 million in grants. Newspaper articles have reported considerable odor problems at the facility. Missouri’s Attorney General brought legal action against the operators due to the odors through a “petition for injunctive relief to abate a public nuisance.” Summary At this time, the significant disadvantages of using unproven technologies and the high capital and operational costs make these MSW management options unsuitable for near-term use in Johnson County. However, the promises of eliminating most MSW warrants continued observation of these technologies in the future.
Chapter 7 Solid Waste Reduction and Disposal Options
CLIENTS\JOCO\KC081858 01.03.08 3607.00.001.001
7-26
CHAPTER 7 REFERENCES
REDUCTION Alameda County Source Reduction and Recycling Board. “Alameda County Source Reduction and Recycling Plan Vision 2010: 75% and Beyond.” Revised January 2006. http://www.stopwaste.org/docs/recycling_plan_-_2006_revised.pdf Canterbury, Janice, and Sue Eisenfeld. “The Rise and …Rise of Pay-As-You-Throw”. MSW Management Elements. 2006. Curbside Value Partnership (CVP) website. Partner Results web page. http://www.recyclecurbside.org/partner_results.html. Engineering Solutions & Design, Inc. “Johnson County Solid Waste Analysis Final Report”. September 15, 2007. http://jced.jocogov.org. Grassroots Recycling Network. Archives web page. Mandatory recycling search. http://greenyes.grrn.org/2001/02/msg00006.html Kansas City, Missouri. “2005 KC Recycles Survey Final Report”. July 2005. Kirk, Denise, and Daniel Dietch. “Mandatory Non-Residential Recycling Ordinance”. Government Engineering. November-December 2004. Leposky, George. “A Smorgasbord of Recycling Equipment Choices”. MSW Management. July/August 2005. Merrill, Lynn. “Recycling’s Heavyweight: C&D Processing”. MSW Management. January/February 2005. http://www.forester.net/mw_0501_recycling.html. Mid-America Regional Council Solid Waste Management District. “Solid Waste Services Eight-County Community Survey”. December 2005. Morehead City, North Carolina website. Recycling web page. http://www.townofmorehead.com/Recycle%20page.html North Carolina State University Cooperative Extension. Environmental Update. January/February 2005. http://www.ces.ncsu.edu/onslow/staff/drashash/newsletr/Jan2005.pdf
Chapter 7 Solid Waste Reduction and Disposal Options
CLIENTS\JOCO\KC081858 01.03.08 3607.00.001.001
7-27
North Central Texas Council of Governments. “Construction and Demolition Waste Minimization Strategies for the North Central Texas Region Final Report”. August 2005. http://www.dfwinfo.com/envir/SEELT/NCTCOG_C_D_Final_Report.pdf RecycleBank company website. http://www.recyclebank.com/home.cfm. Waste Business Journal.com Online newsletter. “RecycleBank shows that it Pays to Recycle”. June 14, 2007 http://www.wastebusinessjournal.com/news/wbj20070613K.htm Waste News. Online newsletter. “Coca-Cola invests $2M in curbside recycling.” October 10, 2007. LANDFILL Beveridge & Diamond, P.C. “Supreme Court Decision Alters Solid Waste Flow Control Jurisprudence”. May 2, 2007. http://www.bdlaw.com/news-173.html Deffenbaugh Landfill data provided by Deffenbaugh and JCED staff. Franklin Associates, A Division of ERG. Internal working papers for EPA document “Municipal Solid Waste in the United States 2006: Facts and Figures.” Kansas Department of Health and Environment. “Solid Waste Update” March 2006. http://www.kdheks.gov/waste/swupdate/SW_Update_0306.pdf Metro Waste Authority “Strategic Business Plan July 1, 2007 to June 30, 2009.” http://www.mwatoday.com/documents/2007-2009FinalBusinessPlanJune2007.pdf Metro Waste Authority website. News Archive. “MWA readies new disposal area - Agency prepared for next 45 years” June 4, 2007. http://www.mwatoday.com/articles/DisplayNewsArticle.asp?id=91 National Solid Wastes Management Association (NSWMA). “Flow Control of Solid Wastes” http://wastec.isproductions.net/webmodules/webarticles/anmviewer.asp?a=1085 Personal contact with Susan Erlenwein. Sedgwick County Environmental Resources. 316-660-7200. May 2007. Recycling Today. “N.Y. Counties Win Flow Control Ruling.” 5/1/2007 Recycling Today online newsletter. URL: http://www.recyclingtoday.com/news/news.asp?ID=11332 TRANSFER STATIONS Email communication with Kent Seyfried. City of Olathe. [email protected]. May 2007.
Chapter 7 Solid Waste Reduction and Disposal Options
CLIENTS\JOCO\KC081858 01.03.08 3607.00.001.001
7-28
Kansas Department of Health and Environment. Online solid waste facility database. Accessed September 2007. http://public1.kdhe.state.ks.us/Landfills/Landfills.nsf?Opendatabase MARC Solid Waste Management District facilities database. Staff. June 2007. Personal communication with Charlie Sedlock. Hamm Landfill. 785-597-5111. May 2007. Personal contact with Susan Erlenwein. Sedgwick County Environmental Resources. 316-660-7200. May 2007. U.S. EPA Solid Waste and Emergency Response. “Waste Transfer Stations: A Manual for Decision-Making.” June 2002. EPA530-R-02-002 MIXED WASTE PROCESSING Apotheker, Steve. “Processing Mixed Wastes: Relearning the Lessons of the Past.” Resource Recycling. September 1993. Apotheker, Steve. “MWP Mixed waste processing: A mixed report card.” Resource Recycling. December 1994. BioCycle. “Citizens Drive 65 percent Diversion System.” April 1999. www.environmental-expert.com/magazine/biocycle/april/article2.htm Clallam County Washington. “Final Draft Solid Waste Management Plan Update 2006.” January 2007. 255-2191-014 (01/01) http://www.ci.sequim.wa.us/council/agenda/2007/04092007/SW%20Comp%20Plan%20Attach.pdf Enviros. Waste Technology web site. “Unsorted / residual waste Materials Recovery Facility (Dirty MRF).” http://www.mbt.landfill-site.com/Dirty_MRF/dirty_mrf.html Franklin Associates, A Division of ERG. Internal working papers for EPA document “Municipal Solid Waste in the United States 2006: Facts and Figures.” Multi-Jurisdiction Solid Waste Task Group Meeting Minutes. Santa Barbara, CA. February 2004. www.countyofsb.org/pwd/MJSWTG/files/Mjdocs/joint%20minutes%2002-23-04.doc New York City Department of Sanitation. “Mixed Waste Processing In New York City. A Pilot Test Evaluation.” October 1999. http://www.nyc.gov/html/nycwasteless/downloads/pdf/mixed_waste.pdf
Chapter 7 Solid Waste Reduction and Disposal Options
CLIENTS\JOCO\KC081858 01.03.08 3607.00.001.001
7-29
MSW COMPOSTING BioCycle. “Mixed MSW Composting Is ‘Steady As She Goes’.” November 2006. Franklin Associates, A Division of ERG. Internal working papers for EPA document “Municipal Solid Waste in the United States 2006: Facts and Figures.” Personal communication with Ken Powell, Kansas Department of Health & Environment. 785-296-1121. September 2007. Pierce County Public Works. “Tacoma-Pierce County Solid Waste Management Plan.” Fall 2000. http://www.co.pierce.wa.us/pc/services/home/environ/pdf/solidwaste/index2.htm Sonoma County, California. “Countywide Integrated Waste Management Plan.” October 15, 2003. http://www.recyclenow.org/CoIWMP/Ch4_SRRE_Composting.pdf COMBUSTION Foth & Van Dyke and Associates, Inc. “Analysis of a Biomass/RDF Facility at Rock-Tenn.” July 2006. Integrated Waste Services Association (IWSA). “The 2002 IWSA Directory of Waste-To-Energy Plants.” 2002. Personal communication with Ken Powell, Kansas Department of Health & Environment. 785-296-1121. September 2007. U.S. EPA. “A Decision Maker’s Guide to Solid Waste Management Vol II.” Chapter 8. http://www.epa.gov/epaoswer/non-hw/muncpl/dmg2/chapter8.pdf Waste-to-Energy Research and Technology Council (WTERT) http://www.seas.columbia.edu/earth/wtert/ ALTERNATIVE TECHNOLOGIES Changing World Technologies, Inc. company website. http://www.changingworldtech.com/press_room/index.asp Cheyenne Herald. “Middletown, New York Middletown mayor tells Herald she is optimistic about their 11 year-old trash-to-ethanol project. ‘Optimistic in hopes it never gets completed.’” December 27, 2005. http://www.cheyenneherald.com/_pdf/December%2027,%202005%20page%207.pdf. Circuit Court of Jasper County, Missouri. Petition for Injunctive Relief to Abate a Public Nuisance. http://ago.mo.gov/lawsuits/2005/041305carthageodor.pdf
Chapter 7 Solid Waste Reduction and Disposal Options
CLIENTS\JOCO\KC081858 01.03.08 3607.00.001.001
7-30
CIWMB Emerging Technologies Forum. Sacramento, CA April 18, 2006. “Update on New York City’s Efforts.” Steven N. Brautigam, Esq. NYC Department of Sanitation. http://www.ciwmb.ca.gov/Organics/Conversion/Events/TechForum06/Presentatns/Brautigam.pdf. Mid-America Regional Council Solid Waste Management District. “Strategic Directions and Policy Recommendations for Solid Waste Management in the Bistate Kansas City Metropolitan Region.” October 2003. Ramsey/Washington County Resource Recovery Project. “Updated Research Study of Alternative Waste Processing Technologies.” September 2004. USA Today. “Florida County plans to vaporize landfill trash.” September 9, 2006. http://www.usatoday.com/news/nation/2006-09-09-fla-county-trash_x.htm
Chapter 8 Public Participation
CLIENTS\JOCO\KC081858 01.03.08 3607.00.001.001
8-1
CHAPTER 8
PUBLIC PARTICIPATION INTRODUCTION As part of the plan development process, the Johnson County Solid Waste Management Committee (SWMC)28 and the Johnson County Environmental Department, with support from the Board of County Commissioners, sought an expanded forum for public input by appointing an Ad Hoc Stakeholders Group. The County considers public participation essential for successful plan development. Three facilitated Stakeholder Group sessions were held at the Johnson County Central Resources Library in Overland Park on March 27, April 19, and May 17, 2007. Topics covered during the meetings included the current solid waste management system, potential solid waste reduction options (including reuse, recycling, and composting), future solid waste disposal options, the future role of public and private entities in solid waste management, and inter-jurisdictional cooperation for implementing future solid waste management programs. In addition to the Stakeholder Group, Johnson County Environmental Department presented pertinent information during the plan development process to the Johnson and Wyandotte County Council of Mayors, the Northeast Kansas City Administrators Group, and the Board of County Commissioners (BOCC). A public hearing on the draft plan was held prior to adoption by the BOCC. STAKEHOLDER GROUP FUNCTION AND GOALS The overall function of the Ad Hoc Stakeholders Group was to provide input to the SWMC about current and future solid waste management in the county. Participants were individuals with a personal or professional interest in solid waste issues including representatives from most cities, several homeowners associations, private waste management companies and public interest groups. The SWMC sought specific stakeholders’ feedback on the current system including positive experiences as well as concerns and perceived or real obstacles. In addition, the SWMC sought stakeholders’ ideas and vision for the future of solid waste management in the county. The Committee used the input from the Stakeholders Group to help develop the new Johnson County Solid Waste Management Plan. A listing of participants is included in Appendix I to this document. The goals established for the stakeholder process are outlined below and included the following:
28 A list of the Johnson County Solid Waste Management Committee members is shown in Appendix H.
Chapter 8 Public Participation
CLIENTS\JOCO\KC081858 01.03.08 3607.00.001.001
8-2
(1) To provide the Group with an understanding of solid waste management planning in Johnson County a. Why the County is going through this process b. A description of the process
(2) To provide the Group with an understanding of the current solid waste management system serving Johnson County, upcoming challenges to that system, and options for responding to those challenges a. A description of the current system and future challenges b. A description of options for responding to future challenges
(3) To facilitate stakeholders participation by a. Providing a forum for the participants to voice their opinions
verbally b. Providing a forum for dialog among other stakeholders c. Providing a process for participants to provide written comments d. Providing meeting summaries to the participants e. If possible, identifying any common themes or consensus among
participants regarding options for responding to future challenges (4) To incorporate stakeholders’ input into the planning process by
a. Listening and recording the Group’s comments b. Identifying any common themes and consensus among the
stakeholders c. Sharing the Group’s comments including any common themes
with the SWMC for consideration as the Committee develops the new Plan
d. Acknowledging the role of the Group in Plan development in the Plan itself
e. Including the Group’s meeting summaries as appendices to the Plan
f. To the extent possible within resource constraints, sharing the reasons with the Group for any stakeholders’ suggestions and ideas that the Committee elects not to include in the Plan
g. Providing the Group an overview of the final Plan prior to sharing it with the general public or the Board of County Commissioners
STAKEHOLDER MEETING FORMAT Each stakeholder meeting started with the group facilitator providing an overview of the meeting structure and stakeholder process (ground rules, agenda, etc.) and, for meetings two and three, a summary of the previous meeting. The Johnson County Environmental and their plan development consulting team then gave an educational presentation to provide the stakeholders with background information on the meeting topic. Data and information developed for the solid waste management plan were incorporated into the educational presentations, which are included in the appendices to this document.
Chapter 8 Public Participation
CLIENTS\JOCO\KC081858 01.03.08 3607.00.001.001
8-3
After the educational presentation at each meeting, the stakeholders were separated into four small groups which were assigned a facilitator and a notetaker. Each group was provided questions related to the meeting topic to generate discussion. Top ideas and key thoughts from each small group were captured on flip charts and then shared with the full Stakeholders Group following the small group breakouts. The discussion questions posed to the small breakout groups are listed below. Session 1. Current solid waste management system A. Current trash collection and disposal
(1) What do you like about the current trash collection and disposal system? (2) What don’t you like about the current trash collection and disposal
system? (problems, obstacles, concerns) B. Current recyclable materials and yard waste collection
(1) What do you like about the current recyclables and yard waste collection and disposal system?
(2) What don’t you like about the current recyclables and yard waste collection and disposal system?
Session 2. Stakeholder Vision: Waste Reduction Options A. What ideas do you have for reducing the following waste streams? (Prioritize the
following waste materials and come up with 3-4 top ideas) (1) Residential yard waste (2) Construction and demolition debris (3) Commercial food waste (4) Paper & cardboard (5) Plastics
B. For the top reduction ideas from the group ranking exercise (“dotocracy”), what role should each of the main entities play (homeowners associations, county, cities, private sector)?29
Session 3. Stakeholder Vision: Waste Disposal Options A. Assume the Johnson County Landfill is closing and other disposal options must
be found. What future disposal options do you favor for the county and why? (1) New in-county landfill (2) New regional landfill located outside of the county (3) New in-county transfer station(s) (4) New transfer station(s) located outside of the county (5) Other disposal or treatment options
29 Due to time constraints, it was decided to continue discussing the second discussion question at the
third stakeholder session.
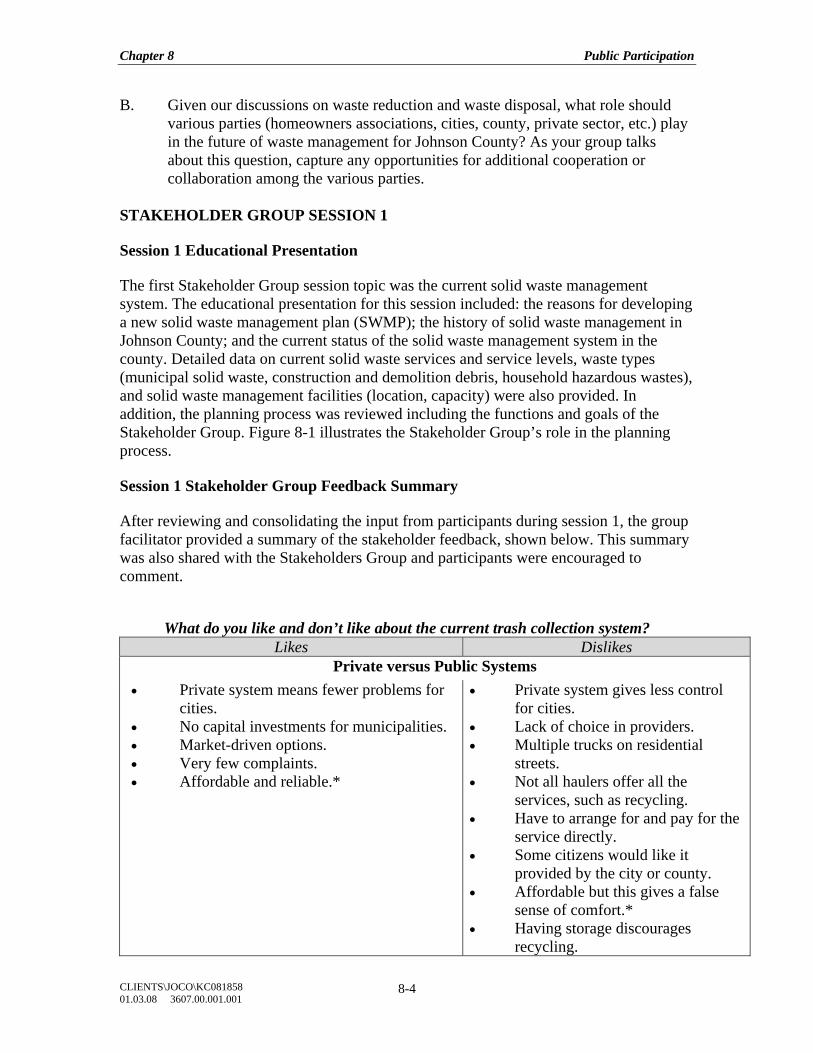
Chapter 8 Public Participation
CLIENTS\JOCO\KC081858 01.03.08 3607.00.001.001
8-4
B. Given our discussions on waste reduction and waste disposal, what role should various parties (homeowners associations, cities, county, private sector, etc.) play in the future of waste management for Johnson County? As your group talks about this question, capture any opportunities for additional cooperation or collaboration among the various parties.
STAKEHOLDER GROUP SESSION 1 Session 1 Educational Presentation The first Stakeholder Group session topic was the current solid waste management system. The educational presentation for this session included: the reasons for developing a new solid waste management plan (SWMP); the history of solid waste management in Johnson County; and the current status of the solid waste management system in the county. Detailed data on current solid waste services and service levels, waste types (municipal solid waste, construction and demolition debris, household hazardous wastes), and solid waste management facilities (location, capacity) were also provided. In addition, the planning process was reviewed including the functions and goals of the Stakeholder Group. Figure 8-1 illustrates the Stakeholder Group’s role in the planning process. Session 1 Stakeholder Group Feedback Summary After reviewing and consolidating the input from participants during session 1, the group facilitator provided a summary of the stakeholder feedback, shown below. This summary was also shared with the Stakeholders Group and participants were encouraged to comment.
What do you like and don’t like about the current trash collection system? Likes Dislikes
Private versus Public Systems • Private system means fewer problems for
cities. • No capital investments for municipalities. • Market-driven options. • Very few complaints. • Affordable and reliable.*
• Private system gives less control for cities.
• Lack of choice in providers. • Multiple trucks on residential
streets. • Not all haulers offer all the
services, such as recycling. • Have to arrange for and pay for the
service directly. • Some citizens would like it
provided by the city or county. • Affordable but this gives a false
sense of comfort.* • Having storage discourages
recycling.
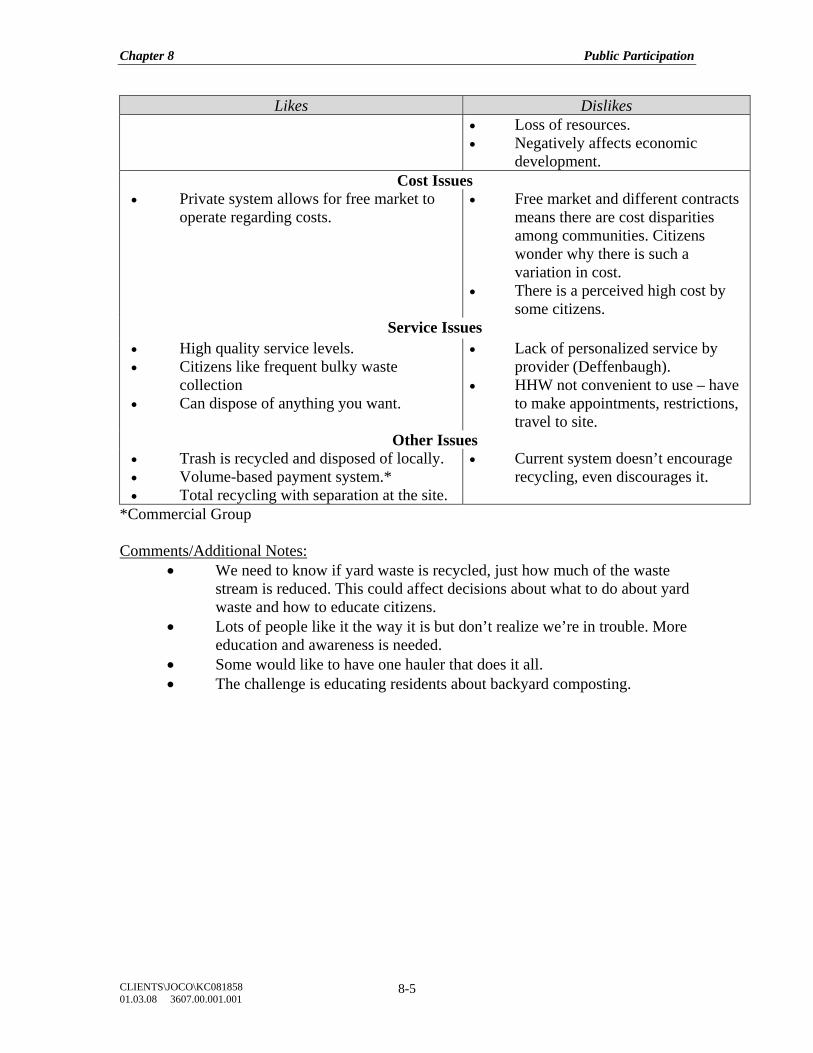
Chapter 8 Public Participation
CLIENTS\JOCO\KC081858 01.03.08 3607.00.001.001
8-5
Likes Dislikes • Loss of resources. • Negatively affects economic
development. Cost Issues
• Private system allows for free market to operate regarding costs.
• Free market and different contracts means there are cost disparities among communities. Citizens wonder why there is such a variation in cost.
• There is a perceived high cost by some citizens.
Service Issues • High quality service levels. • Citizens like frequent bulky waste
collection • Can dispose of anything you want.
• Lack of personalized service by provider (Deffenbaugh).
• HHW not convenient to use – have to make appointments, restrictions, travel to site.
Other Issues • Trash is recycled and disposed of locally. • Volume-based payment system.* • Total recycling with separation at the site.
• Current system doesn’t encourage recycling, even discourages it.
*Commercial Group Comments/Additional Notes:
• We need to know if yard waste is recycled, just how much of the waste stream is reduced. This could affect decisions about what to do about yard waste and how to educate citizens.
• Lots of people like it the way it is but don’t realize we’re in trouble. More education and awareness is needed.
• Some would like to have one hauler that does it all. • The challenge is educating residents about backyard composting.
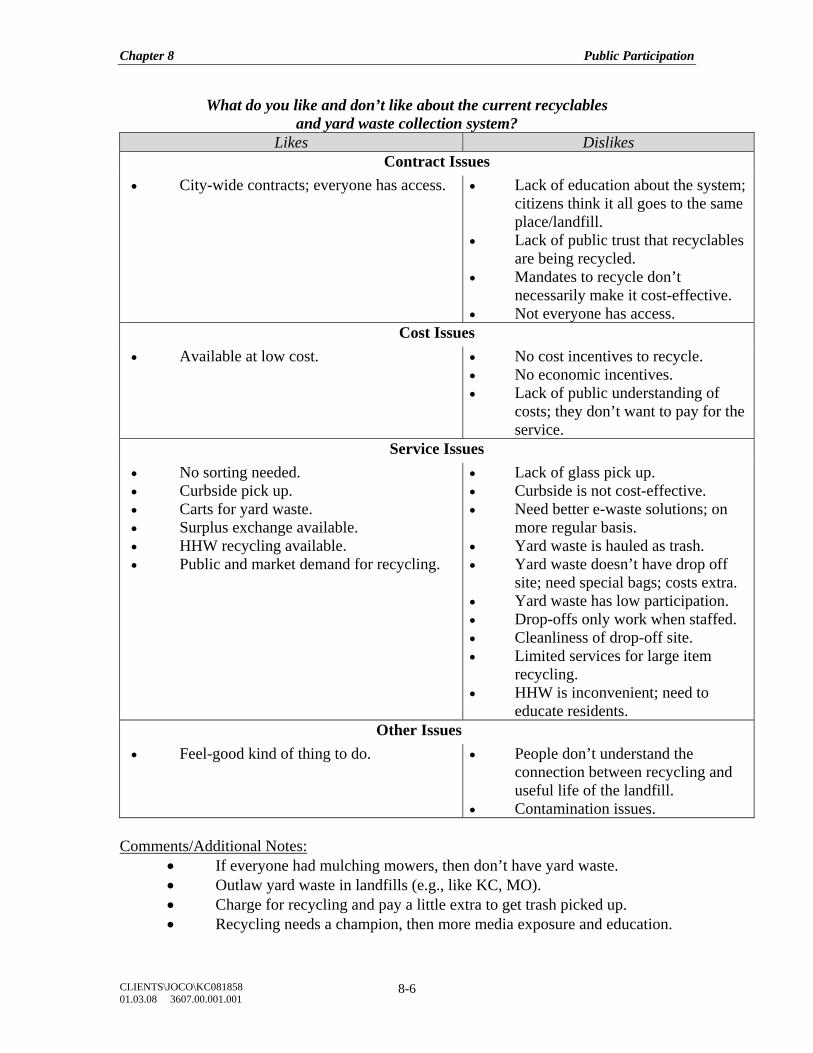
Chapter 8 Public Participation
CLIENTS\JOCO\KC081858 01.03.08 3607.00.001.001
8-6
What do you like and don’t like about the current recyclables and yard waste collection system?
Likes Dislikes Contract Issues
• City-wide contracts; everyone has access.
• Lack of education about the system; citizens think it all goes to the same place/landfill.
• Lack of public trust that recyclables are being recycled.
• Mandates to recycle don’t necessarily make it cost-effective.
• Not everyone has access. Cost Issues
• Available at low cost. • No cost incentives to recycle. • No economic incentives. • Lack of public understanding of
costs; they don’t want to pay for the service.
Service Issues • No sorting needed. • Curbside pick up. • Carts for yard waste. • Surplus exchange available. • HHW recycling available. • Public and market demand for recycling.
• Lack of glass pick up. • Curbside is not cost-effective. • Need better e-waste solutions; on
more regular basis. • Yard waste is hauled as trash. • Yard waste doesn’t have drop off
site; need special bags; costs extra. • Yard waste has low participation. • Drop-offs only work when staffed. • Cleanliness of drop-off site. • Limited services for large item
recycling. • HHW is inconvenient; need to
educate residents. Other Issues
• Feel-good kind of thing to do. • People don’t understand the connection between recycling and useful life of the landfill.
• Contamination issues. Comments/Additional Notes:
• If everyone had mulching mowers, then don’t have yard waste. • Outlaw yard waste in landfills (e.g., like KC, MO). • Charge for recycling and pay a little extra to get trash picked up. • Recycling needs a champion, then more media exposure and education.
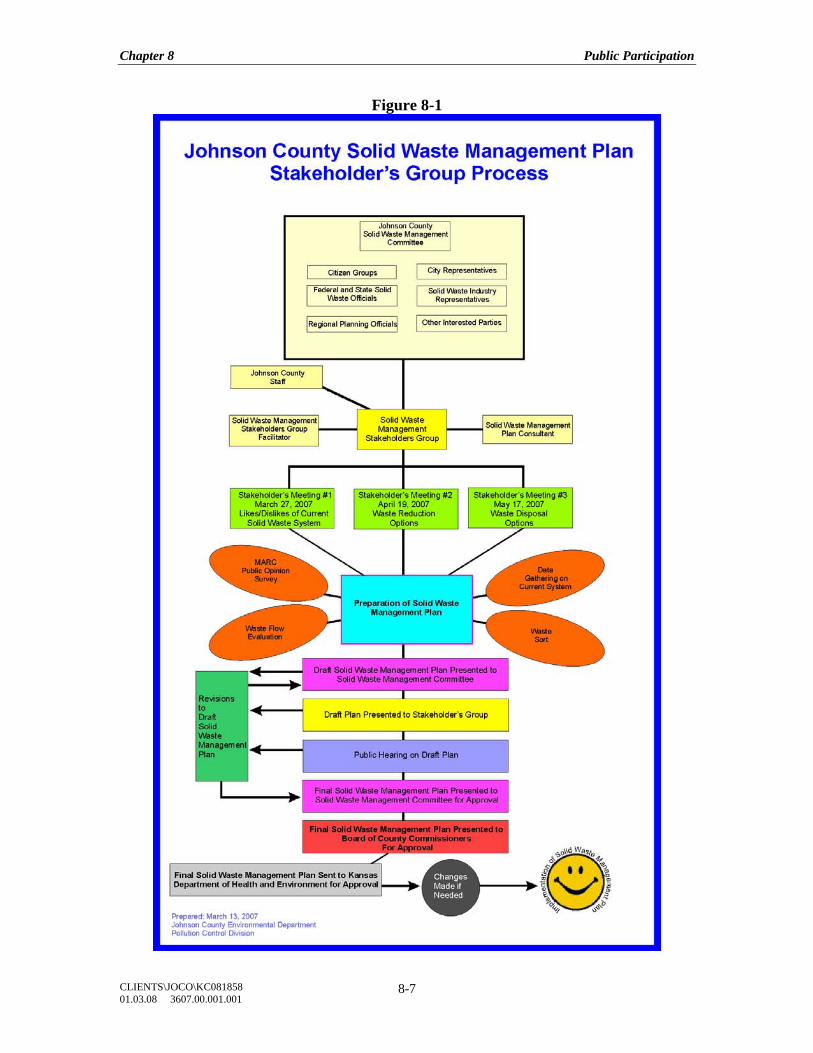
Chapter 8 Public Participation
CLIENTS\JOCO\KC081858 01.03.08 3607.00.001.001
8-7
Figure 8-1
Chapter 8 Public Participation
CLIENTS\JOCO\KC081858 01.03.08 3607.00.001.001
8-8
STAKEHOLDER GROUP SESSION 2 Session 2 Educational Presentation The second Stakeholder Group session topic was future waste reduction options. The topics covered in the educational presentation included the importance of waste reduction, composition of the solid waste disposed at the Johnson County Landfill, Inc., and various approaches for increasing waste reduction. The following waste reduction approaches were discussed in detail with examples provided.
• Public education and awareness to encourage behavioral changes • Regulatory (for example, Missouri’s landfill ban on yard waste, Oregon’s
requirement that construction and demolition debris recycling plans be submitted prior to issuing permits)
• Regulatory/Contractual (for example, mandatory pay and/or mandatory participation in curbside recycling)
• Financial incentives or disincentives (for example, pay-as-you throw (PAYT) fee structure for trash collection service)
• Special collection events or programs (for example, electronic waste and household hazardous waste collection programs)
The county’s current residential and commercial recycling rates were shared and various scenarios for increasing recycling rates in the county were presented. Additional details about the educational presentation are included in the appendices to this document. Session 2 Summary The group facilitator provided the County with a summary of the main stakeholder comments after the second session, shown below. Main ideas generated by the small breakout groups were ranked by the number of “votes” each idea received during a large group ranking activity (“dotocracy”). Each participant was given 5 sticky dots to distribute among the waste reduction ideas they thought were most important to pursue in the county. The higher the ranking shown below, the more “votes” that idea received.
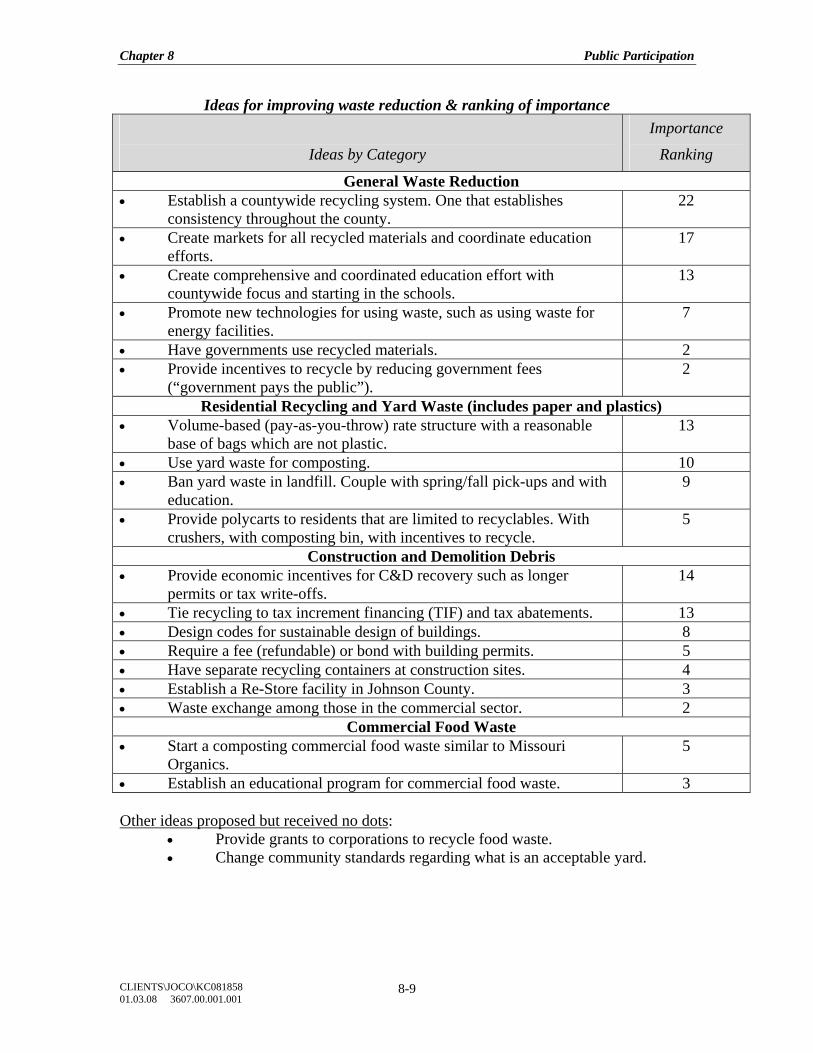
Chapter 8 Public Participation
CLIENTS\JOCO\KC081858 01.03.08 3607.00.001.001
8-9
Ideas for improving waste reduction & ranking of importance
Ideas by Category
Importance
Ranking
General Waste Reduction • Establish a countywide recycling system. One that establishes
consistency throughout the county. 22
• Create markets for all recycled materials and coordinate education efforts.
17
• Create comprehensive and coordinated education effort with countywide focus and starting in the schools.
13
• Promote new technologies for using waste, such as using waste for energy facilities.
7
• Have governments use recycled materials. 2 • Provide incentives to recycle by reducing government fees
(“government pays the public”). 2
Residential Recycling and Yard Waste (includes paper and plastics) • Volume-based (pay-as-you-throw) rate structure with a reasonable
base of bags which are not plastic. 13
• Use yard waste for composting. 10 • Ban yard waste in landfill. Couple with spring/fall pick-ups and with
education. 9
• Provide polycarts to residents that are limited to recyclables. With crushers, with composting bin, with incentives to recycle.
5
Construction and Demolition Debris • Provide economic incentives for C&D recovery such as longer
permits or tax write-offs. 14
• Tie recycling to tax increment financing (TIF) and tax abatements. 13 • Design codes for sustainable design of buildings. 8 • Require a fee (refundable) or bond with building permits. 5 • Have separate recycling containers at construction sites. 4 • Establish a Re-Store facility in Johnson County. 3 • Waste exchange among those in the commercial sector. 2
Commercial Food Waste • Start a composting commercial food waste similar to Missouri
Organics. 5
• Establish an educational program for commercial food waste. 3 Other ideas proposed but received no dots:
• Provide grants to corporations to recycle food waste. • Change community standards regarding what is an acceptable yard.
Chapter 8 Public Participation
CLIENTS\JOCO\KC081858 01.03.08 3607.00.001.001
8-10
Comments/Additional Notes: • Focus on economics – incentives, markets. • Focus on small businesses as well as large. • We need a better understanding of the total costs to recycle, not just the
cost to pick up and sort. • Focus and educate about the total benefits. • Distinguish between commercial and residential waste reduction. The
costs and incentives may be different. • Make it simple. • We need to communicate the sense of urgency. • Land disposal
STAKEHOLDER GROUP SESSION 3 Session 3 Educational Presentation The third and final Stakeholder Group session covered two topics: 1) Future solid waste management disposal options and 2) The roles of the various public and private parties and opportunities for collaboration. Future solid waste management disposal options. During the educational presentation, the stakeholders were given a review of the existing regional solid waste management disposal infrastructure, and were reminded that the County must account for diminishing landfill capacity in the county while pursuing future disposal options that are both economical and environmentally responsible. The pros and cons of the various potential disposal options were presented to the stakeholders. In addition, example economics from other locations were provided. Additional details about the educational presentation are included in the appendices to this document. The future disposal options for the County discussed in Session 3 included the following:
• Land disposal • Transfer stations • Over-the-road haul • Rail haul • Combustion (waste-to-energy and dedicated units) • Conversion technologies (thermo, chemical, and biochemical)
The roles of the various public and private parties and opportunities for collaboration. In preparing to discuss the second topic for Session 3, the stakeholders were reminded of their top three ideas for reducing waste in general:
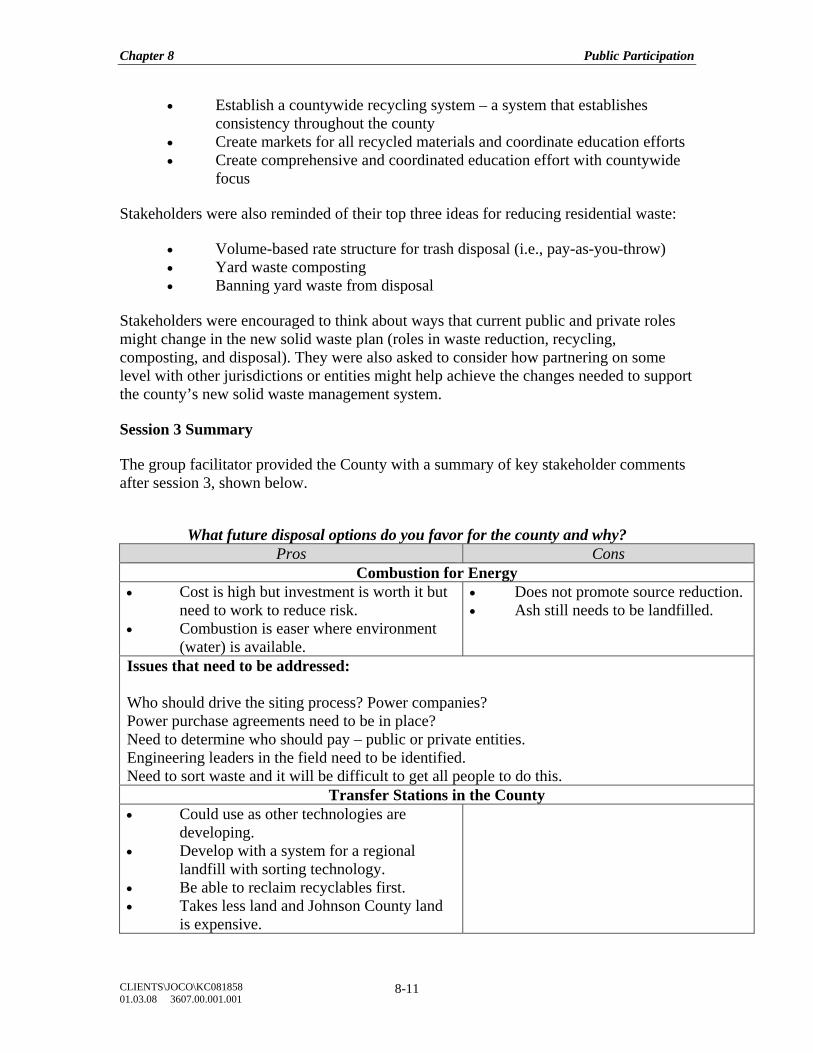
Chapter 8 Public Participation
CLIENTS\JOCO\KC081858 01.03.08 3607.00.001.001
8-11
• Establish a countywide recycling system – a system that establishes consistency throughout the county
• Create markets for all recycled materials and coordinate education efforts • Create comprehensive and coordinated education effort with countywide
focus Stakeholders were also reminded of their top three ideas for reducing residential waste:
• Volume-based rate structure for trash disposal (i.e., pay-as-you-throw) • Yard waste composting • Banning yard waste from disposal
Stakeholders were encouraged to think about ways that current public and private roles might change in the new solid waste plan (roles in waste reduction, recycling, composting, and disposal). They were also asked to consider how partnering on some level with other jurisdictions or entities might help achieve the changes needed to support the county’s new solid waste management system. Session 3 Summary The group facilitator provided the County with a summary of key stakeholder comments after session 3, shown below.
What future disposal options do you favor for the county and why? Pros Cons
Combustion for Energy • Cost is high but investment is worth it but
need to work to reduce risk. • Combustion is easer where environment
(water) is available.
• Does not promote source reduction. • Ash still needs to be landfilled.
Issues that need to be addressed: Who should drive the siting process? Power companies? Power purchase agreements need to be in place? Need to determine who should pay – public or private entities. Engineering leaders in the field need to be identified. Need to sort waste and it will be difficult to get all people to do this.
Transfer Stations in the County • Could use as other technologies are
developing. • Develop with a system for a regional
landfill with sorting technology. • Be able to reclaim recyclables first. • Takes less land and Johnson County land
is expensive.
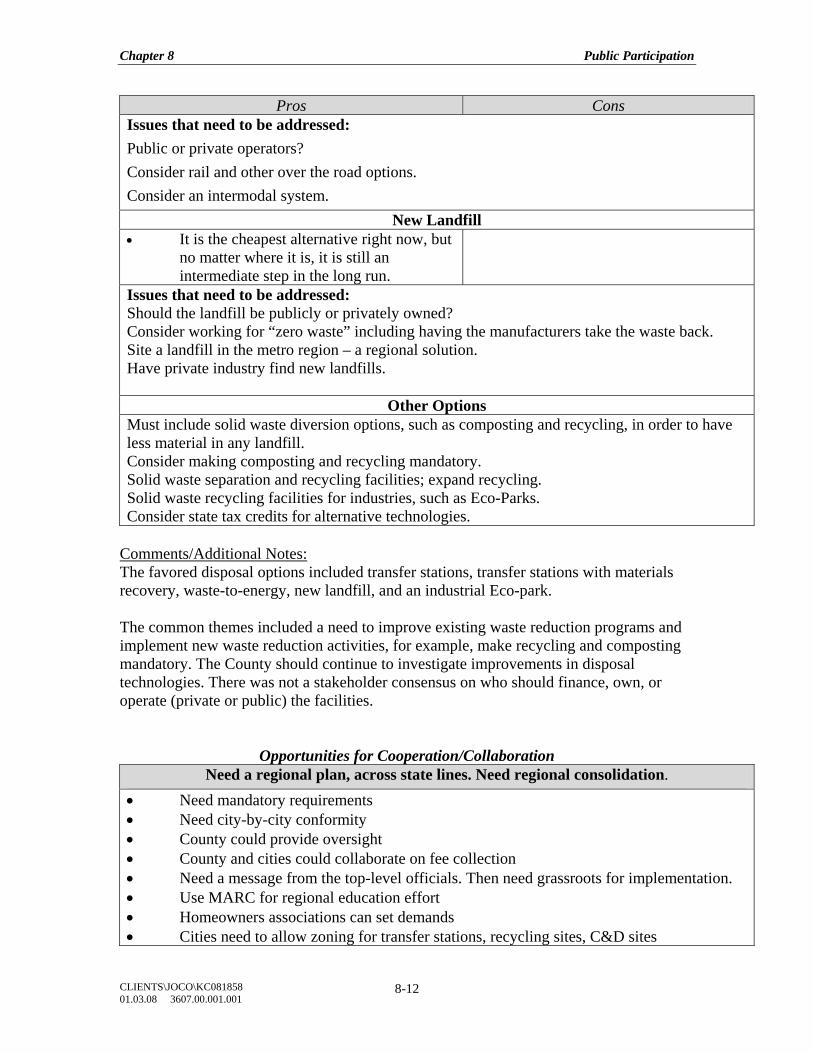
Chapter 8 Public Participation
CLIENTS\JOCO\KC081858 01.03.08 3607.00.001.001
8-12
Pros Cons Issues that need to be addressed: Public or private operators? Consider rail and other over the road options. Consider an intermodal system.
New Landfill • It is the cheapest alternative right now, but
no matter where it is, it is still an intermediate step in the long run.
Issues that need to be addressed: Should the landfill be publicly or privately owned? Consider working for “zero waste” including having the manufacturers take the waste back. Site a landfill in the metro region – a regional solution. Have private industry find new landfills.
Other Options Must include solid waste diversion options, such as composting and recycling, in order to have less material in any landfill. Consider making composting and recycling mandatory. Solid waste separation and recycling facilities; expand recycling. Solid waste recycling facilities for industries, such as Eco-Parks. Consider state tax credits for alternative technologies.
Comments/Additional Notes: The favored disposal options included transfer stations, transfer stations with materials recovery, waste-to-energy, new landfill, and an industrial Eco-park. The common themes included a need to improve existing waste reduction programs and implement new waste reduction activities, for example, make recycling and composting mandatory. The County should continue to investigate improvements in disposal technologies. There was not a stakeholder consensus on who should finance, own, or operate (private or public) the facilities.
Opportunities for Cooperation/Collaboration Need a regional plan, across state lines. Need regional consolidation.
• Need mandatory requirements • Need city-by-city conformity • County could provide oversight • County and cities could collaborate on fee collection • Need a message from the top-level officials. Then need grassroots for implementation. • Use MARC for regional education effort • Homeowners associations can set demands • Cities need to allow zoning for transfer stations, recycling sites, C&D sites
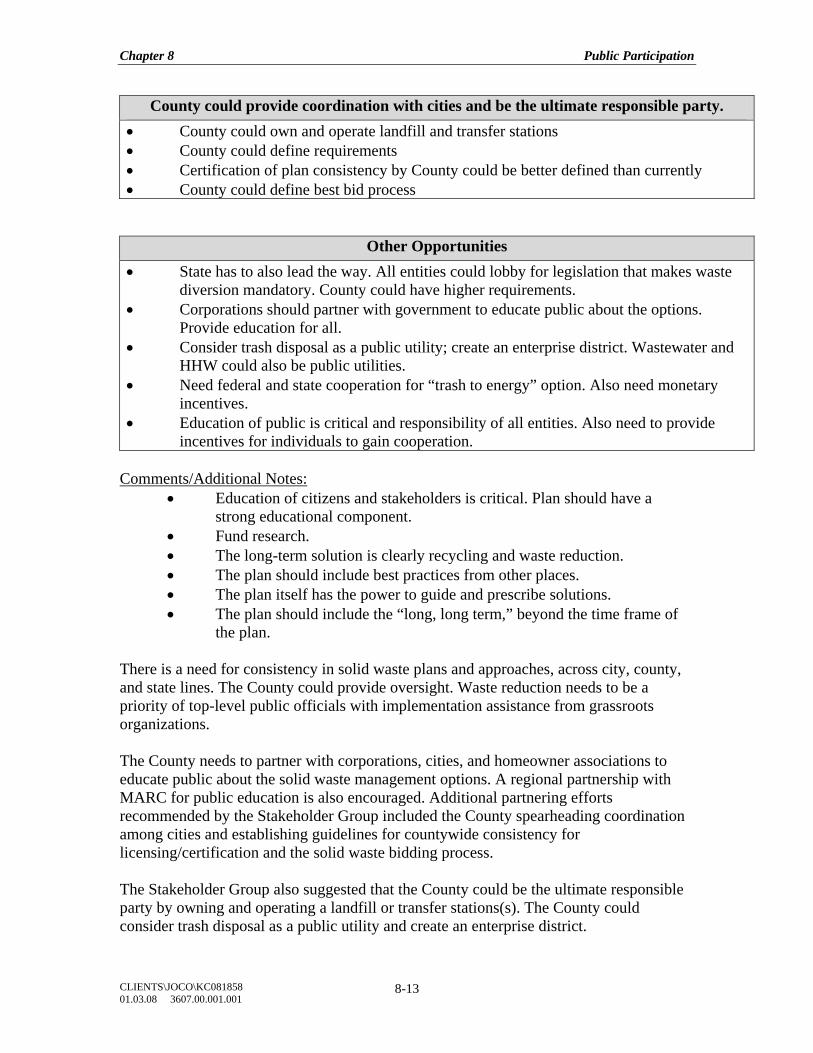
Chapter 8 Public Participation
CLIENTS\JOCO\KC081858 01.03.08 3607.00.001.001
8-13
County could provide coordination with cities and be the ultimate responsible party. • County could own and operate landfill and transfer stations • County could define requirements • Certification of plan consistency by County could be better defined than currently • County could define best bid process
Other Opportunities • State has to also lead the way. All entities could lobby for legislation that makes waste
diversion mandatory. County could have higher requirements. • Corporations should partner with government to educate public about the options.
Provide education for all. • Consider trash disposal as a public utility; create an enterprise district. Wastewater and
HHW could also be public utilities. • Need federal and state cooperation for “trash to energy” option. Also need monetary
incentives. • Education of public is critical and responsibility of all entities. Also need to provide
incentives for individuals to gain cooperation. Comments/Additional Notes:
• Education of citizens and stakeholders is critical. Plan should have a strong educational component.
• Fund research. • The long-term solution is clearly recycling and waste reduction. • The plan should include best practices from other places. • The plan itself has the power to guide and prescribe solutions. • The plan should include the “long, long term,” beyond the time frame of
the plan. There is a need for consistency in solid waste plans and approaches, across city, county, and state lines. The County could provide oversight. Waste reduction needs to be a priority of top-level public officials with implementation assistance from grassroots organizations. The County needs to partner with corporations, cities, and homeowner associations to educate public about the solid waste management options. A regional partnership with MARC for public education is also encouraged. Additional partnering efforts recommended by the Stakeholder Group included the County spearheading coordination among cities and establishing guidelines for countywide consistency for licensing/certification and the solid waste bidding process. The Stakeholder Group also suggested that the County could be the ultimate responsible party by owning and operating a landfill or transfer stations(s). The County could consider trash disposal as a public utility and create an enterprise district.
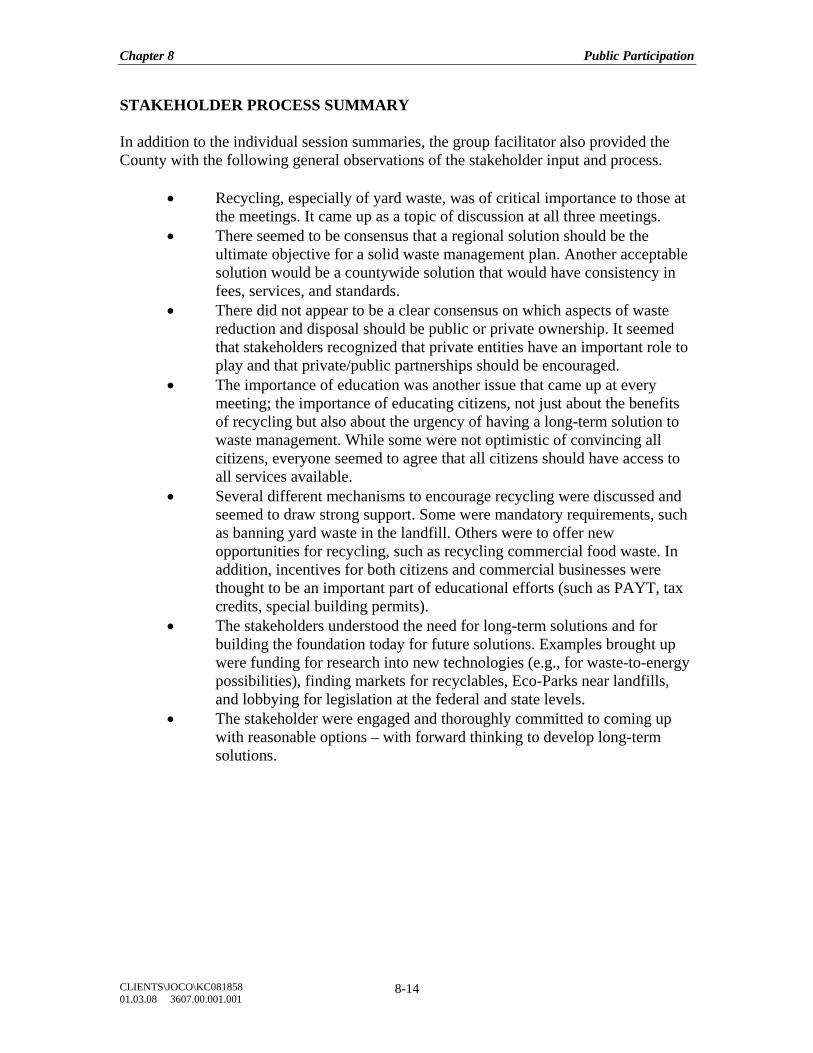
Chapter 8 Public Participation
CLIENTS\JOCO\KC081858 01.03.08 3607.00.001.001
8-14
STAKEHOLDER PROCESS SUMMARY In addition to the individual session summaries, the group facilitator also provided the County with the following general observations of the stakeholder input and process.
• Recycling, especially of yard waste, was of critical importance to those at the meetings. It came up as a topic of discussion at all three meetings.
• There seemed to be consensus that a regional solution should be the ultimate objective for a solid waste management plan. Another acceptable solution would be a countywide solution that would have consistency in fees, services, and standards.
• There did not appear to be a clear consensus on which aspects of waste reduction and disposal should be public or private ownership. It seemed that stakeholders recognized that private entities have an important role to play and that private/public partnerships should be encouraged.
• The importance of education was another issue that came up at every meeting; the importance of educating citizens, not just about the benefits of recycling but also about the urgency of having a long-term solution to waste management. While some were not optimistic of convincing all citizens, everyone seemed to agree that all citizens should have access to all services available.
• Several different mechanisms to encourage recycling were discussed and seemed to draw strong support. Some were mandatory requirements, such as banning yard waste in the landfill. Others were to offer new opportunities for recycling, such as recycling commercial food waste. In addition, incentives for both citizens and commercial businesses were thought to be an important part of educational efforts (such as PAYT, tax credits, special building permits).
• The stakeholders understood the need for long-term solutions and for building the foundation today for future solutions. Examples brought up were funding for research into new technologies (e.g., for waste-to-energy possibilities), finding markets for recyclables, Eco-Parks near landfills, and lobbying for legislation at the federal and state levels.
• The stakeholder were engaged and thoroughly committed to coming up with reasonable options – with forward thinking to develop long-term solutions.
Chapter 9 Johnson County Potential Solid Waste Management Measures, Strategies, and Scenarios
CLIENTS\JOCO\KC081858 01.03.08 3607.00.001.001
9-1
CHAPTER 9
JOHNSON COUNTY POTENTIAL SOLID WASTE MANAGEMENT MEASURES, STRATEGIES, AND SCENARIOS
INTRODUCTION House Bill (HB) 2801, enacted in 1992, amended Kansas Statute and provides for the safe and sanitary disposal of solid wastes in the state. HB 2801 also requires that counties, through their Solid Waste Management Plans (SWMP), establish future solid waste management goals and “establish a schedule for the reduction of waste volumes taking into consideration the following: (A) source reduction; (B) reuse, recycling, composting; and (C) land disposal.” In 2005, approximately 23 percent of the municipal solid waste (MSW) generated in the county was being recovered for recycling and composting, with 77 percent being landfilled. Further analysis, on a sector basis, indicates that 15 percent of the residential MSW waste stream and 30 percent of the commercial MSW waste stream were recovered for recycling and composting. In addition to waste reduction, the County is required by Kansas Statute to consider other solid waste management (SWM) issues including:
• Assurance of long-term disposal capacity for solid waste generated in the county.
• The County’s role in waste management activities including waste collection, recycling, composting, and disposal, and the monitoring of these activities.
Measures and strategies that are available to address these state requirements are presented below, along with several scenarios intended to illustrate the potential impact of implementing these strategies in Johnson County. The County’s ability to provide for adequate and affordable long-term disposal capacity for county-generated wastes will be largely influenced by the County’s success in significantly reducing county-generated wastes. SOLID WASTE REDUCTION Diverting solid waste from disposal may be accomplished through source reduction, recycling, and/or composting activities. Research shows that waste diversion is usually less expensive in the long run than waste disposal, especially if life cycle costs of the materials from “cradle to cradle” are considered. Potential waste reduction measures followed by possible strategies for implementing these measures and an illustration of the impact that these reduction strategies might have on the countywide recovery rate are discussed in this section.
Chapter 9 Johnson County Potential Solid Waste Management Measures, Strategies, and Scenarios
CLIENTS\JOCO\KC081858 01.03.08 3607.00.001.001
9-2
Source reduction decreases the amount of wastes before they enter the municipal solid waste management system. Some source reduction measures such as mandatory manufacturer packaging restrictions will require federal or state action to be effective. However, source reduction measures that can be implemented at the local level include the following:
• Reusing items: e.g., donating clothing, appliances, etc., to charitable organizations; selling used books; copying on both sides of paper sheets; reusing grocery bags; etc.
• Substituting reusable products for throwaway products such as cups, plates, and other eating utensils; substituting reusable cloth bags for retailer plastic or paper bags.
• Purchasing products with less volume and longer useful life. • Purchasing products in bulk (large) quantities, in concentrated form or,
where available, in reusable containers that can be refilled to minimize packaging waste.
• Requesting discontinuance of unwanted mail. • Promoting reuse outlets for household furnishings and building materials:
e.g., “swap shops”, Surplus Exchange, Habitat for Humanity ReStore. • Managing yard waste on-site; e.g., backyard composting of leaves and/or
grass clippings, or alternatively, leaving grass clippings on the lawn. The single most effective source reduction measure at the local level is management of yard waste on-site. Leaving all grass clippings on the lawns would reduce MSW generation in the county by an estimated 5 percent. Specific strategies to achieve source reduction through the measures listed above may include any or all of the following:
• Provide public information and education programs to explain and promote source reduction measures.
• Provide residents access to backyard composting bins at a reduced cost. • Provide expansion or siting assistance to non-profit and/or private reuse
outlets. • Incorporate incentives into the building permit process to encourage
renovation and demolition contractors to practice deconstruction and utilize reuse outlets.
• Ban some or all yard waste from landfills. • Implement volume-based fee structures (i.e., pay-as-you-throw) on wastes
collected for disposal. Increasing recycling and composting in the county would also reduce the amount of solid wastes disposed. Extending separate curbside collection of both recyclables and yard waste to all residents of the incorporated cities in the county would reduce county-generated MSW remaining for disposal.
Chapter 9 Johnson County Potential Solid Waste Management Measures, Strategies, and Scenarios
CLIENTS\JOCO\KC081858 01.03.08 3607.00.001.001
9-3
Additional drop-off centers strategically located to accept recyclable materials from households in the unincorporated area, multi-family household units, and/or small commercial establishments would increase recovery. Promoting and expanding recovery of recyclable materials from the large and medium size commercial sector within the county would also reduce the waste remaining for disposal. Measures to increase recycling and composting levels in the county might include any or all of the following:
• Extending curbside collection of recyclable materials to all single-family households in the incorporated cities of the county.
• Extending curbside collection of yard waste for composting to all single-family households in the incorporated cities of the county.
• Providing additional drop-off recycling centers for residents in the unincorporated areas and multi-family units.
• Expanding existing commercial recycling infrastructure to all commercial establishments.
• Promoting recycling in small commercial establishments. • Extending recycling options for public events and public spaces. • Encouraging residential and commercial participation in recycling
programs through mandatory pay options. Requiring everyone to pay for recycling will promote participation.
• Encouraging residential and commercial participation in recycling programs through mandatory participation regulations.
• Implementing volume-based fee structures (i.e., pay-as-you-throw) on wastes collected for disposal. This measure will also affect waste reduction.
• Banning certain recyclables from residential and commercial disposal (e.g., old newspapers (ONP), aluminum cans, polyethylene terephthalate (PET), high-density polyethylene (HDPE), old corrugated containers (OCC), yard waste, consumer electronics, etc.). Alternatives would need to be found for these materials.
• Requiring recovery of construction and demolition debris (C&D). Currently limited infrastructure exists for the processing and recovery of C&D debris in the county.
Specific strategies to achieve waste reduction through the recycling and composting measures listed above may include any or all of the following:
• Provide aggressive public information and education programs to explain and promote recycling and composting in the county. Partner with cities and the state to provide public information. The household hazardous
Chapter 9 Johnson County Potential Solid Waste Management Measures, Strategies, and Scenarios
CLIENTS\JOCO\KC081858 01.03.08 3607.00.001.001
9-4
waste promotional campaign that builds on KDH&E’s “Get Caught Recycling”30 program is an example of such partnering.
• Coordinate efforts among the cities and homeowners associations to provide a similar level of solid waste, recycling, and yard waste collection services to all residents.
• Provide technical guidance and assistance to cities and homeowners associations to increase materials recovery and composting.
• Develop a measurement system to track recycling and composting rates. Monitor the recently opened City of Overland Park drop-off site to evaluate the potential impacts of a site with expanded services in the county.
• Establish a voluntary recycling goal. Setting a county goal of reaching, at a minimum, the national recycling average will allow the county to compare itself with the rest of the nation. The national MSW residential and commercial rate was 32 percent in 2005.31
• Work with solid waste haulers to increase participation of single-family residents in the curbside recycling and yard waste programs. Strive for a consistent fee structure that would include the cost of curbside recycling and/or yard waste collection. Providing curbside recycling and yard waste services to all residents may increase participation.
• Promote the use of larger or multiple recycling containers by residents. A resident participating in the curbside collection of recyclables may dispose of recyclable materials in the trash if the capacity of the recycling container is insufficient.
• Promote existing recycling infrastructure, including central drop-off centers as well as individual material collection points such as retail stores that accept plastic bags for recycling.
• Work with solid waste haulers to identify and reduce the barriers to increased recycling options for small, medium, and large size commercial establishments.
• Work with commercial establishments to initiate or improve on-the-job recycling.
• Partner with Keep Kansas City Beautiful to promote away-from-home recycling through the “Green & Litter-free Events”32 program. Public event recycling will increase recovery of recyclable materials as well as serve to educate the public about recycling.
• Work with haulers, cities and homeowners associations to implement a countywide volume-based fee structure (i.e., pay-as-you-throw or PAYT) for residential trash collection. PAYT provides an economic incentive to maximize the materials recovered through the curbside recyclables and
30 http://www.getcaughtrecycling.org 31 U.S. Environmental Protection Agency. Municipal Solid Waste Generation, Recycling, and Disposal in
the United States: 2005 Facts and Figures. http://www.epa.gov/epaoswer/non-hw/muncpl/msw99.htm 32 http://www.bridgingthegap.org/PROGRAMS/kkcb/KKCBPrograms.htm
Chapter 9 Johnson County Potential Solid Waste Management Measures, Strategies, and Scenarios
CLIENTS\JOCO\KC081858 01.03.08 3607.00.001.001
9-5
yard waste collection programs by “rewarding” those who reduce the amount of trash placed curbside for disposal with lower trash fees.
• Investigate other economic incentive measures to increase residential participation such as RecycleBank or distributing coupons to participating households.
• Work with cities and homeowners associations to develop a countywide collection program for consumer electronics or other solutions such as city/county contracts with computer suppliers to take back surplused electronics as part of their contract. The County’s household hazardous collection program will be expanded in 2008 to allow residents to drop-off consumer electronics.
• Work with private industry to identify the barriers to construction and demolition debris recovery.
• Encourage recyclable and composting market development through revision of County purchasing policies; work with cities to do the same.
• Ban yard waste and/or other recyclable materials from landfilling. The potential impact of recycling and composting reduction strategies on the MSW recovery rate is illustrated in the following scenarios. Estimated recovery of MSW recyclables and yard wastes in the county with additional residential curbside collection programs and participation is shown in Tables 9-1 and 9-2. Table 9-3 shows changes to the countywide recovery rate if only the commercial sector recycling rate is increased. Finally, Table 9-4 combines scenarios from the other three tables to illustrate two aggressive recovery scenarios. The tables reflect MSW recovery as a percent of MSW generation based on 2005 estimates. These tables assume that all households in the incorporated cities would have access to separate curbside collection of recyclables and yard wastes for composting. Currently, 96 percent of the county residents living in incorporated cities have access to curbside collection of recyclable materials, but only about 38 percent participate. About 30 percent of city residents have access to separate collection of yard waste through city or subdivision contracts. In addition, Overland Park residents can receive curbside yard waste collection for composting by subscribing to the service through a private hauler. Recovered residential and commercial recyclable materials and yard waste collected for composting are first shown at current levels (Baseline Scenario). A series of scenarios depicting increased residential service and participation follows in Table 9-1. Scenario 1 assumes 100 percent of the residents in the incorporated cities have access to curbside collection of recyclables materials at the current participation rate of 38 percent. The second and third scenarios reflect an increase in participation to 50 percent and 90 percent. Scenario 1 shows increasing the curbside service level to 100 percent of residents in the incorporated cities does not change the overall county recovery rate; however, this sets the foundation for the following scenarios.
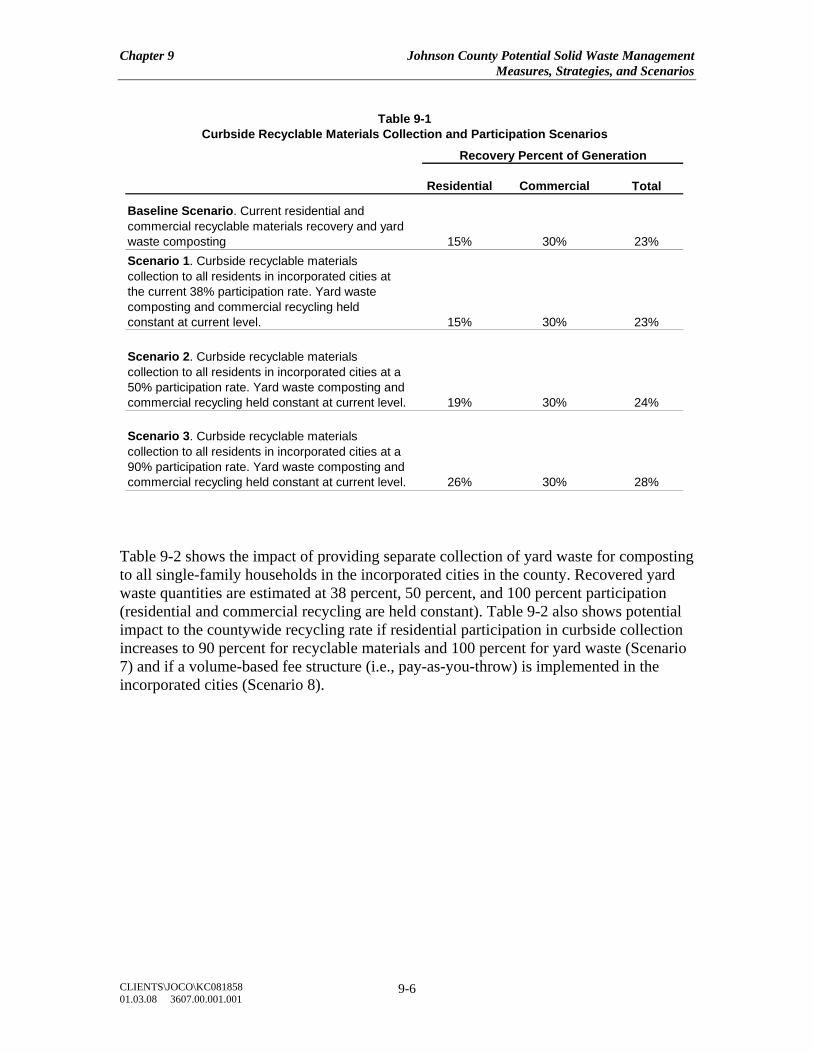
Chapter 9 Johnson County Potential Solid Waste Management Measures, Strategies, and Scenarios
CLIENTS\JOCO\KC081858 01.03.08 3607.00.001.001
9-6
Residential Commercial Total
15% 30% 23%
15% 30% 23%
19% 30% 24%
26% 30% 28%
Scenario 1. Curbside recyclable materials collection to all residents in incorporated cities at the current 38% participation rate. Yard waste composting and commercial recycling held constant at current level.
Scenario 2. Curbside recyclable materials collection to all residents in incorporated cities at a 50% participation rate. Yard waste composting and commercial recycling held constant at current level.
Scenario 3. Curbside recyclable materials collection to all residents in incorporated cities at a 90% participation rate. Yard waste composting and commercial recycling held constant at current level.
Table 9-1Curbside Recyclable Materials Collection and Participation Scenarios
Recovery Percent of Generation
Baseline Scenario. Current residential and commercial recyclable materials recovery and yard waste composting
Table 9-2 shows the impact of providing separate collection of yard waste for composting to all single-family households in the incorporated cities in the county. Recovered yard waste quantities are estimated at 38 percent, 50 percent, and 100 percent participation (residential and commercial recycling are held constant). Table 9-2 also shows potential impact to the countywide recycling rate if residential participation in curbside collection increases to 90 percent for recyclable materials and 100 percent for yard waste (Scenario 7) and if a volume-based fee structure (i.e., pay-as-you-throw) is implemented in the incorporated cities (Scenario 8).
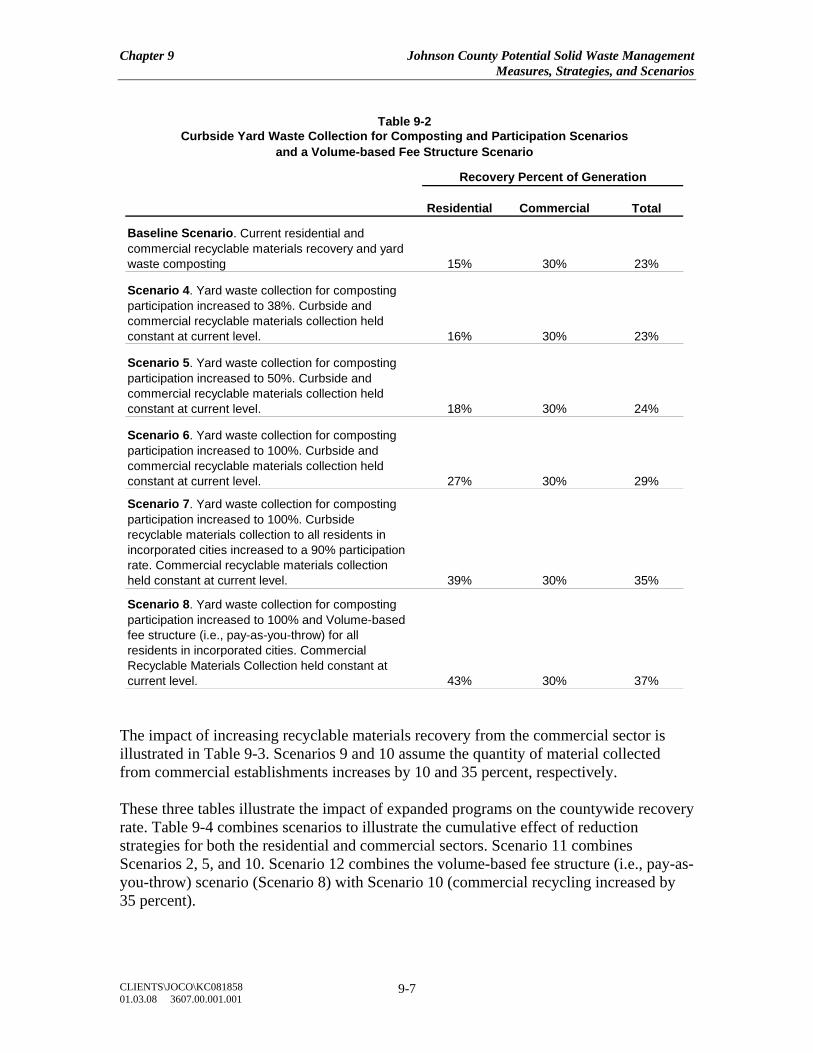
Chapter 9 Johnson County Potential Solid Waste Management Measures, Strategies, and Scenarios
CLIENTS\JOCO\KC081858 01.03.08 3607.00.001.001
9-7
Residential Commercial Total
15% 30% 23%
16% 30% 23%
18% 30% 24%
27% 30% 29%
39% 30% 35%
43% 30% 37%
Baseline Scenario. Current residential and commercial recyclable materials recovery and yard waste composting
Recovery Percent of Generation
Table 9-2Curbside Yard Waste Collection for Composting and Participation Scenarios
and a Volume-based Fee Structure Scenario
Scenario 6. Yard waste collection for composting participation increased to 100%. Curbside and commercial recyclable materials collection held constant at current level.
Scenario 4. Yard waste collection for composting participation increased to 38%. Curbside and commercial recyclable materials collection held constant at current level.
Scenario 7. Yard waste collection for composting participation increased to 100%. Curbside recyclable materials collection to all residents in incorporated cities increased to a 90% participation rate. Commercial recyclable materials collection held constant at current level.
Scenario 8. Yard waste collection for composting participation increased to 100% and Volume-based fee structure (i.e., pay-as-you-throw) for all residents in incorporated cities. Commercial Recyclable Materials Collection held constant at current level.
Scenario 5. Yard waste collection for composting participation increased to 50%. Curbside and commercial recyclable materials collection held constant at current level.
The impact of increasing recyclable materials recovery from the commercial sector is illustrated in Table 9-3. Scenarios 9 and 10 assume the quantity of material collected from commercial establishments increases by 10 and 35 percent, respectively. These three tables illustrate the impact of expanded programs on the countywide recovery rate. Table 9-4 combines scenarios to illustrate the cumulative effect of reduction strategies for both the residential and commercial sectors. Scenario 11 combines Scenarios 2, 5, and 10. Scenario 12 combines the volume-based fee structure (i.e., pay-as-you-throw) scenario (Scenario 8) with Scenario 10 (commercial recycling increased by 35 percent).
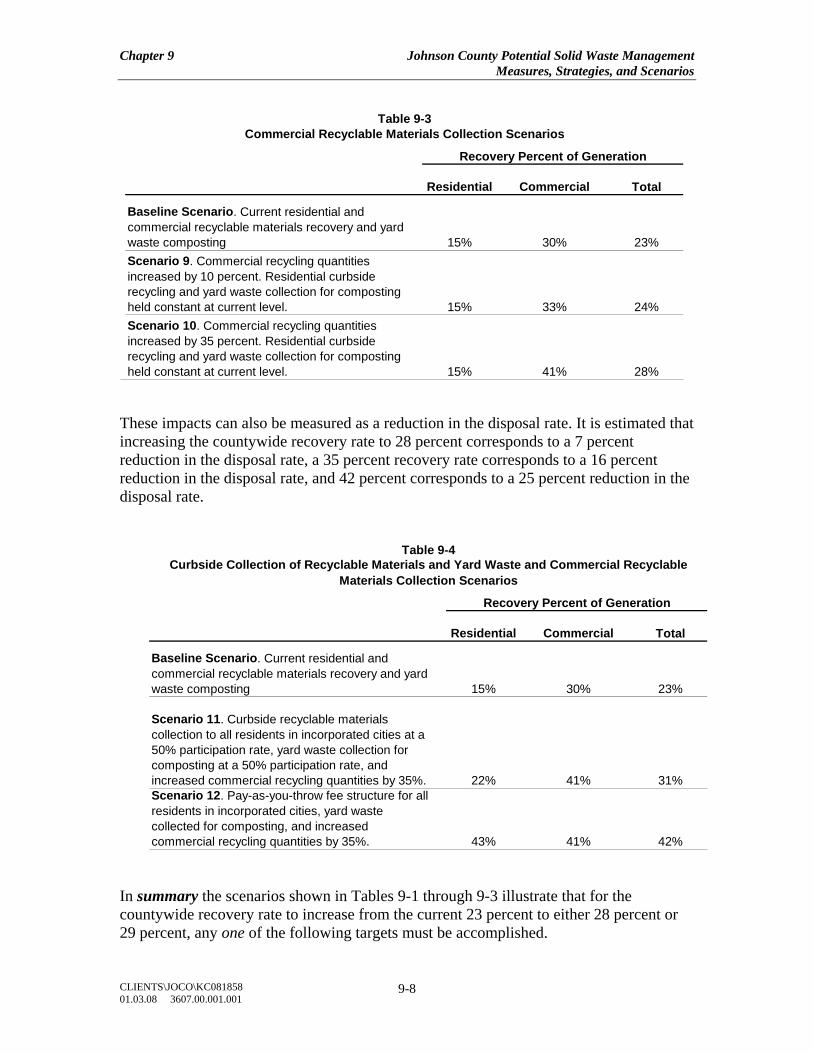
Chapter 9 Johnson County Potential Solid Waste Management Measures, Strategies, and Scenarios
CLIENTS\JOCO\KC081858 01.03.08 3607.00.001.001
9-8
Residential Commercial Total
15% 30% 23%
15% 33% 24%
15% 41% 28%
Commercial Recyclable Materials Collection Scenarios
Recovery Percent of Generation
Baseline Scenario. Current residential and commercial recyclable materials recovery and yard waste compostingScenario 9. Commercial recycling quantities increased by 10 percent. Residential curbside recycling and yard waste collection for composting held constant at current level.Scenario 10. Commercial recycling quantities increased by 35 percent. Residential curbside recycling and yard waste collection for composting held constant at current level.
Table 9-3
These impacts can also be measured as a reduction in the disposal rate. It is estimated that increasing the countywide recovery rate to 28 percent corresponds to a 7 percent reduction in the disposal rate, a 35 percent recovery rate corresponds to a 16 percent reduction in the disposal rate, and 42 percent corresponds to a 25 percent reduction in the disposal rate.
Residential Commercial Total
15% 30% 23%
22% 41% 31%
43% 41% 42%
Scenario 11. Curbside recyclable materials collection to all residents in incorporated cities at a 50% participation rate, yard waste collection for composting at a 50% participation rate, and increased commercial recycling quantities by 35%.Scenario 12. Pay-as-you-throw fee structure for all residents in incorporated cities, yard waste collected for composting, and increased commercial recycling quantities by 35%.
Table 9-4
Recovery Percent of Generation
Baseline Scenario. Current residential and commercial recyclable materials recovery and yard waste composting
Curbside Collection of Recyclable Materials and Yard Waste and Commercial Recyclable Materials Collection Scenarios
In summary the scenarios shown in Tables 9-1 through 9-3 illustrate that for the countywide recovery rate to increase from the current 23 percent to either 28 percent or 29 percent, any one of the following targets must be accomplished.
Chapter 9 Johnson County Potential Solid Waste Management Measures, Strategies, and Scenarios
CLIENTS\JOCO\KC081858 01.03.08 3607.00.001.001
9-9
• Increase participation in residential curbside collection of recyclable materials to
90 percent; or • Increase participation in residential curbside collection of yard waste for
composting to 100 percent; or • Increase recovered quantities from the commercial sector by 35 percent.
To increase the countywide recovery rate above 28 to 29 percent, a combination of these targets would be required. As shown in Table 9-4, increasing residential participation in curbside recyclables and yard waste collection to 50 percent and increasing the quantities of recovered materials from the commercial sector by 35 percent increases the overall countywide recovery rate to 31 percent. If a volume-based (i.e., pay-as-you-throw) fee structure is implemented for residential solid waste collection, yard waste is collected curbside for composting, and commercial recycling quantities are increased by 35 percent, the countywide recovery rate could potentially rise to 42 percent. LONG-TERM DISPOSAL CAPACITY Despite the potential through recycling and composting for reducing the county’s solid waste, there will still remain a significant need for disposal options. The Johnson County Landfill, Inc., the only landfill in the county licensed to accept MSW, will close no later than 2027 per condition of a special use permit from the City of Shawnee. Construction of the final disposal cell was initiated in 2007. Assuming that current disposal rates do not grow in future years (i.e., the number of tons per day disposed at the landfill stays the same), the Johnson County Landfill, Inc. has permitted capacity to remain open until 2023. Again, assuming steady disposal rates, the life of the landfill could be extended to 2027 if additional capacity is permitted as planned. However, if population and consumption continue to grow, the landfill life may be shortened. If future disposal rates increase by 2.0 percent per year, the permitted capacity of the landfill will be exhausted by the end of 2021 (or two years sooner). Any number of other factors could affect these projections, up or down. In addition to the Johnson County Landfill, several landfills in the county are licensed to accept certain non-MSW wastes—primarily construction and demolition debris (C&D). The Johnson County Landfill reported accepting the largest tonnage of C&D debris (195,000 tons in 2005). The largest of the dedicated C&D landfills, owned by APAC-Reno Construction Company, received 115,000 tons in 2005. This landfill has reached its permitted capacity. A pending expansion permit application, if approved, would extend capacity another 7 to 14 years. Additionally, O’Donnell & Sons, Holland Corporation, and Asphalt Sales received 104,000, 88,000 and 36,000 tons of C&D debris respectively in 2005. Based on current permits, these three C&D landfills have between 10 and 25 years of capacity life left. Future expansion permits may extend the life of the C&D landfills beyond current permit limits. The cities of Olathe and Overland Park own C&D landfills that accept waste from city-government generated activities only.
Chapter 9 Johnson County Potential Solid Waste Management Measures, Strategies, and Scenarios
CLIENTS\JOCO\KC081858 01.03.08 3607.00.001.001
9-10
The long-term availability of MSW disposal capacity is clearly the greatest concern to the County. When the privately owned Johnson County Landfill closes, the county’s MSW will have to be disposed outside the county unless another disposal alternative is developed within Johnson County. The County’s ability to provide for adequate and affordable disposal capacity when the Johnson County Landfill closes will be largely influenced by the degree to which the County is successful in reducing county-generated MSW. In response to this concern, alternatives for disposal of county-generated MSW have been reviewed. Measures to ensure long-term MSW disposal capacity might include any or all of the following:
• Increasing MSW source reduction and diversion through recycling and composting.
• Implementing product specific disposal bans such as yard waste or recyclable products.
• Processing MSW in a mixed waste processing facility to recover recyclable materials. This measure would require a disposal option for the process residue. The process residue can also be composted or shredded for combustion.
• Processing MSW by composting the mixed waste stream. This measure may require a disposal option for process residue. Markets for the MSW composting end product would need to be evaluated.
• Transferring MSW to landfill disposal outside the county. This measure would likely require additional transfer stations in the county.
• Disposing of MSW in a new landfill located in the county. • Disposing of MSW by siting a new waste-to-energy combustion facility to
produce energy for the electrical grid or dedicated combustion units to produce energy for a single customer.
• Disposing of MSW by siting a new facility(ies) that use alternative conversion technologies such as thermochemical and biochemical systems.
Specific strategies to ensure long-term MSW disposal capacity through the measures listed above may include any or all of the following:
• Explore disposal of county waste at regional landfills. • Initiate a dialogue with private waste haulers and landfill owners on
possible options. • Engage city leaders and homeowners associations in a discussion of future
disposal needs and provide technical assistance to increase diversion of both residential and commercial waste.
Chapter 9 Johnson County Potential Solid Waste Management Measures, Strategies, and Scenarios
CLIENTS\JOCO\KC081858 01.03.08 3607.00.001.001
9-11
• Provide for targeted public education and input through a stakeholder process to emphasize the need for more aggressive waste reduction measures and future disposal options.
• Develop and administer a general public educational campaign to inform the citizens of the need for waste reduction and new disposal options.
• Monitor regional activity through MARC, surrounding counties, and the private sector.
• Conduct feasibility studies on selected options such as transfer stations and central processing facilities.
• Explore ways for Johnson County to exert more control over disposal capacity for waste generated in the county. This would require County ownership or public/private contracts for transfer/disposal facilities.
• Monitor the waste disposal industry to stay abreast of new and emerging technologies.
• Implement a volume-based (i.e., pay-as-you-throw) residential fee structure to encourage waste reduction and increase materials collected for recycling.
In order to assure long term disposal capacity for the county’s solid waste, action on two related fronts needs to be undertaken in the early years of the solid waste management plan implementation– promoting more aggressive waste reduction/diversion through recycling and composting; and conducting detailed evaluations of alternative disposal options that could be in place when the Johnson County Landfill closes. These two fronts are integrally intertwined; diverting more waste may ensure that the Johnson County Landfill has capacity to remain open until 2027 and reduce the amount (and cost) of future disposal capacity needed to accommodate the county’s waste. It can take years to fully implement strategies that reduce waste and provide for adequate future disposal capacity. Thus it is essential to move ahead on both fronts as early as possible. Given the complexities of achieving significant waste reduction and providing for adequate future disposal in a county with 20 municipalities and hundreds of homeowners associations, all with varying roles in waste management, the County will need to play a strong role. COUNTY ROLE IN SOLID WASTE MANAGEMENT Currently, Johnson County Government’s primary responsibilities in SWM include the following functions:
(1) Providing for adequate processing and disposal capacity for solid wastes generated in the incorporated and unincorporated parts of the county.
(2) Monitoring and enforcing non-hazardous SWM activities including storage and collection in the unincorporated areas of the county.
(3) Operating a household hazardous waste facility for all county residents, which also provides a fee-based collection program for county businesses that generate small quantities of hazardous waste.
Chapter 9 Johnson County Potential Solid Waste Management Measures, Strategies, and Scenarios
CLIENTS\JOCO\KC081858 01.03.08 3607.00.001.001
9-12
(4) Through the Solid Waste Management Committee, developing and updating a solid waste management plan that provides for adequate waste storage, collection, disposal and recycling, countywide.
(5) Regulating the operation of all solid waste transfer stations and disposal facilities located within the county.
The cities in the county are currently responsible for providing waste storage, collection and recycling services for households within their jurisdictions. Several cities have chosen to rely on homeowners associations or residents themselves to arrange directly for waste collection and recycling services. Historically, the County has not needed to own or operate any SWM facilities except for the household hazardous waste facility, due to the willingness of the private sector to own and operate these facilities. Such involvement by the County would probably be desirable only if necessary to assure long-term availability of adequate and affordable processing or disposal capacity. Achieving the desired objective might not require both facility ownership and operation by the County. The County might, instead, facilitate the development of a new private SWM facility through contractual arrangements and waste flow guarantees. The County might own the facility and/or the property to reduce capital costs and impose some waste flow control. Given the significant challenges ahead in increasing waste reduction and ensuring adequate disposal capacity, the County should enhance its role as needed to achieve the following:
(1) A recycling rate for county-generated municipal solid waste that exceeds the national recycling rate average.
(2) Reasonable assurance of long-term disposal capacity for county-generated solid waste.
(3) Affordable and equitable costs and consistent services for managing county-generated solid waste.
(4) A better informed and educated public regarding future solid waste management challenges and solutions.
The County may need to strengthen its regulatory control over waste haulers, transfer stations and disposal facilities in order to meet its responsibility to ensure that adequate waste processing and disposal capacity exists in the future. Since the need for future waste processing and disposal capacity is affected by waste reduction efforts, it is likely that the County will need to assume a more centralized role in implementing waste reduction efforts, in close coordination and consultation with the cities, homeowners associations and the private sector.
Chapter 9 Johnson County Potential Solid Waste Management Measures, Strategies, and Scenarios
CLIENTS\JOCO\KC081858 01.03.08 3607.00.001.001
9-13
SUMMARY This chapter presents a number of potential measures, strategies, and scenarios for source reduction, recycling, and composting to reduce the amount of solid waste requiring disposal. It also lists potential measures and strategies for ensuring future disposal capacity when the Johnson County Landfill, Inc. closes. Finally, the role that Johnson County Government might play in the future of solid waste management is discussed. These potential measures, strategies, and scenarios are used in a later chapter to develop recommendations and targeted measures and strategies to pursue in the short as well as long term.
Chapter10 Johnson County Future Solid Waste Management System Recommendations, Strategies, Implementation Schedule, and County Costs
CLIENTS\JOCO\KC081858 01.03.08 3607.00.001.001
10-1
CHAPTER 10
JOHNSON COUNTY FUTURE SOLID WASTE MANAGEMENT SYSTEM RECOMMENDATIONS, STRATEGIES, IMPLEMENTATION SCHEDULE,
AND COUNTY COSTS INTRODUCTION The purpose of this chapter is to address the future of solid waste management in Johnson County. There are strong recommendations for solid waste reduction via recycling and composting; for managing residential MSW; for managing commercial and multi-family MSW; and for managing construction and demolition debris (C&D). Other recommendations are given for solid waste disposal. The County’s role is also defined. Each of these solid waste categories has multiple strategies and a timetable for implementation for the years 2008 through 2027. Implementation of the strategies is shown for each year from 2008 to 2012 (Phase 1). Phases 2 and 3 are shown in five- and ten-year increments respectively (2013 – 2017 and 2018 – 2027). The chapter concludes with a summary section. After consideration of stakeholder input and review of the current solid waste management system and potential measures and strategies for solid waste reduction and disposal, the Solid Waste Management Committee (SWMC) of Johnson County has developed the following solid waste reduction, solid waste disposal, and County role and operations recommendations and implementation schedule. SOLID WASTE REDUCTION The SWMC recommends the following to achieve solid waste reduction in Johnson County.
The County should strive to increase solid waste reduction through aggressive countywide education, promotion, and implementation of cost effective source reduction, recycling, and composting measures. Results, based on a per capita disposal rate, should be measured and reported annually. Educational, promotional, and implementation efforts should target a municipal solid waste (MSW) recovery rate that, at a minimum, exceeds the national average. The national MSW recovery rate average in 2005 was 32 percent.
Residential Municipal Solid Waste The SWMC recommends the following for the residential MSW stream.
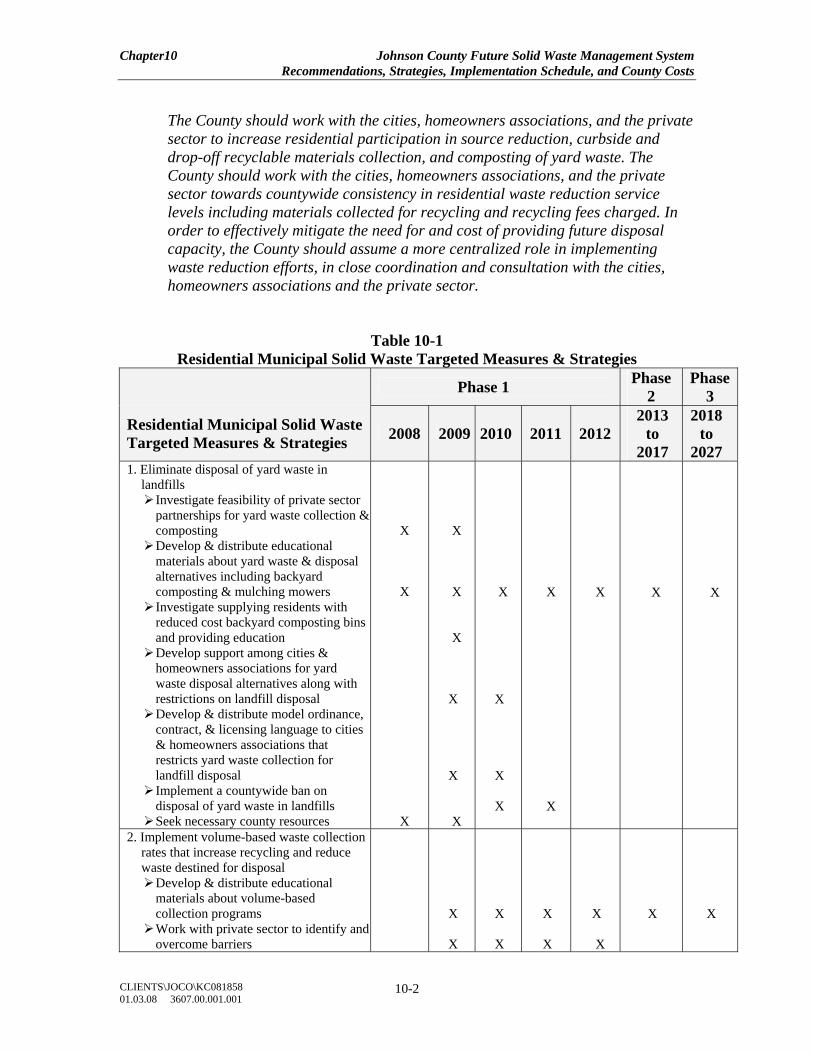
Chapter10 Johnson County Future Solid Waste Management System Recommendations, Strategies, Implementation Schedule, and County Costs
CLIENTS\JOCO\KC081858 01.03.08 3607.00.001.001
10-2
The County should work with the cities, homeowners associations, and the private sector to increase residential participation in source reduction, curbside and drop-off recyclable materials collection, and composting of yard waste. The County should work with the cities, homeowners associations, and the private sector towards countywide consistency in residential waste reduction service levels including materials collected for recycling and recycling fees charged. In order to effectively mitigate the need for and cost of providing future disposal capacity, the County should assume a more centralized role in implementing waste reduction efforts, in close coordination and consultation with the cities, homeowners associations and the private sector.
Table 10-1 Residential Municipal Solid Waste Targeted Measures & Strategies
Phase 1 Phase 2
Phase3
Residential Municipal Solid Waste Targeted Measures & Strategies 2008 2009 2010 2011 2012
2013 to
2017
2018 to
2027 1. Eliminate disposal of yard waste in
landfills Investigate feasibility of private sector partnerships for yard waste collection & composting Develop & distribute educational materials about yard waste & disposal alternatives including backyard composting & mulching mowers Investigate supplying residents with reduced cost backyard composting bins and providing education Develop support among cities & homeowners associations for yard waste disposal alternatives along with restrictions on landfill disposal Develop & distribute model ordinance, contract, & licensing language to cities & homeowners associations that restricts yard waste collection for landfill disposal Implement a countywide ban on disposal of yard waste in landfills Seek necessary county resources
X X X
X X X
X
X X
X
X
X
X
X X
X
X
X
2. Implement volume-based waste collection rates that increase recycling and reduce waste destined for disposal
Develop & distribute educational materials about volume-based collection programs Work with private sector to identify and overcome barriers
X
X
X
X
X
X
X X
X
X
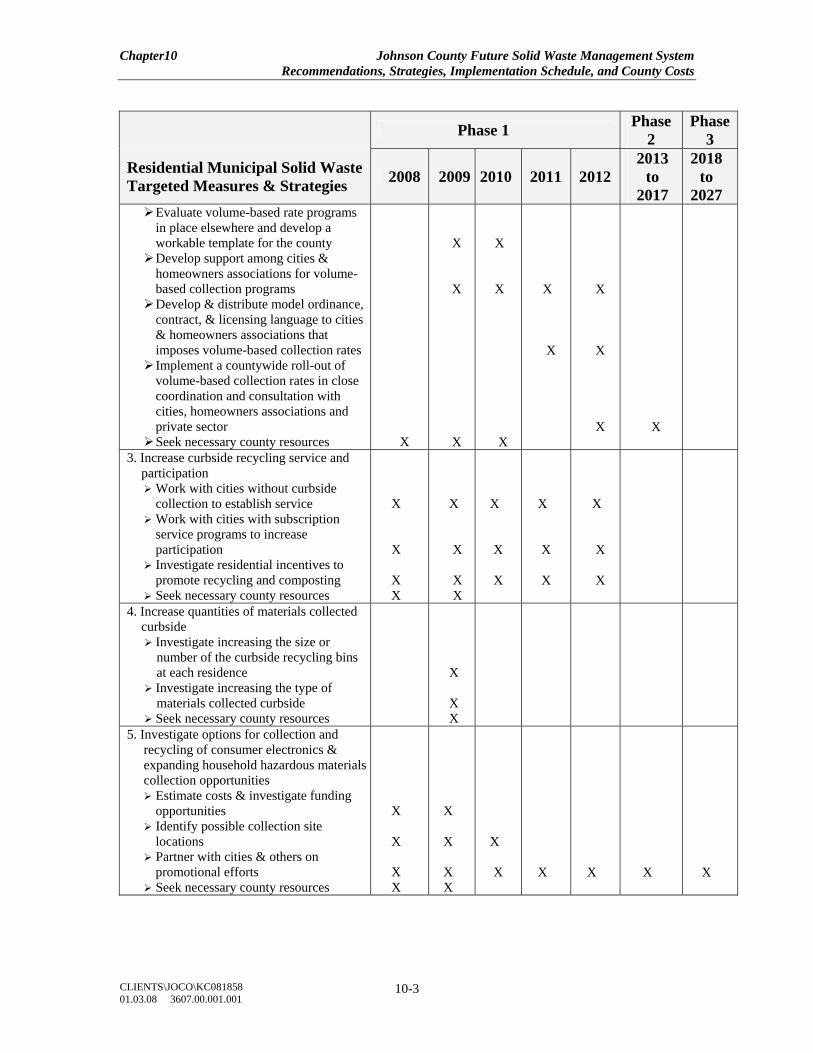
Chapter10 Johnson County Future Solid Waste Management System Recommendations, Strategies, Implementation Schedule, and County Costs
CLIENTS\JOCO\KC081858 01.03.08 3607.00.001.001
10-3
Phase 1 Phase 2
Phase3
Residential Municipal Solid Waste Targeted Measures & Strategies 2008 2009 2010 2011 2012
2013 to
2017
2018 to
2027 Evaluate volume-based rate programs in place elsewhere and develop a workable template for the county Develop support among cities & homeowners associations for volume-based collection programs Develop & distribute model ordinance, contract, & licensing language to cities & homeowners associations that imposes volume-based collection rates Implement a countywide roll-out of volume-based collection rates in close coordination and consultation with cities, homeowners associations and private sector Seek necessary county resources
X
X
X
X
X
X X
X
X
X
X
X
X
3. Increase curbside recycling service and participation
Work with cities without curbside collection to establish service
Work with cities with subscription service programs to increase participation
Investigate residential incentives to promote recycling and composting
Seek necessary county resources
X
X
X X
X
X
X X
X
X
X
X
X
X
X
X
X
4. Increase quantities of materials collected curbside
Investigate increasing the size or number of the curbside recycling bins at each residence
Investigate increasing the type of materials collected curbside
Seek necessary county resources
X
X X
5. Investigate options for collection and recycling of consumer electronics & expanding household hazardous materials collection opportunities
Estimate costs & investigate funding opportunities
Identify possible collection site locations
Partner with cities & others on promotional efforts
Seek necessary county resources
X
X
X X
X
X
X X
X X
X
X
X
X
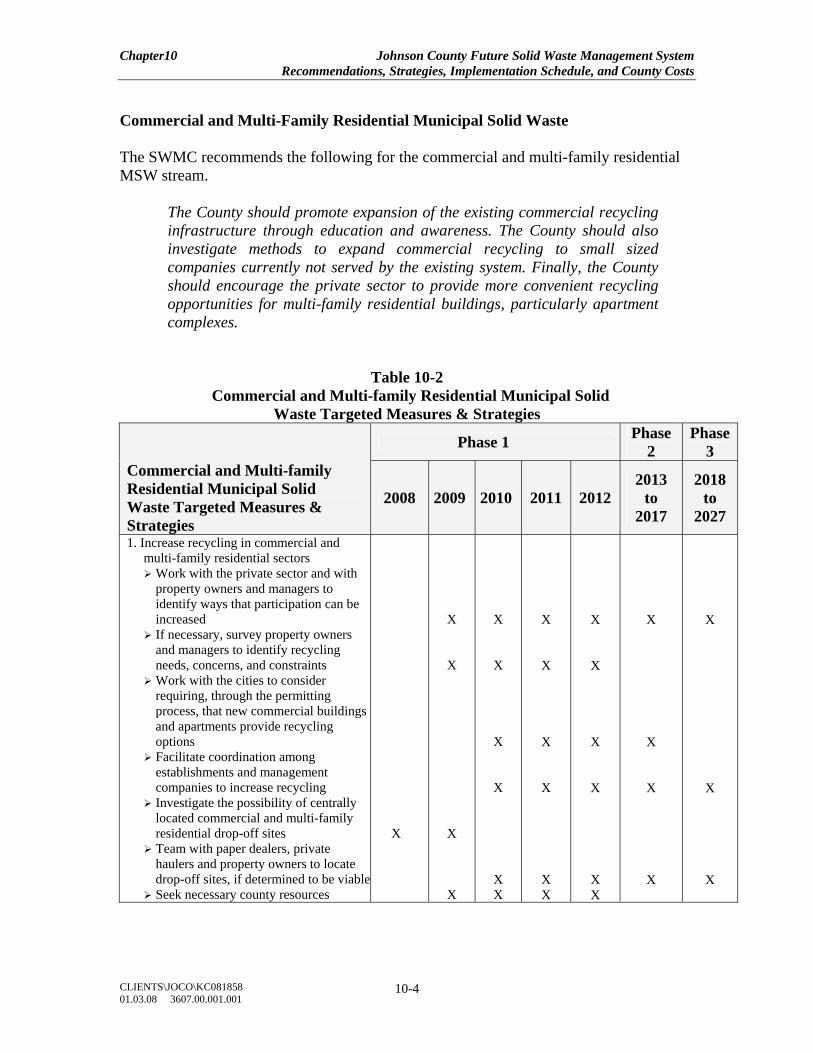
Chapter10 Johnson County Future Solid Waste Management System Recommendations, Strategies, Implementation Schedule, and County Costs
CLIENTS\JOCO\KC081858 01.03.08 3607.00.001.001
10-4
Commercial and Multi-Family Residential Municipal Solid Waste The SWMC recommends the following for the commercial and multi-family residential MSW stream.
The County should promote expansion of the existing commercial recycling infrastructure through education and awareness. The County should also investigate methods to expand commercial recycling to small sized companies currently not served by the existing system. Finally, the County should encourage the private sector to provide more convenient recycling opportunities for multi-family residential buildings, particularly apartment complexes.
Table 10-2 Commercial and Multi-family Residential Municipal Solid
Waste Targeted Measures & Strategies Phase 1 Phase
2 Phase
3 Commercial and Multi-family Residential Municipal Solid Waste Targeted Measures & Strategies
2008 2009 2010 2011 2012 2013
to 2017
2018 to
2027 1. Increase recycling in commercial and
multi-family residential sectors Work with the private sector and with property owners and managers to identify ways that participation can be increased
If necessary, survey property owners and managers to identify recycling needs, concerns, and constraints
Work with the cities to consider requiring, through the permitting process, that new commercial buildings and apartments provide recycling options
Facilitate coordination among establishments and management companies to increase recycling
Investigate the possibility of centrally located commercial and multi-family residential drop-off sites
Team with paper dealers, private haulers and property owners to locate drop-off sites, if determined to be viable
Seek necessary county resources
X
X
X
X
X
X
X
X
X
X X
X
X
X
X
X X
X
X
X
X
X X
X
X
X
X
X
X
X
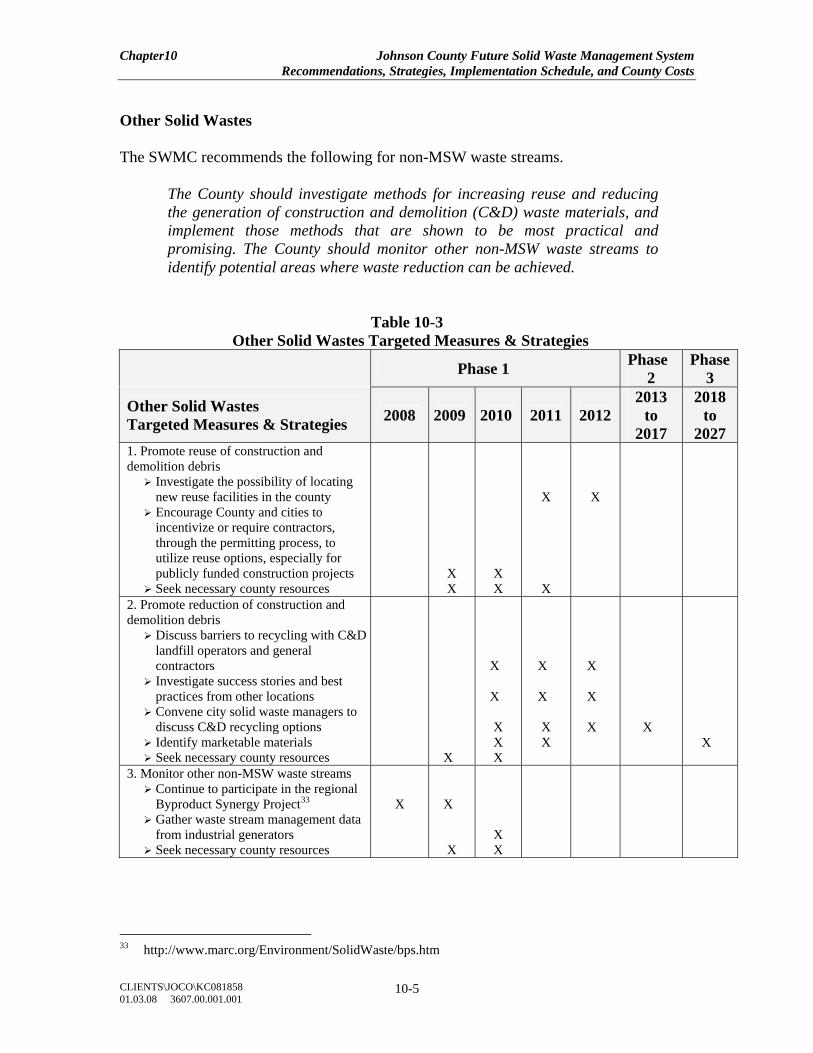
Chapter10 Johnson County Future Solid Waste Management System Recommendations, Strategies, Implementation Schedule, and County Costs
CLIENTS\JOCO\KC081858 01.03.08 3607.00.001.001
10-5
Other Solid Wastes The SWMC recommends the following for non-MSW waste streams.
The County should investigate methods for increasing reuse and reducing the generation of construction and demolition (C&D) waste materials, and implement those methods that are shown to be most practical and promising. The County should monitor other non-MSW waste streams to identify potential areas where waste reduction can be achieved.
Table 10-3 Other Solid Wastes Targeted Measures & Strategies
Phase 1 Phase 2
Phase3
Other Solid Wastes Targeted Measures & Strategies 2008 2009 2010 2011 2012
2013 to
2017
2018 to
2027 1. Promote reuse of construction and demolition debris
Investigate the possibility of locating new reuse facilities in the county
Encourage County and cities to incentivize or require contractors, through the permitting process, to utilize reuse options, especially for publicly funded construction projects
Seek necessary county resources
X X
X X
X
X
X
2. Promote reduction of construction and demolition debris
Discuss barriers to recycling with C&D landfill operators and general contractors
Investigate success stories and best practices from other locations
Convene city solid waste managers to discuss C&D recycling options
Identify marketable materials Seek necessary county resources
X
X
X X X X
X
X X X
X
X
X
X
X
3. Monitor other non-MSW waste streams Continue to participate in the regional Byproduct Synergy Project33
Gather waste stream management data from industrial generators
Seek necessary county resources
X
X X
X X
33 http://www.marc.org/Environment/SolidWaste/bps.htm
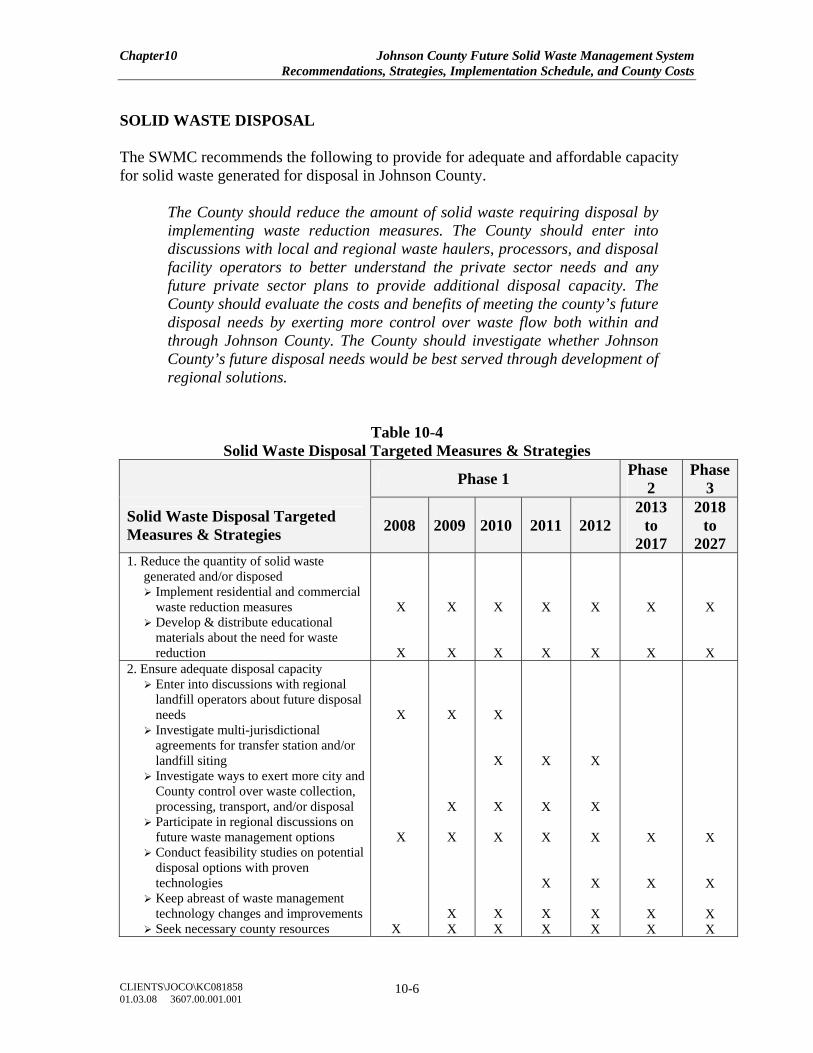
Chapter10 Johnson County Future Solid Waste Management System Recommendations, Strategies, Implementation Schedule, and County Costs
CLIENTS\JOCO\KC081858 01.03.08 3607.00.001.001
10-6
SOLID WASTE DISPOSAL The SWMC recommends the following to provide for adequate and affordable capacity for solid waste generated for disposal in Johnson County.
The County should reduce the amount of solid waste requiring disposal by implementing waste reduction measures. The County should enter into discussions with local and regional waste haulers, processors, and disposal facility operators to better understand the private sector needs and any future private sector plans to provide additional disposal capacity. The County should evaluate the costs and benefits of meeting the county’s future disposal needs by exerting more control over waste flow both within and through Johnson County. The County should investigate whether Johnson County’s future disposal needs would be best served through development of regional solutions.
Table 10-4 Solid Waste Disposal Targeted Measures & Strategies
Phase 1 Phase 2
Phase3
Solid Waste Disposal Targeted Measures & Strategies 2008 2009 2010 2011 2012
2013 to
2017
2018 to
2027 1. Reduce the quantity of solid waste
generated and/or disposed Implement residential and commercial waste reduction measures
Develop & distribute educational materials about the need for waste reduction
X
X
X
X
X
X
X
X
X
X
X
X
X
X 2. Ensure adequate disposal capacity
Enter into discussions with regional landfill operators about future disposal needs
Investigate multi-jurisdictional agreements for transfer station and/or landfill siting
Investigate ways to exert more city and County control over waste collection, processing, transport, and/or disposal
Participate in regional discussions on future waste management options
Conduct feasibility studies on potential disposal options with proven technologies
Keep abreast of waste management technology changes and improvements
Seek necessary county resources
X
X
X
X
X
X
X X
X
X
X
X
X X
X
X
X
X
X X
X
X
X
X
X X
X
X
X X
X
X
X X
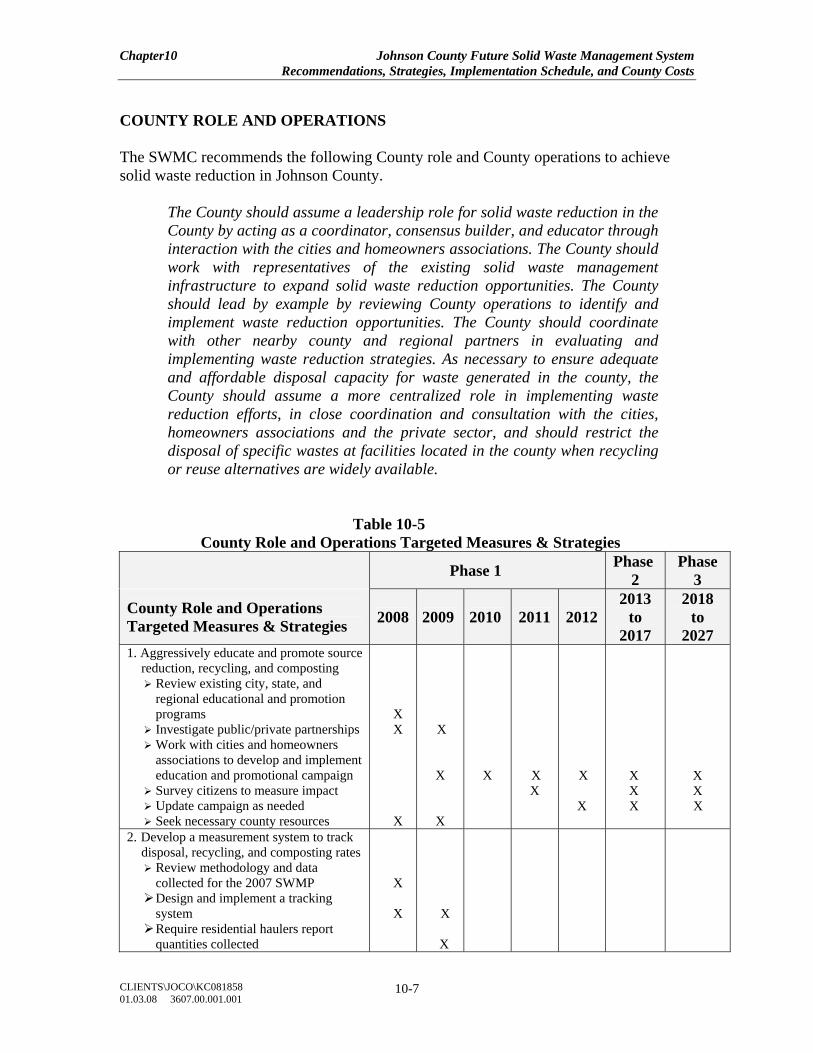
Chapter10 Johnson County Future Solid Waste Management System Recommendations, Strategies, Implementation Schedule, and County Costs
CLIENTS\JOCO\KC081858 01.03.08 3607.00.001.001
10-7
COUNTY ROLE AND OPERATIONS The SWMC recommends the following County role and County operations to achieve solid waste reduction in Johnson County.
The County should assume a leadership role for solid waste reduction in the County by acting as a coordinator, consensus builder, and educator through interaction with the cities and homeowners associations. The County should work with representatives of the existing solid waste management infrastructure to expand solid waste reduction opportunities. The County should lead by example by reviewing County operations to identify and implement waste reduction opportunities. The County should coordinate with other nearby county and regional partners in evaluating and implementing waste reduction strategies. As necessary to ensure adequate and affordable disposal capacity for waste generated in the county, the County should assume a more centralized role in implementing waste reduction efforts, in close coordination and consultation with the cities, homeowners associations and the private sector, and should restrict the disposal of specific wastes at facilities located in the county when recycling or reuse alternatives are widely available.
Table 10-5 County Role and Operations Targeted Measures & Strategies
Phase 1 Phase 2
Phase 3
County Role and Operations Targeted Measures & Strategies 2008 2009 2010 2011 2012
2013 to
2017
2018 to
2027 1. Aggressively educate and promote source
reduction, recycling, and composting Review existing city, state, and regional educational and promotion programs
Investigate public/private partnerships Work with cities and homeowners associations to develop and implement education and promotional campaign
Survey citizens to measure impact Update campaign as needed Seek necessary county resources
X X
X
X
X
X
X
X X
X
X
X X X
X X X
2. Develop a measurement system to track disposal, recycling, and composting rates
Review methodology and data collected for the 2007 SWMP Design and implement a tracking system Require residential haulers report quantities collected
X X
X
X
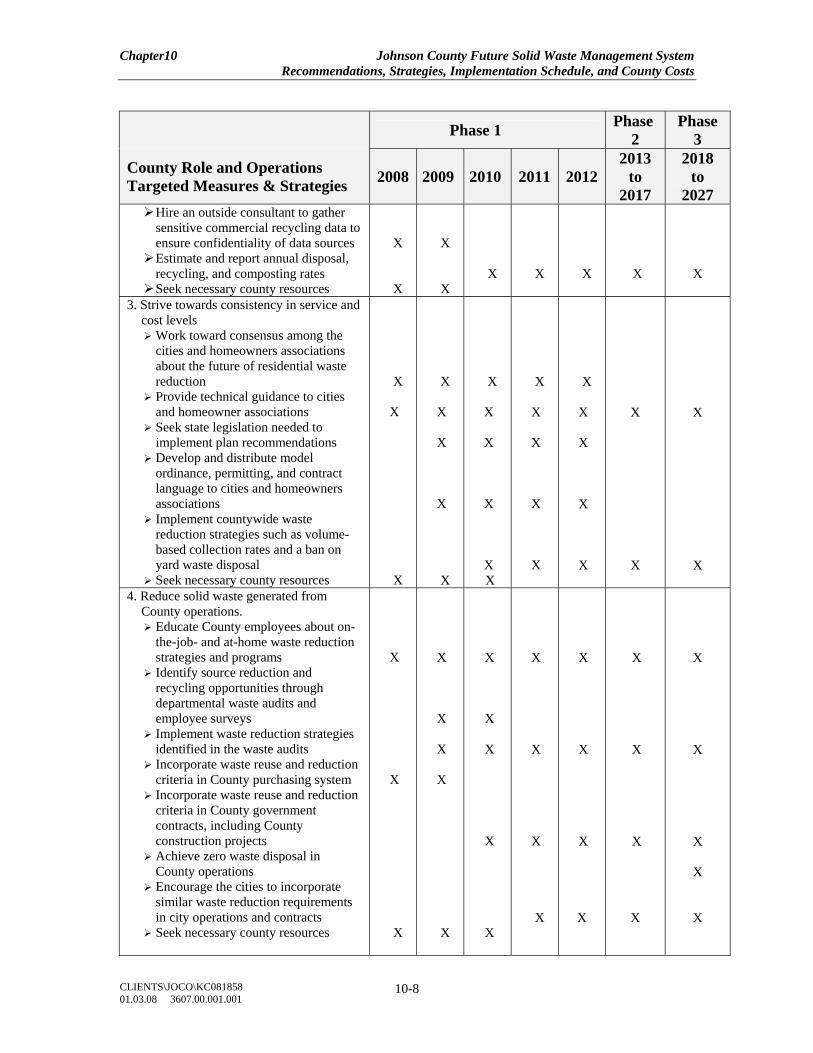
Chapter10 Johnson County Future Solid Waste Management System Recommendations, Strategies, Implementation Schedule, and County Costs
CLIENTS\JOCO\KC081858 01.03.08 3607.00.001.001
10-8
Phase 1 Phase 2
Phase 3
County Role and Operations Targeted Measures & Strategies 2008 2009 2010 2011 2012
2013 to
2017
2018 to
2027 Hire an outside consultant to gather sensitive commercial recycling data to ensure confidentiality of data sources Estimate and report annual disposal, recycling, and composting rates Seek necessary county resources
X
X
X
X
X
X
X
X
X
3. Strive towards consistency in service and cost levels
Work toward consensus among the cities and homeowners associations about the future of residential waste reduction
Provide technical guidance to cities and homeowner associations
Seek state legislation needed to implement plan recommendations
Develop and distribute model ordinance, permitting, and contract language to cities and homeowners associations
Implement countywide waste reduction strategies such as volume-based collection rates and a ban on yard waste disposal
Seek necessary county resources
X
X X
X
X
X
X X
X
X
X
X
X X
X
X
X
X
X
X
X
X
X
X
X
X
X
X
4. Reduce solid waste generated from County operations.
Educate County employees about on-the-job- and at-home waste reduction strategies and programs
Identify source reduction and recycling opportunities through departmental waste audits and employee surveys
Implement waste reduction strategies identified in the waste audits
Incorporate waste reuse and reduction criteria in County purchasing system
Incorporate waste reuse and reduction criteria in County government contracts, including County construction projects
Achieve zero waste disposal in County operations
Encourage the cities to incorporate similar waste reduction requirements in city operations and contracts
Seek necessary county resources
X
X
X
X
X
X
X
X
X
X
X
X
X
X
X
X
X
X
X
X
X
X
X
X
X
X
X
X
X
X
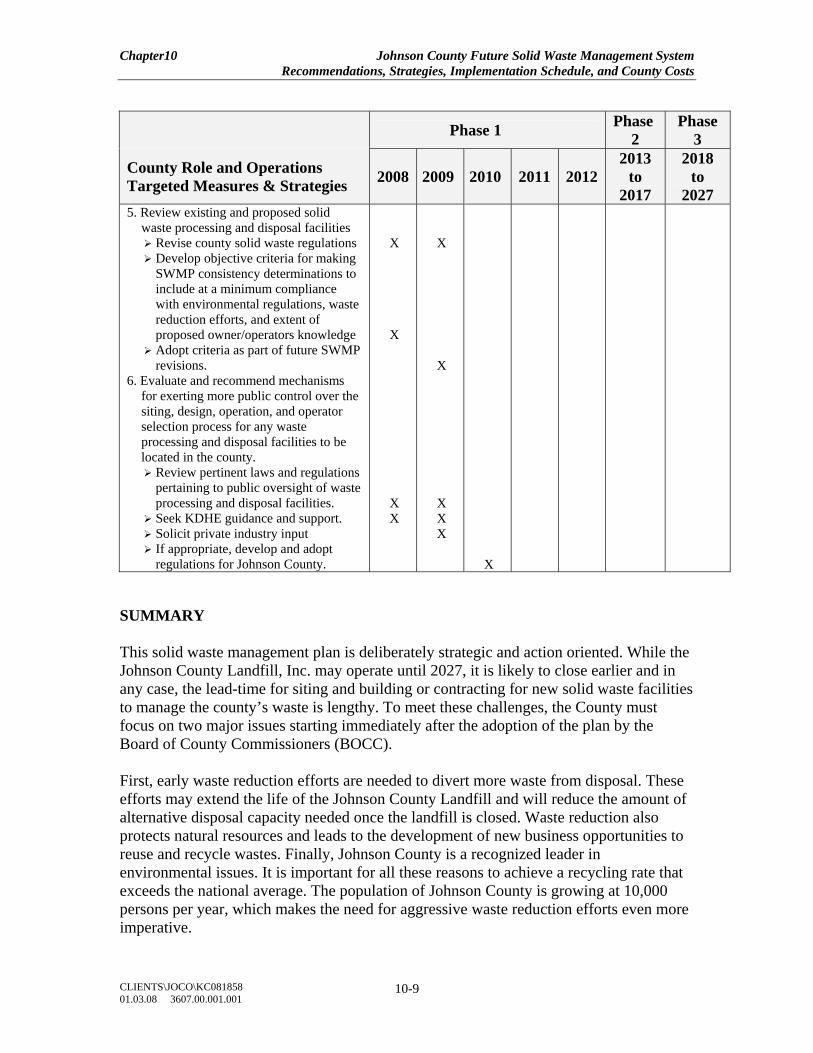
Chapter10 Johnson County Future Solid Waste Management System Recommendations, Strategies, Implementation Schedule, and County Costs
CLIENTS\JOCO\KC081858 01.03.08 3607.00.001.001
10-9
Phase 1 Phase 2
Phase 3
County Role and Operations Targeted Measures & Strategies 2008 2009 2010 2011 2012
2013 to
2017
2018 to
2027 5. Review existing and proposed solid
waste processing and disposal facilities Revise county solid waste regulations Develop objective criteria for making SWMP consistency determinations to include at a minimum compliance with environmental regulations, waste reduction efforts, and extent of proposed owner/operators knowledge
Adopt criteria as part of future SWMP revisions.
6. Evaluate and recommend mechanisms for exerting more public control over the siting, design, operation, and operator selection process for any waste processing and disposal facilities to be located in the county.
Review pertinent laws and regulations pertaining to public oversight of waste processing and disposal facilities.
Seek KDHE guidance and support. Solicit private industry input If appropriate, develop and adopt regulations for Johnson County.
X
X
X X
X
X
X X X
X
SUMMARY This solid waste management plan is deliberately strategic and action oriented. While the Johnson County Landfill, Inc. may operate until 2027, it is likely to close earlier and in any case, the lead-time for siting and building or contracting for new solid waste facilities to manage the county’s waste is lengthy. To meet these challenges, the County must focus on two major issues starting immediately after the adoption of the plan by the Board of County Commissioners (BOCC). First, early waste reduction efforts are needed to divert more waste from disposal. These efforts may extend the life of the Johnson County Landfill and will reduce the amount of alternative disposal capacity needed once the landfill is closed. Waste reduction also protects natural resources and leads to the development of new business opportunities to reuse and recycle wastes. Finally, Johnson County is a recognized leader in environmental issues. It is important for all these reasons to achieve a recycling rate that exceeds the national average. The population of Johnson County is growing at 10,000 persons per year, which makes the need for aggressive waste reduction efforts even more imperative.
Chapter10 Johnson County Future Solid Waste Management System Recommendations, Strategies, Implementation Schedule, and County Costs
CLIENTS\JOCO\KC081858 01.03.08 3607.00.001.001
10-10
Second, the County needs to expediously evaluate alternative waste disposal and processing capacity options in the earliest years of this plan to ensure that adequate and affordable disposal is available when the Johnson County Landfill closes. To stay focused on progress, the County needs to establish methods of measuring success toward achieving the goals laid out in the plan. Solid Waste Reduction Residential Municipal Solid Waste The principal recommendations in this plan to reduce municipal solid waste are twofold. First, residential recycling must be increased. Second, a countywide composting program should be established that leads to a prohibition on landfill disposal of yard waste. To ensure higher residential recycling rates and to reduce the need for future disposal capacity, the plan also recommends eventual implementation of a countywide volume-based (i.e., pay-as-you-throw) rate structure for solid waste collection at the residential level. To accomplish these goals, the County will need to work closely with cities, homeowner associations, and the waste management sector. The strategies emphasize private sector partnerships and extensive public education and outreach. Tangible progress toward these goals will require the County to play a more centralized role in implementing waste reduction efforts in order to ensure that adequate and affordable disposal capacity can be provided in the future. Generally, the plan calls for extensive outreach and coordination of residential waste reduction measures during the 2008 - 2009 period, with implementation by 2010 – 2012. Commercial Municipal Solid Waste The plan recommendations for commercial solid waste are intended to build upon the existing commercial recycling infrastructure and to extend more recycling opportunities to smaller sized waste generators and multi-family residential units. Strategies include educating businesses and public/quasi-public organizations such as hospitals, K-12 schools, colleges, retirement communities, etc. about recycling options. Since the most easily recycled products in the commercial sector are corrugated boxes, office paper, and mixed paper, the paper dealers and solid waste haulers can be important allies in the effort. Because it is clear that the commercial recycling rate needs to increase in order for the county to achieve an overall recycling goal that exceeds the national average, this effort needs to begin in 2009 and continue throughout the timeframe of the plan.
Chapter10 Johnson County Future Solid Waste Management System Recommendations, Strategies, Implementation Schedule, and County Costs
CLIENTS\JOCO\KC081858 01.03.08 3607.00.001.001
10-11
Construction and Demolition Debris The plan recommendations related to construction and demolition debris (C&D) involve the development of better information about reusable and recyclable components of the C&D waste stream. The County should gather information from the C&D industry and other communities about how to expand recycling and waste reduction of C&D waste. One strategy will be to investigate the feasibility of bringing some recyclers to the county and to work with organizations such as ReStore. Deconstruction is an evolving opportunity as is the ongoing Byproduct Synergy Project34 in which the County is currently participating. The County and the cities should also explore and implement ways to reduce C&D waste associated with public building projects. Additional C&D waste reduction strategies should be recommended in future plan updates as better information becomes available. The timeframe for implementing the C&D strategies will be 2009 to 2012. Solid Waste Disposal The plan incorporates three major recommendations for assuring affordable and adequate solid waste disposal capacity for Johnson County solid waste: (1) pursue aggressive waste reduction strategies to reduce the quantity of waste going to disposal sites, (2) enter into discussions with local and regional haulers, processors, and landfill operators to assess future private sector plans and proposals for accommodating the county’s waste and to evaluate ways that the County could exert more control over waste flow, and (3) continue to explore whether regional solutions would best meet Johnson County’s future disposal needs. Ensuring adequate disposal capacity for Johnson County solid waste will likely involve the siting of at least one new transfer station within the county and utilizing new or expanded landfill space outside the county. The use of emerging, more environmentally sustainable technologies might supplement landfill disposal over the longer term and should be periodically re-evaluated. Key associated strategies include discussions with private sector firms and exploration of multi-jurisdictional agreements. To ensure adequate and affordable future disposal capacity, Johnson County must begin working on these issues in 2008 and continue until enforceable contracts or agreements are in place. County Role And Operations This solid waste management plan recommends that the County assume a strong leadership role to assure that its citizens and businesses have continued access to affordable and adequate disposal capacity. 34 http://www.marc.org/Environment/SolidWaste/bps.htm
Chapter10 Johnson County Future Solid Waste Management System Recommendations, Strategies, Implementation Schedule, and County Costs
CLIENTS\JOCO\KC081858 01.03.08 3607.00.001.001
10-12
The strategies related to the County’s role fall into three areas: (1) aggressively educate, promote and implement recycling, composting, and source reduction in close cooperation and coordination with cities, homeowners associations and the private sector, (2) by 2008, develop a comprehensive measurement system that annually tracks solid waste generated in the county; recycling of solid waste from residential and commercial sectors; composting of yard waste; and waste disposal on a per capita and tonnage basis, (3) Lead by example by implementing aggressive waste reduction within County government operations. Implementing the recommendations in this plan will require commitment of additional County resources. It is anticipated that two new full time employees will be needed at an estimated annual cost of $100,000 each (this includes salary, fringe benefits, supplies, computers, vehicle use, etc.). One of the new employees will perform educational and outreach functions with citizens, businesses, cities, and homeowners associations; the other will be responsible for more technical work such as measuring and reporting progress towards achieving goals, developing model documents, and managing surveys and feasibility studies through contractors. An annual educational budget of $20,000 to $40,000 for development and implementation of an educational campaign will be needed starting in 2009. Surveys and feasibility studies will require assistance from outside consultants. These studies, spaced over the twenty year planning horizon, will cost as little per study as $5,000 to gather confidential private sector recycling data to over $75,000 to conduct feasibility studies of potential disposal options. Several of these studies could be active in any given year. The County should budget at least $100,000 per year for outside consulting services.