Embed Size (px)
DESCRIPTION
Joint analysis of Archeops and WMAP observations of the CMB. G. Patanchon (University of British Columbia) for the Archeops collaboration. Main points:. wide range of angular scales covered 15 < l < 600. - large sky coverage ~ 30%. - angular resolution ~ 10’. - PowerPoint PPT Presentation
Citation preview
Joint analysis of Archeops and WMAP observations of the CMB
G. Patanchon (University of British Columbia) for the Archeops collaboration

Collaboration :France : IAP, PCC-CdF (Paris), IAS, LAL (Orsay), CRTBT, LAOG, LPSC (Grenoble), DAPNIA/SPP (CEA), CESR/LAOMP (Toulouse)United Kingdom : Cardiff UniversityItaly : University of Rome, Florence, ASIUSA : Caltech, JPL, University of Minnesota
The Archeops balloon borne experiment
Main points:
- 22 spider web bolometers cooled to 100 mK
testbed for Planck HFI
- angular resolution ~ 10’
- large sky coverage ~ 30% wide range of angularscales covered 15 < l < 600
- 4 frequencies: 143, 217, 353 and 545 GHz
polarimeters at 353 GHz
systematic controlforegrounds separation
dust polarization

Main Archeops CMB results
Best measurement of the first acoustic peak before WMAP
first link between COBE and small scale experiments
Scientific flight February 2002,12 hours of data

Why a joint analysis between Archeops and WMAP
To check the compatibility of CMB anisotropies in a wide range of frequencies, from 41 to 217 GHz
To look for possible residual foreground emission and systematics in maps
To constrain SZ emission in WMAP data
Q band V band W band 143 217

Data sets
Use Archeops observed maps from 6 detectors, 4 maps at 143 GHz and 2 maps at 217 GHz Galactic dust emission and atmospheric emission has been removed from the maps
Use 8 foreground cleaned maps from WMAP, from 41 to 90 GHz
WMAP maps are rescanned following Archeops observation strategy, extracted timelines are high pass filtered (as done for Archeops) before reprojection onto maps
Galactic and point source masks are applied

CMB map comparison
Archeops and WMAP see the same structureswith a high significance
difference map shows stripes and residual galactic emission
further investigation is needed

Cross-power spectrumArcheops/WMAP with X-spect(Tristram et al. 2004)
Cross-power spectrumCross-power spectra between each mapfrom Archeops and the best estimate ofCMB map from WMAP (1st yr)
after recalibration
CMB anisotropies are compatible in Archeops and WMAP (except for an amplitude coefficient)
Further investigations are needed to understand the CMB amplitude discrepancy

Model for joint multi-component analysis
We assume that the observations are a linear mixture of components + noise
Components are CMB, unresolved point sources, and possibly residual components
x = A s + nModel in matrix form:We assumeai,ps(Krj) = (i/0)-2
xi() = i (scmb() + ai,ps() si,ps()) + aic sc() + ni ()
recalibration factorsfor Archeops
Observed maps in T CMB units:
noiseresidual components
Point sourcesCMB

Method
<xlm.xlmt> = A
At + CRes(l)
CPS
CCMB(l)
0
0N143(l)
NQ1(l)
0
0NQ2(l)
N217(l)
We assume a flat power spectrum of point sources.
• Compute all the cross- and auto-power spectra of the observed maps
• adjust their multi-component model:
• estimate the relevant parameters: - component power spectra CCMB(l), CRes(l) - CMB calibration in Archeops, ... - mixing parameters of the unknown components Aic
- amplitude of unresolved point sources CPS
- Noise power spectra Ni(l)Patanchon et al. 2003, 2005 (WMAP appl.)Delabrouille, Cardoso, Patanchon 2002

Results: number of components
We want to estimate the required number of residual components in data
Goodness of fit for various number of estimated components :
3 significantcomponents in maps:
CMB + 2 residuals

Results: amplitude of components
• CMB anisotropies
Only component in common between Archeops and WMAP
Archeops calibration on dipole is significantly underestimated
• 2 residual components
detected in Archeops only 1st component has a relatively constant amplitude 2nd component is detected at 217 GHz only
• Point source power spectrum: CPS = (19.8 ± 11.8) x 10-3 K2
Consistant with other estimates (Komatsu et al., Patanchon et al.)
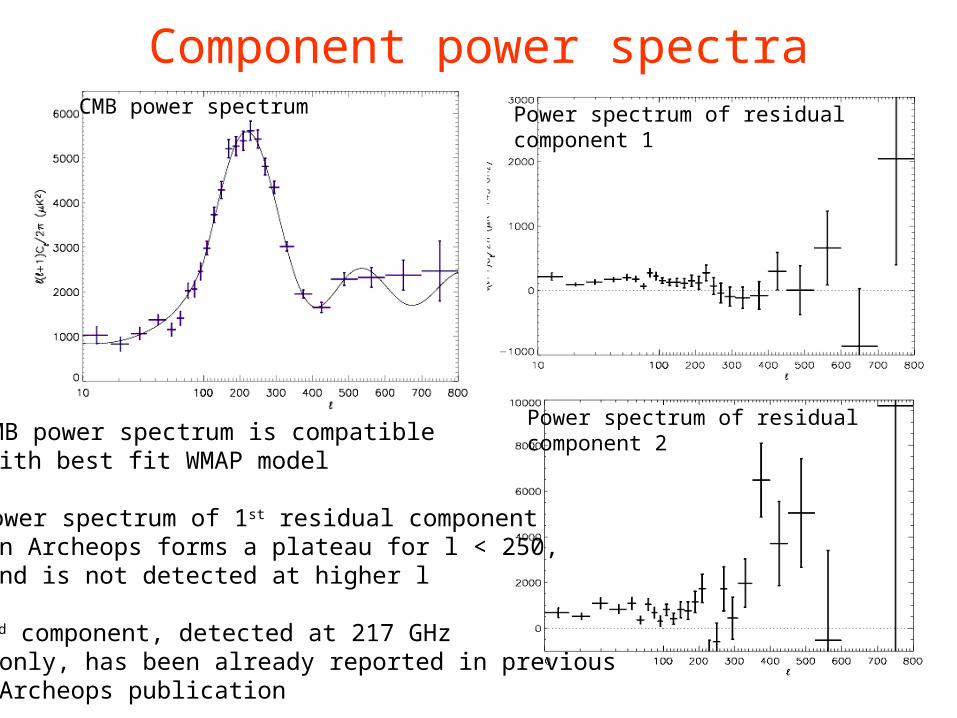
Component power spectraCMB power spectrum Power spectrum of residual
component 1
Power spectrum of residualcomponent 2
CMB power spectrum is compatible with best fit WMAP model
power spectrum of 1st residual component in Archeops forms a plateau for l < 250, and is not detected at higher l
2nd component, detected at 217 GHz only, has been already reported in previous Archeops publication

Component maps
CMB
Residualcomponent 2
Residualcomponent 1
Residual components are amixture of residualatmospheric emission andgalactic emission

Constraints on thermal SZ emission
Q band V band W band 143 217E.M spectra ofcomponents:
We assumeai,ps(Krj) = (i/0)-2
3 astrophysical components: CMB, thermal SZ, unresolved point sources+ 2 residuals
New Model:
Observed maps in T CMB units:
xi() = i (scmb() + ai,sz() ssz() + ai,ps() sps()) + aic sc() + ni ()
We add SZ in the model,ai,sz() is perfectly known
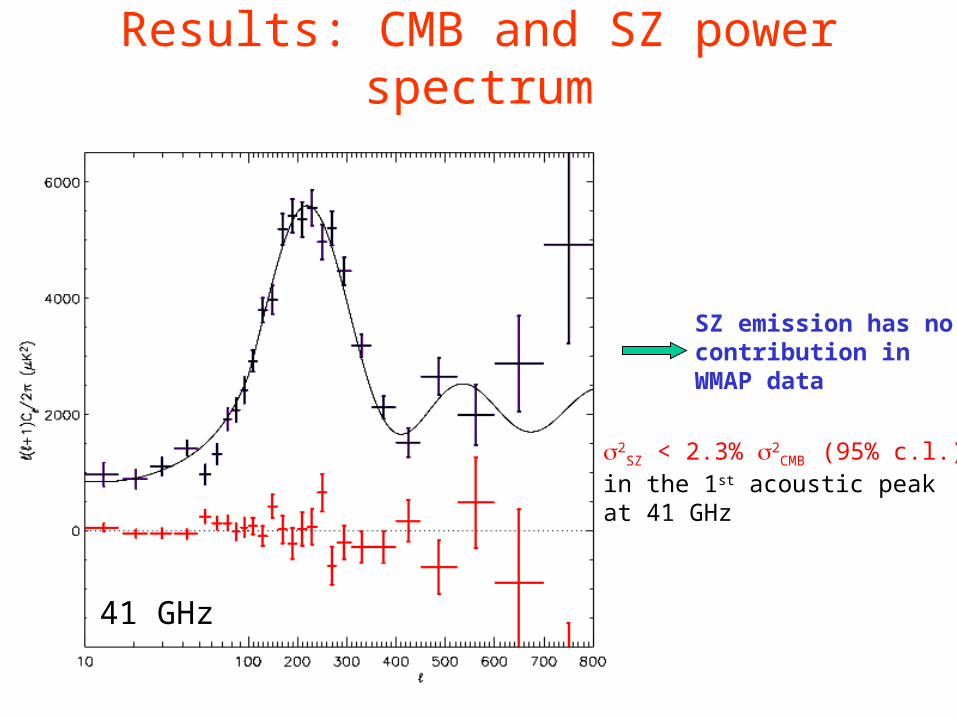
Results: CMB and SZ power spectrum
41 GHz
2SZ < 2.3% 2
CMB (95% c.l.)in the 1st acoustic peakat 41 GHz
SZ emission has nocontribution inWMAP data

Conclusions Joint analysis shows that Archeops and WMAP data are compatible - The only component in common between Archeops and WMAP is CMB.
- CMB anisotropies are compatible in WMAP and Archeops data, except for an amplitude coefficient.
- Cross-power spectrum is compatible with best fit WMAP model
Archeops is systematically under-calibrated by ~7-8 % for the best channels (while 1- error on dipole calibration was estimated to 4% at 143 GHz and 8% at 217GHz).
two weak residual components are detected in Archeops maps. They are attributed to a mixture of residual atmospheric emission and galactic emission.
Archeops allows to constrain thermal SZ effect in WMAP data. We showed that there is no evidence of SZ effect, 2
SZ < 2.3% 2CMB (95% c.l.) in the 1st acoustic peak at 41 GHz