Embed Size (px)
Citation preview

Joint Committee on Pensions
2014 INTERIM REPORT
Annapolis, Maryland January 2015

Contributing Staff
Writers
Phillip S. Anthony Michael C. Rubenstein
Dana K. Tagalicod
For further information concerning this document contact:
Library and Information Services Office of Policy Analysis
Department of Legislative Services 90 State Circle
Annapolis, Maryland 21401
Baltimore Area: 410-946-5400 ● Washington Area: 301-970-5400 Other Areas: 1-800-492-7122, Extension 5400
TDD: 410-946-5401 ● 301-970-5401 Maryland Relay Service: 1-800-735-2258
E-mail: [email protected] Home Page: http://mgaleg.maryland.gov
The Department of Legislative Services does not discriminate on the basis of age, ancestry, color, creed, marital status, national origin, race, religion, gender, gender identity, sexual orientation, or disability in the admission or access to its programs, services, or activities. The Department’s Information Officer has been designated to coordinate compliance with the nondiscrimination requirements contained in Section 35.107 of the Department of Justice Regulations. Requests for assistance should be directed to the Information Officer at the telephone numbers shown above.
ii


iv

Maryland General Assembly Joint Committee on Pensions
2014 Membership Roster
Senators
Verna L. Jones-Rodwell, Chair Nathaniel J. McFadden
Joseph M. Getty George C. Edwards
Edward J. Kasemeyer Richard S. Madaleno, Jr.
James N. Robey Roger Manno
Delegates
Melony G. Griffith, Chair
Susan L. M. Aumann Gail H. Bates
Keith E. Haynes Mary-Dulany James Adrienne A. Jones Galen R. Clagett Craig J. Zucker
Committee Staff
Phillip S. Anthony Dana K. Tagalicod
v

vi

Contents Letter of Transmittal ................................................................................................................... iii Roster ..............................................................................................................................................v Summary and Recommendations .................................................................................................1 Appendix 1
Maryland State Retirement and Pension System ‒ 2014 Actuarial Valuation Results .....................................................................................................................9
Appendix 2 Annual State Retirement and Pension System’s Investment Overview ................69
Appendix 3
Agency Response to Investment Overview ...........................................................82
Appendix 4 Agency Report on Elected and Appointed Officials..............................................86
Appendix 5 Board of Trustees Legislative Proposals for the 2015 Session ..............................90
vii

viii

1

2

3

4

5

6

7

8

Copyright © 2014 GRS – All rights reserved.
Maryland State Retirement and Pension System
Results of the
June 30, 2014 Actuarial Valuation
For Fiscal 2016
November 18, 2014
9

Table of Contents
2014 Actuarial Valuation
GASB Changes
Appendix
2
10

Purpose of the Actuarial Valuation
Measure the financial position of SRPS
Provide the Board with State and PGU contribution rates for certification:
► Allocate investment income among pools within Systems
► Work closely with SRA staff exchanging and reconciling information
► Determine amortization payments
Determine actuarial and statutory contribution rates with reinvested savings for FY 2016
Provide disclosure information for financial reporting ► Provided by separate GASB 67 and 68 valuations
Analyze aggregate experience over the last year
3
11

Funding Objectives
Intergenerational equity with respect to plan costs
Stable or increasing ratio of Assets to Liabilities
Stable pattern of contribution rates
4
12

Variables Affecting Valuation Results
5
Benefits (Retirement, Disability, Survivor)
Actual past experience
Legislative Changes ► 2014 General Assembly reduced the schedule of reinvested savings
► 2011 General Assembly reforms result in a gradually decreasing normal cost rate
Assumption Changes ► 7.65% investment return; 3.40% payroll growth; 2.90% CPI for June 30,
2014
► The ultimate assumptions of 7.55% investment return, 3.30% payroll growth, and 2.80% CPI are being phased in over 4 years
13

Variables Affecting Valuation Results
Funding Policy ► 25-year closed amortization of unfunded actuarial accrued liability for
each State System, ending in FY 2039 (24 years remaining in 2014 valuation)
► 10-year phase out of corridor funding method for TCS and ECS, ending in 2022 valuation (8 years remaining)
Actuarial Audit ► Most audit recommendations will be deferred to the June 30, 2015
valuation
► Recommendations included in the June 30, 2014 valuation: • An adjustment to the mortality table that affects disabled public safety participants.
• Extending the retiree mortality tables from age 115 to 120.
6
14

Reduced Reinvested Savings
Fiscal Year Original Schedule Reduced Schedule
2014 $300M $100M
2015 $300M $100M
2016 $300M $150M
2017 $300M $200M
2018 $300M $250M
2019 & After $300M $300M, until the combined funded ratio
reaches 85% and the corridor is fully phased
out
7
Legislation passed in 2014 by the General Assembly reduced the amount MSRPS would receive in reinvested savings.
15

Reduced Reinvested Savings
Funded Ratio Contribution ($
millions) Probability of 85%
Funded
Year Original Schedule
Reduced Schedule
Original Schedule
Reduced Schedule Reduced Schedule
2015 68.9% 68.2% $1,909 $1,708 < 1%
2016 69.7% 68.7% $2,008 $1,869 1%
2017 71.3% 70.2% $2,082 $2,008 4%
2018 72.7% 71.5% $2,153 $2,141 11%
2024 80.7% 79.7% $2,282 $2,349 40%
2025 82.0% 81.0% $2,303 $2,373 43%
2026 83.3% 82.4% $2,324 $2,396 44%
2027 84.6% 83.7% $2,344 $2,419 46%
2028 85.9% 85.1% $2,364 $2,442 49%
8
Total contributions from 2015 to 2039 are $1.7 billion more under the reduced schedule. From projections based on the June 30, 2013 valuation.
Effect of reduced reinvested savings on projected funded ratios and contribution requirements (for combined state systems):
16

Primary Assumptions & Methods
9
Demographic actuarial assumptions based on the 2006-2010 experience study (first used in 2012 Valuation)
June 30, 2014 Valuation Assumptions
► 7.65% investment return; 3.40% payroll growth; 2.90% CPI
• Assumptions decreasing by 0.05% per year
• Ultimate assumptions reached in 2016 valuation (7.55%, 3.30%, 2.80%)
► 2.65% COLA for service where COLA is capped at 3%
► 2.88% COLA for service where COLA is capped at 5%
► 2.90% COLA for service where COLA is not capped
► 1.68% COLA for service earned after July 1, 2011 where COLA is capped at 2.5% in years when the System earns at least the investment assumption (7.70% for FY 2014 and 7.65% for FY 2015) or capped at 1% in years when the System earns less than the investment assumption
17

Primary Methods
The valuation results are developed using:
►Entry Age Normal Actuarial Cost Method
►5-year asset smoothing
►20% market value collar on assets
►Corridor Funding Method for TCS and ECS (phasing out through 2022 valuation)
►Amortization policy (entire unfunded liability amortized by FY 2039)
• ECS Municipal still uses separate amortization bases
10
18

State and Municipal Demographic Data
11
2013State
2014State
2013Muni
2014Muni
2013Total
MSRPS
2014Total
MSRPSRetired 122,240 126,558 15,685 16,329 137,925 142,887Vested Former 44,899 45,416 6,653 6,717 51,552 52,133Active 167,224 167,816 25,586 25,706 192,810 193,522Total 334,363 339,790 47,924 48,752 382,287 388,542
334,363 339,790
47,924 48,752
382,287 388,542
0
50,000
100,000
150,000
200,000
250,000
300,000
350,000
400,000
450,000
Cou
nt
19

Demographic Data
12
2013
Number Counts State PGU Total Total % Chg
Active Members 167,816 25,706 193,522 192,810 0.4%Vested Former Members 45,416 6,717 52,133 51,552 1.1%Retired Members 126,558 16,329 142,887 137,925 3.6%
Total Members 339,790 48,752 388,542 382,287 1.6%Total Valuation Payroll ($ in Millions) $9,709.0 $1,094.7 $10,803.6 $10,477.5 3.1%Active Member Averages
Age 46.0 48.8 46.3 46.4 -0.1%Service 12.8 11.7 12.6 12.7 -0.7%Pay $ 57,855 $ 42,584 $ 55,826 $ 54,341 2.7%
Total Retiree Benefits ($ in Millions) $2,931.5 $ 216.1 $ 3,147.7 $ 2,988.6 5.3%Average Retiree Benefit $ 23,163 $ 13,237 $ 22,029 $ 21,668 1.7%
2014
20

Valuation Results – Combined State Systems ($ in Millions)
13
$55,707 $58,027
$35,992$39,277
$36,922
$41,419
64.61%
67.69%
66.28%
71.38%
0%
5%
10%
15%
20%
25%
30%
35%
40%
45%
50%
55%
60%
65%
70%
75%
0
10,000
20,000
30,000
40,000
50,000
60,000
70,000
2013 2014
$ in
Mil
lio
ns
Actuarial Accrued Liabilities Actuarial Value of Assets Market Value of AssetsFunded Ratio (AVA basis) Funded Ratio (MVA basis)
21

Year to Year Comparison of Results
14
Teachers' Employees'
Combined Combined State
System * System * Police Judges LEOPS Total
FY 2016 Contribution Rate 15.71% 16.38% 78.91% 40.70% 39.77% 16.83%FY 2016 Contr. Rate (w. Reinv. Savings) 17.27% 17.70% 81.24% 40.70% 42.14% 18.32%FY 2015 Contribution Rate 15.47% 15.53% 83.06% 42.74% 41.37% 16.41%FY 2015 Contr. Rate (w. Reinv. Savings) 16.53% 16.45% 84.73% 42.74% 43.10% 17.44%
2014 Actuarial Value of Assets 26,068$ 11,040$ 1,242$ 389$ 539$ 39,277$ 2014 Unfunded Actuarial Liability 10,815$ 6,783$ 725$ 70$ 357$ 18,750$ 2013 Unfunded Actuarial Liability 11,685$ 6,866$ 718$ 84$ 362$ 19,716$
Funded Ratios2014 (Total Plan includes Municipal) 70.7% 61.9% 63.1% 84.7% 60.2% 68.7%
2013 (Total Plan includes Municipal) 67.1% 59.7% 61.8% 80.9% 56.9% 65.5%
* Includes effect of corridor.
(STATE ONLY except Total Funded Ratios, $ in Millions)
Municipal Actuarial Value of Assets of $3,720 Million and Municipal Unfunded Actuarial Liability of $863 Million are also included in the development of the Total Funded Ratio of 68.7%. State only 2014 Funded Ratio is 67.7%. FY 2015 contributions reflect the reduced reinvested savings schedule per new legislation. Total Funded Ratio in 2014 would have been approximately 69% if reinvested savings was not reduced.
22

Actuarially Determined Contribution Rates
15
18.48% 17.71%20.24% 19.21%
84.73%81.24%
42.74%40.70%
43.10% 42.14%
0.00%
10.00%
20.00%
30.00%
40.00%
50.00%
60.00%
70.00%
80.00%
90.00%
FY2015 FY2016 FY2015 FY2016 FY2015 FY2016 FY2015 FY2016 FY2015 FY2016
Budgeted Reinvested Savings Corridor Shortfall
TCS ECS State Police Judges LEOPS
16.53%
16.45%
17.70%17.27%
FY 2015 contributions reflect the reduced reinvested savings schedule per new legislation.
23

Reconciliation of Employer Contribution Rates
16 Other includes impact on contribution rate of change in total base payroll. Sources of change due to demographic experience described on slides 25 and 26.
(STATE ONLY)
Teachers' Employees'
Combined Combined State
System System Police Judges LEOPS Total
Actuarially Determined Calculations
FY2015 Contribution Rate 17.42% 19.32% 83.06% 42.74% 41.37% 18.91%Change due to Investment Return -0.85% -0.73% -2.79% -1.63% -1.01% -0.83%Change due to Demographic Experience -0.45% 0.00% -0.73% -0.52% -0.04% -0.30%Change due to Reduced Reinvested Savings 0.14% 0.12% 0.21% 0.00% 0.22% 0.14%Change due to Corridor 0.38% 0.47% 0.00% 0.00% 0.00% 0.40%Change due to Other -0.33% -1.12% -4.23% 0.10% -2.40% -0.59%Change due to Method Changes -0.23% -0.22% 0.00% 0.00% 0.00% -0.22%Change due to Assumption Changes 0.06% 0.05% 3.38% 0.01% 1.64% 0.11%
FY2016 Contribution Rate 16.15% 17.89% 78.91% 40.70% 39.77% 17.61%
Application of Corridor Method (Before Reinvested Savings)
FY2015 Corridor Contribution Rate 15.47% 15.53% 16.41%36% of Difference between FY2016 Actuarial Rate and FY2015 Corridor Rate 0.24% 0.85%FY2016 Budgeted Contribution Rate 15.71% 16.38% 78.91% 40.70% 39.77% 16.83%Reinvested Savings Rate 1.56% 1.32% 2.33% 0.00% 2.37% 1.49%Final FY2016 Total Budgeted Contr. Rate 17.27% 17.70% 81.24% 40.70% 42.14% 18.32%
Effect of Corridor -0.44% -1.51% -0.78%
24

Calculation of Contribution Rate Attributable to Reinvestment Amounts
17
Teachers' Employees'
Combined Combined State
System System Police Judges LEOPS Total
% of Total Pension Reform Savings# 67.7% 29.4% 1.4% 0.0% 1.5% 100.0%Reinvested Savings 101.5$ 44.0$ 2.1$ -$ 2.3$ 150.0$
FY 2016 Contributions
Illustrated Dollar Contributions 1,025.1$ 547.3$ 71.1$ 18.1$ 38.9$ 1,700.4$ Reinvested Savings 101.5$ 44.0$ 2.1$ -$ 2.3$ 150.0$ Total Illustrated Contributions 1,126.6$ 591.3$ 73.2$ 18.1$ 41.2$ 1,850.4$
FY 2015 Illustrated Contributions 1,057.6$ 523.8$ 71.2$ 18.0$ 38.4$ 1,709.0$
FY 2016 Contribution Rates
Employer Contribution Rate 15.71% 16.38% 78.91% 40.70% 39.77% 16.83%Reinvested Savings Rate^ 1.56% 1.32% 2.33% 0.00% 2.37% 1.49%Total Contribution Rate 17.27% 17.70% 81.24% 40.70% 42.14% 18.32%
(STATE ONLY, $ in Millions)
# Based on Calculations from June 30, 2011 Valuation. ^ Rate calculated based on allocated reinvested dollars and FY 2016 projected payroll. It is our
understanding that the Retirement Agency will monitor contributions to ensure that the System receives the proper amount of reinvested savings during Fiscal Year 2016.
FY 2015 contributions reflect the reduced reinvested savings schedule per new legislation.
25

Budgeted Employer Contribution Rates Year to Year Comparison ($ Millions)
18
Teachers' Employees'
Combined Combined State
System System Police Judges LEOPS Total
FY2016 Contribution Rate 17.27% 17.70% 81.24% 40.70% 42.14% 18.32%FY2015 Contribution Rate 16.53% 16.45% 84.73% 42.74% 43.10% 17.44%Year over Year Change 0.74% 1.25% -3.49% -2.04% -0.96% 0.88%
FY2016 Illustrative Contribution^ 1,025.1$ 547.3$ 71.1$ 18.1$ 38.9$ 1,700.4$ FY2016 Reinvested Savings 101.5$ 44.0$ 2.1$ -$ 2.3$ 150.0$ FY2016 Total Illustrative Contr. 1,126.6$ 591.3$ 73.2$ 18.1$ 41.2$ 1,850.4$
FY2015 Illustrative Contribution# 989.9$ 494.5$ 69.8$ 18.0$ 36.9$ 1,609.0$ FY2015 Reinvested Savings 67.7$ 29.4$ 1.4$ -$ 1.5$ 100.0$ FY2015 Total Illustrative Contr. 1,057.6$ 523.9$ 71.2$ 18.0$ 38.4$ 1,709.0$
Year over Year Change 69.1$ 67.5$ 2.0$ 0.1$ 2.8$ 141.4$
(STATE ONLY, $ in Millions)
^ FY2016 Contribution based on payroll as of June 30, 2014, projected to FY2015 for TCS and FY2016 for all other systems. FY2016 Contribution for TCS is $1,165 Million based on payroll projected to FY2016. # FY2015 Contribution based on payroll as of June 30, 2013, projected to FY2014 for TCS and FY2015 for all other systems. FY2015 Contribution for TCS is $1,227 Million based on payroll projected to FY2015. FY 2015 contributions reflect the reduced reinvested savings schedule per new legislation.
26

Recommended Fiscal Year 2016 Budgeted Contribution Rates
19
Reinvested savings should be added to the rates above.
System
Budgeted
Rate
Teachers' Combined System 15.71%
Employees' Combined System 16.38%
State Police 78.91%
Judges 40.70%
LEOPS 39.77%
(STATE ONLY)
27

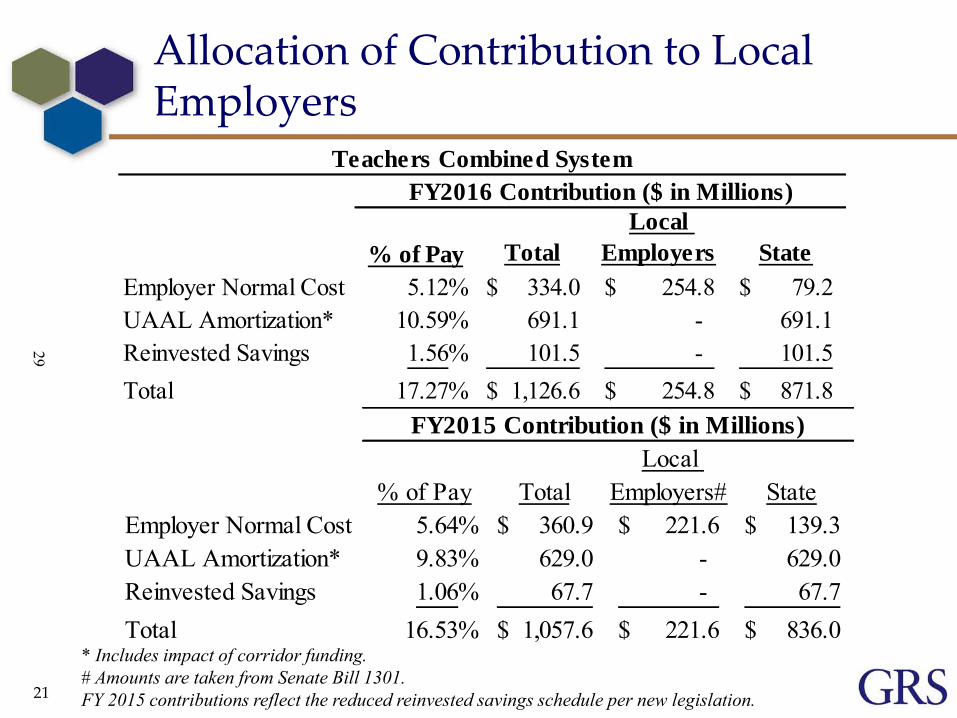
Allocation of Contribution to Local Employers
20
Allocation of Contributions to Local Employers
►Beginning in fiscal year 2013, local employers contribute a portion of the statutory normal cost contribution for the Teachers Combined System
►Normal cost contribution amounts for local employers for fiscal years 2013 through 2016 are defined in statute
►Beginning in fiscal year 2017, local employers will contribute the full normal cost contribution for their employees
28
Allocation of Contribution to Local Employers
21
* Includes impact of corridor funding. # Amounts are taken from Senate Bill 1301. FY 2015 contributions reflect the reduced reinvested savings schedule per new legislation.
% of Pay Total
Local
Employers State
Employer Normal Cost 5.12% 334.0$ 254.8$ 79.2$ UAAL Amortization* 10.59% 691.1 - 691.1 Reinvested Savings 1.56% 101.5 - 101.5 Total 17.27% 1,126.6$ 254.8$ 871.8$
FY2016 Contribution ($ in Millions)
Teachers Combined System
% of Pay TotalLocal
Employers# StateEmployer Normal Cost 5.64% 360.9$ 221.6$ 139.3$ UAAL Amortization* 9.83% 629.0 - 629.0 Reinvested Savings 1.06% 67.7 - 67.7 Total 16.53% 1,057.6$ 221.6$ 836.0$
FY2015 Contribution ($ in Millions)
29

Actuarial Value of Assets - ($ Millions)
22
$34,688 $36,178 $37,248 $39,351$42,997
$31,924$37,593 $37,179
$40,363$45,340
108.7%
96.2%100.2% 97.5% 94.8%
$0
$10,000
$20,000
$30,000
$40,000
$50,000
$60,000
$70,000
2010 2011 2012 2013 2014
State and Municipal
Actuarial Value of Assets (AVA) Market Value of Assets (MVA) Ratio of AVA to MVA
Millions
Valuation Year
The actuarial valuation is not based directly upon market value, but rather uses a smoothed value of assets that phases in each year’s gain or loss above/below the investment return assumption over 5 years.
30

Actuarial Value of Assets - ($ Millions)
23
$39,351
$42,997
$(729)
$3,080
$525
$770 $-
$36,000
$37,000
$38,000
$39,000
$40,000
$41,000
$42,000
$43,000
$44,000
Actuarial Value of Assets (Gain) Loss
2013 2014Net Non-
InvestmentCash Flow
Phase in of Current
Year Gain
Expected InvestmentReturn on Market Value of 7.70%
Phase in of Prior Year Deferred Gains/Losses
Effect of Collar
31

Actuarial Value of Assets – ($ Millions) Phase In of Deferred Gains and Losses
24
2014 2015 2016 2017 2018
1. Value at July 1, 2013 39,351.0$
2. Net Cash Flow (729.5)
3. Investment Return 5,706.3
4. Expected Return 3,080.4
5. Gain or loss (3-4) 2,625.9
6. Amount for full recognition 3,080.4
7. Phase-in amounts
7a. From this year 525.2
7b. From one year ago 197.9 525.2$
7c. From two years ago (557.9) 197.9 525.2$
7d. From three years ago 764.4 (557.9) 197.9 525.2$
7e. From four years ago 365.5 764.4 (557.9) 197.9 525.2$
8. Total Phase-ins 1,295.1 929.6 165.1 723.1 525.2
9. Final Value: 1+2+6+8 42,997.0
There is a net gain of about $2.3 Billion to be recognized in the future ($2.1 Billion State and $200 Million Municipal)
32
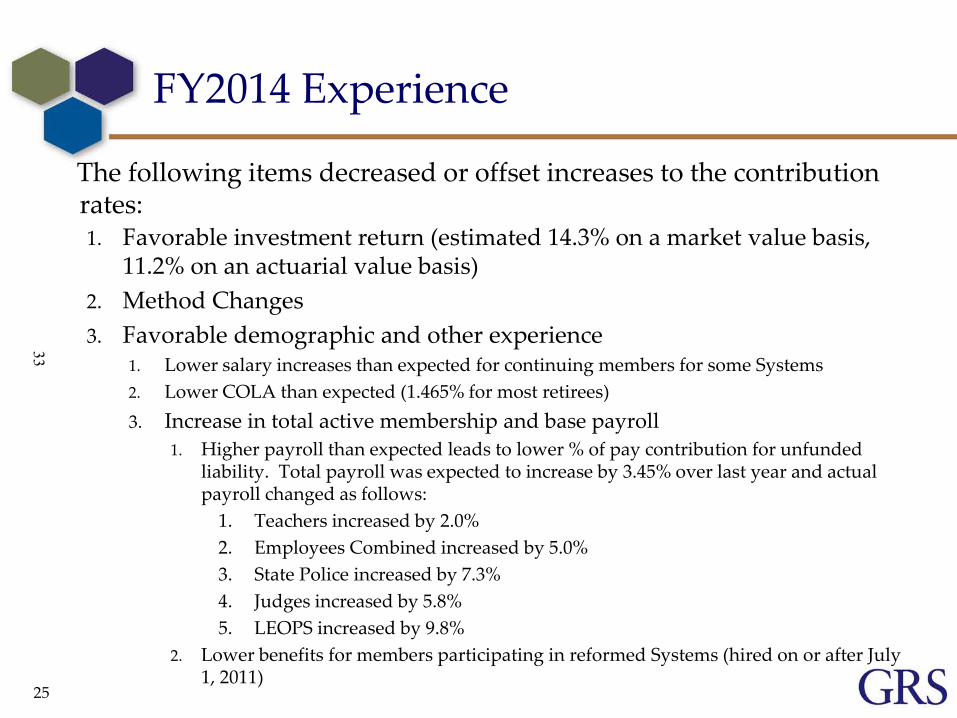
FY2014 Experience
1. Favorable investment return (estimated 14.3% on a market value basis, 11.2% on an actuarial value basis)
2. Method Changes
3. Favorable demographic and other experience 1. Lower salary increases than expected for continuing members for some Systems
2. Lower COLA than expected (1.465% for most retirees)
3. Increase in total active membership and base payroll
1. Higher payroll than expected leads to lower % of pay contribution for unfunded liability. Total payroll was expected to increase by 3.45% over last year and actual payroll changed as follows:
1. Teachers increased by 2.0%
2. Employees Combined increased by 5.0%
3. State Police increased by 7.3%
4. Judges increased by 5.8%
5. LEOPS increased by 9.8%
2. Lower benefits for members participating in reformed Systems (hired on or after July 1, 2011)
25
The following items decreased or offset increases to the contribution
rates:
33
FY2014 Experience
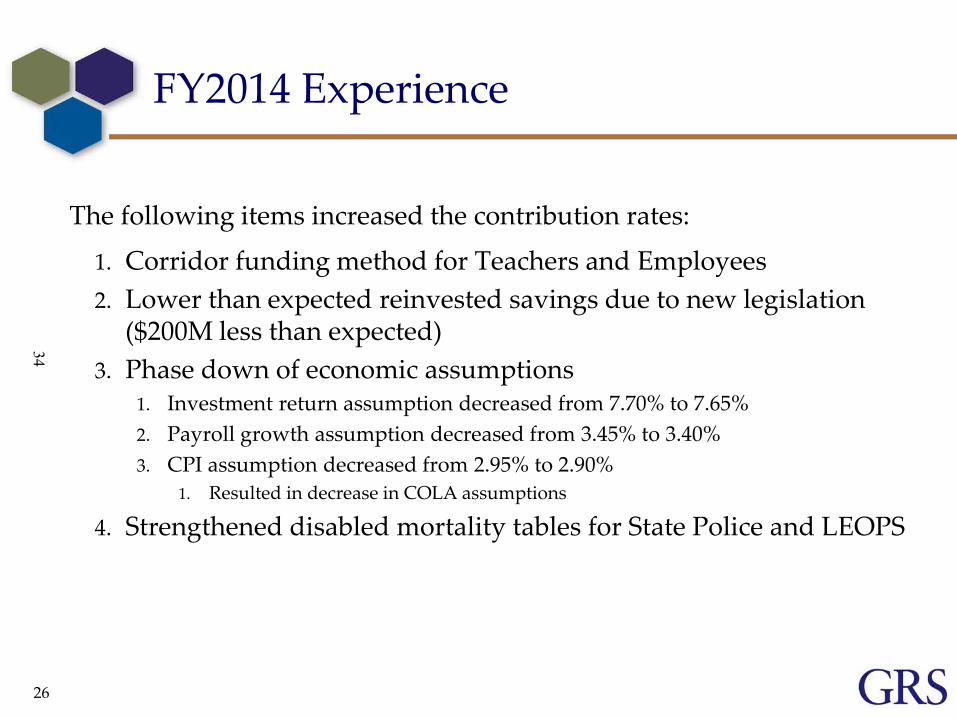
1. Corridor funding method for Teachers and Employees
2. Lower than expected reinvested savings due to new legislation ($200M less than expected)
3. Phase down of economic assumptions 1. Investment return assumption decreased from 7.70% to 7.65%
2. Payroll growth assumption decreased from 3.45% to 3.40%
3. CPI assumption decreased from 2.95% to 2.90%
1. Resulted in decrease in COLA assumptions
4. Strengthened disabled mortality tables for State Police and LEOPS
26
The following items increased the contribution rates:
34

Membership History Combined State and Municipal
27
116.007 120.247 127.171 132.493 137.925 142.887
199.705 197.786 195.059 192.994 192.810 193.522
1
1.1
1.2
1.3
1.4
1.5
1.6
1.7
1.8
1.9
2
0
50
100
150
200
250
300
350
400
2009 2010 2011 2012 2013 2014
Th
ou
san
ds
Retirees Actives Ratio of Actives to Retirees
35

Historical Trends – Change in Funded Status, 2006 to 2014
28
82.8%80.4% 78.6%
65.0% 64.1% 64.7% 64.4%65.5%
68.7%
$0
$10,000
$20,000
$30,000
$40,000
$50,000
$60,000
$70,000
06 07 08 09 10 11 12 13 14
State and Municipal
Accrued Liability Actuarial Value of Assets Market Value of Assets Funded Ratio
Millions
Valuation Year
36

Ratio of Accrued Liability and Market Value of Assets to Payroll
29
0
1
2
3
4
5
6
7
06 07 08 09 10 11 12 13 14
State and Municipal
Accrued Liability to Payroll Market Value of Assets to Payroll
Valuation Year
37

Historical Trends – Non-Investment Cash Flow (State and Municipal)
30
$0
$500
$1,000
$1,500
$2,000
$2,500
$3,000
$3,500
2004 2005 2006 2007 2008 2009 2010 2011 2012 2013 2014
Mil
lio
ns
Employer Contributions Member Contributions Benefit Payments
38

Percent of Employer Contributions and Benefit Payments to Payroll
31
0.00%
5.00%
10.00%
15.00%
20.00%
25.00%
30.00%
35.00%
06 07 08 09 10 11 12 13 14
State and Municipal
Employer Contributions to Payroll Benefit Payments to Payroll
Valuation Year
39
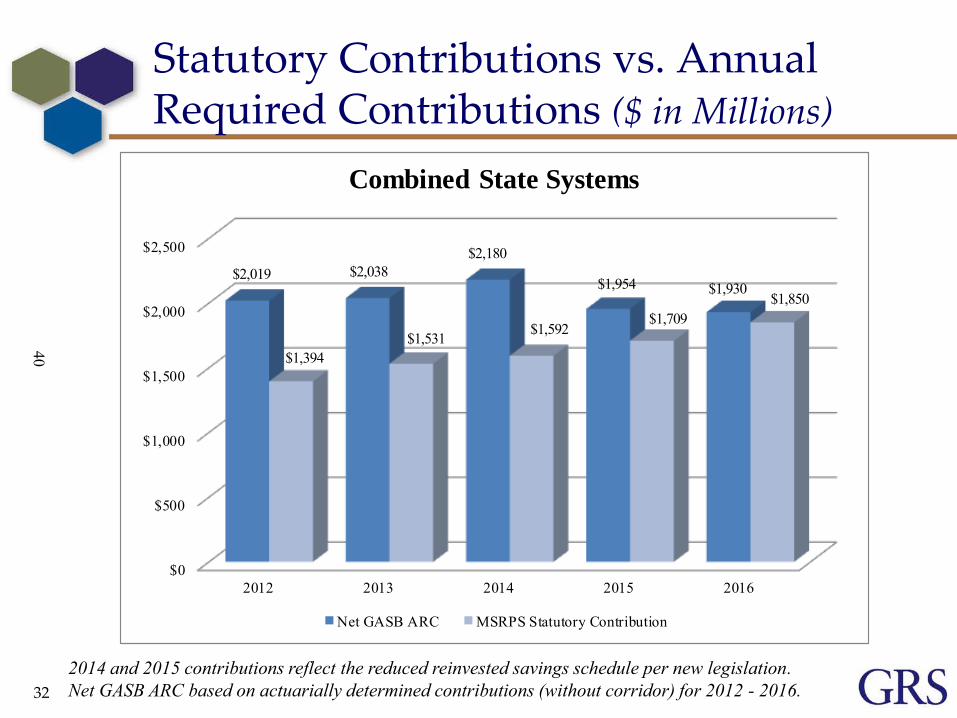
Statutory Contributions vs. Annual Required Contributions ($ in Millions)
32
$0
$500
$1,000
$1,500
$2,000
$2,500
2012 2013 2014 2015 2016
$2,019 $2,038$2,180
$1,954 $1,930
$1,394$1,531 $1,592
$1,709$1,850
Combined State Systems
Net GASB ARC MSRPS Statutory Contribution
2014 and 2015 contributions reflect the reduced reinvested savings schedule per new legislation. Net GASB ARC based on actuarially determined contributions (without corridor) for 2012 - 2016.
40

GASB No. 67 - Plan Net Position as Percent of Total Pension Liability*
33
1% Decrease to SDR
Single Discount Rate
(SDR) Assumption 1% Increase to SDR
System 6.65% 7.65% 8.65%
Teachers 65.36% 73.65% 82.40%Employees (State) 58.43% 65.35% 72.60%State Police 58.56% 66.11% 73.89%Judges 80.55% 88.84% 97.42%LEOPS (State) 55.88% 63.12% 70.67%Employees (Muni) 77.63% 86.90% 96.66%LEOPS (Muni) 53.26% 61.19% 69.62%CORS 86.93% 99.27% 112.43%Total MSRPS 63.94% 71.87% 80.21%
* The figures on this page were developed using a measurement date of June 30, 2013 for Total Pension Liability (TPL) rolled forward to June 30, 2014 (reflecting changes in assumptions) and a measurement date of June 30, 2014 for the Fiduciary Net Position. This practice will facilitate completion of MSRPS’ reporting requirements in the future. Because the TPL was rolled forward, figures shown above will not match comparable figures shown elsewhere.
41

Concluding Comments
34
Employer contributions changed in approximately the manner in which was projected from the June 30, 2013 valuation results. Overall, the experience was more favorable than anticipated for the fiscal year ending June 30, 2013 which led to slightly lower FY 2016 illustrative contributions for the State (and local employers) than was projected.
Reduction in reinvested savings will slow growth of funded ratio
► System still projected to attain an 85% funded ratio in 2028
State Systems on a path to reach a 100% funded ratio by 2039
42

Conclusion
35
What Is Needed to Sustain MSRPS?
►Continued reasonable forecasts of resources and obligations
►Continued sound investment program
►Continued long-term approach to changes
►Continued adherence to funding policy
43
Copyright © 2014 GRS – All rights reserved.
GASB Changes
44

GASB Changes - Overview
New GASB Accounting Standards No. 67 and No. 68 will create accounting results separate from funding results ►Funding calculations are not impacted
►GASB created a new Net Pension Liability (NPL) and Pension Expense
►Statement No. 67 replaces Statement No. 25
►Statement No. 68 replaces Statement No. 27
37
45

GASB Changes - Overview
Requires recognition of a version of unfunded liability on each employer’s balance sheet ►Formerly only in footnotes
Changes calculation of annual cost ►No longer equal to required contribution
(ARC)
Meant to improve transparency and comparability – market assets, single funding method, rigid amortization rules
38
46

GASB Changes - Overview
Special Rules
►All pension plans (single, cost sharing, and agent employers) have to disclose their assets in great detail as well as plan description, Board composition, investment policies, etc. Identify participating GAAP entities
►Single and cost-sharing plans have to disclose TPL, NPL, etc, but agent plans do not
39
47

GASB Changes - Overview
Key differences for employer accounting ►New GASB rules do not allow smoothing of
assets
►New GASB rules may require lower (or blended) discount rate to value liabilities
Key takeaways ►New GASB rules do NOT change the funding
contribution rate or methods
►New GASB rules do provide a second set of actuarial numbers
40
48

Disclosures
This presentation is intended to be used in conjunction with the June 30, 2014 actuarial valuation report. This presentation should not be relied on for any purpose other than the purpose described in the valuation report.
Circular 230 Notice: Pursuant to regulations issued by the IRS, to the extent this
presentation concerns tax matters, it is not intended or written to be used, and cannot be used, for the purpose of (i) avoiding tax-related penalties under the Internal Revenue Code or (ii) marketing or recommending to another party any tax-related matter addressed within. Each taxpayer should seek advice based on the individual’s circumstances from an independent tax advisor.
This presentation shall not be construed to provide tax advice, legal advice or investment advice.
The actuaries submitting this presentation (Brian Murphy, Brad Armstrong, and Amy Williams) are members of the American Academy of Actuaries and meet the Qualification Standards of the American Academy of Actuaries to render the actuarial opinion contained herein.
The purposes of the actuarial valuation are to measure the financial position of MSRPS, assist the Board in establishing employer contribution rates necessary to fund the benefits provided by MSRPS, and provide actuarial reporting and disclosure information for financial reporting.
41
49

Disclosures
Future actuarial measurements may differ significantly from the current and projected measurements presented in this presentation due to such factors as the following: plan experience differing from that anticipated by the economic or demographic assumptions; changes in economic or demographic assumptions; increases or decreases expected as part of the natural operation of the methodology used for these measurements (such as the end of an amortization period or additional cost or contribution requirements based on the plan’s funded status); and changes in plan provisions or applicable law.
This is one of multiple documents comprising the actuarial reports for the combined systems and the municipal corporations. Additional information regarding actuarial assumptions and methods, and important additional disclosures are provided in the Actuarial Valuations as of June 30, 2014.
If you need additional information to make an informed decision about the contents of this presentation, or if anything appears to be missing or incomplete, please contact us before relying on this presentation.
42
50

Copyright © 2014 GRS – All rights reserved.
Appendix
51

State Demographic Data by System
44
2013 TCS 2014 TCS 2013 ECS 2014 ECSRetired 66,390 68,929 51,798 53,457Vested Former 23,555 24,220 21,078 20,914Active 104,028 104,470 60,129 60,151Total 193,973 197,619 133,005 134,522
193,973 197,619
133,005 134,522
0
50,000
100,000
150,000
200,000
250,000
Cou
nt
52

State Demographic Data by System
45
2013StatePolice
2014StatePolice
2013Judges
2014Judges
2013LEOPS
2014LEOPS
Retired 2,428 2,468 378 395 1,246 1,309Vested Former 84 82 10 8 172 192Active 1,320 1,351 288 301 1,459 1,543Total 3,832 3,901 676 704 2,877 3,044
3,832 3,901
676 704
2,877 3,044
0
500
1,000
1,500
2,000
2,500
3,000
3,500
4,000
4,500
Cou
nt
53

State Demographic Data by System
46
TCS ECS State Police Judges LEOPS Total
Active Members
2014 Count 104,470 60,151 1,351 301 1,543 167,8162013 Count 104,028 60,129 1,320 288 1,459 167,2242012 Count 103,694 60,719 1,332 294 1,473 167,512% Change 2014/2013 0.4% 0.0% 2.3% 4.5% 5.8% 0.4%
2014 Payroll ($Mill) $6,310.3 $3,177.7 $85.7 $42.3 $93.0 $9,709.02013 Payroll ($Mill) $6,185.2 $3,026.1 $79.8 $40.0 $84.7 $9,415.82012 Payroll ($Mill) $6,080.6 $3,001.2 $77.7 $40.0 $83.7 $9,283.1% Change 2014/2013 2.0% 5.0% 7.3% 5.8% 9.8% 3.1%
2014 Average Pay $ 60,403 $ 52,829 $ 63,405 $ 140,576 $ 60,290 $ 57,8552013 Average Pay $ 59,457 $ 50,326 $ 60,491 $ 138,891 $ 58,077 $ 56,3072012 Average Pay $ 58,640 $ 49,428 $ 58,326 $ 135,903 $ 56,803 $ 55,418% Change 2014/2013 1.6% 5.0% 4.8% 1.2% 3.8% 2.7%
54

State Demographic Data by System
47
TCS ECS State Police Judges LEOPS Total
Retired Members
2014 Count 68,929 53,457 2,468 395 1,309 126,5582013 Count 66,390 51,798 2,428 378 1,246 122,2402012 Count 63,699 49,955 2,387 365 1,161 117,567% Change 2014/2013 3.8% 3.2% 1.6% 4.5% 5.1% 3.5%
2014 Benefits ($ Mill) $1,850.9 $895.8 $113.1 $28.7 $43.0 $2,931.52013 Benefits ($ Mill) $1,758.6 $851.2 $109.9 $26.5 $40.4 $2,786.62012 Benefits ($ Mill) $1,657.5 $801.1 $106.0 $25.2 $36.9 $2,626.6% Change 2014/2013 5.2% 5.2% 2.9% 8.3% 6.4% 5.2%
Vested Former Members
2014 Count 24,220 20,914 82 8 192 45,4162013 Count 23,555 21,078 84 10 172 44,8992012 Count 23,033 21,335 85 10 162 44,625% Change 2014/2013 2.8% -0.8% -2.4% -20.0% 11.6% 1.2%
55

Membership History Combined State and Municipal
48
167.873 172.022 178.082 183.723 189.477 195.020
199.705 197.786 195.059 192.994 192.810 193.522
0.8
0.85
0.9
0.95
1
1.05
1.1
1.15
1.2
0
50
100
150
200
250
300
350
400
450
2009 2010 2011 2012 2013 2014
Th
ou
san
ds
Non-Actives Actives Ratio of Actives to Non-Actives
56

57

58

59

60

61

62
63

64

65

66

67

68

Annual State Retirement and Pension System’s Investment Overview
Presented to the
Joint Committee on Pensions
Department of Legislative Services Office of Policy Analysis
Annapolis, Maryland
December 2014
69
Appendix 2

70

Annual State Retirement and Pension System’s Investment Overview
At the request of the Joint Committee on Pensions, the Department of Legislative Services (DLS) annually reviews the investment performance of the State Retirement and Pension System (SRPS) for the preceding fiscal year. This report is intended to provide an overview of the SRPS performance, a comparison of this performance to its peers, and an identification of issues meriting consideration by the joint committee during the upcoming legislative session.
State Retirement and Pension System Investment Performance
The system’s investment return for fiscal 2014 was 14.4% net of management fees, exceeding its investment return target of 7.70% for the fourth time in the last five years. Public equities continued to lead the fund’s strong performance, with broad indices of public equities surging upward – the U.S. domestic S&P 500 index rose 24.6% and the MSCI international index rose 21.8%. With public equities making up 38.9% of the portfolio, this impressive performance propelled the system to generate returns well in excess of its target.
As shown in Exhibit 1, the system’s assets totaled $45.42 billion as of June 30, 2014, an
increase of 12.8% over fiscal 2013 after accounting for benefit payouts and other expenses. This is the highest fiscal year-end balance in the fund’s history and the second year in a row that the fund has exceeded the $40.0 billion level. As noted above, the strongest performing asset classes in fiscal 2014 were public equity (22.2%), private equity (19.6%), and real estate (14.2%). With financial markets still operating in a low interest rate environment, the two weakest classes were fixed income (4.6%) and real return (7.0%). Asset class performance is discussed in greater detail later in this report.
71

Exhibit 1
State Retirement and Pension System of Maryland Fund Investment Performance for Periods Ending June 30*
($ in Millions)
Time Weighted Total Returns Assets % Total 1 Year 5 Years 10 Years Domestic Equity $4,660.7 10.3% 26.1% 18.9% 7.7% International Equity 5,502.6 12.1% 20.4% 11.5% 7.6% Global Equity 7,508.0 16.5% 21.1% 15.4% n/a Fixed Income 6,706.3 14.8% 4.6% 6.5% 5.6% Credit and Debt 4,557.2 10.0% 11.5% 12.0% n/a Real Estate 3,082.2 6.8% 14.2% 12.3% 8.4% Real Return 5,461.7 12.0% 7.0% 6.9% n/a Private Equity 3,185.0 7.0% 19.6% 15.3% 12.8% Absolute Return 4,252.1 9.4% 7.6% 6.1% n/a Cash 500.0 1.1% 0.8% 2.7% n/a Total Fund $45,415.6 100.0% 14.4% 11.7% 6.5%
*Data presented here includes money invested by the system on behalf of the Maryland Transit Administration. Note: Returns beyond one year are annualized. Returns are net of fees, except for 10-year returns, which are gross of fees. Columns may not add to total due to rounding. Source: State Street Investment Analytics
As shown in Exhibit 2, total system assets increased by almost $5.0 billion from
fiscal 2013 to 2014. In fiscal 2014, the system paid out $3.1 billion in benefits, the first time that figure has exceeded $3.0 billion, and total deductions were $3.2 billion. Income derived from employer and employee contributions totaled $2.5 billion, leaving an initial funding deficit of $0.7 billion; however, total investment income was $5.7 billion, more than covering the funding gap on a cash basis. Total deductions increased by 5.8%, and total additions increased by 4.5% over fiscal 2013 levels. This pattern is expected to continue due to restrained payroll growth combined with increasing rates of retirement among active members, which will put continued pressure on the investment program to continue covering the ongoing and expanding funding gap.
72

Exhibit 2 State Retirement and Pension System of Maryland
Statement of Changes in Net Assets Available for Plan Benefits Fiscal 2013-2014
($ in Millions)
2014 2013 Increase in Assets
Contributions State and Other Employers $1,733.6 $1,643.1 Member 727.7 710.9 Net Investment Income* 5,706.3 3,845.8 Total Additions $8,167.6 $6,199.8 Decrease in Assets
Benefit Payments -$3,121.8 -$2,950.7 Administrative Expenses -26.1 -26.3 Refunds -42.9 -38.3 Total Deductions -$3,190.8 -$3,015.3 Change in Assets During Period $4,976.8 $3,184.5 *Dividends, interest, realized and unrealized capital gains.
Note: Data presented here includes the system’s bank cash account but excludes money invested by the system on behalf of the Maryland Transit Administration. Columns may not add to total due to rounding. Source: State Retirement Agency
Terra Maria Program The Terra Maria program, the system’s emerging manager program, continued to add value
to the portfolio, but its performance has weakened compared with its early years. Now in its eighth year, the program’s returns continue to exceed benchmarks, both on an annual basis and since inception. However, with the program exceeding its benchmark by just 24 basis points in fiscal 2014, annual performance has dipped considerably from its early years, when performance exceeded the benchmark by more than 100 basis points. The program has also continued to experience some retrenchment in size, both relative to total assets and in the total number of managers involved. After hitting its peak of 110 asset managers in fiscal 2012, the Terra Maria program finished fiscal 2014 with 89 managers, down from 94 in fiscal 2013. Total assets devoted to the program increased slightly, from almost $2.8 billion in fiscal 2013 to almost $3.0 billion in fiscal 2014. However, as a proportion of total assets, Terra Maria dropped from 6.9% of total assets in fiscal 2013 to 6.6% in fiscal 2014, reflecting stronger growth in total assets. These trends are driven in part by continued retrenchment in the system’s public equity holdings, which
73

comprise the vast majority of the Terra Maria program, as well as manager performance, with a handful of managers terminated during the year. Exhibit 3 provides an overview of the Terra Maria program by program manager and asset class.
Exhibit 3 Terra Maria Program Performance
June 30, 2014 ($ in Millions)
Performance
Program Manager Total Assets Fiscal 2014
Actual Fiscal 2014 Benchmark
Inception Actual
Inception Benchmark
Attucks $450.8 21.3% 21.3% 17.7% 16.3% Bivium 333.9 22.2% 22.4% 16.5% 16.4% Capital Prospects 455.0 22.5% 20.8% 20.1% 19.4% FIS Group 388.4 23.3% 23.2% 16.8% 16.2% Leading Edge 395.9 21.0% 21.2% 17.1% 16.6% Northern Trust 650.4 19.4% 20.0% 6.1% 5.0% Progress 306.9 4.6% 3.5% 9.8% 9.6% Asset Class U.S. Equity $1,356.3 25.3% 25.0% 9.2% 8.0% International Equity 850.6 22.1% 22.0% 3.0% 1.1% Global Equity 22.3 23.0% 23.0% 13.3% 14.5% Fixed Income 509.2 4.2% 3.5% 7.7% 9.2% Credit/Debt 208.0 13.6% 14.5% 10.0% 10.4% Real Return 34.7 5.9% 4.4% 6.6% 6.4% Total $2,981.2 19.6% 19.3% 6.5% 5.1%
Note: Actual returns are net of fees; returns beyond one year are annualized. Total assets may not sum to total due to rounding.
Source: State Retirement Agency
For fiscal 2014, four of the seven program managers met or exceeded their performance
benchmarks, and on the whole, program performance exceeded its benchmark by 24 basis points. Results are more positive when analyzed by asset class, with managers in five of the six asset classes meeting or exceeding their performance benchmarks. Only credit/debt failed to meet its benchmark, where three out of five asset managers failed to meet their individual benchmarks.
74

Since its inception, the Terra Maria program continues to add value to the portfolio, beating its overall composite benchmark by 139 basis points. This is the lowest level of excess annualized returns above benchmark since the program’s inception, which reflects its maturation. Among asset classes, only domestic and international equity and real return have exceeded benchmarks since inception. All seven program managers are now beating their benchmarks since inception. Performance Compared to Other Systems According to the Trust Universe Comparison Service (TUCS), the system’s fiscal 2014 investment performance was among the worst of 25 public pension funds with at least $25 billion in assets. The system’s fiscal 2014 performance placed it at the ninety-fourth percentile, as shown in Exhibit 4. In the TUCS analysis, the one-hundredth percentile is the lowest ranking, and the first percentile is the highest. Maryland’s ranking, therefore, showed no meaningful change in relative performance from fiscal 2013. Long-term performance rankings place SRPS in the bottom quartile for every timeframe examined. The TUCS rankings are based on returns gross of fees.
Exhibit 4 TUCS Percentile Rankings for Periods Ending June 30
Fiscal 2011-2014
2011 2012 2013 2014 1 Year 87 75 93 94 3 Years 55 60 87 94 5 Years 87 81 68 84 10 Years 100 93 99 99
TUCS: Trust Universe Comparison Service Source: Trust Universe Comparison Service
The TUCS rankings are useful for providing a snapshot assessment of the system’s performance relative to other large public pension plans. However, the rankings do not identify the other funds against which SRPS is measured, and provides only limited information on their asset allocation, which has been shown to be responsible for most variation in performance among investment portfolios. Therefore, the rankings by themselves offer little by way of explaining why Maryland’s performance lags behind that of other funds. However, data provided by TUCS on the risk-return profile of its members provide some explanation. The data show that the system’s level of risk over the three-year period ending September 30, 2014, was below the median for other public funds with assets greater than $25.0 billion. In expanding markets, low-risk portfolios tend to generate lower rates of return than high-risk portfolios, so the system’s below-median performance is somewhat predicted by its low-risk profile. However, the system’s returns were lower than at least five other systems with lower-risk profiles, which indicates that its returns are
75

lower than would be expected given its risk profile. Again, TUCS only measures relative performance at a given point in time, but provides very little information regarding the reasons for relative performance levels of its member funds. A more in-depth examination of asset allocation and returns in comparable state pension plans further illustrates the relationship between allocations to equity and fund performance. In short, high allocations to public and private equity are associated with higher returns due to the run-up in those markets over the last few years. Based on data compiled by the State Retirement Agency (SRA), DLS identified eight other state pension funds with asset levels that exceed $25.0 billion, which is considered the SRPS peer group; these are shown in Exhibit 5. All eight funds outperformed SRPS in fiscal 2014. Five of the eight funds have public equity allocations that exceed Maryland’s which largely explains their overperformance relative to SRPS. Of the three remaining funds with public equity allocations equal to or below Maryland’s, Pennsylvania Teachers and Washington have the highest allocations to private equity, resulting in very high total exposure to equity. This largely explains their over-performance relative to Maryland. By contrast, South Carolina had lower allocations to both public and private equity but generated stronger returns than did Maryland in other asset classes, including real estate, fixed income, private equity, and hedge funds, to exceed Maryland’s annual investment return. The system’s asset allocation strategy is discussed further in the following section.
Exhibit 5 Performance and Asset Allocation of Public Pension Fund Peers
As of June 30, 2014
Asset Allocation
Fiscal 2014
Performance Assets
($ in Millions) Public Equity
Private Equity
Real Estate Total Equity
Massachusetts 17.6% $60.7 43.1% 11.1% 8.9% 63.1% Florida 17.4% 149.1 60.2% 5.4% 7.4% 60.2% Washington 17.1% 78.0 38.9% 22.8% 12.9% 74.5% New Jersey 16.9% n/a 50.7% 7.6% 3.6% 61.9% North Carolina 15.9% 90.1 46.8% 4.8% 8.4% 60.0% Virginia 15.7% 66.0 43.6% 7.8% 8.8% 60.2% South Carolina 15.3% 29.8 30.8% 8.9% 3.6% 43.3% Pennsylvania Teachers 14.9% 53.3 21.9% 21.0% 14.3% 57.2% Maryland 14.4% 45.4 38.9% 7.0% 6.8% 52.7% Source: State Retirement Agency
76

Looking Ahead: The Future of SRPS Investments Asset Allocation Continues Transition to Long-term Targets In its annual spring review of asset allocation, the board did not make any changes to the
overall strategic asset class targets. However, it did raise its maximum hedge fund allocation across all asset targets from 15.0% to 20.0% of total assets. At the time, total hedge fund allocation was 12.1% across all asset classes, including 6.9% outside of the absolute return asset class. The increase in the cap has little practical effect in the short term because the fund would not have exceeded its previous cap for another year or two. In the long term, it gives the system more flexibility to invest in a greater diversity of hedge funds. Aside from this one change, the system has focused its efforts on achieving its long-term strategic targets, as shown in Exhibit 6.
Exhibit 6 State Retirement and Pension System Asset Allocation
Fiscal 2012-2014
Strategic Target
6/30/2014 Actual
6/30/2014 Actual
6/30/2013 Actual
6/30/2012
Equity Domestic Stocks 10.3% 11.6% 13.0% International Stocks 12.1% 13.8% 15.0% Global Equity 16.5% 17.0% 14.4% Total Public Equity 35.0% 38.9% 42.4% 42.4% Private Equity 10.0% 7.0% 6.2% 5.7% Real Estate 10.0% 6.8% 5.8% 6.4% Fixed Income 10.0% 14.8% 16.2% 19.2% Real Return Strategies 14.0% 12.0% 12.6% 10.0% Absolute Return 10.0% 9.4% 7.3% 6.8% Credit/Debt 10.0% 10.0% 8.4% 7.8% Cash and Other 1.0% 1.1% 1.3% 1.7% Total Assets 100.0% 100.0% 100.0% 100.0%
Note: Data reflects all system assets held at State Street. Columns may not add to total due to rounding. Source: State Retirement Agency
Exhibit 6 also shows that, with the exception of real return, all asset classes moved closer to their strategic targets, continuing a trend that began with significant restructuring of the portfolio in fiscal 2008 and 2009. Most notably, public equity dropped from 42.4% to 38.9%, approaching
77

its target of 35.0%, and fixed income dropped from 16.2% to 14.8%, moving closer to its target of 10.0%. There were corresponding increases to alternative asset classes, including private equity and absolute return.
DLS has consistently supported the system’s overall strategy of diminishing its allocation
to public equity as part of an overall approach to decrease risk through diversification in the wake of the 2008 financial crisis, and continues to do so. Exhibit 7 shows why a shift from public equity to alternative strategies like hedge funds can benefit the fund in turbulent markets. In general, hedge fund performance tracks domestic equity performance, but with less volatility, and this has been especially true of the system’s hedge fund portfolio. In fiscal 2009, for instance, when domestic equities dropped 26.3%, the system’s small absolute return allocation (it was then only 2.6% of total assets) dropped only 6.4%, net of fees. These patterns are, in large measure, what prompted the system to shift assets from public equities to alternative strategies like hedge funds in an effort to derisk the portfolio. The overall strategy should not be abandoned just because public equities have been on a multi-year growth pattern, because doing so will not provide sufficient protection when equity markets decline.
Exhibit 7 Equity, Bond, and Hedge Fund Annual Returns
Calendar 2004-2013
Source: Standard & Poors, Barclays, Hedge Fund Research, Inc.
-40%-35%-30%-25%-20%-15%-10%-5%0%5%
10%15%20%25%30%35%40%
2004 2005 2006 2007 2008 2009 2010 2011 2012 2013
S&P 500 Barclay’s U.S. Aggregate Hedge Fund Research, Inc. Fund of Funds
78

Nevertheless, in expanding markets, Exhibit 7 also shows that hedge fund returns frequently trail equity returns. In fiscal 2014, the system’s public equity portfolio grew 22.1%, and the absolute return asset class grew just 7.6%. The persistent strength of the public equity markets raises legitimate questions about the extent to which the system has implemented its plan. Specifically, the long-term strategic target of 35.0% for public equity is among the lowest of large public pension plans and has resulted in bottom-tier performance compared with peer funds. Although DLS supports the system’s diversification into alternative asset classes to reduce reliance on volatile public equities, it may be the case that the board has opted for a public equity allocation that is too low. The Board of Trustees and SRA should comment on the appropriateness of the system’s 35.0% target for public equities in light of persistent underperformance relative to large state pension funds. It should also comment on the system’s underperformance relative to other public pension funds with low-risk profiles.
Appendix 1 presents the fiscal year-end performance by each investment manager for
fiscal 2011 and prior periods, by asset class, and subclass.
Investment Management Fees Continue to Grow, Providing Opportunity for Internal Management SRPS incurred $331.2 million in investment management fees during fiscal 2014, a 20.5% increase over fiscal 2013 fees. As shown in Exhibit 8, management fees for the plan as a whole have grown substantially since fiscal 2008, when the system adjusted its asset allocation to invest more heavily in alternative asset classes with higher fee structures. The shift of public equity assets to global equity managers, which are almost all active managers, contributed significantly to the growth in fees over the past two years. However, the shift was also responsible for a significant improvement in public equity performance relative to its benchmark.
Rapid growth in investment management fees is not unique to Maryland, and it is prompting more large public pension funds to examine the option of moving more investment management functions in-house instead of relying solely on external managers. A major motivating factor in those decisions has been reducing investment management costs. According to Pensions & Investments, 26% of large public defined benefit pension funds report using internal management for at least a portion of their portfolio, but the proportion is growing. North Carolina became the latest state to expand internal management with the addition of 10 new investment positions with flexibility to pay market rate salaries. With SRPS assets reaching record levels, consideration should be given to examining the costs and benefits associated with employing internal asset management in selected areas to reduce management costs. DLS notes that moving to internal management would require substantial increase in staffing and flexibility to provide market rate compensation to a larger number of investment staff, but could also generate substantial net savings in management costs. DLS asks that the board and SRA discuss the advantages and disadvantages of implementing internal management of some system assets, the prerequisites for implementing internal management, and the asset classes that would be the best candidates for internal management.
79

Exhibit 8
Asset Management Fees Paid by Asset Class Fiscal 2008-2014
($ in Millions)
2008 2010 2012 2013 2014 Public Equity $40.6 $55.4 $49.5 $67.2 $86.7 Fixed Income 10.0 7.9 9.4 11.5 9.6 Real Estate 20.9 25.1 30.0 24.7 26.4 Private Equity 12.6 35.6 44.6 53.8 59.3 Real Return n/a 15.9 20.9 24.0 26.4 Credit and Debt Related n/a 10.3 33.0 46.3 63.0 Absolute Return n/a 13.5 26.0 34.7 33.2 Currency n/a 14.4 9.2 9.0 7.0 Service Providers/Other 5.2 1.4 3.1 3.7 3.8 Terra Maria n/a n/a 16.5 n/a 15.6 Total $89.3 $183.7 $242.3 $274.9 $331.2
Note: Columns may not sum to total due to rounding. Source: State Retirement Agency Currency Program Has Mixed Results The currency hedging program was a drag on returns during fiscal 2014 but has since provided significant benefits to the system. Adopted in fiscal 2009, the program is designed to protect against losing value when the dollar appreciates relative to currencies in countries in which the system holds assets. During periods when the dollar is weak, the currency management program offers a hedge, or protection, against dollar appreciation that can devalue international earnings. During those periods, the program’s modest cost ($7.0 million in management fees during fiscal 2014) manifests as a slight drag on international equity holdings. However, when the dollar appreciates, the program provides returns that help offset, and sometimes exceed, the currency losses generated by the strengthening dollar. During fiscal 2014, with the U.S. dollar relatively weak against foreign currencies, the program lowered international and global equity returns. In international equity, for instance, the system earned 22.0% absent the currency program, but 20.4% after factoring in the cost of the currency program. As of June 30, 2014, the currency program had a net loss of $108.3 million since inception. However, with the Eurozone and Japanese economies still struggling, and both central banks taking steps to stimulate growth through monetary policies, the dollar began strengthening
80

over the summer. As a result, the performance of the currency program has rebounded, with net returns of $160 million since inception as of December 5, 2014. This is consistent with the program’s overall design, which is intended to break even over the long term. The system has taken steps to lock in the program’s gains, however. Given the currency program’s volatile performance since its inception, DLS questions the long-term need for the program. Over time, gains and losses due to currency fluctuations are expected to break even. The program is designed to minimize downside risks from currency fluctuations, but it has shown on several occasions that the drag on portfolio performance during times that the dollar is weak can be considerable. The board and SRA are asked to discuss the program’s weak performance during fiscal 2014 and its effect on their plans for the program’s future.
81

82
Appendix 3

83

84

85

Overview of Optional Membership for Elected and Appointed Officials in the Employees’ Pension System
Chapter 636 of 2014 charged the State Retirement Agency with studying the issue of the optional membership for elected and appointed officials in the Employees’ Pension System. This report provides an historical overview of the optional membership provision as it evolved in State pension law to its current posture. In addition, the State Retirement Agency concludes this report with recommendations regarding the future of optional membership for elected and appointed officials. During the 1939 legislative session, the Board of Trustees for the State Employees’ Retirement System submitted recommendations to the General Assembly addressing the “advisability of creating a permanent and sound retirement system” for employees other than teachers. (The Teachers’ Retirement System had been established in 1927.) In 1941, the recommendations of the Board were enacted through Chapter 377. This Act established Article 73B of the Annotated Code of Maryland, entitled “Pensions.” From the outset in 1941, § 3(5) of Article 73B stated that “membership in the retirement system shall be optional with any class of elected officials, or with any class of officials appointed for fixed terms.” Chapter 793 of 1945 added more direction to the optional membership language. The amendments to § 3(5) state, in part:
Such elected or appointed officials now in office may become members of the Employees’ Retirement System by making application for such membership within six months after June 1, 1945. All officials hereafter elected or appointed may become members of the System upon making application therefor within six months after their election or appointment. All such officials shall be entitled to credit for prior service rendered by them to the State, including service rendered prior to the establishment of the Employees’ Retirement System.
It would appear from these amendments that the legislature intended to maintain that
membership would be optional for elected and appointed officials; but that the period of time they would have to elect to join the Employees’ Retirement System (ERS) would now be restricted to six months from the date of their election or appointment. In addition, it is important to keep in mind that at this time vesting in the ERS was 20 years, making it nearly impossible for an elected or appointed official to earn a benefit in this system. Section 3(5) of Article 73B remained virtually unchanged until 1959 when Chapter 805 of 1959 amended it to extend the period of time an elected or appointed official would have to elect to join the ERS from six months to 12 months after the official’s election or appointment. Chapter 805 also included amendments that would allow officials to receive prior service credit rendered by them to a political subdivision of the State. In 1961, Chapter 107 again expanded the time period when an official could elect to join the ERS to provide that such an election needed to be completed at any time “before the expiration of their respective terms.”
86
Appendix 4

Following the enactment of Chapter 107 of 1961, several amendments were made to § 3(5) over the next 10 years. Membership remained optional for all elected and appointed officials, although the clarification that the appointments “for a fixed term” was repealed. Optional membership was expanded to include employees of the Governor’s office and desk officers or other employees of either house of the General Assembly who receive an annual salary as compensation of such employment and who were considered to be an appointed official within the application of § 3(5). Also during this 10-year period the reference to officials receiving credit in the ERS for prior service rendered by them to a “political subdivision” was changed to “participating municipal corporation.” This change would suggest that the legislature recognized that elected and appointed officials of participating governmental units were now facing the choice of whether to enroll in the ERS. Further amendments were made to § 3(5) during this period of time detailing the responsibilities of the participating municipal corporations with regard to any transfer of the funds necessary to cover the costs of prior service if an official chose to receive credit for the official’s prior service with the municipal corporation. Over the next 30 years (1970-2000), very few substantive changes were made to the optional membership provision. By 1980, § 3(5) of Article 73B was revised and moved to § 113(3) of Article 73B. Membership remained optional for elected and appointed officials, but the time period the official had to elect membership was removed entirely. Between 1980 and 2000, the only substantive change was to extend optional membership to members of the Prince George’s County Board of Alcoholic Beverages License Commissioners, employees of participating governmental units who are employed by the participating governmental unit on the effective date of its participation in the State systems, and employees of Dorchester County who are not members of Dorchester County’s general pension and retirement program. Beyond those additions, no further changes were made to the optional membership provision. Also during this period of time, the optional membership provision was moved to § 23-204 of the State Personnel and Pensions Article. In 2000, both Kent County Board of Education and the Town of Oakland joined the Employees’ Pension System (EPS) and sought legislation amending § 23-204 to make membership mandatory for individuals who were existing employees of each participating governmental unit on their effective dates of participation (Chapters 458 and 474 of 2000, respectively). According to the fiscal notes on each of those bills, both Kent County Board of Education and the Town of Oakland sought to modify the existing optional membership provision for existing employees of newly-participating governmental units joining the EPS out of concern that if one of their existing employees opted not to participate in the EPS, that individual would receive no pension at all, because the local plans would be terminated. Chapter 532 of 2004 brought the first major change to optional membership since its inception in 1941. Chapter 532 was legislation sponsored by the Joint Committee on Pensions at the request of the Board of Trustees for the State Retirement and Pension System. Provisions of this bill included restricting optional membership to individuals who were employed within the existing groups previously included in § 23-204, if those individuals were employed in those positions on June 30, 2004. For example, existing elected and appointed officials who were serving in their respective positions on June 30, 2004 would continue to have the option to join
87

the EPS; however, any individual becoming an elected or appointed official on or after July 1, 2004, would be required to join the system. Testimony for the Board stated that it believed membership had been optional in the past due to the onerous vesting requirements (again, at one point, it was as great as 20 years), making it almost impossible for individuals in these positions to earn a benefit from the ERS or EPS. That being said, in 2004, an EPS member was required to accrue only five years of eligibility service to vest in the system. Because EPS members can earn a year of eligibility service for any fiscal year in which they work 500 hours, it was possible at that time for elected and appointed officials to accrue five years of eligibility service during four calendar years and be vested after serving one term of office. Moreover, the Agency noted that requiring these individuals to join the EPS would ensure they were protected with disability and death benefits. Following this major departure, Chapter 627 of 2006 provided a slight exception to mandatory membership. Chapter 627 stated that membership in the EPS would be optional for the Sheriff of Baltimore City, but also provided that if the Sheriff did not elect to join the EPS within six months of taking office, the Sheriff would be enrolled in the Law Enforcement Officers’ Pension System as a condition of employment. In addition, Chapter 239 of 2006 clarified that employees of the City of Frostburg, similar to employees of the Kent County Board of Education and the Town of Oakland, would all be required to join the EPS regardless of whether they were employed by the City of Frostburg on or before June 30, 2004. The small exception established through Chapter 627 of 2006 was expanded through provisions of Chapter 334 of 2007, again making membership in the EPS optional for elected and appointed officials under limited circumstances. Chapter 334 (Senate Bill 515) provided that elected or appointed officials would have one year from election or appointment to join either the Employees’ Pension System or another retirement or pension system operated under the laws of the State or a political subdivision of the State. However, if there was not a second system in which these officials could enroll, membership would be mandatory in the EPS. From 2008 through 2014, various bills were introduced on behalf of participating governmental units that joined the SRPS during that period of time. The Town of University Park (Chapter 632 of 2009) and the Town of Sykesville (Chapter 413 of 2009) had legislation enacted to ensure that membership in the EPS was mandatory for all of the employees of each of the towns, regardless if any of the employees were employed on the effective date of participation and also employed on or before June 30, 2004. Conversely, the Town of Berwyn Heights (Chapter 171 of 2008) and the City of College Park (Chapter 635 of 2014) had legislation enacted to provide optional membership in the EPS to all current employees of the Town and City, employed by the entities prior to the effective date of participation. Finally, the most recent piece of legislation enacted that amended § 23-204 was Chapter 636 of 2014. This legislation provided optional membership for various appointed officials of Prince George’s County. A review of the legislation enacted since the passage of Chapter 532 of 2004 requiring mandatory membership for all elected and appointed officials, would suggest local governments would prefer a return to optional membership for their elected and appointed officials. This is
88

supported by the fact that the argument to move to mandatory membership because vesting had been reduced from 20 years to 5 years over the period of time optional membership had been in place, is no longer relevant. With a return to longer vesting (10 years), local elected and appointed officials now have to serve two and one-half terms before becoming eligible for retirement. Moreover, there may be towns and municipalities participating in the SRPS that have two year terms of office for their elected and appointed officials, which in turn would make vesting even more cumbersome. In addition, these individuals are required to contribute 7% of their annual salary toward a benefit for which they may not become eligible. The employers for local elected and appointed officials have also expressed concern that they will be required to make employee contributions on behalf of these individuals. Yet, unlike the non-vested member who may receive a return of the member’s accumulated contributions at the time the member stops serving as an elected or appointed official, the employer will not receive a return of employer contributions made on behalf of this individual. In light of these concerns that have been raised by both local elected and appointed officials and their employers, staff for the State Retirement Agency would recommend amending § 23-204 of the State Personnel and Pensions Article to more closely reflect the wording of the original optional membership statutes during the period from 1941 through 1961. During that period of time, membership was optional for “any class of elected officials, or with any class of officials appointed for fixed terms.” Language similar to this, or perhaps with even more specific identifying criteria, would provide the Agency with guidance in determining whether an individual is, in fact, an appointed official. Additionally, staff would also recommend similar language from the first versions of the optional membership provisions that placed a statute of limitations on the period of time during which an elected or appointed official could elect membership in the EPS. Initially this period of time was six months but was later extended to 12 months from the date of taking office. A 12-month statute of limitations to elect to join the EPS would be consistent with the period of time the legislature provided members to elect to join the Teachers’ Pension System (TPS) or the Optional Retirement Plan (ORP). Further, stipulating a definite period of time when the election to participate shall be made satisfies the concerns the Agency’s tax counsel raise in 2006 when the time constraints were placed on members choosing between the TPS and the ORP.
89

90
Appendix 5
91

92

93

94