Embed Size (px)
Citation preview

1
Joint Measurement of Economic and Environmental Performance of Water Industries
Tiho Anceva, M.A. Samad Azadb
aA/Professor, School of Economics, 217 Biomedical Building (C81), The University of Sydney, NSW
2006, Australia. bResearch Associate, School of Economics, 206 Biomedical Building (C81), The University of
Sydney, NSW 2006, Australia.
Abstract
Water industries are currently facing the challenge of simultaneously improving economic
and environmental performance while continuing to provide high quality services at low cost.
The study provides an overview of the conceptual frameworks that underpin the approaches
towards this seemingly irreconcilable challenge. A brief literature review on efficiency
measurement in the water industry is provided. The study illustrates the theoretical
framework of tradeoffs between economic and environmental outcomes particularly for water
industries. Recently developed methods for environmentally adjusted productivity
measurement that are able to jointly measure economic and environmental efficiency of water
industries are briefly discussed and critically analysed. Models suited for this
environmentally adjusted productivity measurement are discussed and implications of these
new analytical developments for water policy are identified.
Key words: Water Industries, Performance Measurement, Environmentally Adjusted
Efficiency
JEL codes: D24, Q25, Q28, Q50
1. Introduction
There is a growing demand for services that are provided by water industries. Increased
demand for food due to increasing population and standards of living requires increased food
production, which in turn implies increased water use in irrigated agriculture. Growing
population and its urbanisation also lead to growing need for municipal water supply and
wastewater treatment (Figure 1). Consequently, there is a growing trend in total water

2
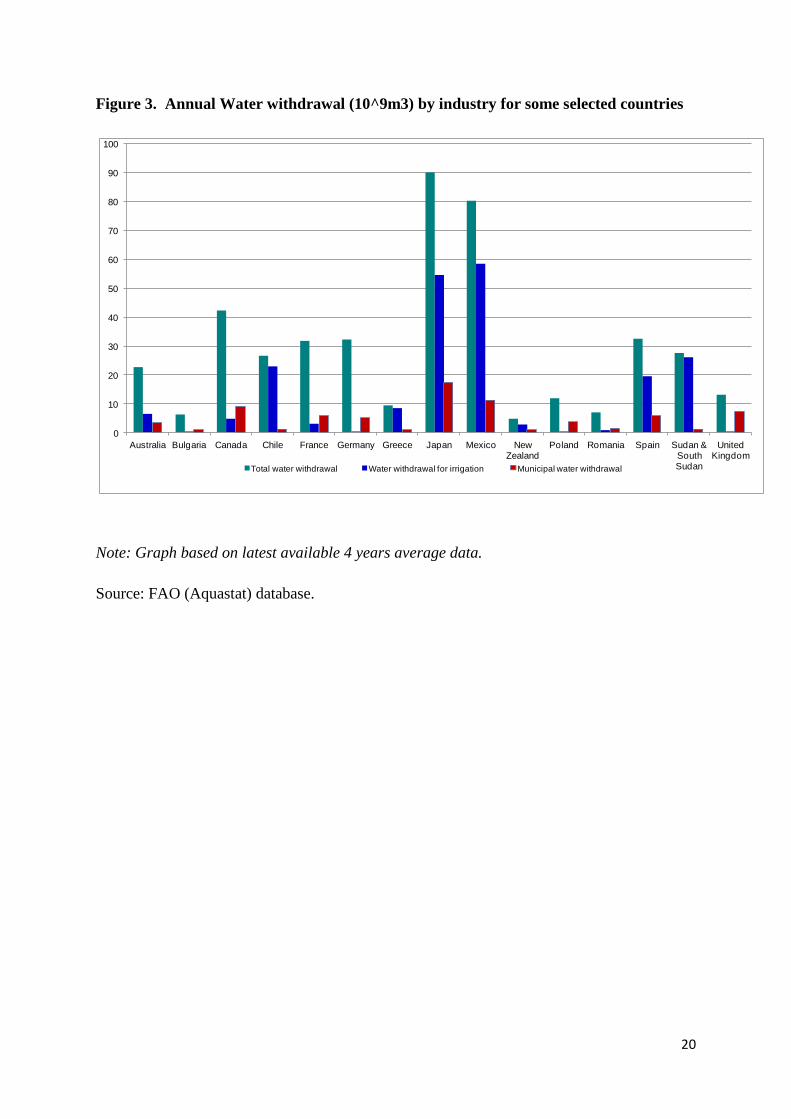
withdrawal across the globe (Figure 2). The annual water use across sectors varies among
individual countries (Figure 3). Whereas water industries need to grow and provide services
to an ever growing number of users, the current economic environment does not offer
favourable conditions for such growth. In the post GFC (Global Financial Crisis) world, there
are tight budgetary conditions for all key economic players: governments, businesses, and
individual consumers. Economic agents at all levels are becoming very conscious about
spending. The situation is also very difficult on the investment front: water industries are
forced to compete for investment funds on the open capital markets, in contrast to a time
gone-by when governments – whether local, regional or national – where willing and able to
fund water infrastructure project. Given the fiscal position of many governments around the
world, this source of investment funding is not going to be very generous in foreseeable
future. As a result, the overall subdued status of the economies in the developed world,
characterised with high unemployment, government austerity measures, and low returns on
capital, makes users very sensitive to pricing of all utility services, including water. The water
industry is going to find it increasingly harder to ask, and to receive, higher prices for the
services it provides. The economic situation in the developing world is relatively better, but
their consumers are climbing the social-economic scales from a very low base, and are
therefore still very sensitive to prices of key utilities. Overall, the water industries are in a
situation where they will have to do ‘more with less’, implying that they will be required to
continuously improve their economic efficiency, and to deliver high quality services at
affordable prices.
In parallel to the demands for improved economic efficiency, the concerns about the state of
water resources and environmental health in general are mounting. In many parts of the world
water resources are extracted close to the brink of the physical limits, and many more are
nearing such physical resource scarcity (CAWMA, 2007). There are increasing calls for the
irrigation sector to minimise the damage it is causing to water dependent ecosystems by
excessive extraction of irrigation water (McCartney et al., 2007). Perhaps a best example of
this can be found in Australia, where water resources have been substantially overallocated,
leaving almost nothing for the rivers, lakes and ecosystems that they support (Quiggin, 2001;
Randall, 1981; Lee and Ancev, 2009). As a result, Australian government has initiated buying
back of water entitlements from irrigators, and is now holding significant quantity of
entitlements for environmental purposes (Ancev, 2014).

3
Municipal and wastewater industries are also subject to significant environmental concerns.
Building new dams and reservoirs for drinking water is almost out of question in many
countries due to environmental concerns (MEA, 2005). Quality requirements for bulk water
supplied to drinking water treatment plants is ever increasing, implying that superior
environmental management of catchment areas is required. Wastewater treatment plants are
also facing increasingly stringent standards on effluent quality, mostly on environmental
grounds (Rodriguez-Garcia et al., 2011).
In the era of carbon pricing, the requirements for improved energy efficiency and reduction of
Green House Gas (GHG) emissions are very relevant for the water industries. They are
expected to deliver the services that they provide and at the same time to use energy
efficiently and to reduce their emissions of GHGs (Rothausen and Conway, 2011). All this
imposes requirements on water industries to improve environmental performance, and to
reduce their environmental ‘footprint’, and at the same time to improve its economic
performance in a challenging economic environment. These seem to be two almost
irreconcilable demands. A key question that this paper addresses is whether economic and
environmental performance of water industries can be jointly improved. This question will be
pursued by proposing the use of methods for environmentally adjusted productivity
measurement to jointly measure environmental and economic efficiency in water industries.
Measuring efficiency allows identifying practices, technologies, and locations where we
observe the highest economic and environmental efficiency. This can then serve for
benchmarking purposes within the water industries, and for formulating policies to promote
superior economic and environmental performance.
The literature on productivity and efficiency measurement provides us with key theoretical
and methodological approaches for jointly measuring environmental and economic
efficiency. The main concepts of incorporating environmental performance measurements in
standard productivity analysis were postulated by Pitman (1983), Fare et al. (1989), and
Chung et al. (1997). Fare and Grosskopf (2004) firmly put environmental effects in the theory
and practice of productivity and efficiency analysis. More recent studies have utilized these
methods in applications to variety of industries (e.g. Zaim, 2004; Kuosmanen and
Kortelainen, 2005) including irrigation (Azad and Ancev, 2010; Azad and Ancev 2013). The
present paper adds to the existing literature by synthesizing the existing knowledge in this
research area, and by proposing how to use this knowledge to jointly evaluate economic and
4
environmental performance of a broad range of production activities undertaken by the water
industries. This has important implications for designing contemporary water policy that
encompasses social concerns about environment, resource use, accessibility to water and its
affordability.
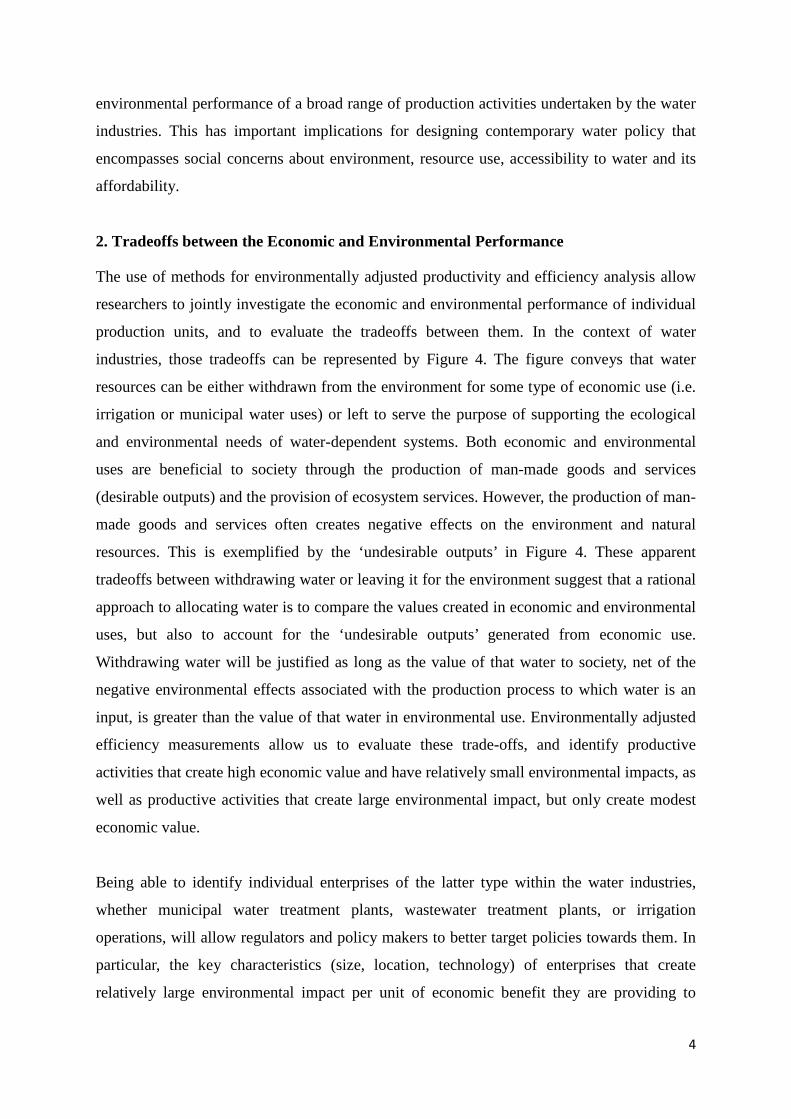
2. Tradeoffs between the Economic and Environmental Performance
The use of methods for environmentally adjusted productivity and efficiency analysis allow
researchers to jointly investigate the economic and environmental performance of individual
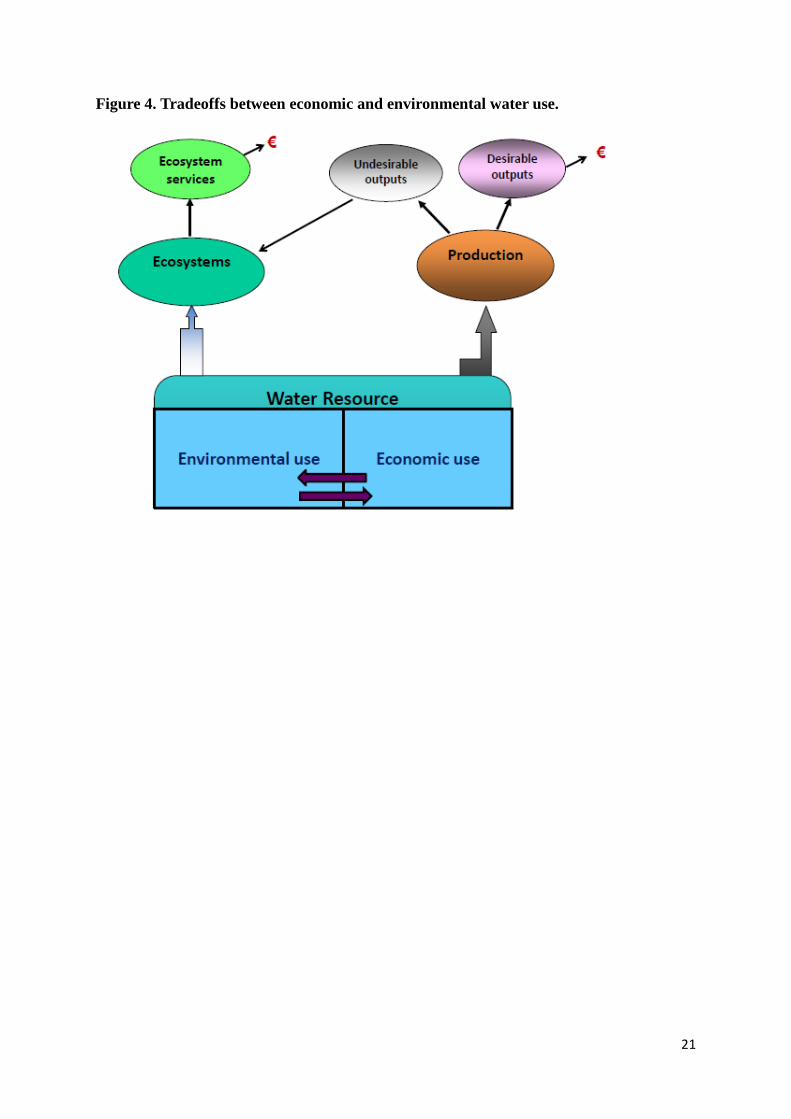
production units, and to evaluate the tradeoffs between them. In the context of water
industries, those tradeoffs can be represented by Figure 4. The figure conveys that water
resources can be either withdrawn from the environment for some type of economic use (i.e.
irrigation or municipal water uses) or left to serve the purpose of supporting the ecological
and environmental needs of water-dependent systems. Both economic and environmental
uses are beneficial to society through the production of man-made goods and services
(desirable outputs) and the provision of ecosystem services. However, the production of man-
made goods and services often creates negative effects on the environment and natural
resources. This is exemplified by the ‘undesirable outputs’ in Figure 4. These apparent
tradeoffs between withdrawing water or leaving it for the environment suggest that a rational
approach to allocating water is to compare the values created in economic and environmental
uses, but also to account for the ‘undesirable outputs’ generated from economic use.
Withdrawing water will be justified as long as the value of that water to society, net of the
negative environmental effects associated with the production process to which water is an
input, is greater than the value of that water in environmental use. Environmentally adjusted
efficiency measurements allow us to evaluate these trade-offs, and identify productive
activities that create high economic value and have relatively small environmental impacts, as
well as productive activities that create large environmental impact, but only create modest
economic value.
Being able to identify individual enterprises of the latter type within the water industries,
whether municipal water treatment plants, wastewater treatment plants, or irrigation
operations, will allow regulators and policy makers to better target policies towards them. In
particular, the key characteristics (size, location, technology) of enterprises that create
relatively large environmental impact per unit of economic benefit they are providing to

5
society will be identified and will be used to inform decision making. Likewise, the
characteristics of enterprises that have relatively small environmental impact per unit of
economic benefit they create can be used to create benchmarks to which the industry can
aspire. Ultimately we would like to see a decreasing number of enterprises that have large
environmental effects but relatively modest economic value added, and commensurate
increase in enterprises that are able to deliver significant economic benefits at minimal
environmental costs.
3. Conceptual Framework
The following section first describes the fundamental notions of measuring productivity and
efficiency in any industry including water industry, and then it describes the main ideas
behind environmentally adjusted productivity and efficiency measurement. In-depth
expositions on productivity and efficiency measurement and their environmental adjustment
are described in Fare and Grosskopf (2004). Efficiency of individual enterprises within an
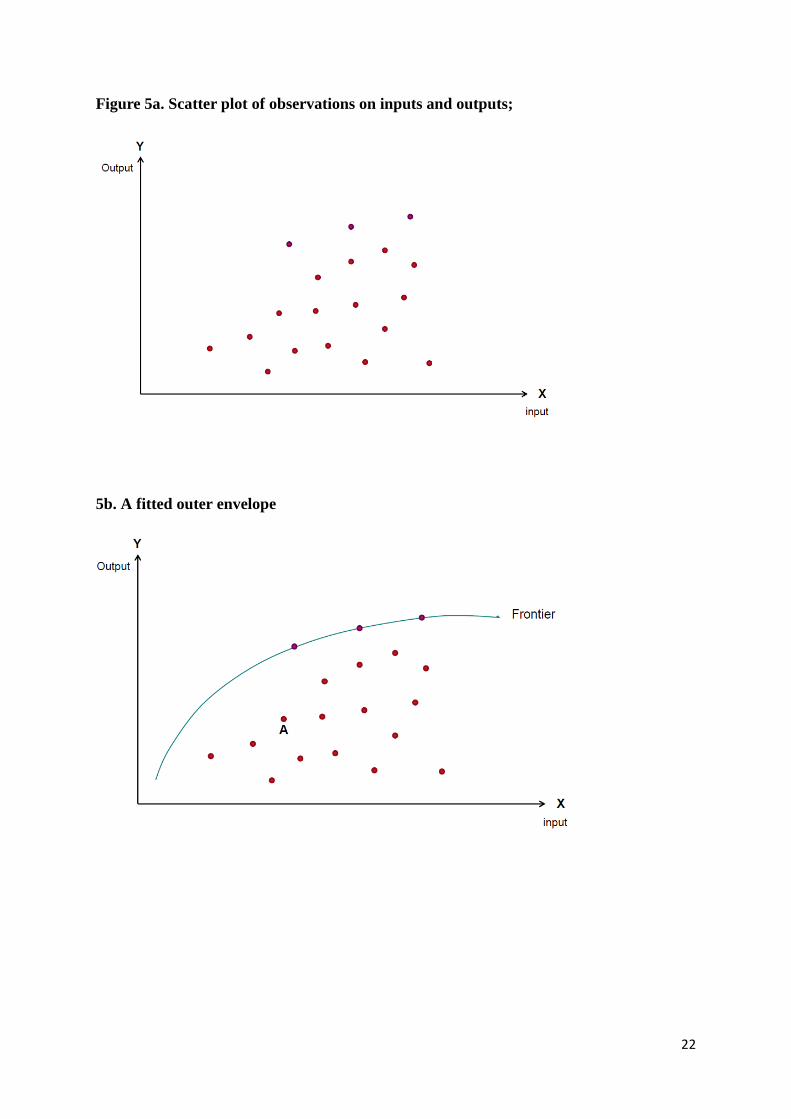
industry, such as the water industry, can be conceptualised in a fairly straightforward way.
This involves collecting data on key inputs and outputs from a number of individual
enterprises that constitute the industry. Further, consider plotting these data on a scatter plot,
as presented in Figure 5a.
The next step is to fit an outer envelope through these data. The fitting of such an envelope (a
curve, or a frontier) can be done using two main groups of methods: 1) parametric methods,
where the envelope is estimated using statistical/econometric methods, with the most widely
used approach being the stochastic production frontier estimation (Aigner et al., 1977;
Green,1980; Battese and Coelli, 1995); and 2) non-parametric methods, where the envelope
is estimated using methods of mathematical optimisation (maximise output for a given
quantity of input, or minimise input for a given output), with the most widely used approach
being the data envelopment analysis (DEA) (Färe et al., 1985; Charnes et al.,1995; Lovell,
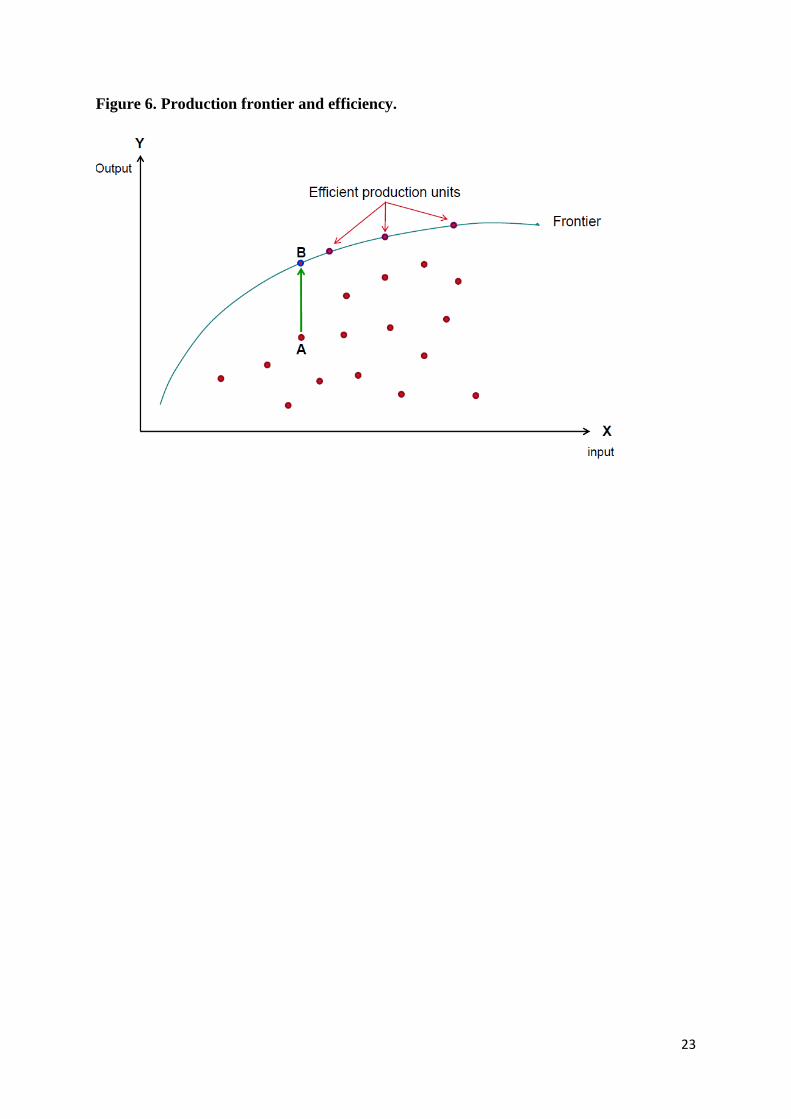
1994; Thanassoulis, 2001). Whichever method of estimation is used, those observations that
are on the frontier are deemed to be efficient: they produce the maximum output, given the
level of input they are using, or vice versa they use minimum input for the level of output that
they are producing (Figure 6).
6
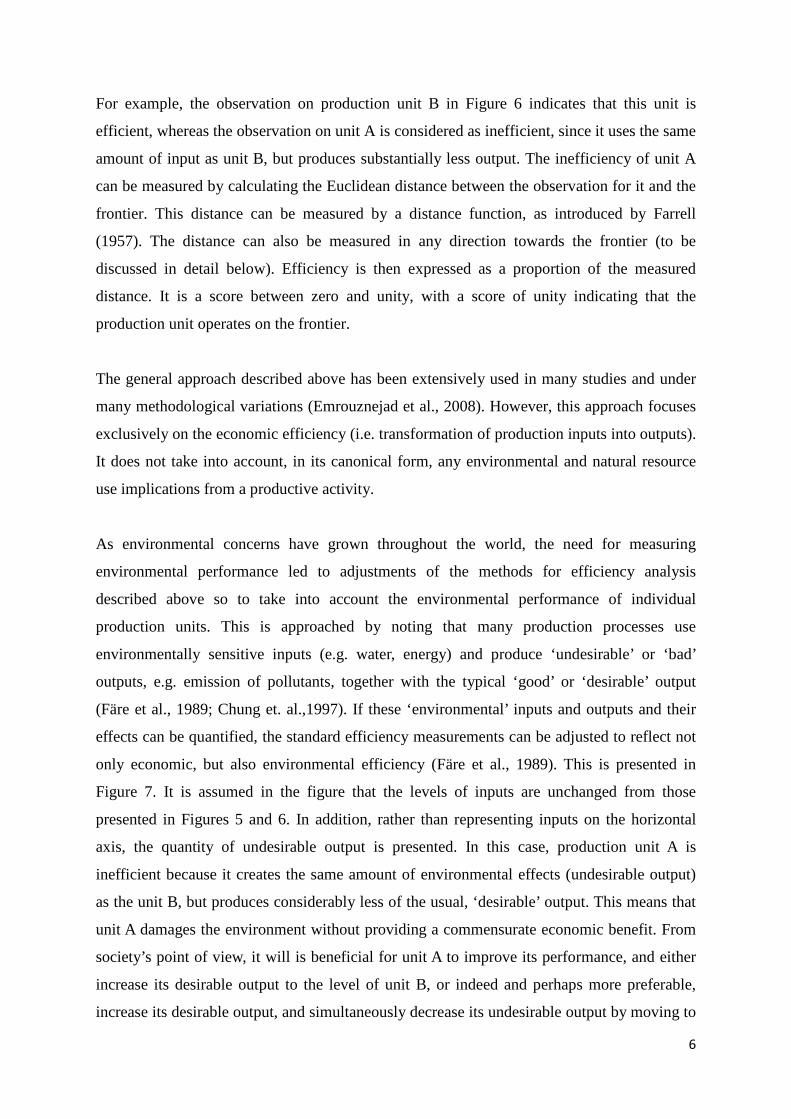
For example, the observation on production unit B in Figure 6 indicates that this unit is
efficient, whereas the observation on unit A is considered as inefficient, since it uses the same
amount of input as unit B, but produces substantially less output. The inefficiency of unit A
can be measured by calculating the Euclidean distance between the observation for it and the
frontier. This distance can be measured by a distance function, as introduced by Farrell
(1957). The distance can also be measured in any direction towards the frontier (to be
discussed in detail below). Efficiency is then expressed as a proportion of the measured
distance. It is a score between zero and unity, with a score of unity indicating that the
production unit operates on the frontier.
The general approach described above has been extensively used in many studies and under
many methodological variations (Emrouznejad et al., 2008). However, this approach focuses
exclusively on the economic efficiency (i.e. transformation of production inputs into outputs).
It does not take into account, in its canonical form, any environmental and natural resource
use implications from a productive activity.
As environmental concerns have grown throughout the world, the need for measuring
environmental performance led to adjustments of the methods for efficiency analysis
described above so to take into account the environmental performance of individual
production units. This is approached by noting that many production processes use
environmentally sensitive inputs (e.g. water, energy) and produce ‘undesirable’ or ‘bad’
outputs, e.g. emission of pollutants, together with the typical ‘good’ or ‘desirable’ output
(Färe et al., 1989; Chung et. al.,1997). If these ‘environmental’ inputs and outputs and their
effects can be quantified, the standard efficiency measurements can be adjusted to reflect not
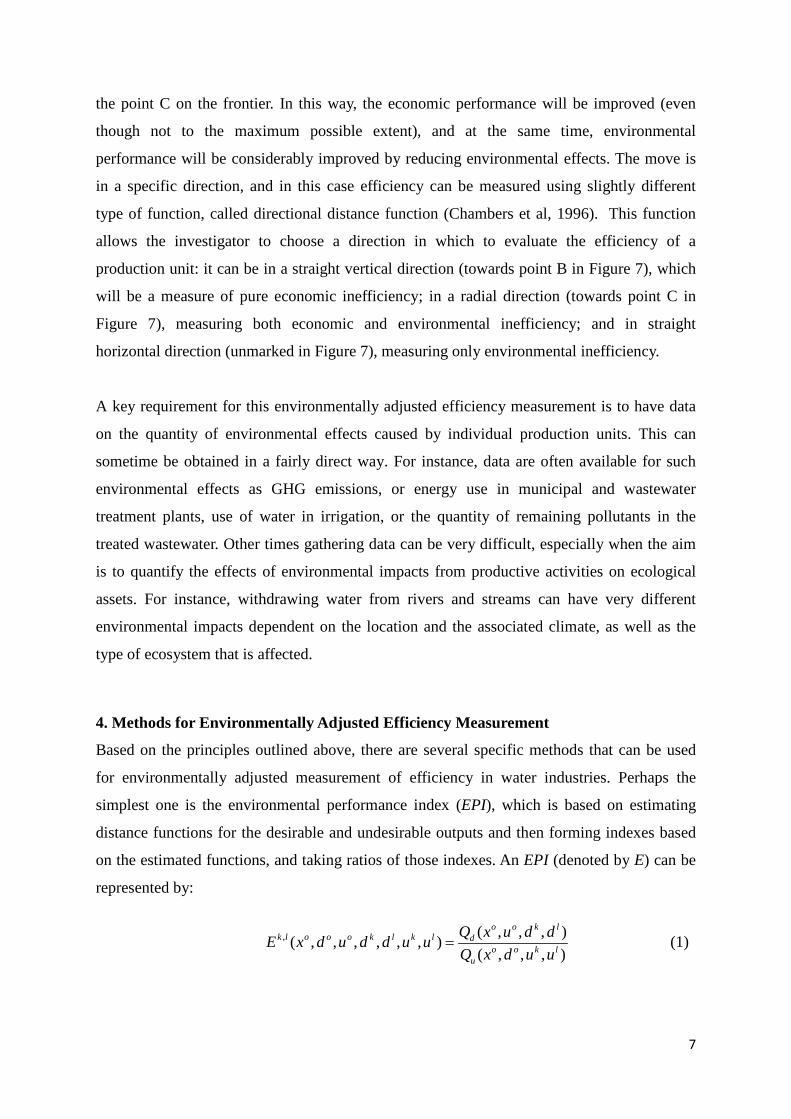
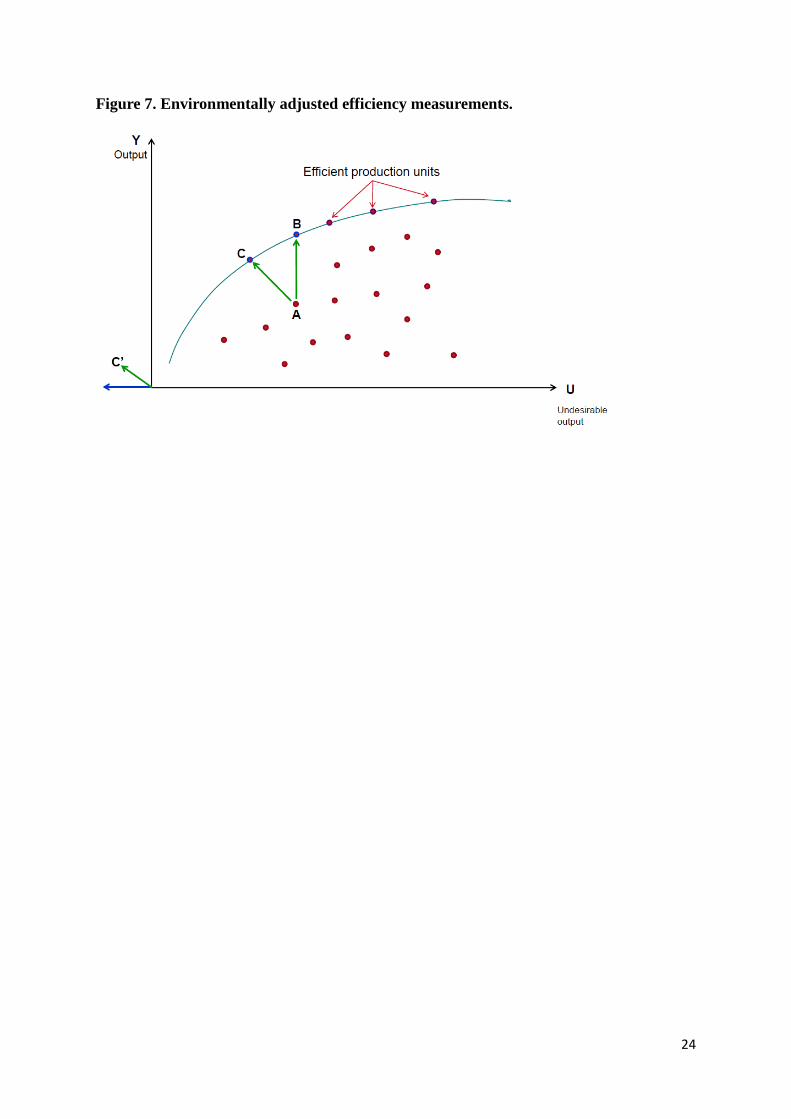
only economic, but also environmental efficiency (Färe et al., 1989). This is presented in
Figure 7. It is assumed in the figure that the levels of inputs are unchanged from those
presented in Figures 5 and 6. In addition, rather than representing inputs on the horizontal
axis, the quantity of undesirable output is presented. In this case, production unit A is
inefficient because it creates the same amount of environmental effects (undesirable output)
as the unit B, but produces considerably less of the usual, ‘desirable’ output. This means that
unit A damages the environment without providing a commensurate economic benefit. From
society’s point of view, it will is beneficial for unit A to improve its performance, and either
increase its desirable output to the level of unit B, or indeed and perhaps more preferable,
increase its desirable output, and simultaneously decrease its undesirable output by moving to
7
the point C on the frontier. In this way, the economic performance will be improved (even
though not to the maximum possible extent), and at the same time, environmental
performance will be considerably improved by reducing environmental effects. The move is
in a specific direction, and in this case efficiency can be measured using slightly different
type of function, called directional distance function (Chambers et al, 1996). This function
allows the investigator to choose a direction in which to evaluate the efficiency of a
production unit: it can be in a straight vertical direction (towards point B in Figure 7), which
will be a measure of pure economic inefficiency; in a radial direction (towards point C in
Figure 7), measuring both economic and environmental inefficiency; and in straight
horizontal direction (unmarked in Figure 7), measuring only environmental inefficiency.
A key requirement for this environmentally adjusted efficiency measurement is to have data
on the quantity of environmental effects caused by individual production units. This can
sometime be obtained in a fairly direct way. For instance, data are often available for such
environmental effects as GHG emissions, or energy use in municipal and wastewater
treatment plants, use of water in irrigation, or the quantity of remaining pollutants in the
treated wastewater. Other times gathering data can be very difficult, especially when the aim
is to quantify the effects of environmental impacts from productive activities on ecological
assets. For instance, withdrawing water from rivers and streams can have very different
environmental impacts dependent on the location and the associated climate, as well as the
type of ecosystem that is affected.
4. Methods for Environmentally Adjusted Efficiency Measurement
Based on the principles outlined above, there are several specific methods that can be used
for environmentally adjusted measurement of efficiency in water industries. Perhaps the
simplest one is the environmental performance index (EPI), which is based on estimating
distance functions for the desirable and undesirable outputs and then forming indexes based
on the estimated functions, and taking ratios of those indexes. An EPI (denoted by E) can be
represented by:
, ( , , , )( , , , , , , )( , , , )
o o k lk l o o o k l k l d
o o k lu
Q x u d dE x d u d d u uQ x d u u
= (1)

8
where Qd and Qu are quantity indexes of desirable and undesirable outputs, respectively,
given by:
( , , )( , , , )( , , )
o k oo o k l d
d o l od
D x d uQ x u d dD x d u
= (2)
( , , )( , , , )( , , )
o o ko o k l u
u o o lu
D x d uQ x d u uD x d u
= (3)
Where the distance functions Du and Dd are defined as follows:
( , , ) inf{ : ( , , ) }ddD x d u x u Tθθ
= ∈ (4)
( , , ) sup{ : ( , , ) }uuD x d u x d Tγγ
= ∈ (5)
Symbol x stands for input, d for desirable output and u for undesirable output. Superscript o
stands for fixed quantities (i.e. indicates that those quantities are not varied within the
evaluation), superscript k stands for the quantity that is being observed and evaluated, and
superscript l stands for the quantity observed for a designated reference unit.1 The operator
‘inf’ in Eq. (4) denotes an infimum, and the operator ‘sup’ in Eq. (5) denotes a supremum. γ
and θ are scaling parameters.
The EPI index effectively measures how much undesirable output is produced per unit of
desirable output produced and ranks productive units according to this measure. Units with
high EPI score have good environmentally adjusted performance, whereas those with low
scores have poor environmentally adjusted performance. A recent example of using the EPI
in the water sector is provided by Azad and Ancev (2010).
Another way to measure efficiency is by using the method of non-radial DEA. This method
allows for differential scaling of multiple inputs used in a production process, and
consequently makes them particularly suitable for conducting efficiency analyses of
production activities where environmentally sensitive inputs (e.g. water, energy) are
1 The reference unit can be designated in variety of ways. One popular way is to construct a hypothetical reference unit from that data, based on the minimum-maximum criterion, which effectively creates a worst possible performing unit (lowest desirable output, highest undesirable output, highest input), and compares the performance of all the other units to it.

9
prominent. Using non-radial DEA, the researcher is able to measure the relative efficiency
with which the environmentally sensitive input is used. The objective function of the
optimisation problem that leads to the computation of efficiency scores is given by the
following equation:
1 1 2 21
( , ) min / : ( , ,..., ) ( ), 0 1N
n N N nn
NRD y x N x x x L yλ λ λ λ λ=
= ∈ ≤ ≤
∑ (6)
where λ stands for the weight given to an input x, L(y) is the production possibility set, y
denotes output, and NRD stands for non-radial DEA. A recent example of using a non-radial
DEA to measure efficiency is provided by Hernandez-Sancho et al. (2011) and Azad et al.
(2013).
While the previous two measures of efficiency are based on distance functions, there are
other approaches that make use of directional distance functions. One such approach is the
environmentally adjusted Luenberger productivity index, which is suitable to measure
efficiency, as well as changes in environmentally adjusted productivity over time. The index
can be written as:
1 1 11 1 1 1 1 11( ( , ; , ) ( ( , ; , )
2( ( , ; , ) ( ( , ; , )][ , , , ,t t t t
u y u
t ty y u
t t t t t t t t t t tt y uL D x y g g D x y g g D x y g g D x y g gu u u u+ + ++ + + + + += − + −
(7)
Where the directional distance function for period t, tD
represents the reference technology
constructed from data for period t, to which the performance for period t+1, as measured by
the directional distance function 1tD + , is compared. The indicator can be used to measure
efficiencies in periods t and t+1, as well as environmentally adjusted productivity and
efficiency change between t and t+1.
5. Current State of Environmentally Adjusted Efficiency Measurements in Water
Industries
The importance of jointly measuring economic and environmental performance of water
industries has been evident in the literature in recent years. While environmentally adjusted
productivity and efficiency measurements have been applied to many production sectors over
the last 10-15 years, their application to the water industries has been very recent.
Applications of standard economic efficiency measurements to water industries have been
10
widespread, with dominance of studies focusing on municipal water supply and wastewater
treatment, and comparably smaller number of studies on efficiency in irrigated agricultural
sector. While these studies are important in their own right, they do not address the
environmental performance of studied production units, and can therefore not be used to
characterise environmental-economic trade-offs in considered water industries. Several
studies that appeared recently have started applying environmentally adjusted efficiency
measurements to production units in water industries, and there is significant amount of
current research work that is likely to be published in near future.
In an empirical application to the irrigation industry, Azad and Ancev (2010) proposed joint
evaluation of economic and environmental efficiency by constructing indexes that capture the
effects of water withdrawal for irrigation on environmental conditions of the affected rivers
and streams. When it comes to wastewater treatment plants, Sala-Garrido et al. (2012)
recently estimated economic efficiency of plants in the Valencia region, Spain. One of the key
inputs considered was energy use, which was implicitly identified as an environmentally
sensitive input.
Other, unrelated techniques that have recently been widely used produce results that can be
used as valuable inputs into environmentally adjusted productivity measurement. An example
is the large body of research on Life-Cycle Analysis (LCA), including studies on wastewater
treatment plants (Rodriguez-Garcia et al., 2011; Larsen et al., 2010; Fagan et al., 2010; Lin,
2009; Munoz et al., 2008; Gallego et al., 2008; Nogueira et al., 2007; Gallego et al., 2008).
The findings from LCA studies are a source of particularly useful inputs that could be used in
environmentally adjusted efficiency analyses. In a recent study Rodriguez-Garcia et al.
(2011) evaluated the performance of wastewater treatment plants by identifying
environmental indicators (eutrophication and global warming potential) and economic
indicators (operation costs). While this study falls short of performing a fully-fledged
environmentally adjusted efficiency analysis, it really opens up opportunities to think about
integrating LCA into the frameworks for environmentally adjusted efficiency and
productivity analysis described above.
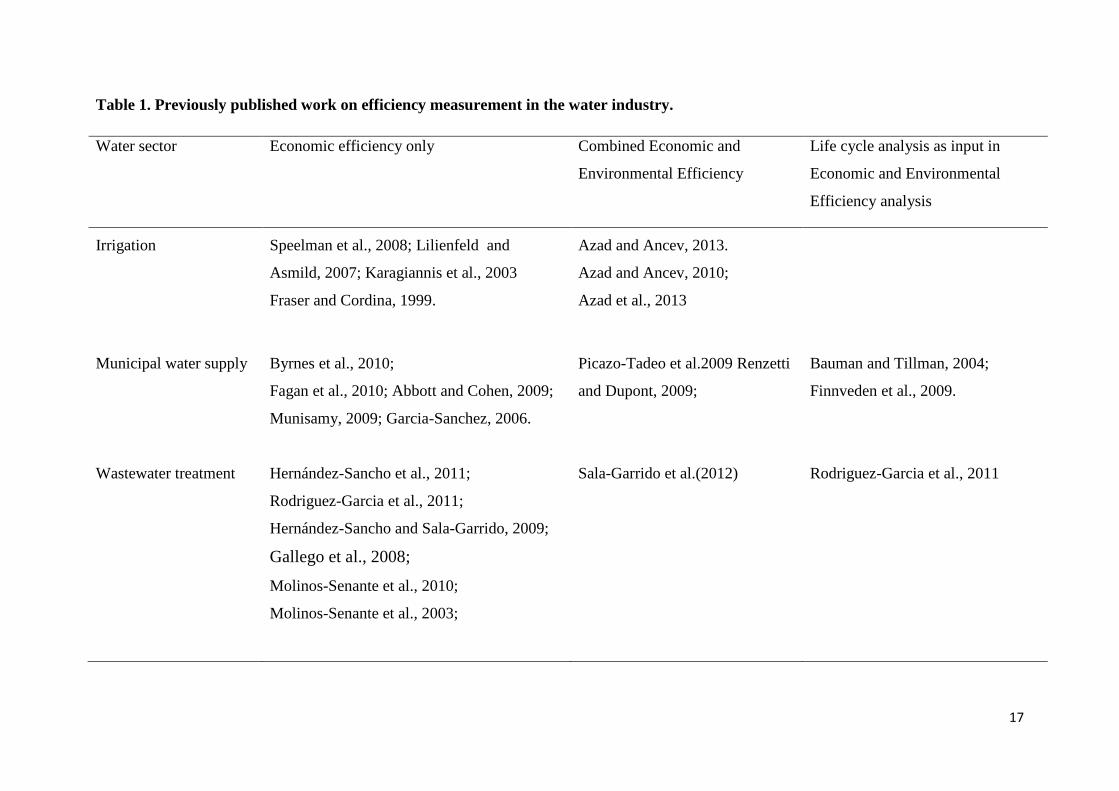
A summary of previously published work by water sector and by type of efficiency analysis
is provided in Table 1. The table does not provide exhaustive list of the literature that reports

11
research on economic efficiency. The study by Abbott and Cohen (2009) provides such
exhaustive list of studies reporting on economic efficiency for both municipal water supply
and wastewater treatment sectors.
6. Implications for policy
Water policy in the 21st century is faced with serious challenges and needs to be able to strike
a balance between unprecedented varieties of social demands. A key aim for water policy is
to ensure sustainable and safe access to municipal water and to wastewater treatment services
by an ever growing human population that is increasingly urbanised. This involves carefully
utilising existing water resources to ensure viability of their use for a long time into the
future. As mobilising new water resources is increasingly difficult and expensive, given that
most easily accessible resources have already been tapped into, managing existing resources
in a sustainable way is a policy priority. The competing demands for these existing resources
are coming from three main sources: irrigation, the environment, and municipal and industrial
water, and are creating a very complex policy landscape that needs to be navigated.
Understanding and being able to measure the relationships between some of these competing
demands, in particular between extractive water uses and the associated environmental and
natural resource effects brings a distinct advantage to modern water policy.
The methods described above are well suited to inform policy about tradeoffs that stem from
these relationships. In particular, the use of environmentally adjusted productivity and
efficiency measurement can help identifying those activities within the water industries that
create relatively modest benefits to society, but generate significant environmental and
natural resource pressure. These activities should consequently be targeted by policies that
will discourage wasteful and environmentally damaging use of water resources. Examples of
such policies are instituting adequate water pricing mechanisms in areas where prices have
been distorted by government involvement, or have been influenced by political pressures;
removing direct or indirect subsidies that allow inefficient operators to be viable; promotion
of technologies that have low environmental impact; and granting rights to water on behalf of
the environment.
In addition, the methods described above also allow policymakers to identify best-practice
activities within the water industries: irrigation enterprises that deliver greatest benefit per

12
unit of environmental / natural resource damage caused; wastewater treatment plants that use
less energy and emit less GHGs per unit of contaminant removed; and municipal drinking
water suppliers that serve most customers per unit of water resource impounded from its
natural state. These best-practice activities can serve as goals towards which water policy
should aim, and the water industries can aspire.
7. Conclusion
Water industries – irrigation, municipal water supply, and wastewater treatment – will have
to find ways to improve both their economic and environmental performance. This is dictated
by the mounting pressures to deliver better and more reliable services to users without
increasing the cost of provision, and to do so in an environmentally prudent way. Managing
this required improvement in economic and environmental efficiency of water industry
operations relies on the ability to quantify and measure efficiency, and to elucidate and
evaluate the trade-offs between economic and environmental performance. In recent years
there have been significant developments in the methods of productivity and efficiency
analysis, which are now at a level of sophistication that allows joint evaluation of economic
and environmental efficiency. Several very recent studies have applied these methods to
cases of irrigation and wastewater treatment. Several others have come very close to jointly
evaluating economic and environmental performance. The amount of research work that is
currently in progress is very significant, pointing to an impending widespread application of
these methods to the water industry.
The use of methods for economic and environmental efficiency measurement is going to
enable identification of technologies, practices and temporal and spatial attributes that can
deliver superior economic outcomes at least cost to the environment. This will result in more
economically and environmentally efficient water industry for the future. From a standpoint
of current economic and environmental climate, this seems to be the only way forward for the
industry.

13
References
Abbott, M., Cohen, B. (2009). Productivity and efficiency in the water industry. Utilities
Policies 17, 233-244.
Aigner, D.J., Lovell, C.A.K., Schmidt, P. (1977). Formulation and estimation of stochastic
frontier production function models. Journal of Econometrics 6, 21-27.
Ancev, T. (2014). The Role of the Commonwealth Environmental Water Holder in Annual
Water Allocation Markets. Australian Journal of Agricultural and Resource
Economics (forthcoming)
Azad, M.A.S., Ancev, T., Hernández-Sancho, F. (2013). Efficient water use for sustainable
irrigation industry. Manuscript under review.
Azad, M.A.S., Ancev, T. (2013). Measuring environmental efficiency of agricultural water
Use: A Luenberger environmental indicator. Manuscript under review.
Azad, M.A.S., Ancev, T. (2010). Using ecological indices to measure economic and
environmental performance of irrigated agriculture. Ecological Economics 69, 1731–
1739.
Battese G. E., Coelli, T. J. (1995). A model for technical inefficiency effects in a stochastic
frontier production function for panel data. Empirical Economics 20, 325-332.
Byrmes, J., Crase, L., Dollery, B., Villano, R. (2010). The relative economic efficiency of
urban water utilities in regional New South Wales and Victoria. Resource and Energy
Economics 32 (3), 439–55.
Chambers, R.G., Färe, R., Grosskopf, S. (1996). Productivity growth in APEC countries.
Pacific Economic Review 1(3), 181-190.
Charnes, A., Cooper, W.W., Lewin, A.Y., Seiford, L.M. (1995). Data Envelopment Analysis:
Theory, Methodology and Application. Kluwer Academic Publishers, Boston.
14
Chung, Y., Färe, R., Grosskopf, S. (1997). Productivity and undesirable outputs: a directional
distance function approach. Journal of Environmental Management 51, 229-240.
Comprehensive Assessment of Water Management in Agriculture (CAWMA). (2007). Water
for Food, Water for Life: A Comprehensive Assessment of Water Management in
Agriculture. London: Earthscan, and Colombo: International Water Management
Institute.
Emrouznejad, A., Parker, B.R., Tavares, G. (2008). Evaluation of research in efficiency and
productivity: A survey and analysis of the first 30 years of scholarly literature in
DEA. Socio-Economic Planning Sciences 42, 151-157.
Färe, R. and Grosskopf, S. (2004). New Directions: Efficiency and Productivity. Kluwer
Academic Publishers, Boston.
Färe, R., Grosskopf, S., Lovell, C.A.K., (1985). The Measurement of Efficiency of
Production. Kluwer Academic Publishers, Boston.
Färe, R., Grosskopf, S., Lovell, C.A.K., Pasurka, C. (1989). Multilateral productivity
comparisons when some outputs are undesirable: a non-parametric approach.
Review of Economics and Statistics 71(1), 90-98.
Farrell, M. J. (1957) The measurement of productive efficiency. Journal of the Royal
Statistical Society Series A 120, 235–90.
Gallego, A., Hospido, A., Moreira, M.T., Feijoo, G. (2008). Environmental
performance of wastewater treatment plants for small populations. Resources
Conservation & Recycling 52, 931-940.
Green, W.H. (1980). Maximum likelihood estimation of econometric frontier
functions. Journal of Econometrics 13, 27-56.
15
Hernández-Sancho, F., Molinos-Senante, M., Sala-Garrido R. (2011) Energy efficiency in
Spanish wastewater treatment plants: A non-radial DEA approach. Science of the
Total Environment 409, 2693-2699.
Lee, L., Ancev, T. (2009). Two decades of Murray-Darling water management: A river of
funding, a trickle of achievement. Agenda 16(1), 5-23.
Lin, C. (2009). Hybrid inputeoutput analysis of wastewater treatment and environmental
impacts: a case study for the Tokyo Metropolis. Ecological Economics 68(7) 2096-
2105.
Lovell, C.A.K. (1994). Linear programming approaches to the measurement and analysis of
productive efficiency. Top 2 175-248.
McCartney, M.P., Boelee, E., Cofie, O., Mutero, C.M. 2007. Minimizing the negative
environmental and health impacts of agricultural water resources development in sub-
Saharan Africa. International Water Management Institute, working paper 117.
Millennium Ecosystem Assessment (MEA) (2005). Ecosystem services and human well-
being: wetlands and water synthesis. World Resources Institute, Washington, D.C.,
USA.
Molinos-Senante, M., Hernandez-Sancho, F., Sala-Garrido, R. (2010). Economic feasibility
study for wastewater treatment: a cost-benefit analysis. Science of the Total
Environment 408(20), 4396–402.
Nogueira, R., Brito, A., Machado, A., Salas, J., Martel, G., Vera, L. (2007). Economic and
environmental assessment of small and decentralized wastewater treatment systems in
Seville (Spain).
Pitman, R.W. (1983). Multilateral productivity comparisons with undesirable outputs.
Economic Journal 93(372), 883-891.

16
Quiggin, J. (2001). Environmental economics and the Murray-Darling river system.
Australian Journal of Agricultural and Resource Economics 45(1), 67–94.
Randall, A. (1981). Property entitlements and pricing policies for a maturing water economy.
Australian Journal of Agricultural Economics 25(3), 195–220.
Rodriguez-Garcia, G., Molinos-Senante, M., Hospido, A., Herna´ndez-Sancho, F., Moreira,
M.T., Feijoo, G., (2011). Environmental and economic profile of six typologies of
wastewater treatment plants. Water Research 45, 5997-6010.
Rothausen, S.G.S.A., Conway, D. (2011). Greenhouse-gas emissions from energy use in the
water sector, Nature Climate Change 1, 210–219.
Thanassoulis, E. (2001). Introduction to the Theory and Application of Data Envelopment
Analysis: A Foundation Text with Integrated Software. Kluwer Academic
Publishers, Boston.
Zaim, O. (2004). Measuring environmental performance of state manufacturing through
changes in pollution intensities: a DEA framework. Ecological Economics 48, 37–47.
17
Table 1. Previously published work on efficiency measurement in the water industry.
Water sector Economic efficiency only Combined Economic and
Environmental Efficiency
Life cycle analysis as input in
Economic and Environmental
Efficiency analysis
Irrigation Speelman et al., 2008; Lilienfeld and
Asmild, 2007; Karagiannis et al., 2003
Fraser and Cordina, 1999.
Azad and Ancev, 2013.
Azad and Ancev, 2010;
Azad et al., 2013
Municipal water supply Byrnes et al., 2010;
Fagan et al., 2010; Abbott and Cohen, 2009;
Munisamy, 2009; Garcia-Sanchez, 2006.
Picazo-Tadeo et al.2009 Renzetti
and Dupont, 2009;
Bauman and Tillman, 2004;
Finnveden et al., 2009.
Wastewater treatment Hernández-Sancho et al., 2011;
Rodriguez-Garcia et al., 2011;
Hernández-Sancho and Sala-Garrido, 2009;
Gallego et al., 2008;
Molinos-Senante et al., 2010;
Molinos-Senante et al., 2003;
Sala-Garrido et al.(2012) Rodriguez-Garcia et al., 2011

18
Figure 1. Water withdrawal trend by sector (in percentage)
Source: UNESCO, 2013

19
Figure 2. Total water withdrawal trend (km3/year) by region.
Source: UNESCO, 2013
20
Figure 3. Annual Water withdrawal (10^9m3) by industry for some selected countries
Note: Graph based on latest available 4 years average data.
Source: FAO (Aquastat) database.
0
10
20
30
40
50
60
70
80
90
100
Australia Bulgaria Canada Chile France Germany Greece Japan Mexico New Zealand
Poland Romania Spain Sudan & South Sudan
United Kingdom
Total water withdrawal Water withdrawal for irrigation Municipal water withdrawal
21
Figure 4. Tradeoffs between economic and environmental water use.
22
Figure 5a. Scatter plot of observations on inputs and outputs;
5b. A fitted outer envelope
23
Figure 6. Production frontier and efficiency.
24
Figure 7. Environmentally adjusted efficiency measurements.