Embed Size (px)
Citation preview

Effective Date: January 22, 2014 Revision A
Check the JPSS MIS Server at https://jpssmis.gsfc.nasa.gov/frontmenu_dsp.cfm to verify that this is the correct version prior to use.
Joint Polar Satellite System (JPSS) Ground Project Code 474
474-00039
Joint Polar Satellite System (JPSS)
VIIRS Vegetation Index (VVI) Algorithm Theoretical Basis Document
For Public Release
National Aeronautics and Space Administration
Goddard Space Flight Center Greenbelt, Maryland
GSFC JPSS CMO July 17, 2014
Released
The information provided herein does not contain technical data as defined in the International Traffic in Arms Regulations (ITAR) 22 CFC 120.10.
This document has been approved For Public Release.

JPSS VIIRS Vegetation Index ATBD 474-00039 Effective Date: January 22, 2014 Revision A
i Check the JPSS MIS Server at https://jpssmis.gsfc.nasa.gov/frontmenu_dsp.cfm to verify that this is the correct version prior to use.
Joint Polar Satellite System (JPSS) VIIRS Vegetation Index (VVI)
Algorithm Theoretical Basis Document
JPSS Electronic Signature Page Prepared By: Ray Godin JPSS Data Products and Algorithms, EDR Lead (Electronic Approvals available online at (https://jpssmis.gsfc.nasa.gov/mainmenu_dsp.cfm) Approved By: Eric Gottshall DPA Manager (Electronic Approvals available online at (https://jpssmis.gsfc.nasa.gov/mainmenu_dsp.cfm)
Goddard Space Flight Center Greenbelt, Maryland

JPSS VIIRS Vegetation Index ATBD 474-00039 Effective Date: January 22, 2014 Revision A
ii Check the JPSS MIS Server at https://jpssmis.gsfc.nasa.gov/frontmenu_dsp.cfm to verify that this is the correct version prior to use.
Preface This document is under JPSS Ground AERB configuration control. Once this document is approved, JPSS approved changes are handled in accordance with Class I and Class II change control requirements as described in the JPSS Configuration Management Procedures, and changes to this document shall be made by complete revision. Any questions should be addressed to: JPSS Ground Project Configuration Management Office NASA/GSFC Code 474 Greenbelt, MD 20771
JPSS VIIRS Vegetation Index ATBD 474-00039 Effective Date: January 22, 2014 Revision A
iii Check the JPSS MIS Server at https://jpssmis.gsfc.nasa.gov/frontmenu_dsp.cfm to verify that this is the correct version prior to use.
Change History Log
Revision Effective Date Description of Changes
(Reference the CCR & CCB/ERB Approve Date) Original 04/22/2011 474-CCR-11-0054: This version baselines D43757, VIIRS
Vegetation Index Algorithm Theoretical Basis Document ATDB (REFY2400), Rev --- dated 01/24/2007 as a JPSS document, version Rev -. This is the version that was approved for NPP launch. Per NPOESS CDFCB - External, Volume V – Metadata, doc number D34862-05, this has been approved for Public Release into CLASS. This CCR was approved by the JPSS Algorithm ERB on April 22, 2011.
A 01/22/2014 474-CCR-13-1218: This CCR was approved by the JPSS Algorithm ERB on January 22, 2014. Sections 3.1 and 4.2 were revised. No Word file is available - Pages 13 and 79 were retyped and inserted into the PDF.

Northrop Grumman Space & Mission Systems Corp. Space Technology One Space Park Redondo Beach, CA 90278
Engineering & Manufacturing Development (EMD) Phase Acquisition & Operations Contract
CAGE NO. 11982
VIIRS Vegetation Index (VVI)
Algorithm Theoretical Basis Document ATBD (ref Y2400) Document Number: D43757 Document Date: 1/24/2007 Revision: --- Point of Contact: Merit Shoucri ELECTRONIC APPROVAL SIGNATURES: ____________________________________ ___________________________________ ____________________________________ ___________________________________ ____________________________________ ___________________________________
Prepared by Northrop Grumman Space Technology One Space Park Redondo Beach, CA 90278
Prepared for Department of the Air Force NPOESS Integrated Program Office C/O SMC/CIK 2420 Vela Way, Suite 1467-A8 Los Angeles AFB, CA 90245-4659
Under Contract No. F04701-02-C-0502
PD
MOD
4375
7, -
--. P
DM
O R
elea
sed:
200
7-01
-29
(VER
IFY
REV
ISIO
N S
TATU
S)
Northrop Grumman Space & Mission Systems Corp. Space Technology One Space Park Redondo Beach, CA 90278
Revision/Change Record Document Number D43757
Revision
Document Date
Revision/Change Description
Pages Affected
--- 1/24/2007 Initial PCIM Release to bring document into Matrix Accountability. Reference original document number: Y2400 delivered in 2002
All
PD
MOD
4375
7, -
--. P
DM
O R
elea
sed:
200
7-01
-29
(VER
IFY
REV
ISIO
N S
TATU
S)

NPOESS COMPETITION SENSITIVE
VIIRS VEGETATION INDEX (VVI) VISIBLE/INFRARED IMAGER/RADIOMETER SUITE ALGORITHM THEORETICAL BASIS DOCUMENT
Version 5: March 2002 Shawn W. Miller Phase I Science Team Steve Running (University of Montana) John Townshend (University of Maryland) RAYTHEON COMPANY Information Technology and Scientific Services 4400 Forbes Boulevard Lanham, MD 20706 SRBS Document #: Y2400
SRBSS Document #: Y2400 i PD
MOD
4375
7, -
--. P
DM
O R
elea
sed:
200
7-01
-29
(VER
IFY
REV
ISIO
N S
TATU
S)

VIIRS Vegetation Index (VVI) NPOESS/VIIRS
EDR: VEGETATION INDEX
Doc No: Y2400
Version: 5
Revision: 0
Function Name Signature Date
Prepared by
EDR Developer
S. MILLER
1/11/02
Approved by
Relevant IPT Lead
S. MILLER
1/11/02
Approved by
Reviewer K. JENSEN 1/18/02
Approved by
Chief Scientist
S. MILLER
2/1/02
Released by
Algorithm Lead
P. KEALY
2/15/02
ii SBRS Document #: Y2400 PD
MOD
4375
7, -
--. P
DM
O R
elea
sed:
200
7-01
-29
(VER
IFY
REV
ISIO
N S
TATU
S)
NPOESS/VIIRS VIIRS Vegetation Index (VVI)
TABLE OF CONTENTS Page
LIST OF FIGURES ....................................................................................................................... iii
LIST OF TABLES ........................................................................................................................ vii
GLOSSARY OF ACRONYMS..................................................................................................... ix
ABSTRACT.................................................................................................................................xiii
1.0 INTRODUCTION ................................................................................................................. 1
1.1 PURPOSE .................................................................................................................. 1
1.2 SCOPE ....................................................................................................................... 2
1.3 VIIRS DOCUMENTS ............................................................................................... 2
1.4 REVISION HISTORY............................................................................................... 3
2.0 EXPERIMENT OVERVIEW ................................................................................................ 5
2.1 OBJECTIVES OF VVI RETRIEVALS .................................................................... 5
2.2 INSTRUMENT CHARACTERISTICS .................................................................... 6
2.3 RETRIEVAL STRATEGY ..................................................................................... 10
3.1 PROCESSING OUTLINE....................................................................................... 13
3.2 ALGORITHM INPUT............................................................................................. 13 3.2.1 VIIRS Data................................................................................................ 13 3.2.2 Non-VIIRS Data ....................................................................................... 13
3.3 THEORETICAL DESCRIPTION OF VVI RETRIEVALS ................................... 15 3.3.1 Physics of the VVI .................................................................................... 15
3.3.1.1 Spectral Characteristics of Vegetation .................................... 15 3.3.1.2 Historical Development of Vegetation Indices ....................... 16
3.3.2 Mathematical Description ......................................................................... 17 3.3.2.1 NDVI – AVHRR/MODIS Continuity Index .......................... 17 3.3.2.2 EVI – MODIS Continuity Index............................................. 18 3.3.2.3 GWVI – Composited Index .................................................... 18 3.3.2.4 AVI – Advanced Vegetation Index......................................... 19 3.3.2.5 LAI and FPAR – Leaf Area Index and Fraction of
Absorbed Photosynthetically Active Radiation ...................... 19 3.3.2.6 PSN – Net Photosynthesis....................................................... 20 3.3.2.7 NPP – Net Primary Productivity ............................................. 20
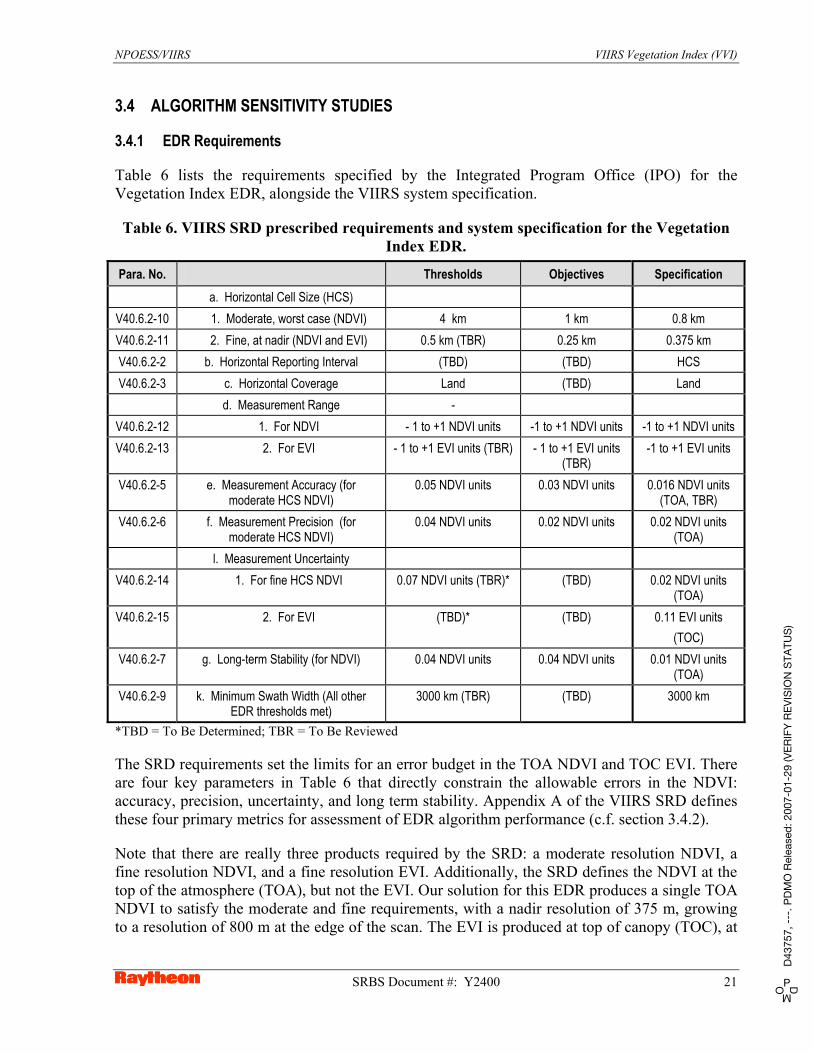
3.4 ALGORITHM SENSITIVITY STUDIES............................................................... 21 3.4.1 EDR Requirements.................................................................................... 21
SRBS Document #: Y2400 i PD
MOD
4375
7, -
--. P
DM
O R
elea
sed:
200
7-01
-29
(VER
IFY
REV
ISIO
N S
TATU
S)
VIIRS Vegetation Index (VVI) NPOESS/VIIRS
3.4.2 Performance Metrics..................................................................................22 3.4.3 Description of Phase I Simulations............................................................24
3.4.3.1 Stick Models Iteration I ........................................................24 3.4.3.2 Stick Models Iteration II .......................................................27 3.4.3.3 Landsat TM 2-D Simulations ..................................................30 3.4.3.4 VIIRS 2-D Simulations with TERCAT Scenes.......................37
3.4.4 Impacts of Reflectance Errors on the NDVI..............................................38 3.4.5 Individual Error Sources............................................................................46
3.4.5.1 Algorithmic Error ....................................................................46 3.4.5.2 BRDF Effects...........................................................................46 3.4.5.3 Atmospheric Effects ................................................................47 3.4.5.4 Band Selection and Continuity ................................................47 3.4.5.5 Sensor MTF Effects.................................................................54 3.3.5.6 Sensor Noise ............................................................................55 3.4.5.7 Radiometric Calibration and Stability .....................................59 3.4.5.8 Geolocation Errors...................................................................63 3.4.5.9 Band-to-Band Registration Errors ...........................................63
3.4.6 End-to-End Performance Assessment .......................................................70 3.4.7 Stratified Performance ...............................................................................73
3.5 PRACTICAL CONSIDERATIONS ........................................................................77 3.5.1 Numerical Computation Considerations....................................................77 3.5.2 Programming and Procedural Considerations ...........................................77 3.5.3 Configuration of Retrievals .......................................................................78 3.5.4 Quality Assessment and Diagnostics.........................................................78 3.5.5 Exception Handling ...................................................................................78
3.6 ALGORITHM VALIDATION ................................................................................78
4.0 ASSUMPTIONS AND LIMITATIONS ..............................................................................79
4.1 ASSUMPTIONS ......................................................................................................79
4.2 LIMITATIONS ........................................................................................................79
5.0 REFERENCES .....................................................................................................................81
ii SBRS Document #: Y2400 PD
MOD
4375
7, -
--. P
DM
O R
elea
sed:
200
7-01
-29
(VER
IFY
REV
ISIO
N S
TATU
S)
NPOESS/VIIRS VIIRS Vegetation Index (VVI)
LIST OF FIGURES
Page
Figure 1. Summary of VIIRS design concepts and heritage........................................................... 7
Figure 2. VIIRS detector footprint aggregation scheme for building "pixels." .............................. 8
Figure 3. Benefits of VIIRS aggregation scheme in reducing pixel growth at edge of scan. ......... 8
Figure 4. VIIRS spectral bands, visible and near infrared. ............................................................. 9
Figure 5. VIIRS spectral bands, short wave infrared. ................................................................... 10
Figure 6. Structure of the VIIRS vegetation-related products. ..................................................... 11
Figure 7. Vegetation Index software architecture (NOTE: the Tertiary Products are generated offline in the VIIRS Gridding module).................................................................... 14
Figure 8. Spectral reflectance of a maple leaf, from USGS spectral library................................. 15
Figure 9. Landsat TM scene 1, Chesapeake, May 16, 1987. ........................................................ 31
Figure 10. Landsat TM scene 2, Appalachians, September 21, 1988........................................... 32
Figure 11. Landsat TM scene 3, White Sands, June 15, 1993. ..................................................... 33
Figure 12. NDVI for Landsat TM scene 1, Chesapeake, May 16, 1987....................................... 34
Figure 13. NDVI for Landsat TM scene 2, Appalachians, September 21, 1988. ......................... 35
Figure 14. NDVI for Landsat TM scene 3, White Sands, June 15, 1993. .................................... 36
Figure 15. Overall structure of VIIRS Testbed as applies to land TERCAT scenes. ................... 37
Figure 16. NDVI accuracy as a function of red and near infrared reflectance accuracy, for values typical of a deciduous forest. ................................................................................... 40
Figure 17. NDVI accuracy as a function of red and near infrared reflectance accuracy, for values typical of moderate vegetation................................................................................. 41
Figure 18. NDVI accuracy as a function of red and near infrared reflectance accuracy, for values typical of bare soil.................................................................................................... 42
Figure 19. NDVI precision as a function of red and near infrared precision, for values typical of a deciduous forest. ...................................................................................................... 43
Figure 20. NDVI precision as a function of red and near infrared precision, for values typical of moderate vegetation. ................................................................................................ 44
SRBS Document #: Y2400 iii PD
MOD
4375
7, -
--. P
DM
O R
elea
sed:
200
7-01
-29
(VER
IFY
REV
ISIO
N S
TATU
S)

VIIRS Vegetation Index (VVI) NPOESS/VIIRS
Figure 21. NDVI precision as a function of red and near infrared precision, for values typical of bare soil.....................................................................................................................45
Figure 22. Comparison of NDVI derived from VIIRS and AVHRR-2 sensors. ...........................49
Figure 23. Linear adjustment of VIIRS NDVI to match AVHRR-2 NDVI. .................................50
Figure 24. Comparison of NDVI derived from VIIRS and AVHRR-3 sensors. ...........................52
Figure 25. Linear adjustment of VIIRS NDVI to match AVHRR-3 NDVI. .................................53
Figure 26. Comparison of reflectivities in VIIRS and MODIS blue bands. For VIIRS, the bands labeled 1, 2, and 3, are now called M1, M2, and M3, respectively..........................53
Figure 27. 400-m accuracy, precision, and uncertainty in the NDVI for MTF-smeared red and near infrared bands in scene 1 (Chesapeake)............................................................55
Figure 28. Comparison of ground, TOA, and sensor-measured retrievals of NDVI using sensor specification for radiometric noise, with a solar zenith of 20 degrees and a viewing zenith of 0 degrees. TOA values are aligned almost exactly with measurements...57
Figure 29. Comparison of ground, TOA, and sensor-measured retrievals of NDVI using sensor specification for radiometric noise, with a solar zenith of 60 degrees and a viewing zenith of 70 degrees..................................................................................................58
Figure 30. Red and near infrared band upper bound calibration/stability requirements and NDVI for 21 surface types, with solar zenith of 20 degrees and viewing zenith of 0 degrees. .....................................................................................................................60
Figure 31. Red and near infrared band upper bound stability requirements and NDVI for 21 surface types, with solar zenith of 60 degrees and viewing zenith of 70 degrees. ...62
Figure 32. 1-km accuracy, precision, and uncertainty in NDVI for identically misregistered red and near infrared bands in scene 1............................................................................65
Figure 33. 1-km accuracy, precision, and uncertainty in NDVI for identically misregistered red and near infrared bands in scene 2............................................................................66
Figure 34. 1-km accuracy, precision, and uncertainty in NDVI for identically misregistered red and near infrared bands in scene 3............................................................................67
Figure 35. 400-m accuracy, precision, and uncertainty in the NDVI for misregistered red and near-infrared bands in scene 1 (Chesapeake). ..........................................................69
Figure 36. Colombia TERCAT scene and subscene. ....................................................................71
Figure 37. TOC NDVI end to end performance for the Colombia TERCAT scene. ....................71
Figure 38. TOA NDVI end to end performance for the Colombia TERCAT scene. ....................72
iv SBRS Document #: Y2400 PD
MOD
4375
7, -
--. P
DM
O R
elea
sed:
200
7-01
-29
(VER
IFY
REV
ISIO
N S
TATU
S)
NPOESS/VIIRS VIIRS Vegetation Index (VVI)
Figure 39. TOC EVI end to end performance for the Colombia TERCAT scene. ....................... 73
Figure 40. Stratified performance of the TOA NDVI from Iteration II........................................ 74
Figure 41. Stratified performance of the TOC EVI from Iteration II. .......................................... 75
Figure 42. Stratified performance of the TOC NDVI from Iteration II. ....................................... 76
SRBS Document #: Y2400 v PD
MOD
4375
7, -
--. P
DM
O R
elea
sed:
200
7-01
-29
(VER
IFY
REV
ISIO
N S
TATU
S)

VIIRS Vegetation Index (VVI) NPOESS/VIIRS
vi SBRS Document #: Y2400 PD
MOD
4375
7, -
--. P
DM
O R
elea
sed:
200
7-01
-29
(VER
IFY
REV
ISIO
N S
TATU
S)
NPOESS/VIIRS VIIRS Vegetation Index (VVI)
LIST OF TABLES
Page
Table 1. Component products of the VIIRS Vegetation Index (VVI), VVI Secondary Products (VVI2P), and VVI Tertiary Products (VVI3P).......................................................... 1
Table 2. VIIRS and Non-VIIRS input data requirements for VVI products. ............................... 14
Table 3. Spectral bands of the AVHRR-2 (through NOAA-14)................................................... 16
Table 4. Spectral bands of the Landsat Thematic Mapper (TM), Landsat-4 and Landsat-5. ....... 17
Table 5. Spectral bands of MODIS relevant to vegetation studies. .............................................. 17
Table 6. VIIRS SRD prescribed requirements and system specification for the Vegetation Index EDR.......................................................................................................................... 21
Table 7. Surface types for simulations of VVI products in Iteration 1. ........................................ 25
Table 8. Summary of dimensions for Land EDR stick modeling data set in Iteration II.............. 28
Table 9. Summary of VIIRS bands investigated in stick modeling data set for Iteration II. ........ 28
Table 10. Summary of error sources simulated for each EDR/IP in Iteration II. ......................... 29
Table 11. Landsat scenes used for 2-D simulations of VVI products........................................... 30
Table 12. Comparison of four different visible/infrared sensors with VIIRS as baseline. ........... 47
SRBS Document #: Y2400 vii PD
MOD
4375
7, -
--. P
DM
O R
elea
sed:
200
7-01
-29
(VER
IFY
REV
ISIO
N S
TATU
S)

VIIRS Vegetation Index (VVI) NPOESS/VIIRS
viii SBRS Document #: Y2400 PD
MOD
4375
7, -
--. P
DM
O R
elea
sed:
200
7-01
-29
(VER
IFY
REV
ISIO
N S
TATU
S)

NPOESS/VIIRS VIIRS Vegetation Index (VVI)
GLOSSARY OF ACRONYMS
AOT Aerosol Optical Thickness ARVI Atmospherically Resistant Vegetation Index ATB Algorithm Theoretical Basis ATBD Algorithm Theoretical Basis Document AVHRR Advanced Very High Resolution Radiometer AVI Advanced Vegetation Index BBR Band-to-Band Registration BRDF Bidirectional Reflectance Distribution Function DISORT Discrete Ordinate Radiative Transfer Model DN Digital Number DoD Department of Defense EDR Environmental Data Record EOS Earth Observing System EVI Enhanced Vegetation Index FPAR Fraction of absorbed Photosynthetically Active Radiation GCOS Global Climate Observing System GIFOV Ground Instantaneous Field of View GMVI Gridded Monthly Vegetation Index GVI Global Vegetation Index GWVI Gridded Weekly Vegetation Index HCS Horizontal Cell Size HITRAN High Resolution Transmission Model HSI Horizontal Sampling Interval HSR Horizontal Spatial Resolution ICD Interface Control Document IPO Integrated Program Office JHU Johns Hopkins University LAI Leaf Area Index LBL Line by Line LLLS Low Level Light Sensor LOWTRAN Low Resolution Transmission Model
SRBS Document #: Y2400 ix PD
MOD
4375
7, -
--. P
DM
O R
elea
sed:
200
7-01
-29
(VER
IFY
REV
ISIO
N S
TATU
S)

VIIRS Vegetation Index (VVI) NPOESS/VIIRS
LQF Land Quality Flag(s) LUT Look-up Table MODIS Moderate Resolution Imaging Spectroradiometer MODTRAN Moderate Resolution Transmission Model MTF Modulation Transfer Function MVI MODIS Vegetation Index NASA National Aeronautics and Space Administration NASA/GSFC NASA Goddard Space Flight Center NASA/JPL NASA Jet Propulsion Laboratory NCEP National Centers for Environmental Prediction NDVI Normalized Difference Vegetation Index NIR Near Infrared NOAA National Oceanic and Atmospheric Administration NPOESS National Polar-orbiting Operational Environmental Satellite System NPP Net Primary Productivity OR NPOESS Preparatory Project OLS Operational Linescan System PAR Photosynthetically Active Radiation PDR Preliminary Design Review PSF Point Spread Function PSN Net Photosynthesis RDR Raw Data Record RMS Root Mean Square SAVI Soil Adjusted Vegetation Index SBRS Santa Barbara Remote Sensing SDP Science Data Processing SDR Sensor Data Record SDSM Solar Diffuser Stability Monitor SeaWiFS Sea-viewing Wide Field of View Sensor SNR Signal-to-Noise Ratio SRD Sensor Requirements Document SWIR Short Wave Infrared TBD To Be Determined TBR To Be Reviewed TERCAT Terrain Categorization TIROS Television Infrared Observation Satellite TM Thematic Mapper TOA Top of Atmosphere TOC Top of Canopy USGS United States Geological Survey VIIRS Visible/Infrared Imager/Radiometer Suite VNIR Visible/Near Infrared
x SBRS Document #: Y2400 PD
MOD
4375
7, -
--. P
DM
O R
elea
sed:
200
7-01
-29
(VER
IFY
REV
ISIO
N S
TATU
S)

NPOESS/VIIRS VIIRS Vegetation Index (VVI)
VVI VIIRS Vegetation Index VVI2P VIIRS Vegetation Index Secondary Products VVI3P VIIRS Vegetation Index Tertiary Products WVI Weekly Vegetation Index
SRBS Document #: Y2400 xi PD
MOD
4375
7, -
--. P
DM
O R
elea
sed:
200
7-01
-29
(VER
IFY
REV
ISIO
N S
TATU
S)
VIIRS Vegetation Index (VVI) NPOESS/VIIRS
xii SBRS Document #: Y2400 PD
MOD
4375
7, -
--. P
DM
O R
elea
sed:
200
7-01
-29
(VER
IFY
REV
ISIO
N S
TATU
S)
NPOESS/VIIRS VIIRS Vegetation Index (VVI)
ABSTRACT
The Visible/Infrared Imager/Radiometer Suite (VIIRS) Vegetation Index (VVI) is one of more than two dozen environmental data records (EDRs) explicitly required as products to be derived from the VIIRS sensor slated to fly onboard the National Polar-orbiting Operational Environmental Satellite System (NPOESS), which is scheduled for launch in the late 2000’s. The requirements for the VIIRS EDRs are described in detail in the VIIRS Sensor Requirements Document (SRD). These requirements form the foundation from which both the algorithms and the sensor are designed and built. A revised version of the SRD was released in November 1999, detailing a set of new requirements targeted toward the NPOESS Preparatory Project (NPP), a National Aeronautics and Space Administration (NASA) endeavor to build upon the Moderate Resolution Imaging Spectroradiometer (MODIS) heritage beginning in 2005. Based upon the sum of these requirements, the VVI is currently proposed to consist of a suite of four vegetation indices. Two other suites of related products will be produced for added value: the VVI Secondary Products (VVI2P) and the VVI Tertiary Products (VVI3P). Individual algorithms within the suites will be referred to by their traditional names, e.g., NDVI, LAI.
The VVI will contain the following products at the imagery resolution pixel level: the Normalized Difference Vegetation Index (NDVI) both top-of-canopy (TOC) and top-of-atmosphere (TOA) for continuity with the Advanced Very High Resolution Radiometer (AVHRR) heritage; the Enhanced Vegetation Index (EVI), for continuity with the MODIS heritage; and a placeholder for an Advanced Vegetation Index (AVI), which exhibits an optimal combination of sensitivity to vegetative processes and insensitivity to non-vegetative effects. The VVI2P will contain leaf area index (LAI) and fraction of absorbed photosynthetically active radiation (FPAR) at the moderate resolution pixel level. The VVI3P will contain net primary production (NPP) and net photosynthesis (PSN), as useful inputs to biophysical and climate models, on a global 1-km grid. Additionally, a Gridded Weekly Vegetation Index (GWVI), compositing the NDVI from nadir-adjusted surface reflectances to remove the effects of clouds and bi-directional reflectance variations, will be produced in VIIRS post-processing each day from a preceding eight-day window.
This document includes a description of the established behavior of the products listed above. Because most of them have a solid basis in the scientific literature, the majority of the discussion here will focus on the assembly of the VVI products, an analysis of the relevant error sources, and a plan for implementation. Numerous Phase I simulations have been conducted using LANDSAT thematic mapper (TM) imagery, government-supplied terrain categorization (TERCAT) scenes, spectral reflectance libraries, modeling of sensor effects, and forward and orbit modeling using packages such as MODTRAN and 6S. These simulations have permitted the construction and characterization of a robust package of environmental products that will build upon the existing MODIS and AVHRR heritages and provide superior spatial resolution (375 m at nadir, 800 m at the edge of the scan for a 3000 km swath).
SRBS Document #: Y2400 xiii PD
MOD
4375
7, -
--. P
DM
O R
elea
sed:
200
7-01
-29
(VER
IFY
REV
ISIO
N S
TATU
S)

VIIRS Vegetation Index (VVI) NPOESS/VIIRS
xiv SBRS Document #: Y2400 PD
MOD
4375
7, -
--. P
DM
O R
elea
sed:
200
7-01
-29
(VER
IFY
REV
ISIO
N S
TATU
S)

NPOESS/VIIRS VIIRS Vegetation Index (VVI)
1.0 INTRODUCTION
1.1 PURPOSE
This algorithm theoretical basis document (ATBD) describes the algorithms used to retrieve the Visible/Infrared Imager/Radiometer Suite (VIIRS) Vegetation Index (VVI), the VVI Secondary Products (VVI2P), and the VVI Tertiary Products (VVI3P). Together, these items include a total of eight separate vegetation-related products. Each of these products will be described in detail in this document. The primary purpose of this ATBD is to establish guidelines for the production of the VVI, the VVI2P, and the VVI3P. This document will describe the required inputs, a theoretical description of the algorithms, the sources and magnitudes of the errors involved, practical considerations for post-launch implementation, and the assumptions and limitations associated with the products. Table 1 summarizes the VVI-related products. SRD is an acronym for the VIIRS Sensor Requirements Document (IPO, 2000).
Table 1. Component products of the VIIRS Vegetation Index (VVI), VVI Secondary Products (VVI2P), and VVI Tertiary Products (VVI3P).
Product Sub-Product Acronym Description Purpose
VIIRS Vegetation Index (VVI)
TOA NDVI Normalized Difference Vegetation Index, at the top of the atmosphere
Continuity with AVHRR heritage, meeting of SRD requirements
TOC NDVI Normalized Difference Vegetation Index, at the top of the canopy
Continuity with MODIS/AVHRR heritage, focused on surface values
EVI Enhanced Vegetation Index Continuity with MODIS heritage, meeting of SRD requirements
AVI Advanced Vegetation Index Index with optimal combination of low sensitivity to non-vegetative effects and high sensitivity to important vegetative effects
VVI Secondary Products (VVI2P)
LAI Leaf Area Index Useful parameter for biogeophysical models and scientific interpretation
FPAR Fraction of absorbed Photosynthetically Active Radiation
Useful parameter for biogeophysical models and scientific interpretation
VVI Tertiary Products (VVI3P)
PSN Net Photosynthesis Useful parameter for assessing the magnitude of CO2 transport in the carbon cycle
NPP Net Primary Production Useful parameter for monitoring of crops and forests
Other Products (produced offline)
GWVI Gridded Weekly Vegetation Index Running gridded composite of NDVI to remove bi-directional and cloud contamination effects
SRBS Document #: Y2400 1 PD
MOD
4375
7, -
--. P
DM
O R
elea
sed:
200
7-01
-29
(VER
IFY
REV
ISIO
N S
TATU
S)
VIIRS Vegetation Index (VVI) NPOESS/VIIRS
1.2 SCOPE
This document covers the algorithm theoretical basis (ATB) for the operational retrieval of the VVI, VVI2P, and VVI3P. Any derived products beyond the eight components of the VVI will not be discussed in detail.
Section 1 describes the purpose and scope of this document; it also includes a listing of VIIRS documents that will be cited in the following sections. Section 2 provides a brief overview of the motivation for the VVI algorithms, including the objectives of the retrievals, the currently designed VIIRS instrument characteristics, and the strategy for retrieval of the VVI products. Section 3 contains the essence of this document – a complete description of the VVI products and their components. Consideration is given to the overall structure, the required inputs, a theoretical description of the products, assessment of the error budget, results of ongoing sensitivity studies, practical implementation issues, validation, and the algorithm development schedule. Section 4 provides an overview of the constraints, assumptions and limitations associated with the VVI algorithms, and Section 5 contains a listing of references cited throughout the course of this document.
1.3 VIIRS DOCUMENTS
Reference to VIIRS documents within this ATBD will be indicated by an italicized Raytheon Santa Barbara Remote Sensing (SBRS) official Y-number in brackets, e.g., [Y2388].
Y2387 VIIRS Soil Moisture ATBD
Y2388 VIIRS Aerosol Optical Thickness and Particle Size Parameter ATBD
Y2390 VIIRS Suspended Matter ATBD
Y2393 VIIRS Cloud Effective Particle Size and Cloud Optical Thickness ATBD
Y2402 VIIRS Surface Type ATBD
Y2411 VIIRS Surface Reflectance ATBD
Y2412 VIIRS Cloud Mask ATBD
Y2468 VIIRS Operations Concept Document
Y2469 VIIRS Context Level Software Architecture
Y2470 VIIRS Interface Control Document (ICD)
Y2474 VIIRS Land Module Level Software Architecture
Y2483 VIIRS Land Module Level Detailed Design
Y2499 VIIRS Vegetation Index Unit Level Detailed Design
2 SBRS Document #: Y2400 PD
MOD
4375
7, -
--. P
DM
O R
elea
sed:
200
7-01
-29
(VER
IFY
REV
ISIO
N S
TATU
S)

NPOESS/VIIRS VIIRS Vegetation Index (VVI)
Y3236 VIIRS Software Integration and Test Plan
Y3237 VIIRS Algorithm Verification and Validation Plan
Y3252 VIIRS Active Fires ATBD
Y3257 VIIRS Computer Resources Requirements Document
Y3261 VIIRS Radiometric Calibration ATBD
Y3270 VIIRS System Verification and Validation Plan
Y3279 VIIRS Land Module Level Interface Control Document
Y6635 VIIRS Algorithm Software Development Plan
Y6661 VIIRS Algorithm Software Maturity Assessment
Y7040 VIIRS Algorithm/Data Processing Technical Report
Y7051 VIIRS Earth Gridding ATBD
SS154650 VIIRS System Specification
PS154650 VIIRS Sensor Specification
PS154640 VIIRS Algorithm Specification
1.4 REVISION HISTORY
This is the fifth working version of this document, dated March 2002. The fourth version was dated May 2001. Version 3 was dated April 14, 2000. Version 2 was dated June 1999. Version 1 was dated September 1998. The original draft version of this document, Version 0, was dated July 1998. The author is greatly indebted to John Townshend and Steve Running for extensive feedback and guidance in the Phase I development of this ATBD. The current version differs from Version 4 in the following areas:
1) Separation of LAI and FPAR into the VVI2P
2) Separation of PSN and NPP into the VVI3P
3) Movement of the Weekly Vegetation Index to a separate gridded product (GWVI)
4) Refined discussion of LAI and FPAR retrievals
5) Movement of the discussion of quality flags to [Y2411]
6) Minor changes to description of VIIRS bands where appropriate
SRBS Document #: Y2400 3 PD
MOD
4375
7, -
--. P
DM
O R
elea
sed:
200
7-01
-29
(VER
IFY
REV
ISIO
N S
TATU
S)

VIIRS Vegetation Index (VVI) NPOESS/VIIRS
4 SBRS Document #: Y2400 PD
MOD
4375
7, -
--. P
DM
O R
elea
sed:
200
7-01
-29
(VER
IFY
REV
ISIO
N S
TATU
S)
NPOESS/VIIRS VIIRS Vegetation Index (VVI)
2.0 EXPERIMENT OVERVIEW
2.1 OBJECTIVES OF VVI RETRIEVALS
Vegetation indices have both qualitative and quantitative applications. Qualitatively, they provide a means of separating vegetation from other surface types, and they also give a general indication of the “greenness” within a given region – a combined measure of the health, density, and type of vegetation present. If retrievals are made consistently, adjusting for bidirectional reflectance and atmospheric effects, the changes in vegetation indices can be analyzed quantitatively, both seasonally and in the longer term. Vegetation indices can also be regressed to produce estimates of real world quantities such as leaf area index (LAI) and chlorophyll absorption. These parameters may be used as input to biogeophysical models.
The worth of an operational vegetation index product has already been demonstrated with the heritage of the Normalized Difference Vegetation Index (NDVI). The NDVI forms the central foundation of the Global Vegetation Index (GVI) product maintained by the National Oceanic and Atmospheric Administration (NOAA). Discussion of various other examples can be found in Sellers et al. (1994), Prince et al. (1994), Prince (1991), Prince and Justice (1991), and Hutchinson (1991).
The VVI shall consist of several output products, which are summarized in Table 1. In addition to meeting the requirements presented in the VIIRS Sensor Requirements Document (SRD), there are six primary scientific objectives underlying the retrieval of the VVI products:
1) To provide a global database of accurately measured vegetation indices, leaf area index (LAI), fraction of absorbed photosynthetically active radiation (FPAR), net photosynthesis (PSN), and annual net primary production (NPP) which can be utilized to conduct studies of the spatial and temporal variability of vegetation
2) To provide regional data of accurately measured vegetation indices, LAI, FPAR, PSN, and NPP which can be used to further the understanding of vegetation-related processes and the coupling of vegetation with local and large scale climate
3) To provide accurate inputs for the continual production of land cover and land cover change maps at a spatial scale sufficient to detect the effects of droughts, floods, fires, and anthropogenic activity. The VIIRS Surface Type EDR is described in [Y2402]
4) To provide accurate inputs for the calculation of surface wetness or soil moisture as a derived VIIRS product. The VIIRS Soil Moisture EDR is described in [Y2387]
5) To continue the climatology of vegetation indices which has been built upon Advanced Very High Resolution Radiometer (AVHRR) NDVI products and which will be further enhanced by data from the Moderate Resolution Imaging Spectroradiometer (MODIS)
6) To provide biophysical parameters which are of sufficient quality to enhance the performance of biogeophysical models.
SRBS Document #: Y2400 5 PD
MOD
4375
7, -
--. P
DM
O R
elea
sed:
200
7-01
-29
(VER
IFY
REV
ISIO
N S
TATU
S)

VIIRS Vegetation Index (VVI) NPOESS/VIIRS
The reader will note the significant diversity of these applications for the VVI products. They span a wide range of scales both in space and time. As time passes and the evolution of vegetation indices continues into the future prior to the launches of the National Polar-orbiting Operational Environmental Satellite System (NPOESS) and the NPOESS Preparatory Project, the VVI products will also evolve to attain a maximum degree of utility across this wide range of user needs.
2.2 INSTRUMENT CHARACTERISTICS
The VIIRS instrument will now be briefly described to clarify the context of the descriptions of the VVI algorithms presented in this document. VIIRS can be pictured as a convergence of three existing sensors, two of which have seen extensive operational use at this writing.
The Operational Linescan System (OLS) is the operational visible/infrared scanner for the Department of Defense (DoD). Its unique strengths are controlled growth in spatial resolution through rotation of the ground instantaneous field of view (GIFOV) and the existence of a low-level light sensor (LLLS) capable of detecting visible radiation at night. OLS has primarily served as a data source for manual analysis of imagery. The Advanced Very High Resolution Radiometer (AVHRR) is the operational visible/infrared sensor flown on the National Oceanic and Atmospheric Administration (NOAA) Television Infrared Observation Satellite (TIROS-N) series of satellites (Planet, 1988). Its unique strengths are low operational and production cost and the presence of five spectral channels that can be used in a wide number of combinations to produce operational and research products. In December 1999, the National Aeronautics and Space Administration (NASA) launched the Earth Observing System (EOS) morning satellite, Terra, which includes the Moderate Resolution Imaging Spectroradiometer (MODIS). This sensor possesses an unprecedented array of thirty-two spectral bands at resolutions ranging from 250 m to 1 km at nadir, allowing for unparalleled accuracy in a wide range of satellite-based environmental measurements.
VIIRS will reside on a platform of the NPOESS series of satellites. It is intended to be the product of a convergence between DoD, NOAA and NASA in the form of a single visible/infrared sensor capable of satisfying the needs of all three communities, as well as the research community beyond. As such, VIIRS will require three key attributes: high spatial resolution with controlled growth off nadir, minimal production and operational cost, and a large number of spectral bands to satisfy the requirements for generating accurate operational and scientific products.
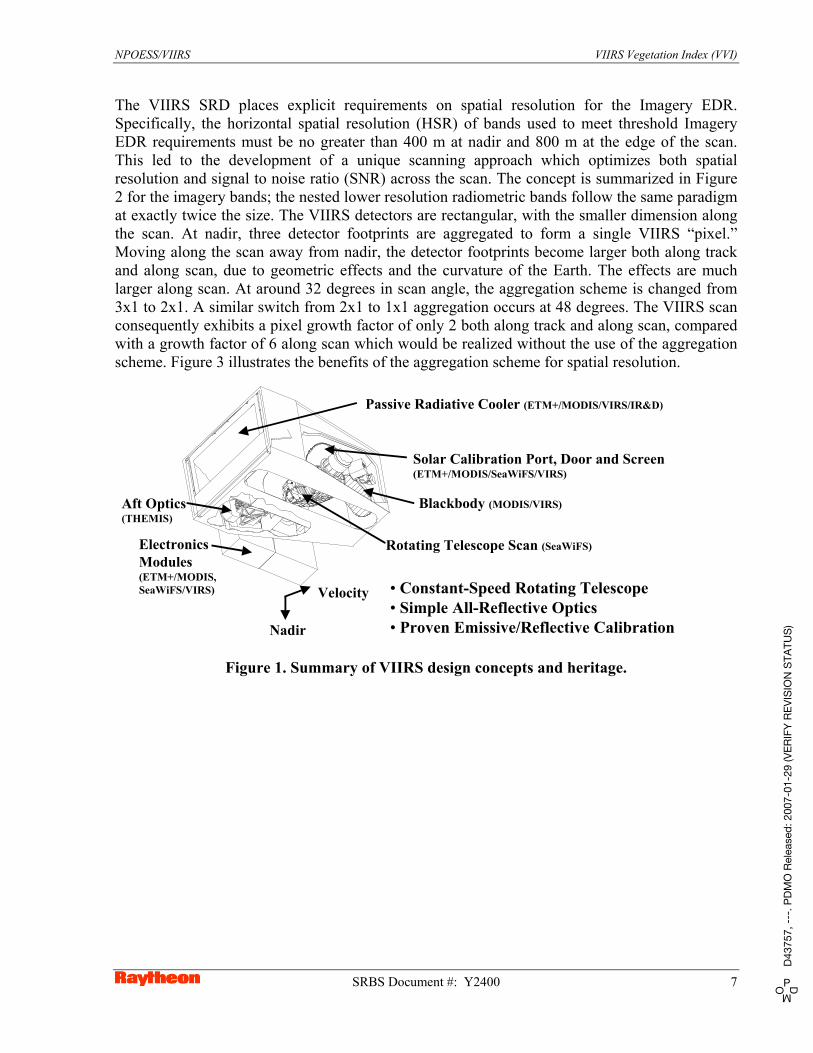
Figure 1 illustrates the design concept for VIIRS, designed and built by Raytheon Santa Barbara Remote Sensing (SBRS). At its heart is a rotating telescope scanning mechanism that minimizes the effects of solar impingement and scattered light. VIIRS is essentially a combination of SeaWiFS foreoptics and an all-reflective modification of MODIS/THEMIS aft-optics. Calibration is performed onboard using a solar diffuser for short wavelengths and a blackbody source and deep space view for thermal wavelengths. A solar diffuser stability monitor (SDSM) is also included to track the performance of the solar diffuser. The nominal altitude for NPOESS will be 833 km. The VIIRS scan will therefore extend to 56 degrees on either side of nadir.
6 SBRS Document #: Y2400 PD
MOD
4375
7, -
--. P
DM
O R
elea
sed:
200
7-01
-29
(VER
IFY
REV
ISIO
N S
TATU
S)
NPOESS/VIIRS VIIRS Vegetation Index (VVI)
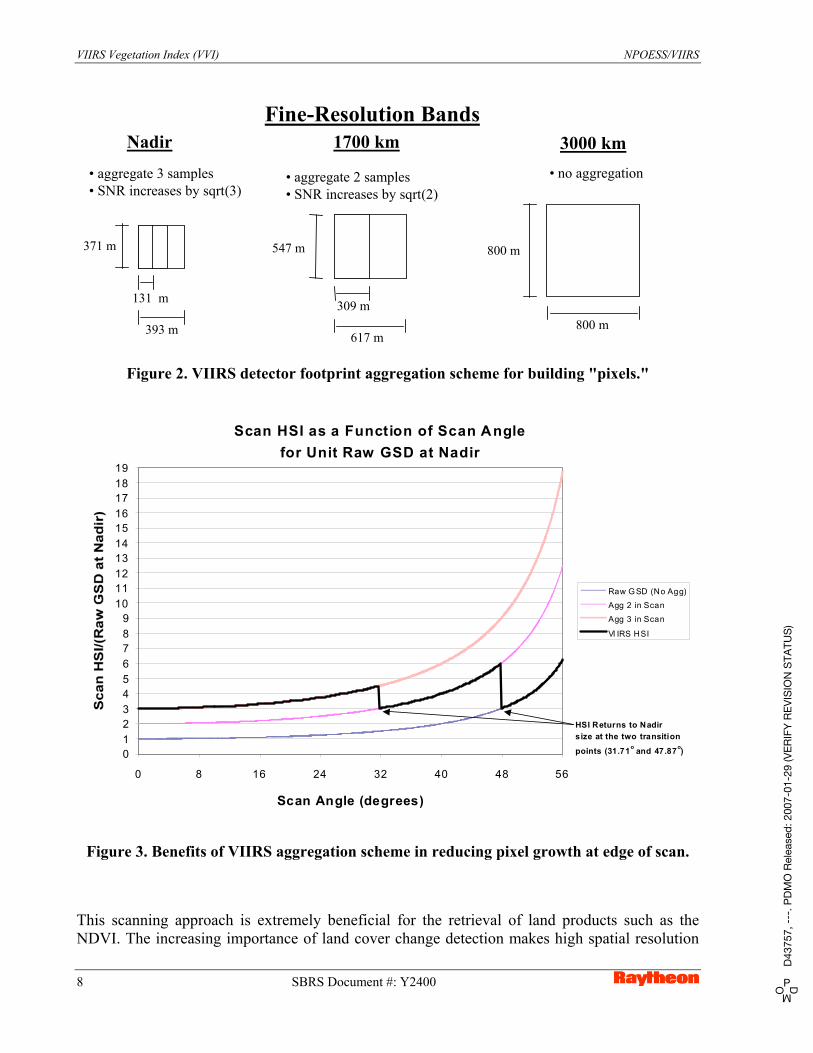
The VIIRS SRD places explicit requirements on spatial resolution for the Imagery EDR. Specifically, the horizontal spatial resolution (HSR) of bands used to meet threshold Imagery EDR requirements must be no greater than 400 m at nadir and 800 m at the edge of the scan. This led to the development of a unique scanning approach which optimizes both spatial resolution and signal to noise ratio (SNR) across the scan. The concept is summarized in Figure 2 for the imagery bands; the nested lower resolution radiometric bands follow the same paradigm at exactly twice the size. The VIIRS detectors are rectangular, with the smaller dimension along the scan. At nadir, three detector footprints are aggregated to form a single VIIRS “pixel.” Moving along the scan away from nadir, the detector footprints become larger both along track and along scan, due to geometric effects and the curvature of the Earth. The effects are much larger along scan. At around 32 degrees in scan angle, the aggregation scheme is changed from 3x1 to 2x1. A similar switch from 2x1 to 1x1 aggregation occurs at 48 degrees. The VIIRS scan consequently exhibits a pixel growth factor of only 2 both along track and along scan, compared with a growth factor of 6 along scan which would be realized without the use of the aggregation scheme. Figure 3 illustrates the benefits of the aggregation scheme for spatial resolution.
• Constant-Speed Rotating Telescope• Simple All-Reflective Optics• Proven Emissive/Reflective Calibration
Passive Radiative Cooler (ETM+/MODIS/VIRS/IR&D)
Rotating Telescope Scan (SeaWiFS)
Solar Calibration Port, Door and Screen(ETM+/MODIS/SeaWiFS/VIRS)
Blackbody (MODIS/VIRS)
Electronics Modules(ETM+/MODIS, SeaWiFS/VIRS)
Aft Optics(THEMIS)
Nadir
Velocity
Figure 1. Summary of VIIRS design concepts and heritage.
SRBS Document #: Y2400 7 PD
MOD
4375
7, -
--. P
DM
O R
elea
sed:
200
7-01
-29
(VER
IFY
REV
ISIO
N S
TATU
S)
VIIRS Vegetation Index (VVI) NPOESS/VIIRS
371 m 547 m 800 m
309 m
617 m800 m
131 m
393 m
Nadir 1700 km 3000 km• aggregate 3 samples• SNR increases by sqrt(3)
• no aggregation• aggregate 2 samples• SNR increases by sqrt(2)
Fine-Resolution Bands
Figure 2. VIIRS detector footprint aggregation scheme for building "pixels."
Scan HSI as a Function of Scan Angle for Unit Raw GSD at Nadir
0123456789
10111213141516171819
0 8 16 24 32 40 48 56
Scan Angle (degrees)
Raw G SD (No Agg)
Agg 2 in Scan
Agg 3 in Scan
VI IRS HSI
HSI Returns to Nadirsize at the two transition
points (31.71o and 47.87o)
Figure 3. Benefits of VIIRS aggregation scheme in reducing pixel growth at edge of scan.
This scanning approach is extremely beneficial for the retrieval of land products such as the NDVI. The increasing importance of land cover change detection makes high spatial resolution
8 SBRS Document #: Y2400 PD
MOD
4375
7, -
--. P
DM
O R
elea
sed:
200
7-01
-29
(VER
IFY
REV
ISIO
N S
TATU
S)

NPOESS/VIIRS VIIRS Vegetation Index (VVI)
in the NDVI or its input reflectances much more important, and SNR becomes a secondary issue (this latter point will be verified later in this document). VIIRS will provide unprecedented performance in spatial resolution for vegetation indices; the EDR will be at 800-m resolution or finer globally, with 375-m resolution at nadir. Additionally, due to the imagery requirements for VIIRS and the “sliver” detector design, MTF performance will be extremely sharp (0.5 at Nyquist).
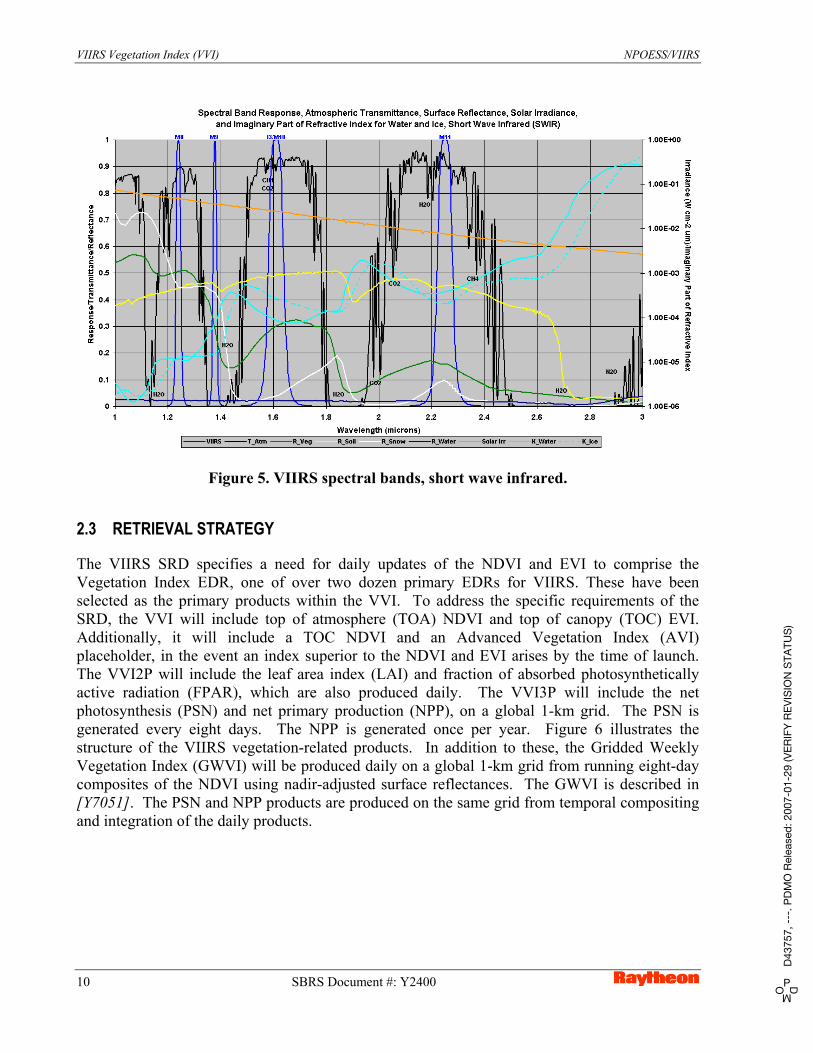
The positioning of the VIIRS spectral bands in the visible/near infrared (VNIR) and shortwave infrared (SWIR) bands is summarized in Figure 4 and Figure 5. A summary of the spatial, radiometric, and spectral performances of these bands can be found in the VIIRS Sensor Specification [PS154650].
Figure 4. VIIRS spectral bands, visible and near infrared.
SRBS Document #: Y2400 9 PD
MOD
4375
7, -
--. P
DM
O R
elea
sed:
200
7-01
-29
(VER
IFY
REV
ISIO
N S
TATU
S)
VIIRS Vegetation Index (VVI) NPOESS/VIIRS
Figure 5. VIIRS spectral bands, short wave infrared.
2.3 RETRIEVAL STRATEGY
The VIIRS SRD specifies a need for daily updates of the NDVI and EVI to comprise the Vegetation Index EDR, one of over two dozen primary EDRs for VIIRS. These have been selected as the primary products within the VVI. To address the specific requirements of the SRD, the VVI will include top of atmosphere (TOA) NDVI and top of canopy (TOC) EVI. Additionally, it will include a TOC NDVI and an Advanced Vegetation Index (AVI) placeholder, in the event an index superior to the NDVI and EVI arises by the time of launch. The VVI2P will include the leaf area index (LAI) and fraction of absorbed photosynthetically active radiation (FPAR), which are also produced daily. The VVI3P will include the net photosynthesis (PSN) and net primary production (NPP), on a global 1-km grid. The PSN is generated every eight days. The NPP is generated once per year. Figure 6 illustrates the structure of the VIIRS vegetation-related products. In addition to these, the Gridded Weekly Vegetation Index (GWVI) will be produced daily on a global 1-km grid from running eight-day composites of the NDVI using nadir-adjusted surface reflectances. The GWVI is described in [Y7051]. The PSN and NPP products are produced on the same grid from temporal compositing and integration of the daily products.
10 SBRS Document #: Y2400 PD
MOD
4375
7, -
--. P
DM
O R
elea
sed:
200
7-01
-29
(VER
IFY
REV
ISIO
N S
TATU
S)

NPOESS/VIIRS VIIRS Vegetation Index (VVI)
VIIRS Vegetation Products
VIIRS VegetationIndex (VVI)
VVI SecondaryProducts (VVI2P)
TOANDVI LAI
TOCEVI
PSN
FPAR NPP
VVI TertiaryProducts (VVI3P)
TOCNDVI
TOCAVI GWVI
VIIRS Vegetation Products
VIIRS VegetationIndex (VVI)
VVI SecondaryProducts (VVI2P)
TOANDVI LAI
TOCEVI
PSN
FPAR NPP
VVI TertiaryProducts (VVI3P)
TOCNDVI
TOCAVI GWVI
Figure 6. Structure of the VIIRS vegetation-related products.
All of the reflectances used as input to the VVI products are first corrected for atmospheric effects, with the exception of the TOA NDVI, which uses TOA reflectances as input. Surface reflectances arrive in the form of the VIIRS Surface Reflectance Intermediate Product (IP), which is detailed in [Y2411]. TOA reflectances originate in the VIIRS 375-m Earth View Sensor Data Record (SDR), which is detailed in [Y3261]. Reflectances from VIIRS bands I1 (620-670 nm) and I2 (846-885 nm) red and near infrared, respectively are used to generate the NDVI. VIIRS bands M3 (478-498), I1, and I2 are used to generate the EVI. Since the AVI has not yet been established, the required bands are not known; however, it will minimally require bands I1 and I2. LAI and FPAR are generated as derived products from the vegetation indices, following the methodology described in the corresponding MODIS ATBD (Knyazikhin et al, 1999). The NDVI will be composited into the GWVI for a moving window that stretches back eight days from the time of retrieval. This process makes use of the Gridded Weekly Surface Reflectance IP, which is described in [Y7051].
FPAR is composited into eight-day estimates to assist in the evaluation of the PSN product, which is computed on a global 1-km grid equivalent to that for the Surface Type EDR (this grid is detailed in [Y7051]). PSN is integrated across an entire year to generate the annual NPP product on the same global 1-km grid.
A final note on the retrieval strategy for the Vegetation Index EDR is the required production of an additional intermediate product, the Gridded Monthly Vegetation Index (GMVI) IP. This product is required for use by the Surface Type EDR in generating the Quarterly Surface Type IP. It is a maximum value composite of NDVI over the course of a single month. Since this product is only required by the Surface Type EDR, the baseline approach is not to generate a moving window of monthly NDVI, but rather a static window which is accumulated and then discarded after three months of data have been collected and used by the Surface Type algorithm. The actual processing for the GMVI IP is conducted within the scope of the Build SDR module, which builds the product incrementally using the most recent output of the Vegetation Index
SRBS Document #: Y2400 11 PD
MOD
4375
7, -
--. P
DM
O R
elea
sed:
200
7-01
-29
(VER
IFY
REV
ISIO
N S
TATU
S)

VIIRS Vegetation Index (VVI) NPOESS/VIIRS
EDR. This process is described in detail in [Y7051]. Only pixels for which a "confident clear" retrieval of NDVI was performed will be used in constructing the composite. This is necessary particularly in polar regions, where a maximum value composite would favor clouds over snow.
12 SBRS Document #: Y2400 PD
MOD
4375
7, -
--. P
DM
O R
elea
sed:
200
7-01
-29
(VER
IFY
REV
ISIO
N S
TATU
S)

NPOESS VIIRS VIIRS Vegetation Index (VVI)
Raytheon SRBS Document #: Y2400 13
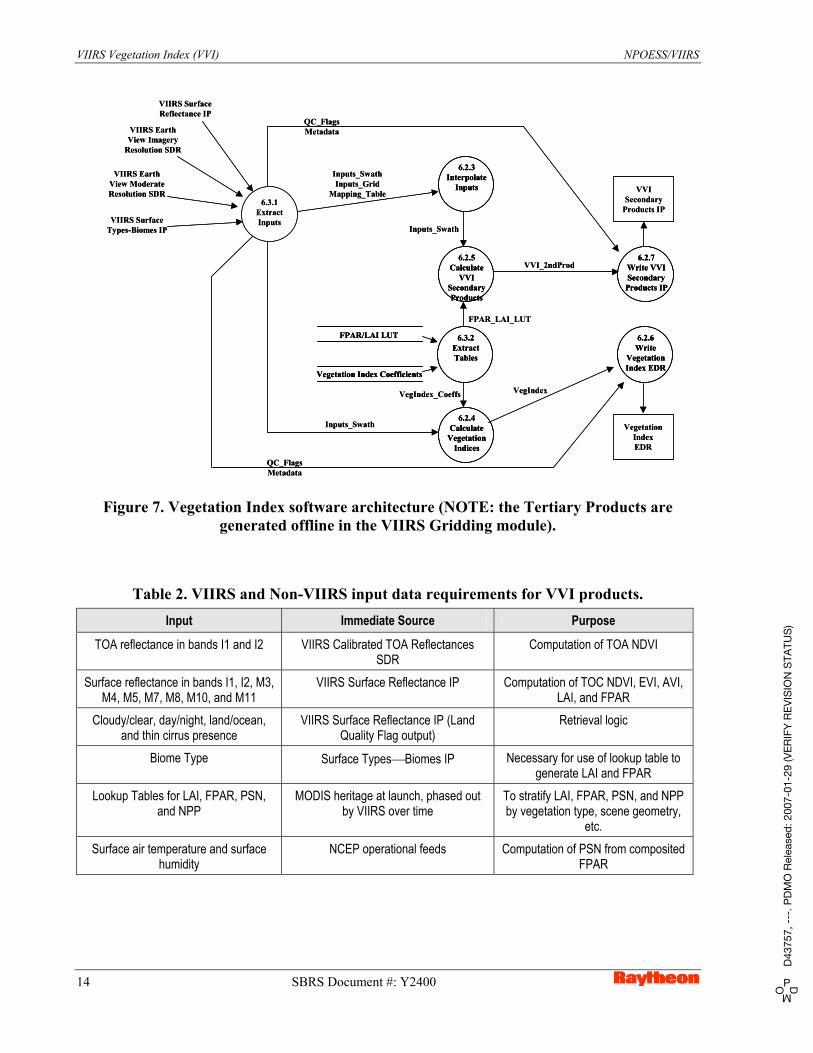
3.0 ALGORITHM DESCRIPTION 3.1 PROCESSING OUTLINE Figure 7 illustrates a snapshot of the software architecture for the Vegetation Index Unit. For the most up-to-date architecture, the reader should consult [Y2474]. The two primary inputs are the VIIRS 375-m Earth View SDR [Y3261] and the VIIRS Surface Reflectance IP [Y2411]. These spectral reflectance products are fed into the computation of the various vegetation indices and ultimately the VVI2P and VVI3P fields as well. The VVI3P and GWVI architectures are illustrated in [Y2474]. The Surface Reflectance IP includes an appended structure of Land Quality Flags (LQF), which apply to Surface Reflectance, Vegetation Index, Surface Albedo, Soil Moisture, Surface Type, and Active Fires. Among these flags are information pertaining to day/night, clear/cloudy, land/ocean, and the presence of thin cirrus. All daytime land pixels (defined by a solar zenith angle of 85 degrees or less and the land/sea flag in the VIIRS Cloud Mask, respectively) are processed. The LQF output includes a flag for all land retrievals with a solar zenith angle greater than or equal to 65 degrees. "Land" is allowed to include inland water bodies and rivers. All "confident clear" pixels are processed. Pixels labeled by the VIIRS Cloud Mask as "probably clear", "probably cloudy", or “confident cloudy” are processed but flagged in the LQF output. Cloudy pixels identified as thin cirrus, up to a TBD optical thickness, will be processed assuming a correction has occurred in the Surface Reflectance retrievals [Y2411]. Pixels with an optical thickness of TBD or higher in thin cirrus will be flagged as obscured by thin cirrus. For all other pixels, including nighttime and ocean, all fields of the VVI and VVI2P will be filled with a predefined "missing" value. The LQF output will also indicate whether sufficient aerosol is present to warrant flagging the pixel as obscured. 3.2 ALGORITHM INPUT 3.2.1 VIIRS Data The VVI products require two primary VIIRS inputs. Calibrated TOA reflectances in bands I1 and I2 are required for the production of the TOA NDVI; these are obtained from the VIIRS 375-m Earth View SDR. Surface reflectances in bands I1, I2, M3, and M4 are required for the remainder of the vegetation indices. Surface reflectances in several bands are also required for production of LAI and FPAR. The VIIRS Cloud Mask is not required directly, as its output will already be summarized in the context of land retrievals by the LQF output. Relevant information about the solar zenith angle is also contained in the LQF output. The production of LAI and FPAR also requires the Surface Types--Biomes IP as an LUT input. Finally, the VVI processing requires the LUTs themselves, for LAI, FPAR, PSN, and NPP. 3.2.2 Non-VIIRS Data Only two non-VIIRS inputs are required by the VVI3P--Surface Air Temperature and Surface Humidity. Both are expected to be available from National Centers for Environmental Prediction (NCEP) operational feeds. These are required for the computation of PSN from composited FPAR. Table 2 summarizes the input requirements for the VVI products.
VIIRS Vegetation Index (VVI) NPOESS/VIIRS
6.2.7Write VVISecondary
Products IP
FPAR/LAI LUT
VegetationIndexEDR
6.2.4Calculate
VegetationIndices
6.3.1ExtractInputs
VIIRS SurfaceReflectance IP
VIIRS EarthView Imagery
Resolution SDR
6.2.6Write
VegetationIndex EDR
6.2.5Calculate
VVI SecondaryProducts
6.2.3Interpolate
Inputs
6.3.2ExtractTables
Vegetation Index Coefficients
VIIRS EarthView ModerateResolution SDR
VIIRS SurfaceTypes-Biomes IP
VVISecondary
Products IP
QC_FlagsMetadata
QC_FlagsMetadata
Inputs_SwathInputs_Grid
Mapping_Table
Inputs_Swath
VVI_2ndProd
FPAR_LAI_LUT
VegIndex_Coeffs
Inputs_Swath
VegIndex
6.2.7Write VVISecondary
Products IP
6.2.7Write VVISecondary
Products IP
FPAR/LAI LUTFPAR/LAI LUT
VegetationIndexEDR
6.2.4Calculate
VegetationIndices
6.2.4Calculate
VegetationIndices
6.3.1ExtractInputs
VIIRS SurfaceReflectance IP
VIIRS EarthView Imagery
Resolution SDR
6.2.6Write
VegetationIndex EDR
6.2.6Write
VegetationIndex EDR
6.2.5Calculate
VVI SecondaryProducts
6.2.5Calculate
VVI SecondaryProducts
6.2.3Interpolate
Inputs
6.2.3Interpolate
Inputs
6.3.2ExtractTables
6.3.2ExtractTables
Vegetation Index CoefficientsVegetation Index Coefficients
VIIRS EarthView ModerateResolution SDR
VIIRS SurfaceTypes-Biomes IP
VVISecondary
Products IP
QC_FlagsMetadata
QC_FlagsMetadata
Inputs_SwathInputs_Grid
Mapping_Table
Inputs_Swath
VVI_2ndProd
FPAR_LAI_LUT
VegIndex_Coeffs
Inputs_Swath
VegIndex
Figure 7. Vegetation Index software architecture (NOTE: the Tertiary Products are generated offline in the VIIRS Gridding module).
Table 2. VIIRS and Non-VIIRS input data requirements for VVI products. Input Immediate Source Purpose
TOA reflectance in bands I1 and I2 VIIRS Calibrated TOA Reflectances SDR
Computation of TOA NDVI
Surface reflectance in bands I1, I2, M3, M4, M5, M7, M8, M10, and M11
VIIRS Surface Reflectance IP Computation of TOC NDVI, EVI, AVI, LAI, and FPAR
Cloudy/clear, day/night, land/ocean, and thin cirrus presence
VIIRS Surface Reflectance IP (Land Quality Flag output)
Retrieval logic
Biome Type Surface Types Biomes IP Necessary for use of lookup table to generate LAI and FPAR
Lookup Tables for LAI, FPAR, PSN, and NPP
MODIS heritage at launch, phased out by VIIRS over time
To stratify LAI, FPAR, PSN, and NPP by vegetation type, scene geometry,
etc. Surface air temperature and surface
humidity NCEP operational feeds Computation of PSN from composited
FPAR
14 SBRS Document #: Y2400 PD
MOD
4375
7, -
--. P
DM
O R
elea
sed:
200
7-01
-29
(VER
IFY
REV
ISIO
N S
TATU
S)

NPOESS/VIIRS VIIRS Vegetation Index (VVI)
3.3 THEORETICAL DESCRIPTION OF VVI RETRIEVALS
3.3.1 Physics of the VVI
3.3.1.1 Spectral Characteristics of Vegetation
There are three important regimes in the optical portion of the electromagnetic spectrum that provide significant and useful information about vegetation: visible, near infrared (NIR), and shortwave infrared (SWIR). A typical spectral reflectance curve for pure vegetation here represented by a maple leaf is shown in Figure 8.
Figure 8. Spectral reflectance of a maple leaf, from USGS spectral library.
In the visible wavelengths, the dominant radiative process is absorption of incoming solar radiation by plant pigments, especially chlorophyll, which supplies the plant with the energy needed to conduct its internal biological functions. Pigment absorption extends across the entire visible portion of the spectrum; however, there is a slight reprieve in the green wavelengths, to
SRBS Document #: Y2400 15 PD
MOD
4375
7, -
--. P
DM
O R
elea
sed:
200
7-01
-29
(VER
IFY
REV
ISIO
N S
TATU
S)

VIIRS Vegetation Index (VVI) NPOESS/VIIRS
which vegetation owes its typical green coloring. In the NIR, the reflectance curve increases sharply to a plateau that extends partially into the SWIR. This is due to significant scattering off of the interior walls of the leaf. The total airspace within the leaf is an important factor in the amount of reflected radiation (Gausman, 1974; Howard, 1991). Farther into the SWIR, there is a noticeable drop in the reflectance of a healthy leaf, owing to absorption by water. The reflected SWIR signal from a leaf thus provides information about the general stress level of the vegetation being observed.
3.3.1.2 Historical Development of Vegetation Indices
Two forces have shaped the evolution of remote sensing of vegetation. The first is the spectral signature discussed above. The second is the availability of the relevant spectral bands on spaceborne sensors. The dominant instrument in the remote sensing of vegetation on a global scale for the past two decades has been the Advanced Very High Resolution Radiometer (AVHRR). This instrument has been flown on several of the most recent satellites in the National Atmospheric and Oceanic Administration (NOAA) Television/Infrared Observation Satellite (TIROS-N) series of polar orbiters. Table 3 lists the spectral channels of the AVHRR-2, which has provided the bulk of vegetation climatology to date. For the study of vegetation from space, the first two bands are the most relevant. The red band, channel 1, represents the absorption by chlorophyll in plant leaves, and the NIR band, channel 2, has been an indicator of the leaf area index (LAI) and general density of vegetation.
Table 3. Spectral bands of the AVHRR-2 (through NOAA-14). Band Spectral Range (nm) Nadir Spatial Resolution (m)
1 580 – 680 1100 2 720 – 1100 1100 3 2530 – 2930 1100 4 10300 – 11300 1100 5 11500 – 12500 1100
By far, the dominant measure of vegetation from space has been the Normalized Difference Vegetation Index (NDVI), which was first seen in its current form in Deering (1978). The formal mathematical description of the NDVI is presented in section 3.3.2.1; it is simply a ratio of the difference and the sum between the near-infrared and red bands. Originally, this ratio was defined for the sensor counts in the two bands. This is, of course, not an optimal definition. Throughout most of the history of the NDVI, it has instead been taken as a ratio of reflectances.
Attempted variations of the NDVI have been plentiful. In the late 1980s and early 1990s, these variations began to provide a distinct improvement on the sensitivity of the product to real changes in vegetation properties. One such adjustment is the Soil Adjusted Vegetation Index (SAVI) (Huete, 1988), which adds a constant term L to the equation in a manner that reduces the effect of the soil background on the output product. Variations of this algorithm have also been developed. In parallel, the issue of atmospheric contamination, primarily by aerosols, was addressed by the introduction of the Atmospherically Resistant Vegetation Index (ARVI)
16 SBRS Document #: Y2400 PD
MOD
4375
7, -
--. P
DM
O R
elea
sed:
200
7-01
-29
(VER
IFY
REV
ISIO
N S
TATU
S)

NPOESS/VIIRS VIIRS Vegetation Index (VVI)
(Kaufman and Tanre, 1992). The ARVI uses the difference between the blue and red band reflectances to remove some of the atmospheric aerosol effects on changes in the vegetation index. Unfortunately, the ARVI is in a class of vegetation indices that require bands not present on the AVHRR, and so global databases of the ARVI have not been feasible until the recent launch of the first MODIS. Most of the research on space-based manifestations of the ARVI has been done with Landsat Thematic Mapper (TM) data. The spectral bands for the TM from Landsat-4 and Landsat-5 are shown in Table 4. The high spatial resolution of the TM bands, while ideal for detailed local studies, makes global climatologies from TM data intractable.
Table 4. Spectral bands of the Landsat Thematic Mapper (TM), Landsat-4 and Landsat-5. Band Spectral Range (nm) Nadir Spatial Resolution (m)
1 450 – 520 30
2 520 – 600 30
3 630 – 690 30
4 760 – 900 30
5 1550 – 1750 30
6 10400 – 12500 120
7 2080 – 2350 30
A similar situation to that for the ARVI exists for the more recent modifications of the NDVI that use the green band reflectance in one form or another. As one author put it, not to use the green band is “ignoring millions of years of experience” by humans who have recognized vegetation by its greenness (Gitelson et al., 1996). Again, however, the absence of this band on the AVHRR has limited its consideration in the operational community. This could change with the burgeoning MODIS heritage. Table 5 lists the MODIS bands most relevant to the generation of vegetation products.
Table 5. Spectral bands of MODIS relevant to vegetation studies. Band Spectral Range (nm) Nadir Spatial Resolution (m)
1 620 – 670 250
2 841 – 876 250
3 459 – 479 500
4 545 – 565 500
6 1628 – 1652 500
7 2105 – 2155 500 3.3.2 Mathematical Description
3.3.2.1 NDVI – AVHRR/MODIS Continuity Index
The NDVI products for VIIRS are defined by:
SRBS Document #: Y2400 17 PD
MOD
4375
7, -
--. P
DM
O R
elea
sed:
200
7-01
-29
(VER
IFY
REV
ISIO
N S
TATU
S)

VIIRS Vegetation Index (VVI) NPOESS/VIIRS
rednir
rednirNDVI (1)
where nir and red are the directional reflectances in the near-infrared and red bands, respectively. For the TOA NDVI, these are TOA reflectances, obtained directly from the VIIRS 375-m Earth View SDR; for the TOC NDVI, they are surface reflectances, obtained from the VIIRS Surface Reflectance IP. The NDVI is included in the VVI for two reasons. First, it is explicitly specified in the VIIRS SRD. Second, a rich heritage of NDVI climatology has been produced from the AVHRR, and MODIS is adding to this archive (Huete et al., 1999). A similar product from VIIRS will be very beneficial for the study of changes in climate and land cover.
3.3.2.2 EVI – MODIS Continuity Index
The NDVI, by nature, is a very robust parameter; the ratio aspect of (1) significantly mitigates sensitivity to certain non-vegetation-related effects, such as directly illuminated topography. Several nontrivial sources of contamination remain, however, and much of the effort in the historical development of the NDVI has been to modify it in ways that remove these sources of contamination. The most mature culmination of these efforts is the Enhanced Vegetation Index (EVI) (Liu and Huete, 1995), which is a feedback-based combination of the SAVI and the ARVI, and is given by the equation:
LCCLEVI
bluerednir
rednir
21
)1( (2)
where L is a constant to adjust for the soil background, and C1 and C2 are constants derived from minimizing feedback and errors from soil and atmospheric effects
The MODIS Vegetation Index (MVI) product consists of two entities: the EVI, as a relatively “clean” vegetation index, resistant to atmospheric and background sources of noise, and the NDVI, for continuity with the AVHRR heritage (Huete et al., 1999). Consequently, there will be a new MODIS heritage established with the EVI by the time NPOESS is launched into orbit. For this reason, the VVI contains the EVI as an output product. The latest version of the VIIRS SRD now also explicitly requires the production of an EVI, although the form of the equation is not specified. The MODIS form will be used to provide the best continuity.
3.3.2.3 GWVI – Composited Index
The TOC and TOA NDVI are produced from directional TOA and surface reflectances, respectively. In other words, they will contain variability stemming from the bi-directional reflectance distribution function (BRDF) of the surface and atmosphere. This introduces temporal signals correlated with solar zenith, view zenith, and relative azimuth, which are of course unrelated to the properties of the vegetation being observed, aside from the variations of solar energy available to the plant as a function of solar zenith angle. There is still some debate over which is the best means of compositing these effects and the effects of clouds out of the NDVI to make it more robust. It is expected that different end users will wish to implement different techniques, which is why the VIIRS TOC and TOA NDVI have been left in directional
18 SBRS Document #: Y2400 PD
MOD
4375
7, -
--. P
DM
O R
elea
sed:
200
7-01
-29
(VER
IFY
REV
ISIO
N S
TATU
S)

NPOESS/VIIRS VIIRS Vegetation Index (VVI)
form. To enhance the utility of the EDR, however, a composited NDVI, hereafter called the Gridded Weekly Vegetation Index (WVI) is also constructed and reported operationally. The GWVI is produced from a running eight-day composite of the TOC NDVI. There will thus be a new GWVI reported each day, along with the other daily vegetation index products. The GWVI and its required input, the Gridded Weekly Surface Reflectance IP, are both summarized in [Y7051]. Strong attention will be paid to the MODIS heritage for this kind of processing, to incorporate lessons learned and further maximize continuity.
Since it must be accumulated temporally, the GWVI will be generated on a global 1-km grid, instead of at the pixel level. This grid will be equivalent to that for the Gridded Monthly Vegetation Index, to maximize opportunities for as yet undetermined interplay between various VIIRS gridded products. The gridding scheme for global 1-km data is described in [Y7051].
3.3.2.4 AVI – Advanced Vegetation Index
Although the concept of a vegetation index is quite basic, the past few years have shown that a number of useful variations can be obtained by using different bands and/or adding correction terms. Although there is much worth in maintaining continuity with heritage indices such as the NDVI and EVI, this continuity should not be maintained at the expense of building new databases of more accurate vegetation indices. In this context, “accurate” means “more sensitive to biophysical parameters and less sensitive to nonbiophysical contaminants.” With this in mind, the VVI includes a placeholder for an Advanced Vegetation Index (AVI) as an operational output product.
The exact identity of the AVI has not yet been determined as of this writing. Future revisions of this document will detail the final choice and rationale, based on evaluation of various candidates as applied to MODIS data. The selection criteria will be (in no particular order):
1) High sensitivity to changes in LAI and FPAR.
2) Resistance to atmospheric contamination.
3) Low sensitivity to changes in soil background.
4) Ease of implementation.
3.3.2.5 LAI and FPAR – Leaf Area Index and Fraction of Absorbed Photosynthetically Active Radiation
The NDVI itself has rarely been directly used in quantitative studies; it is rather first converted into a secondary product such as the LAI or FPAR. LAI is simply a measure of the amount of one-sided leaf area per unit ground area in a pixel. For dense canopies, the LAI can reach values much higher than 1; the LAI is very much akin in this respect to optical depth. The FPAR is a measure of absorbed radiation in the visible wavelengths. It is another biogeophysical parameter of interest in the scientific community. In general, FPAR is linearly related to the NDVI; LAI is not.
SRBS Document #: Y2400 19 PD
MOD
4375
7, -
--. P
DM
O R
elea
sed:
200
7-01
-29
(VER
IFY
REV
ISIO
N S
TATU
S)

VIIRS Vegetation Index (VVI) NPOESS/VIIRS
LAI and FPAR are not required parameters in the VIIRS SRD. Raytheon has added them to enhance the value of the Vegetation Index EDR. Both LAI and FPAR are crucial products for computing terrestrial energy, carbon, water cycle processes, and biogeochemistry of vegetation. With MODIS, a burgeoning heritage of these products will serve as the foundation for future VIIRS climatologies.
Following this MODIS heritage, the VIIRS LAI and FPAR products are derived from a lookup table (LUT) based on three-dimensional canopy modeling combined with measurements of reflectance, surface type and viewing geometry (Knyazikhin et al, 1999). For a given set of observations, e.g., surface reflectances and solar/viewing geometry in a given pixel, a set of possible canopy/soil pattern solutions from the LUT can be extracted, with each solution corresponding to specific values of LAI and FPAR. If only one solution is found, these values of LAI and FPAR are reported for the pixel. If several solutions are found, a weighted average is computed and reported for LAI and FPAR. For MODIS, a fallback solution is to use vegetation indices to compute LAI and FPAR in the event of cloud or excessive aerosol contamination. For VIIRS, this strategy will also be implemented as a fallback in such situations, i.e., where a pixel is not labeled as confidently clear or the aerosol loading is beyond a TBD limit. Both pieces of information are available from the Land Quality Flags (LQF) in the Surface Reflectance IP. In cases where the LAI/FPAR LUT can be used, the Surface Types-Biomes IP is also required as an input.
3.3.2.6 PSN – Net Photosynthesis
The chief utility of net photosynthesis (PSN) is in connecting the biosphere to the atmosphere via CO2 transport as part of the carbon cycle (Tans et al., 1986; Schimel, 1995; Keeling et al., 1989, 1995, and 1996). Dense vegetation in a regrowth stage is often a significant sink for atmospheric CO2. The VVI PSN product will follow the development and lessons learned from its MODIS predecessor (described in Running et al., 1996b). The baseline approach is to generate the VIIRS PSN product from a temporal composite once every eight days. The general form of the equation for PSN is:
PARVIPSN (3)
where PAR is the incident photosynthetically active radiation and is the PAR conversion efficiency. The parameter will be determined using a look-up table generated during the MODIS era. PSN will be produced on the same 1-km grid as that for the GWVI.
3.3.2.7 NPP – Net Primary Productivity
Annual net primary productivity (NPP) is also a MODIS product. As with PSN, the VIIRS product will continue the MODIS algorithmic heritage. NPP is valuable for the monitoring of crops and forests on a level relevant to national political and economic policy (Running et al., 1996b). It is simply the time integral of PSN over a single year:
annualPSNNPP (4)
NPP will therefore be reported annually on a global 1-km grid.
20 SBRS Document #: Y2400 PD
MOD
4375
7, -
--. P
DM
O R
elea
sed:
200
7-01
-29
(VER
IFY
REV
ISIO
N S
TATU
S)
NPOESS/VIIRS VIIRS Vegetation Index (VVI)
3.4 ALGORITHM SENSITIVITY STUDIES
3.4.1 EDR Requirements
Table 6 lists the requirements specified by the Integrated Program Office (IPO) for the Vegetation Index EDR, alongside the VIIRS system specification.
Table 6. VIIRS SRD prescribed requirements and system specification for the Vegetation Index EDR.
Para. No. Thresholds Objectives Specification a. Horizontal Cell Size (HCS)
V40.6.2-10 1. Moderate, worst case (NDVI) 4 km 1 km 0.8 km V40.6.2-11 2. Fine, at nadir (NDVI and EVI) 0.5 km (TBR) 0.25 km 0.375 km V40.6.2-2 b. Horizontal Reporting Interval (TBD) (TBD) HCS V40.6.2-3 c. Horizontal Coverage Land (TBD) Land
d. Measurement Range - V40.6.2-12 1. For NDVI - 1 to +1 NDVI units -1 to +1 NDVI units -1 to +1 NDVI units V40.6.2-13 2. For EVI - 1 to +1 EVI units (TBR) - 1 to +1 EVI units
(TBR) -1 to +1 EVI units
V40.6.2-5 e. Measurement Accuracy (for moderate HCS NDVI)
0.05 NDVI units 0.03 NDVI units 0.016 NDVI units (TOA, TBR)
V40.6.2-6 f. Measurement Precision (for moderate HCS NDVI)
0.04 NDVI units 0.02 NDVI units 0.02 NDVI units (TOA)
l. Measurement Uncertainty V40.6.2-14 1. For fine HCS NDVI 0.07 NDVI units (TBR)* (TBD) 0.02 NDVI units
(TOA) V40.6.2-15 2. For EVI (TBD)* (TBD) 0.11 EVI units
(TOC) V40.6.2-7 g. Long-term Stability (for NDVI) 0.04 NDVI units 0.04 NDVI units 0.01 NDVI units
(TOA) V40.6.2-9 k. Minimum Swath Width (All other
EDR thresholds met) 3000 km (TBR) (TBD) 3000 km
*TBD = To Be Determined; TBR = To Be Reviewed
The SRD requirements set the limits for an error budget in the TOA NDVI and TOC EVI. There are four key parameters in Table 6 that directly constrain the allowable errors in the NDVI: accuracy, precision, uncertainty, and long term stability. Appendix A of the VIIRS SRD defines these four primary metrics for assessment of EDR algorithm performance (c.f. section 3.4.2).
Note that there are really three products required by the SRD: a moderate resolution NDVI, a fine resolution NDVI, and a fine resolution EVI. Additionally, the SRD defines the NDVI at the top of the atmosphere (TOA), but not the EVI. Our solution for this EDR produces a single TOA NDVI to satisfy the moderate and fine requirements, with a nadir resolution of 375 m, growing to a resolution of 800 m at the edge of the scan. The EVI is produced at top of canopy (TOC), at
SRBS Document #: Y2400 21 PD
MOD
4375
7, -
--. P
DM
O R
elea
sed:
200
7-01
-29
(VER
IFY
REV
ISIO
N S
TATU
S)
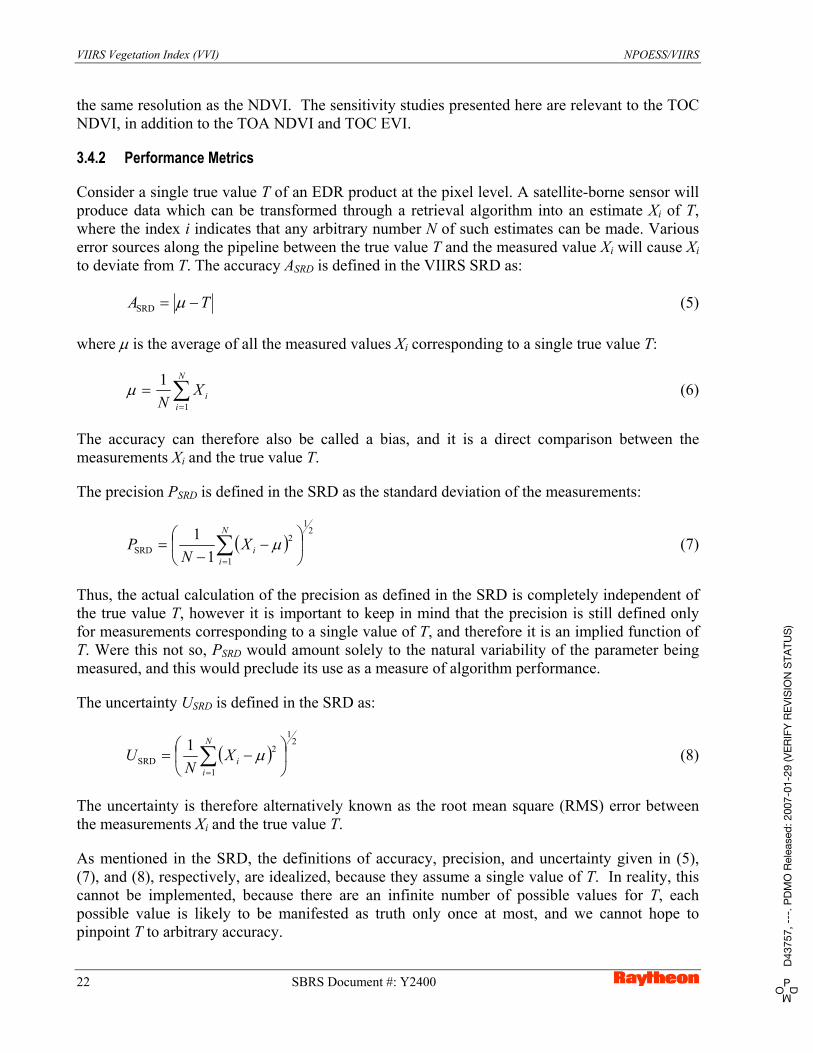
VIIRS Vegetation Index (VVI) NPOESS/VIIRS
the same resolution as the NDVI. The sensitivity studies presented here are relevant to the TOC NDVI, in addition to the TOA NDVI and TOC EVI.
3.4.2 Performance Metrics
Consider a single true value T of an EDR product at the pixel level. A satellite-borne sensor will produce data which can be transformed through a retrieval algorithm into an estimate Xi of T, where the index i indicates that any arbitrary number N of such estimates can be made. Various error sources along the pipeline between the true value T and the measured value Xi will cause Xi to deviate from T. The accuracy ASRD is defined in the VIIRS SRD as:
TASRD (5)
where is the average of all the measured values Xi corresponding to a single true value T:
N
iiX
N 1
1 (6)
The accuracy can therefore also be called a bias, and it is a direct comparison between the measurements Xi and the true value T.
The precision PSRD is defined in the SRD as the standard deviation of the measurements:
21
1
2SRD 1
1 N
iiX
NP (7)
Thus, the actual calculation of the precision as defined in the SRD is completely independent of the true value T, however it is important to keep in mind that the precision is still defined only for measurements corresponding to a single value of T, and therefore it is an implied function of T. Were this not so, PSRD would amount solely to the natural variability of the parameter being measured, and this would preclude its use as a measure of algorithm performance.
The uncertainty USRD is defined in the SRD as:
21
1
2SRD
1 N
iiX
NU (8)
The uncertainty is therefore alternatively known as the root mean square (RMS) error between the measurements Xi and the true value T.
As mentioned in the SRD, the definitions of accuracy, precision, and uncertainty given in (5), (7), and (8), respectively, are idealized, because they assume a single value of T. In reality, this cannot be implemented, because there are an infinite number of possible values for T, each possible value is likely to be manifested as truth only once at most, and we cannot hope to pinpoint T to arbitrary accuracy.
22 SBRS Document #: Y2400 PD
MOD
4375
7, -
--. P
DM
O R
elea
sed:
200
7-01
-29
(VER
IFY
REV
ISIO
N S
TATU
S)
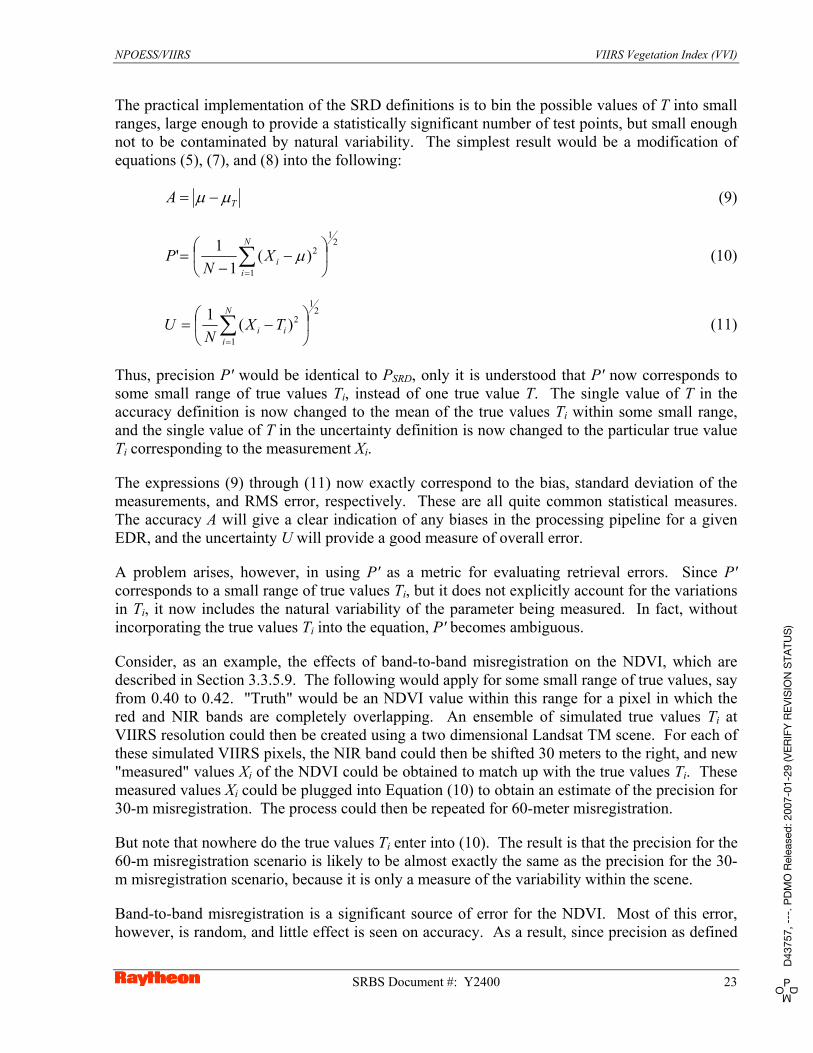
NPOESS/VIIRS VIIRS Vegetation Index (VVI)
The practical implementation of the SRD definitions is to bin the possible values of T into small ranges, large enough to provide a statistically significant number of test points, but small enough not to be contaminated by natural variability. The simplest result would be a modification of equations (5), (7), and (8) into the following:
TA (9)
21
1
2)(1
1'N
iiX
NP (10)
21
1
2)(1 N
iii TX
NU (11)
Thus, precision P' would be identical to PSRD, only it is understood that P' now corresponds to some small range of true values Ti, instead of one true value T. The single value of T in the accuracy definition is now changed to the mean of the true values Ti within some small range, and the single value of T in the uncertainty definition is now changed to the particular true value Ti corresponding to the measurement Xi.
The expressions (9) through (11) now exactly correspond to the bias, standard deviation of the measurements, and RMS error, respectively. These are all quite common statistical measures. The accuracy A will give a clear indication of any biases in the processing pipeline for a given EDR, and the uncertainty U will provide a good measure of overall error.
A problem arises, however, in using P' as a metric for evaluating retrieval errors. Since P' corresponds to a small range of true values Ti, but it does not explicitly account for the variations in Ti, it now includes the natural variability of the parameter being measured. In fact, without incorporating the true values Ti into the equation, P' becomes ambiguous.
Consider, as an example, the effects of band-to-band misregistration on the NDVI, which are described in Section 3.3.5.9. The following would apply for some small range of true values, say from 0.40 to 0.42. "Truth" would be an NDVI value within this range for a pixel in which the red and NIR bands are completely overlapping. An ensemble of simulated true values Ti at VIIRS resolution could then be created using a two dimensional Landsat TM scene. For each of these simulated VIIRS pixels, the NIR band could then be shifted 30 meters to the right, and new "measured" values Xi of the NDVI could be obtained to match up with the true values Ti. These measured values Xi could be plugged into Equation (10) to obtain an estimate of the precision for 30-m misregistration. The process could then be repeated for 60-meter misregistration.
But note that nowhere do the true values Ti enter into (10). The result is that the precision for the 60-m misregistration scenario is likely to be almost exactly the same as the precision for the 30-m misregistration scenario, because it is only a measure of the variability within the scene.
Band-to-band misregistration is a significant source of error for the NDVI. Most of this error, however, is random, and little effect is seen on accuracy. As a result, since precision as defined
SRBS Document #: Y2400 23 PD
MOD
4375
7, -
--. P
DM
O R
elea
sed:
200
7-01
-29
(VER
IFY
REV
ISIO
N S
TATU
S)
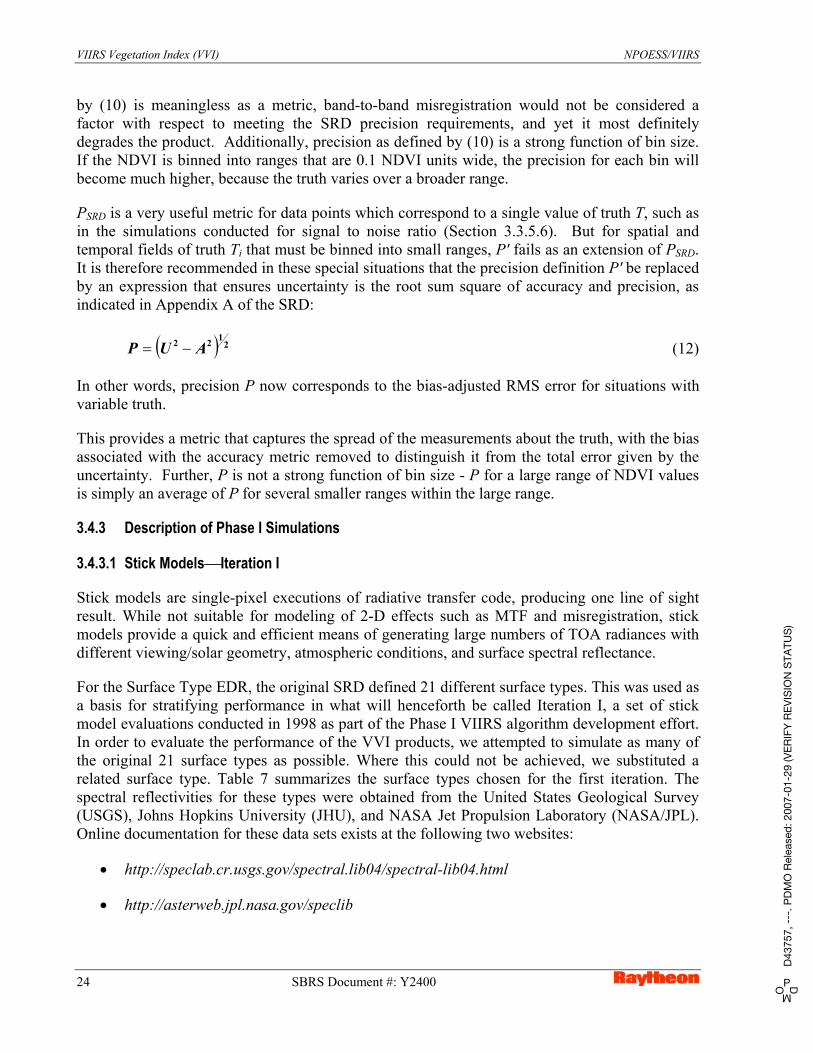
VIIRS Vegetation Index (VVI) NPOESS/VIIRS
by (10) is meaningless as a metric, band-to-band misregistration would not be considered a factor with respect to meeting the SRD precision requirements, and yet it most definitely degrades the product. Additionally, precision as defined by (10) is a strong function of bin size. If the NDVI is binned into ranges that are 0.1 NDVI units wide, the precision for each bin will become much higher, because the truth varies over a broader range.
PSRD is a very useful metric for data points which correspond to a single value of truth T, such as in the simulations conducted for signal to noise ratio (Section 3.3.5.6). But for spatial and temporal fields of truth Ti that must be binned into small ranges, P' fails as an extension of PSRD. It is therefore recommended in these special situations that the precision definition P' be replaced by an expression that ensures uncertainty is the root sum square of accuracy and precision, as indicated in Appendix A of the SRD:
2122 AUP (12)
In other words, precision P now corresponds to the bias-adjusted RMS error for situations with variable truth.
This provides a metric that captures the spread of the measurements about the truth, with the bias associated with the accuracy metric removed to distinguish it from the total error given by the uncertainty. Further, P is not a strong function of bin size - P for a large range of NDVI values is simply an average of P for several smaller ranges within the large range.
3.4.3 Description of Phase I Simulations
3.4.3.1 Stick Models Iteration I
Stick models are single-pixel executions of radiative transfer code, producing one line of sight result. While not suitable for modeling of 2-D effects such as MTF and misregistration, stick models provide a quick and efficient means of generating large numbers of TOA radiances with different viewing/solar geometry, atmospheric conditions, and surface spectral reflectance.
For the Surface Type EDR, the original SRD defined 21 different surface types. This was used as a basis for stratifying performance in what will henceforth be called Iteration I, a set of stick model evaluations conducted in 1998 as part of the Phase I VIIRS algorithm development effort. In order to evaluate the performance of the VVI products, we attempted to simulate as many of the original 21 surface types as possible. Where this could not be achieved, we substituted a related surface type. Table 7 summarizes the surface types chosen for the first iteration. The spectral reflectivities for these types were obtained from the United States Geological Survey (USGS), Johns Hopkins University (JHU), and NASA Jet Propulsion Laboratory (NASA/JPL). Online documentation for these data sets exists at the following two websites:
http://speclab.cr.usgs.gov/spectral.lib04/spectral-lib04.html
http://asterweb.jpl.nasa.gov/speclib
24 SBRS Document #: Y2400 PD
MOD
4375
7, -
--. P
DM
O R
elea
sed:
200
7-01
-29
(VER
IFY
REV
ISIO
N S
TATU
S)
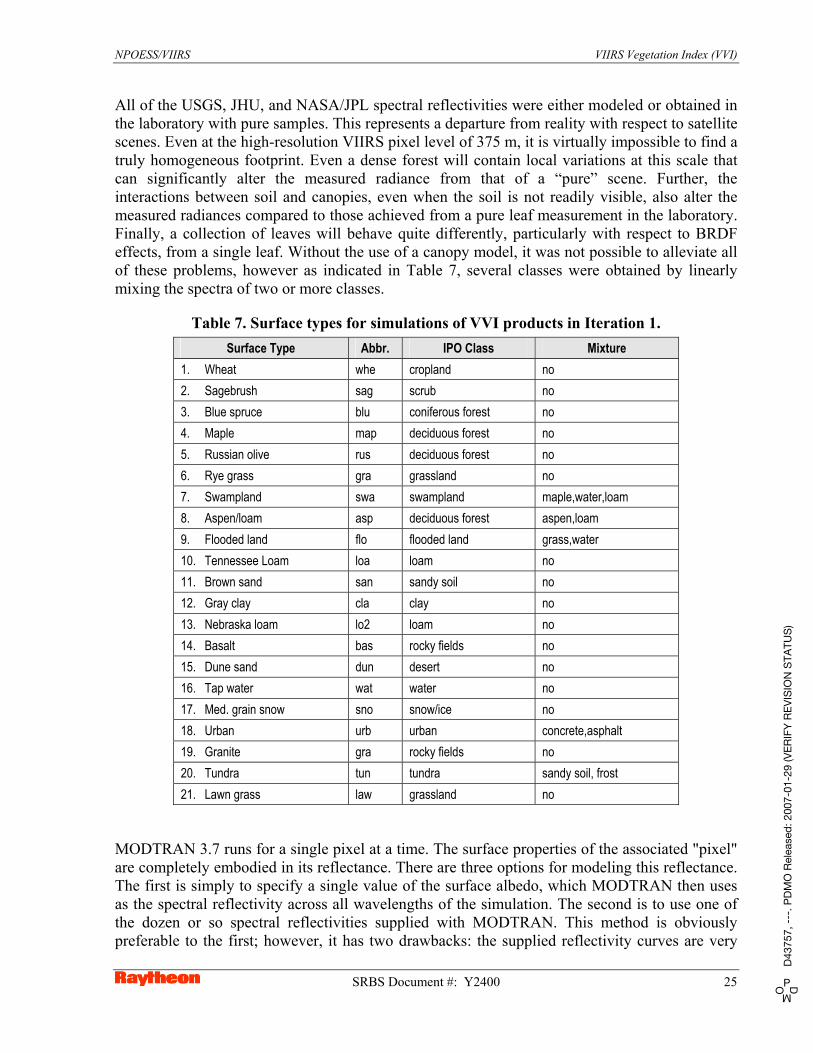
NPOESS/VIIRS VIIRS Vegetation Index (VVI)
All of the USGS, JHU, and NASA/JPL spectral reflectivities were either modeled or obtained in the laboratory with pure samples. This represents a departure from reality with respect to satellite scenes. Even at the high-resolution VIIRS pixel level of 375 m, it is virtually impossible to find a truly homogeneous footprint. Even a dense forest will contain local variations at this scale that can significantly alter the measured radiance from that of a “pure” scene. Further, the interactions between soil and canopies, even when the soil is not readily visible, also alter the measured radiances compared to those achieved from a pure leaf measurement in the laboratory. Finally, a collection of leaves will behave quite differently, particularly with respect to BRDF effects, from a single leaf. Without the use of a canopy model, it was not possible to alleviate all of these problems, however as indicated in Table 7, several classes were obtained by linearly mixing the spectra of two or more classes.
Table 7. Surface types for simulations of VVI products in Iteration 1. Surface Type Abbr. IPO Class Mixture
1. Wheat whe cropland no 2. Sagebrush sag scrub no 3. Blue spruce blu coniferous forest no 4. Maple map deciduous forest no 5. Russian olive rus deciduous forest no 6. Rye grass gra grassland no 7. Swampland swa swampland maple,water,loam 8. Aspen/loam asp deciduous forest aspen,loam 9. Flooded land flo flooded land grass,water 10. Tennessee Loam loa loam no 11. Brown sand san sandy soil no 12. Gray clay cla clay no 13. Nebraska loam lo2 loam no 14. Basalt bas rocky fields no 15. Dune sand dun desert no 16. Tap water wat water no 17. Med. grain snow sno snow/ice no 18. Urban urb urban concrete,asphalt 19. Granite gra rocky fields no 20. Tundra tun tundra sandy soil, frost 21. Lawn grass law grassland no
MODTRAN 3.7 runs for a single pixel at a time. The surface properties of the associated "pixel" are completely embodied in its reflectance. There are three options for modeling this reflectance. The first is simply to specify a single value of the surface albedo, which MODTRAN then uses as the spectral reflectivity across all wavelengths of the simulation. The second is to use one of the dozen or so spectral reflectivities supplied with MODTRAN. This method is obviously preferable to the first; however, it has two drawbacks: the supplied reflectivity curves are very
SRBS Document #: Y2400 25 PD
MOD
4375
7, -
--. P
DM
O R
elea
sed:
200
7-01
-29
(VER
IFY
REV
ISIO
N S
TATU
S)
VIIRS Vegetation Index (VVI) NPOESS/VIIRS
coarse and the number of classes is extremely limited. The third method is to generate a separate set of spectral reflectivities, which are then converted to an input format compatible with MODTRAN. This third approach was used for VVI simulations during Iteration I.
For each specific background type listed in Table 7, a spectral reflectivity data file was generated as input to MODTRAN. The MODTRAN source code was modified to allow a larger number of spectral reflectivity values to be read in; typically these values were available at 4 nm resolution. To further generalize the input dataset, each background was input to simulations at four sets of viewing and solar geometry, using solar zenith angles of 20 and 60 and viewing zenith angles of 0 and 70 . The viewing zenith of 70 was chosen to simulate the edge of the VIIRS scan. The maximum VIIRS scan angle is 56.25 , but when Earth’s curvature is taken into account, this translates into a surface viewing angle of approximately 70 . For simplicity, a relative azimuth of 0 (forward scattering) was assumed in all cases.
In order to evaluate the magnitude of sensor and atmospheric errors, it was necessary to generate “ground truth.” Rather than using the input spectral reflectivities, which are specified in general for different spectral intervals from that of the MODTRAN output radiances, it was decided to run MODTRAN a second time for each stick model with the observer at an altitude of 1 meter. This corresponds fairly well with real ground truth measurements for reflective radiances. The TOA radiances were simulated with an altitude of 833 km, the nominal altitude of the VIIRS sensor. There were 168 different stick model simulations conducted in Iteration I.
The radiative transfer model MODTRAN 3.7 was used to simulate the atmosphere for all the stick models. MODTRAN is a band model package, as opposed to the more accurate but more time-consuming line-by-line (LBL) models such as HITRAN. The internal spectral resolution of MODTRAN is 1 cm-1 for frequencies between 0 and 22681 cm-1; a transition is then made to 5 cm-1 resolution for higher frequencies, up to a limit of 50000 cm-1. The output resolution chosen for the first iteration was 1 cm-1 across all frequencies. This provided maximum accuracy for the integration into spectral bands. The spectral interval considered spanned from 0.4 m to 1.1 m, which includes the entire range of visible and NIR bands for the VIIRS, MODIS, and AVHRR.
MODTRAN offers a variety of different options for simulations. Multiple scattering using the DISORT code was chosen, with eight streams for the computations. Clouds and rainfall were assumed nonexistent in all cases. The choice of atmospheric profile and type of tropospheric aerosol extinction depended upon the surface type. Stratospheric aerosol was set to a standard background level for all simulations; special volcanic aerosols were not considered. Spectral reflectivities were supplied for all MODTRAN runs, however the surface temperature was dictated by the lowest layer of the atmospheric profile. The solar and viewing geometry were explicitly specified for each run. The internal MIE database in MODTRAN was used to simulate the aerosol phase functions. For a given background and viewing geometry, the exact same MODTRAN parameters were used to generate both TOA and ground truth spectral radiances.
The output of each MODTRAN simulation was a set of spectral radiances at 1 cm-1 resolution ranging from 0.4 to 1.1 m. The simulation was either carried out at 1-meter altitude or at the top of the atmosphere (TOA). In both cases, the spectral radiances were then integrated into various bands corresponding to the VIIRS, MODIS and AVHRR sensors.
26 SBRS Document #: Y2400 PD
MOD
4375
7, -
--. P
DM
O R
elea
sed:
200
7-01
-29
(VER
IFY
REV
ISIO
N S
TATU
S)
NPOESS/VIIRS VIIRS Vegetation Index (VVI)
Integration into spectral bands was done on a very basic level. A “top hat” response function was assumed in all cases; the band was assumed to be equally responsive at all points across the bandwidth, with absolutely no contributions from frequencies outside the interval. For each band, a corresponding extraterrestrial solar irradiance was calculated using the solar irradiance data supplied with the MODTRAN code. The solar irradiance data were smoothed and then integrated spectrally to produce band values.
SBRS has constructed a detailed radiometric sensitivity model of the VIIRS that simulates all the important sources of sensor noise. This model is described in detail in Hucks (1998). Briefly, the sensor model reduces to a form that can be modified by two constants— and —such that:
TOAL (13)
where LTOA is the TOA band radiance (Wcm-1sr-1) and is the standard deviation of the total sensor noise, assuming a Gaussian distribution. This assumption breaks down for very low radiances, however it was deemed a sufficiently accurate approximation for simulations. Seven sensor noise models were considered for each band, each corresponding to specific values of and . These parameters in turn represent various combinations of physical sensor characteristics, including detector noise, quantization effects, optical throughput, quantum efficiency, integration time, and so forth.
For each TOA stick model simulation, the following steps were taken. For each band, the TOA radiance was used in (13) to produce a standard deviation for the sensor noise. This value of was then used to generate 32 random Gaussian deviates, producing 32 separate measurements of the same TOA radiance. Thus, the SRD definition of accuracy, precision and uncertainty could be applied to these data by setting the input TOA radiance equal to the truth. This allows a general assessment of the performance of each sensor model in each band with respect to the EDR requirements. These simulations were geared primarily toward the relative magnitudes of atmospheric and sensor noise effects, a statement of required signal to noise ratio (SNR) for the sensor, and an assessment of the continuity issue when using different bands to calculate the same EDR outputs.
3.4.3.2 Stick Models Iteration II
A second round of stick model iterations was conducted between the Phase I System Function Review (SFR) and the Preliminary Design Review (PDR) for the NDVI and EVI. The dimensions of this data set are summarized in
Table 8. All forward modeling was again conducted using MODTRAN 3.7, with a midlatitude summer profile. It was not deemed necessary to vary the profile, as water vapor, temperature, and ozone effects are much smaller than the effects of aerosols in the VIIRS bands used for reflectance-based land EDRs. The output of each stick model simulation consisted of a true broadband surface albedo, true TOA reflectances in nine spectral bands, and true surface reflectances in nine spectral bands. These bands are summarized in Table 9. The true reflectances were used to generated true values of NDVI and EVI at both top of canopy (TOC) and top of atmosphere (TOA).
SRBS Document #: Y2400 27 PD
MOD
4375
7, -
--. P
DM
O R
elea
sed:
200
7-01
-29
(VER
IFY
REV
ISIO
N S
TATU
S)

VIIRS Vegetation Index (VVI) NPOESS/VIIRS
Table 8. Summary of dimensions for Land EDR stick modeling data set in Iteration II.
Parameter # Different Values Range
Surface Type 10 Coniferous forest, deciduous forest, shrub, grass, crops, urban, snow, bare soil, desert sand, water
Solar Zenith 8 0-70 degrees Scan Angle 7 0-60 degrees Relative Azimuth 5 0-180 degrees Aerosol Type 4 Urban, rural, desert, LOWTRAN
maritime Aerosol Optical Thickness 5 0.1-0.5
Table 9. Summary of VIIRS bands investigated in stick modeling data set for Iteration II. Band(s) Center (nm) Width (nm)
M1 412 20 M2 445 20 M3 488 20 M4 555 20 I1 645 50 I2 865 39 M8 1240 20 I3 1610 60
M11 2250 50
Table 10 summarizes the error sources simulated for this data set. The results of these simulations form the bulk of the basis for our stratification and error budgets for Surface Reflectance, Surface Albedo, and Vegetation Index. Note that the results for reflectance are flowed into the results for Vegetation Index.
28 SBRS Document #: Y2400 PD
MOD
4375
7, -
--. P
DM
O R
elea
sed:
200
7-01
-29
(VER
IFY
REV
ISIO
N S
TATU
S)

NPOESS/VIIRS VIIRS Vegetation Index (VVI)
Table 10. Summary of error sources simulated for each EDR/IP in Iteration II. EDR/IP Figure of Merit Error Source Spec for Error
Source Predicted
Performance for Error Source
Sensor Noise Spec SNR by band Predicted SNR by band
Calibration 2% 1.7% Forward modeling 3% radiance 3% radiance
Accuracy
Aerosols See Aerosol EDR specification
See Aerosol EDR stratified
performance Sensor Noise Spec SNR by band Predicted SNR by
band
Surface Reflectance
Precision
Aerosols See Aerosol EDR specification
See Aerosol EDR stratified
performance Sensor Noise Spec SNR by band Predicted SNR by
band Accuracy
Calibration 2% 1.7%
TOA Reflectance
Precision Sensor Noise Spec SNR by band Predicted SNR by band
Reflectance Accuracy
Results for TOA/Surface
Reflectance at spec
Results for TOA/Surface
Reflectance with predicted
performances BBR 20% 4%
Accuracy
MTF Model 3 (0.5 @ Nyquist)
Model 3 (0.5 @ Nyquist)
Reflectance Precision
Results for TOA/Surface
Reflectance at spec
Results for TOA/Surface
Reflectance with predicted
performances BBR 20% 4%
Vegetation Indices (TOA NDVI, TOC
EVI)
Precision
MTF Model 3 (0.5 @ Nyquist)
Model 3 (0.5 @ Nyquist)
BBR 20% 4% Accuracy MTF Model 3 (0.5 @
Nyquist) Model 3 (0.5 @
Nyquist) BBR 20% 4%
Albedo
Precision MTF Model 3 (0.5 @
Nyquist) Model 3 (0.5 @
Nyquist)
SRBS Document #: Y2400 29 PD
MOD
4375
7, -
--. P
DM
O R
elea
sed:
200
7-01
-29
(VER
IFY
REV
ISIO
N S
TATU
S)
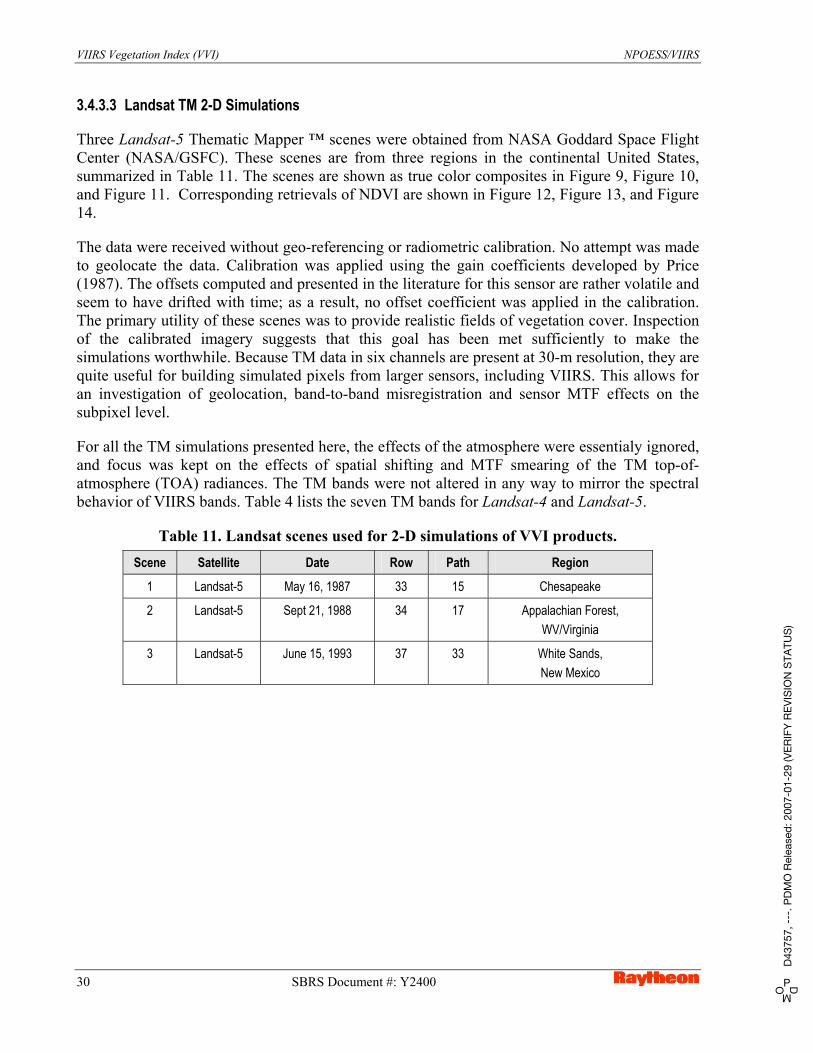
VIIRS Vegetation Index (VVI) NPOESS/VIIRS
3.4.3.3 Landsat TM 2-D Simulations
Three Landsat-5 Thematic Mapper ™ scenes were obtained from NASA Goddard Space Flight Center (NASA/GSFC). These scenes are from three regions in the continental United States, summarized in Table 11. The scenes are shown as true color composites in Figure 9, Figure 10, and Figure 11. Corresponding retrievals of NDVI are shown in Figure 12, Figure 13, and Figure 14.
The data were received without geo-referencing or radiometric calibration. No attempt was made to geolocate the data. Calibration was applied using the gain coefficients developed by Price (1987). The offsets computed and presented in the literature for this sensor are rather volatile and seem to have drifted with time; as a result, no offset coefficient was applied in the calibration. The primary utility of these scenes was to provide realistic fields of vegetation cover. Inspection of the calibrated imagery suggests that this goal has been met sufficiently to make the simulations worthwhile. Because TM data in six channels are present at 30-m resolution, they are quite useful for building simulated pixels from larger sensors, including VIIRS. This allows for an investigation of geolocation, band-to-band misregistration and sensor MTF effects on the subpixel level.
For all the TM simulations presented here, the effects of the atmosphere were essentialy ignored, and focus was kept on the effects of spatial shifting and MTF smearing of the TM top-of-atmosphere (TOA) radiances. The TM bands were not altered in any way to mirror the spectral behavior of VIIRS bands. Table 4 lists the seven TM bands for Landsat-4 and Landsat-5.
Table 11. Landsat scenes used for 2-D simulations of VVI products. Scene Satellite Date Row Path Region
1 Landsat-5 May 16, 1987 33 15 Chesapeake
2 Landsat-5 Sept 21, 1988 34 17 Appalachian Forest, WV/Virginia
3 Landsat-5 June 15, 1993 37 33 White Sands, New Mexico
30 SBRS Document #: Y2400 PD
MOD
4375
7, -
--. P
DM
O R
elea
sed:
200
7-01
-29
(VER
IFY
REV
ISIO
N S
TATU
S)

NPOESS/VIIRS VIIRS Vegetation Index (VVI)
Figure 9. Landsat TM scene 1, Chesapeake, May 16, 1987.
SRBS Document #: Y2400 31 PD
MOD
4375
7, -
--. P
DM
O R
elea
sed:
200
7-01
-29
(VER
IFY
REV
ISIO
N S
TATU
S)

VIIRS Vegetation Index (VVI) NPOESS/VIIRS
Figure 10. Landsat TM scene 2, Appalachians, September 21, 1988.
32 SBRS Document #: Y2400 PD
MOD
4375
7, -
--. P
DM
O R
elea
sed:
200
7-01
-29
(VER
IFY
REV
ISIO
N S
TATU
S)
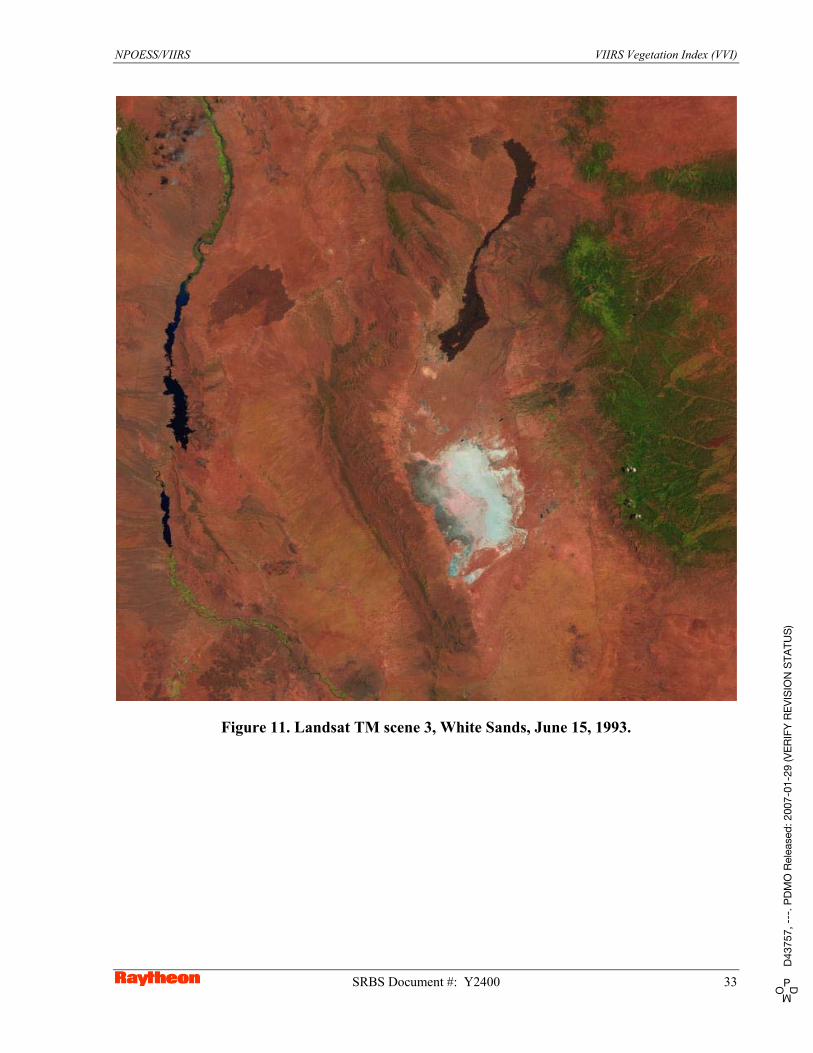
NPOESS/VIIRS VIIRS Vegetation Index (VVI)
Figure 11. Landsat TM scene 3, White Sands, June 15, 1993.
SRBS Document #: Y2400 33 PD
MOD
4375
7, -
--. P
DM
O R
elea
sed:
200
7-01
-29
(VER
IFY
REV
ISIO
N S
TATU
S)

VIIRS Vegetation Index (VVI) NPOESS/VIIRS
Figure 12. NDVI for Landsat TM scene 1, Chesapeake, May 16, 1987.
34 SBRS Document #: Y2400 PD
MOD
4375
7, -
--. P
DM
O R
elea
sed:
200
7-01
-29
(VER
IFY
REV
ISIO
N S
TATU
S)

NPOESS/VIIRS VIIRS Vegetation Index (VVI)
Figure 13. NDVI for Landsat TM scene 2, Appalachians, September 21, 1988.
SRBS Document #: Y2400 35 PD
MOD
4375
7, -
--. P
DM
O R
elea
sed:
200
7-01
-29
(VER
IFY
REV
ISIO
N S
TATU
S)
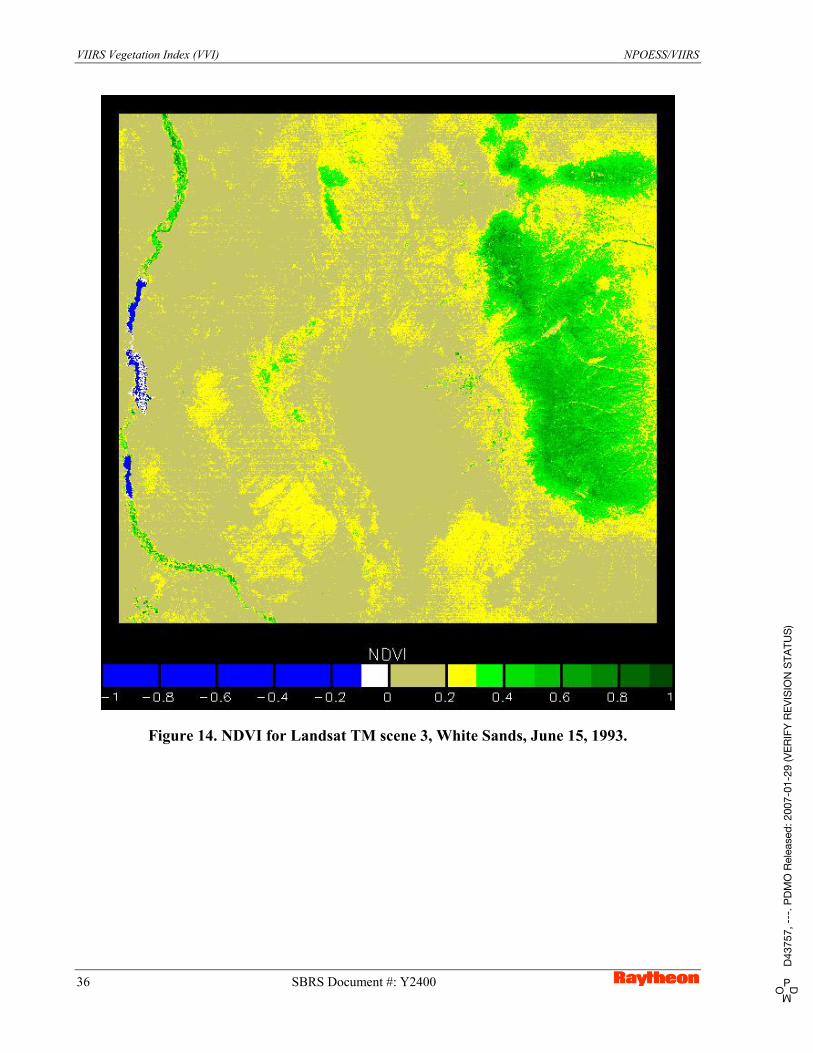
VIIRS Vegetation Index (VVI) NPOESS/VIIRS
Figure 14. NDVI for Landsat TM scene 3, White Sands, June 15, 1993.
36 SBRS Document #: Y2400 PD
MOD
4375
7, -
--. P
DM
O R
elea
sed:
200
7-01
-29
(VER
IFY
REV
ISIO
N S
TATU
S)
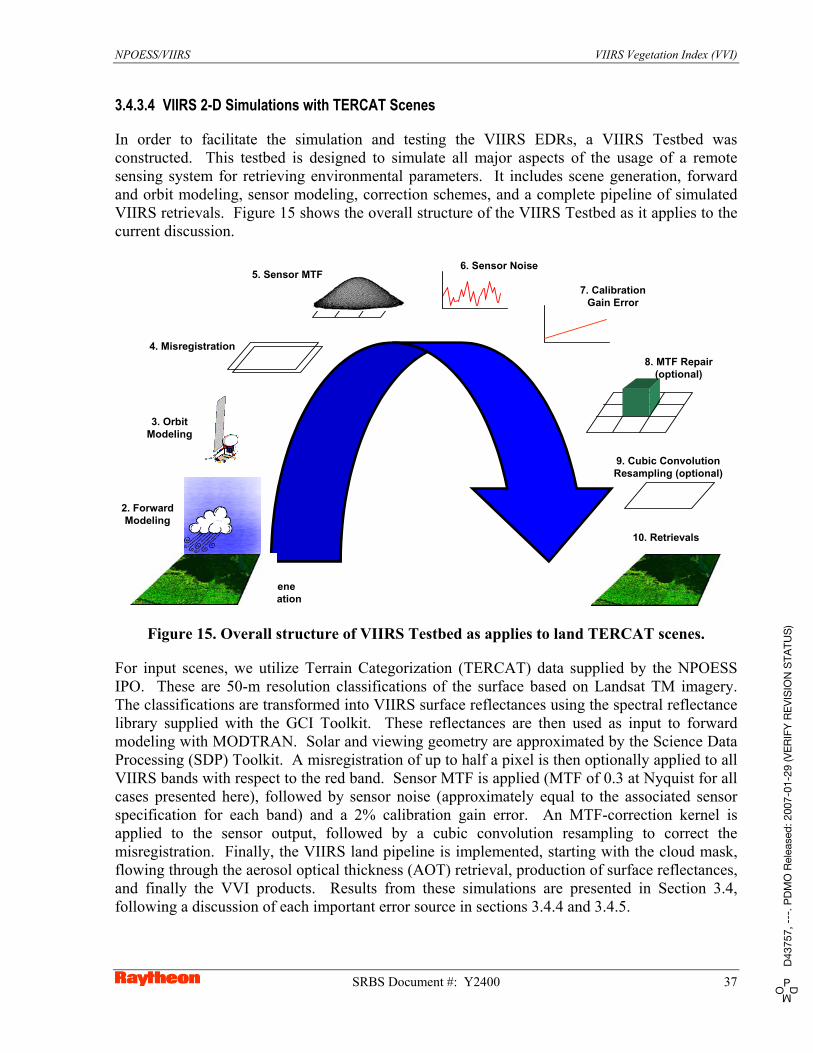
NPOESS/VIIRS VIIRS Vegetation Index (VVI)
3.4.3.4 VIIRS 2-D Simulations with TERCAT Scenes
In order to facilitate the simulation and testing the VIIRS EDRs, a VIIRS Testbed was constructed. This testbed is designed to simulate all major aspects of the usage of a remote sensing system for retrieving environmental parameters. It includes scene generation, forward and orbit modeling, sensor modeling, correction schemes, and a complete pipeline of simulated VIIRS retrievals. Figure 15 shows the overall structure of the VIIRS Testbed as it applies to the current discussion.
1. SceneGeneration
2. ForwardModeling
3. OrbitModeling
4. Misregistration
5. Sensor MTF6. Sensor Noise
7. CalibrationGain Error
8. MTF Repair(optional)
9. Cubic ConvolutionResampling (optional)
10. Retrievals
Figure 15. Overall structure of VIIRS Testbed as applies to land TERCAT scenes.
For input scenes, we utilize Terrain Categorization (TERCAT) data supplied by the NPOESS IPO. These are 50-m resolution classifications of the surface based on Landsat TM imagery. The classifications are transformed into VIIRS surface reflectances using the spectral reflectance library supplied with the GCI Toolkit. These reflectances are then used as input to forward modeling with MODTRAN. Solar and viewing geometry are approximated by the Science Data Processing (SDP) Toolkit. A misregistration of up to half a pixel is then optionally applied to all VIIRS bands with respect to the red band. Sensor MTF is applied (MTF of 0.3 at Nyquist for all cases presented here), followed by sensor noise (approximately equal to the associated sensor specification for each band) and a 2% calibration gain error. An MTF-correction kernel is applied to the sensor output, followed by a cubic convolution resampling to correct the misregistration. Finally, the VIIRS land pipeline is implemented, starting with the cloud mask, flowing through the aerosol optical thickness (AOT) retrieval, production of surface reflectances, and finally the VVI products. Results from these simulations are presented in Section 3.4, following a discussion of each important error source in sections 3.4.4 and 3.4.5.
SRBS Document #: Y2400 37 PD
MOD
4375
7, -
--. P
DM
O R
elea
sed:
200
7-01
-29
(VER
IFY
REV
ISIO
N S
TATU
S)
VIIRS Vegetation Index (VVI) NPOESS/VIIRS
3.4.4 Impacts of Reflectance Errors on the NDVI
Before individual and end-to-end error sources are discussed in detail, it is helpful to consider the impacts of reflectance errors on the NDVI. This is a topic that has not received its due attention in the literature, primarily because of the seeming simplicity of the NDVI equation. The associated reflectances can be either surface reflectances or TOA reflectances for the following discussion, even though the relevant figures explicitly list “surface reflectance” in their titles.
The simplicity of equation (1) is deceptive. The reader should be alert to the unpredictable nature of the NDVI solely on the basis of the fact that no matter what the positively-valued reflectances are, the NDVI is confined between –1 and 1. Since there are all kinds of possibilities for the two reflectances, the NDVI packs a diverse amount of behavior into the range from –1 to 1, leading to sometimes unanticipated consequences.
The first temptation when viewing (1) is to believe that it has no preference toward either band in terms of sensitivity. Were (1) merely a simple ratio, this would indeed be the case. However, (1) is not a simple ratio, but rather the ratio of a difference over a sum, and in so being, it leaves one band treated differently from the other. If you add a perturbation of 0.01 to the near infrared reflectance, this perturbation will be added to both the numerator and the denominator. The resultant change in the NDVI will therefore be reasonably small. Suppose, on the other hand, that you add a perturbation of 0.01 to the red reflectance. In this instance, 0.01 is subtracted from the numerator, while 0.01 is added to the denominator. The numerator shrinks, and the denominator grows, which causes a substantial change in the NDVI. The opposite occurs when a perturbation of –0.01 is added to the red reflectance the numerator grows, while the denominator shrinks.
For example, suppose the red reflectance is 0.03, and the near infrared reflectance is 0.36. These are reasonable values for a deciduous forest. The true NDVI in this instance is (0.36-0.03)/(0.36+0.03) = 0.33/0.39 = 0.846. Now add a 0.01 perturbation to the near infrared band; the measured NDVI becomes (0.37-0.03)/(0.37+0.03) = 0.34/0.40 = 0.850. This is a bias of only 0.004 NDVI units. A perturbation of –0.01 in the near infrared reflectance causes the measured NDVI to be (0.35-0.03)/(0.35+0.03) = 0.32/0.38 = 0.842, again an error of only 0.004 NDVI units. Now suppose we add a 0.01 perturbation to the red band; the measured NDVI becomes (0.36-0.04)/(0.36+0.04) = 0.32/0.40 = 0.800. This is an error of nearly 0.05 NDVI units, which is the VIIRS SRD accuracy threshold for the NDVI. If a perturbation of -0.01 is added to the red reflectance, the measured NDVI becomes (0.36-0.02)/(0.36+0.02) = 0.34/0.38 = 0.895, also nearly a 0.05 error in NDVI units.
For deciduous vegetation, the NDVI’s sensitivity to red reflectance errors compared to its sensitivity to near infrared reflectance errors is maximized. This is because of both the nature of the equation (a difference over a sum) and the fact that the red reflectance itself is very low, which reduces the value of the numerator and the denominator and increases the relative proportion of the error. Consider a case of less dense vegetation, with a near infrared reflectance of 0.30, and a red reflectance of 0.10. The true NDVI in this case is (0.30-0.10)/(0.30+0.10) = 0.20/0.40 = 0.50. If we perturb the near infrared reflectance by 0.01, the measured NDVI becomes (0.31-0.10)/(0.31+0.10) = 0.21/0.41 = 0.512, an error of 0.012 NDVI units. A –0.01 perturbation in the NDVI leads to a measured NDVI of (0.29-0.10)/(0.29+0.10) = 0.19/0.39 =
38 SBRS Document #: Y2400 PD
MOD
4375
7, -
--. P
DM
O R
elea
sed:
200
7-01
-29
(VER
IFY
REV
ISIO
N S
TATU
S)

NPOESS/VIIRS VIIRS Vegetation Index (VVI)
0.487, an error of 0.013 NDVI units. In both cases, the error is significantly higher than it was for the deciduous forest case with near infrared reflectance perturbations of this size. This is because the true near infrared reflectance is closer to the true red reflectance, causing the relative importance of errors in the near infrared band to increase.
The red band is still the bigger troublemaker, however. If you perturb the red reflectance by 0.01, the measured NDVI becomes (0.30-0.11)/(0.30+0.11) = 0.19/0.41 = 0.463, an error of 0.037. Perturbing the red reflectance by –0.01 causes the NDVI to become (0.30-0.09)/(0.30+0.09) = 0.21/0.39 = 0.538, an error of 0.038 NDVI units.
This can be extended downward into instances where the NDVI becomes less interesting to someone concerned about the biosphere – for example, the case of bare soil. Consider such a case where the near infrared reflectance is 0.22 and the red reflectance is 0.19. Here, the true NDVI is low: (0.22-0.19)/(0.22+0.19) = 0.03/0.41 = 0.073. A perturbation of 0.01 in the near infrared reflectance causes the measured NDVI to be (0.23-0.19)/(0.23+0.19) = 0.04/0.42 = 0.095, an error of over 0.02 NDVI units. A perturbation of 0.01 in the red reflectance leads to an NDVI of (0.22-0.20)/(0.22+0.20) = 0.02/0.42 = 0.048, an error of 0.025 NDVI units. The near infrared sensitivity is nearly that of the red sensitivity, but the latter is still higher.
If both reflectances are the same, the sensitivity to the red reflectances becomes equal to the sensitivity to the near infrared reflectances, because the true NDVI is 0, causing a kind of symmetry in the behavior regardless of the signs in the numerator and denominator. Consider, for example, a cloud, with a red reflectance of 0.80 and a near infrared reflectance of 0.80. The NDVI is (0.80-0.80)/(0.80+0.80) = 0.0/1.6 = 0. A perturbation of 0.01 in the near infrared reflectance in this case would lead to an NDVI of (0.81-0.80)/(0.81+0.80) = 0.01/1.61 = 0.0062. A perturbation of 0.01 in the red reflectance causes the NDVI to become (0.80-0.81)/(0.80+0.81) = -0.01/1.61 = -0.0062 – exactly the same magnitude of error as for the near infrared perturbation. If, on the other hand, a perturbation of –0.01 is given to the near infrared reflectance, the NDVI becomes (0.79-0.80)/(0.79+0.80) = -0.01/1.59 = -0.0063, while a perturbation of –0.01 in the red reflectance leads to a value of 0.0063.
Figure 16 shows the resulting bias in the NDVI from a combination of biases in the red and near infrared bands. These calculations are purely mathematical in nature and assume no particular bandwidth or spatial resolution.
SRBS Document #: Y2400 39 PD
MOD
4375
7, -
--. P
DM
O R
elea
sed:
200
7-01
-29
(VER
IFY
REV
ISIO
N S
TATU
S)
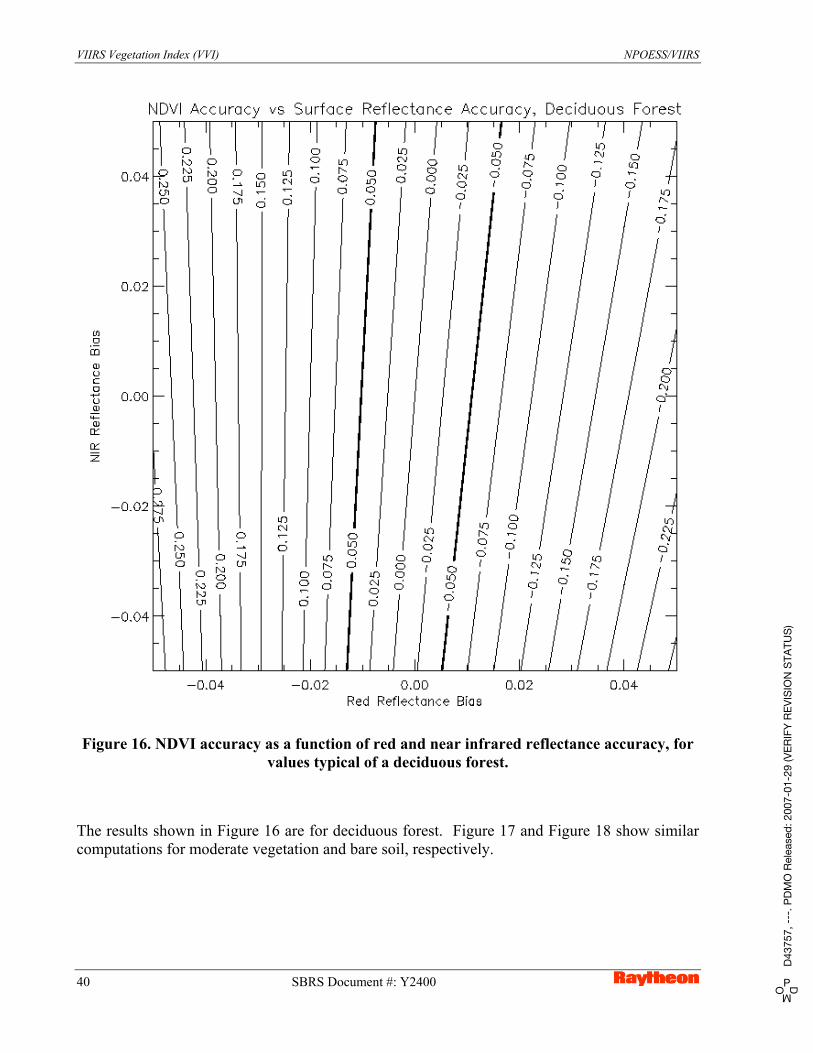
VIIRS Vegetation Index (VVI) NPOESS/VIIRS
Figure 16. NDVI accuracy as a function of red and near infrared reflectance accuracy, for values typical of a deciduous forest.
The results shown in Figure 16 are for deciduous forest. Figure 17 and Figure 18 show similar computations for moderate vegetation and bare soil, respectively.
40 SBRS Document #: Y2400 PD
MOD
4375
7, -
--. P
DM
O R
elea
sed:
200
7-01
-29
(VER
IFY
REV
ISIO
N S
TATU
S)
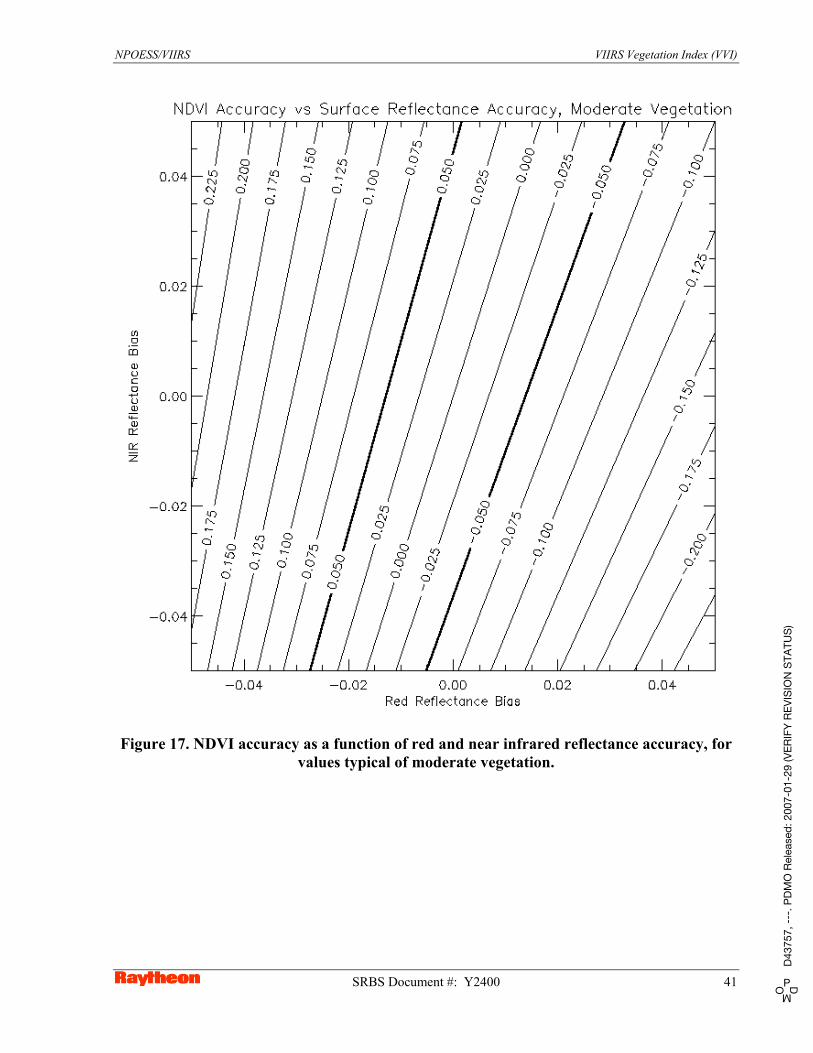
NPOESS/VIIRS VIIRS Vegetation Index (VVI)
Figure 17. NDVI accuracy as a function of red and near infrared reflectance accuracy, for values typical of moderate vegetation.
SRBS Document #: Y2400 41 PD
MOD
4375
7, -
--. P
DM
O R
elea
sed:
200
7-01
-29
(VER
IFY
REV
ISIO
N S
TATU
S)
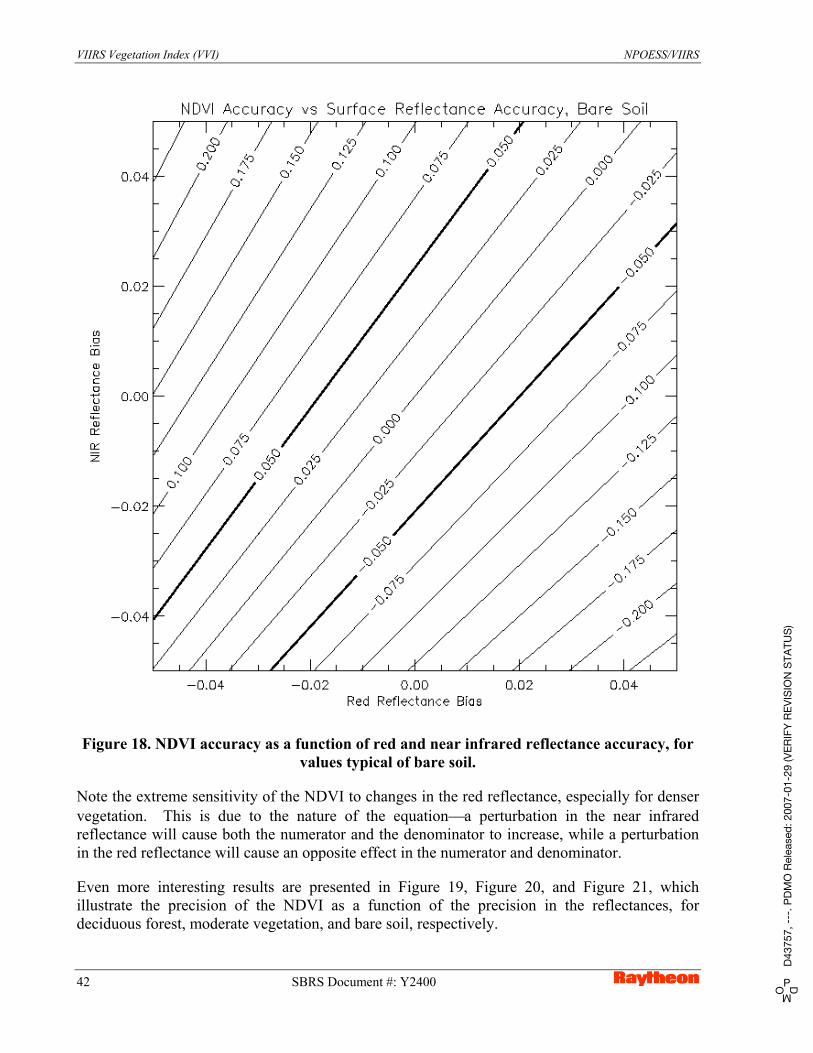
VIIRS Vegetation Index (VVI) NPOESS/VIIRS
Figure 18. NDVI accuracy as a function of red and near infrared reflectance accuracy, for values typical of bare soil.
Note the extreme sensitivity of the NDVI to changes in the red reflectance, especially for denser vegetation. This is due to the nature of the equation a perturbation in the near infrared reflectance will cause both the numerator and the denominator to increase, while a perturbation in the red reflectance will cause an opposite effect in the numerator and denominator.
Even more interesting results are presented in Figure 19, Figure 20, and Figure 21, which illustrate the precision of the NDVI as a function of the precision in the reflectances, for deciduous forest, moderate vegetation, and bare soil, respectively.
42 SBRS Document #: Y2400 PD
MOD
4375
7, -
--. P
DM
O R
elea
sed:
200
7-01
-29
(VER
IFY
REV
ISIO
N S
TATU
S)

NPOESS/VIIRS VIIRS Vegetation Index (VVI)
Figure 19. NDVI precision as a function of red and near infrared precision, for values typical of a deciduous forest.
SRBS Document #: Y2400 43 PD
MOD
4375
7, -
--. P
DM
O R
elea
sed:
200
7-01
-29
(VER
IFY
REV
ISIO
N S
TATU
S)

VIIRS Vegetation Index (VVI) NPOESS/VIIRS
Figure 20. NDVI precision as a function of red and near infrared precision, for values typical of moderate vegetation.
44 SBRS Document #: Y2400 PD
MOD
4375
7, -
--. P
DM
O R
elea
sed:
200
7-01
-29
(VER
IFY
REV
ISIO
N S
TATU
S)
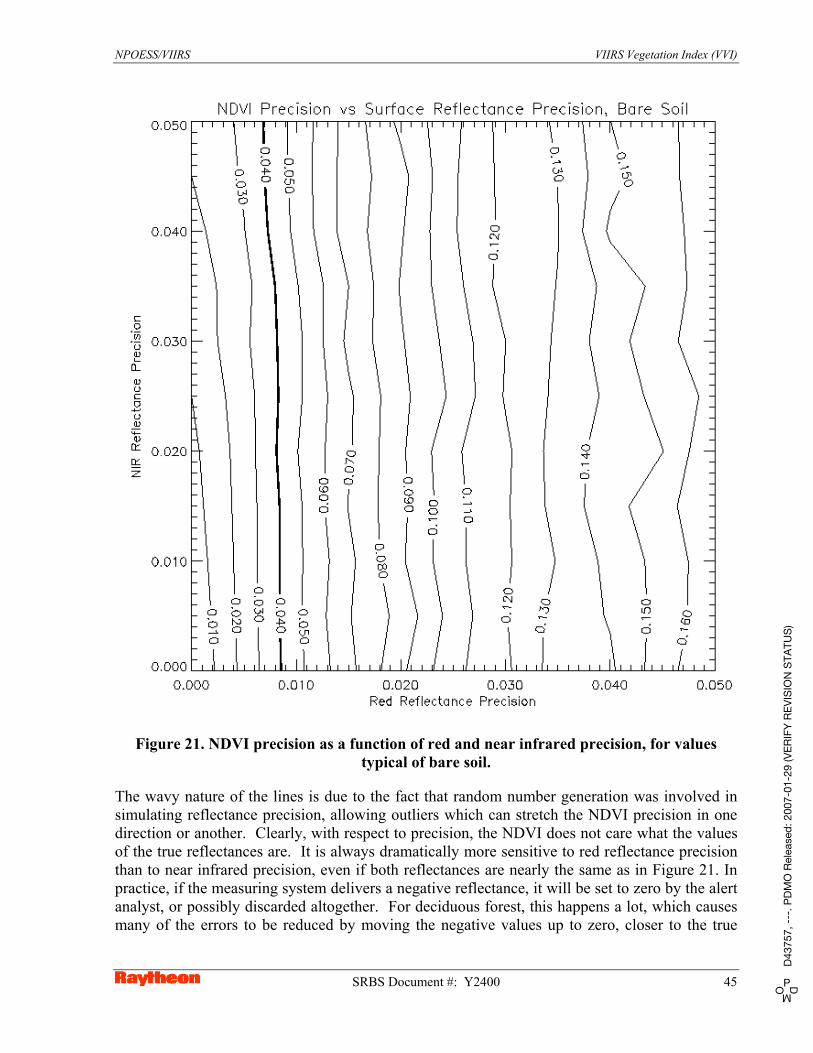
NPOESS/VIIRS VIIRS Vegetation Index (VVI)
Figure 21. NDVI precision as a function of red and near infrared precision, for values typical of bare soil.
The wavy nature of the lines is due to the fact that random number generation was involved in simulating reflectance precision, allowing outliers which can stretch the NDVI precision in one direction or another. Clearly, with respect to precision, the NDVI does not care what the values of the true reflectances are. It is always dramatically more sensitive to red reflectance precision than to near infrared precision, even if both reflectances are nearly the same as in Figure 21. In practice, if the measuring system delivers a negative reflectance, it will be set to zero by the alert analyst, or possibly discarded altogether. For deciduous forest, this happens a lot, which causes many of the errors to be reduced by moving the negative values up to zero, closer to the true
SRBS Document #: Y2400 45 PD
MOD
4375
7, -
--. P
DM
O R
elea
sed:
200
7-01
-29
(VER
IFY
REV
ISIO
N S
TATU
S)
VIIRS Vegetation Index (VVI) NPOESS/VIIRS
positive value. For moderate vegetation and bare soil, however, the flowed down precision requirement on the red band is extremely stringent.
The extreme dominance of precision errors in the red reflectance can be explained by noting that these errors are not linear as in the case of a bias. The precision in a reflectance must be simulated by generating many random measurements (1000 in this case) with a standard deviation equal to the prescribed precision value. This is done using a normal distribution, which is built from an exponential function and allows the introduction of extreme individual anomalies. The difference and sum in the NDVI, with different sign on the red reflectance in the numerator and denominator, amplify this nonlinearity and volatility. If the precision in the red reflectance is zero, the near infrared precision contribution to the NDVI precision is significant, but as the red reflectance precision is increased, the near infrared band quickly becomes a distant second in importance.
The conclusion of these findings is simple: the NDVI is very sensitive to errors in surface reflectance, and even small errors in the latter can cause the former to fall short of achieving threshold performance. This helps to explain why the TOC NDVI is unable to meet the SRD precision requirements, especially when band to band registration errors are included. TOA reflectance only has two significant error sources sensor noise, which was shown to be unimportant for NDVI using the current VIIRS baseline, and sensor calibration, for which the sensor specification is sufficient to meet the TOA NDVI accuracy requirements with margin.
3.4.5 Individual Error Sources
The next several subsections define and detail the major error sources for the NDVI or EVI. Some do not impact the SRD requirements by their definitions.
3.4.5.1 Algorithmic Error
Algorithmic error refers to the extent to which an algorithm is unable to produce the correct value for its physical output parameter or parameters, based upon approximation of the true physics, simplifying assumptions, and variations in the parameter itself. For a vegetation index, the index itself is the target output parameter, and hence this error reduces simply to the natural variability of the vegetation index in question. Such issues as soil contamination, saturation, and so forth will therefore not be discussed in the present version of this document; the reader is directed to Huete et al. (1999) for a discussion of these effects. They may be included in this ATBD at a later date. For more physically meaningful parameters such as LAI and FPAR, however, there will be an algorithmic error in the use of a lookup table. These errors are not addressed in the current version of this document; the reader is directed to Knyazikhin et al (1999) for a detailed discussion of LAI and FPAR error analysis.
3.4.5.2 BRDF Effects
Typically, the NDVI and other vegetation indices are used in temporal sequences to study short-term, seasonal, and annual trends for various regions around the globe. If these temporal sequences include variations due to solar and viewing geometry, it will be more difficult to
46 SBRS Document #: Y2400 PD
MOD
4375
7, -
--. P
DM
O R
elea
sed:
200
7-01
-29
(VER
IFY
REV
ISIO
N S
TATU
S)

NPOESS/VIIRS VIIRS Vegetation Index (VVI)
extract information about real changes in the vegetation itself. BRDF effects can therefore be considered an error source in the retrieval of vegetation indices. The SRD definition of the NDVI, however, implies an instantaneous product, which means BRDF variations from one look to another do not apply to the accuracy, precision, or uncertainty error budgets; directional reflectances are sufficient to define truth. In order to best serve the user community, we have added the Gridded Weekly Vegetation Index (GWVI), which is based on nadir-adjusted reflectances. The errors associated with BRDF effects, however, have not been investigated at this writing, for either the TOC NDVI or the GWVI. BRDF coupling between the surface and atmosphere, which impacts the instantaneous Surface Reflectance IP and therefore the instantaneous vegetation indices as well, has been given some attention in the Surface Reflectance algorithm [Y2411].
3.4.5.3 Atmospheric Effects
With regard to the VVI, there are four major sources of atmospheric error in the reflective portion of the spectrum: water vapor absorption, ozone absorption, Rayleigh scattering, and aerosol extinction. For the selected VIIRS reflectance bands, water vapor and ozone effects are negligible, as indicated in [Y2411]. Rayleigh scattering and aerosol effects, however, are substantial, and they become more prominent as the wavelength is decreased.
The VIIRS Surface Reflectance algorithm is based upon the MODIS atmospheric correction product, summarized in Vermote and Vermeulen (1999). In both products, all four of the above sources of atmospheric noise are addressed. Atmospheric effects do not impact the performance of the TOA NDVI, however they are significant for the TOC NDVI and EVI.
As mentioned in the previous section, the plots in Figure 16 through Figure 21 are applicable to both TOA and surface reflectance. Errors in surface reflectance contain additional factors not present for TOA reflectance, including forward modeling, LUT interpolation, and the effects of various atmospheric constituents, most notably aerosols. When these errors are summed together, they can cause reflectance errors as high as 0.03 or 0.04, which from the plots in Figure 16 through Figure 21 will clearly lead to NDVI errors much larger than threshold. The reader is directed to [Y2411] for a detailed discussion of errors in Surface Reflectance, and [Y3261] for a discussion of errors in TOA reflectance.
3.4.5.4 Band Selection and Continuity
There will be two separate heritages of vegetation indices available when VIIRS is launched. The first will be the AVHRR NDVI archive, generated from AVHRR bands 1 and 2, which are different in center position and width from their VIIRS counterparts. The second heritage will be the MODIS NDVI/EVI products, involving the use of MODIS bands 1 and 2, which correspond closely with VIIRS bands I1 and I2, and MODIS band 3, which has no current VIIRS equivalent. The VIIRS vegetation indices thus possess differences with respect to those generated previously by both AVHRR and MODIS. This introduces errors into any attempt to combine VIIRS vegetation indices with existing heritages for climatological studies. Table 12 shows a comparison of the VIIRS bands with their MODIS and AVHRR heritage counterparts.
Table 12. Comparison of four different visible/infrared sensors with VIIRS as baseline.
SRBS Document #: Y2400 47 PD
MOD
4375
7, -
--. P
DM
O R
elea
sed:
200
7-01
-29
(VER
IFY
REV
ISIO
N S
TATU
S)
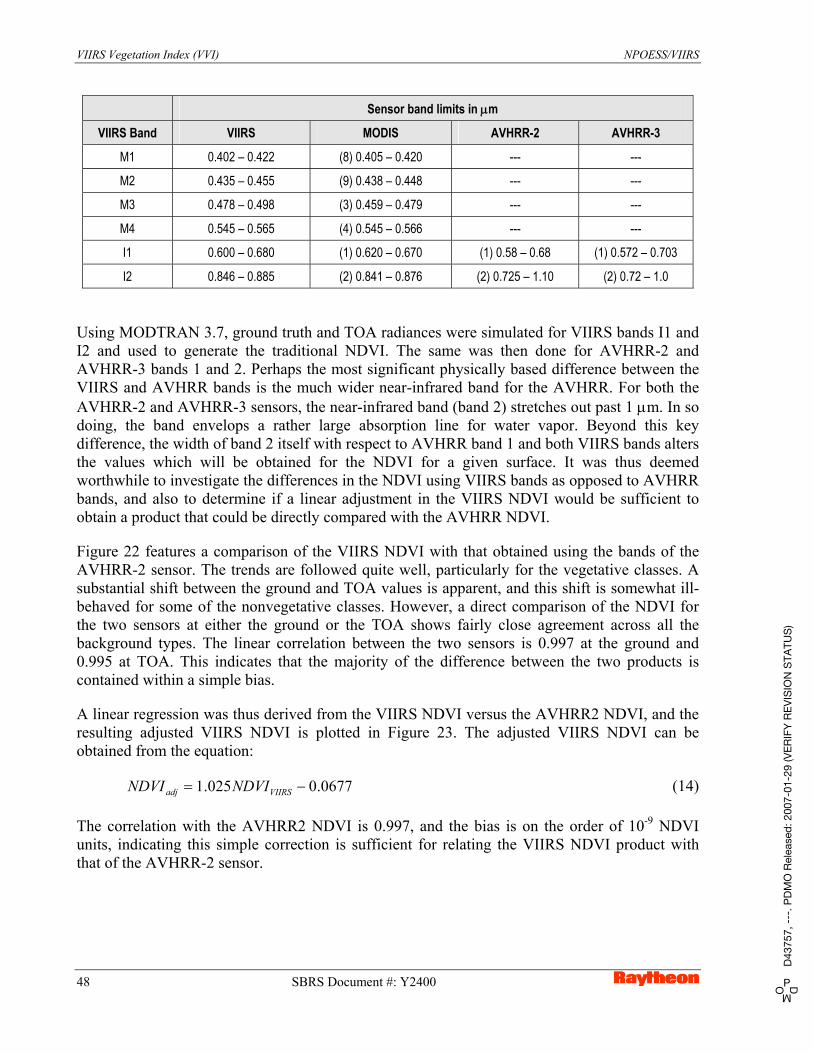
VIIRS Vegetation Index (VVI) NPOESS/VIIRS
Sensor band limits in m
VIIRS Band VIIRS MODIS AVHRR-2 AVHRR-3
M1 0.402 – 0.422 (8) 0.405 – 0.420 --- ---
M2 0.435 – 0.455 (9) 0.438 – 0.448 --- ---
M3 0.478 – 0.498 (3) 0.459 – 0.479 --- ---
M4 0.545 – 0.565 (4) 0.545 – 0.566 --- ---
I1 0.600 – 0.680 (1) 0.620 – 0.670 (1) 0.58 – 0.68 (1) 0.572 – 0.703
I2 0.846 – 0.885 (2) 0.841 – 0.876 (2) 0.725 – 1.10 (2) 0.72 – 1.0
Using MODTRAN 3.7, ground truth and TOA radiances were simulated for VIIRS bands I1 and I2 and used to generate the traditional NDVI. The same was then done for AVHRR-2 and AVHRR-3 bands 1 and 2. Perhaps the most significant physically based difference between the VIIRS and AVHRR bands is the much wider near-infrared band for the AVHRR. For both the AVHRR-2 and AVHRR-3 sensors, the near-infrared band (band 2) stretches out past 1 m. In so doing, the band envelops a rather large absorption line for water vapor. Beyond this key difference, the width of band 2 itself with respect to AVHRR band 1 and both VIIRS bands alters the values which will be obtained for the NDVI for a given surface. It was thus deemed worthwhile to investigate the differences in the NDVI using VIIRS bands as opposed to AVHRR bands, and also to determine if a linear adjustment in the VIIRS NDVI would be sufficient to obtain a product that could be directly compared with the AVHRR NDVI.
Figure 22 features a comparison of the VIIRS NDVI with that obtained using the bands of the AVHRR-2 sensor. The trends are followed quite well, particularly for the vegetative classes. A substantial shift between the ground and TOA values is apparent, and this shift is somewhat ill-behaved for some of the nonvegetative classes. However, a direct comparison of the NDVI for the two sensors at either the ground or the TOA shows fairly close agreement across all the background types. The linear correlation between the two sensors is 0.997 at the ground and 0.995 at TOA. This indicates that the majority of the difference between the two products is contained within a simple bias.
A linear regression was thus derived from the VIIRS NDVI versus the AVHRR2 NDVI, and the resulting adjusted VIIRS NDVI is plotted in Figure 23. The adjusted VIIRS NDVI can be obtained from the equation:
0677.0025.1 VIIRSadj NDVINDVI (14)
The correlation with the AVHRR2 NDVI is 0.997, and the bias is on the order of 10-9 NDVI units, indicating this simple correction is sufficient for relating the VIIRS NDVI product with that of the AVHRR-2 sensor.
48 SBRS Document #: Y2400 PD
MOD
4375
7, -
--. P
DM
O R
elea
sed:
200
7-01
-29
(VER
IFY
REV
ISIO
N S
TATU
S)
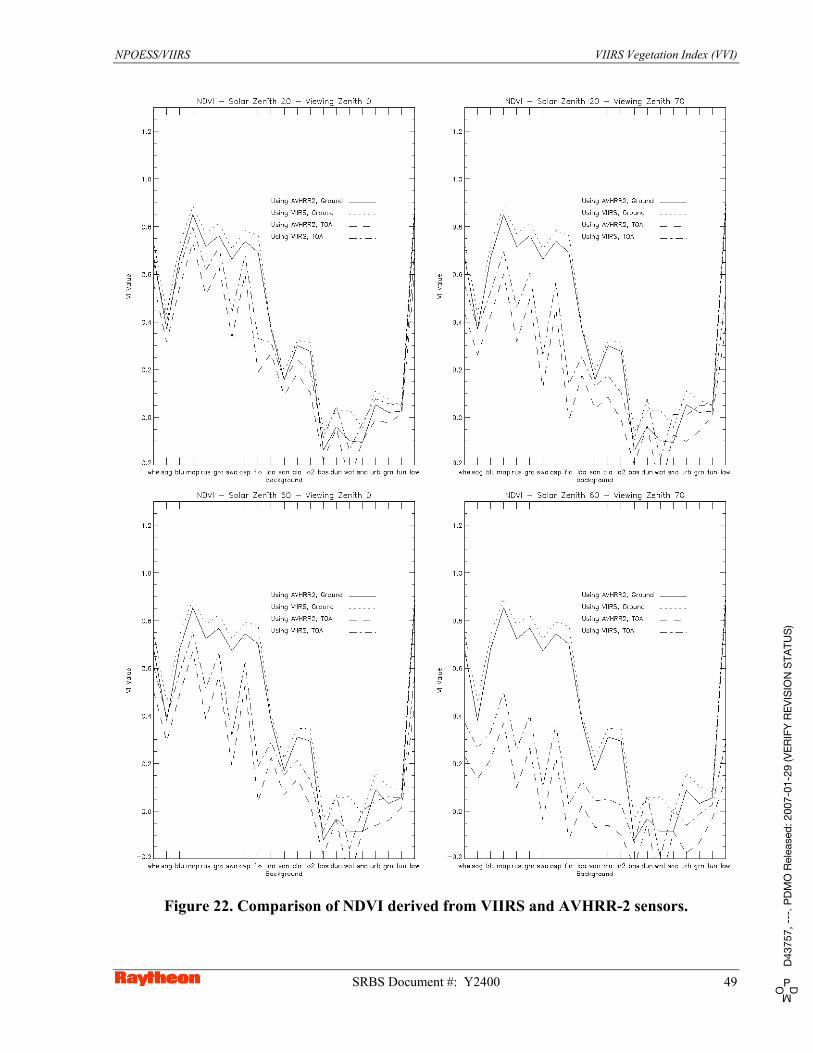
NPOESS/VIIRS VIIRS Vegetation Index (VVI)
Figure 22. Comparison of NDVI derived from VIIRS and AVHRR-2 sensors.
SRBS Document #: Y2400 49 PD
MOD
4375
7, -
--. P
DM
O R
elea
sed:
200
7-01
-29
(VER
IFY
REV
ISIO
N S
TATU
S)

VIIRS Vegetation Index (VVI) NPOESS/VIIRS
Figure 23. Linear adjustment of VIIRS NDVI to match AVHRR-2 NDVI.
50 SBRS Document #: Y2400 PD
MOD
4375
7, -
--. P
DM
O R
elea
sed:
200
7-01
-29
(VER
IFY
REV
ISIO
N S
TATU
S)
NPOESS/VIIRS VIIRS Vegetation Index (VVI)
Based upon the results obtained, we can expect to obtain a similarly acceptable solution for the bias between the VIIRS and AVHRR-3 NDVI products. Figure 24 shows a comparison of the NDVI for the two sensors. A comparison of Figure 24 with Figure 22 immediately suggests that a linear regression adjustment of the VIIRS NDVI will be sufficient to relate it to the AVHRR-3 NDVI. The correlation between the unadjusted VIIRS NDVI and the AVHRR-3 NDVI is 0.998 at the ground and 0.993 at TOA. The bias is 0.12 NDVI units at TOA, indicating that an adjustment is in order. A linear regression of the VIIRS NDVI versus the AVHRR-3 NDVI yields the following relation:
0840.0009.1 VIIRSadj NDVINDVI (15)
and the correlation between this adjusted VIIRS NDVI and the AVHRR-3 NDVI is 0.998, with a bias again on the order of 10-9 NDVI units A graphical comparison is shown in Figure 25. In short, band selection need not have a significant impact on continuity with the AVHRR NDVI heritage, and the current baseline VIIRS design would suffice.
The MODIS EVI product uses MODIS band 3 as input. This band has no equivalent in the VIIRS baseline. Some assessment of the impact of this situation on continuity with the EVI thus becomes necessary. Figure 26 shows the ground reflectivity for 21 different surface types in four different bands VIIRS bands M1, M2, and M3, and MODIS band 3. The same trends are followed across the board for all four bands, but in almost every case, VIIRS band M3 follows MODIS band 3 the most closely, while VIIRS band M1 appears to exhibit the largest deviations from MODIS band 3. Based on this comparison, it was determined that VIIRS band M3 should be used in place of MODIS band 3 in the generation of any reflectance-based EDR products. Studies similar to those done above for NDVI suggest a fairly straightforward linear transformation will be possible for converting the VIIRS EVI to a MODIS equivalent.
Since the SRD does not explicitly require the types of conversions described above, continuity is not considered a part of the accuracy, precision, or uncertainty error budgets for the NDVI and EVI.
An important note must be made about VIIRS band I1. This band was originally located at 645 nm, with a width of 50 nm, to match the MODIS spectral band 1. In Phase II, it was altered slightly to its present center of 640 nm and width of 80 nm. This change occurred through iteration with representatives of the science and operational communities. The change was necessary because the saturation radiance in I1 was found to be too low for cloud imagery requirements. Increasing the saturation radiance decreased the SNR performance, which then had to be recovered by increasing the band width. Care was taken to avoid moving the band too far into either the green or the near infrared parts of the spectrum, and the current center and width are a result of the best possible compromise between the different user communities. Movement farther into the near infrared would have encroached on the near infrared reflectance plateau for vegetation, while movement farther into the green would have brought in signals from pigments other than the target chlorophyll. It should be noted that this change only impacts the imagery-resolution vegetation indices; LAI and FPAR utilize only moderate resolution spectral bands.
SRBS Document #: Y2400 51 PD
MOD
4375
7, -
--. P
DM
O R
elea
sed:
200
7-01
-29
(VER
IFY
REV
ISIO
N S
TATU
S)
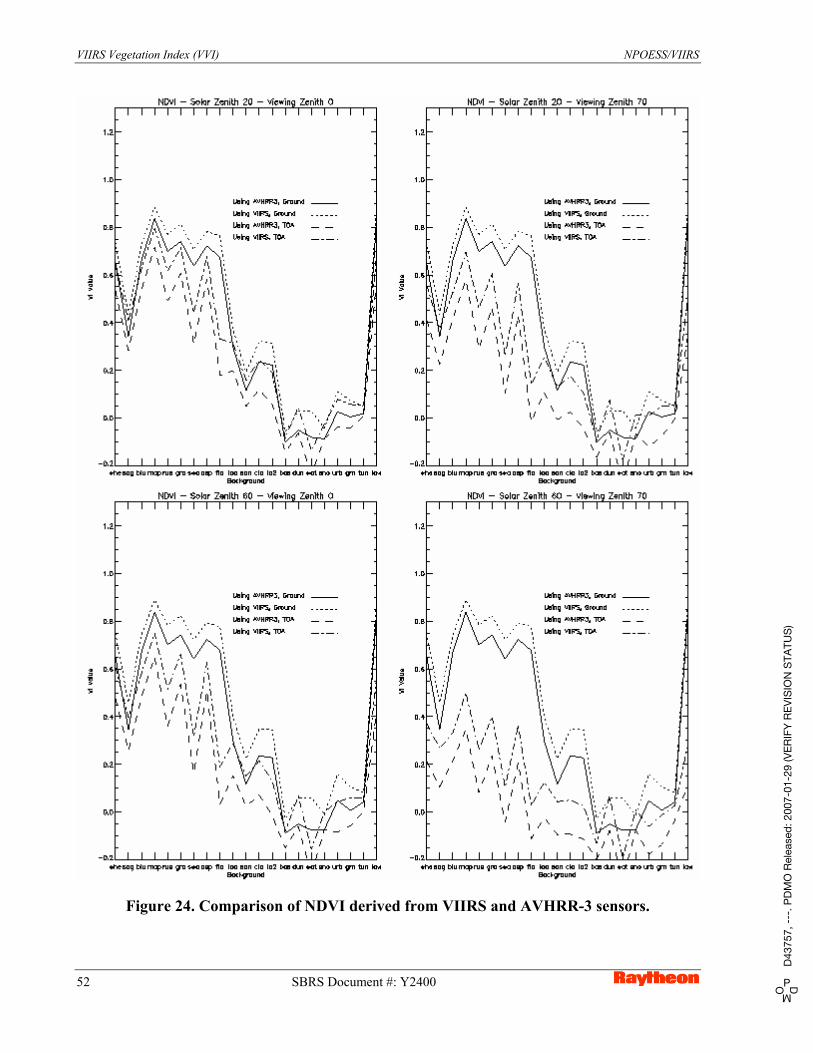
VIIRS Vegetation Index (VVI) NPOESS/VIIRS
Figure 24. Comparison of NDVI derived from VIIRS and AVHRR-3 sensors.
52 SBRS Document #: Y2400 PD
MOD
4375
7, -
--. P
DM
O R
elea
sed:
200
7-01
-29
(VER
IFY
REV
ISIO
N S
TATU
S)
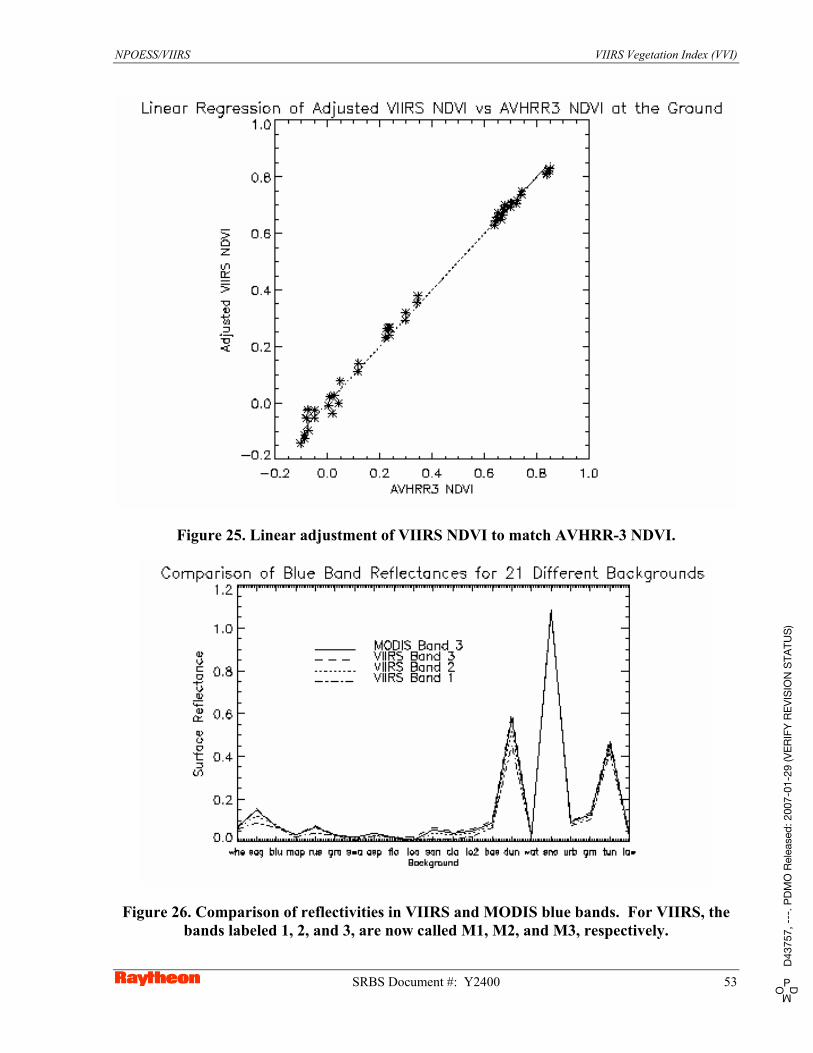
NPOESS/VIIRS VIIRS Vegetation Index (VVI)
Figure 25. Linear adjustment of VIIRS NDVI to match AVHRR-3 NDVI.
Figure 26. Comparison of reflectivities in VIIRS and MODIS blue bands. For VIIRS, the bands labeled 1, 2, and 3, are now called M1, M2, and M3, respectively.
SRBS Document #: Y2400 53 PD
MOD
4375
7, -
--. P
DM
O R
elea
sed:
200
7-01
-29
(VER
IFY
REV
ISIO
N S
TATU
S)
VIIRS Vegetation Index (VVI) NPOESS/VIIRS
3.4.5.5 Sensor MTF Effects
The most likely scientific interpretation of a “perfect” pixel would be one that perfectly represented the averaged radiance over some square region on the Earth’s surface. The average should be equally weighted across the entire square, with no contributions from outside the borders. In reality, of course, this is not achieved. A pixel will instead be the result of several convolutions, due to scattered and stray light, diffraction, blurring, the finite nature of the detector, and so forth. This will have the effects of varying the weighting within the target region on the surface and incorporating photons which came from outside this region, either from surrounding regions on the surface or from entirely different sources. The ultimate effect of all these convolutions can be represented as the sensor point spread function (PSF), which typically has some central peak near the center of the target region, around which the radiances contributed from surrounding areas of the Earth’s surface drop off in a typically exponential manner. The Modulation Transfer Function (MTF) is the absolute value of the Fourier transform of the PSF, and provides a measure of spatial performance for a given sensor design.
To study the effects of MTF smearing on the NDVI, the Landsat scenes from Table 11 were used to generate simulated VIIRS pixels at 390-m resolution (a similar resolution to the baseline for the red band). Simulated VIIRS pixels in both the red and near-infrared bands were built from 30-m Landsat TM pixels, and subsequently seven different MTF models were applied and compared with a perfect boxcar point spread function (PSF). The MTF models are described thoroughly in Hucks (1998). All seven of the modeled MTF curves are Gaussian, with values of 0.1, 0.2, 0.3, 0.4, 0.5, 0.6, and 0.7 at Nyquist. MTF model 1 is 0.7 at Nyquist, model 2 is 0.6, and so on. The sensor specification is model 3 (0.5 at Nyquist) for imagery resolution bands and model 5 (0.3 at Nyquist) for moderate resolution bands. Both NDVI bands are at imagery resolution. Truth was defined here as the boxcar average across the entire pixel, so that one might expect the best performing MTF model would be somewhere in the middle of the range provided here.
Figure 27 illustrates the results for the heterogeneous Chesapeake scene at 400-m resolution. In each plot, the solid horizontal line corresponds to the threshold requirement, and the dotted horizontal line corresponds to the objective. As expected, particularly for vegetated surfaces, the best MTF is neither model 1 nor model 7, but model 3. Model 2 seems to become the optimal choice for non-vegetated surfaces; however, model 3 achieves comparable performance in these instances, and vegetated surfaces would seem to be more important from a physical standpoint for this particular EDR. Accuracy is less affected than precision by MTF smearing. The precision error for model 3 remains confined below 0.01 for the most part; the corresponding accuracy error is virtually zero. Since model 3 is essentially the nominal design, the MTF errors in the NDVI product can be assumed on the order of 0.01 or less even in worst cases. A more thorough analysis of MTF errors will be presented in future revisions of this document.
54 SBRS Document #: Y2400 PD
MOD
4375
7, -
--. P
DM
O R
elea
sed:
200
7-01
-29
(VER
IFY
REV
ISIO
N S
TATU
S)

NPOESS/VIIRS VIIRS Vegetation Index (VVI)
Figure 27. 400-m accuracy, precision, and uncertainty in the NDVI for MTF-smeared red and near infrared bands in scene 1 (Chesapeake).
3.3.5.6 Sensor Noise
A real sensor will take top-of-atmosphere (TOA) radiance as input and convert this to a corresponding measured radiance that deviates from the input value by some amount. Ignoring calibration errors, the deviations should be random in nature and roughly assume the form of Gaussian noise. Although this assumption breaks down at the limits of the sensor’s dynamic range, it does form a good first cut at modeling sensor noise. The reader is directed to Hucks (1998) for a more detailed description of the VIIRS sensor noise modeling process. Sensor noise is not considered a direct part of the NDVI or EVI error budgets, since it is included in the total
SRBS Document #: Y2400 55 PD
MOD
4375
7, -
--. P
DM
O R
elea
sed:
200
7-01
-29
(VER
IFY
REV
ISIO
N S
TATU
S)

VIIRS Vegetation Index (VVI) NPOESS/VIIRS
error in TOA or Surface Reflectance. Results of some simulations targeted toward the effects of sensor noise on the NDVI are summarized as follows.
Simulations of sensor and atmospheric noise effects were conducted using MODTRAN 3.7. Figure 28 illustrates a comparison of vegetation indices computed using ground, TOA and measured (noisy) band radiances. All of these values are for a solar zenith of 20 and a viewing zenith of 0 , using the sensor specification for radiometric noise. For each background, there are 32 points for comparison, one for each measurement made by the sensor noise model. Since the ground and TOA values do not incorporate sensor noise, they remain constant for a given background in each plot. The measurements, in contrast, will deviate from the TOA values in a random fashion.
Two things are immediately apparent from Figure 28. First, the disparity between the ground and TOA values far outweighs that between the TOA and measured values for this sensor noise model: atmospheric effects are dominant in comparison with sensor noise effects for the NDVI. Deviations of the measurements from the TOA values are minimal even in an absolute sense.
Figure 29 illustrates the same comparisons, only with a solar zenith of 60 and a viewing zenith of 70 . This represents extreme values of viewing and solar geometry. The NDVI is still relatively unaffected by sensor noise.
The VVI is therefore not considered to be a driver for SNR.
56 SBRS Document #: Y2400 PD
MOD
4375
7, -
--. P
DM
O R
elea
sed:
200
7-01
-29
(VER
IFY
REV
ISIO
N S
TATU
S)

NPOESS/VIIRS VIIRS Vegetation Index (VVI)
Figure 28. Comparison of ground, TOA, and sensor-measured retrievals of NDVI using sensor specification for radiometric noise, with a solar zenith of 20 degrees and a viewing
zenith of 0 degrees. TOA values are aligned almost exactly with measurements.
SRBS Document #: Y2400 57 PD
MOD
4375
7, -
--. P
DM
O R
elea
sed:
200
7-01
-29
(VER
IFY
REV
ISIO
N S
TATU
S)

VIIRS Vegetation Index (VVI) NPOESS/VIIRS
Figure 29. Comparison of ground, TOA, and sensor-measured retrievals of NDVI using
sensor specification for radiometric noise, with a solar zenith of 60 degrees and a viewing zenith of 70 degrees.
58 SBRS Document #: Y2400 PD
MOD
4375
7, -
--. P
DM
O R
elea
sed:
200
7-01
-29
(VER
IFY
REV
ISIO
N S
TATU
S)
NPOESS/VIIRS VIIRS Vegetation Index (VVI)
3.4.5.7 Radiometric Calibration and Stability
The NDVI and EVI have explicit requirements for accuracy and for long-term stability. Both are affected to a large degree by radiometric calibration and its behavior over time. Calibration is not considered part of the NDVI/EVI error budgets, as it is folded into TOA or Surface Reflectance error, however the relationship between calibration, stability, and the NDVI will be briefly presented in this section.
As a first cut at the issues of calibration and stability for the VIIRS sensor, the data generated for the SNR studies were used to trace back requirements to individual band radiances. For this portion of the study, sensor noise was assumed to be zero. There were then 84 different cases—21 different backgrounds with 4 different sets of viewing and solar geometry—from which an initial assessment of calibration and long-term stability requirements could be obtained.
As an example, consider the calibration of the NDVI, as defined in equation 1. According to the SRD, the worst allowable drift in the calibration of the sensor would produce a systematic change in the measured NDVI of 0.04 NDVI units. This change, NDVI, can be traced back to a corresponding change in the band radiances reported by the sensor. Since there are two bands involved in the generation of the NDVI, an exact stability requirement cannot be placed on either band. If, however, one band is held fixed, then all of the variability can be traced back through the other band, placing an upper bound on the allowable drift in that band’s calibration. In practice, since both bands will drift to some degree, it must be understood that this upper bound may not fulfill the SRD requirements; however, it does help to bracket the performance of the individual bands in terms of calibration and stability. If a drift in the two bands is strongly correlated, which is quite possible, then the upper bounds derived in this manner may be quite close to the actual requirements.
If the near-infrared band is held fixed, then NDVI can be traced back to a drift Lred in the red band radiance Lred:
)cos( 00 redredred
FL (16)
where
NDVINDVI
NDVINDVINDVINDVI
redred 11
11 (17)
and F0red is the solar constant in the red band. A similar expression can be obtained for the case in which the near-infrared band is allowed to drift with the red band held fixed.
Figure 30 shows the upper-bound stability requirements in the red and near-infrared bands, along with the NDVI, for 21 surface types with 0 = 20 and = 0 (nadir).
SRBS Document #: Y2400 59 PD
MOD
4375
7, -
--. P
DM
O R
elea
sed:
200
7-01
-29
(VER
IFY
REV
ISIO
N S
TATU
S)

VIIRS Vegetation Index (VVI) NPOESS/VIIRS
Figure 30. Red and near infrared band upper bound calibration/stability requirements and NDVI for 21 surface types, with solar zenith of 20 degrees and viewing zenith of 0 degrees.
60 SBRS Document #: Y2400 PD
MOD
4375
7, -
--. P
DM
O R
elea
sed:
200
7-01
-29
(VER
IFY
REV
ISIO
N S
TATU
S)

NPOESS/VIIRS VIIRS Vegetation Index (VVI)
For vegetation, a slightly higher upward drift is allowable in both bands than downward. The opposite is true for non-vegetative surfaces. The least tolerance for instability is seen for the water class; however, for vegetation indices this is not critical. For the most part, the upper bound in both bands runs along the order of 10-5 Wcm-2sr-1.
Figure 31 shows the same type of plot for 0 = 60 and = 70 (low Sun, edge of scan).
SRBS Document #: Y2400 61 PD
MOD
4375
7, -
--. P
DM
O R
elea
sed:
200
7-01
-29
(VER
IFY
REV
ISIO
N S
TATU
S)

VIIRS Vegetation Index (VVI) NPOESS/VIIRS
Figure 31. Red and near infrared band upper bound stability requirements and NDVI for 21 surface types, with solar zenith of 60 degrees and viewing zenith of 70 degrees.
62 SBRS Document #: Y2400 PD
MOD
4375
7, -
--. P
DM
O R
elea
sed:
200
7-01
-29
(VER
IFY
REV
ISIO
N S
TATU
S)

NPOESS/VIIRS VIIRS Vegetation Index (VVI)
3.4.5.8 Geolocation Errors
For both bands, the upper bound on the upward drift drops only very slightly from the case for nadir and high illumination. Interestingly, the allowable downward shift drops much more noticeably, so that the leeway is approximately the same both up and down. This change is probably due to the nonlinearity of (17). Overall, the stability for extreme angles is close to 10-5 Wcm2sr-1.
The results presented here were targeted toward stability, however they are also quite applicable to calibration. The accuracy requirement for the NDVI is 0.05, which is looser than the stability requirement, however the accuracy error budget includes contributions from other error sources, including reflectance retrieval, misregistration, and MTF effects. The sensor specification of 2% reflectance calibration in the reflective bands on the VIIRS instrument have been flowed into the error analysis presented in Section 3.3.7, and this level of calibration is deemed sufficient to satisfy the NDVI/EVI accuracy requirements.
The NDVI and EVI have specific mapping uncertainty requirements, but the specified requirement is no smaller than the horizontal cell size for these two products. Were this the only requirement on geolocation, little concern would be warranted for achieving highly accurate estimates of Earth location. There is a desire, however, to keep apparent errors associated with geolocation at or below the level of other errors in the NDVI/EVI error budgets, and the geolocation error implied by the SRD mapping uncertainty requirement far exceeds this criterion. Geolocation is not considered to be a part of the error budget for either product, however its effects should be kept at a minimum relative to other error sources.
The effects of geolocation errors on the NDVI were simulated for the three Landsat scenes from Table 11. VIIRS pixels of 390 m were constructed from 30-m Landsat TM pixels, and then shifted in incremental amounts from a reference position to determine the effects on accuracy, precision, and uncertainty. The results are shown in Figure 32, Figure 33, and Figure 34; for scenes 1, 2, and 3, respectively. Overall, for heterogeneous regions (such as that depicted in the Chesapeake scene, scene 1), geolocation errors can exceed the objective for precision, even at 100-m displacement. When combined with errors from other sources, this is significant and possibly too high. It has therefore been independently recommended that the VIIRS system be driven toward a rigorous geolocation algorithm that maintains an uncertainty of 200 m or less, 2 , at nadir. This is equivalent to the MODIS sensor specification for geolocation.
3.4.5.9 Band-to-Band Registration Errors
Any two given bands on the VIIRS instrument would ideally project to perfectly aligned pixels at the same spot on the ground. In reality, any two given bands will be offset in an arbitrary direction from one another, causing errors in EDR retrieval algorithms.
In order to study the effects of misregistration between bands for the VIIRS sensor, the three Landsat scenes from Table 11 were processed as simulated VIIRS scenes: the Chesapeake, Appalachian, and White Sands scenes. All three scenes originated from Landsat-5. None of the scenes were georegistered or radiometrically calibrated to any high degree of accuracy. Since they were used as the basis for simulated scenes only, extremely accurate radiometric calibration
SRBS Document #: Y2400 63 PD
MOD
4375
7, -
--. P
DM
O R
elea
sed:
200
7-01
-29
(VER
IFY
REV
ISIO
N S
TATU
S)

VIIRS Vegetation Index (VVI) NPOESS/VIIRS
was not deemed necessary. Similarly, absolute georegistration was considered unimportant here. The only preprocessing done to the imagery was to convert the single-byte digital number (DN) values to reflectances using suitable averaged gain coefficients. The seven Landsat bands are summarized in Table 4. For the purposes here, only band 3 (red) and band 4 (near infrared) were used.
64 SBRS Document #: Y2400 PD
MOD
4375
7, -
--. P
DM
O R
elea
sed:
200
7-01
-29
(VER
IFY
REV
ISIO
N S
TATU
S)

NPOESS/VIIRS VIIRS Vegetation Index (VVI)
Figure 32. 1-km accuracy, precision, and uncertainty in NDVI for identically misregistered red and near infrared bands in scene 1.
SRBS Document #: Y2400 65 PD
MOD
4375
7, -
--. P
DM
O R
elea
sed:
200
7-01
-29
(VER
IFY
REV
ISIO
N S
TATU
S)

VIIRS Vegetation Index (VVI) NPOESS/VIIRS
Figure 33. 1-km accuracy, precision, and uncertainty in NDVI for identically misregistered red and near infrared bands in scene 2.
66 SBRS Document #: Y2400 PD
MOD
4375
7, -
--. P
DM
O R
elea
sed:
200
7-01
-29
(VER
IFY
REV
ISIO
N S
TATU
S)

NPOESS/VIIRS VIIRS Vegetation Index (VVI)
Figure 34. 1-km accuracy, precision, and uncertainty in NDVI for identically misregistered red and near infrared bands in scene 3.
SRBS Document #: Y2400 67 PD
MOD
4375
7, -
--. P
DM
O R
elea
sed:
200
7-01
-29
(VER
IFY
REV
ISIO
N S
TATU
S)

VIIRS Vegetation Index (VVI) NPOESS/VIIRS
The nadir resolution of Landsat TM is 30 m for bands 1 through 5, and band 7. The thermal band (band 6) has a resolution of 120 m, however that band was not used here. The high resolution of TM imagery allows an investigation of subpixel variations for the VIIRS sensor. The original nominal resolution of the VIIRS red band was 370 m. This has since been changed to 375 m. A reasonable first choice for building 375 m VIIRS pixels from TM pixels would then be to group the Landsat pixels into 12x12 arrays. Unfortunately, this grouping places the center of a VIIRS pixel in between four Landsat pixels. For coding purposes, it was more convenient to select 13x13 arrays of Landsat pixels, allowing the center of the resulting 390 m VIIRS pixel to correspond to a single Landsat pixel. For this study, the near-infrared band was also defined at 390 m resolution, the same as that of the red band.
For a given pixel-level HCS, the following process was conducted. First, a series of horizontal cells were extracted from the Landsat scene. Because one Landsat scene consists of more than 37 million pixels, we opted to use only every fiftieth pixel in each direction as the center of a horizontal cell. This still allowed for the generation of over 13,000 horizontal cells. For each horizontal cell, the reflectances were calculated first, and then the NDVI was computed. In this case, the two bands were considered to have perfectly overlapping footprints on the surface.
The next step was to apply a fixed systematic shift in the near infrared VIIRS pixels with respect to the red pixels. Since the TM pixels are at 30 m resolution, this shift could only be conducted in 30 m increments. Six different levels of misregistration, ranging from 30 m up to 180 m (approximately one half-pixel), were applied. Each level was applied four times, corresponding to systematic shifts in the up, down, left and right directions in the imagery. The NDVI was then computed from the misregistered reflectances. The end result is that each pixel has 50 numbers associated with it in the output—the “true” value of the NDVI, plus perturbed values for six different-sized shifts in four different directions.
For brevity, the results of these simulations are presented for the Chesapeake scene only, in Figure 35. Similar behavior was observed in the other two Landsat scenes, with slightly lower errors for scene 2, which is more homogeneous. Accuracy is largely unaffected by misregistration, as would be expected. In terms of precision, also as would be expected, misregistration has the biggest effect where the variation between vegetative and non-vegetative surfaces is significant across the imagery. The only regime where the precision exceeds the threshold requirement is for regions where vegetation borders water bodies in scene 1. Particularly along the Potomac, the land adjacent to the water is often quite heavily vegetated. This means there will be a discontinuity in the NDVI across the land/water boundary, which is the most likely cause of the larger values of the precision attribute.
The simulations conducted for this study involved a number of simplifications. Among the most important, the sensor point spread function (PSF) was treated as a perfect "boxcar" spatial average. Actual sensor MTF performance will tend to reduce the effects of misregistration errors. In contrast, variations in terrain were not considered; these effects can substantially increase the separation of pixel centers in different bands, even if the sensor coregistration specification is met with margin. These effects may be addressed in a future version of this document, however they have not been used to drive the VIIRS design.
68 SBRS Document #: Y2400 PD
MOD
4375
7, -
--. P
DM
O R
elea
sed:
200
7-01
-29
(VER
IFY
REV
ISIO
N S
TATU
S)
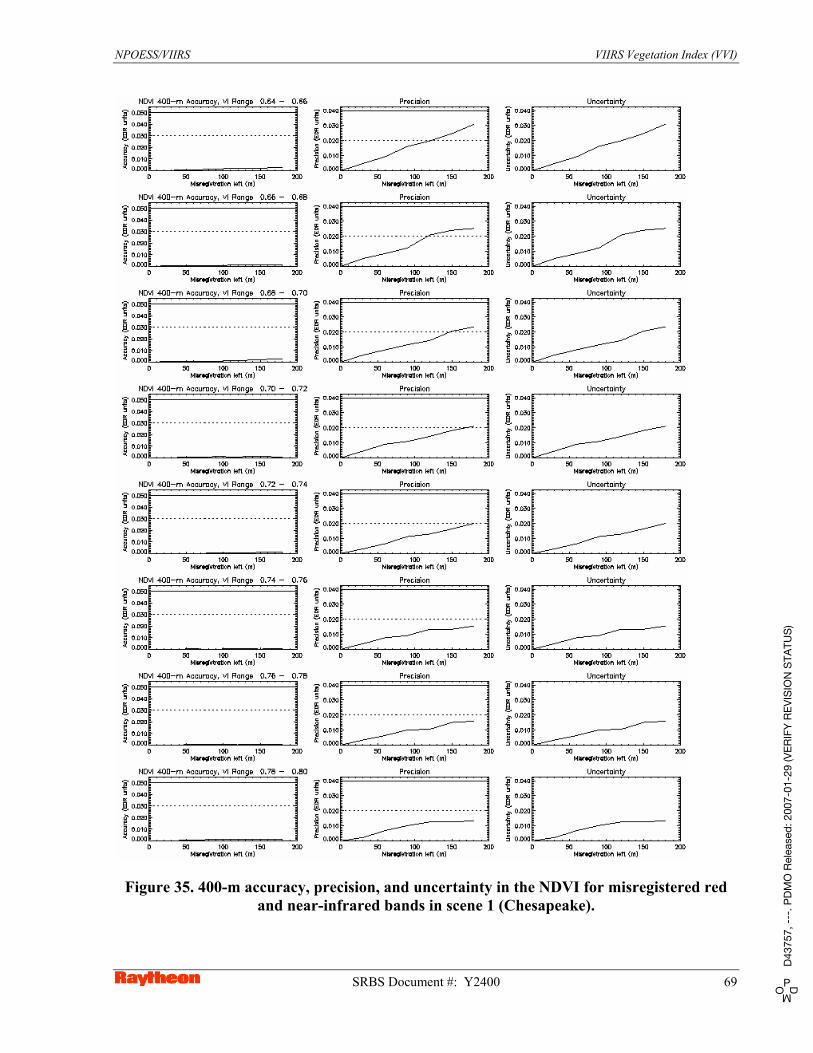
NPOESS/VIIRS VIIRS Vegetation Index (VVI)
Figure 35. 400-m accuracy, precision, and uncertainty in the NDVI for misregistered red and near-infrared bands in scene 1 (Chesapeake).
SRBS Document #: Y2400 69 PD
MOD
4375
7, -
--. P
DM
O R
elea
sed:
200
7-01
-29
(VER
IFY
REV
ISIO
N S
TATU
S)

VIIRS Vegetation Index (VVI) NPOESS/VIIRS
3.4.6 End-to-End Performance Assessment
One of the most interesting activities of Phase I algorithm development for VIIRS was the attempt to simulate an entire system of geophysics, sensor behavior, and retrieval algorithms. This was done for several land products, including the Vegetation Index EDR. The overall process is described briefly in Section 3.4.3.4.
The results presented here are for the Colombia TERCAT scene, shown in Figure 36. The rectangular box indicates the 6144x4096 subscene over which simulations were conducted. This subscene was broken down into 300-m, 600-m, and 1200-m VIIRS pixels, each with varying degrees of misregistration. Aggregation of reflectances into coarser HCS values is also allowed within the Testbed.
Figure 37 shows the error propagation for the NDVI, as retrieved at various stages along the way. The x-axis labels can be summarized as follows. Truth is defined as the NDVI at the surface. Perfect is defined as retrieval of TOC NDVI at the top of the atmosphere without any sensor effects, save for the finite VIIRS bandwidths and the finite pixel extent. Shiftmmm refers to a maximum possible misregistration of mmm meters in all bands with respect to the red band. MTFmmm adds the sensor MTF, Noisemmm adds sensor noise, and Calibmmm adds gain error. UnMTFmmm adds the MTF correction, and CCmmm adds the cubic convolution resampling. Cloudmmm incorporates the retrieved cloud mask, however those results were not available at the time of this writing. AOTmmm considers using the retrieved aerosols instead of the truth, which is used for all previous steps. The diamonds represent accuracy at each step; the asterisks represent precision. The solid line is the accuracy threshold, while the dotted line is the precision threshold.
Figure 37a (top panel) shows the results for moderately high AOT, high NDVI, and a half-pixel misregistration for 300-m pixels aggregated to 600-m HCS. In this instance, the correction routines (UnMTF and CC) do not do much good, as the original MTF error in fact tended to reduce errors. This is not always the case; often the MTF correction and the cubic convolution reduce errors significantly. This plot is a warning to use caution in applying the routines, however. MTF correction and cubic convolution resampling are opposite processes; the former sharpens, while the latter smooths. One lesson learned from these simulations is that MTF correction would best be applied after any kind of resampling. In the end, both MTF correction and cubic convolution resampling were rejected as parts of the operational processing pipeline due to their unpredictable behavior.
The TOC NDVI fails to meet threshold after the final aerosol retrieval is incorporated. Performance does meet threshold for lower AOT on some occasions. Figure 37b (bottom panel) shows the results for 600-m pixels; the accuracy error is worse for this case.
70 SBRS Document #: Y2400 PD
MOD
4375
7, -
--. P
DM
O R
elea
sed:
200
7-01
-29
(VER
IFY
REV
ISIO
N S
TATU
S)

NPOESS/VIIRS VIIRS Vegetation Index (VVI)
Figure 36. Colombia TERCAT scene and subscene.
AOT 0.40 - 0.50, NDVI 0.80 - 0.85, 300-m GSD 600-m HCS, 150-m shift
AOT 0.40 - 0.50, NDVI 0.80 - 0.85 , 600-m GSD 600-m HCS, 300-m shift
Truth Perfect Shift150 MTF150 Noise150 Calib150 UnMTF150 CC150 Cloud150 AOT150
Truth Perfect Shift300 MTF300 Noise300 Calib300 UnMTF300 CC300 Cloud300 AOT300
Figure 37. TOC NDVI end to end performance for the Colombia TERCAT scene.
SRBS Document #: Y2400 71 PD
MOD
4375
7, -
--. P
DM
O R
elea
sed:
200
7-01
-29
(VER
IFY
REV
ISIO
N S
TATU
S)
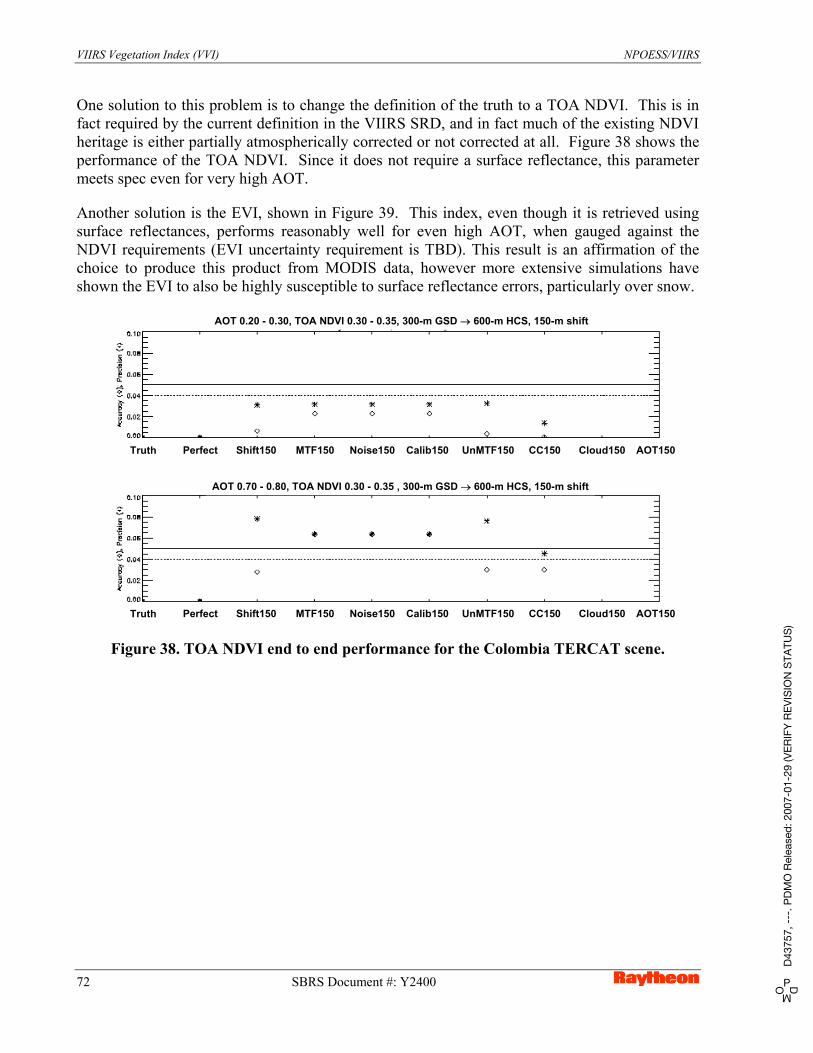
VIIRS Vegetation Index (VVI) NPOESS/VIIRS
One solution to this problem is to change the definition of the truth to a TOA NDVI. This is in fact required by the current definition in the VIIRS SRD, and in fact much of the existing NDVI heritage is either partially atmospherically corrected or not corrected at all. Figure 38 shows the performance of the TOA NDVI. Since it does not require a surface reflectance, this parameter meets spec even for very high AOT.
Another solution is the EVI, shown in Figure 39. This index, even though it is retrieved using surface reflectances, performs reasonably well for even high AOT, when gauged against the NDVI requirements (EVI uncertainty requirement is TBD). This result is an affirmation of the choice to produce this product from MODIS data, however more extensive simulations have shown the EVI to also be highly susceptible to surface reflectance errors, particularly over snow.
AOT 0.20 - 0.30, TOA NDVI 0.30 - 0.35, 300-m GSD 600-m HCS, 150-m shift
AOT 0.70 - 0.80, TOA NDVI 0.30 - 0.35 , 300-m GSD 600-m HCS, 150-m shift
Truth Perfect Shift150 MTF150 Noise150 Calib150 UnMTF150 CC150 Cloud150 AOT150
Truth Perfect Shift150 MTF150 Noise150 Calib150 UnMTF150 CC150 Cloud150 AOT150
Figure 38. TOA NDVI end to end performance for the Colombia TERCAT scene.
72 SBRS Document #: Y2400 PD
MOD
4375
7, -
--. P
DM
O R
elea
sed:
200
7-01
-29
(VER
IFY
REV
ISIO
N S
TATU
S)
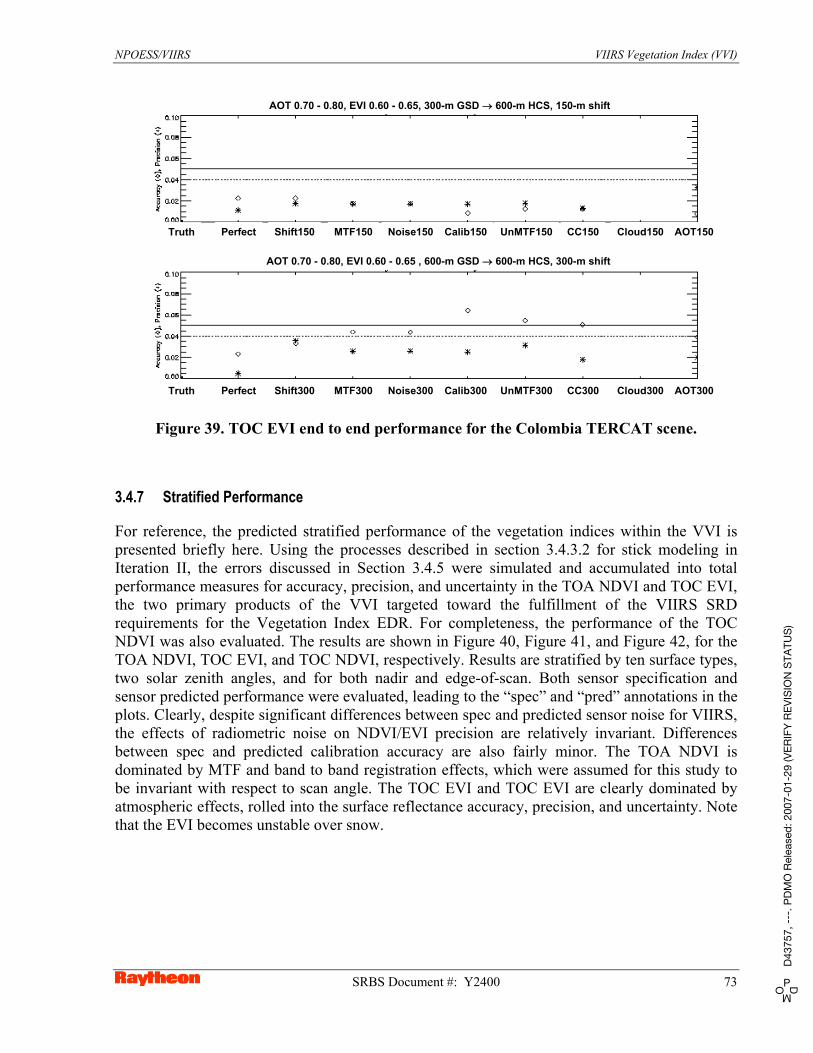
NPOESS/VIIRS VIIRS Vegetation Index (VVI)
AOT 0.70 - 0.80, EVI 0.60 - 0.65, 300-m GSD 600-m HCS, 150-m shift
AOT 0.70 - 0.80, EVI 0.60 - 0.65 , 600-m GSD 600-m HCS, 300-m shift
Truth Perfect Shift150 MTF150 Noise150 Calib150 UnMTF150 CC150 Cloud150 AOT150
Truth Perfect Shift300 MTF300 Noise300 Calib300 UnMTF300 CC300 Cloud300 AOT300
Figure 39. TOC EVI end to end performance for the Colombia TERCAT scene.
3.4.7 Stratified Performance
For reference, the predicted stratified performance of the vegetation indices within the VVI is presented briefly here. Using the processes described in section 3.4.3.2 for stick modeling in Iteration II, the errors discussed in Section 3.4.5 were simulated and accumulated into total performance measures for accuracy, precision, and uncertainty in the TOA NDVI and TOC EVI, the two primary products of the VVI targeted toward the fulfillment of the VIIRS SRD requirements for the Vegetation Index EDR. For completeness, the performance of the TOC NDVI was also evaluated. The results are shown in Figure 40, Figure 41, and Figure 42, for the TOA NDVI, TOC EVI, and TOC NDVI, respectively. Results are stratified by ten surface types, two solar zenith angles, and for both nadir and edge-of-scan. Both sensor specification and sensor predicted performance were evaluated, leading to the “spec” and “pred” annotations in the plots. Clearly, despite significant differences between spec and predicted sensor noise for VIIRS, the effects of radiometric noise on NDVI/EVI precision are relatively invariant. Differences between spec and predicted calibration accuracy are also fairly minor. The TOA NDVI is dominated by MTF and band to band registration effects, which were assumed for this study to be invariant with respect to scan angle. The TOC EVI and TOC EVI are clearly dominated by atmospheric effects, rolled into the surface reflectance accuracy, precision, and uncertainty. Note that the EVI becomes unstable over snow.
SRBS Document #: Y2400 73 PD
MOD
4375
7, -
--. P
DM
O R
elea
sed:
200
7-01
-29
(VER
IFY
REV
ISIO
N S
TATU
S)

VIIRS Vegetation Index (VVI) NPOESS/VIIRS
Figure 40. Stratified performance of the TOA NDVI from Iteration II.
74 SBRS Document #: Y2400 PD
MOD
4375
7, -
--. P
DM
O R
elea
sed:
200
7-01
-29
(VER
IFY
REV
ISIO
N S
TATU
S)
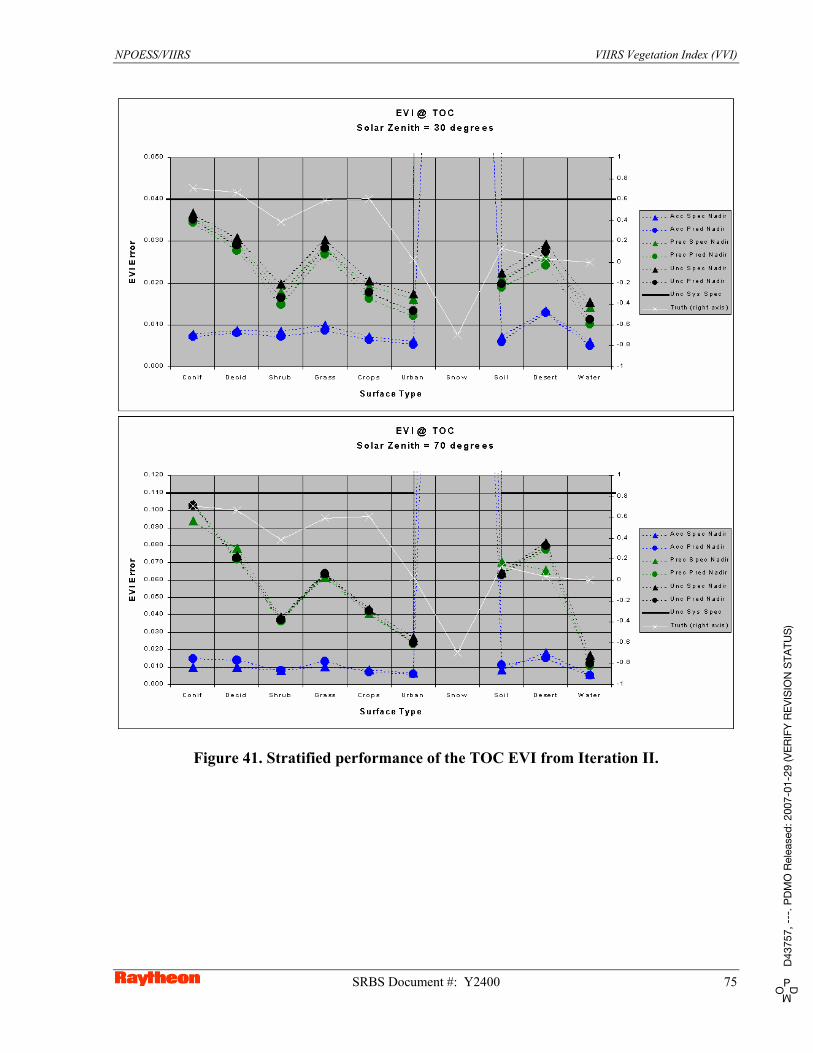
NPOESS/VIIRS VIIRS Vegetation Index (VVI)
Figure 41. Stratified performance of the TOC EVI from Iteration II.
SRBS Document #: Y2400 75 PD
MOD
4375
7, -
--. P
DM
O R
elea
sed:
200
7-01
-29
(VER
IFY
REV
ISIO
N S
TATU
S)

VIIRS Vegetation Index (VVI) NPOESS/VIIRS
Figure 42. Stratified performance of the TOC NDVI from Iteration II.
76 SBRS Document #: Y2400 PD
MOD
4375
7, -
--. P
DM
O R
elea
sed:
200
7-01
-29
(VER
IFY
REV
ISIO
N S
TATU
S)
NPOESS/VIIRS VIIRS Vegetation Index (VVI)
3.5 PRACTICAL CONSIDERATIONS
3.5.1 Numerical Computation Considerations
Paragraph SRDV3.2.1.5.4-1 of the VIIRS SRD states the following:
“The scientific SDR and EDR algorithms delivered by the VIIRS contractor shall be convertible into operational code that is compatible with a 20 minute maximum processing time at either the DoD Centrals or DoD field terminals for the conversion of all pertinent RDRs into all required EDRs for the site or terminal, including those based wholly or in part on data from other sensor suites.”
RDR here stands for Raw Data Record. This essentially means that any and all EDRs must be completely processed from VIIRS raw data, including calibration and georeferencing within 20 minutes from the time the raw data are available. This requirement is a strong reminder that VIIRS is an operational instrument.
For the VVI products, the challenges posed by the SRD time requirement are minimal. None of the VVI products are computationally intensive in nature. The NDVI and EVI are single-line algorithms. They do not involve any kind of iteration or inversion of physically-based models. LAI and FPAR are based upon pre-generated lookup tables, and PSN and NPP are subsequently derived as simple temporal accumulations or composites.
3.5.2 Programming and Procedural Considerations
Numerical computation load and complexity of operational code are typically rather well correlated. More intensive algorithms will generally be manifested in larger and more intricate source code. The code itself can have a significant impact on numerical computation load if it is not developed efficiently. The VVI products are not expected to cause many problems in this regard. The simplicity of all the algorithms described in this document translates into very small amounts of code using basic mathematical routines. VIIRS Phase II efforts are largely software-focused, and the methodology for this development work is based on sound and proven principles, as discussed in the VIIRS Algorithm Software Development Plan [Y6635]. The present maturity of the VIIRS software is detailed in the VIIRS Algorithm Software Maturity Assessment document [Y6661]. The maturity and remaining Phase II tasks for the algorithms themselves is summarized in the VIIRS Algorithm/Data Processing Technical Report [Y7040]. The software designs relevant to the Vegetation Index Unit are summarized in the VIIRS Context Level Software Architecture [Y2469], Land Module Level Software Architecture [Y2474], Land Module Level Detailed Design [Y2483], and Vegetation Index Unit Level Detailed Design [Y2499]. These designs will be tested at the system level as described in the most recent versions of the VIIRS Software Integration and Test Plan [Y3236], Algorithm Verification and Validation Plan [Y3237], and System Verification and Validation Plan [Y3270]. A summary of the ultimate strategy for operational application of the system of VIIRS algorithms is provided in the VIIRS Operations Concept document [Y2468]. The VIIRS Interface Control Document (ICD [Y2470]) provides more detail on the specifics of ancillary data requirements for Vegetation Index and other VIIRS products.
SRBS Document #: Y2400 77 PD
MOD
4375
7, -
--. P
DM
O R
elea
sed:
200
7-01
-29
(VER
IFY
REV
ISIO
N S
TATU
S)

VIIRS Vegetation Index (VVI) NPOESS/VIIRS
3.5.3 Configuration of Retrievals
The retrievals and performances of the VVI products are governed by the Land Quality Flags (LQF), which are generated along with the Surface Reflectance IP. These parameters are summarized in [Y2411].
3.5.4 Quality Assessment and Diagnostics
Operationally, quality control is automated for the VVI products, using the constraint parameters for the LQF output. In order to ensure a high level of quality in the product, it is necessary to periodically perform manual inspections of both the input data and the processing scheme. The VIIRS team will use a variety of inputs to this process, including but not limited to surface-generated maps of vegetation cover, aerial photography and remote sensing of vegetation, field experiments refining the relationships between the VVI products at ground level, VIIRS quality control information, data from other sensors, and statistical analyses.
3.5.5 Exception Handling
Exception handling for the VVI products is discussed in [Y2411] as part of the discussion of the LQF output.
3.6 ALGORITHM VALIDATION
Validation of the VVI products should be conducted using surface-based and aircraft-based measurements of vegetation. High altitude aircraft measurements should be used to validate the spatial coverage and variability inferred by the VVI products. Low-flying aircraft measurements would be useful for validating top-of-canopy (TOC) radiances and solar input. The ground-based measurements will focus upon physically-based parameters such as the LAI and chlorophyll absorption, as well as further validation of surface solar irradiance. Ground- and aircraft-based measurements of BRDF variability should also be conducted. The MODIS validation infrastructure, combined with international efforts such as Long Term Ecological Research (LTER), Global Terrestrial Observing System (GTOS), and Global Climate Observing System (GCOS), will minimize the cost and risk associated with pre-launch and post-launch validation of the VVI.
Further details on planned field campaigns, experimental methodologies and instrument calibration and data reduction procedures are documented in the VIIRS System Verification and Validation Plan [Y3270].
78 SBRS Document #: Y2400 PD
MOD
4375
7, -
--. P
DM
O R
elea
sed:
200
7-01
-29
(VER
IFY
REV
ISIO
N S
TATU
S)
NPOESS VIIRS VIIRS Vegetation Index (VVI)
Raytheon SRBS Document #: Y2400 79
4.0 ASSUMPTIONS AND LIMITATIONS 4.1 ASSUMPTIONS The following assumptions are made with respect to the retrievals described in this document: 1) The VIIRS Cloud Mask is sufficiently accurate to ensure both maximum coverage and minimum cloud contamination in the VVI products. 2) Geolocation, band to band registration and characterization of surface elevation and slope have been sufficiently parameterized to ensure minimal degradation of the input reflectances. 3) The VIIRS MTF and spectral response curves have been characterized to a sufficient degree to ensure minimal degradation of the input reflectances both spatially and spectrally. 4) Reliable information about surface type is available, either from the Surface Type EDR or from some other database, to ensure the appropriate selection of coefficients for determining LAI and FPAR, and subsequently PSN and NPP. 4.2 LIMITATIONS The following limitations apply to the at-launch retrievals of VVI daily products described in this document: 1) Retrievals will not be performed under nighttime conditions. This is defined as instances where the solar zenith angle exceeds 85 degrees. 2) Retrievals will be performed under confident cloudy conditions, including where correctable thin cirrus is present. 3) Retrievals will not be performed over ocean surfaces. 4) Retrievals of EVI and other surface parameters will be questionable under conditions of extreme aerosol loading, such as events associated with volcanic eruptions or biomass burning, and retrievals of EVI over snow are not guaranteed to meet the performance specification.

VIIRS Vegetation Index (VVI) NPOESS/VIIRS
80 SBRS Document #: Y2400 PD
MOD
4375
7, -
--. P
DM
O R
elea
sed:
200
7-01
-29
(VER
IFY
REV
ISIO
N S
TATU
S)

NPOESS/VIIRS VIIRS Vegetation Index (VVI)
5.0 REFERENCES
Deering, D.W. (1978). Rangeland reflectance characteristics measured by aircraft and spacecraft sensors. Ph.D. dissertation, Texas A&M University, College Station, TX. 338 pp.
Gausman, H.W. (1974). Leaf reflectance of near-infrared. Photogrammetric Engineering and Remote Sensing, 40, 183-192.
Gitelson, A.A., Y.J. Kaufman, and M.N. Merzlyak (1996). Use of a green channel in remote sensing of global vegetation from EOS-MODIS. Remote Sensing of Environment, 58, 289-298.
Howard, J.A. (1991). Remote sensing of forest resources. Chapman and Hall.
Hucks, J. (1998). VIIRS Testbed sensor modeling efforts, Phase I. Raytheon Systems Company Internal Memorandum Y1629.
Huete, A. (1988). A soil adjusted vegetation index (SAVI). Remote Sensing of Environment, 25, 295-309.
Huete, A., C. Justice, and W. van Leeuwen (1999). MODIS Vegetation Index (MOD13) Algorithm Theoretical Basis Document, Version 3.
Hutchinson, C.F. (1991). Use of satellite data for Famine Early Warning in sub-Saharan Africa. International Journal of Remote Sensing, 12, 1405-1421.
IPO (2000). Visible/Infrared Imager/Radiometer Suite (VIIRS) Sensor Requirements Document (SRD) for National Polar-Orbiting Operational Environmental Satellite System (NPOESS) spacecraft and sensors, Rev. 3. Prepared by Assoc. Directorate for Acquisition, NPOESS Integrated Program Office, Silver Spring, MD.
Kaufman, Y.J., and D. Tanre (1992). Atmospherically resistant vegetation index (ARVI) for EOS-MODIS. IEEE Transactions on Geoscience and Remote Sensing, 30, 261-270.
Keeling, C.D., R.B. Bacastow, A.F. Carter, S.C. Piper, T.P Whorf, M. Heimann, W.G. Mook, and H. Roeloffzen (1989). A three-dimensional model of atmospheric CO2 transport based on observed winds: 1. Analysis of observed data. Geophysical Monograph, 55, 165-236.
Keeling, C.D., T.P. Whorf, M. Wahlen, and J. Van der Plicht (1995). Interannual extremes in the rate of rise in atmospheric carbon dioxide since 1980. Nature, 375, 666-670.
Keeling, C.D., J.F.S. Chin, and T.P. Whorf (1996). Increased activity of northern vegetation inferred from atmospheric CO2 measurements. Nature, 382, 146-149.
SRBS Document #: Y2400 81 PD
MOD
4375
7, -
--. P
DM
O R
elea
sed:
200
7-01
-29
(VER
IFY
REV
ISIO
N S
TATU
S)

VIIRS Vegetation Index (VVI) NPOESS/VIIRS
Knyazikhin, Y., J. Glassy, J. L. Privette, Y. Tian, A. Lotsch, Y. Zhang, Y. Wang, J. T. Morisette, P.Votava, R.B. Myneni, R. R. Nemani, S. W. Running (1999). MODIS Leaf Area Index (LAI) and Fraction of Photosynthetically Active Radiation Absorbed by Vegetation (FPAR) Product (MOD15) Algorithm Theoretical Basis Document, http://eospso.gsfc.nasa.gov/atbd/modistables.html.
Liu, H. Q., and Huete, A. R. (1995). A feedback based modification of the NDVI to minimize canopy background and atmospheric noise, IEEE Trans. Geosci. Remote Sensing, 33:457-465.
Planet, W.G. (ed.), (1988). Data extraction and calibration of TIROS-N/NOAA radiometers. NOAA Technical Memorandum NESS 107 – Rev. 1, Oct. 1988. 130 pp.
Price, J.C. (1987). Calibration of satellite radiometers and the comparison of vegetation indices. Remote Sensing of Environment, 21, 15-27.
Prince, S.D., C.O. Justice, and B. Moore (1994). Remote sensing of NPP. IGBP DIS Working Paper #10, IGBP-DIS, Paris.
Prince, S.D. (1991). A model of regional primary production for use with coarse resolution satellite data. International Journal of Remote Sensing, 12, 1313-1330.
Prince, S.D and C.O. Justice (1991). (Editorial) Special issue on Coarse Resolution Remote Sensing of the Sahelian Environment. International Journal of Remote Sensing, 12, 1137-1146.
Running, S.W., R. Nemani, and J.M. Glassy (1996b). MOD17 PSN/NPP Algorithm Theoretical Basis Document, MODIS PSN (Net Photosynthesis) and MODIS NPP (Net Primary Productivity), Version 3.0.
Schimel, D.S. (1995). Terrestrial ecosystems and the carbon cycle. Glob. Change Biol., 1, 77-91.
Sellers, P.J., C.J. Tucker, G.J. Collatz, S. Los, C.O. Justice, D.A. Dazlich, and D.A. Randall (1994). A global 1 degree by 1 degree NDVI data set for climate studies. Part 2 – The adjustment of the NDVI and generation of global fields of terrestrial biophysical parameters. International Journal of Remote Sensing, 15, 3519-3545.
Tans, P.P., I.Y. Fung, C.D. Keeling, and R.H. Gammon (1986). Relationship between atmospheric CO2 variations and a satellite-derived vegetation index. Nature, 319, 195-199.
Vermote, E. F., and A. Vermeulen (1999). Spectral Reflectances (MOD09), MODIS Algorithm Theoretical Basis Document, Version 4.0.
82 SBRS Document #: Y2400 PD
MOD
4375
7, -
--. P
DM
O R
elea
sed:
200
7-01
-29
(VER
IFY
REV
ISIO
N S
TATU
S)