Embed Size (px)
Citation preview

Draft Agenda
Joint-State Columbia River Salmon Fishery Policy Review Committee (PRC) February 6, 2019 9 a.m. – 5 p.m.
Washington Fish and Wildlife Southwest Region 5525 S 11th Street, Ridgefield, WA
____________________________________________________________________________
9:00-9:30
1. Opening Remarks and Adoption of Agenda a. Opening Remarks b. Adoption of Agenda
Commissioners/Staff
Commissioners
9:30-2:30 Break at ~10:30 Working Lunch 12:00 – 12:45
2. 2019 Policies and Regulations a. Analysis and Discussion of the Four Options
Defined at the 1/17/18 Salem meeting. i. Transition Period Policies
1. Analysis resultsi 2. Implications discussion
ii. 2018 Status Quo Policies 1. Analysis results 2. Implications discussion
iii. No Loss of Economic Benefit Potential 1. Analysis results 2. Implications discussion
iv. Staff-developed Alternatives b. Voluntary Barbless Hooks and the Youngs Bay
Sanctuary c. Developing a Consolidated Recommendation
i. Proposals ii. Staff Analysis Tasking
Staff Commissioners
Staff
Commissioners
Staff Commissioners
Commissioners
Commissioners
2:30-4:00 Break at ~3:00
3. Policies and Regulations in 2020 and Beyond a. Prioritization of Ideas in Matrix b. Description of Range of Alternatives for
Analysis. c. Discussion of issues, next steps and staff
analysis tasking
Commissioners Commissioners
Commissioners
4:00-4:30 4. Future Process and Schedule a. Review of draft Process and Schedule
Document b. Discussion of Future Meeting Dates and
Process Expectations
Staff
Commissioners

Draft Agenda
4:30-5:00 5. Conclusionary Matters a. Review of Staff Assignments b. Review of Expectations for Next Meeting c. Closing Remarks
Staff/Commissioners
Commissioners Commissioners
i Analysis to include: 1) Written description of Option 2) Evaluation aligned with criteria identified at the January 17 PRC meeting
a. Meet or advance conservation goals b. Maintain or enhance the economic well-being of each fishery c. Promote orderly fisheries
3) Additional staff analysis elements/effects

Summary of Modelling Approach for Comparison of Policy Options
-Out-year projections for angler trips and commercial ex-vessel value are compared to expected values for these metrics in the absence of the Harvest Reform Policy.
-Out-year modelling results are not intended to be predictive, but instead provide a relative comparison to the expected baseline for different policy options.
-The "without policy" baselines for angler trips and ex-vessel value represent an average annual expectation for out-years, based on 2013-2018 observed results adjusted to what they would have been withpre-Reform (2010-2012 average) allocations and Select Area releases.
-Based on observed results from 2013-2018 (run sizes, angler trips, ex-vessel value, etc.), the model estimates fishery outcomes in out-years using various inputs with respect to ESA impact allocations,mainstem commercial gear types, and Select Area production levels.
1

Summary of Modelling Results for Policy Review Committee Fishery Scenarios (February 6, 2019)
Trips 350,362
$ EV $3,855,999$ LPII b $27,005,903
Scenario Metric 2019-2023 Avg 2024 2019-2023 Avg 2024Trips 349,709 349,709 2.8% 2.8%$ EV $4,303,964 $4,371,077 -13.0% -11.7%
$ LPII b $34,659,740 $34,772,228 -1.0% -0.7%
Trips 352,506 352,506 3.6% 3.6%$ EV $4,065,599 $4,581,953 -17.8% -7.4%
$ LPII b $34,470,705 $35,336,157 -1.5% 0.9%$35,006,928
Trips 356,109 356,109 4.7% 4.7%$ EV $3,022,334 $3,314,068 -38.9% -33.0%
$ LPII b $33,013,403 $33,502,373 -5.7% -4.3%
Trips 350,705 350,705 3.1% 3.1%$ EV $4,462,363 $4,978,717 -9.8% 0.6%
$ LPII b $34,990,068 $35,855,520 0.0% 2.4%
Trips 350,705 350,705 3.1% 3.1%$ EV $4,473,023 $4,989,378 -9.6% 0.8%
$ LPII b $35,007,935 $35,873,387 0.0% 2.5%
b Combined LPII for sport and commercial fisheries.
2012 Pre-Policy Baseline a
a Assumes static run sizes in future years
No Loss of Economic Benefit Potential #2
% Delta Relative to "No Policy" Baseline
Current Oregon Policy
Current Washington Policy
Freeze Transition (2016)
No Loss of Economic Benefit Potential #1
2

Option Model Inputs a Fishery Metric 2019 2020 2021 2022 2023 2024Sport Total Angler Trips 349,709 349,709 349,709 349,709 349,709 349,709
Without Policy Angler Trips 340,198 340,198 340,198 340,198 340,198 340,198Angler Trip ∆ 9,511 9,511 9,511 9,511 9,511 9,511Angler Trip ∆ % 2.8% 2.8% 2.8% 2.8% 2.8% 2.8%Local Personal Income Impact $27,445,948 $27,445,948 $27,445,948 $27,445,948 $27,445,948 $27,445,948
Commercial Total Ex-Vessel Value $4,229,789 $4,237,721 $4,394,477 $4,336,126 $4,321,705 $4,371,077Without Policy Ex-Vessel Value $4,948,463 $4,948,463 $4,948,463 $4,948,463 $4,948,463 $4,948,463Ex-Vessel Value ∆ ($718,673) ($710,742) ($553,985) ($612,337) ($626,757) ($577,385)Ex-Vessel Value ∆ % -14.5% -14.4% -11.2% -12.4% -12.7% -11.7%Local Personal Income Impact $7,089,470 $7,102,764 $7,365,500 $7,267,698 $7,243,528 $7,326,280
Combined Local Personal Income Impact $34,535,418 $34,548,712 $34,811,448 $34,713,646 $34,689,476 $34,772,228Mainstem Gillnet Spring Chinook $313,257 $313,257 $313,257 $313,257 $313,257 $313,257
Summer Chinook $153,809 $153,809 $153,809 $153,809 $153,809 $153,809Zone 4-5 Fall Chinook $1,581,695 $1,581,695 $1,581,695 $1,581,695 $1,581,695 $1,581,695Coho $96,427 $96,427 $96,427 $96,427 $96,427 $96,427
Select Area Gillnet Spring Chinook $996,017 $1,092,537 $1,222,113 $1,126,250 $1,066,346 $1,066,346Fall Chinook $219,083 $213,480 $221,779 $259,290 $304,774 $354,146Coho $788,774 $705,789 $724,671 $724,671 $724,671 $724,671
Mainstem Seine Beach Chinook/Coho $8,534 $8,534 $8,534 $8,534 $8,534 $8,534Purse Chinook/Coho $22,453 $22,453 $22,453 $22,453 $22,453 $22,453
Mainstem Tangle Net Coho $49,740 $49,740 $49,740 $49,740 $49,740 $49,740Total Commercial $4,229,789 $4,237,721 $4,394,477 $4,336,126 $4,321,705 $4,371,077Spring Spring Chinook 115,398 115,398 115,398 115,398 115,398 115,398Summer Summer Chinook 22,350 22,350 22,350 22,350 22,350 22,350Fall-Buoy 10 Fall Chinook/Coho 90,002 90,002 90,002 90,002 90,002 90,002Fall-Mainstem Fall Chinook/Coho 121,959 121,959 121,959 121,959 121,959 121,959Total Sport 349,709 349,709 349,709 349,709 349,709 349,709
Contribution to Total Sport Angler Trips by Fishery
Freeze Transition (2016)
Spring 30% allocation (pre-update commercial buffer), with pre-update mainstem tangle net and post-update tangle net/gillnet; Summer 30% with gillnets; Fall LRH tule/URB ≥30% with Zone 4-5 gillnet; beach and purse seine MSF (100%); Coho 6" gillnet (100%); Coho tangle net (100%); SAFE releases: 2018+ CHS brood @ 2.2M, 2020+ SAB brood @ 1.0M (Mitchell Act cap), 2018+ Coho brood @ 5.255M (Mitchell Act cap)Contribution to Total Commercial Ex-Vessel Value by Fishery
-Select Area releases of Coho, tule CHF, and Select Area Bright CHF are capped at 5.255M, 3.875M, and 1.0M, respectively, due to Mitchell Act production limitations. Expected ex-vessel values were adjusted down accordingly effective 2020 return year.-"Without Policy" angler trips and ex-vessel value represent the average number of trips and average ex-vessel value expected for 2013-2018 had the Harvest Reform Policy not been implemented. These averages are used athe baseline values for 2019-2024.-Local Personal Income Impact is a measure of the impact to local economies in the Oregon/Washington region associated with angler trips in the lower Columbia River sport fishery (e.g. gas, food, lodging, guide fees, etc.), and the impact to local economies of lower Columbia River commercially landed salmon (e.g. value to processors, wholesalers, etc.). Sport and commercial value multipliers from the 2016 Input-Output Pacific Fisheries (I-O PAC) model were applied to total angler trips and ex-vessel value for the respective fisheries. Different multipliers were applied to estimated guided and non-guided angler trips in the sport fishery.
a Percentage in parentheses for seine, Coho 6" gillnet, and Coho tangle net fisheries indicates modelled fishery scale relative to fisheries during 2013-2018.
3

1/31/2019
Option Model Inputs a Fishery Metric 2019 2020 2021 2022 2023 2024Sport Total Angler Trips 352,506 352,506 352,506 352,506 352,506 352,506
Without Policy Angler Trips 340,198 340,198 340,198 340,198 340,198 340,198Angler Trip ∆ 12,308 12,308 12,308 12,308 12,308 12,308Angler Trip ∆ % 3.6% 3.6% 3.6% 3.6% 3.6% 3.6%Local Personal Income Impact $27,656,432 $27,656,432 $27,656,432 $27,656,432 $27,656,432 $27,656,432
Commercial Total Ex-Vessel Value $3,762,010 $3,769,942 $3,926,698 $4,336,762 $4,532,581 $4,581,953Without Policy Ex-Vessel Value $4,948,463 $4,948,463 $4,948,463 $4,948,463 $4,948,463 $4,948,463Ex-Vessel Value ∆ ($1,186,452) ($1,178,521) ($1,021,764) ($611,701) ($415,882) ($366,509)Ex-Vessel Value ∆ % -24.0% -23.8% -20.6% -12.4% -8.4% -7.4%Local Personal Income Impact $6,305,434 $6,318,728 $6,581,464 $7,268,764 $7,596,973 $7,679,725
Combined Local Personal Income Impact $33,961,866 $33,975,160 $34,237,896 $34,925,196 $35,253,405 $35,336,157Mainstem Gillnet Spring Chinook $95,714 $95,714 $95,714 $95,714 $95,714 $95,714
Summer Chinook $0 $0 $0 $0 $0 $0Zone 4-5 Fall Chinook $1,581,695 $1,581,695 $1,581,695 $1,581,695 $1,581,695 $1,581,695Coho $0 $0 $0 $0 $0 $0
Select Area Gillnet Spring Chinook $996,017 $1,092,537 $1,222,113 $1,594,665 $1,745,000 $1,745,000Fall Chinook $219,083 $213,480 $221,779 $259,290 $304,774 $354,146Coho $788,774 $705,789 $724,671 $724,671 $724,671 $724,671
Mainstem Seine Beach Chinook/Coho $8,534 $8,534 $8,534 $8,534 $8,534 $8,534Purse Chinook/Coho $22,453 $22,453 $22,453 $22,453 $22,453 $22,453
Mainstem Tangle Net Coho $49,740 $49,740 $49,740 $49,740 $49,740 $49,740Total Commercial $3,762,010 $3,769,942 $3,926,698 $4,336,762 $4,532,581 $4,581,953Spring Spring Chinook 115,398 115,398 115,398 115,398 115,398 115,398Summer Summer Chinook 25,147 25,147 25,147 25,147 25,147 25,147Fall-Buoy 10 Fall Chinook/Coho 90,002 90,002 90,002 90,002 90,002 90,002Fall-Mainstem Fall Chinook/Coho 121,959 121,959 121,959 121,959 121,959 121,959Total Sport 352,506 352,506 352,506 352,506 352,506 352,506
Contribution to Total Sport Angler Trips by Fishery
-Select Area releases of Coho, tule CHF, and Select Area Bright CHF are capped at 5.255M, 3.875M, and 1.0M, respectively, due to Mitchell Act production limitations. Expected ex-vessel values were adjusted downaccordingly effective 2020 return year.
Spring 20% allocation (no commercial buffer), with mainstem post-update tangle net fishery if not all ESA impacts expected to be used in SAFE; Summer 20% with alternative gear (assumes 0 value if no approved gear); Fall LRH tule/URB ≥30% with Zone 4-5 gillnet; beach and purse seine MSF ((100% scale); limited to ≤2% of commercial impacts used for most constraining stock); No Coho 6" gillnet; Coho tangle net (100%); SAFE releases: 2018+ CHS brood @ 3.7M, 2020+ SAB brood @ 1.0M (Mitchell Act cap), 2018+ Coho brood @ 5.255M (Mitchell Act cap)Contribution to Total Commercial Ex-Vessel Value by Fishery
-Local Personal Income Impact is a measure of the impact to local economies in the Oregon/Washington region associated with angler trips in the lower Columbia River sport fishery (e.g. gas, food, lodging, guide fees, etc.),and the impact to local economies of lower Columbia River commercially landed salmon (e.g. value to processors, wholesalers, etc.). Sport and commercial value multipliers from the 2016 Input-Output Pacific Fisheries (I-OPAC) model were applied to total angler trips and ex-vessel value for the respective fisheries. Different multipliers were applied to estimated guided and non-guided angler trips in the sport fishery.
a Percentage in parentheses for seine, Coho 6" gillnet, and Coho tangle net fisheries indicates modelled fishery scale relative to fisheries during 2013-2018.
-"Without Policy" angler trips and ex-vessel value represent the average number of trips and average ex-vessel value expected for 2013-2018 had the Harvest Reform Policy not been implemented. These averages are used asthe baseline values for 2019-2024.
Current Oregon Policy
4
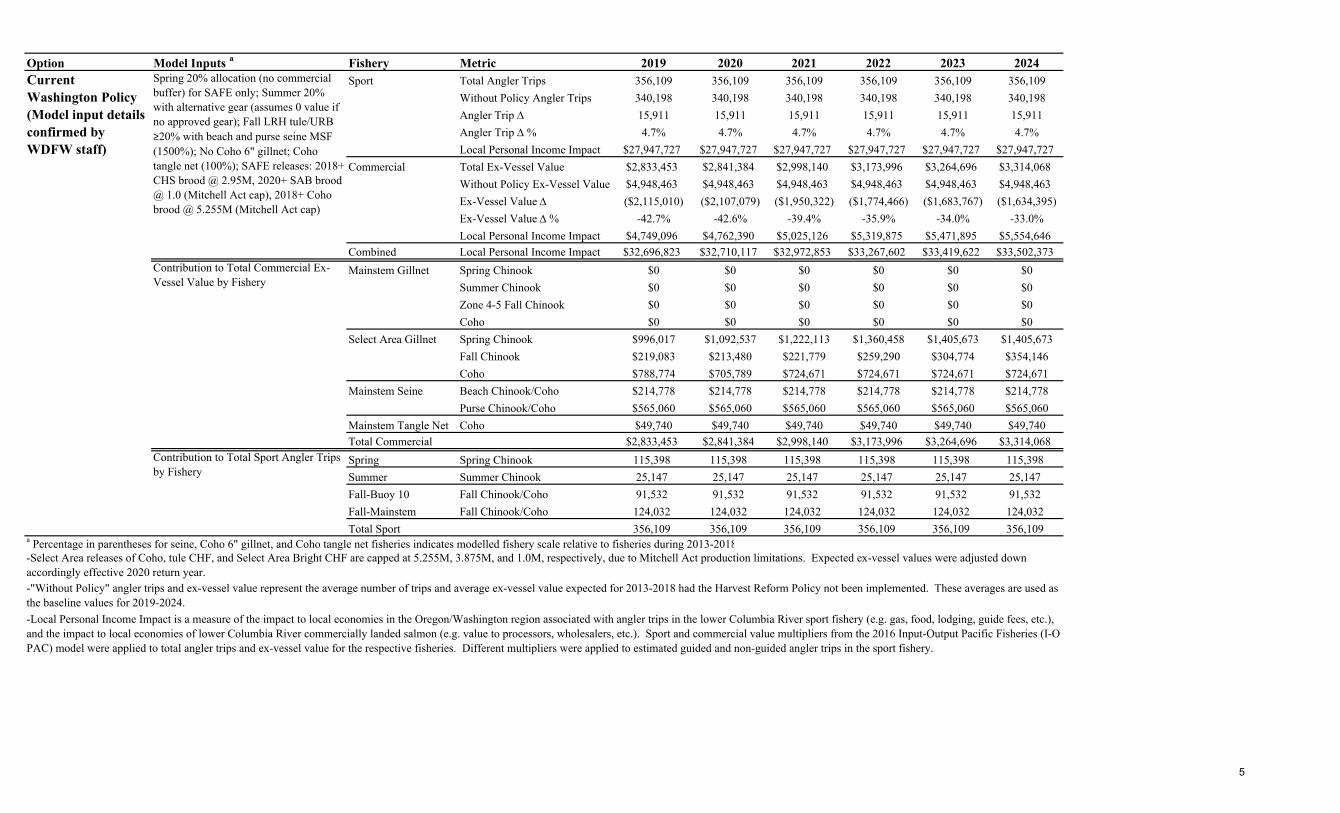
Option Model Inputs a Fishery Metric 2019 2020 2021 2022 2023 2024Sport Total Angler Trips 356,109 356,109 356,109 356,109 356,109 356,109
Without Policy Angler Trips 340,198 340,198 340,198 340,198 340,198 340,198Angler Trip ∆ 15,911 15,911 15,911 15,911 15,911 15,911Angler Trip ∆ % 4.7% 4.7% 4.7% 4.7% 4.7% 4.7%Local Personal Income Impact $27,947,727 $27,947,727 $27,947,727 $27,947,727 $27,947,727 $27,947,727
Commercial Total Ex-Vessel Value $2,833,453 $2,841,384 $2,998,140 $3,173,996 $3,264,696 $3,314,068Without Policy Ex-Vessel Value $4,948,463 $4,948,463 $4,948,463 $4,948,463 $4,948,463 $4,948,463Ex-Vessel Value ∆ ($2,115,010) ($2,107,079) ($1,950,322) ($1,774,466) ($1,683,767) ($1,634,395)Ex-Vessel Value ∆ % -42.7% -42.6% -39.4% -35.9% -34.0% -33.0%Local Personal Income Impact $4,749,096 $4,762,390 $5,025,126 $5,319,875 $5,471,895 $5,554,646
Combined Local Personal Income Impact $32,696,823 $32,710,117 $32,972,853 $33,267,602 $33,419,622 $33,502,373Mainstem Gillnet Spring Chinook $0 $0 $0 $0 $0 $0
Summer Chinook $0 $0 $0 $0 $0 $0Zone 4-5 Fall Chinook $0 $0 $0 $0 $0 $0Coho $0 $0 $0 $0 $0 $0
Select Area Gillnet Spring Chinook $996,017 $1,092,537 $1,222,113 $1,360,458 $1,405,673 $1,405,673Fall Chinook $219,083 $213,480 $221,779 $259,290 $304,774 $354,146Coho $788,774 $705,789 $724,671 $724,671 $724,671 $724,671
Mainstem Seine Beach Chinook/Coho $214,778 $214,778 $214,778 $214,778 $214,778 $214,778Purse Chinook/Coho $565,060 $565,060 $565,060 $565,060 $565,060 $565,060
Mainstem Tangle Net Coho $49,740 $49,740 $49,740 $49,740 $49,740 $49,740Total Commercial $2,833,453 $2,841,384 $2,998,140 $3,173,996 $3,264,696 $3,314,068Spring Spring Chinook 115,398 115,398 115,398 115,398 115,398 115,398Summer Summer Chinook 25,147 25,147 25,147 25,147 25,147 25,147Fall-Buoy 10 Fall Chinook/Coho 91,532 91,532 91,532 91,532 91,532 91,532Fall-Mainstem Fall Chinook/Coho 124,032 124,032 124,032 124,032 124,032 124,032Total Sport 356,109 356,109 356,109 356,109 356,109 356,109
Spring 20% allocation (no commercial buffer) for SAFE only; Summer 20% with alternative gear (assumes 0 value if no approved gear); Fall LRH tule/URB ≥20% with beach and purse seine MSF (1500%); No Coho 6" gillnet; Coho tangle net (100%); SAFE releases: 2018+ CHS brood @ 2.95M, 2020+ SAB brood @ 1.0 (Mitchell Act cap), 2018+ Coho brood @ 5.255M (Mitchell Act cap)
Contribution to Total Commercial Ex-Vessel Value by Fishery
Contribution to Total Sport Angler Trips by Fishery
-Local Personal Income Impact is a measure of the impact to local economies in the Oregon/Washington region associated with angler trips in the lower Columbia River sport fishery (e.g. gas, food, lodging, guide fees, etc.),and the impact to local economies of lower Columbia River commercially landed salmon (e.g. value to processors, wholesalers, etc.). Sport and commercial value multipliers from the 2016 Input-Output Pacific Fisheries (I-OPAC) model were applied to total angler trips and ex-vessel value for the respective fisheries. Different multipliers were applied to estimated guided and non-guided angler trips in the sport fishery.
-"Without Policy" angler trips and ex-vessel value represent the average number of trips and average ex-vessel value expected for 2013-2018 had the Harvest Reform Policy not been implemented. These averages are used asthe baseline values for 2019-2024.
-Select Area releases of Coho, tule CHF, and Select Area Bright CHF are capped at 5.255M, 3.875M, and 1.0M, respectively, due to Mitchell Act production limitations. Expected ex-vessel values were adjusted downaccordingly effective 2020 return year.
Current Washington Policy (Model input details confirmed by WDFW staff)
a Percentage in parentheses for seine, Coho 6" gillnet, and Coho tangle net fisheries indicates modelled fishery scale relative to fisheries during 2013-2018
5

Option Model Inputs a, b Fishery Metric 2019 2020 2021 2022 2023 2024Sport Total Angler Trips 350,705 350,705 350,705 350,705 350,705 350,705
Without Policy Angler Trips 340,198 340,198 340,198 340,198 340,198 340,198Angler Trip ∆ 10,507 10,507 10,507 10,507 10,507 10,507Angler Trip ∆ % 3.1% 3.1% 3.1% 3.1% 3.1% 3.1%Local Personal Income Impact $27,510,786 $27,510,786 $27,510,786 $27,510,786 $27,510,786 $27,510,786
Commercial Total Ex-Vessel Value $4,158,775 $4,166,706 $4,323,462 $4,733,526 $4,929,345 $4,978,717Without Policy Ex-Vessel Value $4,948,463 $4,948,463 $4,948,463 $4,948,463 $4,948,463 $4,948,463Ex-Vessel Value ∆ ($789,688) ($781,756) ($625,000) ($214,937) ($19,117) $30,255Ex-Vessel Value ∆ % -16.0% -15.8% -12.6% -4.3% -0.4% 0.6%Local Personal Income Impact $6,970,443 $6,983,737 $7,246,473 $7,933,773 $8,261,982 $8,344,734
Combined Local Personal Income Impact $34,481,229 $34,494,523 $34,757,259 $35,444,559 $35,772,768 $35,855,520Mainstem Gillnet Spring Chinook $171,080 $171,080 $171,080 $171,080 $171,080 $171,080
Summer Chinook $0 $0 $0 $0 $0 $0Zone 4-5 Fall Chinook $1,885,867 $1,885,867 $1,885,867 $1,885,867 $1,885,867 $1,885,867Coho $48,214 $48,214 $48,214 $48,214 $48,214 $48,214
Select Area Gillnet Spring Chinook $996,017 $1,092,537 $1,222,113 $1,594,665 $1,745,000 $1,745,000Fall Chinook $219,083 $213,480 $221,779 $259,290 $304,774 $354,146Coho $788,774 $705,789 $724,671 $724,671 $724,671 $724,671
Mainstem Seine Beach Chinook/Coho $0 $0 $0 $0 $0 $0Purse Chinook/Coho $0 $0 $0 $0 $0 $0
Mainstem Tangle Net Coho $49,740 $49,740 $49,740 $49,740 $49,740 $49,740Total Commercial $4,158,775 $4,166,706 $4,323,462 $4,733,526 $4,929,345 $4,978,717Spring Spring Chinook 115,398 115,398 115,398 115,398 115,398 115,398Summer Summer Chinook 25,147 25,147 25,147 25,147 25,147 25,147Fall-Buoy 10 Fall Chinook/Coho 89,237 89,237 89,237 89,237 89,237 89,237Fall-Mainstem Fall Chinook/Coho 120,922 120,922 120,922 120,922 120,922 120,922Total Sport 350,705 350,705 350,705 350,705 350,705 350,705
Contribution to Total Sport Angler Trips by Fishery
a Percentage in parentheses for seine, Coho 6" gillnet, and Coho tangle net fisheries indicates modelled fishery scale relative to fisheries during 2013-2018.
No Loss of Economic Benefit Potential #1
Spring 25% allocation (no commercial buffer), with mainstem post-update tangle net fishery if not all ESA impacts expected to be used in SAFE; Summer 5% for SAFE only; Fall LRH tule/URB ≥35% with Zone 4-5 gillnet; no seine; Coho 6" gillnet (50%); Coho tangle net (100%); SAFE releases: 2018+ CHS brood @3.7M, 2020+ SAB brood @ 1.0M (Mitchell Act cap), 2018+ Coho brood @ 5.255M (Mitchell Act cap)
-"Without Policy" angler trips and ex-vessel value represent the average number of trips and average ex-vessel value expected for 2013-2018 had the Harvest Reform Policy not been implemented. These averages are used as the baseline values for 2019-2024.-Local Personal Income Impact is a measure of the impact to local economies in the Oregon/Washington region associated with angler trips in the lower Columbia River sport fishery (e.g. gas, food, lodging, guide fees, etc.)and the impact to local economies of lower Columbia River commercially landed salmon (e.g. value to processors, wholesalers, etc.). Sport and commercial value multipliers from the 2016 Input-Output Pacific Fisheries (I-O PAC) model were applied to total angler trips and ex-vessel value for the respective fisheries. Different multipliers were applied to estimated guided and non-guided angler trips in the sport fishery.
b Model inputs for commercial allocations and allowable gears were adjusted to achieve no commercial economic loss when Select Area production enhancements are fully realized (2024).
Contribution to Total Commercial Ex-Vessel Value by Fishery
-Select Area releases of Coho, tule CHF, and Select Area Bright CHF are capped at 5.255M, 3.875M, and 1.0M, respectively, due to Mitchell Act production limitations. Expected ex-vessel values were adjusted down accordingly effective 2020 return year.
6

Option Model Inputs a, b Fishery Metric 2019 2020 2021 2022 2023 2024Sport Total Angler Trips 350,705 350,705 350,705 350,705 350,705 350,705
Without Policy Angler Trips 340,198 340,198 340,198 340,198 340,198 340,198Angler Trip ∆ 10,507 10,507 10,507 10,507 10,507 10,507Angler Trip ∆ % 3.1% 3.1% 3.1% 3.1% 3.1% 3.1%Local Personal Income Impact $27,510,786 $27,510,786 $27,510,786 $27,510,786 $27,510,786 $27,510,786
Commercial Total Ex-Vessel Value $4,169,435 $4,177,366 $4,334,123 $4,744,186 $4,940,006 $4,989,378Without Policy Ex-Vessel Value $4,948,463 $4,948,463 $4,948,463 $4,948,463 $4,948,463 $4,948,463Ex-Vessel Value ∆ ($779,028) ($771,096) ($614,340) ($204,276) ($8,457) $40,915Ex-Vessel Value ∆ % -15.7% -15.6% -12.4% -4.1% -0.2% 0.8%Local Personal Income Impact $6,988,311 $7,001,605 $7,264,341 $7,951,641 $8,279,850 $8,362,601
Combined Local Personal Income Impact $34,499,097 $34,512,391 $34,775,127 $35,462,427 $35,790,636 $35,873,387Mainstem Gillnet Spring Chinook $0 $0 $0 $0 $0 $0
Summer Chinook $102,540 $102,540 $102,540 $102,540 $102,540 $102,540Zone 4-5 Fall Chinook $1,885,867 $1,885,867 $1,885,867 $1,885,867 $1,885,867 $1,885,867Coho $96,427 $96,427 $96,427 $96,427 $96,427 $96,427
Select Area Gillnet Spring Chinook $996,017 $1,092,537 $1,222,113 $1,594,665 $1,745,000 $1,745,000Fall Chinook $219,083 $213,480 $221,779 $259,290 $304,774 $354,146Coho $788,774 $705,789 $724,671 $724,671 $724,671 $724,671
Mainstem Seine Beach Chinook/Coho $8,534 $8,534 $8,534 $8,534 $8,534 $8,534Purse Chinook/Coho $22,453 $22,453 $22,453 $22,453 $22,453 $22,453
Mainstem Tangle Net Coho $49,740 $49,740 $49,740 $49,740 $49,740 $49,740Total Commercial $4,169,435 $4,177,366 $4,334,123 $4,744,186 $4,940,006 $4,989,378Spring Spring Chinook 115,398 115,398 115,398 115,398 115,398 115,398Summer Summer Chinook 25,147 25,147 25,147 25,147 25,147 25,147Fall-Buoy 10 Fall Chinook/Coho 89,237 89,237 89,237 89,237 89,237 89,237Fall-Mainstem Fall Chinook/Coho 120,922 120,922 120,922 120,922 120,922 120,922Total Sport 350,705 350,705 350,705 350,705 350,705 350,705
-Local Personal Income Impact is a measure of the impact to local economies in the Oregon/Washington region associated with angler trips in the lower Columbia River sport fishery (e.g. gas, food, lodging, guide fees, etc.),and the impact to local economies of lower Columbia River commercially landed salmon (e.g. value to processors, wholesalers, etc.). Sport and commercial value multipliers from the 2016 Input-Output Pacific Fisheries (I-OPAC) model were applied to total angler trips and ex-vessel value for the respective fisheries. Different multipliers were applied to estimated guided and non-guided angler trips in the sport fishery.
No Loss of Economic Benefit Potential #2
Spring 20% allocation (no commercial buffer) for SAFE only; Summer 20% with gillnets; Fall LRH tule/URB ≥35% with Zone 4-5 gillnet; beach and purse seine MSF (100%); Coho 6" gillnet (100%); Coho tangle net (100%); SAFE releases: 2018+ CHS brood @ 3.7M, 2020+ SAB brood @ 1.0M (Mitchell Act cap), 2018+ Coho brood @ 5.255M (Mitchell Act cap)
-"Without Policy" angler trips and ex-vessel value represent the average number of trips and average ex-vessel value expected for 2013-2018 had the Harvest Reform Policy not been implemented. These averages are used asthe baseline values for 2019-2024.
Contribution to Total Commercial Ex-Vessel Value by Fishery
a Percentage in parentheses for seine, Coho 6" gillnet, and Coho tangle net fisheries indicates modelled fishery scale relative to fisheries during 2013-2018.
Contribution to Total Sport Angler Trips by Fishery
b Model inputs for commercial allocations and allowable gears were adjusted to achieve no commercial economic loss when Select Area production enhancements are fully realized (2024).-Select Area releases of Coho, tule CHF, and Select Area Bright CHF are capped at 5.255M, 3.875M, and 1.0M, respectively, due to Mitchell Act production limitations. Expected ex-vessel values were adjusted downaccordingly effective 2020 return year.
7
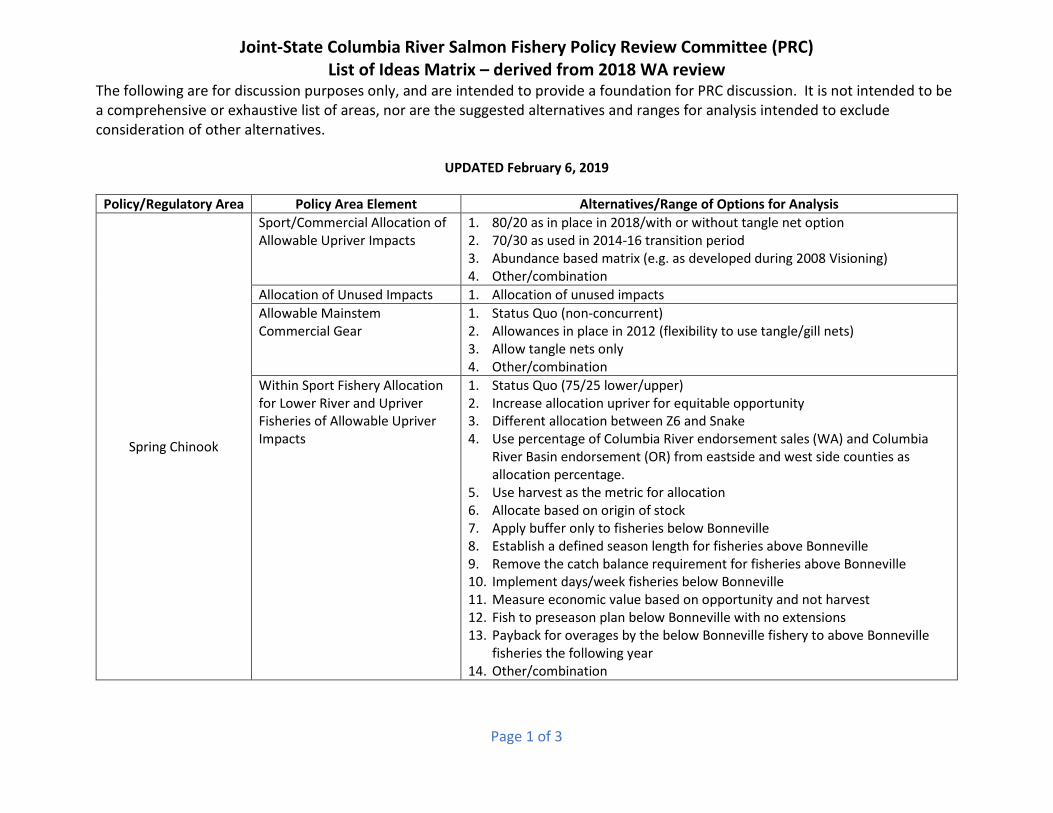
Joint-State Columbia River Salmon Fishery Policy Review Committee (PRC) List of Ideas Matrix – derived from 2018 WA review
The following are for discussion purposes only, and are intended to provide a foundation for PRC discussion. It is not intended to be a comprehensive or exhaustive list of areas, nor are the suggested alternatives and ranges for analysis intended to exclude consideration of other alternatives.
Page 1 of 3
UPDATED February 6, 2019
Policy/Regulatory Area Policy Area Element Alternatives/Range of Options for Analysis
Spring Chinook
Sport/Commercial Allocation of Allowable Upriver Impacts
1. 80/20 as in place in 2018/with or without tangle net option 2. 70/30 as used in 2014-16 transition period 3. Abundance based matrix (e.g. as developed during 2008 Visioning) 4. Other/combination
Allocation of Unused Impacts 1. Allocation of unused impacts Allowable Mainstem Commercial Gear
1. Status Quo (non-concurrent) 2. Allowances in place in 2012 (flexibility to use tangle/gill nets) 3. Allow tangle nets only 4. Other/combination
Within Sport Fishery Allocation for Lower River and Upriver Fisheries of Allowable Upriver Impacts
1. Status Quo (75/25 lower/upper) 2. Increase allocation upriver for equitable opportunity 3. Different allocation between Z6 and Snake 4. Use percentage of Columbia River endorsement sales (WA) and Columbia
River Basin endorsement (OR) from eastside and west side counties as allocation percentage.
5. Use harvest as the metric for allocation 6. Allocate based on origin of stock 7. Apply buffer only to fisheries below Bonneville 8. Establish a defined season length for fisheries above Bonneville 9. Remove the catch balance requirement for fisheries above Bonneville 10. Implement days/week fisheries below Bonneville 11. Measure economic value based on opportunity and not harvest 12. Fish to preseason plan below Bonneville with no extensions 13. Payback for overages by the below Bonneville fishery to above Bonneville
fisheries the following year 14. Other/combination
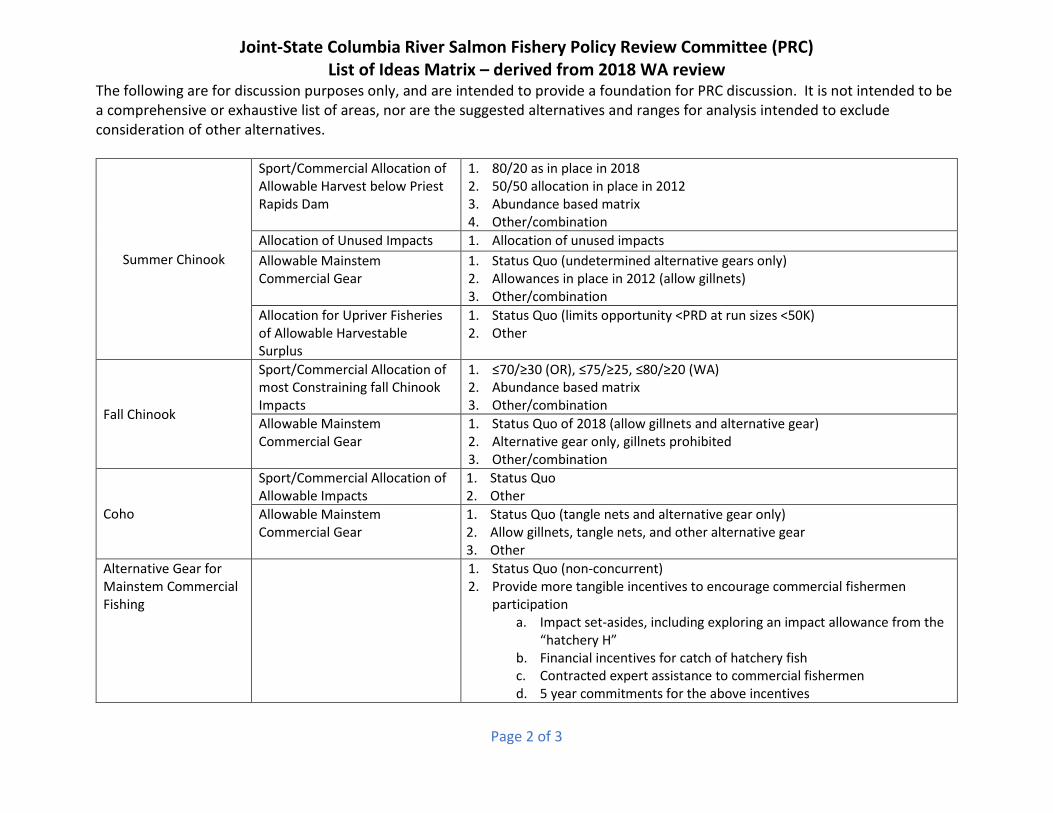
Joint-State Columbia River Salmon Fishery Policy Review Committee (PRC) List of Ideas Matrix – derived from 2018 WA review
The following are for discussion purposes only, and are intended to provide a foundation for PRC discussion. It is not intended to be a comprehensive or exhaustive list of areas, nor are the suggested alternatives and ranges for analysis intended to exclude consideration of other alternatives.
Page 2 of 3
Summer Chinook
Sport/Commercial Allocation of Allowable Harvest below Priest Rapids Dam
1. 80/20 as in place in 2018 2. 50/50 allocation in place in 2012 3. Abundance based matrix 4. Other/combination
Allocation of Unused Impacts 1. Allocation of unused impacts Allowable Mainstem Commercial Gear
1. Status Quo (undetermined alternative gears only) 2. Allowances in place in 2012 (allow gillnets) 3. Other/combination
Allocation for Upriver Fisheries of Allowable Harvestable Surplus
1. Status Quo (limits opportunity <PRD at run sizes <50K) 2. Other
Fall Chinook
Sport/Commercial Allocation of most Constraining fall Chinook Impacts
1. ≤70/≥30 (OR), ≤75/≥25, ≤80/≥20 (WA) 2. Abundance based matrix 3. Other/combination
Allowable Mainstem Commercial Gear
1. Status Quo of 2018 (allow gillnets and alternative gear) 2. Alternative gear only, gillnets prohibited 3. Other/combination
Coho
Sport/Commercial Allocation of Allowable Impacts
1. Status Quo 2. Other
Allowable Mainstem Commercial Gear
1. Status Quo (tangle nets and alternative gear only) 2. Allow gillnets, tangle nets, and other alternative gear 3. Other
Alternative Gear for Mainstem Commercial Fishing
1. Status Quo (non-concurrent) 2. Provide more tangible incentives to encourage commercial fishermen
participation a. Impact set-asides, including exploring an impact allowance from the
“hatchery H” b. Financial incentives for catch of hatchery fish c. Contracted expert assistance to commercial fishermen d. 5 year commitments for the above incentives

Joint-State Columbia River Salmon Fishery Policy Review Committee (PRC) List of Ideas Matrix – derived from 2018 WA review
The following are for discussion purposes only, and are intended to provide a foundation for PRC discussion. It is not intended to be a comprehensive or exhaustive list of areas, nor are the suggested alternatives and ranges for analysis intended to exclude consideration of other alternatives.
Page 3 of 3
3. Hire a conservation expert to assist in development 4. Consider tributary locations 5. Note: Need to determine where steelhead impacts will come from
Buyback Program for Commercial Fishing Licenses
1. Need to make progress on buyback by prioritizing, planning and budgeting
SAFE Fisheries SAFE Area enhancements and production
1. Explore new SAFE areas and strategies in Washington 2. Evaluate Coal Creek as identified by OR review 3. Prioritize achievement of target SAFE production goals.
Hatchery Production Goals
Not included in current Policy 1. Continue to produce sufficient hatchery fish for all fisheries 2. Include hatchery production goals in the Policy
Analysis of Options Elements of Analysis to be included
1. Include analysis of socio-economic impacts to smaller communities prior to policy document decision-making. This would likely require services of an economist.
2. Include more interface with Regional Recovery Boards prior to policy document decision-making.
3. Include comparisons to pre-2013 Columbia River Policy period. Language adjustments to the WA Policy C-3620 and/or OR written policy provisions
1. Policy Purpose Statement 2. Conservation
Statement/Definition Clarity 3. Adaptive Management
Definition Clarity
1. Need policy decisions on draft alternatives for language changes for these, if any.
Other Limitation on Sport Fishery Guide Licenses/Impacts
1. Status Quo 2. OR limits guides to match WA 3. WA relaxes restriction to match OR 4. Set guide license limits to 2012 levels 5. Fishery regulations 6. Other
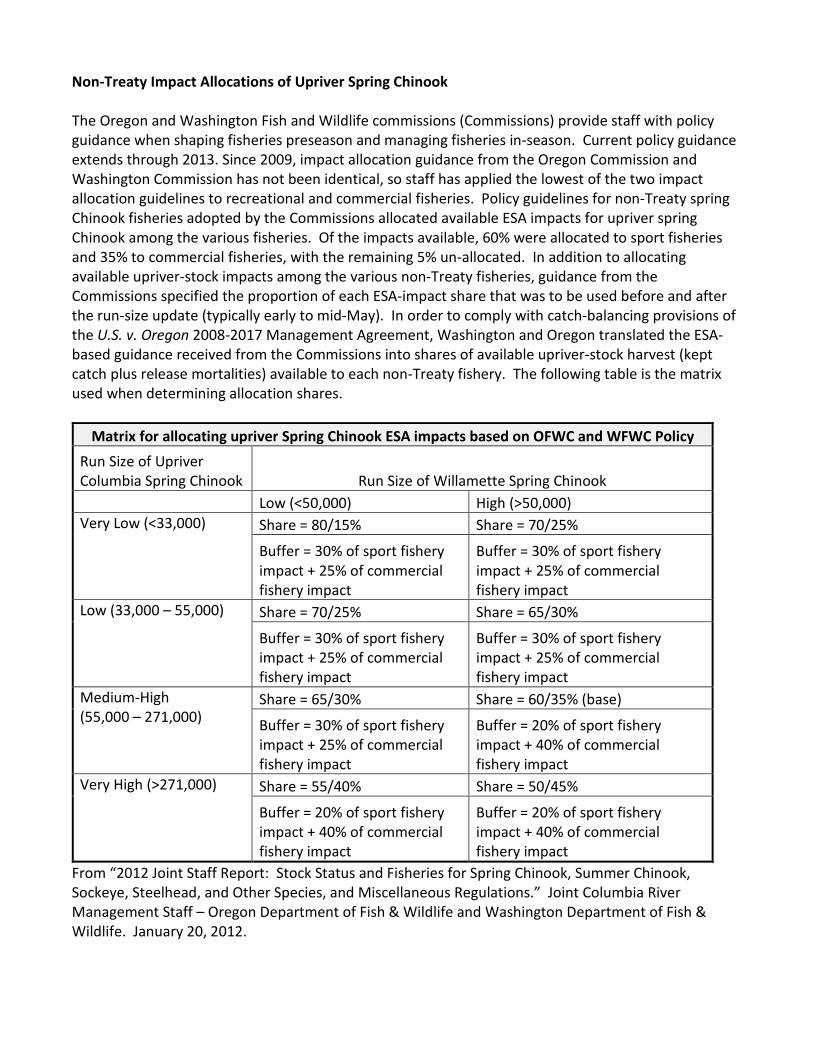
Non-Treaty Impact Allocations of Upriver Spring Chinook The Oregon and Washington Fish and Wildlife commissions (Commissions) provide staff with policy guidance when shaping fisheries preseason and managing fisheries in-season. Current policy guidance extends through 2013. Since 2009, impact allocation guidance from the Oregon Commission and Washington Commission has not been identical, so staff has applied the lowest of the two impact allocation guidelines to recreational and commercial fisheries. Policy guidelines for non-Treaty spring Chinook fisheries adopted by the Commissions allocated available ESA impacts for upriver spring Chinook among the various fisheries. Of the impacts available, 60% were allocated to sport fisheries and 35% to commercial fisheries, with the remaining 5% un-allocated. In addition to allocating available upriver-stock impacts among the various non-Treaty fisheries, guidance from the Commissions specified the proportion of each ESA-impact share that was to be used before and after the run-size update (typically early to mid-May). In order to comply with catch-balancing provisions of the U.S. v. Oregon 2008-2017 Management Agreement, Washington and Oregon translated the ESA-based guidance received from the Commissions into shares of available upriver-stock harvest (kept catch plus release mortalities) available to each non-Treaty fishery. The following table is the matrix used when determining allocation shares.
Matrix for allocating upriver Spring Chinook ESA impacts based on OFWC and WFWC Policy Run Size of Upriver Columbia Spring Chinook Run Size of Willamette Spring Chinook
Low (<50,000) High (>50,000) Very Low (<33,000) Share = 80/15% Share = 70/25%
Buffer = 30% of sport fishery impact + 25% of commercial fishery impact
Buffer = 30% of sport fishery impact + 25% of commercial fishery impact
Low (33,000 – 55,000) Share = 70/25% Share = 65/30%
Buffer = 30% of sport fishery impact + 25% of commercial fishery impact
Buffer = 30% of sport fishery impact + 25% of commercial fishery impact
Medium-High (55,000 – 271,000)
Share = 65/30% Share = 60/35% (base)
Buffer = 30% of sport fishery impact + 25% of commercial fishery impact
Buffer = 20% of sport fishery impact + 40% of commercial fishery impact
Very High (>271,000) Share = 55/40% Share = 50/45%
Buffer = 20% of sport fishery impact + 40% of commercial fishery impact
Buffer = 20% of sport fishery impact + 40% of commercial fishery impact
From “2012 Joint Staff Report: Stock Status and Fisheries for Spring Chinook, Summer Chinook, Sockeye, Steelhead, and Other Species, and Miscellaneous Regulations.” Joint Columbia River Management Staff – Oregon Department of Fish & Wildlife and Washington Department of Fish & Wildlife. January 20, 2012.

Draft
Page 1 of 2
Joint State Columbia River Salmon Fishery Policy Review Committee (PRC) Process and Schedule
January 30, 2019 Detailed Process and Schedule
2018 November 1 Joint Commission Meeting, Vancouver, WA
November 15 WA ‘Comprehensive Evaluation of the Columbia River Basin Salmon Management Policy C-3620, 2013-17’ finalized
2019 January 15 OR draft ‘Summary and Analysis of Columbia River Harvest
Reform Activities 2009-17’ shared January 17 Meeting #1 – PRC meeting in Salem, OR
• Process established (i.e., chair, order, public, timeframe)
• Initial 2019 options developed for analysis • 2020 and beyond modification discussion
January 25 WA Commission conference call – PRC update February 1 Provide February 6 materials to PRC February 6 Meeting #2 – PRC meeting in Ridgefield, WA
• Primary focus on analysis of options for 2019 • Secondary focus on policy and regulatory matters for
2020 and beyond modification o Complete full listing of ideas o Culling/narrowing of candidate ideas
February 7-8 OR Commission meeting – Portland, OR February 8-9 WA Commission meeting – Olympia, WA February 22 Provide February 26 materials to PRC February 26 Meeting #3 – PRC meeting in Salem, OR
• Continue primary focus on 2019 policies and regulations
o Strive for a single recommendation • Potentially finalize recommendations for 2019 to
present to full commissions • Continue discussion of 2020 and beyond
o Develop a range of options for each appropriate issue, for staff analysis
March 1-2 WA Commission meeting – Spokane WA • PRC members potentially present recommendations for
2019 March 7-12 Pacific Fishery Management Council #1, Vancouver, WA
March 8 Provide March 14 materials to PRC
Draft
Page 2 of 2
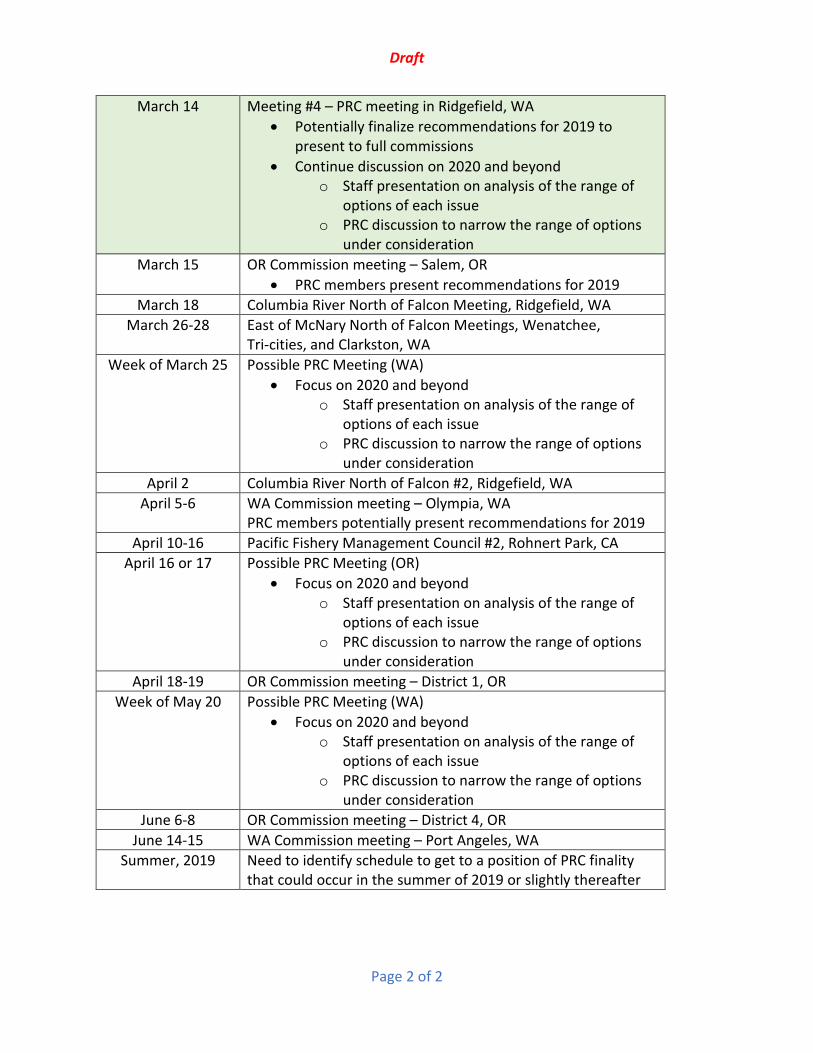
March 14 Meeting #4 – PRC meeting in Ridgefield, WA • Potentially finalize recommendations for 2019 to
present to full commissions • Continue discussion on 2020 and beyond
o Staff presentation on analysis of the range of options of each issue
o PRC discussion to narrow the range of options under consideration
March 15 OR Commission meeting – Salem, OR • PRC members present recommendations for 2019
March 18 Columbia River North of Falcon Meeting, Ridgefield, WA March 26-28 East of McNary North of Falcon Meetings, Wenatchee,
Tri-cities, and Clarkston, WA Week of March 25 Possible PRC Meeting (WA)
• Focus on 2020 and beyond o Staff presentation on analysis of the range of
options of each issue o PRC discussion to narrow the range of options
under consideration April 2 Columbia River North of Falcon #2, Ridgefield, WA
April 5-6 WA Commission meeting – Olympia, WA PRC members potentially present recommendations for 2019
April 10-16 Pacific Fishery Management Council #2, Rohnert Park, CA April 16 or 17 Possible PRC Meeting (OR)
• Focus on 2020 and beyond o Staff presentation on analysis of the range of
options of each issue o PRC discussion to narrow the range of options
under consideration April 18-19 OR Commission meeting – District 1, OR
Week of May 20 Possible PRC Meeting (WA) • Focus on 2020 and beyond
o Staff presentation on analysis of the range of options of each issue
o PRC discussion to narrow the range of options under consideration
June 6-8 OR Commission meeting – District 4, OR June 14-15 WA Commission meeting – Port Angeles, WA
Summer, 2019 Need to identify schedule to get to a position of PRC finality that could occur in the summer of 2019 or slightly thereafter

Joint-State Columbia River Salmon Fishery Policy Review Committee February 6, 2019 Meeting Summary 1
Joint-State Columbia River Fishery Policy Review Committee February 6, 2019
9am to 5pm Location: WDFW Region 5 Office, Ridgefield WA
Meeting Summary Notes and Decisions ATTENDANCE: Holly Akenson – ODFW Commissioner Bruce Buckmaster – ODFW Commissioner Bob Webber – ODFW Commissioner Curt Melcher – ODFW Director Ed Bowles – ODFW Staff Tucker Jones – ODFW Staff Chris Kern – ODFW Staff April Mack – ODFW Staff John North – ODFW Staff Michelle Tate – ODFW Staff
Anika Marriot – OR AG office David Graybill – WDFW Commissioner Bob Kehoe – WDFW Commissioner Don McIsaac – WDFW Commissioner Myrtice Dobler – WDFW Staff Cindy Lefleur – WDFW Staff Tami Lininger – WDFW Staff Ryan Lothrop – WDFW Staff Ron Warren – WDFW Staff
Opening Remarks and Adoption of the Agenda The over-arching goal of the PRC as shown in the meeting summary notes of the January 17 meeting, was reiterated: • The overarching goal is to achieve concurrent policies and regulations for 2019 and beyond:
o First step: Focus on the 2019 season, to have concurrency prior to the start of the North of Falcon process in mid-March
o Secondary priority: continue the dialogue on the long term beyond 2019 and make this the primary focus after mid-March
The draft agenda was adopted as the working agenda of the meeting without change (attached). 2019 Policies and Regulations Analysis of Options Analysis of three new policy options were to be discussed in terms of the evaluation criteria agreed to at the January 17, 2019 PRC meeting in Salem, in comparison to the base period of 2010-2012 prior to the major change in policy approach that occurred in 2013 (the “pre-policy” base period). The evaluation criteria for the Policy Review Committee were the purpose/goals stated in the Washington policy document: 1) the ability to meet or advance conservation goals; 2) the ability to conduct orderly fisheries; and 3) the ability to advance the economic well-being of both the sport and commercial fishing industries. Additionally, Oregon has a statutory requirement to optimize fishery benefits for the State of Oregon. The fishery metrics within the economic criteria for sport fisheries was angler trips and for commercial fisheries was ex-vessel value. The model outputs also show Local Personal

Joint-State Columbia River Salmon Fishery Policy Review Committee February 6, 2019 Meeting Summary 2
Income Impact, a metric that describes the broader economic impact of the fisheries to the region. Option 1: Transition Period Policies
• In a discussion of refining the written description of this option, it was determined that the intent of this option is to freeze the policies in place during transition year of 2016, together with the suite of enhanced Oregon SAFE area hatchery production releases that were added to the March 2017 rules adopted by the Oregon Fish and Wildlife Commission.
• Initial modeling results of the sport and commercial fishery metrics of Option 1 were reviewed for 2019, as well as out years to 2024, and adjusted during the course of the meeting. Modeling results will be reviewed and verified for presentation at the next meeting.
Evaluation of Option 1 under the three criteria showed the following:
• Conservation o The ability to achieve conservation goals under Option 1 would be essentially the
same as without changes brought forth by the new policy approach in 2013, and the same as Option 2 and Option 3.
• Orderly Fisheries o Staff indicated that evaluation of a particular policy approach in terms of the
ability to conduct orderly fisheries was dependent upon the concurrency of the policies in the two states, not the details of individual model runs or policy options. Thus, in a manner similar to the conservation criteria, there would be no difference between Options 1 and the pre-policy base period, or Options 2 and 3 with regard to the ability to conduct orderly fisheries—so long as there is concurrency in policy between the States.
• Economics o As modelled for the meeting sport fishery angler trips under Option 1 for 2019-
2024 would be collectively slightly better ~3% in comparison to the pre-policy base period, with slight increases for spring chinook and fall chinook seasons, and no change for summer chinook seasons.
o Commercial fishery ex-vessel values would be ~15% worse in 2019 than the pre-policy base period allocations; modeling detail showed substantially reduced values in mainstem areas (~67% of base), but improved values in SAFE areas. However, with increased releases in SAFE areas, total commercial fishery economic benefits could show a slight increase of ~2% by 2024.
Option 2: 2018 Status Quo
• In a discussion of refining the written description of this option, it was determined that the intent of this option is to replicate the 2018 Washington policy, not the concurrent actual regulations negotiated to be in effect in 2018. The key difference is the sharing of

Joint-State Columbia River Salmon Fishery Policy Review Committee February 6, 2019 Meeting Summary 3
the most limiting fall chinook impacts (a commercial allocation of ≥25% is the 2018 Washington policy; ≥30% is how fisheries were managed in 2018). This option should be retitled “2018 Washington Policies” for future analytical work, to reduce any confusion with actual 2018 status quo seasons.
• Impromptu modeling of this clarified option was done during the meeting and will need to be confirmed for review at the next meeting.
Evaluation of Option 2 in comparison to the 2010-2012 base period under the three criteria showed the following:
• Policy performance under the conservation and orderly fisheries criteria showed no difference with the base period or Options 1 and 3, as noted above.
• Economics o As modelled for the meeting, sport fishery angler trips under Option 2 for 2019-
2024 would be collectively slightly better (~4%) in comparison to the base period allocations and production, with most of the difference with Option 1 due to increased angler trips in the summer chinook season.
o Commercial fishery ex-vessel values would be more than 30% less in 2019 than base period policies; modeling detail showed substantially worse values in mainstem areas (~-40% of base), but 15% better values in SAFE areas. Modeling of out years to 2024 still showed negative comparative ex-vessel values in excess of ~20%, even with increased releases in SAFE areas.
Option 3: No Loss of Economic Benefit Potential
• The January 17 PRC meeting notes describe this option as “…allocations and gear types that provide for no economic loss to the commercial fishery across a full season…” (compared to base period policy allocations and SAFE production). Noting there could be many ways to refine a written description of this option, the PRC had asked the staff to attempt a description.
• Staff modeled two sub-options for review to illustrate that different approaches could be taken to achieve this outcome. Modeling assumptions for commercial fisheries ranged from 20%-25% for spring chinook, 0%-20% for summer chinook, ≥35% for the most limiting fall chinook stock, and various other gear and area restriction assumptions.
Evaluation of Option 3 in comparison to the 2010-2012 base period under the three criteria showed the following:
• Policy performance under the conservation and orderly fisheries criteria showed no difference with the base period or Options 1 and 2, as noted above.

Joint-State Columbia River Salmon Fishery Policy Review Committee February 6, 2019 Meeting Summary 4
• Economics o As currently modelled, sport fishery angler trips under both Option 3 sub-options
would be collectively slightly better (~3%) in comparison to base period policy allocations from 2019-2024.
o Commercial fishery ex-vessel values under both Option 3 sub-options would be collectively less in 2019 than they would be without the 2013 harvest reform policy (~16%); modeling detail showed significant negative impacts in mainstem areas(~65% of base), but 15% better in SAFE areas for 2019. Modeling of out years to 2024 could achieve economic parity with pre-policy allocations and SAFE production with increased releases in SAFE areas.
Voluntary Barbless Hooks and the Youngs Bay Sanctuary There was no discussion of proposals for these two topics, but rather assignments to staff for information to be discussed at the next PRC meeting (see conclusion, below). Developing a Consolidated Recommendation No proposals for a consolidated recommendation for 2019 policies and regulations were discussed, pending the confirmation of modeling results and additional comparative analysis to be shown at the February 26 PRC meeting. Policies and Regulations in 2020 and Beyond Committee members reiterated a strong interest to not neglect the need for a comprehensive policy approach for the long term, while still focusing on 2019. The committee did not modify the List of Ideas Matrix, but prioritized several items:
• Low Priorities: a search for new WA SAFE areas; Joint State commercial license buyback program
• High Priorities: all of the items on pages 1 and 2 of the matrix; the inclusion of a section on hatchery production goals with special attention to mitigation hatchery programs, and including SAFE target production goals
• Medium Priorities: all remaining items in the matrix. Future Process and Schedule Document The draft process and schedule document was reviewed, with most of the discussion about the timing needed for each full Commission to decide on a single set of policies for 2019 in time for the onset of the North of Falcon process in mid-March. There was agreement to strive for a recommendation from the PRC at its next meeting on February 26 in Salem, Oregon and to organize staff assignments with that priority in mind. Another review of the Future Process and Schedule document will occur at that meeting with any adjustments as necessary to achieve the primary (2019) and secondary (2020 and beyond) goals of the Committee.

Joint-State Columbia River Salmon Fishery Policy Review Committee February 6, 2019 Meeting Summary 5
Conclusion The Committee asked the Chair to work with the staff to prioritize the listing of assignments below so as to optimize the chances of reaching a recommendation for policies in 2019 at the next PRC meeting.
• Develop stand-alone narrative descriptions of each Option, as opposed to the model run assumptions, scalars, coefficients, etc.
• Review, confirm, and validate model output results.
• Review models to verify the difference in angler trips when allocation changes.
• Show economic returns for high and low run sizes within the 2013-2018 grouping, for display with the average results.
• Prepare easily viewed comparison of option results for 2019.
• Provide detail on Select Area assumptions (OR and WA) o Pre-policy level of releases, and releases for returns in 2019 o Where the funding comes from o Where the broodstock comes from o Risk of not meeting broodstock/egg goals
• Where does the Columbia River endorsement money go (OR and WA)? What programs are supported by the endorsement funds?
• Identify which fisheries (commercial/sport/species) have unused allocation but were provided the opportunity to use their share
• Look at angler trips relative to different allocation levels o If it does not negatively affect sport and improves commercial that might show
areas where we might want to make changes. Keep the sport fishery in the positive with regards to angler trips
(economically enhanced) Need to truth economic response model with 2019 pre-season fisheries
model.
• What is the marked/unmarked ratio in Spring/Summer/Fall MSF fishery and/or what are the mark rates?
o Specifically, how many fish are caught and how many fish are released in each fishery
• Youngs Bay Control Zone - does the sanctuary increase the number of fish caught in the Youngs Bay commercial fishery?
• Obtain information of barbed hooks vs. barbless hook perspective within sport sector fishery participants, if available.
• Provide a Pound Net update to the group

Joint-State Columbia River Salmon Fishery Policy Review Committee February 6, 2019 Meeting Summary 6
• Develop an initial straw range of options for upriver/downriver sharing of spring Chinook (WA commissioner subgroup assignment- 2020 and beyond), for analysis for the 2020 and beyond period
• Briefing from OR and WA on hatchery productions goals (SAFE areas?) o Where is production occurring? o What species are being produced? o How many are produced? o What is the funding source? o How secure is the funding?
• Look at specific areas or runs that could benefit from additional sport or commercial fisheries to remove hatchery fish and improve pHOS
• Share the NOAA 5-year status review and Columbia River Partnership Taskforce goals with group
• Share WA white paper or Orcas (Chair McIsaac to provide)