Embed Size (px)
Citation preview

Joop HoxUtrecht University
[email protected]://www.joophox.net
Introduction Multilevel AnalysisIntroduction Multilevel Analysis
Rens van de [email protected] / rensvandeschoot.wordpress.com
2
Multilevel Regression ModelMultilevel Regression Model
Known in literature under a variety of names Hierarchical linear model (HLM) Random coefficient model Variance component model Multilevel model Contextual analysis Mixed Linear Model
3
Hierarchical Data StructureHierarchical Data Structure
Three level data structure Groups at different levels may have different sizes Response (outcome) variable at lowest level Explanatory variables at all levels

4
Examples? Examples?
5
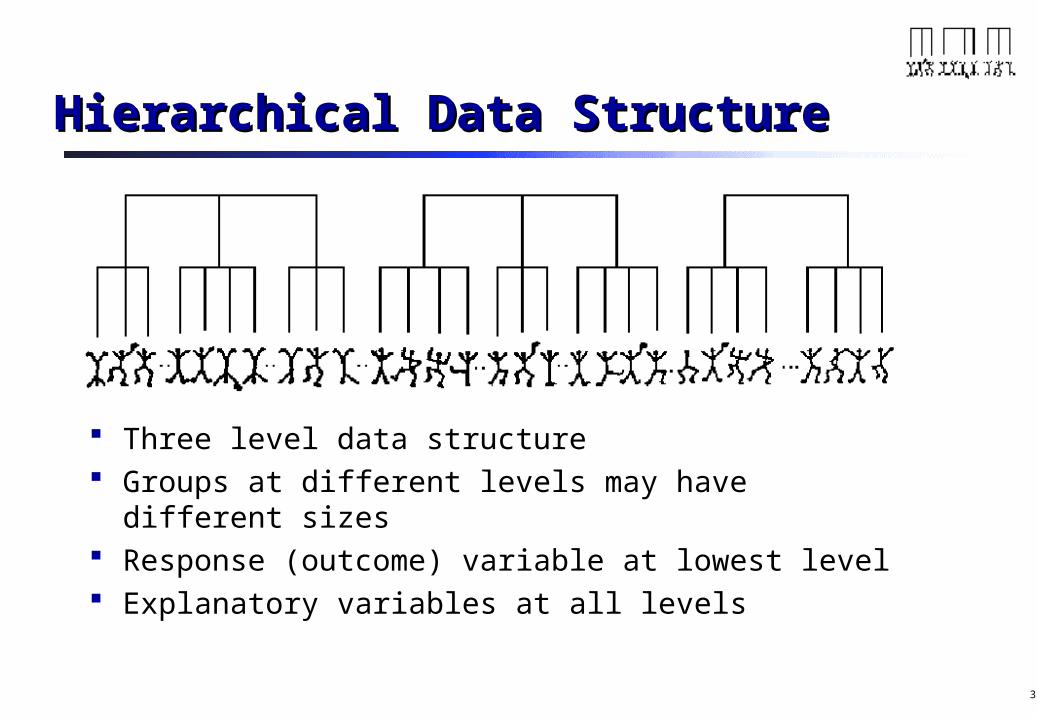
Traditional Approaches
Disaggregate all variables to the lowest level Do standard analyses (anova, multiple regression)
Aggregate all variables to the highest level Do standard analyses (anova, multiple regression)
Ancova with groups as factor
Some improvements: explanatory variables as deviations from their group mean have both
deviation score and disaggregated group mean as predictor (separates individual and group effects)
Why not? What is wrong with this?
6
Problems With Standard Analysisof Hierarchical Data
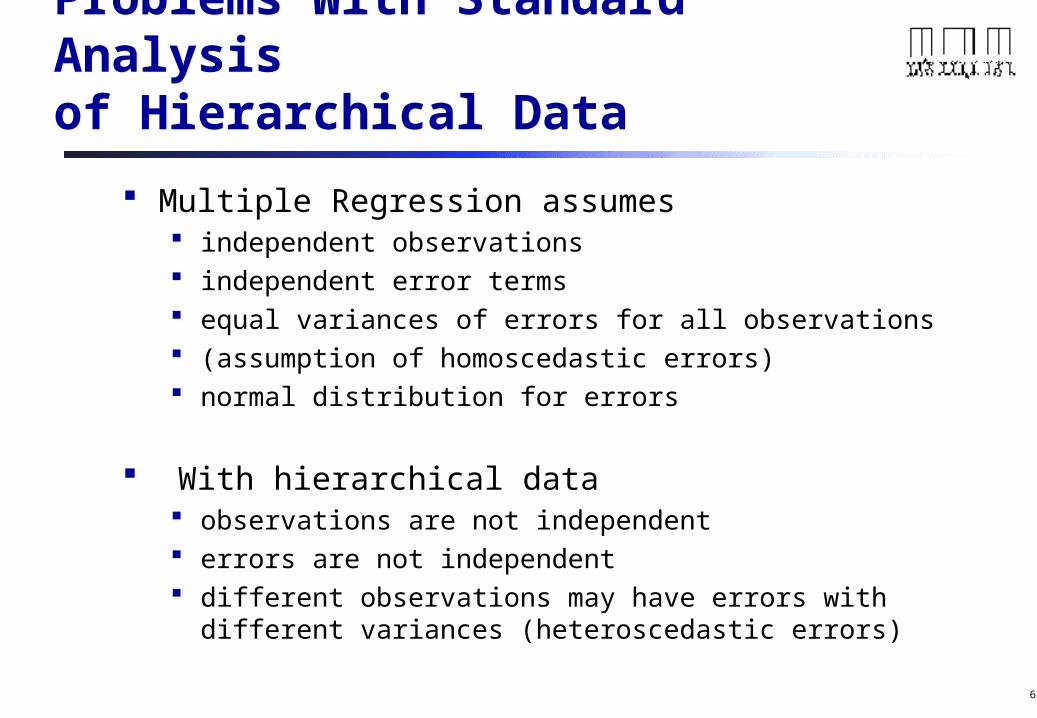
Multiple Regression assumes independent observations independent error terms equal variances of errors for all observations (assumption of homoscedastic errors) normal distribution for errors
With hierarchical data observations are not independent errors are not independent different observations may have errors with different variances
(heteroscedastic errors)
7
Problems With Standard Analysis Problems With Standard Analysis of Hierarchical Dataof Hierarchical Data
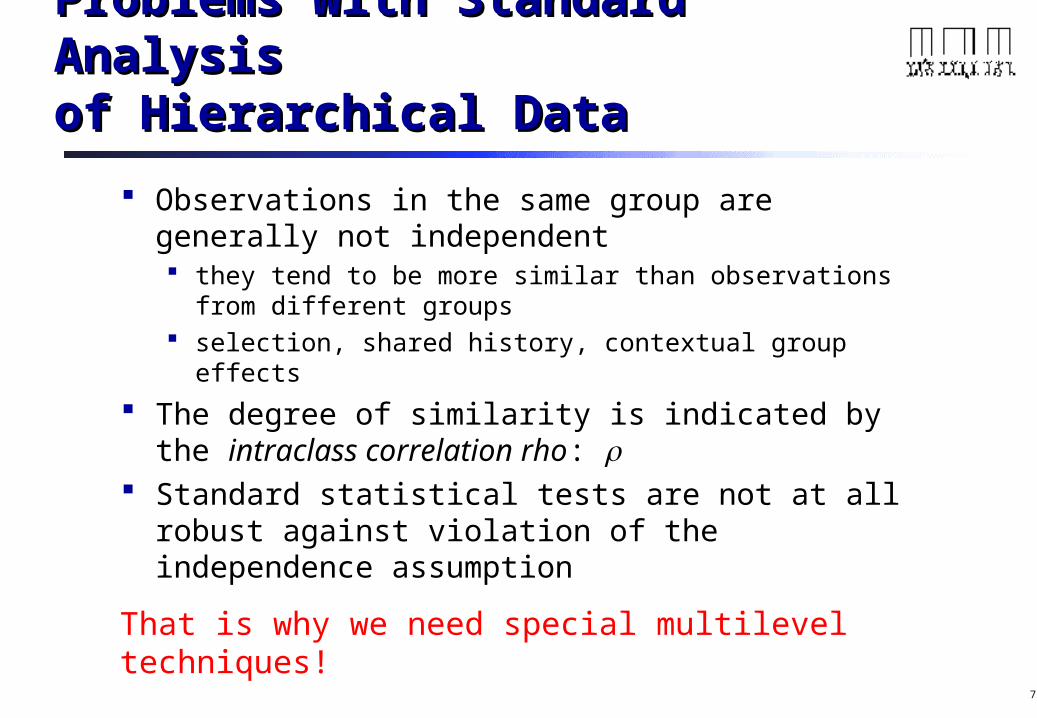
Observations in the same group are generally not independent they tend to be more similar than observations from different
groups selection, shared history, contextual group effects
The degree of similarity is indicated by the intraclass correlation rho:
Standard statistical tests are not at all robust against violation of the independence assumption
That is why we need special multilevel techniques!

8
Sample size?Sample size?
Hox, J., van de Schoot. R., & Matthijsse, S. (2012). How few countries will do? Comparative survey analysis from a Bayesian perspective. Survey Research Methods, Vol.6, No.2, pp. 87-93
9
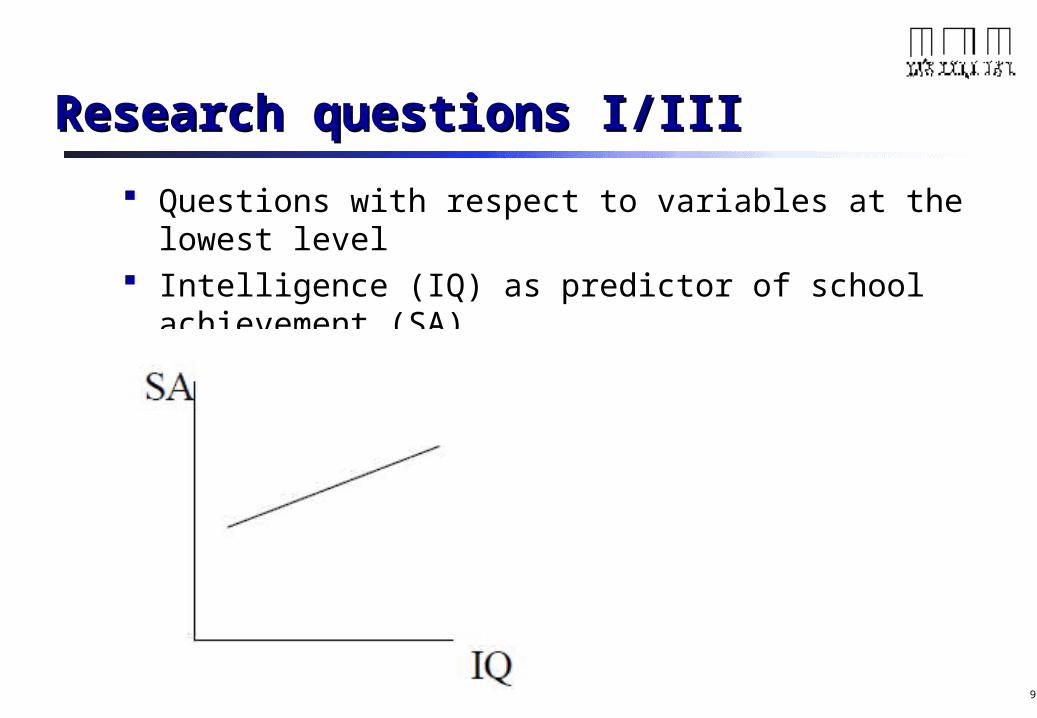
Research questions I/IIIResearch questions I/III
Questions with respect to variables at the lowest level Intelligence (IQ) as predictor of school achievement (SA)
10
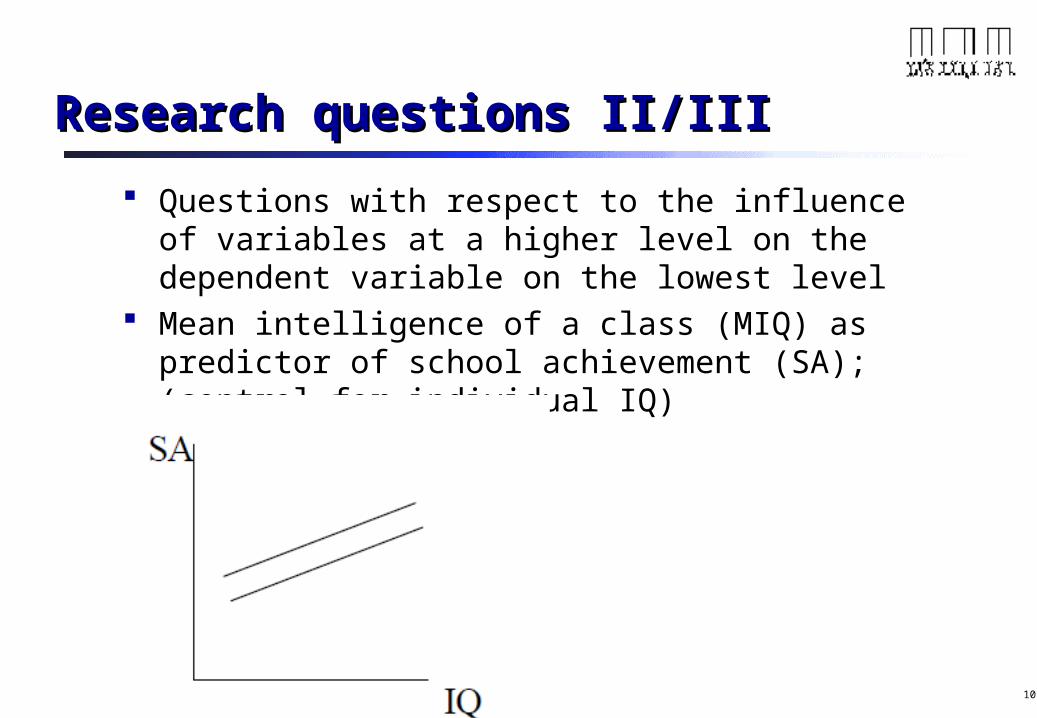
Research questions II/IIIResearch questions II/III
Questions with respect to the influence of variables at a higher level on the dependent variable on the lowest level
Mean intelligence of a class (MIQ) as predictor of school achievement (SA); (control for individual IQ)
11
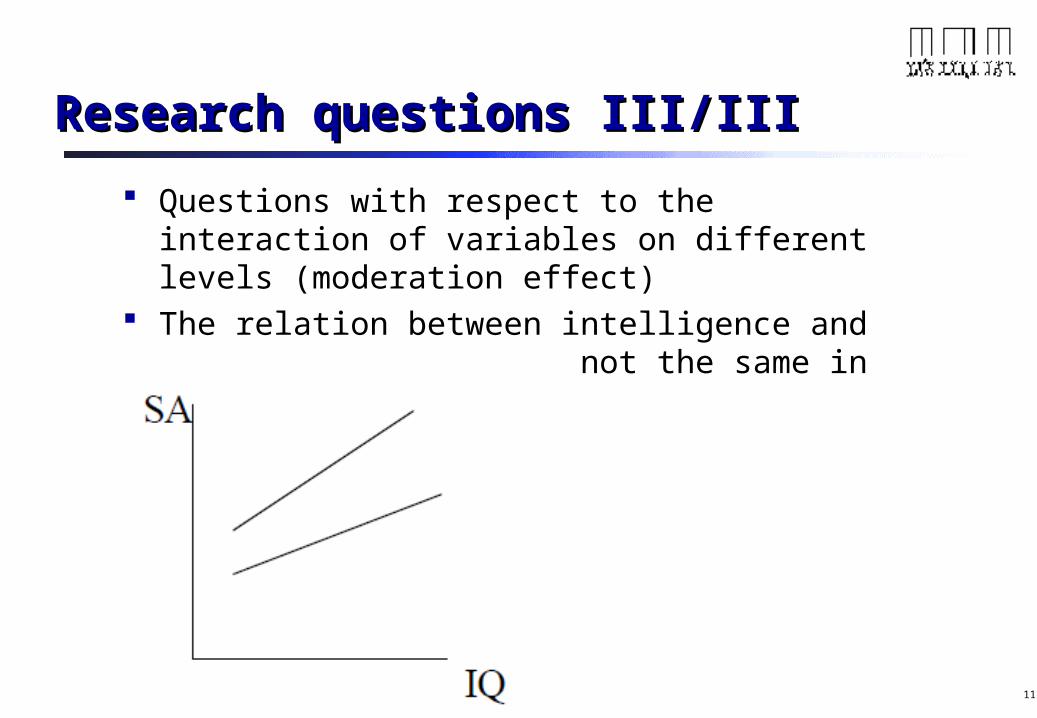
Research questions III/IIIResearch questions III/III
Questions with respect to the interaction of variables on different levels (moderation effect)
The relation between intelligence and school achievement is not the same in all classes
12
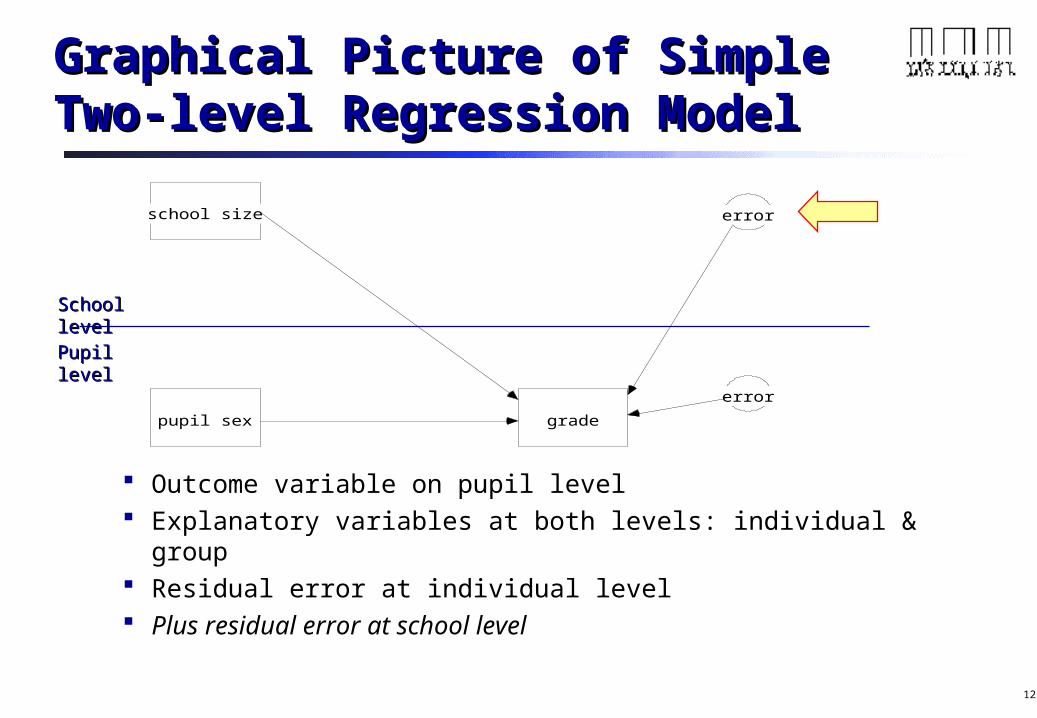
Graphical Picture of SimpleGraphical Picture of SimpleTwo-level Regression ModelTwo-level Regression Model
Outcome variable on pupil level Explanatory variables at both levels: individual & group Residual error at individual level Plus residual error at school level
school size
pupil sex grade
error
error
School levelSchool level
Pupil levelPupil level
13
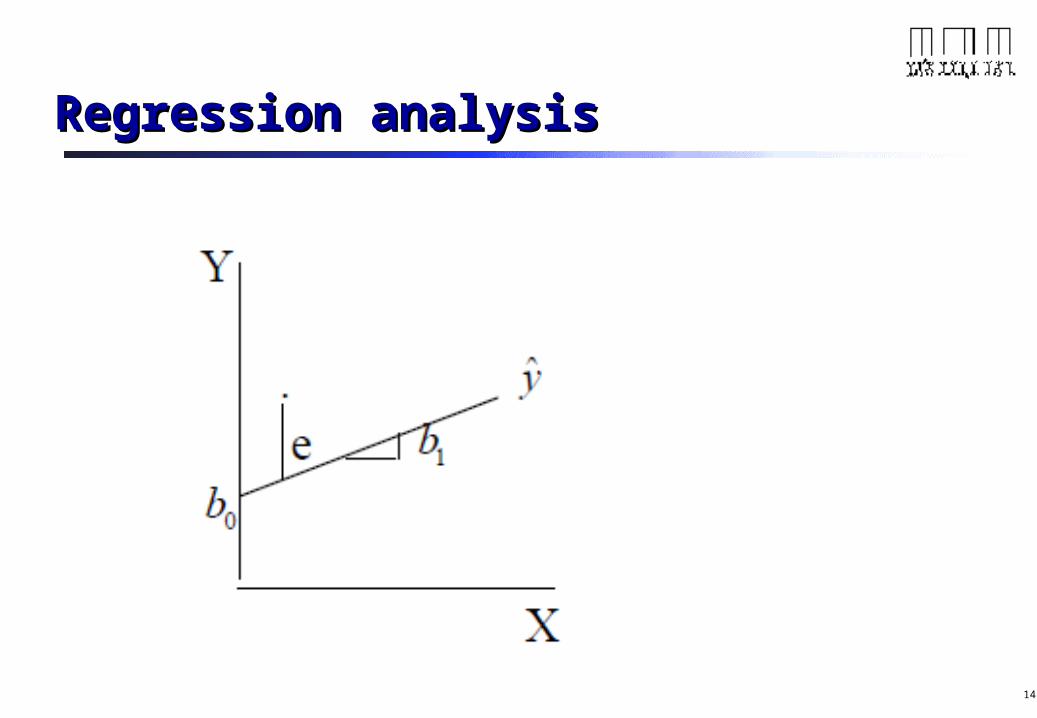
Regression analysisRegression analysis
In ordinary regression, with one explanatory variable X:
Yi= 0+ 1Xi+ ei
0 intercept,
1 regression slope,
ei residual error term
14
Regression analysisRegression analysis
15
Building the Multilevel Regression Building the Multilevel Regression Model: Random intercept modelModel: Random intercept model
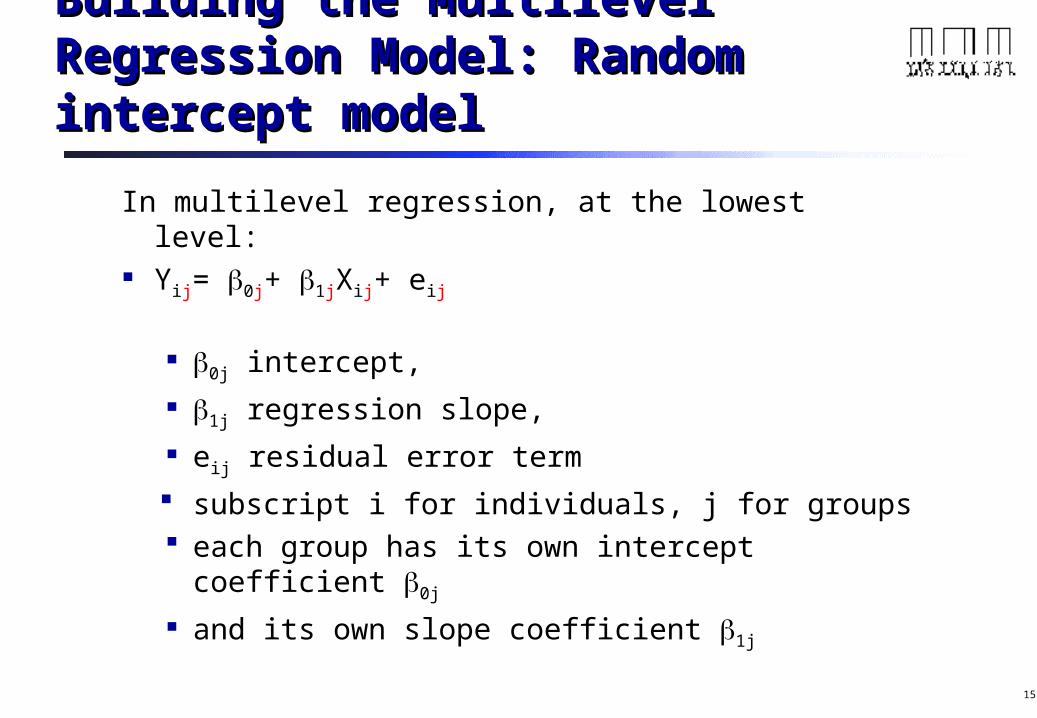
In multilevel regression, at the lowest level: Yij= 0j+ 1jXij+ eij
0j intercept,
1j regression slope,
eij residual error term
subscript i for individuals, j for groups each group has its own intercept coefficient 0j
and its own slope coefficient 1j
16
Building the Multilevel Regression Building the Multilevel Regression Model: Intercept only modelModel: Intercept only model
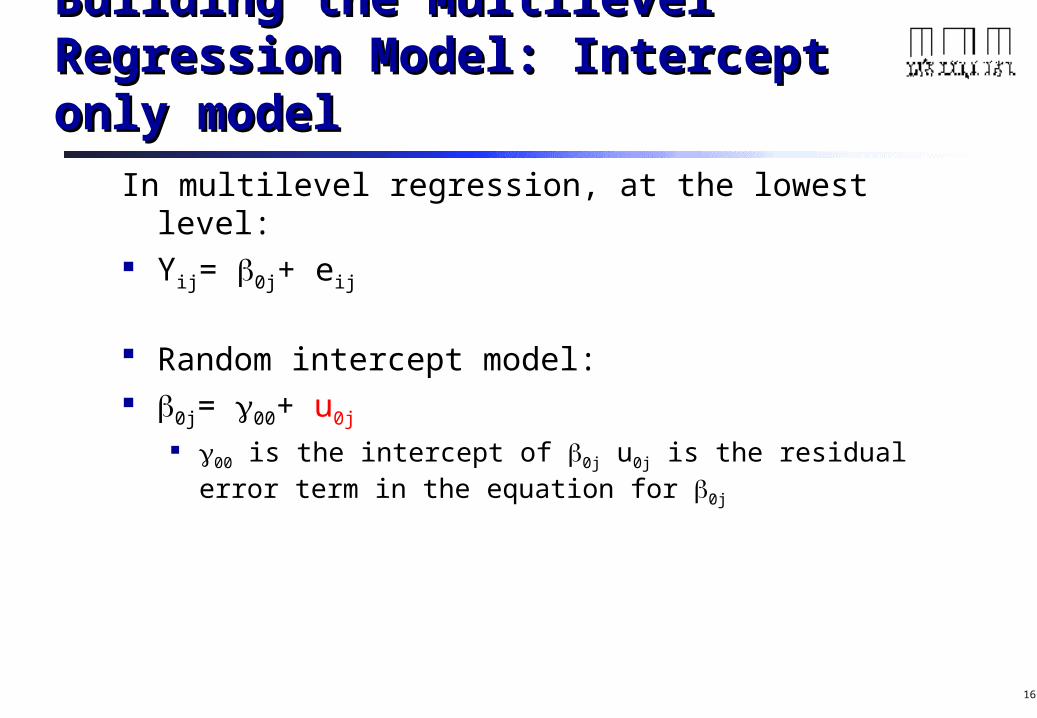
In multilevel regression, at the lowest level: Yij= 0j+ eij
Random intercept model: 0j= 00+ u0j
00 is the intercept of 0j u0j is the residual error term in the equation for 0j
17
Building the Multilevel Regression Building the Multilevel Regression Model: Random intercept modelModel: Random intercept model
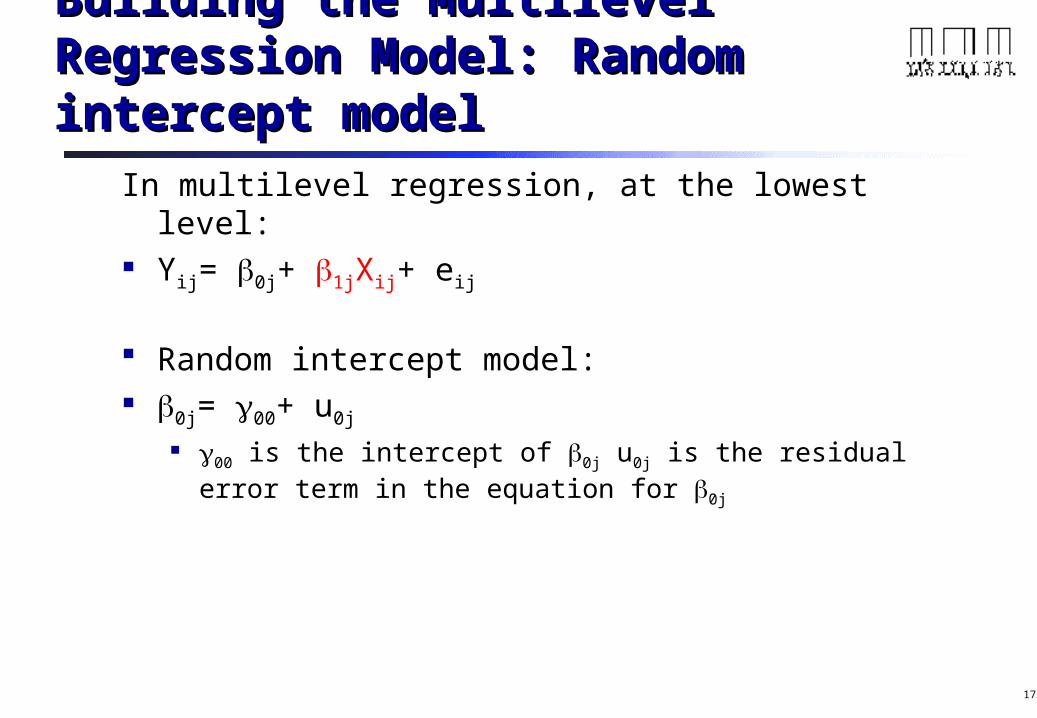
In multilevel regression, at the lowest level: Yij= 0j+ 1jXij+ eij
Random intercept model: 0j= 00+ u0j
00 is the intercept of 0j u0j is the residual error term in the equation for 0j
18
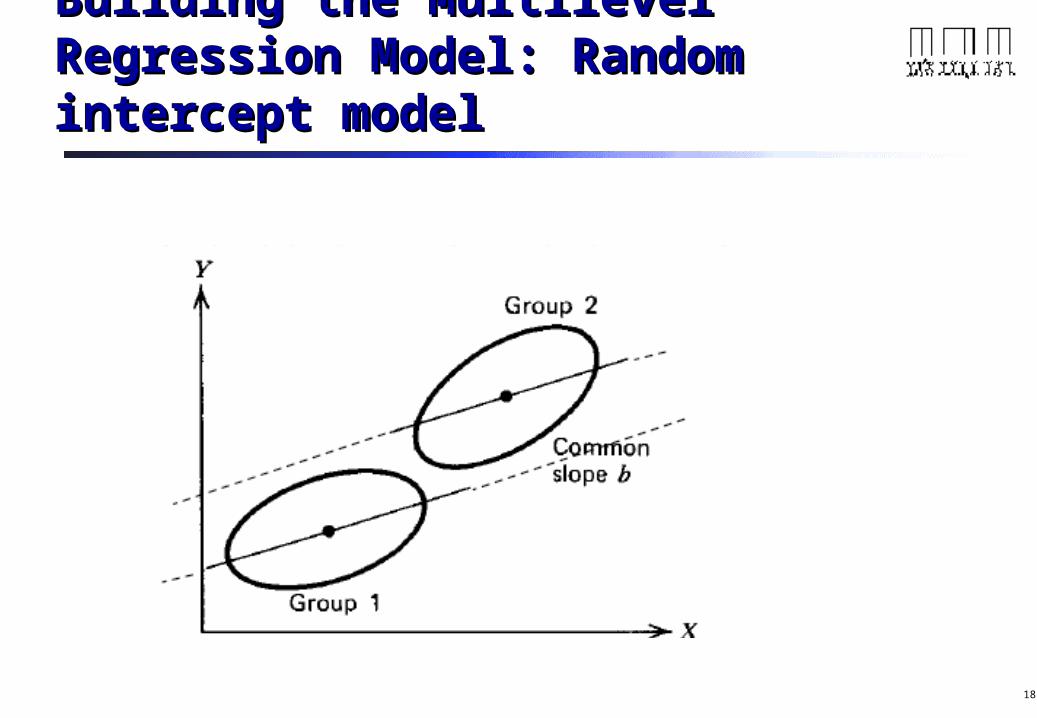
Building the Multilevel Regression Building the Multilevel Regression Model: Random intercept modelModel: Random intercept model
19
Building the Multilevel Regression Building the Multilevel Regression Model: Intercept only modelModel: Intercept only model
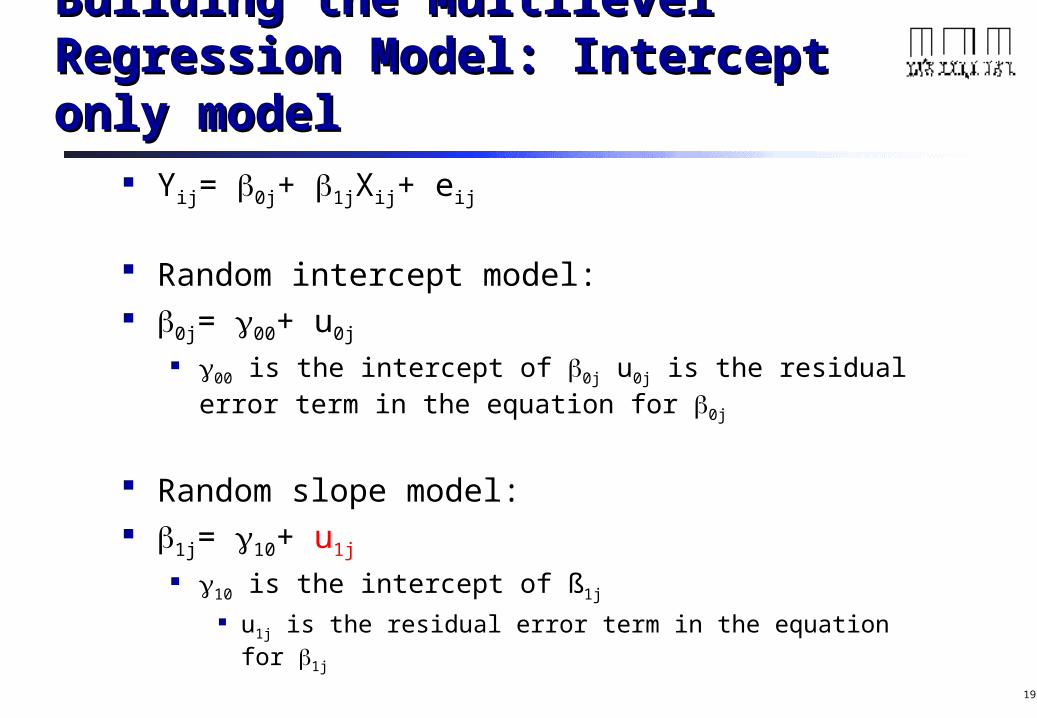
Yij= 0j+ 1jXij+ eij
Random intercept model: 0j= 00+ u0j
00 is the intercept of 0j u0j is the residual error term in the equation for 0j
Random slope model: 1j= 10+ u1j
10 is the intercept of ß1j u1j is the residual error term in the equation for 1j
20
Difference with the usual Difference with the usual regression model:regression model:
Each class has a different intercept coefficient b0j and a different slope coefficient b1j
Since the intercept and the slope coefficients vary across the classes: random coefficients
=> Random intercept model & random slope model
21
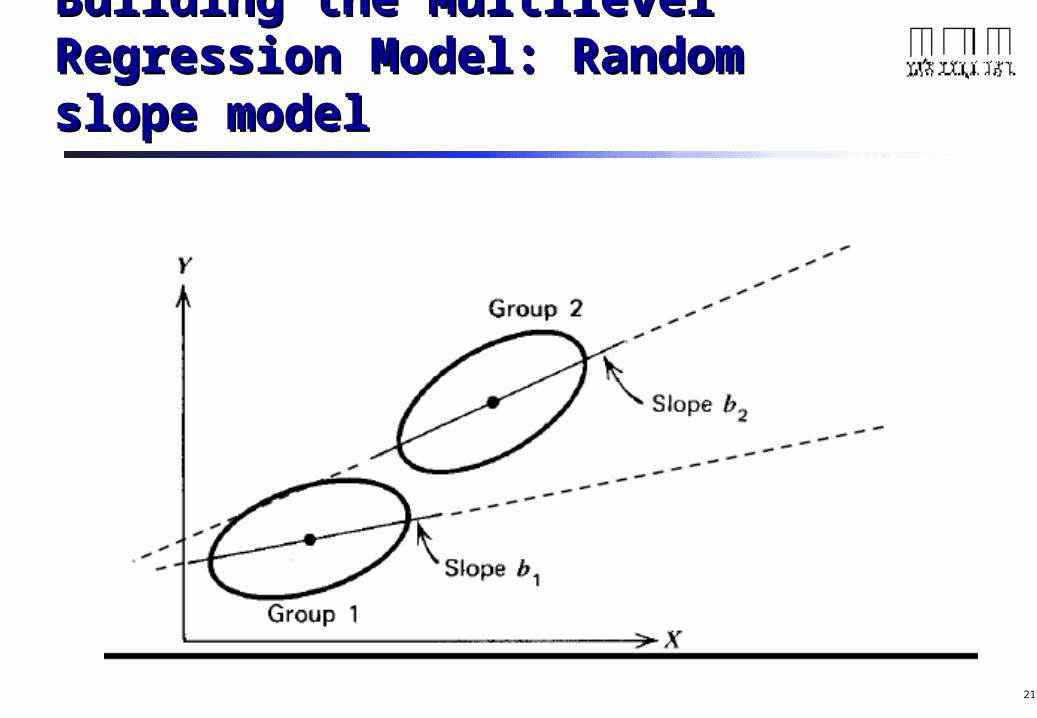
Building the Multilevel Regression Building the Multilevel Regression Model: Random slope modelModel: Random slope model
22
BuildingBuilding the Multilevel Regression the Multilevel Regression Model: the Second (Group) LevelModel: the Second (Group) Level
Next step: explain the variation of the regression coefficients b0j
and b1j by introducing explanatory variables at the class level
23
Building the Multilevel Regression Building the Multilevel Regression Model: the Second (Group) LevelModel: the Second (Group) Level
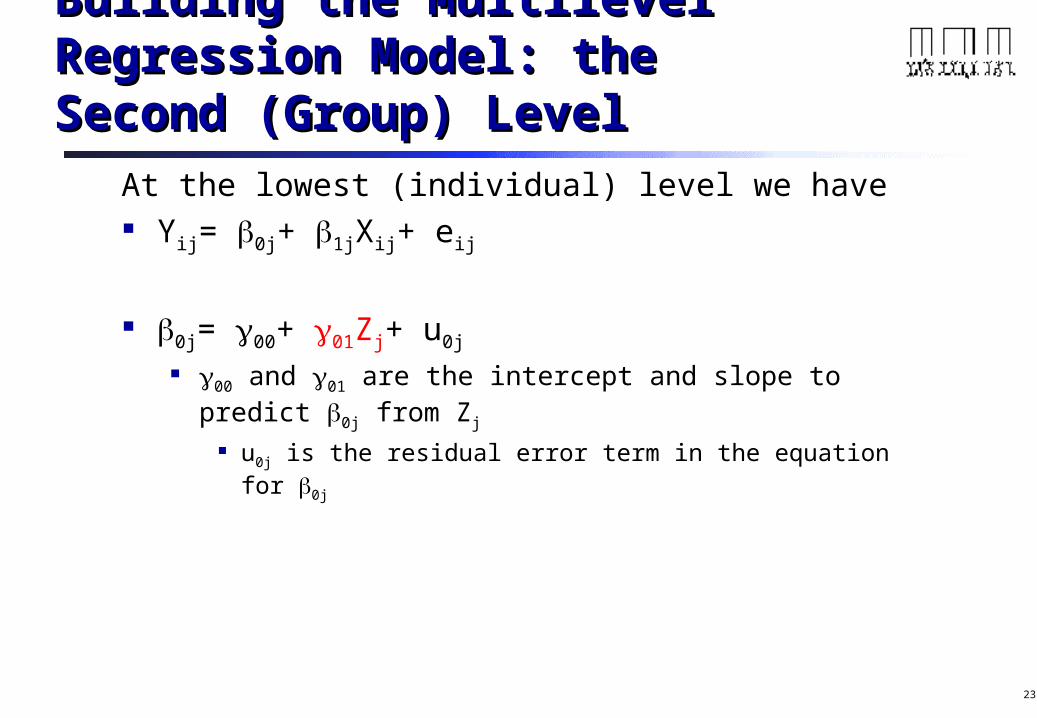
At the lowest (individual) level we have Yij= 0j+ 1jXij+ eij
0j= 00+ 01Zj+ u0j 00 and 01 are the intercept and slope to predict 0j from Zj
u0j is the residual error term in the equation for 0j
24
Building the Multilevel Regression Building the Multilevel Regression Model: Cross level interactionModel: Cross level interaction
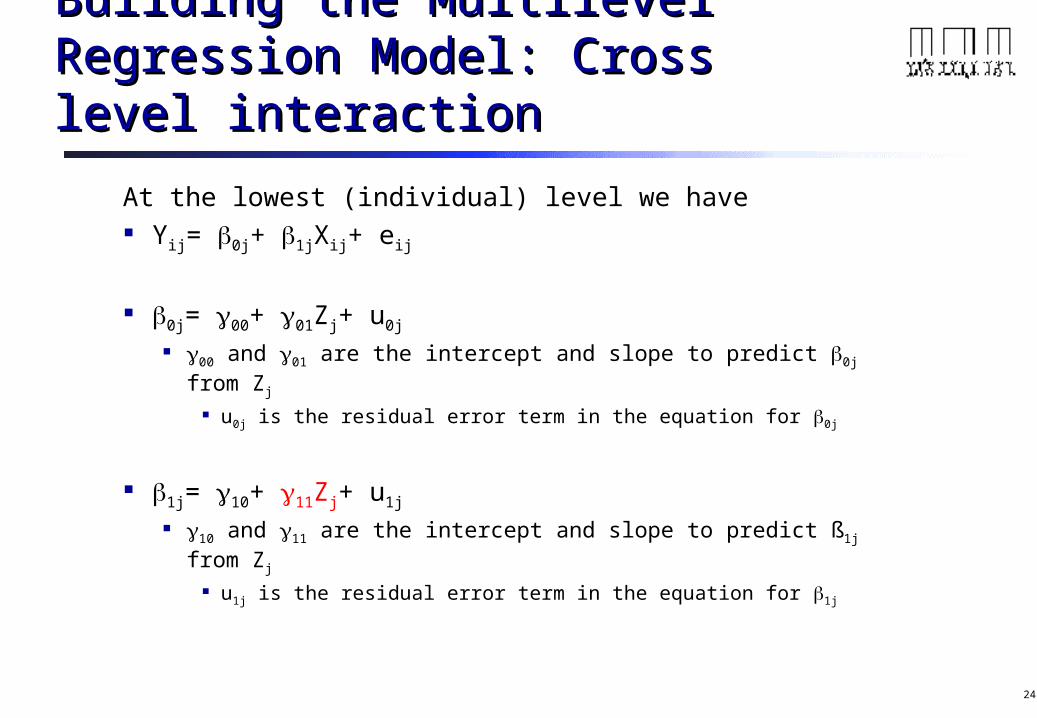
At the lowest (individual) level we have Yij= 0j+ 1jXij+ eij
0j= 00+ 01Zj+ u0j 00 and 01 are the intercept and slope to predict 0j from Zj
u0j is the residual error term in the equation for 0j
1j= 10+ 11Zj+ u1j 10 and 11 are the intercept and slope to predict ß1j from Zj
u1j is the residual error term in the equation for 1j
25
Building the Multilevel Regression Building the Multilevel Regression Model: Single Equation VersionModel: Single Equation Version
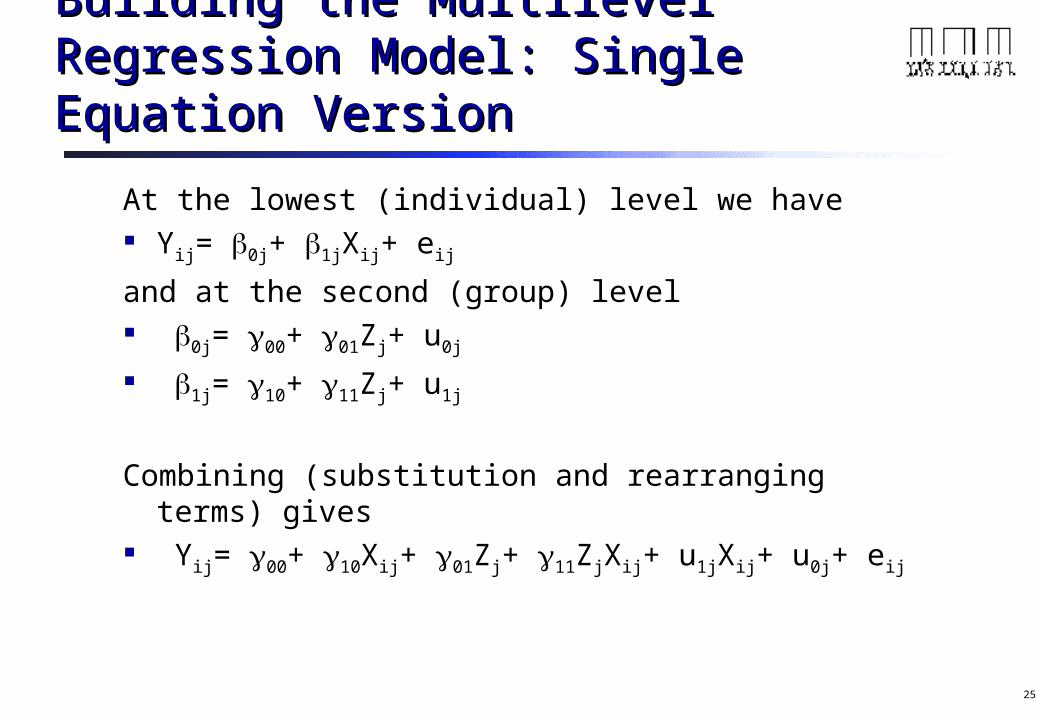
At the lowest (individual) level we have Yij= 0j+ 1jXij+ eijand at the second (group) level 0j= 00+ 01Zj+ u0j 1j= 10+ 11Zj+ u1j
Combining (substitution and rearranging terms) gives Yij= 00+ 10Xij+ 01Zj+ 11ZjXij+ u1jXij+ u0j+ eij
26
Building the Multilevel Regression Building the Multilevel Regression Model: Single Equation VersionModel: Single Equation Version
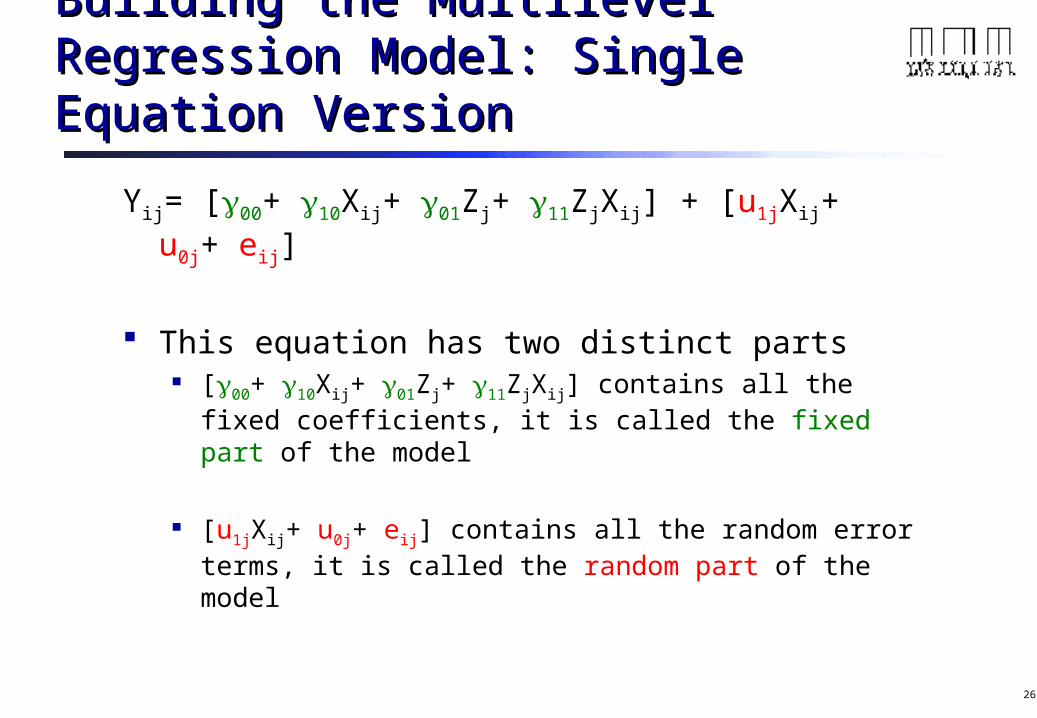
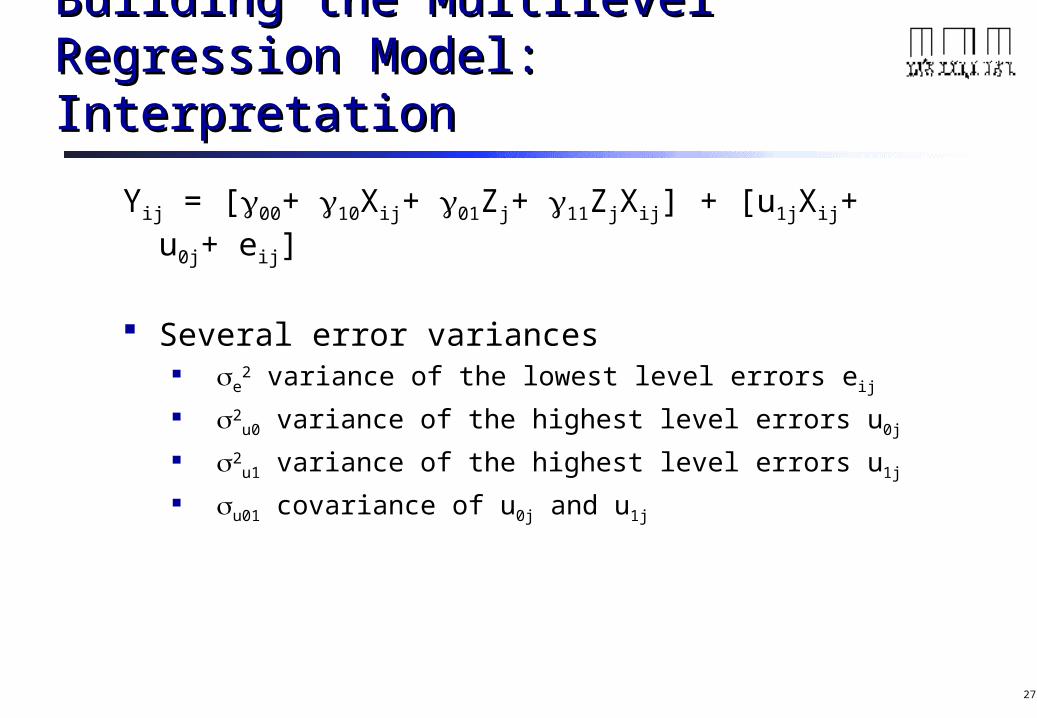
Yij= [00+ 10Xij+ 01Zj+ 11ZjXij] + [u1jXij+ u0j+ eij]
This equation has two distinct parts [00+ 10Xij+ 01Zj+ 11ZjXij] contains all the fixed coefficients,
it is called the fixed part of the model
[u1jXij+ u0j+ eij] contains all the random error terms, it is called the random part of the model
27
Building the Multilevel Regression Building the Multilevel Regression Model: InterpretationModel: Interpretation
Yij = [00+ 10Xij+ 01Zj+ 11ZjXij] + [u1jXij+ u0j+ eij]
Several error variances e
2 variance of the lowest level errors eij
2u0 variance of the highest level errors u0j
2u1 variance of the highest level errors u1j
u01 covariance of u0j and u1j
28
Full Multilevel Regression ModelFull Multilevel Regression Model
Explanatory variables at all levels
Higher level variables predict variation of lowest level intercept and slopes
Predicting the intercept implies a direct effect
Predicting slopes implies cross-level interactions
29
Model ExplorationModel Exploration
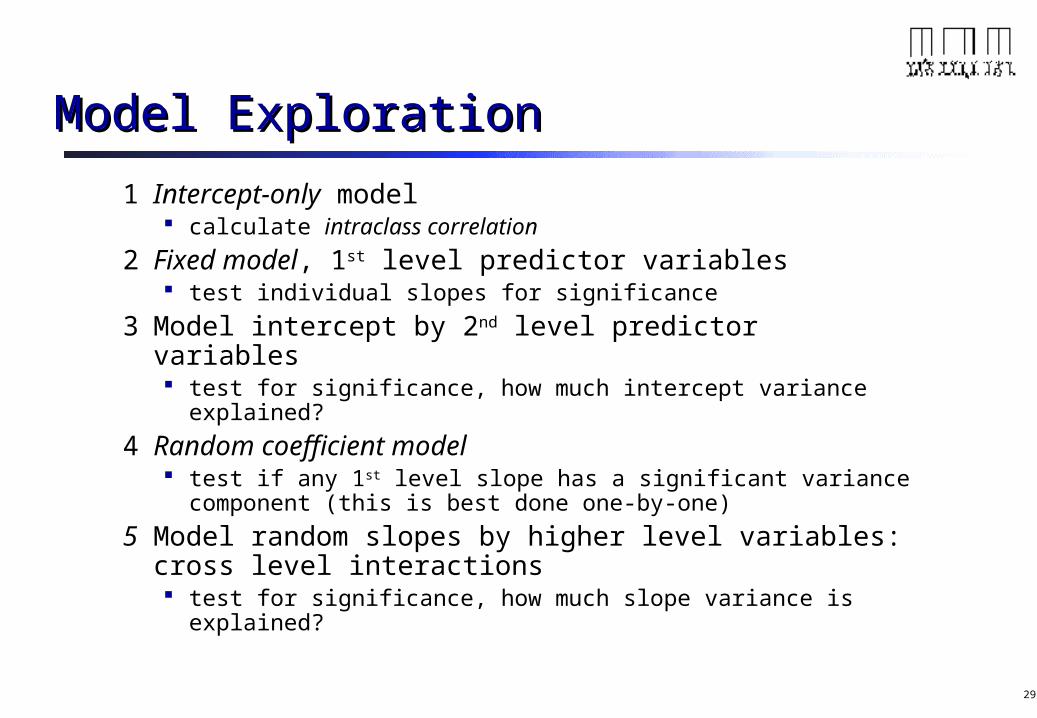
1 Intercept-only model calculate intraclass correlation
2 Fixed model, 1st level predictor variables test individual slopes for significance
3 Model intercept by 2nd level predictor variables test for significance, how much intercept variance
explained?
4 Random coefficient model test if any 1st level slope has a significant variance
component (this is best done one-by-one)
5 Model random slopes by higher level variables: cross level interactions test for significance, how much slope variance is explained?
30
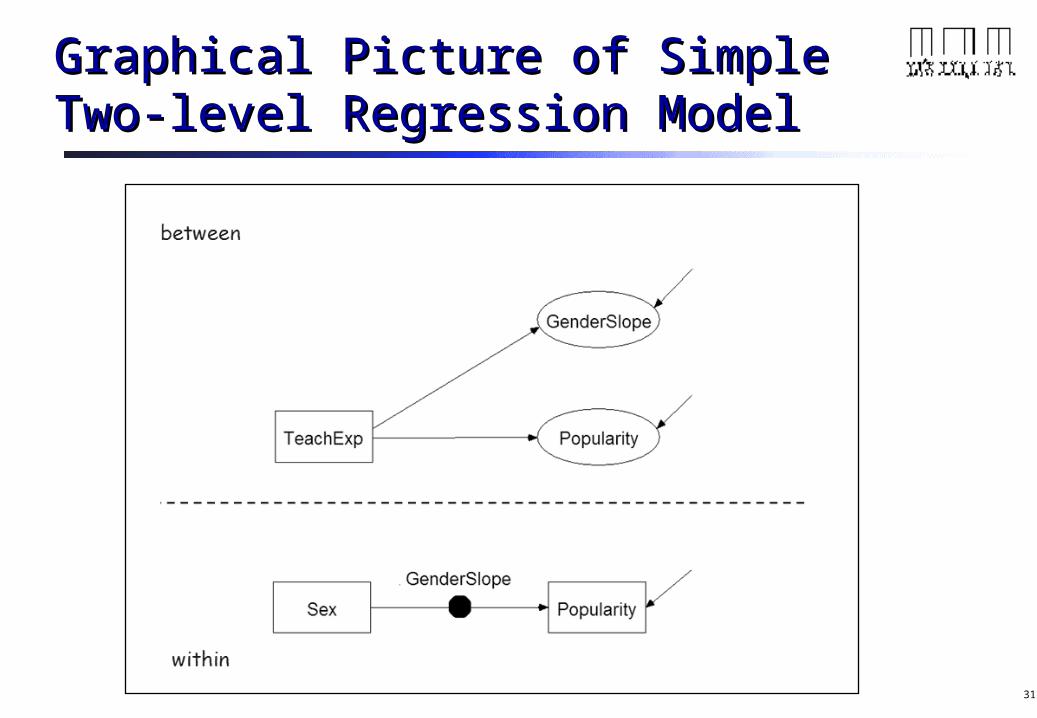
Example: Popularity in SchoolsExample: Popularity in Schools
Outcome: popularity rating 100 classes, 2000 pupils Explanatory variables
Pupil level: sex (0=boy, 1=girl) Class level: teacher experience (in years)
31
Graphical Picture of SimpleGraphical Picture of SimpleTwo-level Regression ModelTwo-level Regression Model
32
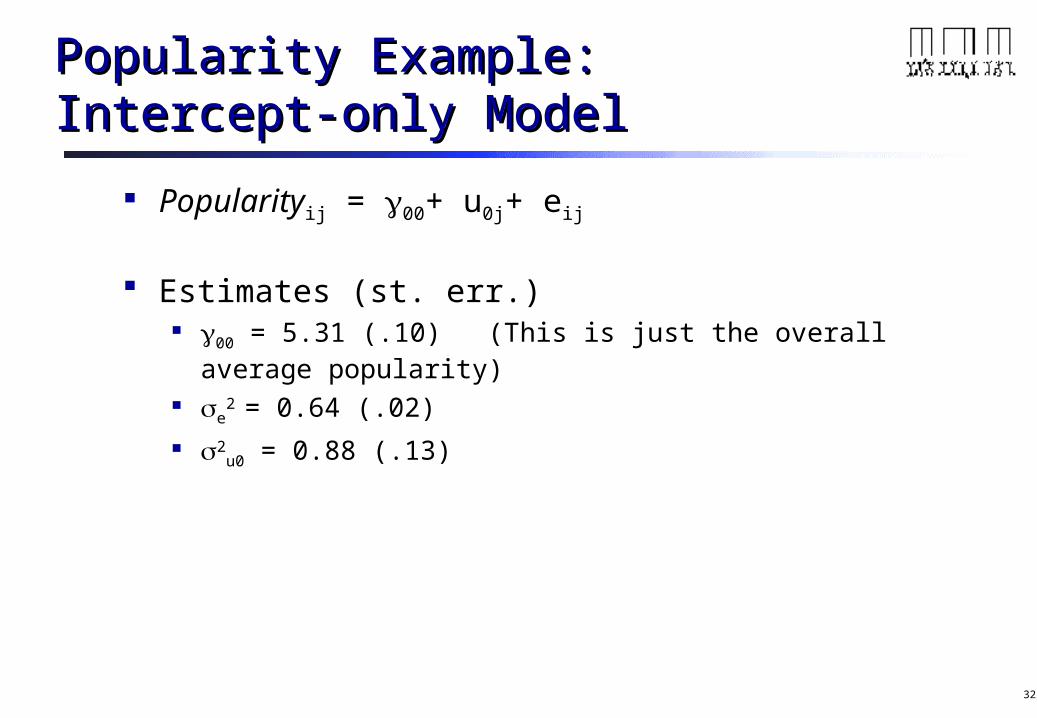
Popularity Example:Popularity Example:Intercept-only ModelIntercept-only Model
Popularityij = 00+ u0j+ eij
Estimates (st. err.) 00 = 5.31 (.10) (This is just the overall average popularity)
e2 = 0.64 (.02)
2u0 = 0.88 (.13)
33
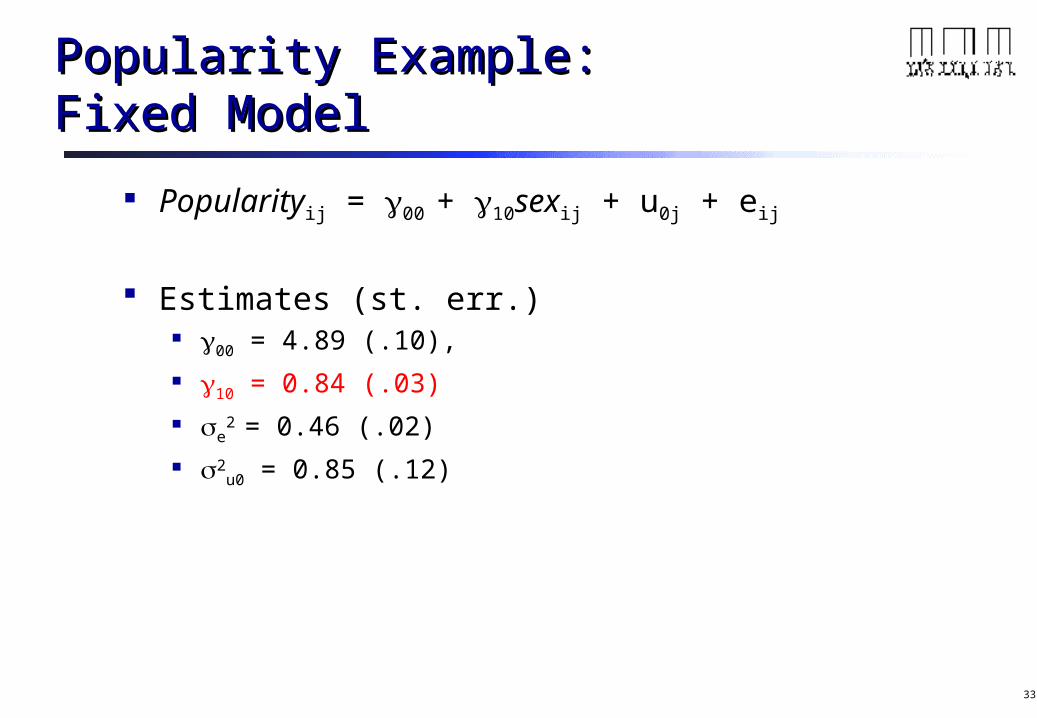
Popularity Example:Popularity Example:Fixed ModelFixed Model
Popularityij = 00 + 10sexij + u0j + eij
Estimates (st. err.) 00 = 4.89 (.10),
10 = 0.84 (.03)
e2 = 0.46 (.02)
2u0 = 0.85 (.12)
34
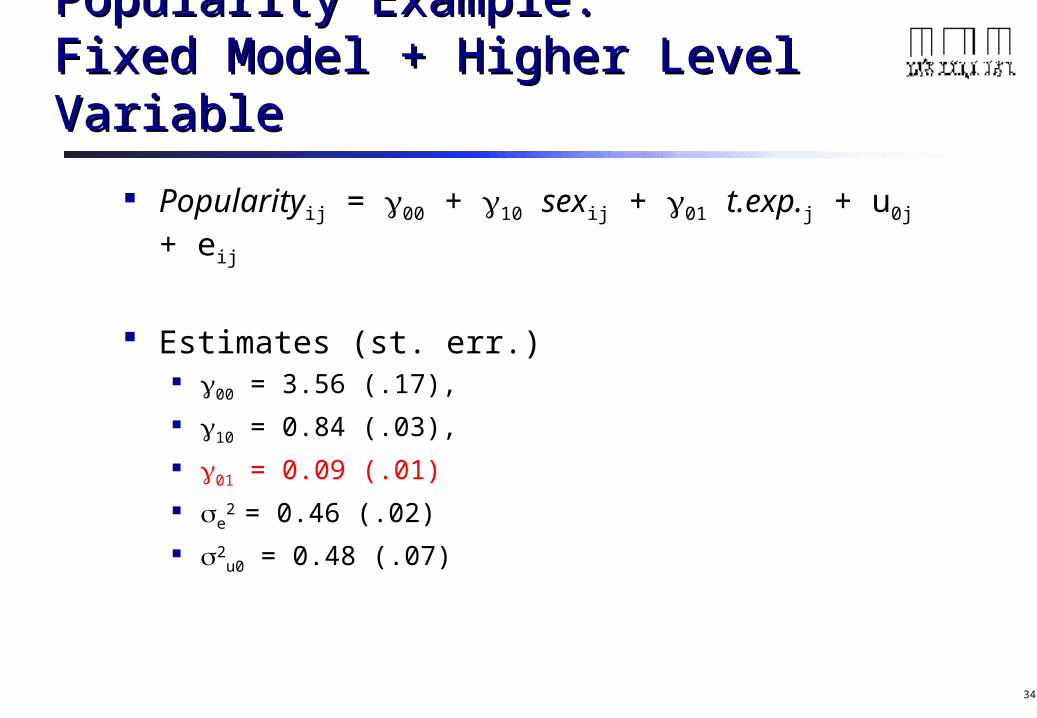
Popularity Example:Popularity Example:Fixed Model + Higher Level VariableFixed Model + Higher Level Variable
Popularityij = 00 + 10 sexij + 01 t.exp.j + u0j + eij
Estimates (st. err.) 00 = 3.56 (.17),
10 = 0.84 (.03),
01 = 0.09 (.01)
e2 = 0.46 (.02)
2u0 = 0.48 (.07)
35
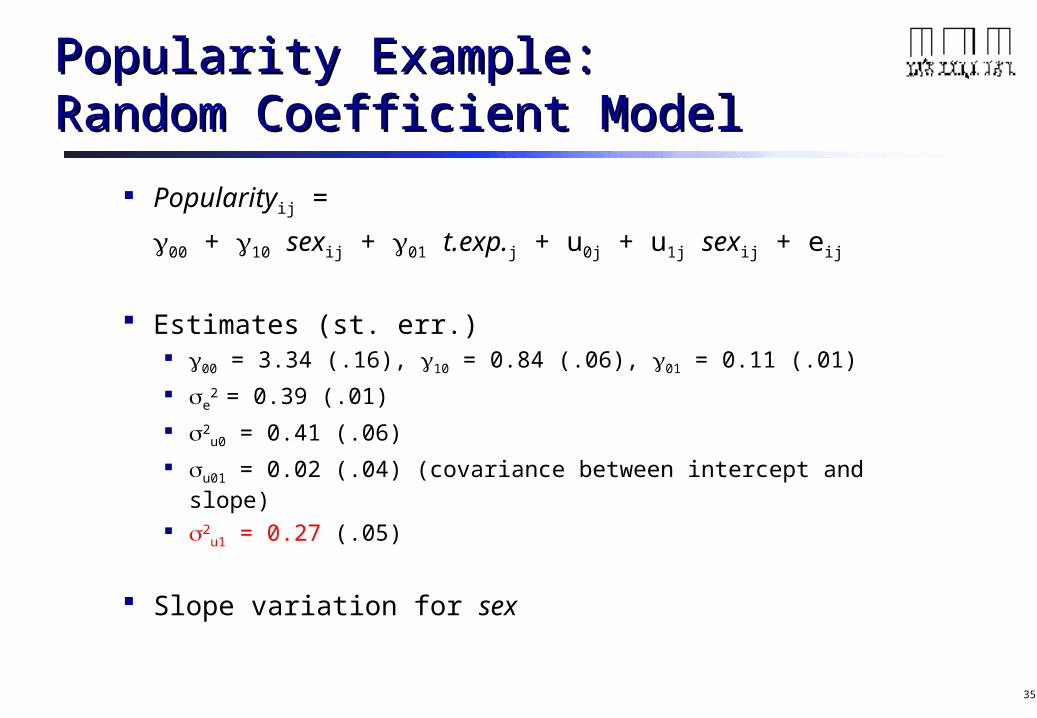
Popularity Example:Popularity Example:Random Coefficient ModelRandom Coefficient Model
Popularityij =
00 + 10 sexij + 01 t.exp.j + u0j + u1j sexij + eij
Estimates (st. err.) 00 = 3.34 (.16), 10 = 0.84 (.06), 01 = 0.11 (.01)
e2 = 0.39 (.01)
2u0 = 0.41 (.06)
u01 = 0.02 (.04) (covariance between intercept and slope)
2u1 = 0.27 (.05)
Slope variation for sex
36
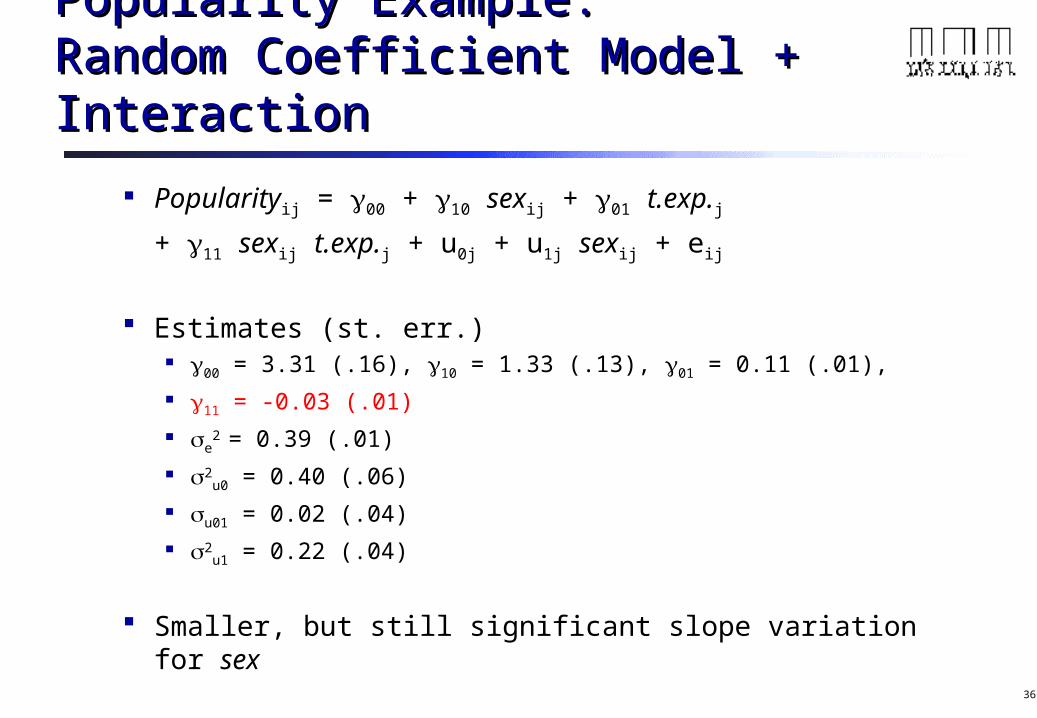
Popularity Example:Popularity Example:Random Coefficient Model + InteractionRandom Coefficient Model + Interaction
Popularityij = 00 + 10 sexij + 01 t.exp.j
+ 11 sexij t.exp.j + u0j + u1j sexij + eij
Estimates (st. err.) 00 = 3.31 (.16), 10 = 1.33 (.13), 01 = 0.11 (.01),
11 = -0.03 (.01)
e2 = 0.39 (.01)
2u0 = 0.40 (.06)
u01 = 0.02 (.04)
2u1 = 0.22 (.04)
Smaller, but still significant slope variation for sex

37
5-day course Multilevel Analyses in Mplus 21-25 jan. 2013 http://www.uu.nl/faculty/socialsciences/NL/organisatie/graduateschool/promoveren/onderwijs%20voor
%20promovendi/courseoffering/Pages/Multilevel-Analyses-using-Mplus.aspx
The 9th International Multilevel Conference is on March 27-28 (2013). http://multilevel.fss.uu.nl/
Prior to the conference (26th of March) a one-day course is taught by prof. Stef van Buuren on Mutiple Imputation of Multilevel missing data in MICE.
5th Mplus users meeting will be organized, 25th of March http://mplus.fss.uu.nl