Embed Size (px)
Citation preview

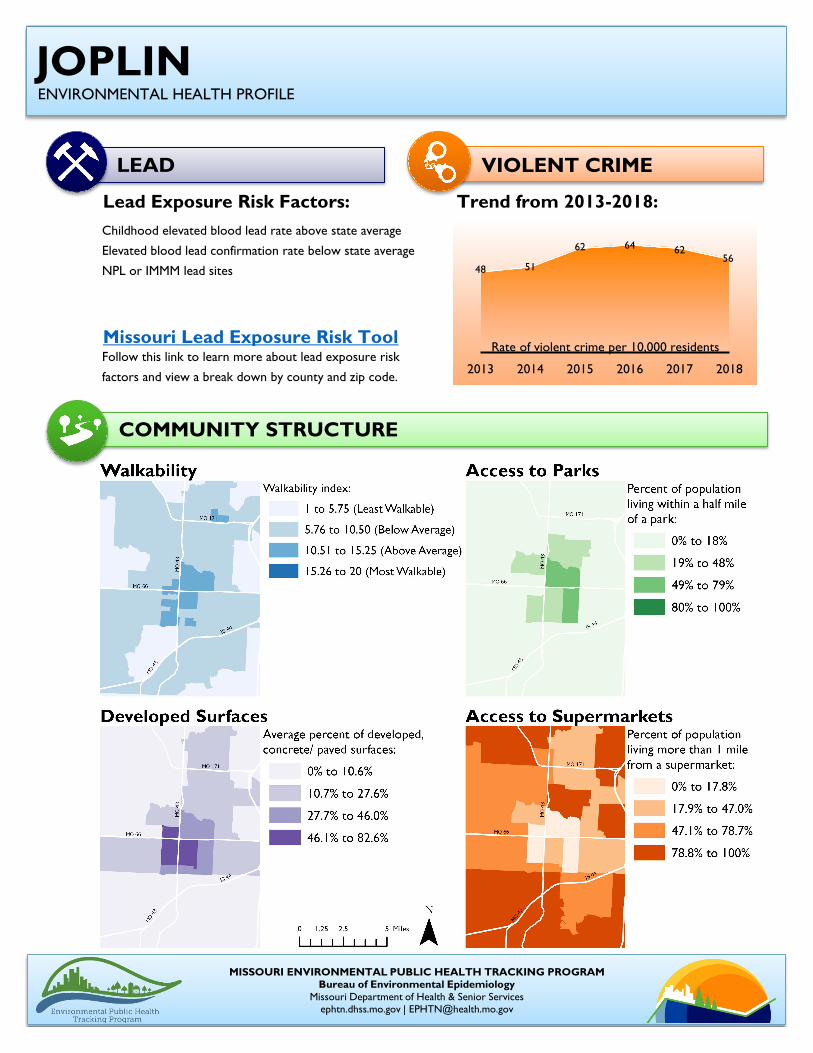
Age-adjusted rate of hospitalizations Age-adjusted rate of ER visitsper 10,000 people in 2016 per 10,000 people in 2016State Rate: 6.1 State Rate: 42.7
Age-adjusted rate of hospitalizations Age-adjusted rate of ER visitsper 10,000 people in 2016 per 10,000 people in 2016State Rate: 23.8 State Rate: 51.7
Age-adjusted rate of hospitalizations Age-adjusted rate of ER visitsper 10,000 people in 2016 per 100,000 people in 2016State Rate: 21.9 State Rate: 13.2
*
State Rate: 32.6 State Rate: 86.6
Smoke-free Laws
Population 51,540
19.3
Asthma ER Visits
72.8
Asthma Hospitalizations
28.1
27.2
COPD Hospitalizations
17.9% of people
live in poverty
Melanoma Incidence
22.3
COPD ER Visits
8.6% of people
are minorities
Missouri's 13th Largest City
3.3
Heart Attack Hospitalizations
100% smoke-free in non-hospitality
workplaces, restaurants, and bars
(As of October 2019)
Age-adjusted rate of incidenceper 100,000 people in 2016
Heat Related Illness
41.7
Prohibited in non-hospitality
workplaces, restaurants, and bars
(As of October 2019)E-Cigarette Use
Lung Cancer Incidence
99.7Age-adjusted rate of incidence
The median household
income is $41,063
per 100,000 people in 2016
At or Above State RateBelow State Rate
* Counts less than 20 are considered unreliable.Ø Non-zero counts less than 5 are suppressed for patient confidentiallity.
JOPLINENVIRONMENTAL HEALTH PROFILE
MISSOURI ENVIRONMENTAL PUBLIC HEALTH TRACKING PROGRAMBureau of Environmental Epidemiology
Missouri Department of Health & Senior Servicesephtn.dhss.mo.gov | [email protected]
HEALTH
SMOKING
Follow this link to learn more about lead exposure risk
factors and view a break down by county and zip code.
Trend from 2013-2018:Lead Exposure Risk Factors:
Missouri Lead Exposure Risk Tool
Childhood elevated blood lead rate above state average
Elevated blood lead confirmation rate below state average
NPL or IMMM lead sites 48 51
62 64 6256
2013 2014 2015 2016 2017 2018
COMMUNITY STRUCTURE
JOPLINENVIRONMENTAL HEALTH PROFILE
VIOLENT CRIME
MISSOURI ENVIRONMENTAL PUBLIC HEALTH TRACKING PROGRAMBureau of Environmental Epidemiology
Missouri Department of Health & Senior Servicesephtn.dhss.mo.gov | [email protected]
LEAD
Rate of violent crime per 10,000 residents
Source Years Description
City Size Rank American Community Survey
2013-2017
City size rank based on population. Source: American Community Survey 5- Year Estimates, 2013-2017, Table B01003.
Population American Community
Survey 2013-2017
Total population. Source: American Community Survey 5- Year Estimates, 2013-2017, Table B01003.
Minorities U.S. Census Bureau 2010 Percentage of racial and ethnic minorities. State average:
19%. Source: 2010 U.S. Census, Summary File 1, Table GCT-P3.
Poverty American Community Survey
2013-2017
Percent of the population living in poverty. State average: 14.6%. Source: American Community Survey 5-Year Estimates, 2013-2017, Table GCT1701.
Income American Community Survey
2013-2017
Median annual household income. State average: $51,542. Source: American Community Survey 5-Year Estimates, 2013-2017, Table GCT1901.
Source Years Description
Asthma COPD Heart Attack
MOPHIMS-EPHT DHSS-EPHT
2016 Age-adjusted rates of emergency room (ER) visits and hospitalizations for asthma and COPD; and hospitalizations for heart attack per 10,000 people, based on the 2000 U.S. Census standard population. Source: DHSS MOPHIMS-Environmental Public Health Tracking (EPHT).
Melanoma Lung Cancer
MOPHIMS-EPHT MOPHIMS-MICA DHSS-EPHT
2016 Incidence of melanoma and lung cancer per 100,000 people, based on the 2000 U.S. Census standard population. Source: DHSS MOPHIMS-Missouri Information for Community Assessment (MICA) (cancer incidence).
Heat Related Illness DHSS-EPHT 2016 Age-adjusted rate of ER visits per 100,000 people, based on the 2000 U.S. Census standard population. Source: DHSS Bureau of Environmental Epidemiology, EPHT.
Source Years Description
Smoke-free Laws ANRF 2019 Municipalities with 100% smoke-free laws. Source: American Nonsmoker’s Rights Foundation (ANRF). In effect as of October 1, 2019.
E-Cigarette Use ANRF 2019 Municipalities with laws regulating use of electronic cigarettes. Source: ANRF. In effect as of October 1, 2019.
ABOUT THE DATA
ENVIRONMENTAL HEALTH PROFILE
MISSOURI ENVIRONMENTAL PUBLIC HEALTH TRACKING PROGRAM Bureau of Environmental Epidemiology
Missouri Department of Health & Senior Services ephtn.dhss.mo.gov | [email protected]
SMOKING
HEALTH
Source Years Description
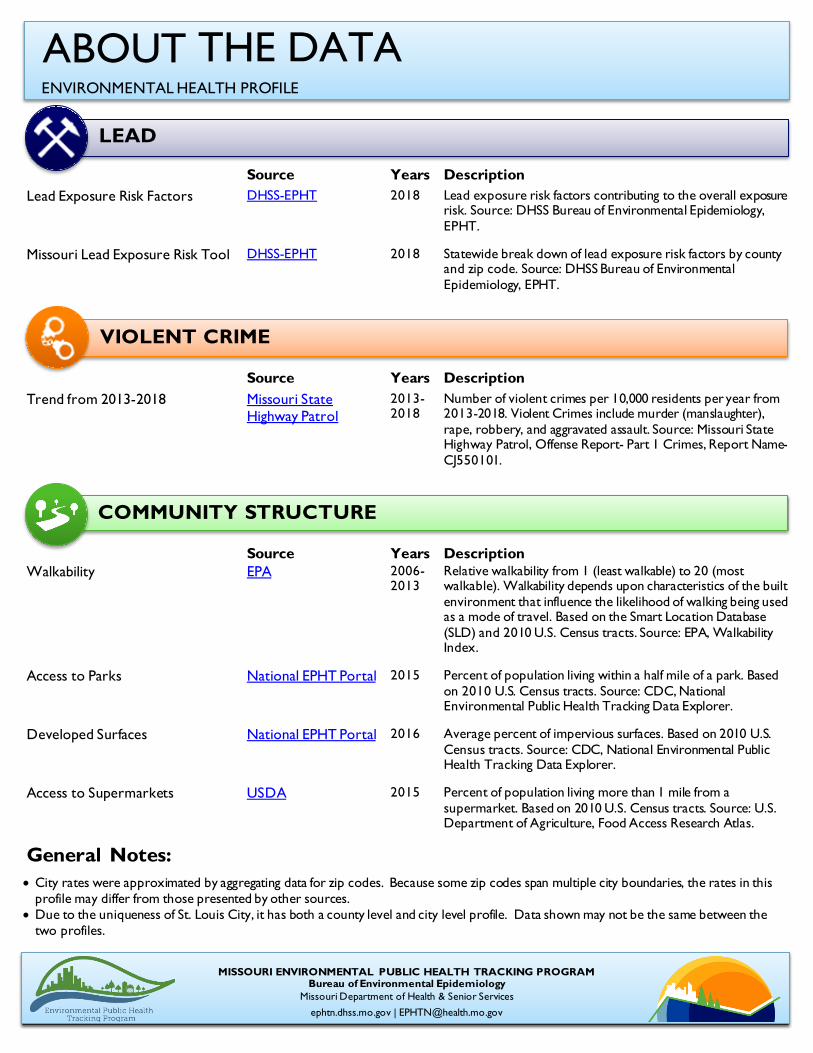
Lead Exposure Risk Factors DHSS-EPHT 2018 Lead exposure risk factors contributing to the overall exposure risk. Source: DHSS Bureau of Environmental Epidemiology, EPHT.
Missouri Lead Exposure Risk Tool DHSS-EPHT 2018 Statewide break down of lead exposure risk factors by county
and zip code. Source: DHSS Bureau of Environmental Epidemiology, EPHT.
Source Years Description
Trend from 2013-2018 Missouri State Highway Patrol
2013-2018
Number of violent crimes per 10,000 residents per year from 2013-2018. Violent Crimes include murder (manslaughter), rape, robbery, and aggravated assault. Source: Missouri State Highway Patrol, Offense Report- Part 1 Crimes, Report Name- CJ550101.
Source Years Description Walkability EPA 2006-
2013 Relative walkability from 1 (least walkable) to 20 (most walkable). Walkability depends upon characteristics of the built environment that influence the likelihood of walking being used as a mode of travel. Based on the Smart Location Database (SLD) and 2010 U.S. Census tracts. Source: EPA, Walkability Index.
Access to Parks National EPHT Portal 2015 Percent of population living within a half mile of a park. Based
on 2010 U.S. Census tracts. Source: CDC, National Environmental Public Health Tracking Data Explorer.
Developed Surfaces National EPHT Portal 2016 Average percent of impervious surfaces. Based on 2010 U.S.
Census tracts. Source: CDC, National Environmental Public Health Tracking Data Explorer.
Access to Supermarkets USDA 2015 Percent of population living more than 1 mile from a
supermarket. Based on 2010 U.S. Census tracts. Source: U.S. Department of Agriculture, Food Access Research Atlas.
General Notes:
• City rates were approximated by aggregating data for zip codes. Because some zip codes span multiple city boundaries, the rates in this profile may differ from those presented by other sources.
• Due to the uniqueness of St. Louis City, it has both a county level and city level profile. Data shown may not be the same between the two profiles.
LEAD
VIOLENT CRIME
COMMUNITY STRUCTURE
ABOUT THE DATA
ENVIRONMENTAL HEALTH PROFILE
MISSOURI ENVIRONMENTAL PUBLIC HEALTH TRACKING PROGRAM Bureau of Environmental Epidemiology
Missouri Department of Health & Senior Services ephtn.dhss.mo.gov | [email protected]


![[Songbook]Scott Joplin - The Best of Scott Joplin](https://img.pdfslide.net/doc/110x75/552ca7e14a7959e17c8b47ca/songbookscott-joplin-the-best-of-scott-joplin.jpg)