Embed Size (px)
Citation preview

Prepared For:
Microeconomics of Competitiveness
May 8, 2009
Jordan Tourism Cluster
Prepared By:
Jeremy Fischer Imran Khan Tulika Khemani Diane Mak Rosita Najmi

Jordan Tourism
TABLE OF CONTENTS
1. EXECUTIVE SUMMARY ........................................................................................... 1
2. ABOUT JORDAN ....................................................................................................... 2 2.1. GEOGRAPHY AND DEMOGRAPHICS .................................................................................. 2
2.2. POLITICS ....................................................................................................................... 2
2.3. ECONOMICS ................................................................................................................... 3
2.4. SOCIAL INDICATORS ....................................................................................................... 4
3. JORDAN DIAMOND ANALYSIS ................................................................................ 5 3.1. OVERVIEW OF JORDAN’S COMPETITIVE POSITION ............................................................ 5
3.2. FACTOR CONDITIONS ..................................................................................................... 6 3.2.1. Human Capital ............................................................................................................. 6
3.2.2. Transport, Energy, and Telecommunications Infrastructure ......................................... 8
3.2.3. Access to Finance ........................................................................................................ 8
3.3. DEMAND CONDITIONS ..................................................................................................... 9
3.4. CONTEXT FOR FIRM’S STRATEGY AND RIVALRY ............................................................... 9
3.5. RELATED AND SUPPORTING INDUSTRIES ....................................................................... 12
3.6. CONCLUSION ............................................................................................................... 13
3.7. STRATEGIC ISSUES AND RECOMMENDATIONS ................................................................. 15
4. JORDAN TOURISM CLUSTER ANALYSIS ............................................................ 16 4.1. GLOBAL TOURISM INDUSTRY ......................................................................................... 16
4.2. TOURISM IN JORDAN ..................................................................................................... 16
4.3. NATIONAL TOURISM STRATEGY: VISION 2004-2010 ...................................................... 18
4.4. CLUSTER ANALYSIS ...................................................................................................... 19
4.5. FACTOR INPUTS ........................................................................................................... 20
4.6. RELATED AND SUPPORTING INDUSTRIES: ...................................................................... 21 4.6.1. Hotels and Restaurants .............................................................................................. 22
4.6.2. Health Tourism ........................................................................................................... 23
4.7. DEMAND CONDITIONS ................................................................................................... 24
4.8. CONTEXT FOR FIRM STRATEGY AND RIVALRY ................................................................ 25
4.9. INSTITUTES FOR COLLABORATION .................................................................................. 26 4.9.1. Ministry of Tourism and Antiquities ............................................................................ 26
4.9.2. Jordan Tourism Board ................................................................................................ 27
4.9.3. Risks and Recommendations ..................................................................................... 28 5. BIBLIOGRAPHY ...................................................................................................... 29

1
1. EXECUTIVE SUMMARY
This analysis explores the microeconomic competitiveness of Jordan and its tourism cluster.
Although Jordan tries to remain politically neutral, the country is vulnerable to the political instability
of its neighborhood. Despite a modestly growing GDP, Jordan ranks well on the Global Competitive-
ness Index, a puzzle this analysis explores. Human development indicators show improvement, and
the government has ambitious goals and investments for health and education. Nevertheless, unem-
ployment is high, poverty continues, a youth bulge poses risks, and FDI could be more productive.
Human capital, access to finance for SMEs, unsophisticated demand, and infrastructure for transpor-
tation, energy, and telecommunications are among the various limitations to Jordan’s growth.
Although regional tourism is growing, tourism in Jordan is slow relative to its peers. Since
2004, the Ministry of Tourism and Antiquities has been leading a national tourism strategy, which
targets high-end tourists and promotes eco-tourism, adventure tourism, health tourism, leisure and
wellness tourism, religious tourism, and volunteer tourism. Despite efforts from both the private and
public stakeholders in the tourism cluster, this analysis identified a number of risks and areas of im-
provement.
This analysis reviews past and current policy initiatives and presents data that indicates re-
sulting impact. Based on a literature review, data analysis, and a number of individuals with key play-
ers in relevant ministries and the tourism sector, the analysis concludes with recommendations of both
short and long-term actions for both the public and private sector stakeholders to improve Jordan and
its tourism sector’s growth and competitiveness. For example, to improve the competitive national
environment, Jordan should offer scholarships and management training to alleviate the discrepancy
between the skills of adult population and the qualifications required for available jobs, improve
access of SMEs to financing, and channel FDI investments to productive investment. On the cluster
level, Jordan should provide extra security around tourist attractions and promote an image of a safe
country, manage conflict between tour companies and local communities afraid of cultural degrada-
tion, and improve the educational offerings for students of tourism.

2
2. ABOUT JORDAN
2.1. GEOGRAPHY AND DEMOGRAPHICS Bordered by Syria (to the North), Iraq (to the Northeast), Israel and the West Bank (to the
West), Saudi Arabia (to both East and South), the Hashemite Kingdom of Jordan (Jordan) is home to
6.2M people, including individuals of Palestinian (47%), Jordanian (30%), and Iraqi (14%) origin.
Arabic is Jordan’s official language, though many people also know English, and increasing
numbers speak French. Jordan’s climate is mostly desert, with primary bodies of water limited to the
Dead Sea, Jordan River, and Gulf of Aqaba.1 Jordan is 45,495 square miles in size, slightly smaller
than Indiana, with an urban population over 78%.2
2.2. POLITICS In 1946, Jordan declared its independence from Britain. A constitutional monarchy3 and legal
system that is based on Islamic law and French code govern Jordan’s twelve provinces. The
Government of Jordan (GoJ) legalized political parties in 1992, which number more than thirty.
Nevertheless, political parties have little influence on the political process, and King Abdullah II
remains watchful of public resentment at opaque policymaking. The Jordanians hold a long-standing
and positive relationship with their kings, and smooth transitions between them have contributed to
the country’s internal political stability. In 1948, 1967, and 1973, Jordan engaged in a number of
wars with Israel that culminated into the 1994 Israeli-Jordanian Peace Treaty. With its pro-Western
orientation, Jordan seeks nonalignment with regional conflict as much as possible.4 Although Jordan
maintains internal political stability, the country is vulnerable to external, regional political
instability, which for instance, spilled over into Jordan during the 2005 terrorist bombings (EIU
2009).
1 Jordan shares the Gulf of Aqaba with Israel, Saudi Arabia, and Egypt. 2 CIA World Fact Book, “Jordan” https://www.cia.gov/library/publications/the-world-factbook/geos/mg.html, accessed March 2009. 3 Jordan has a king and parliament. 4 Jordan offers humanitarian aid to Palestinian people.

3
2.3. ECONOMICS Jordan’s economy has enjoyed macroeconomic stability since the 1990s and is export
oriented. Jordan has signed a number of agreements (with the United States and Europe) that has
increased trade, including joining the WTO in 2000. Exports include clothing, fertilizers, potash,
phosphates, vegetables, and pharmaceuticals to the United States (22.4%), Iraq (12.9%), India
(8.3%), UAE (7.8%), Saudi Arabia (7.5%), and Syria (4.9%). Yet, as the global economic crisis
reduces demand for exports from the United States, in the short-term, Jordan might have to shift its
reliance to an already fast-rising demand for exports from Iraq. In 2007, Jordan’s imports of crude
oil, machinery, transport equipment, iron, and cereals came from Saudi Arabia (21%), China (9.7%),
Germany (7.5%), United States (7.5%), and Egypt (4.4%).5
While the country has maintained a real GDP growth rate of approximately 6%, the
government deficit has grown, measuring 17.5% of GDP in 2007. The largest economic sectors in
2007 were financial services, real estate, and business services (22% of GDP) and manufacturing
(20% of GDP). Agriculture only contributes 3.4% of GDP. Jordan’s sources of revenue include taxes
(21% of GDP), remittances (21%), and foreign aid (3%). The Central Bank’s accounting for foreign
aid, however, is not comprehensive. Jordan’s largest donor, USAID, for instance gave US$488M in
2004, which would not have been reflected in the reported figure for foreign aid (Central Bank of
Jordan 2007).
On the expenditure side, 5% of GDP is spent on the defense, 4.9% on education, and 7% on
refugees.6 In 2008, Jordan’s cumulative domestic investment measured 34.1% of GDP. In 2006,
Jordan carried US$7.3M of outstanding external public debt. While most was owed to foreign
5 CIA World Fact Book, “Jordan” https://www.cia.gov/library/publications/the-world-factbook/geos/mg.html, accessed March 2009.
6 Refugees are 1.8M Palestinian and 0.5M from Iraq.

4
governments,7 Jordan also borrows from the European Investment Bank, IMF, World Bank, Islamic
Development Bank, and the Arab Fund for Economic and Social Development. Jordan’s total public
debt was 58.3% of GDP in 2008. The Jordanian dinar is pegged to the US dollar (0.709), and the
country has managed to control inflation, projecting a decrease from 14.9% (2008) to 4.7% in 2009
(Central Bank of Jordan 2007).
Since 2000, GDP per capita has been steadily increasing.8 However, real GDP growth has
been slowing down in the last five years. Jordan’s steady and high unemployment rate, officially
recorded at 12.6% in 2008 (unofficially reported at 30%) is also concerning.9 Each year, 40,000
additional Jordanians enter into the labor market, which already counts 194,000 unemployed
persons. In 2001, Jordan updated the Vocational Training Corporation Law to support the growing
unemployment and also launched the Jordan Education Initiative Project in 2003. The 2008
employed labor force was 1.615M people, who worked in agriculture (2.7%), industry (20%), and
services (77.4%).
2.4. SOCIAL INDICATORS Jordan has made human development a national priority and can be proud of its achievement
of ranking ninth out of 19 (mostly wealthier) Arab countries for its HDI value. Jordan’s orientation
towards women contributes to its strong HDI ranking. One example of gradual improvement in
women’s rights is the 20% of seats in all municipal councils that are reserved by quota for women
since 2003.10 The Government also set an ambitious goal of 100% health insurance coverage by
2012 (EIU 2009). Although Jordan’s relative human development indicators ranking is strong,11 a
number of issues threaten social stability.
7 Japan, Germany, France, UK, and US 8 PPP dollars in 2008 reached $5,000 9 CIA World Fact Book, “Jordan” https://www.cia.gov/library/publications/the-world-factbook/geos/mg.html, accessed March 2009. 10 CIA World Fact Book, “Jordan” https://www.cia.gov/library/publications/the-world-factbook/geos/mg.html, accessed March 2009. 11 Human Development Index (HDI) of 0.77 out of scale of 0-1

5
Despite some human development strengths, Jordan faces a number of risks including one
related to a regional youth bulge. With 38% of its population under 14 years old and 70% under age
29, Jordan has one of the youngest populations among lower-middle income countries.12 If this large
and young population is not engaged in employment, it will be vulnerable to regional Islamic
militancy or emigration, the latter of which would result in potential long-term brain drain.
3. JORDAN DIAMOND ANALYSIS
3.1. OVERVIEW OF JORDAN’S COMPETITIVE POSITION
Jordan is something of an enigma.
Since the Global Competitiveness Index (GCI)
was created in 2001, the country has ranked
well on the Index, and its 2008 ranking of 46
on the 134-country survey is an improvement
over the last few years. Yet, the income level of
Jordan is much closer to its less competitive
neighbors Egypt and Morocco and further from
levels of Israel and other more competitive
peers, as illustrated in Figure 1. What is behind
this discrepancy? The following analysis highlights the key issues underlying the seeming strengths
of the economy which may account for this.
12 IMF, "Jordan” http://dsbb.imf.org/Applications/web/gdds/gddscountrycategorylist/?strcode=JOR#SUM, accessed March 2009.
Source: Global Competitiveness Index 2008
Figure 1 Competitiveness Ranking vs. GDP per capita

6
3.2. FACTOR CONDITIONS
3.2.1. Human Capital
Jordan ranks well across all factor conditions within the GCI, particularly in educational
attainment and transportation, administrative, and capital market infrastructure, where it approaches
the regional leaders. It ranks less competitively on telecommunications and innovation measures,
much closer to expectations for a country with $5,000 per capita income.
One explanation for the high social attainment is that the Government of Jordan (GoJ) spends
20% of its budget on education and 5% of the budget on health. These compare favorably to other
countries in the region. Looking toward the future, the GoJ is moving toward a knowledge
economy, using two thirds of its education budget to fund initiatives to teach English to all primary
school students and to place computers in each classroom (Ministry of Planning and International
Cooperation (MoP), 2004). Although Jordan already has a high number of scientists and engineers
available, Jordan has extremely low levels of patents: only 21 utility patents on record with the
United States Patent and Trademark Office.13
Despite the high level of educational attainment in Jordan, the labor market is puzzling.
Companies in Jordan resort to hiring foreign workers to fill a variety of positions, including
managers at all levels as well as nurses.14 Brain drain is a big concern in Jordan, as employees in the
engineering, financial services, IT, and other sectors have left for higher paying jobs in the region
(Ghazal “Rising Cost”, 2008). This hiring of foreign workers points to a gap between the jobs
demanded and the skills available among Jordanians.
13 U.S. Patent and Trademark Office (USPTO), “Patents by Country, State, and Year – Utility Patents (December 2008),” http://www.uspto.gov/web/offices/ac/ido/oeip/taf/cst_utl.htm, accessed May 2, 2009.
14 Nour Al Tarawaneh, Senior Researcher, Jordanian Ministry of Planning and International Cooperation, interview by authors (via
telephone), Amman, Jordan, April 5, 2009.

7
Though the GoJ’s proposal to increased technology and English language training is a step in
the right direction, the effort was initiated only in 2004, and it will take many years for the impact to
be realized and for this lagging indicator to appear in macroeconomic evaluations (MoP, 2004). To
ensure short-term results, Jordanian authorities have worked with high schools, vocational schools,
and universities to modify curricula to better align with the needs of employers. In addition, Jordan
has expanded managerial training through technical and vocational and educational training (TVET).
Given the recent real estate boom fueled by investments from the Gulf Coast Countries, the initial
focus has been training 5,000 managers in the real estate sector, though TVET programs will soon
begin targeting managers in other industries.15
Interestingly, high skilled jobs are not the only ones Jordan fills with guest workers. The
Jordanian apparel industry employs large numbers of low-skilled workers from abroad. Foreign
workers’ willingness to work for lower salaries and a record of fewer complaints about poor working
conditions accounts for much of the story. In response to a scandal where Jordanian companies were
accused of abusing foreign workers in the apparel sector, the Jordanian legislature created an Action
Plan to Strengthen Labor Compliance in 2007 aimed at protecting workers rights ((EIU, 2009; FIAS,
2008). Finally, recent immigration policies eased visa requirements for Iraqis, Chinese, and Indians,
such that they can more easily travel to Jordan for work and tourism.
Compared to Egypt, Jordan’s labor costs are more than 52% higher for the same low-skilled
positions.16 However, labor productivity, measured in GDP per employee, is only 17% higher.17 One
explanation is that a minimum wage law in the apparel sector artificially inflates wages. Yet despite
15 Nour Al Tarawaneh, Senior Researcher, Jordanian Ministry of Planning and International Cooperation, interview by authors (via
telephone), Amman, Jordan, April 5, 2009. 16 Authors’ calculations from International Labour Organization data from www.ilo.org, accessed March 2009.
17Authors’ calculations based on data from Groningen Growth and Development Centre web site http://www.ggdc.net/databases/ted.htm, accessed March 2009.

8
this, Jordan still has trouble hiring and retaining workers. Jordanian low-skilled workers are a less
competitive than in neighboring countries.
3.2.2. Transport, Energy, and Telecommunications Infrastructure
Jordan’s transportation infrastructure is strong overall and improving through better
management and increased routes. The GoJ privatized the national airline in 2007, as part of easing
restrictions on private investment and gradually privatizing other transportation, energy, and
telecommunication industries. The GoJ is planning to expand the railway and create a new port south
of Aqaba near the border with Saudi Arabia to ease competing demands of Jordan’s lone port. This
will strengthen Jordan’s position as a transshipment point for Iraq, mirroring the way the airport has
been a hub for travel to Iraq (EIU, 2008). Energy is considered to be adequate, though
telecommunications are still less developed than they could be.
3.2.3. Access to Finance
Jordan receives good marks on the GCI for easy access to loans and other financial
indicators. However, a number of sources, including the World Bank’s Doing Business Survey, cite
access to credit as one of the major constraints in the Jordanian economy. An interview with a
representative of the Ministry of Planning in Jordan18 and USAID’s department of Development
Credit19 confirmed this as a major issue, as well. In Jordan, 99% of firms are small and medium
enterprises, accounting for 40% of the value added production and employ 70% of workers in the
country (MoP, 2009). Small and medium enterprises (SMEs) are widely expected to play a major
role in Jordan’s growth, but can only do so with the ability to take out loans to expand their
businesses and to employ more workers.
18 Nour Al Tarawaneh, Senior Researcher, Jordanian Ministry of Planning and International Cooperation, interview by authors (via
telephone), Amman, Jordan, April 5, 2009
19 Sashi Salvendran, USAID Development Credit Authority, interview by authors, April 21, 2009.

9
3.3. DEMAND CONDITIONS
Jordan is a small market with relatively unsophisticated demand. Most of the major clusters,
such as tourism and hospitality, apparel, and agriculture, are export-oriented and are not particularly
focused on meeting the demands of the local market. Jordan does compare more favorably on the
GCI in areas of information communication and technology (ICT) promotion and procurement of
advanced technology, which is in alignment with their focus on evolving into a knowledge economy.
While this could be a driver of demand and sophistication in the IT sector moving forward, this
cluster has yet to develop substantially. Information technology makes up a negligible percentage of
Jordan’s exports, having fallen significantly since its peak in 2001 (ICCP, 2008).
3.4. CONTEXT FOR FIRM’S STRATEGY AND RIVALRY
Jordan ranks well on CSR indicators on the GCI relative to regional competitors. Since 1997, the
Government of Jordan (GoJ) introduced a series of policies to increase the country’s economic
competitiveness. Examples include the 1997 Executive Privatization Unit, which assisted in the
completion of 64 privatization transactions since its inception, and the launch of the 2001 Aqaba
Special Economic Zone (ASEZA), which is a model for
streamlining investment procedures. The ASEZA successfully
attracted over 1,500 new enterprises and a total investment of US$
1.5B in registered capital between 2001 and 2005, with an
estimated US$ 11B additional investment forecasted for 2006-2014
(JNCT, 2007).
Despite this progress, there is still significant room for
improvement, as evident in the World Bank’s Doing Business
Report (Figure 2). Specific weaknesses include protecting investors
137
28
24
16
102
24
5
30
145
113
113
46
151
41
70
114
112
62
164
128
128
131
113
101
0 100 200
Enforcing Contracts
Starting a Business
Protecting Investors
Ease of Doing Business
Jordan Morocoo Egypt UAE Israel Saudi Arabia
Source: 2009 Doing Business Report
Figure 2 Ease of Doing Business Index 2009

10
(Jordan ranks 113th out of 181 countries), starting a business (131th), and enforcing contracts
(128th), which collectively increase the risks, delays, and transaction costs of doing business in
Jordan. The “one-stop-shop” initiated under the Jordan Investment Board (JIB) in 2004 aims to
streamline procedures for licensing and registration of new investment projects by having nine of the
16 relevant government agencies co-located. However, the CEO of the JIB acknowledges room for
improving the efficiency of the operation, the main obstacles being the lack of legal authority of
ministry officials to make decisions regarding projects, the lack of representation of certain
ministries, and the delay caused by late responses from institutions or ministries to requests.20
The Jordanian government, aware of the challenges to doing business, is scheduled to launch
the new National Investment Strategy (NIS) later in 2009 to simplify investment procedures (EIU
2009). Drawn up in consultation with key business leaders, the NIS concentrates not only on easing
bureaucratic restrictions (for example by simplifying rules for business start-ups and by easing hiring
and firing regulations), but also on reforming the tax system. However, the implementation of the
NIS may be delayed due to the more urgent challenges presented by
the global financial crisis.
Jordan has made great strides following its 2000 accession to
the WTO in liberalizing its trade regime. In addition to membership
with the Pan-Arab Free Trade Area and the Free Trade Area with
Egypt, Morocco, and Tunisia, Jordan has bilateral trade agreements
with the United States, Singapore, and the European Community
European Free Trade Association. Although tariff rates for imports are
20 Jordan Business Magazine, “National Strategy”, http://www.jordan-business.net/magazine/index.php?option=com_content&task=view&id=217&Itemid=40, accessed May 2009.
15
23
36
36
46
90
20
26
37
40
44
92
0 50 100
Saudi Arabia
United Arab Emirates
Israel
Egypt
Morocco
Jordan
%
Figure 3 FDI stock as percentage of GDP
2007 2006
Source: World Investment Report 2008

11
still high,21 they are likely to be progressively lowered with the implementation of the various free
trade agreements. Also, under the Qualifying Industrial Zone (QIZ) initiative, exports from
designated industrial parks in Jordan have benefitted from duty-free and quota-free access to the
United States22 (WTO, 2008).
From 2000 until 2006, Jordan has attracted significant amounts of FDI (Ghazal “Jordan
Ranked,” 2008). Inward FDI flows as a percentage of gross fixed capital formation was 42.7% in
2007, and as illustrated in Figure 3, FDI stocks as a percentage of GDP amounted to 91.9%, much
higher than regional comparators (UNCTAD, 2008). High FDI flows are partly attributable to the
political stability of Jordan, its government’s commitment to economic reform, and its location in the
neighborhood of Gulf Coast Countries (GCCs).23 Until the recent decline in oil prices, Jordan had
been flush with high liquidity due to its endowment of oil and natural gas reserves. Eighty-five
percent of these foreign direct investments bankrolled industrial projects, which includes an
unreported but large component funding real estate, 10% to hotels and agriculture, and the rest to
hospitals and exhibitions and conferences. Since FDI plays such a significant role in the economy,
the new NIS can give the Jordanian Government more guidelines in managing investments, such as
those from Saudi Arabia and Qatar, and Abu Dhabi National Energy Company’s investment in the
oil shale sector.
One major concern relating to FDI inflows is the likelihood that the majority of capital might
be going to unproductive real estate investments and threatening upward pressure on inflation and
the cost-of-living (JNCT, 2007). Furthermore, the majority of 2006 and 2007 FDI increases can be
attributable to a few major privatization initiatives that attracted large interest from regional
21 High tariff rates include those for agricultural imports at an applied MFN average rate of 16.7% in 2008. 22 These are subject to specified shares of inputs originating in certain countries in the region (Israel, Jordan and Palestine) and from the United States. 23 Gulf Coast Countries include: Saudi Arabia, Kuwait, Bahrain, Qatar, the United Arab Emirates, and Oman.

12
investors. Relatively little FDI financed new business initiatives that would support the
competitiveness of the Jordanian economy.24
3.5. RELATED AND SUPPORTING INDUSTRIES
Jordan ranks well on most RSI indicators and has made progress in cluster development. The
Jordan National Competitiveness Team (JNCT) was set up by the Ministry of Planning and
International Cooperation in 1997. Funded by USAID from 1998 to 2007, the JNCT was tasked with
assessing, evaluating, and improving the competitiveness of various industries and economic clusters
in Jordan.25 The Jordan National Competitiveness Observatory (JNCO) was established in 2007 to
sustain the JNCT’s efforts and to systematically assess and measure the competiveness of the
Jordanian economy.26 In addition, the Jordan Enterprise Development Corporation (JEDCO) was
established in 2003 and responsible for export promotion and financial and technical support to
upgrade Jordan’s industries.
Source: ICCP
Figure 4 Key Clusters – Changes in World Export Share 1997-2007
24 AME Info, “Jordan steps up efforts to attract foreign direct investment”, http://www.ameinfo.com/147262.html, accessed May 2009. 25 Jordan National Competitiveness Team, “Origin of JNCT” http://www.competitiveness.gov.jo/origin.php, accessed May 2009. 26 Jordan National Competitiveness Observatory, “What is JNCO” http://www.jnco.gov.jo/static/about1.shtm, accessed May 2009.

13
As can be seen from above Figure 4, the largest export clusters are hospitality and tourism,
agricultural products, and apparel, followed by transportation and logistics and biopharmaceuticals.
Of these, only apparel and biopharmaceuticals have shown any meaningful increase in world market
share over the last ten years. Apparel has grown at 58% CAGR and biopharmaceuticals at 33%.
However, in the last few years, the apparel sector has shown no growth, while the
biopharmaceuticals industry has been expanding rapidly.
Various challenges to cluster development exist. In particular, an unsatisfactory level of
support services across many of the clusters seems to have inhibited their development. For example,
the apparel sector has been constrained by a lack of managerial, exporting, and marketing skills
(USAID 2007), while in the tourism sector, a shortage of skilled personnel in communications,
management, marketing and sales, and customer care has been identified as a problem. Moreover, a
lack of investments to upgrade capital in the agriculture and apparel clusters has kept productivity
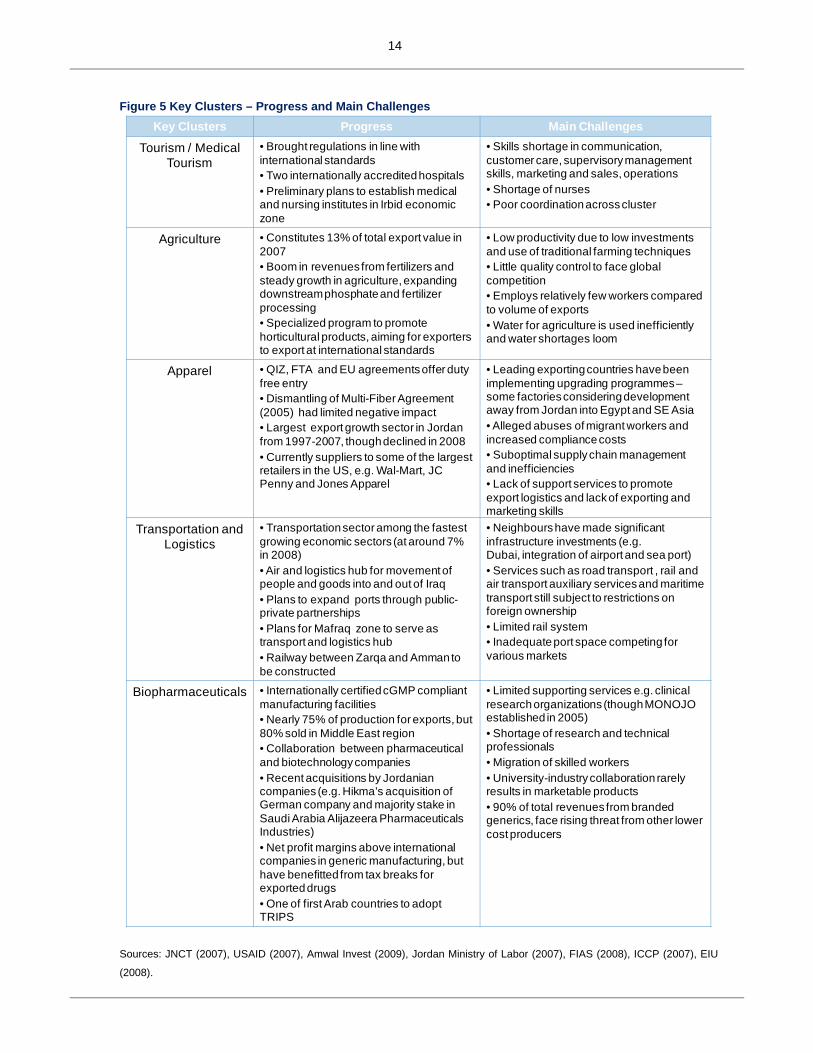
low. Figure 5 (next page) summarizes the progress made and main challenges faced by key clusters
in Jordan.
3.6. CONCLUSION After reviewing the data, several possible explanations exist to the question, why has Jordan
not grown more quickly than it has, considering its competitive position? The first possibility is that
despite the high level of competitiveness Jordan exhibits, the Global Competitiveness Indicators are
unable to account for a few critical factors that present binding constraints to accelerated economic
growth, including a skills gap, lack of financing for SMEs, and FDI in the form of hot money that is
being funneled primarily into unproductive real estate projects. A second explanation is that the
correlation between competitiveness and income is not perfect, and it may be unreasonable for us to
expect this to be so. Finally, there might be a lag between improved competitiveness measures
stemming from new policy initiatives and increased income.
14
Figure 5 Key Clusters – Progress and Main Challenges Key Clusters Progress Main Challenges
Tourism / Medical Tourism
• Brought regulations in line with international standards• Two internationally accredited hospitals• Preliminary plans to establish medical and nursing institutes in Irbid economic zone
• Skills shortage in communication, customer care, supervisory management skills, marketing and sales, operations• Shortage of nurses• Poor coordination across cluster
Agriculture • Constitutes 13% of total export value in 2007• Boom in revenues from fertilizers and steady growth in agriculture, expanding downstream phosphate and fertilizer processing• Specialized program to promote horticultural products, aiming for exporters to export at international standards
• Low productivity due to low investments and use of traditional farming techniques• Little quality control to face global competition• Employs relatively few workers compared to volume of exports• Water for agriculture is used inefficiently and water shortages loom
Apparel • QIZ, FTA and EU agreements offer duty free entry • Dismantling of Multi-Fiber Agreement (2005) had limited negative impact• Largest export growth sector in Jordan from 1997-2007, though declined in 2008• Currently suppliers to some of the largest retailers in the US, e.g. Wal-Mart, JC Penny and Jones Apparel
• Leading exporting countries have been implementing upgrading programmes –some factories considering development away from Jordan into Egypt and SE Asia• Alleged abuses of migrant workers and increased compliance costs• Suboptimal supply chain management and inefficiencies• Lack of support services to promote export logistics and lack of exporting and marketing skills
Transportation and Logistics
• Transportation sector among the fastest growing economic sectors (at around 7% in 2008)• Air and logistics hub for movement of people and goods into and out of Iraq• Plans to expand ports through public-private partnerships• Plans for Mafraq zone to serve as transport and logistics hub • Railway between Zarqa and Amman to be constructed
• Neighbours have made significant infrastructure investments (e.g. Dubai, integration of airport and sea port)• Services such as road transport , rail and air transport auxiliary services and maritime transport still subject to restrictions on foreign ownership • Limited rail system• Inadequate port space competing for various markets
Biopharmaceuticals • Internationally certified cGMP compliant manufacturing facilities• Nearly 75% of production for exports, but 80% sold in Middle East region• Collaboration between pharmaceutical and biotechnology companies• Recent acquisitions by Jordanian companies (e.g. Hikma’s acquisition of German company and majority stake in Saudi Arabia Alijazeera Pharmaceuticals Industries) • Net profit margins above international companies in generic manufacturing, but have benefitted from tax breaks for exported drugs • One of first Arab countries to adopt TRIPS
• Limited supporting services e.g. clinical research organizations (though MONOJO established in 2005)• Shortage of research and technical professionals• Migration of skilled workers• University-industry collaboration rarely results in marketable products• 90% of total revenues from branded generics, face rising threat from other lower cost producers
Sources: JNCT (2007), USAID (2007), Amwal Invest (2009), Jordan Ministry of Labor (2007), FIAS (2008), ICCP (2007), EIU
(2008).

15
3.7. STRATEGIC ISSUES AND RECOMMENDATIONS
Macro and National Recommendations for Jordan
Issue Recommendations: Short Term (ST), Medium Term (MT), Long Term (LT)
Primary Actors
High Priority
Skills gap between available jobs and qualifications of employees in key areas such as management, nursing, sales, and marketing
• Offer scholarships for careers in key fields related to cluster strengths (ST)
• Privately funded TVET (technical and vocational education and training) toward executive management training across all industries (ST)
• Promote Jordan’s role as technological and educational center for region (LT)
• Universities
• Private companies
• Government of Jordan Ministries of Planning and Education
Low access to finance for SMEs
• Improve regulations governing granting of loans (MT – LT)
• Provide loan guarantees for qualifying SMEs (MT – LT)
• National Government
• USAID Development Credit Authority
Hot money flows towards real estate, while there is a lack of investments in upgrading clusters
• Jordan Investment Board to launch active campaign of promoting alternative investment opportunities in Jordan, in coordination with recommendations from the JNCO (ST)
• Remove restrictions on foreign ownership in services such as road transport, rail, and air transport auxiliary services, and maritime transport to enable FDI to flow into these essential sectors (MT – LT)
• Government – Jordan Investment Board and the Jordan National Competitiveness Observatory
• Government
Medium Priority
Non-Transparent Policymaking
• Increase transparency (ST) Government
Regulatory environment not conducive to doing business
• Maintain momentum for support and implementation of new National Investment Strategy (ST)
• Grant legal authority to ministry officials at “one-stop-shop” to make decisions regarding licensing and registration of investment projects (ST)
• Mandate representation from all 16 related ministries in the “one-stop-shop” (ST)
• Government – Jordan Investment Board
• Business community
16
4. JORDAN TOURISM CLUSTER ANALYSIS
4.1. GLOBAL TOURISM INDUSTRY The global tourism industry has shown robust growth in recent years, with international tour-
ist arrivals increasing from 536M to 924M between 1995 and 2008. At the same time, tourists have
sought out an increasingly diverse27 number of destinations over the last 50 years. The Middle East
has been one of the main beneficiaries of this diversified growth. In 2006, tourist arrivals into the
region grew by 15%, compared to 6.9% for the world (World Tourism Organization, 2009). The
tourism industry’s growth is inhibited by a range of threats including, virus outbreaks such as SARS,
international terrorism, and more recently the global recession. These threats are much more
pronounced in the Middle East, where political instability and terrorism has often resulted in tourists
being targets.28
4.2. TOURISM IN JORDAN The history of tourism in Jordan extends back to the 4th Century when Christian pilgrims
started arriving to church built on Mount Nebo. Figure 6 is a timeline of developments in the tourism
sector. The industry makes a substantial contribution to the Jordanian economy. For 2008, it
accounted for 10.5% of the GDP, with a CAGR of 15.4% during the period 2003-07 (ABC, 2009).
Employment in the tourism cluster, including indirect employment, was estimated at around 130,000
(11% of the work force). The tourism cluster itself employs 34,405 people, of which 77.5% were in
the hotels and restaurant industry. In 2008, the employment just around Amman accounted for 71%
of the total national employment. Women just form 10% of the overall tourism employment, a
proportion that has not changed much over the years. Within the hotel industry, five-star hotels
27 The top 15 destinations accounted for 98% of all tourist arrivals in 1950; the same for 2007 was 57%. 28 Al Jazeera. “Chronology of attacks on tourists in Egypt” http://english.aljazeera.net/news/middleeast/2008/09/200892213927831637.html, accessed May 2009.

17
employed 7,358 workers amounting to 20% of the overall direct employment in the tourism
industry.29
Figure 6 Timeline for Jordan Tourism
4th Century: Church built at Mount Nebo
1908: The Hijaz Railway inaugurated
1946: Jordan Gains Independence
1968: Dept. of Tourism established
1970: Patients from the region start coming to Jordanian hospitals
1984: Wadi Rum
discovered as a
climbing destination
1987: Investment Law awards incentives for investing into Tourism and Health sectors
1988: Department of Tourism becomes the Ministry of Tourism and Antiquities (MoTA)
1992: Political Parties Legalized
1994: Peace Treaty with
Israel
1997: Jordan National Competitiveness Team established
1998: Jordan Tourism Board
Established
1999: Jordan Becomes a member of the WTO
2000: Intifada: Jordan saw a
huge decline in tourism
2001: Aqaba Special Economic Zone Authority inaugurated
In comparison with regional peers however, Jordan’s tourism industry shows very low growth, both
in terms of tourist arrivals as well as their expenditure. This is illustrated in Figures 7 and 8 below.
29Ministry of Tourism and Antiquity Statistics. http://www.locateme.jo/stat2008/1/statE.htm, accessed March 2009.

18
Figure 7: Tourist Arrivals (M) Figure 8: Tourist Expenditure ($B)
Source: World Tourism Organization 2009
4.3. NATIONAL TOURISM STRATEGY: VISION 2004-2010
Given the importance of the tourism sector to the economy, the GoJ, through the Ministry of
Tourism and Antiquities (MoTA), has focused considerable attention in recent years on developing a
coherent strategy. Previously, this strategy had been driven by ad hoc foreign aid and private
investments.
The GoJ focuses on medium to high-end customers in order to maximize the total daily reve-
nue per tourist. Presently, tourism demand is concentrated in the archaeological and medical tourism
segments. The MoTA has identified several potential niche tourism markets such as eco-tourism,
adventure tourism, health tourism, leisure and wellness tourism, religious tourism, and volunteer
tourism. Targeting the low-end mass market is unsustainable, because Jordanian tourist sites do not

19
have the infrastructure to support large volumes, and because low-end tourists will not generate high
revenues.30
In 2004, the MoTA developed a four-pronged strategy to develop the tourism cluster: 1)
strengthen tourism marketing (generating demand), 2) support product development (related and
supporting industries), 3) develop human resources (factor conditions), and 4) provide an effective
institutional and regulatory framework (context for firm strategy and rivalry). To this end, the GoJ
has allocated resources for international marketing, product development, and human resources
development through 2010.
4.4. CLUSTER ANALYSIS The cluster map is centered on the four pillars of tourism: accommodation, restaurant and food
service, transportation, and attractions. Actors in Jordan’s tourism range from small vendors to
USAID.
Technical / Financial
Assistance
ATTRACTIONSHistorical and religious sites, adventure sports, shopping malls, eco tourism (e.g. Dana Nature Reserve), private hospitals and specialized clinics, small vendors, handicrafts
ACCOMODATIONHotels and Resorts, e.g.
Marriot, MövenpickHotels & Resorts
Suppliers / Maintenance
services
Tour operators
Travel agencies
E‐tourism
INTERNATIONAL ORGANIZATIONS
e.g. USAID, UNESCO
IFCsJordan Tourism
Board, Jordan Hotel Association, Jordan Society of Tourist and Travel Agents, Fair
Trade Jordan
EDUCATION INSTITUTIONSe.g. Amman Hospitality College, Jordan
University Hospital
Financial Services
Construction industry
GOVERNMENT AGENCIES
Ministry of Tourism and Antiquities, Public
Transport Regulatory Commission, Medical Tourism Directorate
RESTAURANTS & FOODSERVICE
TRANSPORTATIONAirlines, ground transport, railway,
shipping
30 Malia Asfour, Director of Jordan Tourism Board North America, interview by authors, Washington DC, March 31, 2009.
Figure 9: Cluster Map

20
6
87 87
26
95
65
29
125
52
20
109
606049
57
19
117
84
Affinity for Travel and Tourism
Natural Resources Cultural Resources
Jordan Tunisia Morocco Egypt Israel UAE
Source: The Travel & Tourism Competitiveness Report 2009 by World Economic Forum
Figure 10 T&T Competitiveness Ranking
Source: Transportation Sector (2009) Amwal Invest
Figure 11 Number of accidents by year
4.5. FACTOR INPUTS Jordan’s tourism industry relies heavily upon
its historical and natural resources. The country ranks
higher than many of its peers on the quality of its
historical as well as its natural heritage, as well as
highly on the openness of its people to tourism and to
foreigners (Figure 10). However, various threats to the
tourism sector also exist. For example, high
concentrations of tourists threaten Petra,31 and
degradation and environmental concerns related to the
Gulf of Aqaba32 are also rising.
Ground transportation infrastructure plays a very important
role in Jordan’s tourism cluster. For one thing, it is the preferred
means of entry to Jordan for 76% of foreign
visitors.33 Jordan ranks lower on the quality of its
ground transport than some of its leading regional
neighbors.34 Some of the main problems the
public transport sector faces are a very low level
of coordination among transporters as well as an
alarmingly high increase in accidents in recent
31 Ministry of Tourism and Antiquity reports Petra attracted 26% of all tourists who visited historical sites.
32 Gulf of Aqaba is being promoted as a beach resort.
33 MoTA Statistics. http://www.locateme.jo/stat2008/1/statE.htm, accessed March 2009.
34 Jordan ranks 69th, while Tunisia is 42nd, Israel 36th, and UAE 39th on the TTCR 2009.

21
years. The Public Transport Regulatory Commission was formed in 2001 specifically to oversee the
public transport sector. The commission is currently addressing the problem of low-coordination by
consolidating unprofitable routes.
Presently, a total of 11 universities (including three state-owned), 10 colleges and 16 voca-
tional training centers are involved in providing tourism specific education. However, various
business surveys35 indicate that a majority of the industry respondents were not satisfied with the
quality of graduates produced by these institutes. The skills shortage might be a reason why in 2008
foreigners constituted 18% of the overall tourist workforce, up from 10% in 2004.36 The Govern-
ment is also cognizant of this fact, and therefore allows new businesses in Aqaba to hire foreigners,
up to 70% of the workforce.
4.6. RELATED AND SUPPORTING INDUSTRIES: Figure 12 below depicts the typical tourism value chain and highlights the degree of
interdependence which exists among the different sectors. It suggests the importance of a national
strategy for tourism buttressed by a strong public and private collaboration and coordinated
development. For instance, popular tourist sites need to be supported by information and good
35 Siyaha Project USAID. Survey carried out by the JNCO 2007. 36 MoTA Statistics. http://www.locateme.jo/stat2008/1/statE.htm, accessed May 2009
Figure 12:
Tourism Value Chain
Source:
Ministry of Tourism and Antiquities.
Jordan National Tourism Strategy 2004 – 2010

22
infrastructure in order to create a strong brand and to generate repeat visitors. Similarly, good hotels
and high quality services should support a good marketing campaign. Hence, a national tourism
strategy becomes imperative for coordinated development (JNCO, 2007). The GoJ analyzed the
strengths and weaknesses of the salient pillars of tourism, including accommodation, transport, food,
tourism services, and activities for each of the aforementioned niche markets.
4.6.1. Hotels and Restaurants
Jordan’s hotels and restaurants employ the bulk of the labor force working in tourism. In
2008, they contributed 1.7% of GDP (ABC, 2009). Hotel accommodations range from one- to five-
star hotels. In 2008, five-star hotels accounted for almost half of the total nights spent.37 The hotel
sector has managed to attract a substantial amount of investment in recent years.38 Many internation-
al hotel chains are competing in the industry and include some award-winning spas near the Dead
Sea.39 In recent years, the tourism industry has gone through changing dynamics, where restaurants
are becoming the high growth segment, while hotels are showing stagnancy.40 Increasing growth in
the restaurant sector indicates a rising appetite of Jordanians for eating out. A wide variety of
international restaurant franchises have entered the market, which suggests increased competition in
the industry.41 The stagnancy in the hotel industry might be explained by low occupancy rates or by
the fact that Jordanian hotels are highly dependent upon European tourists for its demand. 42 This is a
market segment that is very vulnerable to changes in perceptions about Jordan’s security emanating
from regional instability. The GoJ has been encouraging hotel construction, with special emphasis in
the Aqaba specialized economic zone (JNCO, 2007).
37 MoTA statistics, http://www.locateme.jo/stat2008/1/statE.htm, accessed March 2009. 38 Catholic Student Bay (US$500M), the Ayla Oasis project (US$750M), the Saraya Aqaba project (UD$362M), the Sun Days Water Park (US$60M), the Aqaba Ishkar Kempinski Hotel (US$60M), the Royal Metropolis-Jordan Gate and Royal Villages of Amman (US$1B), the Dead Sea Holiday Inn Hotel (US$21M), and the Crowne Plaza Hotel at the Dead Sea (US$49M). 39 Include: Movenpick, Marriot, Intercontinental, Radisson, Crown Plaza, Grand Hyatt among others. 40 JNCO reports that from 2003 to 2006, there has been a 62% increase in the number of restaurants. 41 Includes: McDonalds, KFC, Pizza Hut, Subway. http://meltingpot.fortunecity.com/oregon/639/ammanrestaurants.html, accessed
March 2009. 42 Europeans accounted for more than 50% of the nights spent in hotels ranked 3-star and above.

23
4.6.2. Health Tourism
Health tourism is a core part of the tourism cluster. During the 1970s, Arab patients from
around the region started arriving in Jordan for medical treatment. Today, Jordan’s health sector has
a reputation for subspecialties, such as cardiovascular surgery, transplantation, cancer treatment, and
plastic surgery. The private sector accounts for 54% of the hospitals and 46% of the beds available.43
The GoJ has been very responsive towards the needs of the industry. In 1998, the MoH established
an office at the Queen Alia International Airport (QAIA) to assist foreigners with immigration,
information, and transportation to hospitals.44 Currently, the Medical Tourism Directorate follows-
up on complaints from foreign patients and works in collaboration with an association representing
doctors and private hospitals. The Investment Law of 1987 also provides tax incentives for investing
into the health sector.
The health industry, however, is suffering from stagnation. The total number of foreign pa-
tients increased only modestly from 95,000 to 108,000, between 1998 and 2005 (WHO, 2009).
Given low occupancy rates in private hospitals (around 50%), this stagnation is not due to supply
side constraints. Specialized hospitals are running at 70% occupancy (JNCO, 2007). Despite the
potential of Jordan’s health tourism sector, there are threats on the horizon, including a shortage of
qualified nurses due to brain drain. Also, as the Dubai Health Care city establishes itself, it will
target the same labor market that has traditionally made up the bulk of Jordan’s health tourism
industry.
43 WHO web site http://gis.emro.who.int/HealthSystemObservatory/PDF/Trade%20And%20Health%20Services/Jordan.pdf, accessed May 2009.
44 WHO web site http://gis.emro.who.int/HealthSystemObservatory/PDF/Trade%20And%20Health%20Services/Jordan.pdf, accessed May 2009.

24
4.7. DEMAND CONDITIONS
The industry shows a cyclical pattern in its demand, with the peak
tourist season beginning at the end of July and lasting through the
end of August, coinciding with school holidays. Most visitors come
from Arab countries (Figure 13). Within the Archaeological
Tourism segment, the demand is somewhat concentrated on Petra,
which accounted for 26% of the foreign visitors who visited Jordan
historical sites in 2008.45 This lack of diversification in terms of
origin countries, as well as preferred tourist destinations, puts the
industry at risk, while at the same time the lack of sophistication in demand discourages the
development of more value-added options. To elaborate further, while Arab visitors constitute 68%
of foreign tourists, they contribute only 43% of the overall tourism receipts. One reason is that (in
2008) Arab visitors stayed an average of 3.9 days, compared to European visitors who stayed 5.0
days. Furthermore, in terms of nights spent, 30% of the Arab nights were at the cheapest accommo-
dation available.46 In contrast, 43% of European nights were spent in five-star hotels, indicating that
the Europeans have a much larger and more sophisticated demand than Arab visitors.
In broader terms, Europeans accounted for 54% of all the nights spent in Jordanian hotels
rated 3 stars and above. European tourists also account for 91% of the nights stayed in camp sites.
With less than 15% of occupancy rates, camp sites are the most underutilized of all Jordanian
accommodation options. Although the MoTA’s National Tourism Strategy 2004-2010 did target
45One of the new wonders of the world, Petra was constructed by the Nabateans around 100 BC.
http://www.calvin.edu/petra/about/nabataeans.php, accessed March 2009. 46 Classified apartment “C” by MoTA.
Figure 13: Breakdown of visitors by region (2008)
Source: MoTA

25
niche markets, such as adventure tourism, cruising, and eco-tourism, occupancy rates of camps show
no improvement between 2004 and 2007.47
One of the challenges faced by Jordan is its location in a volatile region; it is very vulnerable to
losing its customers, if the region experiences political turmoil. This highlights the need for Jordan
to develop a sophisticated local demand that could support these high-value added businesses during
times of turmoil.
4.8. CONTEXT FOR FIRM STRATEGY AND RIVALRY On the context for firm strategy and rivalry, Jordan ranks highly compared to regional
competitors on key metrics, such as visa requirements, government prioritization, government
expenditure, and effective marketing and branding
(Figure 14). The GoJ aims to work with the private
sector to strengthen the industry's institutional and
regulatory framework and thereby improve the
competitiveness of the tourism sector. Nonetheless,
the cluster can better coordinate activities across the
tourism value chain and increase representation at
international travel and tourism fairs. Further, the
cluster can explore tourism markets for athletic events
and conferences, which are both currently untapped.
The Jordan tourism cluster is quite competitive with more than 400 hotels, over 350 travel
agencies, about 70 tour operators, and an unaccounted number of tour guides. In 1998, the MoTA
established the Jordan Tourism Board (JTB) to market the cluster. The JTB is a joint initiative
47 The occupancy rate for camps was 14% for 2004 and 2007.
35
50
7
46
81
16
6
1721
4132
27
60
2420
3833
20
49
3
24
72
98
78
3
104
3
30
1
14
Visa Requirments
Govt Prioritization
Government Expenditure
Effective Marketing and
Branding
T&T Fair Attendance
Jordan Tunisia Morocco Egypt Israel UAE
Source: The Travel & Tourism Competitiveness Report 2009 by World Economic Forum
Figure 14: Selected CSR Indicators
26
between the public and private sectors with an 80% and 20% ownership, respectively. By running a
marketing campaign and providing information to cluster members, the JTB acts as a liaison among
the different tourism businesses in the cluster value chain to promote the cluster.
The GoJ has always been very receptive to foreign investments. Jordan ranks 44 on the
‘”Business Impact of FDI,” ahead of Israel, UAE, Morocco, and Egypt, which rank 48, 49, 74, and
83, respectively (WEF, 2009). The JTB, in cooperation with the Jordan Investment Board (JIB),
initiated the Tourism Investment Map, a regional map of investment opportunities in SMEs across
the country in the tourism and hospitality sectors. The GoJ has upgraded the cluster by enforcing
standards for tourism vehicle requirements and other criteria for tour operators. The Touristic
Specialized Transports Regulation requires that transport companies use technically reliable and
state-of-the-art vehicles for their tourism operations. Also, the Ministry of Transport lists other
criteria by which tour operators need to abide.
4.9. INSTITUTES FOR COLLABORATION
Jordan has many IFCs that support the tourism cluster. The most influential IFCs are the Ministry of
Tourism and Antiquities and the Jordan Tourism Board.
4.9.1. Ministry of Tourism and Antiquities
The Ministry of Tourism and Antiquities was established in 1988. Aside from helping set up
the aforementioned National Tourism Strategy, the MoTA encourages cooperation and coordination
across the different agents of the tourism supply chain and creates tourism policies. The MoTA
supports tourists with a number of resources and compiled information. For example, MoTA has
designed on-line maps that are categorized by type of destination and accompanied with a photo
gallery and has compiled car rental, airline, and embassy information. These resources help tourists
27
efficiently access tour guides and locate historical and holy sites, among others. Finally, the MoTA
hosts, Halla, a customer service phone line.
The MoTA also provides information and statistics on tourism receipts and number of
visitors by nationality and places visited. It launched e-licensing initiatives, employee training
employees, and quality control and monitoring activities. The MoTA has also published studies
regarding investments and worked with the JTB to promote tourist sites and parks development and
service provider information.48
4.9.2. Jordan Tourism Board
Set up in 1998 by MoTA, the Jordan Tourism Board (JTB) is a cooperative institution to run
international marketing abroad and to represent all associations of hotels, guides, travel agencies,
and air-lines. Since 1998, the JTB has established marketing offices in major tourist markets in the
United States, Europe, and the Arab world. Furthermore, it participates in tourism exhibitions and
fairs and supports members (particularly travel agents and hotel managers) to enter international
markets. The JTB website is a one-stop-shop for tourists and offers service in 10 languages and
weather information, sample itineraries, accommodation, and restaurants.49 Through its varied
activities, the JTB has created an effective pull strategy for consumers through its website and push
strategy by engaging with and providing relevant information to travel agents and tourism
consortiums around the world. It also works with travel consortiums, such as AAA, American
Express, and Virtuoso to become a preferred destination.50
48 Ministry of Tourism and Antiquities, http://www.mota.gov.jo/Home/index.htm, accessed April 2009.
49 Official Website of Jordan Tourism Board, http://www.visitjordan.com/, accessed April 2009. 50 Malia Asfour, Director of Jordan Tourism Board North America, interview by authors, Washington, DC, March 31, 2009.

28
4.9.3. Risks and Recommendations Tourism Cluster Recommendations
Issue Recommendations: Short Term (ST), Medium Term (MT), and Long Term (LT)
Primary Actors
High Priority Security fears of tourist
• Provide extra security for hotels and tourist destinations (ST)
• Promote the image of a safe Jordan (ST)
• JTB
• Police
Rising tension between local communities favouring cultural preservation versus tour companies
• Increasing role in managing conflict and improving dialogue (ST)
• Government
Low quality of specialized education
• Creation of a body that creates new syllabus with input from the private sector (ST)
• Universities
• Tourism businesses
• Government
• Donor agencies
Medium Priority Brain drain of nurses
• Ensure higher compensation and other incentives (ST)
• MoH
• Private sector hospitals
Weak attendance of Jordanian companies at travel industry fairs
• Increase marketing budgets to improve attendance at travel and tourism industry fair (ST)
• Collaborate with partner countries to improve attendance (ST)
• MoTA
• JTB
Low occupancy rates in hospitals
• Aim at higher specialization by giving incentives to specialists for relocation (ST)
• Offer specialized education in Medical Universities (LT)
• MoH
• Private sector hospitals
• Universities
Low occupancy rates in camp sites
• Launch a campaign aimed at the adventure holiday market in Europe and the US (ST)
• Offer adventure sport courses for Jordanian and Arab tourist to generate local demand for companies dealing in adventure tourism (ST)
• JTB
• Package tour operators
• Adventure businesses

29
5. BIBLIOGRAPHY
ABC Investments. “Tourism Sector Report - 2009”
Amwal Invest. “Transportation Sector - 2009”
Central Bank of Jordan. “Annual Report.” Amman: Central Bank, 2007.
Economist Intelligence Unit. “Country Profile 2008: Jordan. London: EIU, 2008
Economist Intelligence Unit. “EIU Country Report on Jordan” (Jan-Apr). London: EIU, 2009.
FIAS, The Multi-Donor Investment Climate Advisory Service of the World Bank Group. “Competi-tiveness and Corporate Social Responsibility in the Jordanian Apparel Industry.” January 2008, http://www.bsr.org/reports/BSR_FIAS_Jordan-Report.pdf, accessed April, 2009.
Ghazal, Mohammad. “Jordan ranked 6th in Inward FDI.” Jordan Times. September 25, 2008.
Ghazal, Mohammad. “Rising Cost of Living May Fuel Brain Drain.” The Jordan Times. January 18, 2008, http://www.jordantimes.com/?news=5097, accessed May 2, 2009.
Jordan Investment Board. “Annual Report.” Amman, 2007.
Jordan National Competitiveness Observatory. “Jordan’s First Competitiveness Report. 2007”
Jordan National Competitiveness Team. Jordan’s Competitiveness Report 2007. Amman: JNCT, Ministry of Planning and International Cooperation. 2007.
Jordanian Ministry of Labor. “Labor Compliance in Jordan’s Apparel Sector: Actions to Date and Next Steps.” March, 2007
Jordan Ministry of Planning and International Cooperation. “The Jordanian Economy.” Power Point (March, 2009) Presentation sent as supporting information to interview with Nour Al Tarawaneh held on April 5, 2009.
Jordan Ministry of Planning and International Cooperation. “National Social and Economic Development Plan: 2004-2006.”
Jordan Ministry of Planning and International Cooperation and United National Development Program. “Jordan Human Development Report 2004: Building Sustainable Livelihoods.” Amman: UNDP. 2004.
World Economic Forum. “The Travel and Tourism Competitiveness Report 2009”
World Health Organization. “Trade in Health Services and GATS: Jordan” Eastern Mediterranean Regional Health System Observatory.
World Trade Organization. “Trade Policy Review on Jordan (6 October 2008)”. Report was prepared for the first Trade Policy Review of Jordan, and was drawn up by the WTO Secretariat. 2008.
World Tourism Organization. “UNWTO World Tourism Barometer” Vol 7. No 1. Jan 2009.
UNCTAD (2008). World Investment Report 2008. Geneva: UNCTAD.
USAID (2007). Comprehensive Competitiveness Strategy Report for the Garment Sector.
USAID Siyaha (2007). “Manpower and Training Needs analysis of the Jordan Tourism Industry.”