Embed Size (px)
Citation preview

MEASUREMENT & VERIFICATION
Jorge Torres Coto, P.E. LEED APMBO, Inc.

INTRODUCTIONS WHAT IS M & V A LITTLE HISTORY, WHERE WE ARE AND
WHY A FEW COMPARISONS OPTIONS? MEAT & POTATOES LEED . . . NOW & TOMORROW THE DEVIL IS IN THE DETAILS
AGENDA

WHO CAME?

Measurement & Verification Monitoring & Verification
What are you verifying if you haven’t measured it?
Can be used in any context, though mostly used in energy efficiency / water efficiency / emission reduction projects
WHAT IS M & V?

ECM◦ Energy Conservation Measure: reduce the use
of energy. EEM
◦ Energy Efficiency Measure: use energy as efficiently as possible to achieve a specified result.
These two terms are not interchangeable!
GLOSSARY

ESCO◦ Energy Services Company: provides all
services required for implementing externally finances energy efficiency projects. Provides guarantees of certain predicted results
ESP◦ Energy Service Provider: does the same,
without the guarantees of results.
GLOSSARY

IPMVP◦ International Performance Measurement &
Verification Protocol◦ Broad framework of definitions and
approaches
EVO◦ Efficiency Valuation Organization (the sponsor
of IPMVP)
GLOSSARY

ESCO ESP Energy Users (Industrial/Buildings/Etc.) Facility Managers New Building Designers (wait and see) LEED Users (designers, CxA, EBOM Managers, etc) Regional Efficiency Program Designers and
Managers Emission counting and trading organizations
(State of CA, Federal Government, International Markets)
WHO UTILIZES M&V

North American Energy Measurement and Verification Protocol◦ Published March 1996
International Performance Measurement and Verification Protocol◦ December 1997
IPMVP◦ Incorporated in 2002
EVO◦ Renamed in 2004
A LITTLE HISTORY
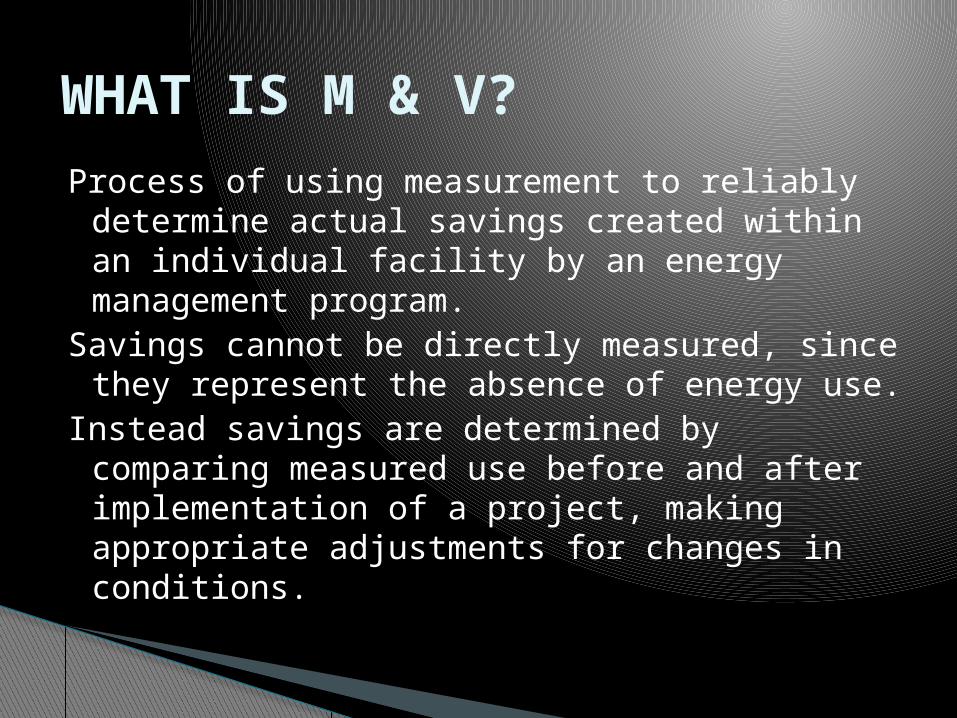
Process of using measurement to reliably determine actual savings created within an individual facility by an energy management program.
Savings cannot be directly measured, since they represent the absence of energy use.
Instead savings are determined by comparing measured use before and after implementation of a project, making appropriate adjustments for changes in conditions.
WHAT IS M & V?

ENERGY & ATMOSPHERE credit 5
To provide ongoing accountability of building energy consumption over time
◦ BENEFITS Minimizes economic
and environmental impacts associated with the projects utility using systems.
Lifetime of a building is more than 50 years, even minor utility savings are significant in aggregate.
Good M&V procedures will bridge the gaps left by personnel changes through time.
LEED
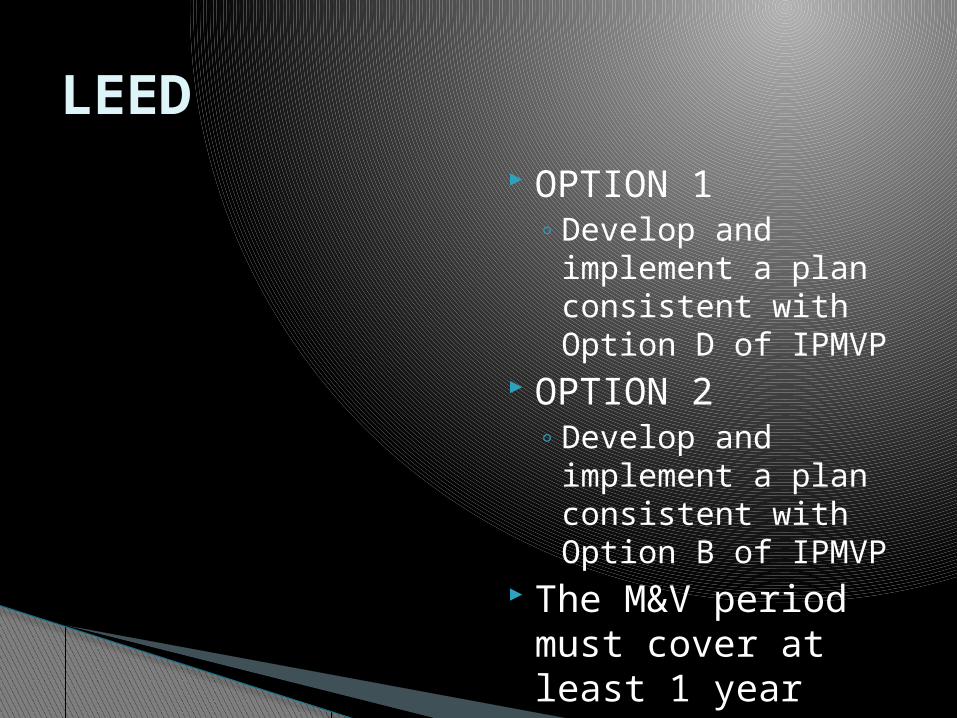
OPTION 1◦ Develop and
implement a plan consistent with Option D of IPMVP
OPTION 2◦ Develop and
implement a plan consistent with Option B of IPMVP
The M&V period must cover at least 1 year
Provide a process for corrective action if the results indicate that energy savings are not being achieved.
LEED
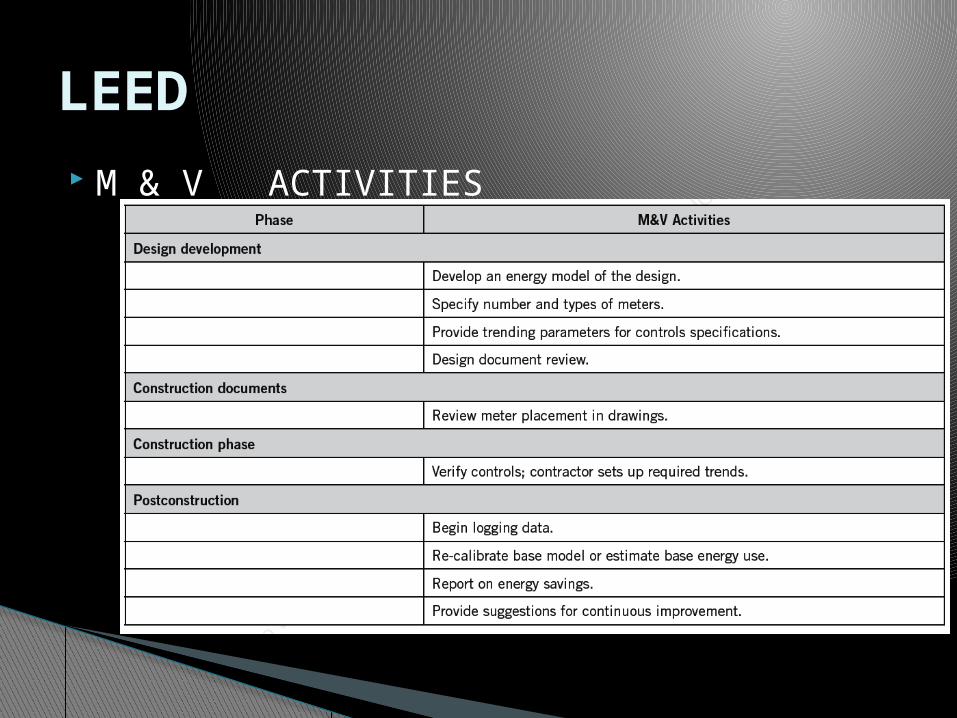
LEED M & V ACTIVITIES

BPI
LEED

BUILDING PERFORMANCE INITIATIVE◦ Comprehensive data collection and analysis
development will be shared with LEED building owners and project teams to help close the performance prediction gaps.
◦ Requirement of ongoing performance data from buildings as part of their certification
LEED

Utility Level Metering◦ Meter, track and share building level utility
resource use to support energy management and LEED program evaluation.
◦ Install or use building level utility metering (electric, gas, chilled water, steam, fuel oil, etc.)
LEED M & V Prerequisite

WHAT DOES IT COST?
M&V Rigor
M&V Cost
Incremental Value of information
$

WHAT DOES IT COST?

WHAT DOES IT COST? Option selected Number of ECM and their complexity Number of energy flows across the measurement
boundary Effort in establishing the baseline conditions Amount and complexity of measurement
equipment Sample sizes Engineering effort Accuracy Savings report requirements Experience and qualifications

WHAT YOU GET!
Annual M&V Costs and Annual Savings
Cost, % = -3E-07 * Savings + 12%
R2 = 0.40
0%
5%
10%
15%
$0 $200,000 $400,000Annual Savings
Rel
ativ
e M
&V
Cos
t
No strong relationship between M&V costs and savings!

IN A NUT SHELL GET IT RIGHT! M&V Plan reviews are
critical:◦ IPMVP, ASHRAE, FEMP, etc. will not create a good
M&V Plans◦ M&V Plans establish a successful project◦ Weak M&V Plans = weak projects◦ Combine guidance with good engineering
judgment to produce great M&V Plans. Input from the WHOLE team is necessary (owner, designer, commissioning, operator, user, etc.)

The M&V process parallels the ECM design and implementation process!!!!!
What does the end user really want (whole facility, specific loads, etc.)?
Selection of the M&V Option is done when the ECMs are developed.
What accuracy is acceptable? What is the baseline period? What is the reporting period?
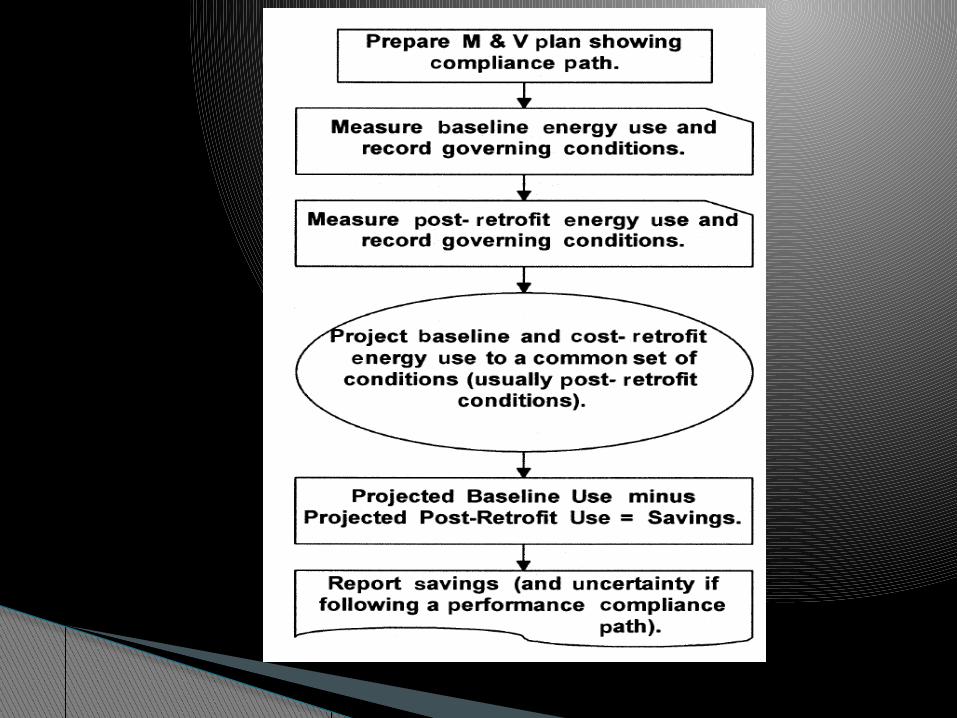
M & V STEP BY STEP

Gather energy information from the baseline period and record in an accessible manner
Prepare M&V Plan with the results of everything above and define the subsequent steps.
As part of the ECM design and installation, also design, install, calibrate and commission any special measurement equipment that is needed under the M&V Plan
M & V STEP BY STEP

After the ECM is installed, Commission the equipment and devices.
Gather energy and operating data from the reporting period (per M&V Plan)
Compute the savings in utility and monetary units per the M&V Plan
Report the savings per the M&V Plan
M & V STEP BY STEP

Meter installation calibration and maintenance
Data gathering and screening
Computational method and acceptable estimates
Computations with measured data
Reporting, QA and third party verification reporting
M & V ACTIVITIES

OPTION A: ◦ISOLATION RETROFIT
OPTION B: ◦ALL PARAMETER MEASUREMENT (LEED)
OPTION C: ◦WHOLE FACILITY
OPTION D: ◦CALIBRATED SIMULATION (LEED)
IPMVP OPTIONS


IPMVP Volume I◦ Defines M&V with fundamental principles.◦ Describes the framework of the M&V plan and
reporting IPMVP Volume II
◦ Provides approach to evaluating building IAQ issues related to ECM design, implementation and maintenance.
IPMVP Volume III◦ Provides detail on methodologies associated with
new building construction and with renewable energy systems added to existing facilities.
M & V Documents

ASHRAE Guideline 14◦ Provides details on implementing M&V plans
within the framework◦ Enhances IPMVP’s discussion on balancing
Uncertainty and Cost FEMP M&V Guide
◦ Complementary to IPMVP◦ It is an application guide◦ Provides more detail on the M&V Options
M & V Documents

Should be representative of all operating modes of the facility (from maximum to minimum
BASELINE PERIOD

Should encompass at least one operating cycle in order to fully characterize the savings effectiveness.
Metering can be left in place to provide real time feedback of operating data to staff.
REPORTING PERIOD

Savings = (Baseline Energy - Reporting Period Energy) + Routine Adjustments + Non-Routine Adjustments
Routine Adjustments: for any utility-governing factors expected to change routinely during the reporting period (weather, production volume, etc.)
Non-Routine Adjustments: utility-governing factors which are not expected to change (size of facility, occupants, shifts, etc.)
ADJUSTMENTS

Using conditions other that those of the Reporting Period as a basis for adjustment.
Adjustment to a fixed set of conditions (for the reporting and for the baseline period) from their actual conditions to a common fixed set of conditions (NORMALIZED)
Normalized Savings = (Baseline Energy + Routine Adjustments to fixed conditions + Non-Routine Adjustments to fixed conditions) – (Reporting Period Energy + Routine Adjustments to fixed conditions + Non-Routine Adjustments to fixed conditions)
NORMALIZED SAVINGS

When to select Avoided Energy Use or Normalized Savings
Avoided Energy Use: depends on the reporting period’s operating conditions. Cannot be directly compared with savings predicted under baseline conditions.
Normalized Savings: unaffected by reporting period conditions since the fixed set of conditions are set and do not change
Can be directly compared with savings predicted under the same set of fixed conditions.
Can only be reported after a full cycle of reporting period energy use
NORMALIZED SAVINGS

OPTION A: ◦ ISOLATION RETROFIT
OPTION B: ◦ ALL PARAMETER MEASUREMENT (LEED)
OPTION C: ◦ WHOLE FACILITY
OPTION D: ◦ CALIBRATED SIMULATION (LEED)
IPMVP OPTIONS

◦ Actual field measurements of the most important performance parameters which define the utility use of the ECMs selected.
◦ Measurement can be short term to continuous, it depends on the expected variations of the measured parameter and the length of the reporting period.
◦ Some parameters not measured in the field can be estimated based on historical data, manufacturer’s expectations. You still have to evaluate the savings error.
OPTION A: RETROFIT ISOLATION

OPTION A: RETROFIT ISOLATION

◦ Savings are calculated utilizing: baseline period Engineering calculations Short-term or continuous measurements of key
parameters Estimated values
◦ Routine and Non-Routine adjustments as required
OPTION A: RETROFIT ISOLATION
SAMPLE CALCULATIONE Savings = QTY * (Before – After) * HoursES = (5,000) * (86 W - 56 W) * (3,000 hours) * (1 kW / 1000 W)ES = 450,000 kWh/year
Cost Savings = (Unit Cost) (Energy Savings)Cost Savings = (450,000 kWh) * ($0.10/kWh)Cost Savings = $45,000/year

◦TYPICAL APPLICATIONS Lighting Retrofits
OPTION A: RETROFIT ISOLATION

◦ Actual field measurements of the ECM affected system.
◦ Measurement can be short term to continuous, it depends on the expected variations of the measured parameter and the length of the reporting period.
OPTION B: ALL PARAMETER MEASUREMENT
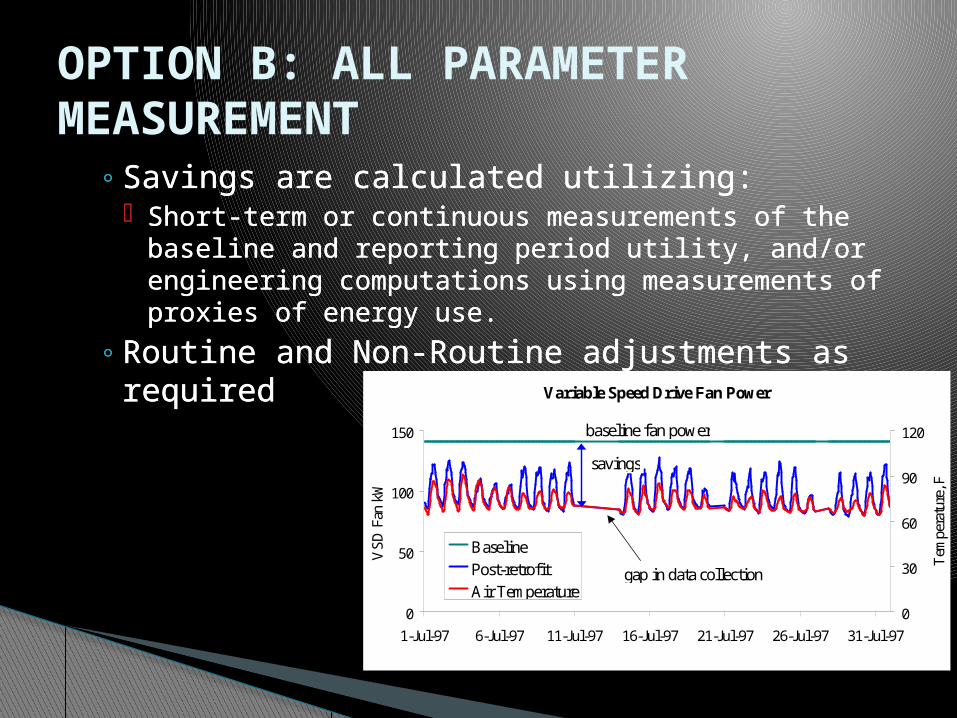
◦ Savings are calculated utilizing: Short-term or continuous measurements of the
baseline and reporting period utility, and/or engineering computations using measurements of proxies of energy use.
◦ Routine and Non-Routine adjustments as required
OPTION B: ALL PARAMETER MEASUREMENT
◦ Savings are calculated utilizing: Short-term or continuous measurements of the
baseline and reporting period utility, and/or engineering computations using measurements of proxies of energy use.
◦ Routine and Non-Routine adjustments as required Variable Speed Drive Fan Power
0
50
100
150
1-Jul-97 6-Jul-97 11-Jul-97 16-Jul-97 21-Jul-97 26-Jul-97 31-Jul-97
VS
D F
an k
W
0
30
60
90
120
Tem
pera
ture
, F
Baseline
Post-retrofit
Air Temperature
baseline fan power
savings
gap in data collection

◦TYPICAL APPLICATIONS Variable speed drive and controls to a pump motor to
adjust to actual requirements of flow and react accordingly.
Measure for a set period of time prior to ECM installation.
Measure for the set period of time after the ECM installation.
Track and report the variation in power use.
OPTION B: ALL PARAMETER MEASUREMENT

◦Measurement at the whole facility or sub-facility level.
◦Continuous measurements throughout the reporting period
OPTION C: WHOLE FACILITY
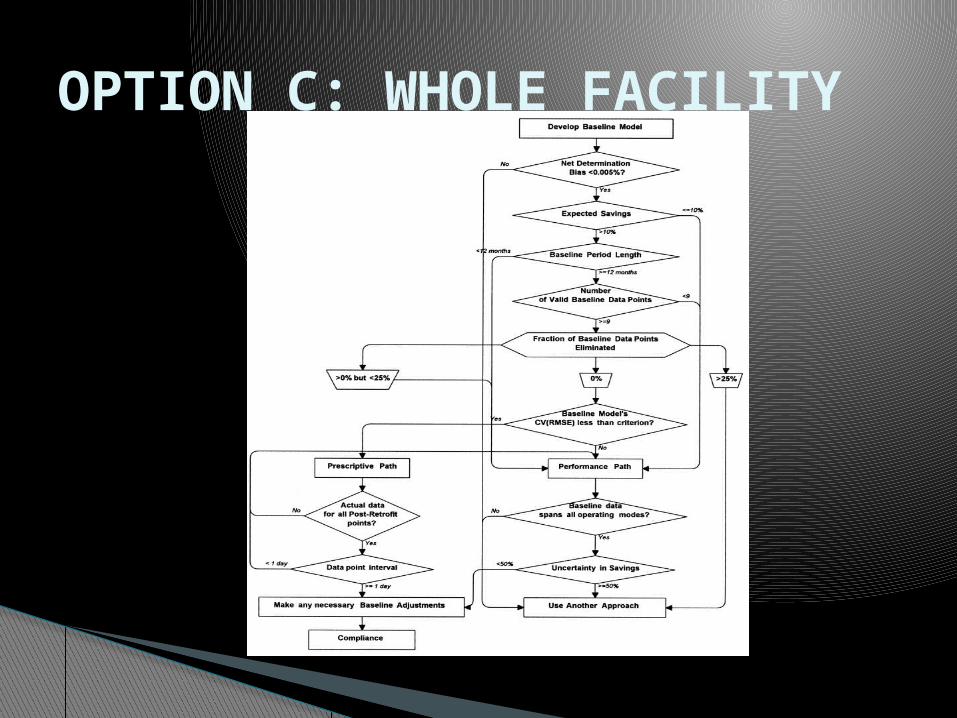
OPTION C: WHOLE FACILITY

◦Savings are calculated utilizing: Utility meter data for the whole facility both
for the baseline and the reporting period◦Routine and Non-Routine adjustments as
required
OPTION C: WHOLE FACILITY
Baseline Gas Use for Heating
0
10,000
20,000
30,000
40,000
Oct-99 Jan-00 Apr-00 Jul-00 Nov-00 Feb-01
The
rms
0
200
400
600
800
1,000
1,200
HD
D b
ase
65
Total Therms
HDD

◦TYPICAL APPLICATIONS Multifaceted energy management program affecting
many systems in a facility. Baseline period is usually a 12 month period from
utility data Keep track of utility data for 12 months after ECM
installation
OPTION C: WHOLE FACILITY
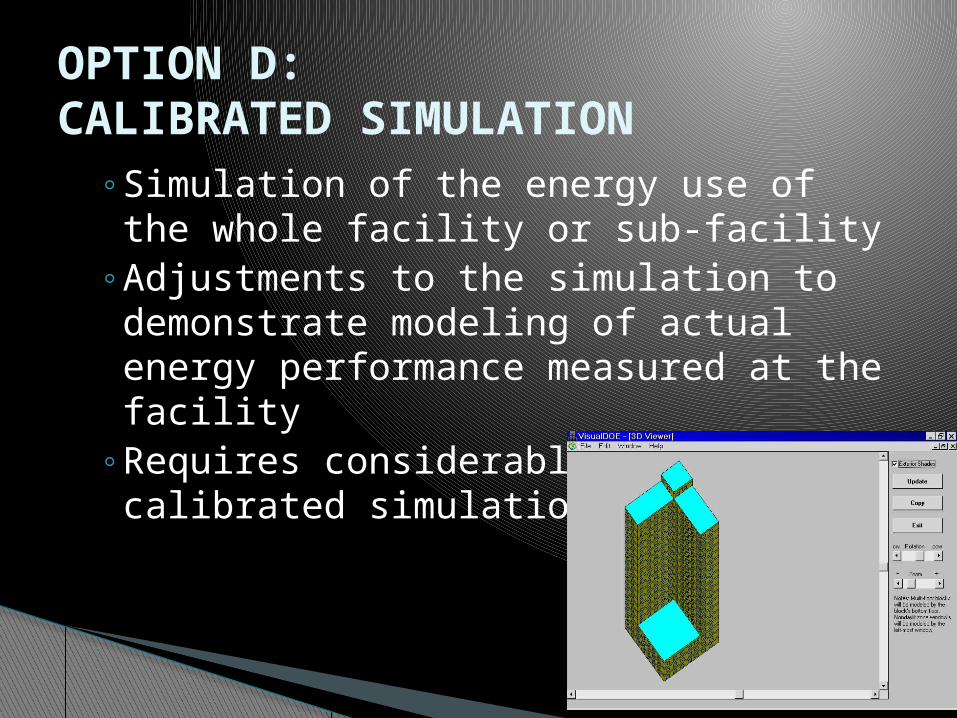
◦Simulation of the energy use of the whole facility or sub-facility
◦Adjustments to the simulation to demonstrate modeling of actual energy performance measured at the facility
◦Requires considerable skill in calibrated simulation
OPTION D: CALIBRATED SIMULATION

OPTION D: CALIBRATED SIMULATION

◦Savings are calculated utilizing: Calibrated hourly or monthly utility billing
data Energy end use metering may be used to help refine input data
OPTION D: CALIBRATED SIMULATION
Building Level Calibration: Compare Model to Actual
0
2,000
4,000
6,000
8,000
10,000
Jan-04 Mar-04 Apr-04 Jun-04 Aug-04 Oct-04
The
rms
or k
W
0
100,000
200,000
300,000
400,000
500,000
kWh
Therms
Therms DOE2
kW
kW DOE2
kWh
kWh DOE2

◦TYPICAL APPLICATIONS Multifaceted energy management program affecting
many systems in a facility, but where no metering existed in the baseline period
Utility use measurements after installation of gas, water, electric meters are used to calibrate simulation.
Baseline utility use is determined with the calibrated energy simulation and compared to the simulation of the reporting period utility use.
OPTION D: CALIBRATED SIMULATION

ASHRAE Guideline 14-2002 M & V Guidelines: Measurement and Verification
for Federal Energy Projects, Version 2.2-2000 The Greenhouse Gas Protocol for Project
Accounting (2005) The U.S. State of California Public Utilities
Commission’s California Energy Efficiency Evaluation Protocols: Technical, Methodological, and Reporting Requirements for Evaluation Professionals (April 2006)
RESOURCES

www.evo-world.org http://
www1.eere.energy.gov/femp/financing/superespcs_mvresources.html
www.ashrae.org http://
resourcecenter.ashrae.org/store/ashrae/newstore.cgi?itemid=9012&view=item
http://www.ghgprotocol.org/ http://
www.wri.org/publication/greenhouse-gas-protocol-ghg-protocol-project-accounting
http://www.cpuc.ca.gov/PUC/energy/Energy+Efficiency/EM+and+V/
http://www.neep.org/about/final_MV_manual.pdf
RESOURCES

THANK YOU
Jorge Torres Coto, P.E. LEED APMBO, Inc.
4830 Viewridge AvenueSan Diego, CA 92123