Embed Size (px)
Citation preview
Editorial Board:
Chief Patron:
CA Sunil G. Karve
Hon. Chairman, Governing Board, Kohinoor Education Trust
Patron:
Dr. N. M. Kondap
Director General, Kohinoor Business School
Editorial Board:
Dr. Matthew Liao-Troth
Dean of the J. Whitney Bunting College of Business, and Interim Provost
for Georgia College and State University
Dr. N Panchanatham
Professor & Head, Department of Business Administration, Annamalai
University
Dr. Rajkumar
Professor, Department of Management Studies, Banaras Hindu University
Mr. H. J.Jani
Professor, MBA Programme, Sardar Patel University
Dr. K Venugopal Rao
Professor, Institute of Management, Shri Krishnadevaraya University
Mr. N. V. Narsimhan
Dean, School of Business and Administration, Wawasan Open University
Dr. Vijay Khole
Former Vice Chancellor, University of Mumbai
Chief Editor:
Dr. Bharati Deshpande
HOD & Associate Professor, Kohinoor Business School
Editorial Team:
Dr. Amit Aggrawal
Associate Professor, Kohinoor Business School
Ms. Nameeta Sonaskar
Assistant Professor, Kohinoor Business School
Focus & Scope
Journal of Management Development & Research (JMDR) is a peer reviewed academic
journal, the aim of the journal is advancing interdisciplinary and multifunctional
academic research and management practices across different sectors and different
streams. The focus of the journal is to publish research papers and cases on the state of the
art business and management practices like marketing, finance, human resource
management, organization behaviour, supply chain management, information
technology. The audience includes researchers, managers, academicians, educators and
practitioners.
The JMDR recognizes excellent researchers from different specialization to disseminate
their research work both from academic and industry practitioners in the field of
management. This Journal is a common platform where academicians, corporate
managers and practitioner would like to share their work in the field of finance,
marketing, human resource management, organization behaviour, quantitative
techniques, information technology, supply chain management etc. across different
sectors in India and Abroad.
The main aim of the Journal is to focus on innovation & practical applications to enhance
the field of management development thinking practice and research. Therefore,
contribution is always welcome from practitioners, academicians, professionals and
experts working in different sectors and different specializations.
Submission:
Journal of Management Development & Research is a advancing interdisciplinary and
multifunctional academic research journal and published bi-annually. Manuscript should be
submitted in Microsoft word format to [email protected]. The paper should be original and
should not be published elsewhere, nor should be under consideration by another journal.
Editorial Process:
Journal aims to provide author with constructive, fair and timely review. The review will be accepted
or rejected based on significance, novelty and usefulness to journal readers. A research paper once
rejected will not be considered again for review. The review process may take approximate 45 days
to be completed. For accepted research paper, the necessary changes will be informed and revised
paper should be submitted within15 days.
Manuscript:
Manuscript must be written in English and should be typed with double spacing throughout one side
of preferably A4 or letter size paper. The research paper should include the title of the article the
authors name and institute they are associated. The title should include an abstract of not more than
200 words. References must follow the journal style requirement. The length of the article should be
restricted to 2500 words. Key words should be written after abstract.
References:
The Harvard system should be used in referencing. When quoted in the text the style is…Gary
1. Kaplan (2000) References are listed alphabetically after the text. Journal and book titles
should be written out in full.
Examples are:
· Richard Daft (1991), Principles and Practices of Management, Cengage Publication
· Gene L Roth and Brain Vivona, “Mirth and Murder: Crime scene investigation as a
work Context f or examining humour applications, Journal of Human resource development Vol. 9,
No. 4, pp 314-332
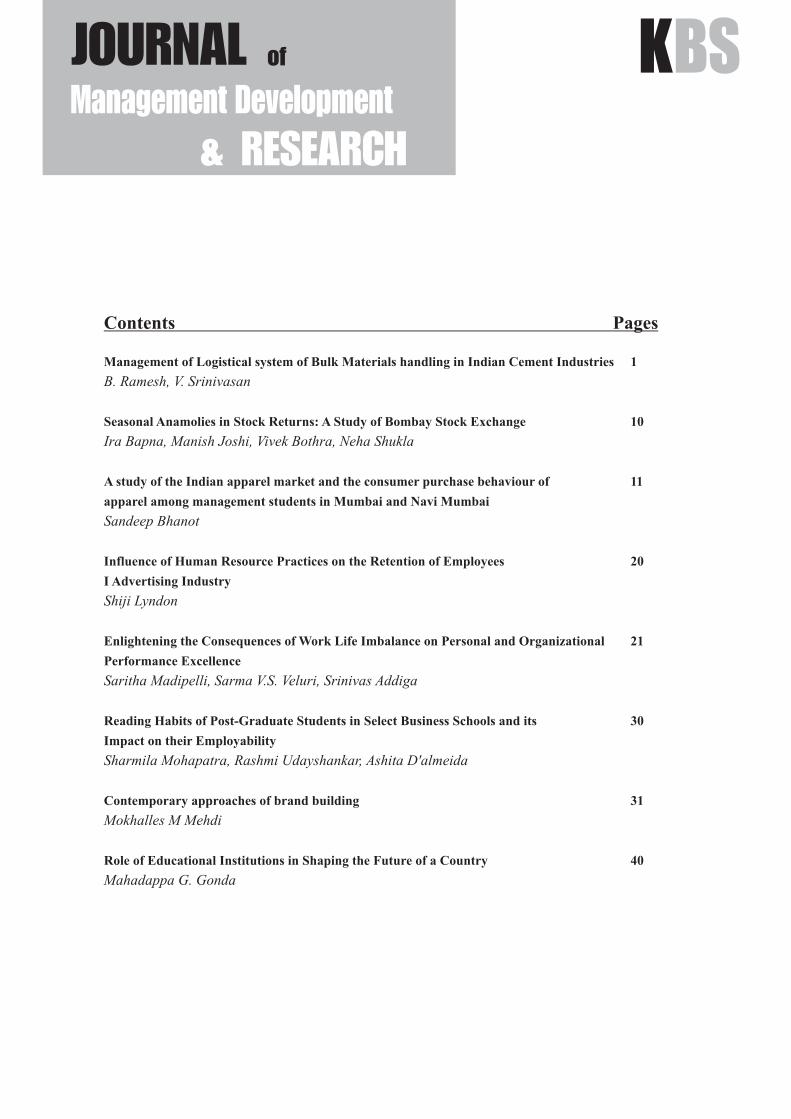
Contents
Management of Logistical system of Bulk Materials handling in Indian Cement Industries 1
B. Ramesh, V. Srinivasan
Seasonal Anamolies in Stock Returns: A Study of Bombay Stock Exchange 10
Ira Bapna, Manish Joshi, Vivek Bothra, Neha Shukla
A study of the Indian apparel market and the consumer purchase behaviour of 11
apparel among management students in Mumbai and Navi Mumbai
Sandeep Bhanot
Influence of Human Resource Practices on the Retention of Employees 20
I Advertising Industry
Shiji Lyndon
Enlightening the Consequences of Work Life Imbalance on Personal and Organizational 21
Performance Excellence
Saritha Madipelli, Sarma V.S. Veluri, Srinivas Addiga
Reading Habits of Post-Graduate Students in Select Business Schools and its 30
Impact on their Employability
Sharmila Mohapatra, Rashmi Udayshankar, Ashita D'almeida
Contemporary approaches of brand building 31
Mokhalles M Mehdi
Role of Educational Institutions in Shaping the Future of a Country 40
Mahadappa G. Gonda
Pages
Management of Logistical system of Bulk Materials handling in Indian
Cement Industries
Mr. B. Ramesh
B.E., MBA, M.S. (BITS, Pilani), Research Scholar in BIT, Mesra
Dr. Utpal Baul
Professor in Management in BIT, Mesra
Dr. V. Srinivasan
Distinguished Member, Former Chairman in IIMM, Chennai and
Deputy General Manager (Retd.), CPCL, Chennai
Logistics, Supply Chain, Value, Bulk Transportation, Cement industry, India
Abstract
Key words:
Volume II Issue 2 Dec. 2012 Journal of Management Development & Research 1
Shopping companion and the subsequent impact on Impulse Buying
thIntroduction capacity of 298 million tones by the end of 11 Cement becomes a key product for the five-year plan. According to the Ministry, an development of infrastructure, which is the
investment of approximately Rs. 500 crore is need of the hour in our country. India is the
required for creating a capacity of 1 million second largest manufacturer of cement and it thranks next to China. tonne. - 95 report of the Parliamentary
The Parliamentary standing committee noted standing committee of Commerce presented ththat the cement production growth touched a on 24 February 2011. In India, different types
peak of 12% in 2009-10, as against 7.9% in of cement are being manufactured using dry,
2008-09. The industry is likely to achieve the semi – dry, and wet processes.
This is an approach paper for doctoral research. Transportation is one of the most visible elements of Supply Chain Management. However, many do not realize that transportation is a key decision area within the logistics mix. Transportation absorbs, on the average, a higher percentage of logistics costs than any other logistics activity. Transportation of the raw material and the finished goods in the cement industries poses a challenge and demands innovative methods to reduce costs on a continual basis. Traditional transportation has to be reviewed de-nevo considering the need and environmental conditions and effectiveness. A study is needed to ascertain whether the latest trends in technology are being followed for transportation in cement industries and whether the current system of transportation used by them is cost effective. An in depth study on the environment of dry bulk transportation with its application in cement industry and its associated role in logistical subsystem is taken in this research. The proposed approach does not replace the regular cost estimation but it would give cost effective guidelines on products during the life cycle and possibly pave the way for new product development concepts in this untapped area.
. In the production of Clinker Cement, a large today's competition between industries is quantum of energy is required. It is produced nothing but the competition between their by using materials such as limestone, iron respective supply chains.oxides, aluminum and silicon oxides. Among Transportation is an essential and a major sub the different kinds of cement produced in function of logistics that creates time and India, Portland Pozzolana Cement, Ordinary place utility in goods. The fact is that the Portland Cement and Portland Blast Furnace importance of transportation is not considered Slag Cement are the most important because seriously either by the government or by the they account for around 99% of the total industries. The cost advantages by proper cement production in India. management on the cost to the economy due Large quantities of raw materials are to the absence of it have not been realized at necessary for transportation in inbound both the macro and firm levels – logistics for production of cement. It involves Vijayaraghavan (2004)movement of Limestone, Coal, Fuel, Fly ash It is needless to stress that transportation is a etc. Similarly, the end product from the key element in the logistic link of any supply cement industry is either Clinkers or different chain. It involves the movement of products, kind of cements, which are to be transported service/speed and cost, which are the critical after production in outbound logistics issues in effective logistics. It also impacts movement. Most of the materials that are for with other two logistics-movements of dry bulk transportation are Cement and Fly information and integration within and among ash. It is possible to make provisions in the suppliers, customers and carriers. To form of specially built tanks to transport evolve a proper transportation strategy the clinkers, limestones coupled with suitable following elements require attention: * infrastructure planning. It may be noted that Customer requirement timely deliveries, different types of supply chain exist in the mode selection, measurement, regulatory cement industries. A detailed study on the impact and flexibility. Among them mode prevailing type of supply chain existing in selection and regulatory impact and flexibility Indian industry and ways & means to are critical. They are briefly explained as improve its performance has not be under:undertaken till now and is called for. Due to infrastructure growth, concrete is produced in · Mode selection Batch plants, which require cement in bulk Mode Selection deals with movement of quantities. Fly ash generated as a waste goods through two angles i.e. Cost and Speed. material in Thermal plants is also required for The selection of 'transportation mode mix' to Cement production. Since transport of both, have optimum cost without sacrificing the are dry product operations, bulk tanks customer delivery requirement is of critical becomes ideal and most suitable logistically importance in this respectin Cement industries; they can unload the products through pneumatic discharge · Regulatory impactwithout handling the product physically and The regulations have far reaching impact on thus avoiding pollution in the environment. It mode selection and transportation cost may be emphasized here, that transportation is thereof. In this case, is the threshold limit of one of the major components of supply chain pollution level fixed by the pollution control Management. The success or failure of a board or several state governments.supply chain depends largely to the movement of products especially in the context that
Volume II Issue 2 Dec. 2012 Journal of Management Development & Research 47
Modified Multidimensional Scaling Technique for Brand Positioning of a product
- A Case Study on Shampoo Brands in Mumbai
· Flexibility Review of LiteratureTransportation is the backbone of the logistics Global Cement Production has continued to strategy. The flexibility in selection of be expanding at an average rate of 6.4% in the transportation strategy is an essential last five years from 2568 million tonnes in ingredient of logistical strategy to exhibit the 2006 to 3294 million tonnes in 2010. Around flexibility. 56% of production is from China. China (with
an average annual growth of 11.4%) and India A study by the researcher reveals that, the (with an average annual growth of 9.8%) have awareness of latest technologies is not been the drivers of the growth in global considered by the cement companies. Most of cement output. India is the second largest t h e c e m e n t c o m p a n i e s o u t s o u r c e cement producer in world after China. Except transportation to contractors. These India and China, other major producers are in contractors due to various reasons use old the range of 45 - 65 million tonnes production vehicles with primitive designs. The (as against 52 - 86 million tonnes in 2008). -researcher desires to consider the “Value” of Report on working group for Cement Industry using the new designs by comparing them for 12th Five-year plan, Dec (2011). Today with the existing designs. The researcher will cement industry in India comprises of 183 also endeavor to find out the reasons for not large cement plants and more than 360 mini changing over to new technologies by the cement plants. Large producers contribute cement companies. In a connection, it may be about 97% of the installed capacity while mini noted that “effectiveness” of these designs as plants account for the rest. Among these, 98% a logistical attributes does not appear to have of production comes from the private sector been studied as a total sub system in Indian and the rest from the public sector. -Report on Environment. This is indeed a gaping research working group for Cement Industry for 12th gap considered from the perspective of total Five-year plan, Dec (2011).The turnover of logistical system. The total cost of owner ship the cement industry has been estimated at US of the major designs have to be studied in $ 25 billion in 2010-11. It may be noted that depth taking into consideration the relative the installed capacity has increased at a advantages and disadvantages. Based on such compound annual growth rate (CAGR) of 8.8 a study, if it is found that improvised new percent during 2001-2011 However, during design is advantageous and feasible, the the last five years (2006 – 2011), while the existing handling equipment can be installed capacity increased at an average redesigned to handle other raw materials annual rate of 13.6 per cent, production including clinkers. Such modified equipment witnessed an increase of 9.1 per cent during will lead to savings in transportation cost. this period. -Report on working group for This in turn will lower the total manufacturing Cement Industry for 12th Five-year plan, Dec c u m d i s t r i b u t i o n c o s t o f c e m e n t (2011).manufacturing system. Three types of cement are produced in India.
They are one. Portland Pozzolana Cement The increase in the pace of industrialization (PPC), 2. Ordinary Portland Cement (OPC) in India has highlighted many management and three. Portland slag Cement (PSC). PPC problems, an important one of which is cost enjoys the major share ( 67%) of the total reduction. It is in this background; the production, followed by OPC (25%) and PSC present study assumes importance and calls 8%. A positive trend towards the increased use for closer attention and detailed of blended cement is discernible with the investigation.
share of blended cement increasing to 75%.
Volume II Issue 2 Dec. 2012 Journal of Management Development & Research 47
Modified Multidimensional Scaling Technique for Brand Positioning of a product
- A Case Study on Shampoo Brands in Mumbai
markets and fly ash sources. Thus clinker, During 2008-09, the industry consumed 35 which is again, a bulk natured intermediate million tonnes of fly ash and 7.5 million product, needs to be transported for long tonnes of slag. According to the Ministry of distances in bulk from the production centers Commerce and Industry, continuous increase to various grinding units. -Report on working
in the production of blended cement is group for Cement Industry for 12th Five-year
expected to reduce the problem of waste plan, Dec (2011)
disposal, improve energy efficiency and One of the major contributions of cement reduce carbon footprint. The principal raw industry to society is in the form of absorption materials for cement are lime stone, gypsum of industrial waste generated by other sectors, and sand. In order to reduce the consumption particularly the power sector and plastics. The of limestone, various substitutes are used. Power generation in India is coal intensive, Substitution of clinker by using fly ash and which generates huge amount of ash and large blast furnace slag can reduce emission of areas of land, is used to store it. Utilization of pollutants per tonne of cement production. - fly ash involves capital cost. It requires
th95 report of the Parliamentary standing establishment of a proper processing
th infrastructure at the power plant site in the committee of Commerce presented on 24 form of dry fly ash collection system and February. (2011)dedicated system of transport to the grinding As with any other industry, the cement unit. -Report on working group for Cement industry needs to focus on its supply chain in Industry for 12th Five year plan Dec (2011).the way it deals with sustainability. Rating
thIn the 12 Five-year plan, a Sub Group IV is agencies today look for companies' formed for logistics, which includes also stewardship efforts across their supply chain, Railways. Issues related to raw materials, and frequently direct them to report on this in fuel, fly ash, minerals right and land their sustainability reports. Companies acquisition and other specific terms of involved in managing cement supply chain reference are given with a view to examine the efficiently and effectively can have a status of bulk transportation of cement and s igni f icant impact on the overa l l recommend measures for increased bulk sustainability. Some cement companies have transportation. -Report on working group for started assessing supply chain performance, Cement Industry for 12th Five year plan Dec but there is no universal agreement on which (2011).factors to consider or their relative Cement is a transport intensive industry; importance. -Cement Sustainabili ty transportation component involves about Initiative, June (2012).20% cost of production. Transportation cost Further, Working Group for Cement Industry of cement is around Rs. 1.03 or Rs.1.04 per convened by Planning commission, suggest tonnes kilometer. This is the reason why that, “Future modernization needed in cement cement companies are seeking more wagons. industry is Bulk loading and transportation
and pneumatic cement transport”. -Report on If the material is brought from or taken to working group for Cement Industry for 12th hinterlands, transportation cost by road Five year plan, Dec (2011) increases. The industry depends heavily on Cement, being relatively a low value and high road transport for movement of Clinker to volume commodity, transportation costs form cement manufacturing units. J. K. Cements a significant proportion of its total cost. To informed the Committee that transportation improve market-servicing ability and reduce cost by truck transport over the last 10 years
ththe transportation of fly ash, many split- has increased by about 60%. -95 report of the grinding units have come up close to key Parliamentary standing committee of
Volume II Issue 2 Dec. 2012 Journal of Management Development & Research 47
Modified Multidimensional Scaling Technique for Brand Positioning of a product
- A Case Study on Shampoo Brands in Mumbai
(2009). In India, it is normally seen that Build thCommerce presented on 24 February, (2011) to Stock type of Supply chain exists.An efficient, integrated supply chain plays a Bulk Carriers of various designs are available. major part in the success of the business Whether the bulk carrier is mounted on a strategies of its constituent companies. It is chassis or a rolling stock, the desired features now recognized that, in many cases, of a bulk carrier are as follows:competition is between supply chain rather
a. Filling and discharge of cement than individual companies as pointed out
should be easy and fast.earlier. Getting the product and service to the b. It should be possible to deliver cement end consumer when they want it, is critical.
at different consumption sites by Consequently, the partner companies should using a Single carrier with a suitable work closely together to define and execute a number of compartmentssupply chain strategy, which will both satisfy
c. The bulk carrier design should be customer needs and allow them to make an made versatile so that it could be used adequate return. To get full benefit from a for the transportation of material other supply chain, it is necessary to line up all the
partners involved so that goods and services than cement on its return journey.flow effectively to consumers.-Ian Sadler, d. It should be simple to fabricate.(2007) Bapat J.D. et al (1984)Harvard's Michael Porter noted that to succeed, companies have to develop distinctive advantage. Distinctive advantage Total Cost of Ownership Conceptimplies that a company differentiates itself in Total cost of ownership (TCO) is a purchasing the mind of customers. Beating the methodology in which the goal is an competition by capturing the heart of understanding the true cost of buying a customers is the battle cry of companies like particular good or service from a particular Apple and Nordstrom. If a company were to supplier - Dobler and Burt, (1996). Ellram bring its managers together to brainstorm (1993) provides a framework for calculating opportunities to create value, many ideas
TCO that is designed to comprise all possible could be crystallized. These ideas could then
relevant costs. This may perhaps act as a be classified as one of the five basic areas of
fulcrum to bolster up this research study. It customer value: Quality, cost, flexibility, has been established by Heilala*y et al (2006) delivery, and innovation.-Stanley E Fawcett, that the TCO method is a useful in system-et al, (2008). Cement manufacturing process supplier and end-user communication, and is capital and energy intensive and has to be helps in trade-off analyses of system designed to generate economies of scale. It is a concepts. It is therefore, a technique of highly automated continuous process. effecting “Value Engineering” in the area of Because of the cost that is incurred by material handling in cement production stopping a plant, traditionally all the logistics
processes are subordinated to avoid this industry in Indian environment.situation, no matter the costs. Now, cement companies are committed to optimize the Research Gapslogistics costs along with avoiding stops in Given the importance of transport sector in the production. -Isabel Agedelo, (2009). Hence Supply Chain Management (SCM), one the logistics cost assumes important. would expect to find a mass of literature on the Three distinct type of supply chain exist in tanker market and operations. However, Cement Industry. First, one is Build to Stock, surprisingly, this sector has not been the focus the second one is Pack to Order and the third of previous research - Stephen Anderson, et al one is Grind Grind to Order. -Isabel Agedelo, (2004).
Volume II Issue 2 Dec. 2012 Journal of Management Development & Research 47
Modified Multidimensional Scaling Technique for Brand Positioning of a product
- A Case Study on Shampoo Brands in Mumbai
Cement Industry
Transporter
Study the SupplyChain Process inCement Industry
Technical Financial
Feasibility Study ofthe Proposed System
Proposed System forBulk materialHanding with otherCountries Operation
USE TOD for BulkTransportEquipment
Study the VariousEquipment used inTransportation
Study the BulkTransportation inIndia
Industries
Transporters
Effect onSupply chainDynamics
Cement Industry
Indian
Foreign
Industry
Actual Operator
Driver
Theoretical
This applies to dry bulk tank vehicles as well. Hence understanding the requirement of the Cement Industry and different types of vehicles used for transportation to fill up this research gap by a research study appears necessary. From the literature survey, it has been clearly identified that there is a thrust for reducing the logistic cost of transportation in cement industry. This can be done with advantage by looking at the transportation mode.
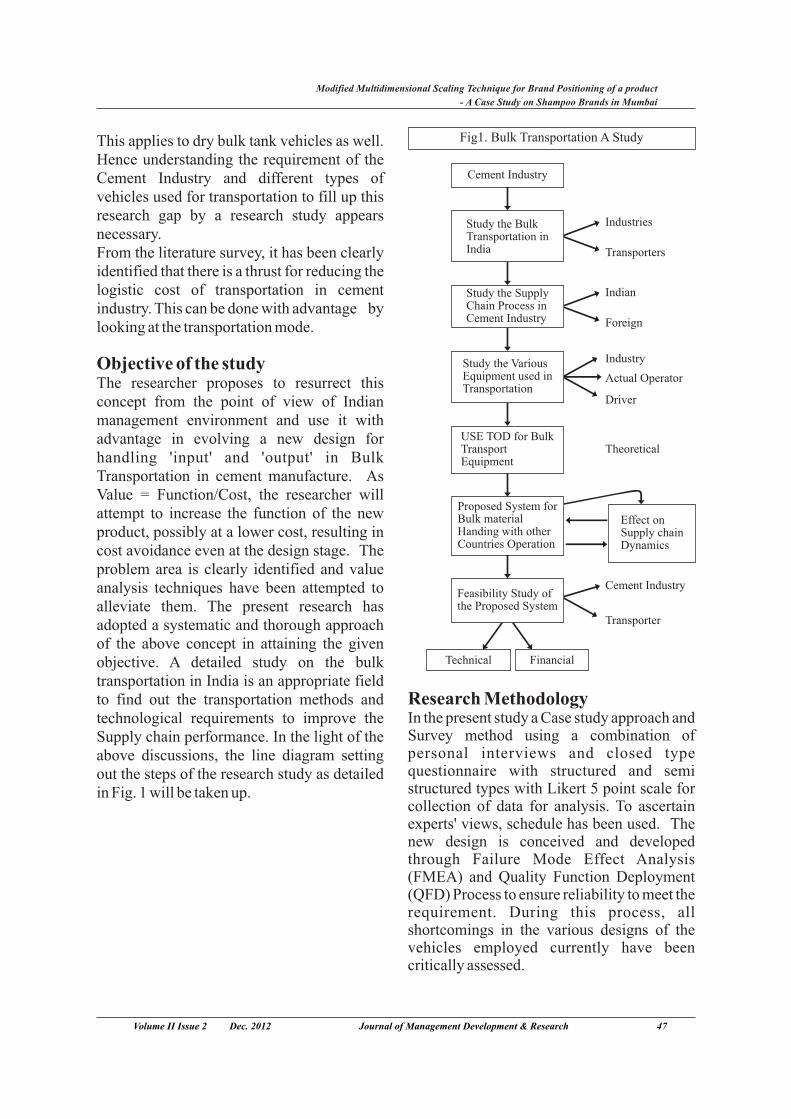
Objective of the studyThe researcher proposes to resurrect this concept from the point of view of Indian management environment and use it with advantage in evolving a new design for handling 'input' and 'output' in Bulk Transportation in cement manufacture. As Value = Function/Cost, the researcher will attempt to increase the function of the new product, possibly at a lower cost, resulting in cost avoidance even at the design stage. The problem area is clearly identified and value analysis techniques have been attempted to alleviate them. The present research has adopted a systematic and thorough approach of the above concept in attaining the given objective. A detailed study on the bulk transportation in India is an appropriate field to find out the transportation methods and technological requirements to improve the Supply chain performance. In the light of the above discussions, the line diagram setting out the steps of the research study as detailed in Fig. 1 will be taken up.
Research MethodologyIn the present study a Case study approach and Survey method using a combination of personal interviews and closed type questionnaire with structured and semi structured types with Likert 5 point scale for collection of data for analysis. To ascertain experts' views, schedule has been used. The new design is conceived and developed through Failure Mode Effect Analysis (FMEA) and Quality Function Deployment (QFD) Process to ensure reliability to meet the requirement. During this process, all shortcomings in the various designs of the vehicles employed currently have been critically assessed.
Volume II Issue 2 Dec. 2012 Journal of Management Development & Research 47
Modified Multidimensional Scaling Technique for Brand Positioning of a product
- A Case Study on Shampoo Brands in Mumbai
Fig1. Bulk Transportation A Study
OptimalLoad
Distriu-tion
TechnicalDesign
ReturnLoad
Option
EngerySaving
Safety
Environ-ment
Accept-ablity
Skills
Care for Operetor
People
Profit
Operation-al
Efficency
HumanFactor
LogisticsSystem
Effective-ness
TotalCost ofOwner-
ship
CorporateSocial
Responsi-bility
H1
H3
H2 H4 H5 SuppyChain
Performance
VariableCost of
Equipment
MaterialCost
Service CostIntial
InverstentCost
EquipmentReplacement
CostLabor Cost ReuseValue
success of this research study.The data so arrived from those techniques is used to reach the research goal. Research Model
A model is developed based on the identified Sourcing of Data research gaps and listed below considering all
the variables contributing to increase the Data have been sourced from the following:supply chain performance.
Primary sourcesThis includes discussions (formal and
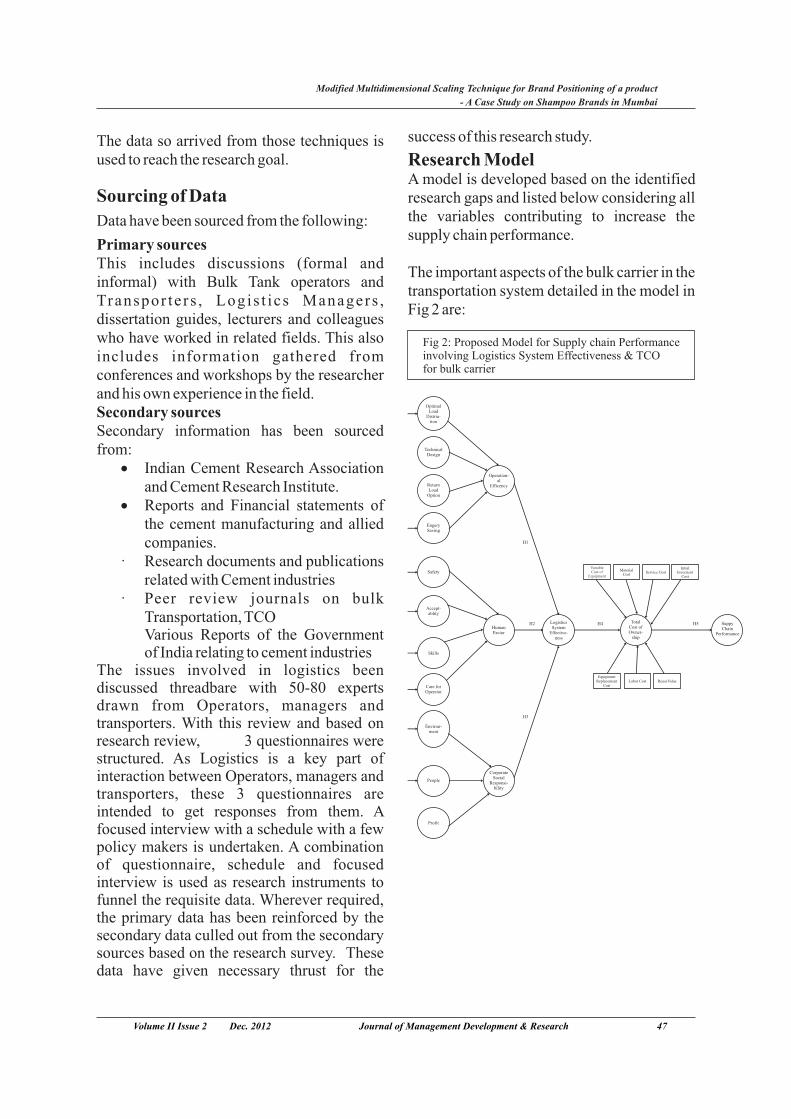
The important aspects of the bulk carrier in the informal) with Bulk Tank operators and
transportation system detailed in the model in Transpor te rs , Logis t ics Managers ,
Fig 2 are:dissertation guides, lecturers and colleagues who have worked in related fields. This also includes information gathered from conferences and workshops by the researcher and his own experience in the field.Secondary sourcesSecondary information has been sourced from:
· Indian Cement Research Association and Cement Research Institute.
· Reports and Financial statements of the cement manufacturing and allied companies.
· Research documents and publications related with Cement industries
· Peer review journals on bulk Transportation, TCOVarious Reports of the Government of India relating to cement industries
The issues involved in logistics been discussed threadbare with 50-80 experts drawn from Operators, managers and transporters. With this review and based on research review, 3 questionnaires were structured. As Logistics is a key part of interaction between Operators, managers and transporters, these 3 questionnaires are intended to get responses from them. A focused interview with a schedule with a few policy makers is undertaken. A combination of questionnaire, schedule and focused interview is used as research instruments to funnel the requisite data. Wherever required, the primary data has been reinforced by the secondary data culled out from the secondary sources based on the research survey. These data have given necessary thrust for the
Volume II Issue 2 Dec. 2012 Journal of Management Development & Research 47
Modified Multidimensional Scaling Technique for Brand Positioning of a product
- A Case Study on Shampoo Brands in Mumbai
Fig 2: Proposed Model for Supply chain Performanceinvolving Logistics System Effectiveness & TCOfor bulk carrier
Notes: Modeling Hypotheses testing. It is tentatively 1. O p t i m a l L o a d d i s t r i b u t i o n , proposed to formulate five Hypothesis as
Technological Design, Return load detailed below:option, Energy Savings leading to Operational Efficiency From the Model in Fig2, H1,H2, H3, H4, H5
2. Safety, Acceptability, Skills, Care for are the hypothesis to be tested.Operator leading to Human Factor · Hypothesis H1, H2, H3
3. Environment, People and Profit Logistics System Effectivenessleading to Corpora te Socia l
This Hypothesis leads to testing the Logistics Responsibility4. Operational Efficiency, Human Factor System Effectiveness of two major designs of
and Corporate Social Responsibility vehicle used in Bulk Transportation.
lead ing to Logis t ics sys tem · Logistics System Effectiveness effectiveness.
5. Logistics system effectiveness is H4 Total Cost of Ownershipstudied through TCO to understand H4 Hypothesis leads to validate Total Cost of Supply Chain Performance
Ownership approach of two major designs
used in Bulk Transportation.Silent features of the Present Research: · Total Cost of Ownership H5
The highlights of the study are: Supply Chain Performance
H5 Hypothesis leads to validate the Supply
A. Population: Chain Performance of the two major designs I. Vehicles used in Bulk Transport of used in Bulk Transportation.
cement and fly ash and its Transportfleet owner, Logistics Managers and Appropriate statistical tools such as Anova Operators. technique, multiple regression analysis have
ii. Manufacturers of the Bulk Tank been contemplated is used for data analysis. vehicles in India Based on the primary data collected and
iii. Cement manufacturers in South India secondary data gathered based on in depth literature survey, further additional and Chhattisgarh, Gujarat.s ta t i s t ica l tools has been used for B. Sampling Location: In and around interpretation. The data is analyzed using Chennai, Chhattisgarh, Gujarat.Statistical Package for Social Sciences. – Nie C. Unit of Analysis: Two major designs of et Al (1975)vehicles
D. Unit of Responses: Fleet owners, ObservationsLogistics Managers, Operators and The great novelist, Victor Huge observed: Manufacturers of Bulk carriers“Nothing in this world is as powerful as an E. Sampling Method: Quota sampling idea whose time has come”. Victor Huge method, which is a non- probability-made this statement almost 11/2 centuries sampling procedure that restricts the ago. Even now and more so in the latest
selection of the sample by controlling the context of Global competition which India
number of respondents by one or more faces now, it holds good due to the role of
criterion, shall be used. transportation in general and bulk F. Hypothesis: To use Structure Equation
Volume II Issue 2 Dec. 2012 Journal of Management Development & Research 47
Modified Multidimensional Scaling Technique for Brand Positioning of a product
- A Case Study on Shampoo Brands in Mumbai
E m e rg i n g m a r k e t s p r e s e n t f u t u r e transportation in particular to bolster up the opportunities as well as new rivals eff ic iency of supply chain of a l l
manufacturing industries in general and bulk Technology is changing the economic and industries in particular. trading relationships and creating a wide array Booz, et al (1982) identified 6 categories of of new business opportunities for such a new products. The categories are:
fiercely competitive global environment. It is
inevitable for every organization to generate 1. New to the world productsthe highest level of customer satisfaction at New products that create an entirely the highest value at the lowest cost. To attain new market
2. New Product lines these objectives it has become necessary for New products that allow a company to Indian organizations to look for innovations enter an established market for the that produce maximum efficiency to jack up first time
the bottom line. Cement industries, which 3. Additions to the existing product line
supply the key component to build the New products that supplement a infrastructure is no exception. Concerted company's established product linesefforts have to be made to increase the 4. Improvements in/revisions to existing
products competitiveness of this industry through cost New products that provide improved avoidance even supplier level. Thus, this performance or greater perceived research work has lead the way in this value and replace existing products direction through an innovative material
5. Repositioning Existing markets that handling cum transportation mode.
are targeted to new market or market The research has been undertaken in a limited segments
6. Cost reduction New products that area, though the research study, per-se has provide similar performance at lower been comprehensive. When the universe is cost being tested with a sample, it may have certain
A company usually pursues a mix of these errors, which are inherent in postulating
new products. An important finding is that hypothesis based on the data siphoned by such only 10% of all new products are new to the a method. Further research are to follow to world. These products involve the greatest validate the results of the study.cost and risk because they are new to the
company and the market place. However, the researcher through this research hopes to synergize a new product concept, which can Acknowledgementimprove the effectiveness and efficiency of supply chain performance of cement The author is grateful to Dr.V.Srinivasan, industries. DGM (Retd.), CPCL, Chennai and Visiting
Professor of ITM Business School & BIT Conclusion (Ranchi) Doctoral Programme, and Dr. Utpal
Baul, Professor in Management in Birla Indian organizations are struggling to sustain Institute of Technology, Mesra who are
competitiveness now in a rapidly globalizing guiding this project.
economy. The traditional industrial and
organizational boundaries are vanishing.
Volume II Issue 2 Dec. 2012 Journal of Management Development & Research 47
Modified Multidimensional Scaling Technique for Brand Positioning of a product
- A Case Study on Shampoo Brands in Mumbai
· Report on working group for Cement Referencesth
Industry for 12 Five year plan · B a p a t J . D . , S a x e n a , ( Dec 2011)J.P.,Chauhan.H.S., Sharma, C.K.,
· Stanley E.Fawcett, Lisa M. Ellram A.K. Mullick, (1984) Appropriate and Jeffrey A.Ogden,(2008) “Supply System Design for Bulk Packaging of Chain Management, From Vision to cement in India, Bulk Solids implementation”, Pearson Education.Handling, Volume 4, Number 3.
· Stephen Anderson, Julian Allen, Allan · Cement Sustainability Initiative, June Peats, Simon Owen, Bulk tanker 2012operations in Great Britain, Focus. · Dobler, Donald W., and David N. Burt (November 2004)(1996), Purchasing and Supply Chain
· Vijayaraghavan.T.A.S. (2004). Management, sixth edition, New Transportation Logistics in India - York: McGraw-Hill.Problems, Issues and Strategies for · Donald W.Dobler and David N.Burt, competitive advantage”, Supply (1996). Purchasing and Supply Chain Management for Global Management, Tata McGraw- Hill Competitiveness, Second Edition, Publishing Company Limited, New MacMillan India Ltd, DelhiDelhi, p.645
· Ellram, Lisa(1993), “Total Cost of O w n e r s h i p : E l e m e n t s a n d Implementation,” International Journal of Purchasing and Materials Management, Fall 1993.
· H e i l a l a * y. J , H e l i n z . K a n d Montoneny. J.(2006). Total cost of ownership,
o analysis for modular final a s s e m b l y s y s t e m s , International Journal of Production Research
· Ian Sadler, (2007), Logistics and Supply Chain Integration, Sage Publications.
· Isabel Agudelo, (2009) “Supply Chain Management in the Cement Industry” M a s s a c h u s e t t s I n s t i t u t e o f Technology.
· Nie, N.H., Hill, C.H., Jen Kins, JG., Stem Brenner,K.,Bent DH ( 1975), Stastical package for Social Sciences, New York: Mc Graw Hill.
· Ninety Fifth report on Performance of Cement Industry by Parliamentary Standing Committee on Commerce, (2011).
Volume II Issue 2 Dec. 2012 Journal of Management Development & Research 47
Modified Multidimensional Scaling Technique for Brand Positioning of a product
- A Case Study on Shampoo Brands in Mumbai
Seasonal Anomalies in Stock Returns: A Study of Bombay Stock Exchange
Dr. Ira Bapna
Professor and Director, Maharaja Ranjit Singh College of Professional Sciences, Indore
Prof. Manish Joshi
Assistant Professor, Prestige Institute of Management and Research, Indore
Mr. Vivek Bothra, Practicing Cost Accountant
Ms. Neha Shukla, Chartered Accountant
Logistics, Supply Chain, Value, Bulk Transportation, Cement industry, India
Abstract
Key words:
Shopping companion and the subsequent impact on Impulse Buying
This paper aims to examine stock market seasonality effect or calendar anomaly for the month of the year effect, weekend effect and the day of the week effect in Indian stock market for the Bombay Stock Exchange (BSE) Sensex. The data used in this study is daily and monthly closing prices of the BSE Sensex over the period from 2000 to 2013. To comply with the objectives of the month-of–the-year effect, weekend effect and day-of-the-week effect on BSE Sensex Kruskal Walis Test and one way ANOVA were used to see if any significant difference exists in average daily returns across weekday and monthly return. The result of the study found that this non-existence of the day effect and month of year effect means the seasonality is not present in Indian stock Market. MS Excel and SPSS 15 were used to carry out the analysis.There are several well-known stock market anomalies: the weekend effect, turn-of-the-month effect, and January effect. Seasonal anomalies--such as the weekend effect, turn-of-the-month effect, and January effect--have been well documented in the finance literature. Although the existence of negative abnormal returns on Mondays or positive abnormal returns around the turn of the month or year does not contradict market efficiency, once discovered, the seasonality's should be eliminated if they are large enough to be profitably exploited. Data for seven U.S. stock indices for 1973 – 2005 suggest that the weekend effect may have already gone through this entire cycle. The negative weekend effect declined first for large stocks and now has mostly disappeared even for small stocks. The reverse weekend effect that was identified in large stocks in the 1990s has similarly declined in recent years. Across all stock indexes, the weekend effect appears to be in the last stage of its cycle disappearance. In reasonably efficient markets, stock market anomalies should be eliminated soon after their discovery if the inefficiency is large enough to be profitably exploited. The January effect is the tendency for stocks to have larger returns in January than in other months of the year. It has since been strongly related to returns on small capitalization stocks. Once an anomaly is publicized, only too often it disappears or goes into reverse.This paper investigates the evolution of the weekend effect and hypothesizes a life cycle for this stock market anomaly involving identification, exploitation, decline, reversal, and finally disappearance.
Introduction example, sales of raincoats and umbrella generally increase in rainy season. Besides Market efficiency is a vital hallmark of an this, customs and tradition also affect urbane market. Increasing globalization of the economic variables as sales of gold increases financial markets and the unblemished nature during marriage seasons. Similarly, stock of cross border investment flows has returns exhibits systematic patterns at certain sharpened interest in emerging markets. Due times of the day, week or month. The most to the structural changes, globalization of the common of these are Monthly Patterns. capital markets, and internationalization of Certain Months provide better returns as the world economy, growing attention is compared to others i.e. the Month of the Year being given to budding capital market (Ray, Effect. Similarly, some Days of the Week 2012). Global investors are thus, attracted by provide lower returns as compared to other the stylish market of developed countries. A trading days i.e. Days of the Week Effectstep out from the fantasy world of market
perfections into the practical world, that, it is Efficient Market Hypothesis
improbable that, one would find an efficient market where there is availability of The existence of Seasonality in stock returns, information, homogenous expectations and however, disobeys a significant hypothesis in zero transaction cost i.e. where no investor finance called the Efficient Market can outperform the other and arbitrary profits Hypothesis (EMH). The Efficient Market a re e l imina ted . There a re marke t Hypothesis is a central paradigm in finance. imperfections and these lead to stock return New Data constantly enter the market place seasonality's. It is therefore important to v i a E c o n o m i c R e p o r t s , C o m p a n y understand stock market seasonality's to be Announcements, Political Statements, and or able to take benefit of them. One of the main Public Surveys. If the market is Informational concerns of investment analysts is the Efficient then security prices adjust rapidly predictability of stock returns. The more and accurately to new information predictable the returns are the lower the risk. (Nageshwari and Selvam, 2011). The This concern gives value to the study of stock Efficient Market Hypothesis suggests that all market behavior (Choudhry, 2000). securities are priced efficient to fully reflect
all the information intrinsic in the asset. Since The Seasonal Effects create higher or lower
all the information is already incorporated in returns depending on the Time Series. They
prices, a trader cannot make any excess are called Anomalies because they cannot be
returns. Thus, EMH proposes that it is not explained by traditional asset pricing models.
possible to outperform the market through Examples of such calendar anomalies patterns
Market Timing or Stock Selection. Thus, include e.g. the January Effect, the Day-of-the
equity prices no longer facilitate market Week Effect and the Week of the Month Effect
participants to devise trading strategy etc.
fetching abnormal profits on the basis of historic pattern. For instance, if there are
Seasonality evidences of 'Day of the Week Effect', investors may devise a trading strategy of Seasonality refers to regular and repetitive selling securities on Fridays and buying on fluctuation in a Time Series which occurs Mondays in order to make excess profits occasionally over a span of less than a year. (Agrawal and Tandon, 1994)..The main cause of seasonal variations in time
series data is the change in climate. For
Volume II Issue 2 Dec. 2012 Journal of Management Development & Research 46
Modified Multidimensional Scaling Technique for Brand Positioning of a product
- A Case Study on Shampoo Brands in Mumbai
Day-of-the-week effect Literature Review
The day-of-the-week effect is persistently one There is an extensive literature filing several of the more appealing stock market anomalies forms of market anomaly, especially in the to study as the existence of momentous day- full-blown capital markets as in US and of-the-week effects would be very useful for Europe. The presence of market anomalies developing profitable trading strategies. such as the month-of-the-year and day-of-the-Investors could buy stocks on days with week effects seems to be ubiquitous, abnormally low returns and sell stocks on occurring in stock markets around the world, days with abnormally high return. Several in both developed markets and emerging empirical studies have studied the phenomena markets (Dash, et al, 2011). Evidence of of calendar effects in stock markets, where seasonality is available for the mature stock returns tend to show higher (or lower) than markets in the developed countries. However, average returns in specific calendar periods. research concerning such anomalies in Calendar effects are anomalies in stock emerging stock markets is scarce (Su et al, returns that relate to the calendar, such as the 2 0 1 0 ) . S e v e r a l m a r k e t a n o m a l i e s , day-of-the-week, the month-of-the-year, or contradicting the EMH, have been reported, holidays, and well-known examples are the such as the January effect, the Monday effect, Monday effect and the January effect. Such the turn-of-the-month effect, the holiday anomalies cast doubts to the efficient market effect, the small-firm effect, announcement hypothesis (Pathak, 2013). effects, and many others. Such market
anomalies are primarily due to behavioral Months- of –the –year effect causes (Schwert, 2003). The pioneering work
on seasonality in stock returns (Watchel, The January effect or turn-of-the-year effect is 1942).a good example of seasonal anomalies in security markets throughout the world. At the Day Effectturn-of-the-year, certain types of securities tend to produce positive abnormal returns. The day-of-the-week effect in stock market Stock prices have tended to rise markedly returns has been extensively reported in during the period starting on the last trading developed and emerging stock markets, with day of December and ending on the fifth lower mean returns on Mondays and higher trading day of January (Su et al, 2010). mean returns on Fridays (Kelly, 1930; Hirsch,
1968; Cross, 1973; French, 1980; Gibbons Purpose of the Study and Hess, 1981; Smirlock and Starks, 1986;
Jaffe and Westerfield, 1989; Mills and Coutts, The presence of the Seasonal or Monthly 1995).While the lowest returns were Effect in stock returns has been accounted in identified on Tuesday in Japan and Australia several developed and emerging stock (Jaffe and Westerfield, 1989).The studies markets. Studies on the Seasonal Effects in the conducted in BSE and NSE to find the day-of-Indian Stock Market are limited. In an attempt the-week effect resulted in negative returns on to fill this gap, the present study investigates Tuesday and relatively higher returns on the existence of seasonality in India's stock Monday (Kumari and Mahendra, 2006). The market. The objective of the study is to study conducted from 1989 to 1996 in the five investigate the existence of seasonality in south East Asian stock markets namely stock returns in Bombay Stock Exchange Taiwan, South Korea, The Philippines, (BSE) Sensex.
Volume II Issue 2 Dec. 2012 Journal of Management Development & Research 46
Modified Multidimensional Scaling Technique for Brand Positioning of a product
- A Case Study on Shampoo Brands in Mumbai
Malaysia and Thailand revealed that neither the study period .The Day of the Week Effect South Korea nor the Philippines has during the Post Rolling Settlement Period was significant calendar effects. However, found with the Highest Mean Return on Malaysia and Thailand showed significant Friday and the Lowest Mean Return on positive return on Monday and significant Tuesday during the study period. Further, negative return on Tuesday (Brooks and there was strong significant positive Persand, 2001). The eleven major stock relationship between Monday – Friday and no market indices on Eastern Europe from 1990 significant relationship among other days of to 2002 found negative return on Monday in the week. The results indicated that the Day of six stock markets and positive return on the Week Effect did not exist in the Indian Monday in rest of them (Ajayi et al., 2004). Stock Market during the study period The seasonality in S&P CNX Nifty mirrors (Nageswari and Selvam, 2011).the day-of-the-week effect finding evidence for a Friday effect (Sah, 2008). While Month Effectevidence of the Monday effect, with lowest The January effect is the phenomenon in daily returns on Monday, and with highest which asset prices tend to increase in the daily returns on Wednesday were investigated month of January; in fact, between the last in NSE (Elango and Al Macki, 2008). In a trading day in December of the previous year research, the consistent positive returns on and the fifth trading day of the New Year in Wednesdays and negative returns on January. The studies were conducted in New Tuesdays were found due to possible impact York Exchange stocks, finding that average of the Week End Effect (Amanulla and return for the month of January was higher Thiripalraju, 2001). The analysis made to than other months (Rozeff and Kinney, 1976). discover the efficiency of Indian Stock A similar study was made in US market with Market by using S&P CNX 500 Index found size effects in stock returns and found that, the presence of Day of the Week Effect in the January returns of small firms were Indian Stock Market, which affected both the significantly higher than large firms, stock returns and volatility, thereby proving providing evidence for the tax-loss-selling the Indian Stock Market to be inefficient hypothesis, wherein investors sell their losing (Kumar and Deo, 2007). positions at the end of December. These The study made on NSE, concluded that, after stocks are sold typically at a discount to their the introduction of the Rolling Settlement, market value, and they are subsequently Friday had become significant. As far as the picked up by speculators, creating a buying Day Effect was concerned, Tuesday Effect pressure in the market (Kiem, 1983; was more prevalent than Monday Effect Reinganum, 1983; Gultekin and Gultekin, (Selvarani and Jenefa, 2009).). The study, 1983). Besides the US market, the analysis of carried on from 1979 to 1998 on BSE and the Canadian stock market from 1973 to 1980 NSE reported negative returns on Tuesday in found that the January effect in Canada not the Indian stock market while it was higher on only appears in small firms but large firms as Monday (Kumari and Mahendra, 2006). On well. A smallest-firm portfolio earns an examining the Week End Effect in the Indian average return of 8.15 percent in January and Stock Market, it was found that the mean 1.13 percent for the rest of the year, while the returns were positive for all days of the week, largest-firm portfolio attains an average return highest on Friday and lowest on Monday. . It of 5.4 percent in January and 0.83 percent for was inferred that the Day of the Week Pattern the rest of the year. Compared with the U.S did not exist in the Indian Stock Market during market where the January effect is only
Volume II Issue 2 Dec. 2012 Journal of Management Development & Research 46
Modified Multidimensional Scaling Technique for Brand Positioning of a product
- A Case Study on Shampoo Brands in Mumbai
pronounced for small capitalization, the Shanghai share markets but a high return in February has been found. Although the explanation for the Canadian stock market is February effect is not statistically significant that most Canadian stocks are small compared for the Chinese stock markets, it may be due to to the U.S stocks and the average return of Chinese Lunar New Year (Ong and Jason large stock in Canada may be equivalent to 2006). However, significant and positive small or medium stock in the U.S. (Berges et March effect was found due to the political al, 1984). Earlier also this was supported nature of financial anomalies in the country. (Ackert and Athanassakos, 1997). March is the political high season in China On the other hand, January and April effects in and in March political window-dressing is the New Zealand stock market were not caused by political maneuvers by the Chinese statistically significant (Raj and Thurston, government, resulting in a higher March 1994). However, using stock data ranging return in the Chinese stock market (Zhang et from 1983 to 1993, it was claimed that there al., 2003). The calendar effect in FTSE 100, was a January effect in the New Zealand stock Mid 250 and 350 indices for the period 1986 market (Hasan and Raj, 2001).The monthly and 1992 found calendar effect in FTSE 100 seasonal effect was not observed in Jordan (Mill and Coutts, 1995). The April effect for (Maghyereh, 2003). Ghana's stock market was observed on Study resulted in the presence of January application of rolling techniques (Alagidede effect on the UK and US stock markets, but and Panagiotidis, 2009).Researchers has also not in the German stock market (Choudhary, reported half- month effect in literature. 2001). The study designed to explore seasonal Various studies have reported that daily stock pattern in stock returns in several markets (18 returns in first half of month are relatively markets) around the world attributed the higher than last half of the month (Ariel, reasons for the January effect in most of the 1987). Similar results were confirmed on US developed stock markets were the tax loss market indices from 1963 to 1981 (Aggarwal selling hypothesis, settlement procedures, and and Tandon, 1994) and in other international insider trading information. Another markets (Ziemba, 1991).explanation for seasonal effects is window-The Bombay Stock Exchange (BSE) and dressing related to institutional trading; to National Stock Exchange (NSE) in India did avoid reporting to many losers in their not confirm the January effect but April portfolios at the end of year, institutional seasonal returns were found to be higher than investors tend to sell losers in December and nine other months. The April seasonal return buy them back after the reporting date in occurs due to Tax-Loss-Selling as the January in order to hold their desired portfolio
stfinancial year ends on 31 March and a capital structure again (Fountas and Segredakis, gains tax is imposed by the Indian government 2002).The Tokyo Stock Exchange in Japan (Raj and Kumari, 2006). The data from confirmed the January and June anomalies Bombay Stock Exchange's Sensitivity Index due to bonuses peculiar in Japanese society documented the monthly effect in the stock (Kato and Schallheim, 1985).On the other returns in India. The results confirm the side it was found due to small-capitalization existence of seasonality in stock returns in stock phenomena (Reyes, 2001). The January India consistent with the 'tax-loss selling' effect was not observed either in the South hypothesis (Lazar et al., 2005). The study Korean market or Taiwanese market (Tong, carried on for exploring seasonality in 1992). It was also not observed in Jamaica monthly returns in BSE Sensex of Indian (Ramacharran, 1997). ). The January effect stock market, found the evidence of January does not appear in either the Shenzhen or
Volume II Issue 2 Dec. 2012 Journal of Management Development & Research 46
Modified Multidimensional Scaling Technique for Brand Positioning of a product
- A Case Study on Shampoo Brands in Mumbai
effect (Pandey, 2002). The confirmation of revealed that in the NSE, there was strong seasonality in both Indian and US markets evidence of April and January Effect. In fact, it were also indentified (Bodla and Jindal, is reported that when the S&P500 has a net 2006). The seasonality in S&P CNX Nifty positive gain in the first five trading days of imitates the month-of-the-year effect, finding the year, there is about an 86% chance that the evidence for July, September, December, and stock market will rise for the year, while when January anomalies (Sah, 2008). Another the first five days of January yield a net loss, research comes out with the month-of-the- there is no statistical bias of the market, up or year effect in the NSE, finding the presence of down (Dash et al, 2011).a January anomaly, with March and April having significant negative returns, and Objectives of the StudyNovember and December showing significant The objectives of the study are as follows:positive returns (Elango and Pandey, 2008). a) To examine days of the week effect in the The similar type of conclusion were drawn returns of Bombay Stock Exchange (BSE) with two distinct effects: a November- Sensex. December effect, in which the mean returns b) To examine the seasonality in monthly for November and December were returns of the Bombay Stock Exchange (BSE) significantly higher than those in the other ten Sensex.months, and a March-to-May effect, in which mean returns for the months March to May Research Designwere significantly lower than those during the
Hypothesisother nine months; and they showed that these H : The return of BSE Sensex of every 01effects were independent of each other (Patel, working day of the week is not statistically 2008).The empirical study conferred on the different.stock returns of India and Malaysia confirmed H : The return of BSE Sensex of every 11the presence of the Monthly Effect and the working day of the week is statistically existence of Seasonality in stock returns in different.both capital markets. H : The return of BSE Sensex is not 02The study suggested that the Indian Stock statistically different in all months of the year.Market would move in the direction of higher H : The return of BSE Sensex is statistically 22level of efficiency and the investors would different in all months of the year.earn returns commensurate with risk
(Chotigcat and Pandey, 2005). The average Scope of the Studyreturns of Stock Exchange of Mauritius
(SEM) found to be the lowest in the Month of · The study is conducted for the period March and Highest in the Month of June. The
stfrom 1 April, 2001 to 31 March 2013 equality of means-return tests shows that , so analysis should be taken in the returns were statistically the same across all purview of circumstances prevailing months. The regression analysis reveals that during The period.returns were not independent of the Months of
· The study is conducted on BSE the Year, except for January (Agathee, Sensex.2008).The analysis of the trends in annual
· The study conducted parametric test returns and daily returns with the set of ANOVA for the analysis.parametric and non-parametric tests were
employed to test the equality of mean returns and standard deviations of the returns and
Volume II Issue 2 Dec. 2012 Journal of Management Development & Research 46
Modified Multidimensional Scaling Technique for Brand Positioning of a product
- A Case Study on Shampoo Brands in Mumbai
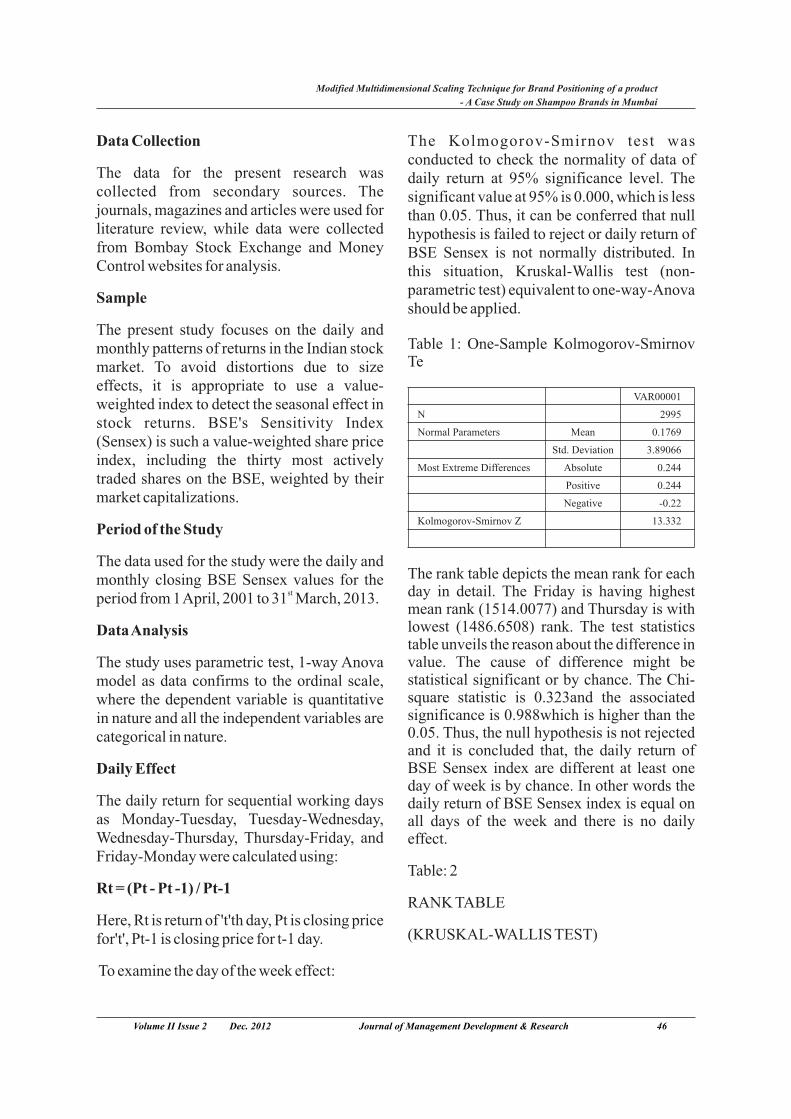
Data Collection The Kolmogorov-Smirnov test was conducted to check the normality of data of
The data for the present research was daily return at 95% significance level. The collected from secondary sources. The significant value at 95% is 0.000, which is less journals, magazines and articles were used for than 0.05. Thus, it can be conferred that null literature review, while data were collected hypothesis is failed to reject or daily return of from Bombay Stock Exchange and Money BSE Sensex is not normally distributed. In Control websites for analysis. this situation, Kruskal-Wallis test (non-
parametric test) equivalent to one-way-Anova Sample
should be applied.
The present study focuses on the daily and Table 1: One-Sample Kolmogorov-Smirnov monthly patterns of returns in the Indian stock Temarket. To avoid distortions due to size
effects, it is appropriate to use a value-weighted index to detect the seasonal effect in stock returns. BSE's Sensitivity Index (Sensex) is such a value-weighted share price index, including the thirty most actively traded shares on the BSE, weighted by their market capitalizations.
Period of the Study
The data used for the study were the daily and The rank table depicts the mean rank for each monthly closing BSE Sensex values for the
st day in detail. The Friday is having highest period from 1 April, 2001 to 31 March, 2013.mean rank (1514.0077) and Thursday is with lowest (1486.6508) rank. The test statistics Data Analysistable unveils the reason about the difference in
The study uses parametric test, 1-way Anova value. The cause of difference might be statistical significant or by chance. The Chi-model as data confirms to the ordinal scale, square statistic is 0.323and the associated where the dependent variable is quantitative significance is 0.988which is higher than the in nature and all the independent variables are 0.05. Thus, the null hypothesis is not rejected categorical in nature.and it is concluded that, the daily return of BSE Sensex index are different at least one Daily Effectday of week is by chance. In other words the
The daily return for sequential working days daily return of BSE Sensex index is equal on as Monday-Tuesday, Tuesday-Wednesday, all days of the week and there is no daily Wednesday-Thursday, Thursday-Friday, and effect.Friday-Monday were calculated using:
Table: 2Rt = (Pt - Pt -1) / Pt-1
RANK TABLEHere, Rt is return of 't'th day, Pt is closing price
(KRUSKAL-WALLIS TEST)for't', Pt-1 is closing price for t-1 day.
To examine the day of the week effect:
Volume II Issue 2 Dec. 2012 Journal of Management Development & Research 46
Modified Multidimensional Scaling Technique for Brand Positioning of a product
- A Case Study on Shampoo Brands in Mumbai
N
Normal Parameters
Most Extreme Differences
Kolmogorov-Smirnov Z
Mean
Std. Deviation
Absolute
Positive
Negative
VAR00001
2995
0.1769
3.89066
0.244
0.244
-0.22
13.332
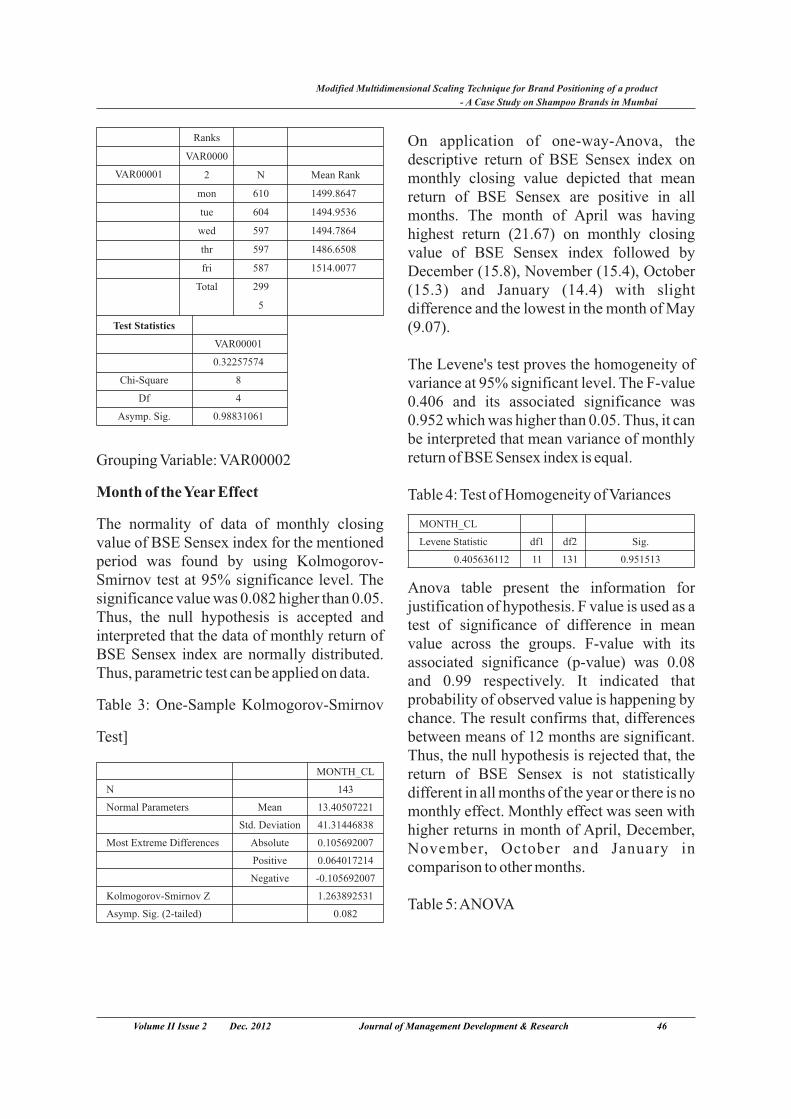
On application of one-way-Anova, the descriptive return of BSE Sensex index on monthly closing value depicted that mean return of BSE Sensex are positive in all months. The month of April was having highest return (21.67) on monthly closing value of BSE Sensex index followed by December (15.8), November (15.4), October (15.3) and January (14.4) with slight difference and the lowest in the month of May (9.07).
The Levene's test proves the homogeneity of variance at 95% significant level. The F-value 0.406 and its associated significance was 0.952 which was higher than 0.05. Thus, it can be interpreted that mean variance of monthly return of BSE Sensex index is equal.Grouping Variable: VAR00002
Month of the Year Effect Table 4: Test of Homogeneity of Variances
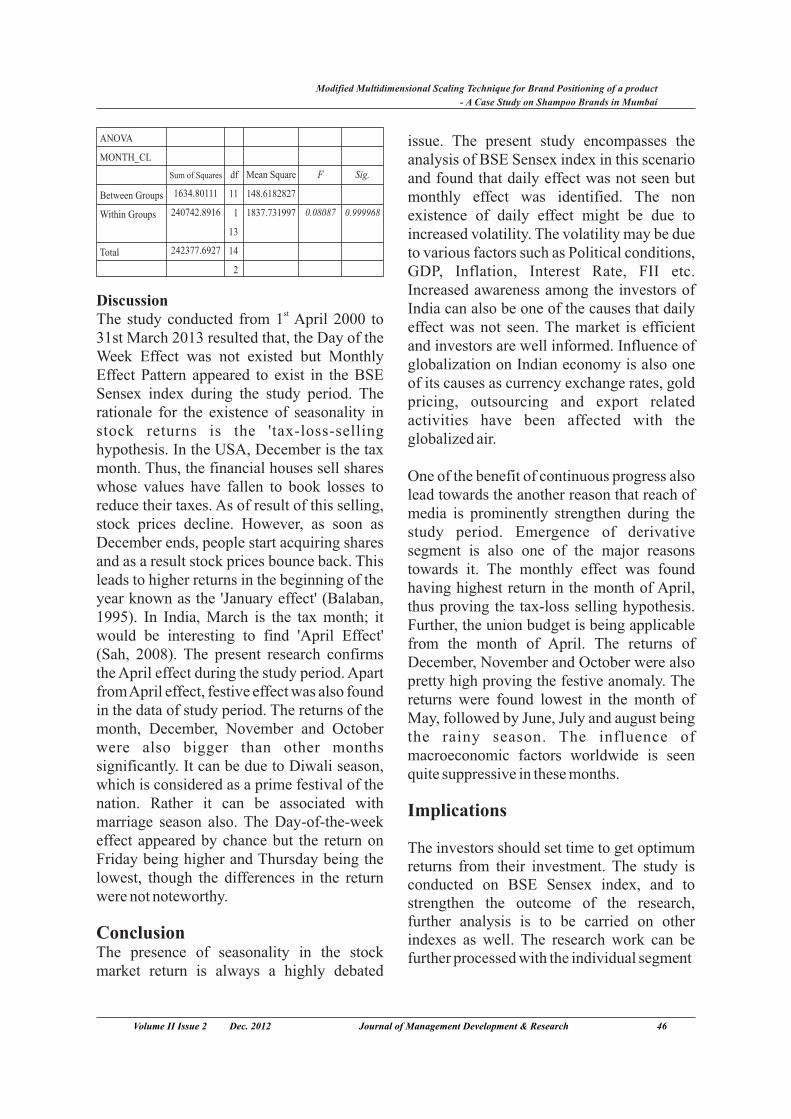
The normality of data of monthly closing value of BSE Sensex index for the mentioned period was found by using Kolmogorov-Smirnov test at 95% significance level. The Anova table present the information for significance value was 0.082 higher than 0.05. justification of hypothesis. F value is used as a Thus, the null hypothesis is accepted and test of significance of difference in mean interpreted that the data of monthly return of value across the groups. F-value with its BSE Sensex index are normally distributed. associated significance (p-value) was 0.08 Thus, parametric test can be applied on data. and 0.99 respectively. It indicated that
probability of observed value is happening by Table 3: One-Sample Kolmogorov-Smirnov chance. The result confirms that, differences
Test] between means of 12 months are significant. Thus, the null hypothesis is rejected that, the return of BSE Sensex is not statistically different in all months of the year or there is no monthly effect. Monthly effect was seen with higher returns in month of April, December, November, October and January in comparison to other months.
Table 5: ANOVA
N
Normal Parameters
Most Extreme Differences
Kolmogorov-Smirnov Z
Asymp. Sig. (2-tailed)
Mean
Std. Deviation
Absolute
Positive
Negative
MONTH_CL
143
13.40507221
41.31446838
0.105692007
0.064017214
-0.105692007
1.263892531
0.082
VAR00001
Ranks
VAR0000
2
mon
tue
wed
thr
fri
Total
N
610
604
597
597
587
299
5
Mean Rank
1499.8647
1494.9536
1494.7864
1486.6508
1514.0077
Test Statistics
Chi-Square
Df
Asymp. Sig.
VAR00001
0.32257574
8
4
0.98831061
Volume II Issue 2 Dec. 2012 Journal of Management Development & Research 46
Modified Multidimensional Scaling Technique for Brand Positioning of a product
- A Case Study on Shampoo Brands in Mumbai
MONTH_CL
Levene Statistic
0.405636112
df1
11
df2
131
Sig.
0.951513
issue. The present study encompasses the analysis of BSE Sensex index in this scenario and found that daily effect was not seen but monthly effect was identified. The non existence of daily effect might be due to increased volatility. The volatility may be due to various factors such as Political conditions, GDP, Inflation, Interest Rate, FII etc. Increased awareness among the investors of
Discussion India can also be one of the causes that daily The study conducted from 1 April 2000 to effect was not seen. The market is efficient 31st March 2013 resulted that, the Day of the and investors are well informed. Influence of Week Effect was not existed but Monthly globalization on Indian economy is also one Effect Pattern appeared to exist in the BSE of its causes as currency exchange rates, gold Sensex index during the study period. The pricing, outsourcing and export related rationale for the existence of seasonality in activities have been affected with the stock returns is the 'tax-loss-selling globalized air. hypothesis. In the USA, December is the tax month. Thus, the financial houses sell shares One of the benefit of continuous progress also whose values have fallen to book losses to lead towards the another reason that reach of reduce their taxes. As of result of this selling, media is prominently strengthen during the stock prices decline. However, as soon as study period. Emergence of derivative December ends, people start acquiring shares segment is also one of the major reasons and as a result stock prices bounce back. This towards it. The monthly effect was found leads to higher returns in the beginning of the having highest return in the month of April, year known as the 'January effect' (Balaban, thus proving the tax-loss selling hypothesis. 1995). In India, March is the tax month; it Further, the union budget is being applicable would be interesting to find 'April Effect' from the month of April. The returns of (Sah, 2008). The present research confirms December, November and October were also the April effect during the study period. Apart pretty high proving the festive anomaly. The from April effect, festive effect was also found returns were found lowest in the month of in the data of study period. The returns of the May, followed by June, July and august being month, December, November and October the rainy season. The influence of were also bigger than other months macroeconomic factors worldwide is seen significantly. It can be due to Diwali season, quite suppressive in these months.which is considered as a prime festival of the nation. Rather it can be associated with Implications marriage season also. The Day-of-the-week effect appeared by chance but the return on The investors should set time to get optimum Friday being higher and Thursday being the returns from their investment. The study is lowest, though the differences in the return conducted on BSE Sensex index, and to were not noteworthy. strengthen the outcome of the research,
further analysis is to be carried on other Conclusion indexes as well. The research work can be The presence of seasonality in the stock further processed with the individual segmentmarket return is always a highly debated
st
Volume II Issue 2 Dec. 2012 Journal of Management Development & Research 46
Modified Multidimensional Scaling Technique for Brand Positioning of a product
- A Case Study on Shampoo Brands in Mumbai
ANOVA
MONTH_CL
Between Groups
Within Groups
Total
Sum of Squares
1634.80111
240742.8916
242377.6927
df
11
1
13
14
2
Mean Square
148.6182827
1837.731997
F
0.08087
Sig.
0.999968
segment to identify the script for investment. At the global platform index value of other developed markets can also be studied as a potential investment avenue.segment to identify the script for investment. At the global platform index value of other developed markets can also be studied as a potential investment avenue.
week effects: new evidence from an merging stock market. Applied Economics Letters, 2, 139- 143.
· Berges, A., John J. McConnell and Gary G. Schlarbaum,1984, "The Turn of the Year Effect in Canada,"Journal of Finance, Vol. 39, (March): 185-192.
· Bodla, B.S., & Jindal, K. (2006). Seasonal Anomalies in Stock Returns:
References: Evidence from India and the US. · Decision, 33(1), 46-55.
1997, Prior Uncertainty, Analyst Bias, · Brooks, Chris, and Gita Persand and Subsequent Abnormal Returns, (2001), “Seasonality in Southeast Journal of Financial Research 20 (2), Asian Stock Markets:(Summer), 263-273. · Some New Evidence on Day-of-the-
· Agathee ,Ushad Subadar(2008), Week Effects,” Applied Economic “Calendar Effects and the Months of Letters, Vol. 8, pp. 155–58.the Year”: Evidence from the · Chotigcat, T. Pandey, I.M,(2005) M a u r i t i a n S t o c k E x c h a n g e . “Seasonality in Asia's Emerging Stock International Research journal of Markets: India and Malaysia”. Finance and Economics, 14, pp. 254- International Trade and Finance 261. Association 15th International
· Agrawal, A., Tandon, K. (1994), conference.'Anomalies or illusions? Evidence · Choudhry T., 2000: 'Day of the Week from stock markets in eighteen Effect in Emerging Asian Stock countries'. Journal of International Markets: Evidence from the GARCH Money and Finance, vol.13, pp83- M o d e l ' , A p p l i e d F i n a n c i a l 106. Economics, 10, 235 – 242.
· Ajayi, R., Mehdian, S. and Perry, M. · Choudhry, T. (2001). Day of the week (2004), “The Day-of-the-Week Effect effect in emerging Asian stock in Stock Returns: Further Evidence markets: evidence from the GRACH from Eastern European Emerging model. Applied Financial Economics, Markets”, Emerging Markets Finance 10, 235-242.and Trade, 40(4), pp 53-62. · Choudhary, T. (2001). Month of the
· Alagidede, P. & Panagiotidis, T. Year Effect and January Effect in pre-(2009) Calendar Anomalies in the WWI stock returns: Evidence from a Ghana Stock Exchange, Journal of non-linear GARCH. International Emerging Market Finance, 8, 1-23. Journal of Finance & Economics, 6,
· Amanulla, S., M.Thiripalraiu(2001), 1-11. “Week End Effect: New Evidence · Cross, F. (1973). The Behavior of from the Indian Stock Market”. Stock Prices on Fridays and Mondays. Vikalpa, 26(2), pp. 33-50. Financ ia l Ana lys t s Journa l ,
· Ariel R A (1987), “Monthly Effects in Nov.–Dec. 1973, 67–69Stock Returns”, Journal of Financial Economics, 18,1987, p.p.161-174.
· Balaban, E. (1995). Day - of- the-
Ackert, L. F., and G. Athanassakos,
Volume II Issue 2 Dec. 2012 Journal of Management Development & Research 46
Modified Multidimensional Scaling Technique for Brand Positioning of a product
- A Case Study on Shampoo Brands in Mumbai
·http://webcache.googleusercontent.com/search?q=cache:UYbiJ0uvH78J:www.macrothink.org/journal/index.php/ajfa/article/view/997+Seasonality+and+Market+Crashes+in+Indian+Stock+Markets+Mihir+Dash&cd=1&hl=en&ct=clnk&gl=in&client=firefox-a. Visited on Aug 09, 2013 at 3:44PM.
· Elango, R., & Al Macki, N.M. (2008). Monday Effect and Stock Return Seasonality: Further Empirical Evidence. The Business Review, Cambridge 10(2), 282-288; available a t S S R N : http://ssrn.com/abstract=1103627.
· Elango, R., & Pandey, D. (2008). An Empirical Study on January Anomaly and Return Predictability in an Emerging Market: Evidence from I n d i a ; a v a i l a b l e a t S S R N : http://ssrn.com/abstract=1150080.
Dash, et al, 2011. Cited in July – December2007, pp.28-35.· Hasan, T. & Raj, M. (2001). An
examination of the tax loss selling behaviour in a de-regulated Pacific financial market. American Business Review 19(2): 100-105.
· Hirsch, Y. (1968). The Stockholder's Almanac. The Hirsch Organization, Old Tappan N. J.
· Jaffe, J.F., Westerfield, R., & Christopher, M. (1989). A Twist on the Monday Effect in Stock Prices: Evidence from the U.S. and Foreign Stock Markets. Journal of Banking and Finance, 13, 641-650
· Kato, K. & Schallheim, J. S. (1985). Seasonal and Size Anomalies in the Japanese Stock Market. Journal of Financial and Quantitative Analysis 20(2):243-261.
· Keim, D B (1983). “A Further Investigation of the Weekend Effect in Stock Returns,” Journal of Finance,
· 39(3), 819-840.(2002). Emerging stock markets · Kelly, F. (1930). Why You Win or return seasonalities: the January effect Lose: The Psychology of Speculation, and the tax-loss selling hypothesis. Boston: Houghton Mifflin.Applied Financial Economics, 12, · Kumari, D., & Mahendra, R. (2006). 291-299 Day-of-the-week and other market
· French, Kenneth R., 1980, "Stock anomalies in theReturns and the Weekend Effect," · Indian stock market. International Journal of Financial Economics, Journal of Emerging Markets, 1(3), Vol.8, 5569. 235-246
· Gibbons, M.R., & Hess, P., (1981). · Lazar, D., Priya, Julia and Jeyapaul, Day-of-the-Week Effects and Asset Joseph (2005). "SENSEX Monthly Returns. Journal of Business, 54, Return: Is there Seasonality?” Indian 579–96. Institute of Capital Markets 9th
· Gultekin, M N and Gultekin, N B Capital Markets Conference.(1983). “Stock Market Seasonality: · Li L., Ong, & Jason, D., M., (2006), International Evidence,” Journal of "Seasonalities in China's Stock Financial Economics, 12(4), 469-482. Markets: Cultural or Structural?” IMF
· Hareesh kumar V. and Malabica Deo Working Paper, IMF.(2007) “Efficiency of Indian Stock · Maghyereh, Aktham Issa (2003), Market- A Case of Day of the Week "Seasonality and January Effect Effect”, SMART Journal of Business Anomalies in the Jordanian Capital Management Studies, Vol.3, No.2, Market". Available at SSRN
Fountas, S., & Segredakis, K.N.
Volume II Issue 2 Dec. 2012 Journal of Management Development & Research 46
Modified Multidimensional Scaling Technique for Brand Positioning of a product
- A Case Study on Shampoo Brands in Mumbai
· Capital Market Seasonality: The Case DOI: 10.2139/ssrn.441081. of Stock Market Returns. Journal of
· Mills, T.C., & Coutts, J.A. (1995). Financial Economics, 3, 376-402.Calendar Effects in the London Stock · Sah, A.N. (2008). Stock Market Exchange FTSE Indices. European Seasonality: A Study of the Indian Journal of Finance, 1, 79-93. Stock Market. NSE Research Paper,
· Nageshwari, P. and Selvam, M (2011). a v a i l a b l e a t N S E : C i t e d i n www.nseindia.com/content/research/http://www.ijmbs.com/14/nageshwar res_paper_final228.pdf.i.pdf Visited on Aug 09, 2013 at · Schwert, G.W. (2003). Anomalies and 2:18PM. Market Efficiency; in Handbook of
· Pandey, I M. (2002). Is There the Economics of Finance, Edited by Seasonality in the Sensex Monthly Constantinides, G.M., Harris, M., Returns. IIMA Working Paper, IIM Stulz, R., Publ. Elsevier Science B.VAhmedabad. · Smirlock, M., & Starks, L. (1986).
· Patel, J.B. (2008). Calendar Effects Day of the Week and Intraday Effects in the Indian Stock Market. in Stock Returns. Journal of Financial International Business and Economics, 17, 197-210. Economic Research Journal, 7(3), · Smirlock, M., & Starks, L. (1986). 61-69. Day of the Week and Intraday Effects
· Pathak, Manish, 2013. Cited in in Stock Returns. Journal of Financial http://theglobaljournals.com/paripex/ Economics, 17, 197-210 file.php?val=OTY4. Visited on Aug · Selvarani,M. and Leena Jenefa, 2009. 09, 2013 at 2:56PM. “Calendar Anomalies in the National
· Raj, M., Thurston, D. (1994). January Stock Exchange (NSE) indices”. The or April? Tests of the turn-of-the-year ICFAI Journal of Applied Finance, effect in the New Zealand stock 15(1), pp. 56-67. market. Applied Economic Letters, 1, · S u e t a l , 2 0 1 0 . C i t e d i n 81-93. http://webcache.googleusercontent.c
· Ramacharran, H. (1997), “Seasonality om/search?q=cache:xlxLq2uMkMMin the Jamaican Stock Market: An J:www.ccsenet.org/journal/index.phpExamination of Stock Returns and the /ijef/article/download/7117/7306+FiVolume Traded,” Journal of Emerging nancial+Anomalies:+Evidence+fromMarkets, vol.2, no.1, pp23-35. +Chinese+Ahare+Markets&cd=1&hl
· Ray Sarbapriya, (2012), Inflation and =en&ct=clnk&gl=in&client=firefox-Stock Price Behaviour in Selected a. Visited on Aug 09, 2013 at 3:11PM.Asian Economies: An Econometric · Wachtel, S.B. (1942). Certain Snapshot, Advances in Asian social Observations on Seasonal Movement Science, vol.2, no.1, pp.387-97. in Stock Prices. Journal of Business,
· Reinganum, M., R.,(1983) “The 15 (2), 184-193.Anomalous Stock Market Behavior of · Zhang, Z., Sun, W. & Hua, W. (2003). Small Firms in January Empirical Test Financial Anomalies in Emerging for Year-End Tax Effect,” Journal of Markets: The Case of China, Working Financial Economics, Vol. 12, pp.89- paper, Business school, Durham 104. University.
· Rozeff, M.S., & Kinney, W.R. (1976).
http://ssrn.com/abstract=441081 or
Volume II Issue 2 Dec. 2012 Journal of Management Development & Research 46
Modified Multidimensional Scaling Technique for Brand Positioning of a product
- A Case Study on Shampoo Brands in Mumbai
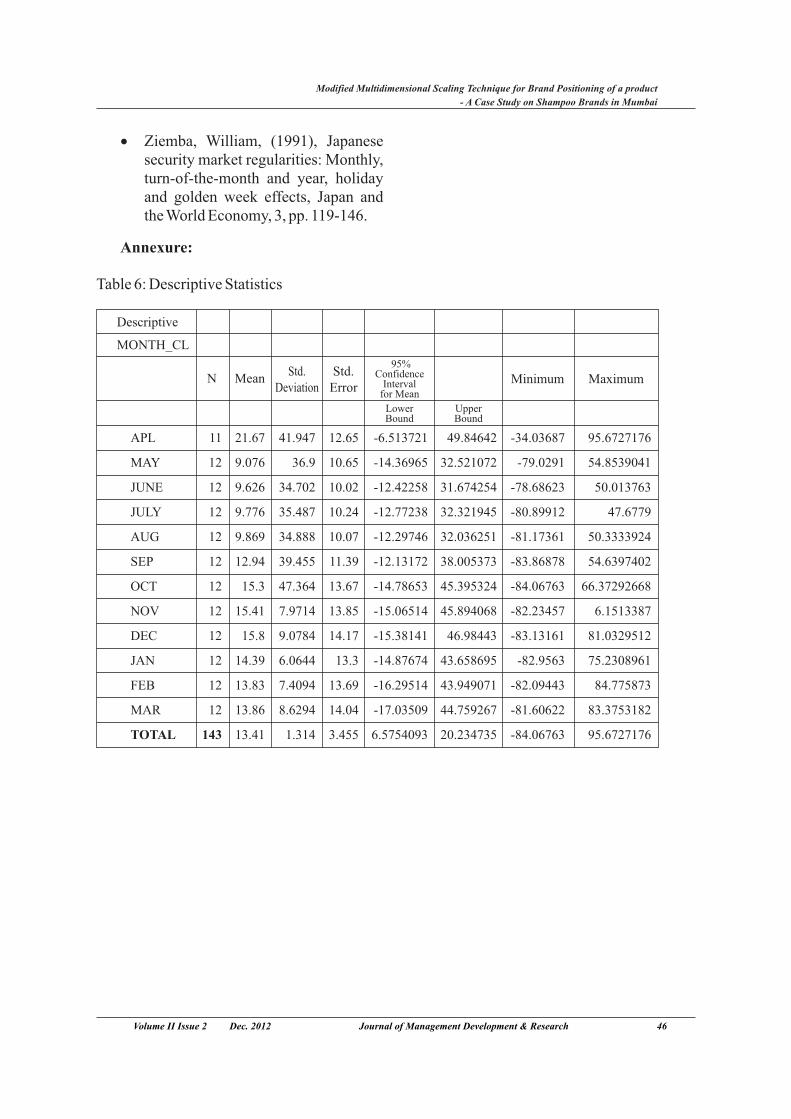
·security market regularities: Monthly, turn-of-the-month and year, holiday and golden week effects, Japan and the World Economy, 3, pp. 119-146.
Annexure:
Table 6: Descriptive Statistics
Ziemba, William, (1991), Japanese
Volume II Issue 2 Dec. 2012 Journal of Management Development & Research 46
Modified Multidimensional Scaling Technique for Brand Positioning of a product
- A Case Study on Shampoo Brands in Mumbai
Descriptive
MONTH_CL
APL
MAY
JUNE
JULY
AUG
SEP
OCT
NOV
DEC
JAN
FEB
MAR
TOTAL
N
11
12
12
12
12
12
12
12
12
12
12
12
143
Mean
21.67
9.076
9.626
9.776
9.869
12.94
15.3
15.41
15.8
14.39
13.83
13.86
13.41
Std.Deviation
41.947
36.9
34.702
35.487
34.888
39.455
47.364
7.9714
9.0784
6.0644
7.4094
8.6294
1.314
Std.Error
12.65
10.65
10.02
10.24
10.07
11.39
13.67
13.85
14.17
13.3
13.69
14.04
3.455
95%Confidence
Intervalfor Mean
-6.513721
-14.36965
-12.42258
-12.77238
-12.29746
-12.13172
-14.78653
-15.06514
-15.38141
-14.87674
-16.29514
-17.03509
6.5754093
LowerBound
49.84642
32.521072
31.674254
32.321945
32.036251
38.005373
45.395324
45.894068
46.98443
43.658695
43.949071
44.759267
20.234735
UpperBound
Minimum Maximum
-34.03687
-79.0291
-78.68623
-80.89912
-81.17361
-83.86878
-84.06763
-82.23457
-83.13161
-82.9563
-82.09443
-81.60622
-84.06763
95.6727176
54.8539041
50.013763
47.6779
50.3333924
54.6397402
66.37292668
6.1513387
81.0329512
75.2308961
84.775873
83.3753182
95.6727176
A Study of the Indian Apparel Market and the Consumer Purchase
Behaviour of Apparel among Management Students in Mumbai and Navi
Mumbai
Prof. Sandeep Bhanot
Associate Professor, SIES College of Management Studies, Nerul, Navi Mumbai
Logistics, Supply Chain, Value, Bulk Transportation, Cement industry, India
Abstract
Key words:
Volume II Issue 2 Dec. 2012 Journal of Management Development & Research 1
Shopping companion and the subsequent impact on Impulse Buying
Apparel is one of the necessities of human civilization along with food, water and shelter. The Apparel Industry reflects people's lifestyles and shows their social and economic status. The Apparel and Textile industry is India's second largest industry after the IT Industry. College students as a young consumer group have gained significant importance from marketers in recent years because of their growing purchasing power. They have easy access to credit cards (Schor, 1998) and income from part-time jobs to spend. Students tend to spend money on clothing and beauty products, and find these items to be important. Therefore, college students' apparel shopping orientation is important to research because it is an important sector of consumer behavior. The purpose of the study is to understand the Indian apparel market in terms of market size and growth and to study the important demographic, psychological and socio-economic factors, which influence the consumer purchase behaviour for apparel with reference to college going students, especially management students. First a secondary study was done on the apparel market in India through books and the internet. Then a questionnaire was prepared to collect primary data from management students of different areas, family income, gender, and attitude regarding purchase behaviour of apparel. The collected data was then analyzed using various quantitative tools. The relation between various demographic variables and consumer behaviour on apparel is expected to be understood. Apparel companies can target the right target segment in terms of gender, age group, family income, personality, culture etc. by understanding the preferences of the students and can devise strategies to enable the students to access
earner for the country. The apparel industry Introductionaccounts for 26% of all Indian exports. The Indian government has targeted the apparel Apparel Industry: Apparel is one of the and textiles industry segments to reach $50 necessities of human civilization along with billion by the year 2015. One of the most food, water and shelter. The Apparel Industry interesting features of the apparel industry is reflects people's lifestyles and shows their that, it migrates from high cost nations to the social and economic status. The Apparel and low cost nations. The growth of the domestic Textile industry is India's second largest demand for clothing in India is linked with the industry after IT Industry. At present, it is success of the retailing sector. India presently amongst the fastest growing industry segment has entered the second phase of growth and and is the second largest foreign exchange
is witnessing a massive rise in the domestic the visible act of making a purchase, lies a demand. This is primarily due to the rise in the decision that must be investigated. The standard of living caused by the rise in the purchase decision process is the stages a buyer middle-income groups. In our present passes through in making choices about which economic world of demand and supply, price
products and services to buy. There are five and quality are the key factors, which
stages of consumer behaviour: (i) problem determine the success of any business. The
recognition (ii) information search (iii) key element here though, is the cost of labor. alternative evaluation (iv) purchase decision (v) India and China have a comparative post purchase behaviouradvantage in this industry though, their vast
labor forces and the relatively low cost of Consumer purchase behaviour of apparel : labor.
The Indian economy has grown over the last 10 Since, India and China have the advantage of years with new jobs created in the ITES sector, making textiles and so fabric costs are lower Biomedical, Automotive engineering, Apparel than in other countries, they have become the
Apparel sourcing choice for many manufacturing and Civil engineering. The international companies. Sourcing choices growth is strongly led by Information arise from profitability. This includes Technology Enabled Services (ITES); this is considering costs, such as, buying factors of supported by the education sector with increase production, like land, buildings and machines in the number of students enrolling for higher versus factors affecting revenues, including education and large numbers of students pricing, marketing, and distribution. The graduating every year thus creating a large pool issues of labor, material, shipping costs and of technical and managerial manpower. The tariffs structure also affect the sourcing working class people segment has grown since choices. Since, apparel production is a labor-
the economic growth and it has benefited intensive activity, wage rates are also a major
middle class and upper middle class people. factor in sourcing decisions. This gives
Due to the increase in the number of working immediate competitive advantage to people and substantial raise in income, producers in countries like India and China to spending power has increased over the years, export to more developed and high cost and particularly the young Indians in the age of countries like the United States and the 15 – 25 like to shop more.European Union.
Apparel is a highly symbolic product category due to its high visibility. Individuals will often make assumptions about a person's self-concept Consumer purchase behaviour:
The actions a person takes in purchasing and simply based on his/her clothing (Soloman & using products and services, including the Rabolt, 1999). Self-concept is a dynamic mental and social processes that precede and structure that changes according to the nature of follow these actions can be called as consumer the social surroundings or situation (Banister & behaviour. It helps us to answer questions Hogg, 2006). Consumers will change their such as: consumption behavior based on a current
change in their self-concepts (Banister & Hogg, (I) Why people choose one product or 2006). The symbolic nature of clothing as a
brand over another? visual expression of self-concept can (ii) How they make these choices, and incorporate various clothing styles, brands, (iii) How companies use this knowledge to retailer outlets and memberships in particular
provide value to consumers subcultures (Soloman & Rabolt, 1999). Consumer purchase decision process: Behind
Volume II Issue 2 Dec. 2012 Journal of Management Development & Research 46
Modified Multidimensional Scaling Technique for Brand Positioning of a product
- A Case Study on Shampoo Brands in Mumbai

Consumer purchase behaviour of apprarel is influenced by retail apparel segment, and to among college going students: College assess the importance of each of them to students as a young consumer group have consumers in selecting apparel from gained significant importance from marketers organized retail outlets. Jinhee Nam et al in recent years because of their growing (2007) in their study examined the apparel and purchasing power. They have easy access to shopping preferences of mature women in credit cards (Schor, 1998) and income from
America. Independent living residents were part-time jobs to spend. Students tend to
surveyed concerning fashion consciousness, spend money on clothing and beauty
fashion information sources and shopping products, and find these items to be important.
behaviours. Young and mature consumers' Therefore, college students' apparel shopping reactions to female apparel ensembles were orientation is important to research because it compared. Mature subjects purchased apparel is an important sector of consumer behavior.for pleasure or need, but less for conformity. Gupta (2004) investigated the factors Literature Reviewinfluencing the choice of private label in Consumer behaviour of apparel: Krishna, departmental stores of Hyderabad for two C. V. (2011) says that Indian retail is in an product categories—processed food and expansion spree and many companies are toiletries. A study conducted by Memon joining the retail landscape. After food and (2006) wanted to trace the impact of private groceries segment apparel is the next large level brands on retailing dealing in garments. retail segment and the consumption of apparel This work considered only two retail brands is also very large in volume. Previously the Westside and Pantaloons in Ahmedabad city manufacturing brands used to lead the apparel and accepted the hypothesis that people are category in the early days and the penetration ready to switch over to other brands if the of the private label brands was very small. same facilities are available. Recently, Radha Now things have changed and private label Krishna and Shylajan (2007) proposed a brands are leading in every segment. In the conceptual model and considered the apparel segment also many private label influence of various marketing and brands are leading the competition. Consumer demographic factors on consumers' habitual buying behavior is mainly affected by many buying behaviour towards branded articles. determinant factors and this paper aims at However, identification of factors, existence understanding and identifying the important of which indulges consumers to go for determinant factors affecting the consumer organized retail apparel brands are still left buying behavior towards private label unturned.apparel. Sullivan, Pauline et al (2012) say that
despite Generation Y (Gen Y) consumers' Consumer behaviour for apparel with significant role as a decision maker in the reference to college going students: Cowart, market, it is increasingly challenging for Kelly O.; Goldsmith, Ronald E. (2007) retailers to understand these consumers' investigate motivations for online apparel behavior and psychology. To enhance an in-consumption using the Consumer Styles depth understanding of Gen Y consumers, this Inventory. Data from a sample of 357 US study examined the effect of fashion college students showed that quality involvement (FI) and perceived experiential consciousness, brand consciousness, fashion value (EV) on Gen Y consumers' retail apparel consciousness, hedonistic shopping, patronage behaviour. Lahiri, Isita et al (2010) impulsiveness and brand loyalty were in their study make an attempt to identify the positively correlated with online apparelfactors of the consumers' buying behavior that
Volume II Issue 2 Dec. 2012 Journal of Management Development & Research 46
Modified Multidimensional Scaling Technique for Brand Positioning of a product
- A Case Study on Shampoo Brands in Mumbai
shopping. Price sensitivity was negatively apparel market, women's apparel market, correlated with online spending. Min-Young boys' and girls' apparel market.Lee et al (2008) in their paper on Mexican (ii) To study the important demographic, college students aim to examine the effects of psychological and socio-economic factors general consumer variables (i.e. normative which influence the consumer purchase in terpersonal inf luence and brand behaviour for apparel with reference to consciousness) and brand-specific variables col lege going s tudents , especial ly (i.e. perceived quality and emotional value) management students.on purchase intention toward a US apparel (iii) To study how consumer behaviour for brand. Kaushal, Shailesh K. (2011) examines apparel is influenced by factors like family the teenager's behavior in reference to fashion income, gender and peer influence. This will apparel purchase intentions and fashion help companies to devise different strategies marketing strategies in Lucknow with survey to promote their apparel brands based on among700 teenagers regarding their attitudes preferences of the students.toward apparels purchase. The paper first uses R e s e a r c h M e t h o d o l o g y both exploratory and confirmatory factor Research Design: First, a secondary study analysis to examine the factor structure and was done on the apparel market in India psychometric properties of these items. through books and the internet. Then a McKinney, Letecia et al (2004) The purpose questionnaire was prepared to collect primary of this research was to examine the influence data from management students of different of selected social factors on the clothing areas, family income, gender, and attitude buying behaviour patterns of black college regarding purchase behaviour of apparel.consumers. The sample consisted of 333 Sampling design: A random sample of 600 students from two US universities. Results management students residing in Mumbai and showed that social participation was Navi Mumbai was taken and would cover significantly related to store patronage. No people of different incomes and gender. difference was found in patronage behaviour Analysis was done based on a sub-sample of for the variables of reference group, social 60 students.involvement, fashion involvement, clothing benefits sought, and social environment. Data collection: The primary data was Kumar, Archana et al (2009) examine the collected using a structured questionnaire.direct and indirect effects of individuals' self-concept, product-oriented variables (i.e. Data analysis: The collected data was then consumer's need for uniqueness (NFU), and using various quantitative tools.clothing interest), and brand-specific variables (i.e. perceived quality and Findings: The overall size of textile and emotional value) on purchase intention apparel industry, including the domestic toward a US retail brand versus a local brand market and exports, is currently estimated at that are available in the Indian market. Rs. 3,27,000 crore (US $ 70 bn). It is pegged to Mohamadou L Fadiga et al (2005) in their grow at Rs. 10,32,000 crore (US $ 220 bn) by study identify sources of demand growth for 2020, with a CAGR of 11%. As per the latest apparel in the US based on consumer report by Technopak, Indian Textile & demographic profiles, regions, and product Apparel Compendium 2010, the Indian characteristics. domestic textile and apparel market size in
2009 was Rs. 218570 crore (US $ 47bn) and is O b j e c t i v e s o f t h e S t u d y ex p ec ted t o g ro w a t t he ra te o f 1 1% CA G R to (i) To study the Indian apparel market in terms reach Rs. 656000 crore (US $ 140 bn) by of market size and growth, focusing on men's 2020.
Volume II Issue 2 Dec. 2012 Journal of Management Development & Research 46
Modified Multidimensional Scaling Technique for Brand Positioning of a product
- A Case Study on Shampoo Brands in Mumbai
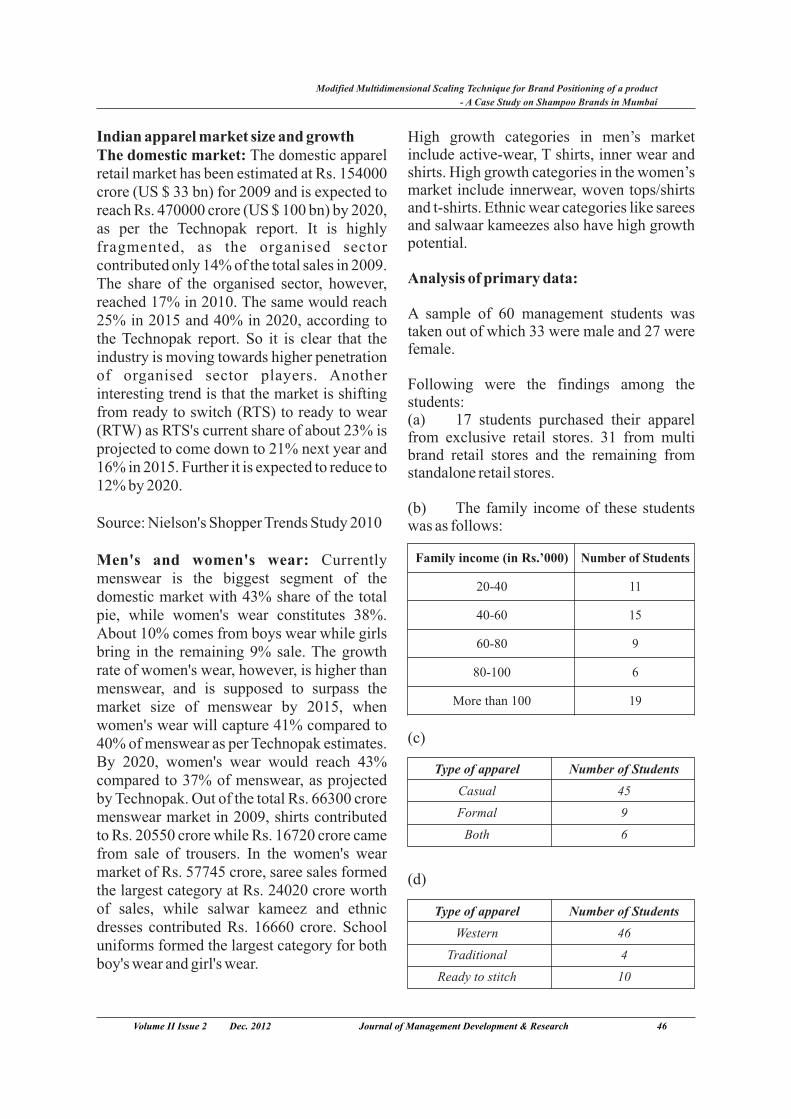
Indian apparel market size and growthThe domestic market: The domestic apparel retail market has been estimated at Rs. 154000 crore (US $ 33 bn) for 2009 and is expected to reach Rs. 470000 crore (US $ 100 bn) by 2020, as per the Technopak report. It is highly fragmented, as the organised sector contributed only 14% of the total sales in 2009. The share of the organised sector, however, reached 17% in 2010. The same would reach 25% in 2015 and 40% in 2020, according to the Technopak report. So it is clear that the industry is moving towards higher penetration of organised sector players. Another interesting trend is that the market is shifting from ready to switch (RTS) to ready to wear (RTW) as RTS's current share of about 23% is projected to come down to 21% next year and 16% in 2015. Further it is expected to reduce to 12% by 2020.
Source: Nielson's Shopper Trends Study 2010
Men's and women's wear: Currently menswear is the biggest segment of the domestic market with 43% share of the total pie, while women's wear constitutes 38%. About 10% comes from boys wear while girls bring in the remaining 9% sale. The growth rate of women's wear, however, is higher than menswear, and is supposed to surpass the market size of menswear by 2015, when women's wear will capture 41% compared to 40% of menswear as per Technopak estimates. By 2020, women's wear would reach 43% compared to 37% of menswear, as projected by Technopak. Out of the total Rs. 66300 crore menswear market in 2009, shirts contributed to Rs. 20550 crore while Rs. 16720 crore came from sale of trousers. In the women's wear market of Rs. 57745 crore, saree sales formed the largest category at Rs. 24020 crore worth of sales, while salwar kameez and ethnic dresses contributed Rs. 16660 crore. School uniforms formed the largest category for both boy's wear and girl's wear.
Volume II Issue 2 Dec. 2012 Journal of Management Development & Research 46
Modified Multidimensional Scaling Technique for Brand Positioning of a product
- A Case Study on Shampoo Brands in Mumbai
High growth categories in men’s market include active-wear, T shirts, inner wear and shirts. High growth categories in the women’s market include innerwear, woven tops/shirts and t-shirts. Ethnic wear categories like sarees and salwaar kameezes also have high growth potential.
Analysis of primary data:
A sample of 60 management students was taken out of which 33 were male and 27 were female.
Following were the findings among the students:(a) 17 students purchased their apparel from exclusive retail stores. 31 from multi brand retail stores and the remaining from standalone retail stores.
(b) The family income of these students was as follows:
(c)
(d)
Family income (in Rs.’000)
20-40
40-60
60-80
80-100
More than 100
Number of Students
11
15
9
6
19
Type of apparel
Casual
Formal
Both
Number of Students
45
9
6
Type of apparel
Western
Traditional
Ready to stitch
Number of Students
46
4
10
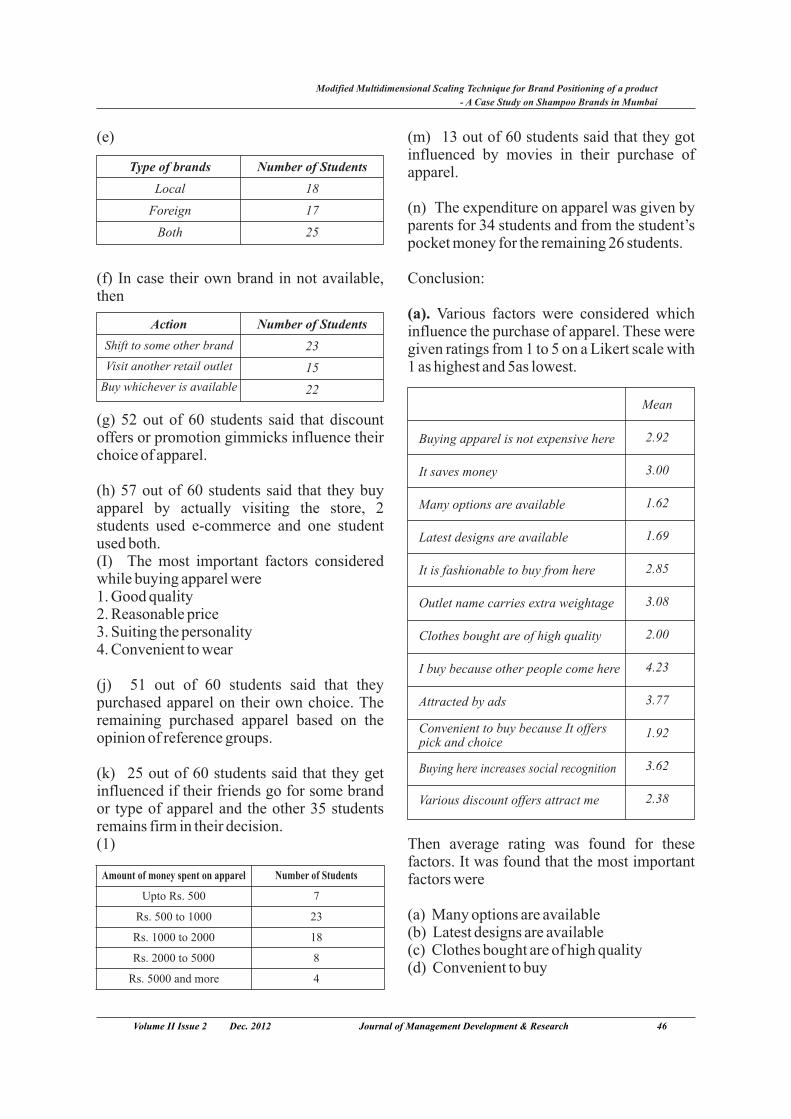
Mean
2.92
3.00
1.62
1.69
2.85
3.08
2.00
4.23
3.77
1.92
3.62
2.38
Buying apparel is not expensive here
It saves money
Many options are available
Latest designs are available
It is fashionable to buy from here
Outlet name carries extra weightage
Clothes bought are of high quality
I buy because other people come here
Attracted by ads
Convenient to buy because It offerspick and choice
Buying here increases social recognition
Various discount offers attract me
(e)
(f) In case their own brand in not available, then
(g) 52 out of 60 students said that discount offers or promotion gimmicks influence their choice of apparel.
(h) 57 out of 60 students said that they buy apparel by actually visiting the store, 2 students used e-commerce and one student used both.(I) The most important factors considered while buying apparel were1. Good quality2. Reasonable price3. Suiting the personality4. Convenient to wear
(j) 51 out of 60 students said that they purchased apparel on their own choice. The remaining purchased apparel based on the opinion of reference groups.
(k) 25 out of 60 students said that they get influenced if their friends go for some brand or type of apparel and the other 35 students remains firm in their decision.(1)
Volume II Issue 2 Dec. 2012 Journal of Management Development & Research 46
Modified Multidimensional Scaling Technique for Brand Positioning of a product
- A Case Study on Shampoo Brands in Mumbai
Type of brands
Local
Foreign
Both
Number of Students
18
17
25
Action
Shift to some other brand
Visit another retail outlet
Buy whichever is available
Number of Students
23
15
22
Amount of money spent on apparel
Upto Rs. 500
Rs. 500 to 1000
Rs. 1000 to 2000
Rs. 2000 to 5000
Rs. 5000 and more
Number of Students
7
23
18
8
4
(m) 13 out of 60 students said that they got influenced by movies in their purchase of apparel.
(n) The expenditure on apparel was given by parents for 34 students and from the student’s pocket money for the remaining 26 students.
Conclusion:
(a). Various factors were considered which influence the purchase of apparel. These were given ratings from 1 to 5 on a Likert scale with 1 as highest and 5as lowest.
Then average rating was found for these factors. It was found that the most important factors were
(a) Many options are available(b) Latest designs are available(c) Clothes bought are of high quality(d) Convenient to buy
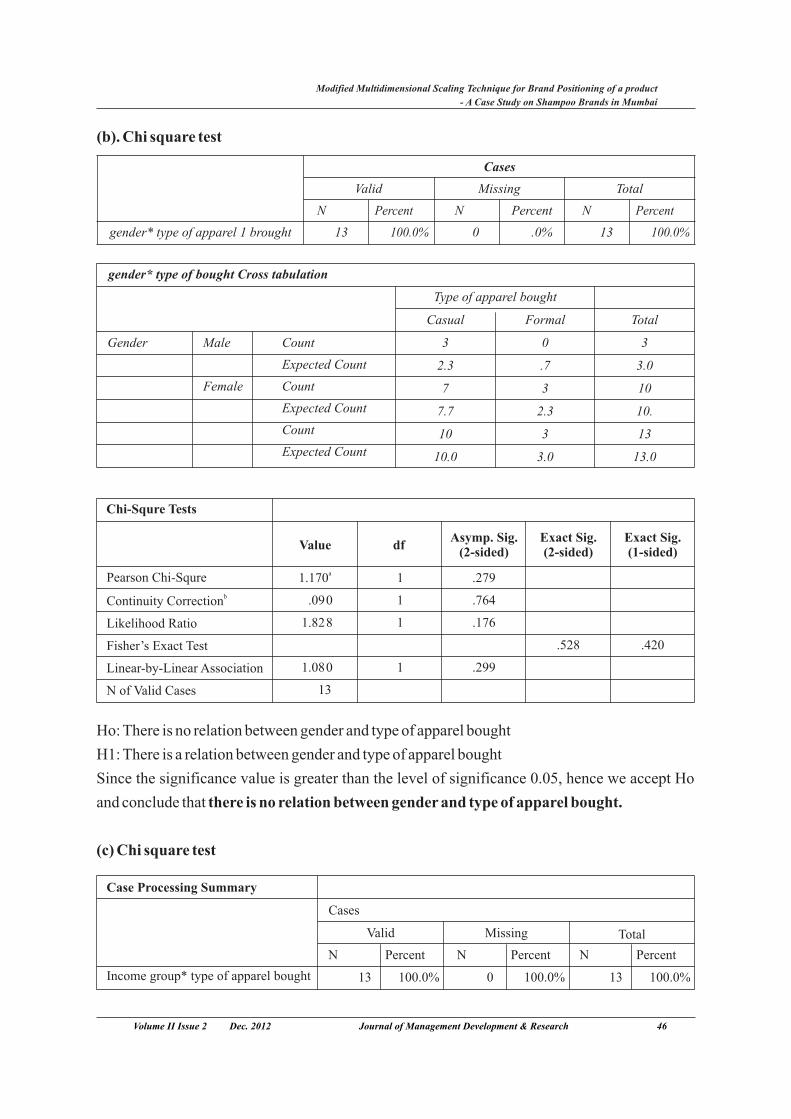
Ho: There is no relation between gender and type of apparel bought
H1: There is a relation between gender and type of apparel bought
Since the significance value is greater than the level of significance 0.05, hence we accept Ho
and conclude that there is no relation between gender and type of apparel bought.
(c) Chi square test
gender* type of bought Cross tabulation
Gender
Type of apparel bought
Casual
3
2.3
7
7.7
10
10.0
Formal
0
.7
3
2.3
3
3.0
Total
3
3.0
10
10.
13
13.0
Male
Female
Count
Expected Count
Count
Expected Count
Count
Expected Count
gender* type of apparel 1 brought
Cases
Valid
N
13
Missing Total
Percent
100.0%
N
0
Percent
.0%
N
13
Percent
100.0%
(b). Chi square test
Volume II Issue 2 Dec. 2012 Journal of Management Development & Research 46
Modified Multidimensional Scaling Technique for Brand Positioning of a product
- A Case Study on Shampoo Brands in Mumbai
Chi-Squre Tests
Pearson Chi-Squre
bContinuity Correction
Likelihood Ratio
Fisher’s Exact Test
Linear-by-Linear Association
N of Valid Cases
a1.170
.090
1.828
1.080
13
Value
1
1
1
1
dfAsymp. Sig.
(2-sided)
.279
.764
.176
.299
Exact Sig.(2-sided)
.528
Exact Sig.(1-sided)
.420
Case Processing Summary
Income group* type of apparel bought
Cases
N
13
Valid
Percent
100.0%
N
0
Percent
100.0%
N
13
Percent
100.0%
Missing Total
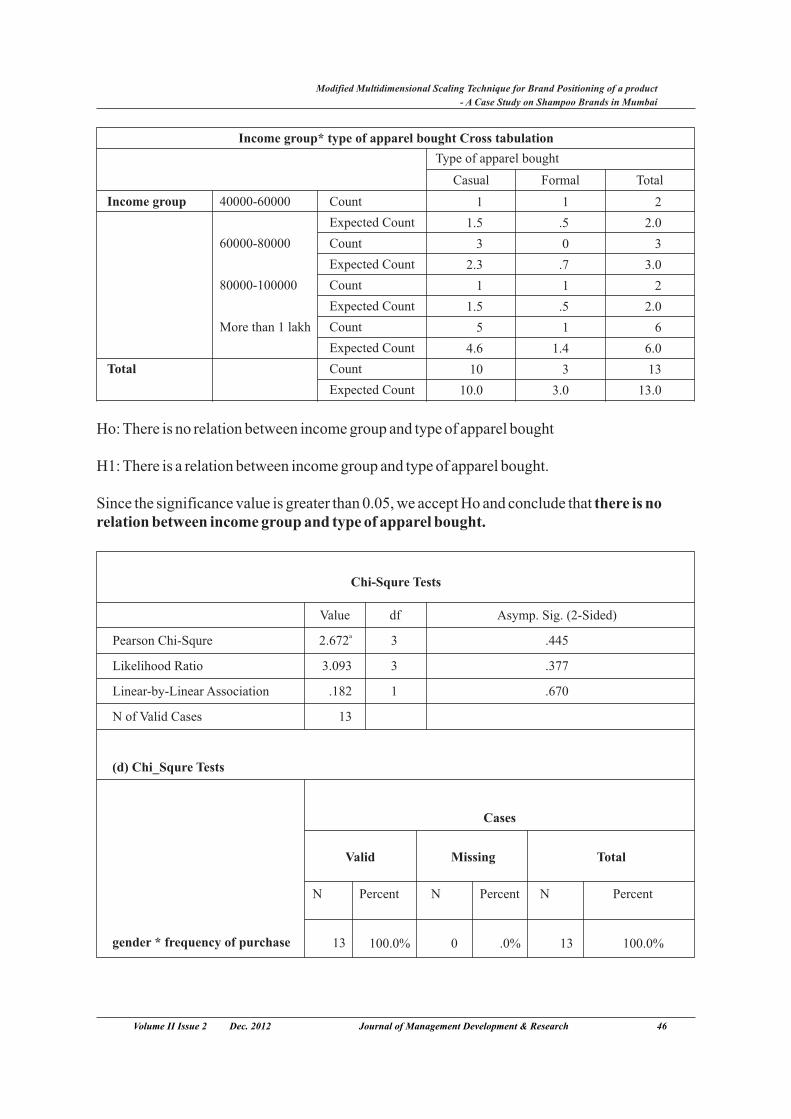
Chi-Squre Tests
Value
Pearson Chi-Squre
Likelihood Ratio
Linear-by-Linear Association
N of Valid Cases
df
a2.672
3.093
.182
13
3
3
1
Asymp. Sig. (2-Sided)
.445
.377
.670
(d) Chi_Squre Tests
Cases
N
13
Valid
gender * frequency of purchase
Missing Total
Percent
100.0%
N
0
Percent
.0%
N
13
Percent
100.0%
Income group* type of apparel bought Cross tabulation
Type of apparel bought
Casual
1
1.5
3
2.3
1
1.5
5
4.6
10
10.0
Income group
Total
Volume II Issue 2 Dec. 2012 Journal of Management Development & Research 46
Modified Multidimensional Scaling Technique for Brand Positioning of a product
- A Case Study on Shampoo Brands in Mumbai
40000-60000
60000-80000
80000-100000
More than 1 lakh
Count
Expected Count
Count
Expected Count
Count
Expected Count
Count
Expected Count
Count
Expected Count
Formal Total
1
.5
0
.7
1
.5
1
1.4
3
3.0
2
2.0
3
3.0
2
2.0
6
6.0
13
13.0
Ho: There is no relation between income group and type of apparel bought
H1: There is a relation between income group and type of apparel bought.
Since the significance value is greater than 0.05, we accept Ho and conclude that there is no relation between income group and type of apparel bought.
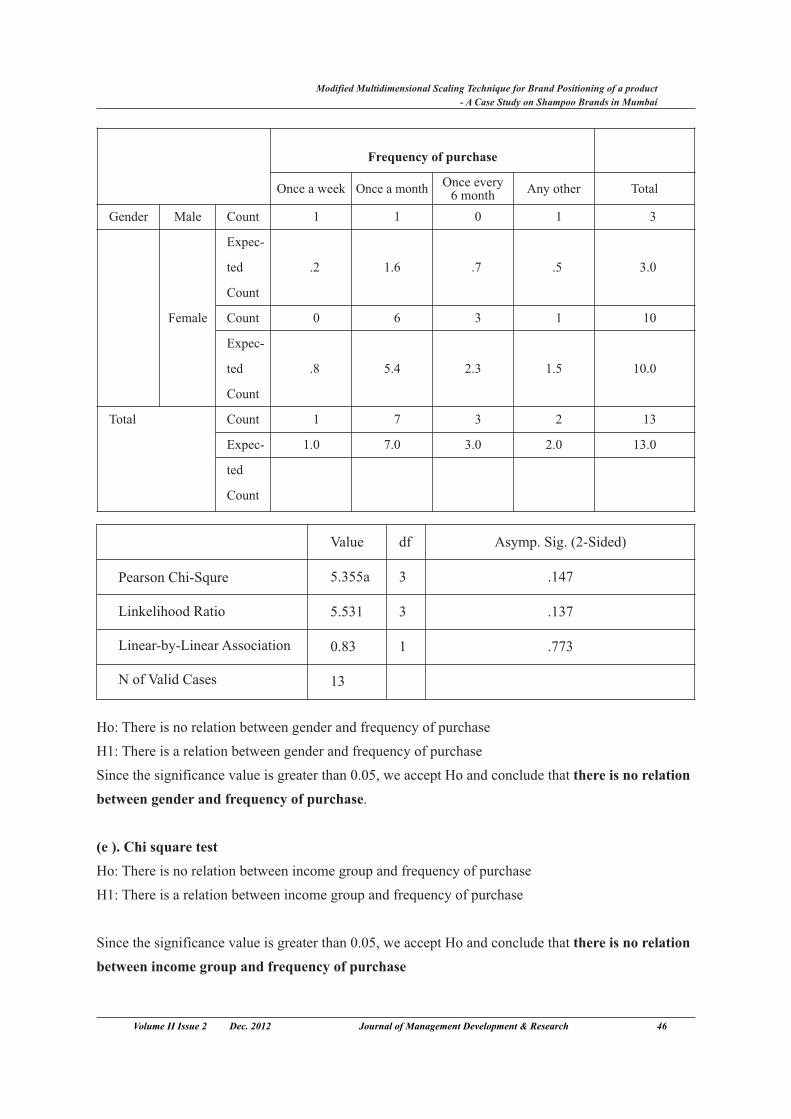
Volume II Issue 2 Dec. 2012 Journal of Management Development & Research 46
Modified Multidimensional Scaling Technique for Brand Positioning of a product
- A Case Study on Shampoo Brands in Mumbai
Ho: There is no relation between gender and frequency of purchase
H1: There is a relation between gender and frequency of purchase
Since the significance value is greater than 0.05, we accept Ho and conclude that there is no relation
between gender and frequency of purchase.
(e ). Chi square test
Ho: There is no relation between income group and frequency of purchase
H1: There is a relation between income group and frequency of purchase
Since the significance value is greater than 0.05, we accept Ho and conclude that there is no relation
between income group and frequency of purchase
Frequency of purchase
Once a week
Gender
Total
1
.2
0
.8
1
1.0
Total
Male
Female
Count
Expec-
ted
Count
Count
Expec-
ted
Count
Count
Expec-
ted
Count
Once a month Once every6 month
Any other
1
1.6
6
5.4
7
7.0
0
.7
3
2.3
3
3.0
1
.5
1
1.5
2
2.0
3
3.0
10
10.0
13
13.0
Pearson Chi-Squre
Linkelihood Ratio
Linear-by-Linear Association
N of Valid Cases
Value
5.355a
5.531
0.83
13
df
3
3
1
Asymp. Sig. (2-Sided)
.147
.137
.773
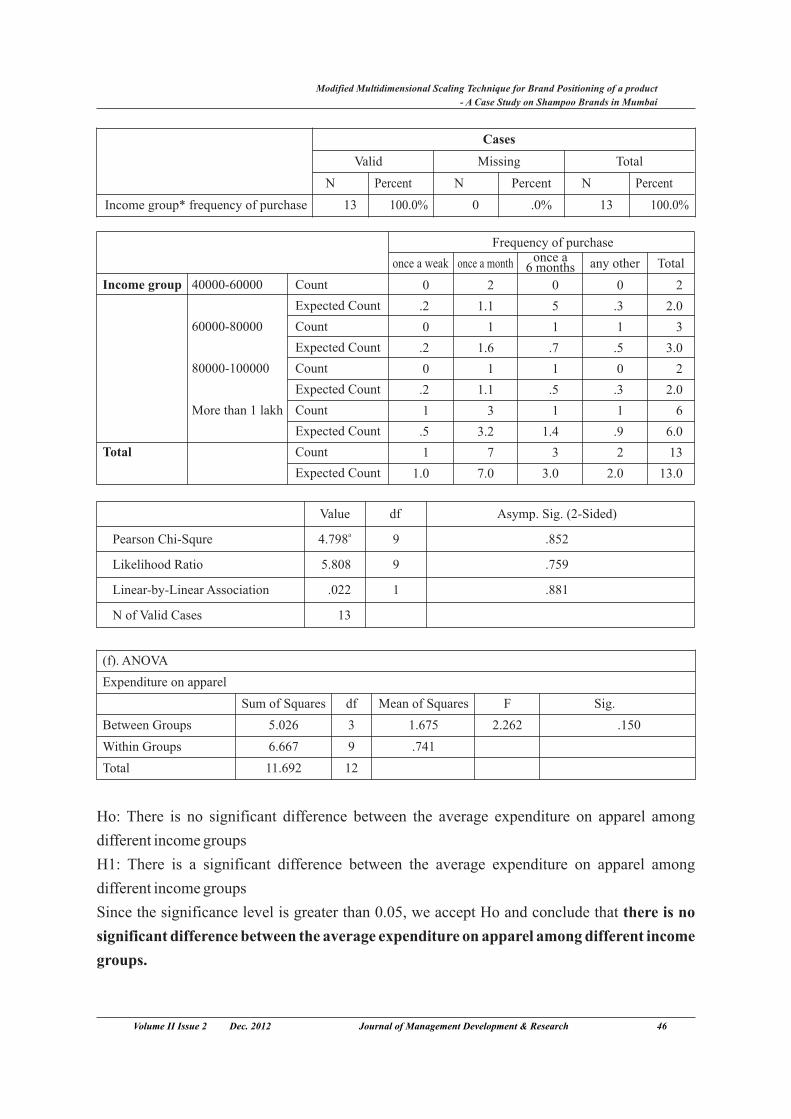
Volume II Issue 2 Dec. 2012 Journal of Management Development & Research 46
Modified Multidimensional Scaling Technique for Brand Positioning of a product
- A Case Study on Shampoo Brands in Mumbai
Ho: There is no significant difference between the average expenditure on apparel among
different income groups
H1: There is a significant difference between the average expenditure on apparel among
different income groups
Since the significance level is greater than 0.05, we accept Ho and conclude that there is no
significant difference between the average expenditure on apparel among different income
groups.
Income group* frequency of purchase
Cases
Valid
N
13
Missing Total
Percent
100.0%
N
0
Percent
.0%
N
13
Percent
100.0%
Frequency of purchase
once a weak
0
.2
0
.2
0
.2
1
.5
1
1.0
Income group
Total
40000-60000
60000-80000
80000-100000
More than 1 lakh
Count
Expected Count
Count
Expected Count
Count
Expected Count
Count
Expected Count
Count
Expected Count
Total
0
5
1
.7
1
.5
1
1.4
3
3.0
2
2.0
3
3.0
2
2.0
6
6.0
13
13.0
once a month once a6 months any other
2
1.1
1
1.6
1
1.1
3
3.2
7
7.0
0
.3
1
.5
0
.3
1
.9
2
2.0
Value
Pearson Chi-Squre
Likelihood Ratio
Linear-by-Linear Association
N of Valid Cases
df
a4.798
5.808
.022
13
9
9
1
Asymp. Sig. (2-Sided)
.852
.759
.881
(f). ANOVA
Expenditure on apparel
Between Groups
Within Groups
Total
Sum of Squares
5.026
6.667
11.692
df
3
9
12
Mean of Squares
1.675
.741
F
2.262
Sig.
.150
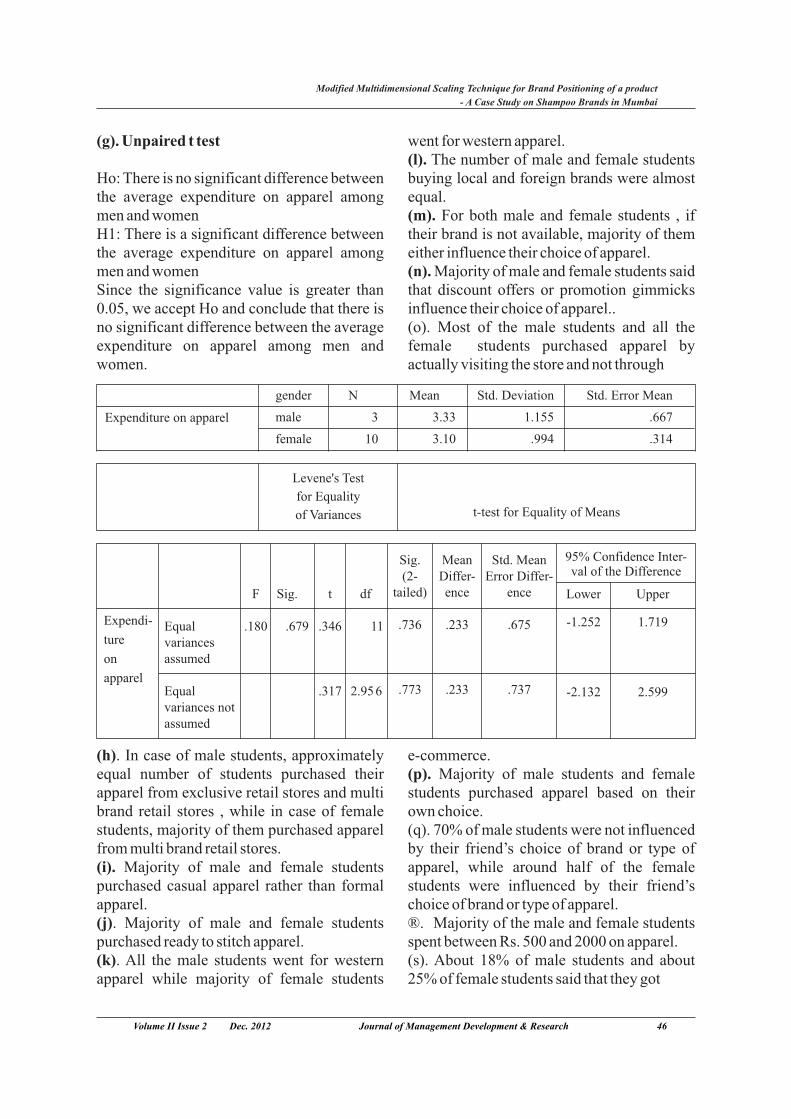
(g). Unpaired t test went for western apparel.(l). The number of male and female students
Ho: There is no significant difference between buying local and foreign brands were almost the average expenditure on apparel among equal.men and women (m). For both male and female students , if H1: There is a significant difference between their brand is not available, majority of them the average expenditure on apparel among either influence their choice of apparel.men and women (n). Majority of male and female students said Since the significance value is greater than that discount offers or promotion gimmicks 0.05, we accept Ho and conclude that there is influence their choice of apparel..no significant difference between the average (o). Most of the male students and all the expenditure on apparel among men and female students purchased apparel by women. actually visiting the store and not through
(h). In case of male students, approximately e-commerce.equal number of students purchased their (p). Majority of male students and female apparel from exclusive retail stores and multi students purchased apparel based on their brand retail stores , while in case of female own choice.students, majority of them purchased apparel (q). 70% of male students were not influenced from multi brand retail stores. by their friend’s choice of brand or type of (i). Majority of male and female students apparel, while around half of the female purchased casual apparel rather than formal students were influenced by their friend’s apparel. choice of brand or type of apparel.(j). Majority of male and female students ®. Majority of the male and female students purchased ready to stitch apparel. spent between Rs. 500 and 2000 on apparel.(k). All the male students went for western (s). About 18% of male students and about apparel while majority of female students 25% of female students said that they got
Volume II Issue 2 Dec. 2012 Journal of Management Development & Research 46
Modified Multidimensional Scaling Technique for Brand Positioning of a product
- A Case Study on Shampoo Brands in Mumbai
Expenditure on apparel
gender
male
female
N
3
10
Mean
3.33
3.10
Std. Deviation
1.155
.994
Std. Error Mean
.667
.314
Levene's Test
for Equality
of Variances t-test for Equality of Means
Expendi-
ture
on
apparel
Equalvariancesassumed
Equalvariances notassumed
F
.180
Sig.
.679
t
.346
.317
df
11
2.956
Sig.(2-
tailed)
.736
.773
MeanDiffer-ence
.233
.233
Std. MeanError Differ-
ence
.675
.737
95% Confidence Inter-val of the Difference
Lower
-1.252
-2.132
Upper
1.719
2.599
influenced by movies in their choice of The Indian Consumer”, Harvard apparel.
Business Review, 84 (10), pp.22-23 (t). In case of male students, about 50% of · Gupta A (2004), “Factors Affecting the them had their expenditure on apparel funded
by parents and 50% by their pocket money. In Trial of Private Labels in Departmental case of female students, 67% of them had thier
Store: Evidence from India”, The Icfai expenditure on apparel funded by parents and
Journal of Brand Management, Vol. 1, 33% by their pocket money.No. 3, pp. 6-21.
References · Hair, J.M., Anderson, R.E., Tatham, · Apparel Retail: Labeling the Indian R.L., Black, W.C., and Babin, B.J.,
Market (2006), available at: (2006), Multivariate Data Analysis, www.ibef.org. Sixth Edition, Pearson Prentice Hall,
· Archana Kumar, Yown Kyung Kim Copper Scordle Rver, NJ. and Lou Pelton (2007), “Indian · Harvey M (2003), Insights of the consume`s purchase behaviour Fashion Business, pp. 1-16 and 22-29, towards US versus local brands”, Prentice Hall.International Journal of Retail and · Images year book on Fashion Business, distribution Management, 37(6), Apparel, Retailing, and Garments pp.510-526. ( 2 0 0 6 ) , a v a i l a b l e a t :
· Berman B and Evans J (2002), Retail www.imagefashion.com/ year-book-Management: A Strategic Approach, III. htmlPearson education, Asia, Singapore · Japanese female university students',
· Biswas, R., (2006), “India`s Journal of Consumer Studies & Home changing consumer”, Chain Store Economics. Dec1999, Vol. 23, Issue 4, Age, 82(5), p.A2. p213-223. 11p.
· Jaya Halepete and K.V.Sesadri Iyyer · Brands in Apparel Retail', Vilakshan:
(2008), “Multidimensional The XIMB Journal of Management,
investigation of apparel retailing in Sep2011, Vol. 8 Issue 2, p43- 56. 14p
India”, International Level of Retail · Cathy; Richards, Lynne, 'The fashion and Distribution Management, 36(9), conscious behaviours of mature pp.676-688female consumers', International
· Jinhee Nam; Hamlin, Reagan; Hae · Clark, R.A., and Goldsmith, R.E., Jin Gam; Ji Hye Kang; Jiyoung Kim; (2005), “Spreading their Sales”, Pimpawan Kumphai; Starr, Journal Business India Intelligence, 12(6), of Consumer Studies. Jan2007, Vol. pp. 1-2. 31 Issue 1, p102-108. 7p.· Gopal, A and Srinivasan, R (2006),”
Volume II Issue 2 Dec. 2012 Journal of Management Development & Research 46
Modified Multidimensional Scaling Technique for Brand Positioning of a product
- A Case Study on Shampoo Brands in Mumbai
· Memon S S(2006), “Garment
Lifestyle Retailing Stores: Vis á Vis
Impact of Private Labels: A Paradigm
Shift”, The Icfai Journal of Marketing
Management, Vol. 5, No. 3, pp. 54-69
· Radha Krishna G and Shylajan C S
(2007), “Determinants of Habitual
Buying Behavior: A Study on Branded
Apparel”, The Icfai Journal of
Marketing Management, Vol. VI, No.
3, pp. 6-21.
· Rusch R (2003), “Private Lebels:
Does Branding Matter?” in Suresh K
(Ed.), Retailing: Concepts and Cases,
The I c fa i Un ive r s i ty P re s s ,
Hyderabad.
· Smith P R and Taylor J (2005),
Marketing Communications: An
Integrated Approach, Kogan Page
India, London
Volume II Issue 2 Dec. 2012 Journal of Management Development & Research 46
Modified Multidimensional Scaling Technique for Brand Positioning of a product
- A Case Study on Shampoo Brands in Mumbai
A Study of Influence of Human Resource Practices
on the Retention of Employees in Advertising Industry
Prof. Shiji Lyndon
Assistant Professor, Aruna Manharlal Shah Institute of Management and Research
Ghatkopar (W), Mumbai
Job Satisfaction, Human Resource Practices, Retention, Attrition
Abstract
Key words:
Volume II Issue 2 Dec. 2012 Journal of Management Development & Research 1
Shopping companion and the subsequent impact on Impulse Buying
Organizations, in general, invest a lot on both physical and human resources in order to ensure increased revenues. Investment in human resources occurs in the area of induction, training, maintaining and retaining them in the organization. One of the prime objectives for these investments is to ensure increased commitment, improved job and organizational performance, job satisfaction and increased retention of its employees. But, almost all the elements which ensure success of an organization are in turn, affected by the unique culture of the organization in which it exists and operates. In this competitive era, when every organization is attempting to benchmark themselves against the best performers in the industry, duplication of technology, business processes, systems may be possible to some extent. But duplication of organizational culture is a daunting task because the fundamental elements which constitutes the organizational culture is invisible, hidden and is cognitive in nature (Schein 1985). The culture of an organization to a great extent is determined by the leadership and the general human resource practices of an organization.Similarly, employee satisfaction has been an important issue for organizations. Employees are viewed as the greatest strength of an organization. An organization's success depends on the employees and thus they should not be deprived of what they deserve in return for their commitment to the organization. However, very few organizations have made employee satisfaction a top priority, perhaps because they fail to understand the significant opportunity that lies in front of them.The objective of this paper is to investigate the influence of Human Resource (HR) practices on employee retention in advertising industry. The study identifies the important elements of HR practices, which strongly influence the decision of employees to stay with the organization.The research method used for the present study is survey research. The population of the present study is employees of advertising industry. Convenience sampling method is used. The sample consists of 105 employees of 8 advertising agencies, based in Mumbai.
The study identified the key Human Resource factors which lead to employee retention. The findings revealed positive relationship between HR factors, organizational commitment and employee retention. The study also recommends measures for improving employee satisfaction levels to enable them to perform better.
Introduction employees (Boxall & Macky, 2009). In order to retain key talent, it is crucial to
India is home to one of the largest media understand the phenomenon of turnover. consuming and content creating industries. In Employee turnover is defined as the rotation the last few years, the entertainment and of employees in the labour market, between media (E&M) industry in India has earned a the status of employment and unemployment place among the fastest growing sectors in the (Abassi and Hollman, 2000). These reasons country. But despite the impressive profile of can be through the interaction of personal and the Indian E&M industry, it constitutes only organizational factors (Westbrook, Ellis, & around 1% of the global E&M industry Ellet, 2006). At the personal level, employees (Indian Entertainment and Media Outlook may leave because of family reasons, to 2009). pursue further education or an unsolicited job One of the key factors responsible for this is offer. These factors are beyond the control of the restricted growth shown by the Indian management. The reasons which are advertising industry – considered to be a core influenced by the organizational environment component of the Indian entertainment and includes lack of job satisfaction, no work-life media industry. There are many reasons as to balance, lack of congruity between individual why advertising in India is not surging ahead values and organizational values, better career the way it should. Prime among them is the prospects elsewhere (Davies 2001, Oh 1996). inability of the agency to retain talent. Turnover, thus, is a symptom of a larger Attrition rates are sky rocketing which is as p rob lem i . e . ine ffec t ive re ten t ion high as 30% which is catastrophic in a people management. Whether the turnover is because oriented business. In the present scenario, not of personal reasons or reasons influenced by only do agencies have to compete with other organization, it imposes costs on the agencies, but also with a host of sunrise organization (Mitchell, Holtom & Lee 2001). industries; advertising agencies have become Turnover leads to a huge departure of human the poaching ground for the emerging knowledge and experience from the industries (Business Today 2007). It is in this organization. It also leads to replacement cost. context, the present study was carried out to Replacement cost consists of search for the find out if there is any association between the prospective candidates in the labour market, Human Resource practices followed and the choosing the best among competing retention of employees, specifically in substitutes, formal and informal training of advertising industry. the new candidate (John 2000). Apart from
these, high attrition might lead to customer Review of Literature dissatisfaction (Meaghan & Nick, 2002). Retention management is defined as a Therefore, if turnover not managed properly it strategic, coherent process which begins with would affect the organization adversely in an investigation of the objective with which terms of personnel costs and also the people join an organization (Davies 2001, profitability of the organization (Hogan, Fitz-enz 1990). The capacity to attract and 1992; Wasmuth & Davis, 1993). Therefore, retain quality employees is important in companies must find out what makes people ensuring organizational competitiveness to engage themselves in being loyal and (Ulrich, 1993; Delery & Shaw, 2001). productive. Mitchell, Holtom, Lee, Sablynski Therefore, organizations should provide such & Erez, (2001) suggested job embeddedness practices which would build a workplace as a recent approaches of predicting employee environment which is able to retain turnover.
Volume II Issue 2 Dec. 2012 Journal of Management Development & Research 46
Modified Multidimensional Scaling Technique for Brand Positioning of a product
- A Case Study on Shampoo Brands in Mumbai
This approach attempts to identify those factors on the employee's decision to stay in factors within and outside the organizational an advertising agency. It tries to identify the space which stops people from leaving their human resource practices which are preferred present job. It suggests that off-the-job by the employees.elements are equally responsible for turnover as the events within the organization. The Research Methodologyresearch also suggests that employees remain The Sample in an organization for reasons other than job The sample in this study consisted of satisfaction. Thus, the approach of job employees of 8 advertising agencies, based in embeddedness studies the problem of Mumbai and Bangalore. The average age of attrition, by focusing on “why do employees the respondent was 30 years and their average decide to stay?” rather than “how do they experience was 5 years. Convenience leave?” sampling method was used.The approach of job embeddedness has led many organizations to pursue to become the Data Collection Process“employer of choice” by creating a healthy Questionnaire was used for the survey. The work environment. An “employer of choice” survey identified nine factors that influence is defined as an organization which the employee's decision to stay in an outperforms its competitors in the attracting, organization. A fifty three item structured developing and retaining employees with questionnaire was used for collection of data. business aptitude, often through innovative Five questions were used to obtain and compelling human resource programs demographic information from the (Clarke 2001, Dessler 1999). The respondent such as gender, age, experience organizational effectiveness enhances with etc. The remaining questions were designed to the employee commitment. Organizational cover the following nine variables:commitment is the degree of identification and participation in an organization. It is the — Remuneration and Recognition (4 items)mental contract that connects the employee to
— Training and Career Development (4 items)the organization. Employee friendly human resource practices increases organizational
— Challenging Employment Assignments and commitment. Research suggests that there is a — Opportunities (4 items)high correlation between high commitment
HR systems and employee retention (Arthur — Organizational Leadership (3 items)
1994). Researchers have identified various HR practices such as scientific selection, — Team Leadership (4 items)staffing, competitive and equitable
— Organizational Policies (4 items)compensation developmental appraisal and development activities to have positive
— Communication (5 items)relation with employee retention.
— Working Environment (6 items)Objectives of the Study
— Organizational Fit ( 2 items)The main objective of the study was to investigate the relationship between Human — Organizational Commitment (8 items)Resource practices and retention of employees in advertising industry. The study — Turnover Intention (4 items)examines the influence of human resource
Volume II Issue 2 Dec. 2012 Journal of Management Development & Research 46
Modified Multidimensional Scaling Technique for Brand Positioning of a product
- A Case Study on Shampoo Brands in Mumbai
Response to all the 52 statements in the organizational results which also questionnaire was obtained on the following lowers the intention to leave and thus five point scale: strongly disagree (1) increases organizational citizenship Strongly disagree (2) Disagree (3) Neither behavior. agree nor disagree (4) Agree (5) Strongly · Teamwork – Employees stay in an agree. By adding responses to the statements organization when they have strong pertaining to each of the sub factors, the score relationship with their colleagues of each respondent for each variable was (Clarke 2001). Team activities, obtained. The aggregate score ranged for assignments involving team work and variables ranged from 2 to 45, depending opportunities for social interaction upon number of items under each variable. improve relationships (Johns et al. Before using these aggregate scores for 2001).further analysis i.e. correlation and · Organisational culture and policies regression, their reliability was tested by – Organizational culture is described calculating Cronbach Alpha. as the invisible force that influences
life in an organization (Schein 1984).Measures · Communicat ion – Effec t ive Independent Variables communication strengthens employee
· Remuneration and recognition – relationship with the company and Employees tend to stay with the develops trust (Clarke 2001, Levine organization when they feel their 1995).capab i l i t i e s and e ffo r t s a r e · Work environment – Individuals appreciated (Davies 2001). will remain with a organization that
· Training and Career Development – cares for the career priorities of Training facilitates in horning specific employee, facilitates work life skills help to improve in the areas of balance (Gonyea and Googins 1992, deficiencies. While development Kamerman and Kahn 1987). attempts to provide employees with · Organizational Fit – Person skills and abilities which the
organization fit is considered a key organization will need in future part of organizational selection and is (Gomez-Mejia, Balkin and Cardy
1995; Wilk and Cappelli 2003). defined as “the compatibility between · Chal l eng ing as s ignments –
individuals and organizations” Challenging assignments with
(Kristof 1996).definite performance measures and feedback is crucial for a performance environment where employees can Dependant Variablesachieve their personal objectives · Organizational Commitment – (Boyer 1994). Angle and Perry (1981) has
· Leadership – Research suggests that classified commitment into two leadership pos i t ive ly affec ts components: affective commitment organizational commitment (Bykio, and calculative commitment. Hacket and Allen 1995). Research of Affective commitment is the extent Yammariona and Bass (1990) to which the employee is attached to suggests that there exists a positive his/her organization. impact of transformational leaders on
Volume II Issue 2 Dec. 2012 Journal of Management Development & Research 46
Modified Multidimensional Scaling Technique for Brand Positioning of a product
- A Case Study on Shampoo Brands in Mumbai
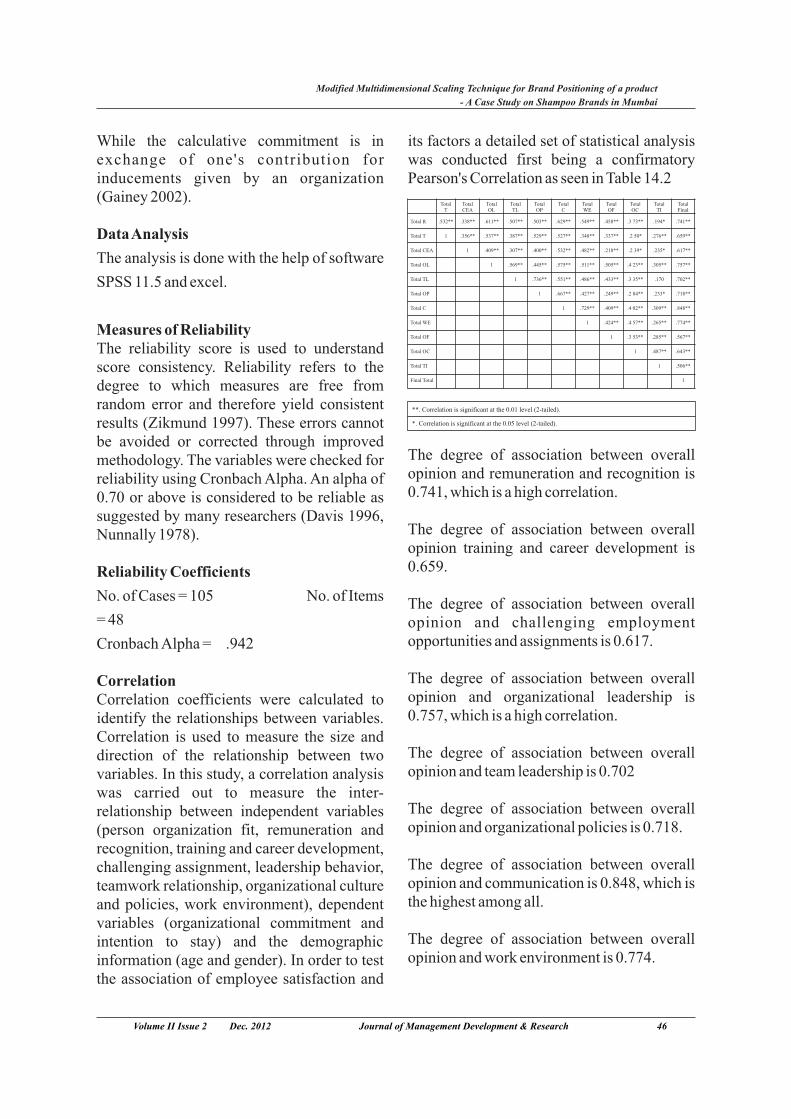
While the calculative commitment is in its factors a detailed set of statistical analysis exchange of one's contribution for was conducted first being a confirmatory inducements given by an organization Pearson's Correlation as seen in Table 14.2(Gainey 2002).
Data Analysis
The analysis is done with the help of software
SPSS 11.5 and excel.
Measures of ReliabilityThe reliability score is used to understand score consistency. Reliability refers to the degree to which measures are free from random error and therefore yield consistent results (Zikmund 1997). These errors cannot be avoided or corrected through improved
The degree of association between overall methodology. The variables were checked for opinion and remuneration and recognition is reliability using Cronbach Alpha. An alpha of 0.741, which is a high correlation.0.70 or above is considered to be reliable as
suggested by many researchers (Davis 1996, The degree of association between overall Nunnally 1978). opinion training and career development is 0.659.Reliability Coefficients
No. of Cases = 105 No. of Items The degree of association between overall
= 48 opinion and challenging employment opportunities and assignments is 0.617.Cronbach Alpha = .942
The degree of association between overall Correlationopinion and organizational leadership is Correlation coefficients were calculated to 0.757, which is a high correlation.identify the relationships between variables.
Correlation is used to measure the size and The degree of association between overall direction of the relationship between two opinion and team leadership is 0.702variables. In this study, a correlation analysis
was carried out to measure the inter-The degree of association between overall relationship between independent variables opinion and organizational policies is 0.718.(person organization fit, remuneration and
recognition, training and career development, The degree of association between overall challenging assignment, leadership behavior, opinion and communication is 0.848, which is teamwork relationship, organizational culture the highest among all.and policies, work environment), dependent
variables (organizational commitment and The degree of association between overall intention to stay) and the demographic opinion and work environment is 0.774.information (age and gender). In order to test
the association of employee satisfaction and
Volume II Issue 2 Dec. 2012 Journal of Management Development & Research 46
Modified Multidimensional Scaling Technique for Brand Positioning of a product
- A Case Study on Shampoo Brands in Mumbai
TotalT
Total R
Total T
Total CEA
Total OL
Total TL
Total OP
Total C
Total WE
Total OF
Total OC
Total TI
Final Total
.532**
1
TotalCEA
.338**
.356**
1
TotalOL
.611**
.537**
.409**
1
TotalTL
.507**
.387**
.307**
.569**
1
TotalOP
.503**
.529**
.400**
.445**
.736**
1
TotalC
.629**
.527**
.532**
.575**
.551**
.667**
1
TotalWE
.549**
.348**
.482**
.511**
.486**
.427**
.729**
1
TotalOF
.458**
.337**
.218**
.505**
.433**
.249**
.409**
.424**
1
TotalOC
.3 73**
.2 50*
.2 39*
.4 23**
.3 35**
.2 84**
.4 02**
.4 57**
.3 53**
1
TotalTI
.194*
.276**
.235*
.305**
.170
.233*
.309**
.265**
.285**
.487**
1
TotalFinal
.741**
.659**
.617**
.757**
.702**
.718**
.848**
.774**
.567**
.643**
.506**
1
**. Correlation is significant at the 0.01 level (2-tailed).
*. Correlation is significant at the 0.05 level (2-tailed).
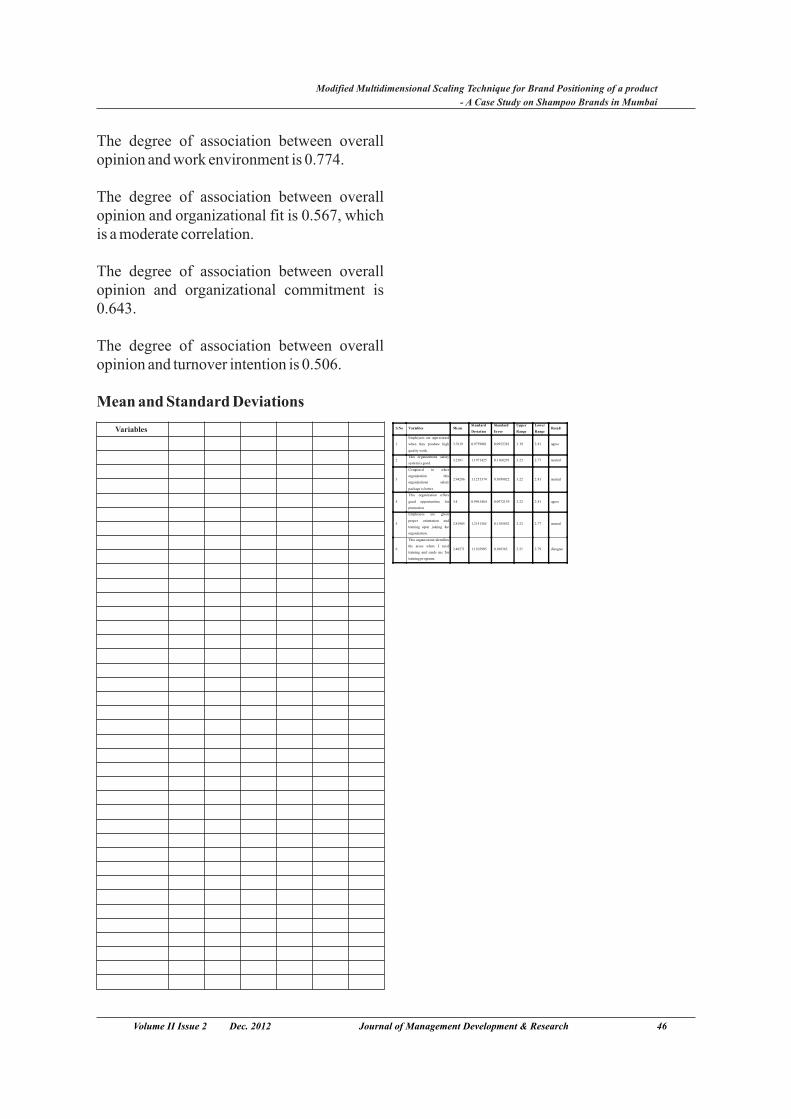
The degree of association between overall opinion and work environment is 0.774.
The degree of association between overall opinion and organizational fit is 0.567, which is a moderate correlation.
The degree of association between overall opinion and organizational commitment is 0.643.
The degree of association between overall opinion and turnover intention is 0.506.
Mean and Standard Deviations
Volume II Issue 2 Dec. 2012 Journal of Management Development & Research 46
Modified Multidimensional Scaling Technique for Brand Positioning of a product
- A Case Study on Shampoo Brands in Mumbai
Variables S.No Variables Mean Standard
Deviation
Standard
Error
Upper
Range
Lower
Range Result
1
Employees are appreciated
when they produce high
quality work.
3.7619 0.9759001 0.0952381 3.19 2.81 agree
2 This organizations salary
system is good. 3.2381 1.1971425 0.1168291 3.23 2.77 neutral
3
Compared to other
organization this
organizations salary
package is better.
2.94286 1.1251374 0.1098022 3.22 2.81 neutral
4
This organization offers
good opportunities for
promotion.
3.4 0.9961464 0.0972139 3.22 2.81 agree
5
Employees are given
proper orientation and
training upon joining the
organization.
2.81905 1.2151365 0.1185852 3.23 2.77 neutral
6
This organization identifies
the areas where I need
training and sends me for
training programs.
2.48571 1.1103905 0.108363 3.21 2.79 disagree
Enlightening the Consequences of Work Life Imbalance on Personal and
Organizational Performance Excellence
Prof. Saritha Madipelli
Assistant Professor
Department of Business Management
University Arts & Science College
Warangal, Andhra Pradesh
Ms. Reshma Anwar
Management Student, University College of Commerce & Business Management
Kakatiya University
Warangal
Mr. Srinivas Addiga
Research Scholar
University College of Commerce & Business Management
Kakatiya University
Ms. Khyathipriya Thalla
Management Student
University College of Commerce & Business Management
Kakatiya University
---------------------------------------------------------------------------------------------------------------
Abstract
Work life balance boosts up positive energy in many people. People with balanced work and family
life are great assets for corporate houses and family members. In spite of many software
applications and advanced technology organizations without competent workforce are difficult to
survive in the market. Personnel are the backbone of organizations. Human resources are greatly
privileged in the organization’s atmosphere, because they offer many invaluable services and strive
for organizational performance excellence. Work life imbalance is a fluster issue for many
organizations and families. Working conditions, work intensification, high performance targets and
extra working hours due to staff shortages makes many employees impotent to do the work. The
decisions, strategies, progress and excellence of an entity largely depends on employees working
over there. The monetary and non-monetary benefits, training and development, promotional
opportunities, organizing social gatherings and promoting social activities play a prominent role to
achieve performance excellence. This paper brings out a model of work life imbalance and its effect
on personal and organizational performance excellence. The model enlightens personal and
organizational consequences of work life imbalance. The researcher also proposed some remedial
measures and outcomes of balanced work and family life.
-----------------------------------------------------------------------------------------------------------------------
Keywords: High performance targets, Lucrative job assignments, Performance Excellence,
Organizing social gatherings, Promoting social activities, Moral influence and spiritual support.
Introduction
In the present scenario, work life imbalance has become a burning issue for most of the employees
and employers. There are many individual and organizational reasons for work life imbalance. The
main causes for the imbalance are long working hours, work intensification, pressurized work
environment, technology, globalization, competition, downsizing, poor industrial relations, multiple
responsibilities, nuclear families, dual earning couples, poor family relations etc. Work life
imbalance creates many loses to employees and for organizations. Employees with high degree of
work life imbalance experiences distortions in family relationships, lack of career advancement and
physical and psychological illness.
Contemporary demographic changes such as increasing number of women in the workforce, dual
career and nuclear families have generated an urgent need of employees to balance their work and
non-work life (Rupashree Baral and S.Bhargava). In response to the demographic shifts, market
changes, talent attrition and changing needs and demands of employees, organizations are applying
employee-friendly strategies for attaining superior performance. Today, organizations are forced to
look beyond mundane human resources (HR) interventions and execute initiatives such as flexible
working hours, alternative work arrangements, leave policies in lieu of family care responsibilities
and employee assistance programs. These initiatives are referred to as ‘family friendly policies’ or
‘work-life balance practices’ (WLBPs) in literature (Grover and Crooker, 1995; Kopelman, Prottas,
Thompson and Jahn, 2006).
Work life imbalance leads to many individual and organizational consequences. Organizations
where employees working with work life imbalance faces decreased productivity, poor industrial
relations, increased turnover, absenteeism and poor organizational development. Work life
imbalance degrades employees belief system and humiliates there confidence levels. Employees
with low morale, less commitment and dedication towards work, hesitation to accept challenging
assignments, increased domestic responsibilities, more attention towards child care and dependent
care, inadequate financial assistance, emotional imbalance are the main causes for work life
imbalance. It is the responsibility of both employees and employer to strive for achieving balanced
work and family life. The problem of work life balance is clearly linked with withdrawal behavior,
including turnover and non-genuine sick absence (Hughes, J. & Bozionelos, N. (2007).
A healthy balance between work and non-work roles fortifies many employees to concentrate more
happily on personal and organizational welfare. Work life balance can be achieved when employees
have crystal clear ideas of investing their time, energy and capital in 5 F’s (Family, Finance,
Fitness, Faith and Friends).
Literature Review
Work life balance is a broad concept including proper prioritizing between career and ambition on
one hand, compared with pleasure, leisure, family and spiritual development on the other. Work life
balance is a key factor which determines employee satisfaction, loyalty and productivity. As the
separation between work and home life has diminished, this concept has become more relevant than
ever where (N. Sekar, 2009). Work is central to our lives. It provides us with a sense of
achievement, recognition and above all a means of income to fulfil our basic and material needs.
Globalization and rapid technological changes demand more of workers (Harish C Jain, 2009).
Long working hours and the intensity of work have consistently emerged as two top most concerns
of workers. In a national study on work life conflict in Canada, in 2001, one in four Canadians
reported that their work responsibilities interfered with their ability to fulfil their responsibilities at
home (Duxbury & Higgins, 2003). Countries such as UK, Ireland, Denmark, Sweden, US and
Canada, to name a few have taken initiatives at providing work / life balance programs for its
working citizens (Harish C Jain, 2009). There are significant changes taking place in the economic,
demographic as well as social and employment relationships. A recent poll by the members of
Society for Human Resource Management indicated that professionals viewed flexible work place
schedules acts as a key to employee retention and placed this working condition in the top three
ways for achieving employee retention (Burke & Collision, 2004).
The work-family conflicts have been conceptualized as an individual’s orientation across different
life roles, an inter role phenomenon (Marks & MacDermid, 1996), ‘satisfaction and good
functioning at work and at home with a minimum of role conflict’(Campbell-Clark, 2000), and ‘a
satisfying, healthy and productive life that includes work, play and love, that integrates a range of
life activities with attention to self and to personal and spiritual development, and that expresses a
person’s unique wishes, interests, and values’(Kofodimos, 1984, p.xiii; Shaffer, Francesco, Joplin
& Lau, 2003).
The increase in women’s labour market participation has contributed to “dual earner family’s
phenomena” (Hunsley, 2006). Those who are young and single tend to have less work life conflict
issues compared with those who have childcare and elderly care responsibilities. Those who work
in the state sector will face less work life conflict issues, than those who work in the private sector,
as competition and performance pressure is relatively lower inn the state sector than in the private
sector. Similarly, the level of position held and income both have positive relation with the level of
work life conflict in different ways (Chen, 2006). While those in higher organizational positions
tend to feel greater pressure of work which affects their family life negatively, those who are on
lower income are less able to commercialize their housework and family care responsibility and
experience more work life struggles. (Harish C Jain, 2009).
Working women are more likely to be affected by work life conflicts than men since the majority of
women spend more time than men on housework, childcare and elderly care. In the middle phase of
the career, family structure is changing and responsibilities from both family and work domain are
increasing (Harish C Jain, 2009).
Work related stress consists of working conditions involving heavy work loads; lack of
participation in decision making; health and safety hazards; job insecurity; and tight deadlines.
Employees (with high levels of work life conflict) are three times more likely to suffer from heart
problems, infections, injuries, mental health problems, and back pain, and five times more likely to
suffer from certain cancers (Social Development Canada, 2004). Another study indicates that such
workers are also more likely to experience poor health; experience negative impacts on
relationships with children and their spouse; less committed to the organization; less satisfied with
their job; more likely to intend to leave their job; and have poor quality of relationships outside
work (Duxbury et al., 2002).
Employment pressures in the domain and care for the children, elderly and other dependents in the
family domains are often highly demanding and invariably incompatible with each other (S.S. Rao,
Aiswarya Ramasundaram, 2011). Study conducted by Allen (2000) states that the conflict results in
dissatisfaction, depression and bad physical health.
The socialization at work, great work environments, flexi time and facilities makes many
employees to spend more time at office and enjoy the time (Sandeep K.Krishnan, 2011). Grzywacz
Butter, (2005) tested some propositions, relating to work family facilitation finding that resource –
rich jobs enable work to family facilitation. The relationship between domain satisfaction (e.g. job,
family, marriage) and life satisfaction have given a very great scope (Beutell, 2006).
Organizations offer a wide range of work-family benefits and programmes to their employees, such
as job sharing, telecommuting, job protected parental leave, part-time return to work options, flexi
time, resource and referral services, unpaid family leave, improvement in job conditions, on-site
childcare, support groups for facilities and canteen facilities (Lobel & Kossek, 1996; Rajadhyaksha
& Smita, 2004). Research shows that flexible work arrangements allow individuals to integrate
work and family responsibilities in time and space and are instrumental in achieving a healthy work
and family balance (Bond, Galinsky, Lord, Staines, Brown, 1998; Galinsky, Bond & Friedman,
1993).
Work life balance seems to have dual benefits for both the organizations and its employees.
Employers benefit by decreased absenteeism, increased retention, increased job satisfaction and
employee commitment; while employees benefit with decreased stress related illness, decreased
health care costs, lower role stressors and less interference of work in family life. Work place health
initiatives can contribute to improved health, fitness, work life balance, better morale and lower
levels of stress and fewer injuries (Harish C Jain, 2009).
A careful scrutiny of the literature on the work life imbalance clearly shows that most of the
organizations and families are facing this problem. By analyzing the literature, the researcher felt
that there is a need to identify the consequences of the work life imbalance which helps to improve
personal and organizational performance. The personal and organizational consequences of work
life imbalance are: hampers family relations, poor career development and psychological illness;
decline in productivity, poor industrial relations and increased turnover respectively. The remedial
measures suggested by the researcher for personal and organizational performance excellence are
offering relationship counselling, training requirement and stress management counselling; adopting
change management training programs, organizing informal associations and creating virtual offices
respectively.
Objectives of the study
The present research article aims at understanding the consequences of work life imbalance. It also
attempts to understand the strategies required to make a positive personal and organizational
performance excellence.
Research Methodology
The methodology used in this paper is purely theoretical and based on certain assumptions of the
scholar and the experiences gained in the survey. The researcher has developed a model depicting
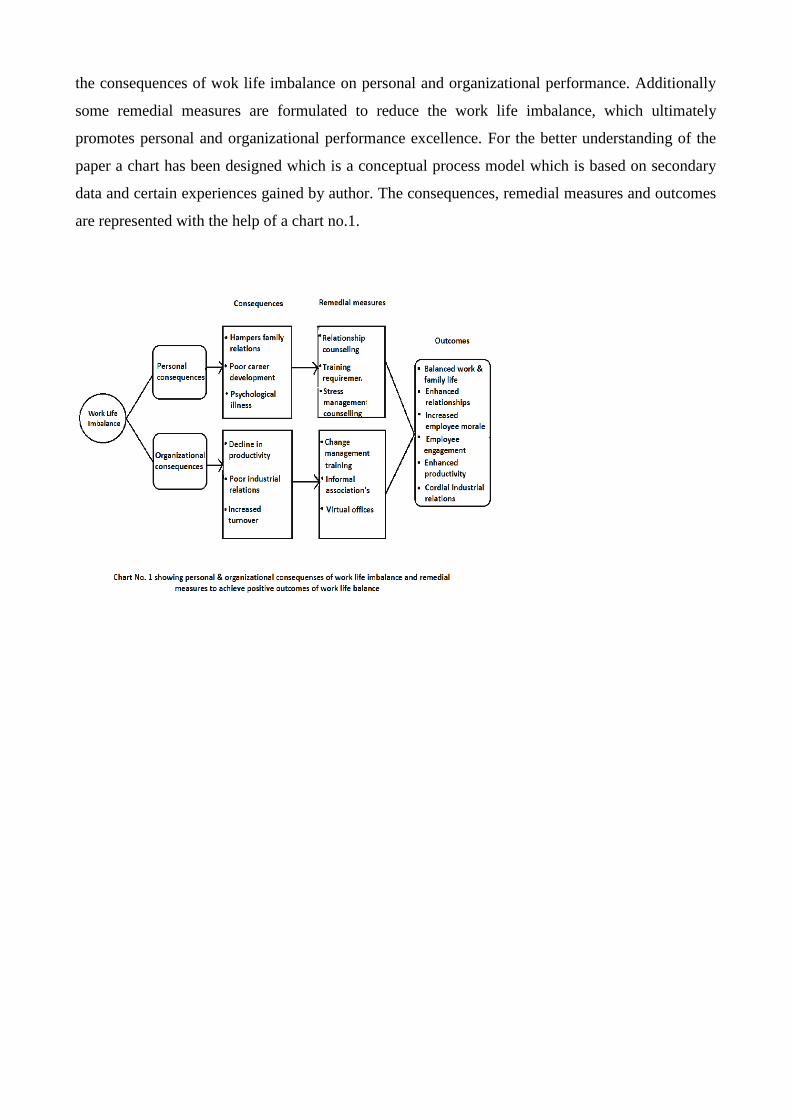
the consequences of wok life imbalance on personal and organizational performance. Additionally
some remedial measures are formulated to reduce the work life imbalance, which ultimately
promotes personal and organizational performance excellence. For the better understanding of the
paper a chart has been designed which is a conceptual process model which is based on secondary
data and certain experiences gained by author. The consequences, remedial measures and outcomes
are represented with the help of a chart no.1.
Personal consequences: Work life imbalance shows a great impact on the personal life of the
employees. Hence the resulted consequences are employees hamper their relationships with family
members, poor career development can be seen in the employees and also they suffer from
psychological stress and illness.
Hampers family relations:
The relationship with parents, siblings, children, dependents, relatives and friends are very
important for employees, which allows them to concentrate on office issues. ‘Man is a social
animal’ argues Amitai Etizioni. The primary society for any individual is family. One becomes a
member of a corporate organization after have established as member in the family. So his
relationship in the family influences his contribution to the corporate. In a research study (Baral,
2009) on 730 managerial employees from various organizations in India, it is clearly found that
family significantly contributes to work in terms of enhancing performance and positive emotions at
the work place (Rupashree Baral and S.Bhargava, 2009). The love, affection, guidance, physical
and moral support from family members makes an employee motivated and balanced. Employees
who doesn’t give due preference to family members experiences poor family relations and
frequently conflicts with family members. The employees with poor family relations may not
concentrate on work and decreases organizational productivity. The interaction with family
members makes many employees share their work stress, feelings, emotions, happiness, sorrows,
success or failures and progress thereby reducing their psychological burdens. But due to
pressurized job demands most of the labour force spends maximum time at work place and least
time at home with family members. “Changes in the markets, ways of working, and labour market
conditions have put tremendous pressure on all organizations to stay competitive and consequently
organizations have put increasing pressure on their employees to deliver the best” (Rupashree Baral
and S.Bhargava, 2009). Due to dual earners and nuclear families the family structure is changing
from last few decades. As the relationships are hampered employees feel difficult to perform their
activities at home and loose physical and moral support from family members and gets conflicts
with them, due to which employees becomes lonely and feels imbalance at home. Even it is not an
exaggeration to say that some of the male employees addict to some bad habits like smoking and
alcohol consumption due to work life imbalance. Relationship with parents, siblings, spouse,
children, in-laws and dependents are very crucial to an employee. But due to imbalance at work
place and home employees fails to balance their relationships, which in turn affects their
performance at work place.
Poor career development:
One who doesn’t have balance in his life and work feels impossible to achieve career advancement.
Everybody either male or female have higher career aspirations in their respective fields / sectors.
For reaching their goals and objectives people have to invest their time, energy and capital at an
extreme level. People should work hard with dedication, determination, commitment, honesty and
give whole hearted performance. They have to make their emotions subordinate to their
commitments. But as they are suffering from imbalance from work and non-work roles they may
not concentrate on their career goals. Most of the employees particularly women leave their career
or take a break in career due to imbalance of work and home. The thrust for getting perfection of
one role may affect the other role. The imbalance is not only a problem for employees but also it
affects organizations because they loses competent work force. Managerial and supervisory support
is one of the major components of organizational culture that facilitates integration of employee
work life balance (Rupashree Baral and S.Bhargava, 2009). Unsupportive organizational culture is
the major impediment for the effectiveness of work life balance problems (WLBPs) (Thompson,
Beauvias and Lyness, 1999). The technology, software and machinery changes from day to day. As
some of the people resist change they ignore to learn the updated things. Even though they have
high need for their career advancement, due to intensified working conditions at work place and
increased responsibilities at home, people fail to focus on their goals. No doubt that employees
spend their maximum time in organizations but all the time they hangover with the thoughts of
home and family members. It means that physically they are in the work area but mentally they are
struggling with the worries of home responsibilities. These worries remain no time for the
employees to work out on their career goals. Always an employer tries to squeeze the skills of an
employee to get superior performance. Performing multiple tasks make employees feel difficult to
concentrate on training and learning needs. As they resist learning they cannot have career
development. Hence work life imbalance leads to poor career development which in turn affects the
performance excellence of organizations.
Psychological illness:
A person should be fit physically and mentally to be perfect. Physical and mental fitness makes a
person to think logical, intellectual, goal oriented and focused. Studies indicate that due to work life
imbalance most of the people face psychological problems. The increased industrial competition,
advanced technology and changing customer tastes and preferences makes many entities to pressure
their employees to give maximum productivity which enhance work life imbalance. Due to
imbalance people become inferior, loose hope and confidence on them selves and fail to think about
their personal goals. All the issues related to work and family life makes many employees
physically and mentally stressed. They face incompatibility in balancing all their personal, family
and organizational goals and values. Concentrating on all these issues the employees become
irritated, frustrated and bored. Frustration and stress leads to psychological illness, which show a
drastic impact on organizations performance. The intolerance nature of employees to balance their
work and non-work roles make them difficult to cope up with their responsibilities and feel
psychologically stressed. They dump all the worries of home and office and feel stressful. Research
says that if you hangover with worries all the time, brain becomes fog. Excess stress equals distress
and leads to many other problems like low fertility, thyroid, blood pressure, cardio vascular
problems etc. Hence there is immense need to organize and implement stress management
counselling programs for achieving work life balance.
Organizational consequences: Work life imbalance shows a severe impact on the organizational
performance standards. The consequences are decline in productivity, poor industrial relations and
increased turnover.
Decline in productivity:
People and organizations mutually depend upon each other. People get their livelihood from
organizations. Organizations get their productivity and profits from the services offered by its
employees. Entities look to harness the full productivity from their work force. But due to work life
imbalance they observe gradual decline in productivity. Organizations with imbalanced employees
fail to maintain a match between the productivity levels and demand from the market. To increase
productivity industries either small or big has to create some sort of innovative activities in the work
environment with the help of work life balance. Employees with work life imbalance working under
same working conditions and tools for longer years feel difficult to give full productivity. Working
conditions, working hours, training and appraisal methods are the positive inputs to enhance the
productivity. Old technology or machinery, lack of qualitative resources, lack of team spirit, lack of
support from co-workers, pressurized superior demands, low pay packages etc., imparts negligence
and carelessness in employees towards work which declines productivity. The ineffective policy
making of organizations makes many employees to experience work life imbalance. Work life
imbalance leads to poor quality products and services and decline in productivity. Due to which
entities loose goodwill in the society, decline in the share value, poor employee-employer relations
and scope in the market. Hence achieving work life balance is predominant which is possible by
adopting some strategies like change management training.
Poor industrial relations:
Organizations consist of people with different demographics, stereotypes, culture and diversity. All
the levels of management either top, middle or lower level should have interactions among
themselves about their company mission, vision, goals and objectives. The formal and informal
interactions among employees make them feel comfortable and encourage them to work with ease
and interest. Grapevine communication enhances team spirit, co-ordination and friendly nature
among the employees of various departments by eliminating misunderstandings and builds positive
work environment. A conflict free environment enhances productivity and leads to organizational
and individual success. All these are the positive inclinations for the smooth functioning of
organizations. But due to imbalance there exists a mismatch between the employees’ nature and
opinions which lead to conflicts between them. Uncompromised conflicts hamper industrial
relations. Poor employee morale, improper utilization of organization’s resources, decline in
productivity, poor quality products, absenteeism, poor organizational development, decreased
commitment towards work, ineffective planning and implementation of training and delay in
attending customer requests are the negative outcomes of poor industrial relations which are
closely associated with work life imbalance. Employees working with work life imbalance fail to
maintain cordial relations with superiors, subordinates and even colleagues which in turn lead to
poor performance. Hence to maintain better industrial relations between the employees and
management, organizations should promote informal interactions and social gatherings
Increased Turnover:
Turnover means employees leaving the organizations. Turnover of employees is a big qualitative
and quantitative damage for employers. Turnover affects organizational culture and productivity.
Turnover leads to windup of many entities. Work intensification has led to health problems and
attrition of professional and managerial employees (Fang Lee Cooke and Xingyao Jing, 2009).
Many employees particularly women feel difficult to make their presence in the office for long
working hours due to multiple responsibilities at home. Attention towards one role may bring lot of
confusion to perform the other roles which creates work life imbalance for the employees. The
employees who fail to handle or balance their work and non-work roles take a break in their career
which affects the organizational growth and development. When an organization offers its
employees policies, practices, benefits and services to help them integrate their work and family
responsibilities, they feel committed to the organization and indulge themselves in organizational
citizenship behaviours’ (Rupashree Baral and S.Bhargava, 2009). Work life imbalance makes many
employees to quit from organizations even they are in higher positions. The imbalance at work and
family life makes many employees leave their power, position, duties and responsibilities. The
multiple responsibilities of employees at home don’t allow them to work for entities for longer time.
The inability of employees to tackle the entire home and work responsibilities makes them to quit,
which becomes a great difficulty for the corporate companies. Hence such calamities can be
eliminated by the firms by enhancing virtual offices.
Remedial measures:
Due to work life imbalance most of the organizations face lot of threats. Hence organizations have
to frame and implement employee friendly policies to make employees involved in organizational
goals. Management of the organizations should communicate with the employees of all levels to
know their problems and experiences in the work environment. Organizations who understands the
feelings, ideas, opinions and problems of employees can maintain good industrial relations, timely
attention towards suppliers and target customers, maximizes shareholders wealth, increase in
employee morale, employee retention, adequate supply of funds, timely completion of working
capital requirements (short term objectives), updating latest technology and making collaborations
with top most companies. Hence work life balance contributes too many advantages for the firms.
So it is the prime responsibility of the organizations to invest in adapting some healthy policies like
employee counselling, training, modern appraisal techniques, gatherings, promotions, transfers,
flexi-working hours, job-sharing, work from home, providing child care facilities, counselling
facilities and many financial and non-financial benefits. The remedial measures suggested by the
researcher for achieving personal and organizational performance excellence are relationship
counselling, training requirement and stress management counselling; adopting modern training
methods, organizing informal associations and creating virtual office culture respectively.
Relationship counselling:
These days life became so mechanical that most of the employees pass their maximum time in
home with the electronic gadgets like television, mobile phone and computer devices. They fail to
spend quality time with their spouse, children, parents’ siblings, friends and colleagues. Employees
with high degree of imbalance fail to maintain family relations. So it is the responsibilities of the
organizations to put such employees on right track by giving psychological treatment to them and
make them aware regarding the need to balance family relationships and responsibilities.
Relationship counsellors provide a caring and supportive environment to help the employees find a
way through any difficulties that they are facing. Relationship counselling is a psychological
counselling given to the employees who face distortions in the family relations. It is a method of
making people aware of their problems in their personal life and find out the suitable strategies for
overcoming their problems. Relationship counselling can offer the employees a chance to examine
their patterns of interacting with the people around them and also allows them lead healthier and
happier lives. It can improve the relationships with work colleagues, friends or an intimate partner.
The counselling helps one to understand the importance of maintaining relationship with family
members and friends. Thus the relationship management centre makes employees manage their
responsibilities perfectly and successfully and achieve work life balance. The employees with
balanced family relationships certainly contribute to personal and organizational performance
excellence.
Training requirement:
The remedial measure for employees with poor career development is to provide periodical training
programs. Due to work life imbalance many employees may not concentrate on career planning and
development. So, a step is to be taken by organizations to retain the talented work pool by giving
them training about the opportunities available with effective career advancement. Training is the
acquisition of knowledge, skills and competencies. Training enhances performance, calibre and
efficiency of the employees. The training program should focus on ‘overcoming their problems at
home and work place’, thereby motivating them to concentrate on their bright career. Training
makes the employees to upgrade their skills and knowledge by learning the latest software,
technology, tools and equipments which make them update their career and contribute to their
organizational productivity. Training always helps to eliminate work life imbalance which improves
employee morale, management skills, better communication between superiors and subordinates
and productivity of organizations. Training gives dual benefits to both employees and organizations
i.e., employees have career advancement and organizations have competent and skilled workforce
with increased productivity. Hence successful training leads to work life balance which ultimately
contributes to performance excellence of both individuals and organizations.
Stress management counselling:
Organizations and employees who seek integration between their home and work spheres can
enrich their personal and organizational growth. Organizations have to implement stress
management counselling services for attaining work life balance from stress-related problems.
Employee assistance programs (EAPs) are being introduced by MNCs and well-performing private
firms to help employees cope with their stress (Fang Lee Cooke and Xingyao Jing, 2009).
Organizations are framing stress management counselling programs where they train the employees
in reducing their psychological burden with the help of yoga, meditation, exercise etc and regulate
the emotional imbalance. One must understand that when the brain is pushed beyond its tolerance
limits, it fogs over. When the brain is given support and appreciation, it becomes clear and alert
(The Hindu Business Line, 2012). Organizations have to hire psychologists who train the
employees to balance their family life and concentrate on work and career development. The
training program should include inputs regarding the diet plan, food habits, and attaining physical
fitness through exercise, hygiene, yoga, meditation, relaxation techniques and maintain emotional
balance. Because balanced diet, fitness and emotional intelligence help employees to reduce stress
and achieve work life balance which makes the employees to concentrate on work and career.
Organizations have to create some flexible work nature which facilitates employees to have some
relaxation while working.
Change management training:
Currently most of the firms are facing a problem of declined productivity because of work life
imbalance. Work life imbalance inhibits employees to accept the transformations taking place in
organizational climate. Due to imbalance employees hesitate to work with the new technology and
machinery as they don’t have knowledge to handle it. Even they don’t accept the changes in
organizational structure, functioning, mission, vision, goals and objectives. To overcome such
problems organizations should implement Change management training program for achieving
work life balance. Misra says, “Transformation is all about breaking habits”. “Organizations
develop holy cows which are created and perpetuated. Somebody needs to challenge that; change is
incremental. We need to create ‘discomfort’ in people about the status quo”. A small change can
influence the whole organization. Growth keeps people young. Hence growth comes with
transformation (change). Change management training program enables employees to achieve work
life balance and focus on productivity. Firms have to accommodate training programs which
enriches employees to explore their skills. Change management is an approach to shifting /
transitioning individuals, teams, and organizations from a current state to a desired future state. It is
an organizational process aimed at helping change stakeholders to accept and embrace changes in
their business environment. Change management's goal is to maximize an organization's benefits
and minimize the change impacts on workers and avoid distractions. Change Management
processes enhances creative thinking in employees to enable better communication, encourage
leadership skills, and motivate team spirit and social understanding nature among the employees by
changing their attitude and behaviour. Organizations with change management training programs
enhances adoptable nature in the employees for the economic, political, government, legal,
technological and socio-cultural reforms prevailing in the environment. It also increases the
operational efficiency with the help of work life balance. Hence employees with balanced work and
family life contribute to personal and organizational performance excellence.
Informal association’s (social gatherings)
Informal interactions make employees friendly, closer, supportive, cordial and enhance interest
towards work. Informal interactions like social gatherings within the organization at least once in a
weak, during the weak ends makes employees stress free and enhances team spirit in them. Informal
associations are the important ways for employees in getting their demands done from the
management through collective bargaining. When employees are asked to attend the parties with
their families organized by organizations, they don’t feel like missing their families and there is a
scope for building a strong bond between employees and the organization, which is also a retaining
strategy. Parties which create entertainment are a way which makes employees to exhibit their
talents and make them relief from their stress. ‘In some firms, social events, art and cultural events
and sports events are organized to employees after work hours and during weak ends which
demonstrates their skills (e.g. composing poems, drawing and painting) and enable managers to
know the employees better’ (Fang Lee Cooke and Xingyao Jing). Informal associations like self
help groups stay in touch and retiree clubs builds good rapport, enhances better communication, co-
ordination and interpersonal relations among the employees.
Virtual offices:
Entities are facing a big challenge to eliminate work life imbalance and retain competent work
force. Most of the organizations are facing a problem of turnover. Due to work life imbalance
employees express inability to stay in the work place for longer time and feel difficult to travel for
long distances because it consumes more energy and time (especially in metropolitan cities). Many
employees particularly women, take a painful decision to quit their fledging career because of some
personal reasons. To minimize the turnover and engage talented work force; organizations have to
establish virtual offices which help employees to attain work life balance. Virtual offices create an
opportunity for such kind of employees to contribute their brains for the firm even when they are
away from office. Virtual offices offer a facility of working from any place all over the globe with
the help of advanced technology and online transfer of information. Hence they prefer to work
virtually. In the rapidly changing business environment, time pressures seem ever increasing and
new technology allows work to be conducted anytime and anywhere. When an organization offers
its employees policies, practices, benefits and services to help them integrate their work and family
responsibilities, they feel committed to the organization and indulge themselves in organizational
citizenship behaviours (Rupashree Baral and S.Bhargava, 2009). Virtual offices create a flexible
advantage for the employees where they focus on the welfare of home and office simultaneously.
One who has balanced family life can concentrate on work effectively. During the period of study
the researcher had observed some medical transcriptions who offer home based work for their
companies. As they are working from home they maintain balanced relationships family and friends
and show great advancement in their career and organizational development. Most of the
employees particularly IT wish to work from home with the help of advanced technology. Today
virtual offices make many employees to bounce back into their career with confidence and ease by
eliminating work life imbalance. Work from home is also a cost reducing strategy. Hence a virtual
office is an excellent facility which promotes performance excellence of many employees with
balanced work and family life.
Conclusion
In the knowledge economy, employers must be able to retain human capital and manage their skills
in order to achieve performance excellence. Organizations aiming to thrive in the competitive
industrial environment, decisions are to be framed to achieve performance excellence. High
performance work practices have to be implemented which control work life imbalance and
envisage performance excellence. People who fail or integrate their work and family wish to move
into flexible-jobs via part-time, flexi-time and project-based working. Many industries spanning IT,
BPO, FMCG, retail, trading, banking, financial services and insurance sectors all try to grow with
the help of work life balance. Work life balance is a dynamic phenomenon which affects employees
and employers of all the sectors. Work life imbalance is a conflicting issue which shows an impact
on employees in prioritizing their personal and professional needs. Work is one of the main
priorities for most of the people which provide a primary source for their livelihood. The search for
better living conditions, craze towards luxury life, focus towards name, fame and earnings,
increased responsibilities, working couples, nuclear family structure, lubricate job assignments and
globalization are the main reasons for work life imbalance. Work life imbalance leads to many other
contradictory issues which effect both employees’ personal life and organizational culture. The
researcher had explored some of the personal consequences of work life imbalance. They are:
hampered family relationships, poor career development and psychological illness. These can be
eliminated by activating some strategies as remedial measures which enhances organizational
performance excellence. They are: sending employees to relationship centre which gives
counselling in balancing the relations, providing training to the employees with poor career
development and counselling the employees who suffer from high stress with the help of some
stress management techniques. The study also found the consequences of work life imbalance on
organizations. They are: decline in productivity, poor industrial relations and increased turnover.
Remedial measures have been suggested for the betterment of organizations which promote
performance excellence. They are adopting change management training programs, promoting
informal associations and adopting virtual office culture respectively. Implementation of all these
strategies creates positive environment for organizations which promote performance excellence
and achieve work life balance of employees. The outcomes of the remedial measures are: balanced
personal life, better family relations, bright career development, increased employee morale,
increased job satisfaction and employee commitment and engagement, enhanced productivity,
cordial industrial relations and achieves personal and organizational performance excellence.
References
Allen T D, Herst DEL, Bruck C S, Sutton M (2000), “Consequences Associated with Work-
to-Family Conflict: A review and agenda for future research”, J Occup Health Psycol,
Vol. 5, No. 2, pp. 278-308.
Anil Verma, Young-Chul Chang, Hyun Jeong KIM & Sarah Rainboth, MIRHR Candidate,
(2009), “Realizing The Korean Dream For Work- Life Balance: Employer Policies For
Sustainable Societies”, NHRD Network Journal, Vol. 2, No. 3, pp. 29-52.
Baral, R (2009), “Examing Antecedents of Work-Family Enrichment and its Effect on
Individual, Family and Organizational Outcomes”, Unpublished Doctoral Dissertation, IIT
Bombay.
Beutell, N J (2006), “Life satisfaction” (in relation to work-family variables), Sloan Work
Family Encyclopedia (Boston College)
Bond, J T, Galinsky, E, Lord, M, Staines, G L & Brown, K R (1998), “Beyond the parental
leave debate: The impact of laws in four states”, New York, NY: Families and Work
Institute.
Burke, M J, & Collinson, J (2004), “Job Recovery & Retention Poll Findings”, Society for
Human Resource Management, U.S.
Campbell-Clark, S (2000), “Work/family border theory: a new theory of work/family
balance”, Human Relations, Vol. 53, No. 6, pp. 747-770.
Chen, Q (2006), “Research on work/family conflict of knowledge worker and its
intervention strategies”, unpublished Masters Dissertation, Chongqing University, China.
Duxbury, L & Higgins, C (2002), “The 2001 National Work-life conflict study”, Final
report, Public Health Agency of Canada.
Duxbury, L & Higgins, C (2003), “Work- Life Conflict in Canada in the New Millennium:
A Status Report”, Ottawa: Health Canada.
Fang Lee Cooke & Xingyao Jing (2009), Work-Life Balance in China: Sources of Conflicts
and Copying Strategies”, NHRD Network Journal, Vol. 2, No. 3, pp. 18-28.
Galinsky, E, Bond, J T, and Friedman, D E (1993), “The changing workforce: Highlights of
the National Study”, New York: Families and Work Institute, in NHRD Network Journal,
Vol. 2, No. 3.
Grover, S L and Crooker, K J (1995), “Who appreciates family-responsive human resource
policies, the impact of family-friendly policies on the organizational attachment of parents
and non-parents”, Personal Psychology, Vol. 48, pp. 271-288.
Grzywacz, J G, & Butler, A B (2005), “The impact of job characteristics on work-to-family
facilitation: Testing a theory and distinguishing a concept”, Journal of Occupational Health
Psychology, Vol.10, No. 2, pp. 97-109.
Harish C Jain, (2009), “Issues & Prospects Relating To Work-Life Balance”, NHRD
Network Journal, Vol. 2, No. 3, pp. 9-17.
Hughes, J & Bozionelos, N (2007), “Work-life balance as source of job dissatisfaction and
withdrawal attitudes”, Personnel Review, Vol. 36, No. 1, pp. 145-154.
Hunsley, T (2006), “Work Life Balance in an Aging Population. Dimensions, Ottawa:
Policy Research Institute, Govt. of Canada”, Lessons Learned Own-Account Self
Employment in Canada (2000), Final Report: Evaluation and Data Development, Strategic
Policy, Human Resource Management, Canada.
Kofodimos, J R (1984), ‘A question of balance’, Issues and Observations, in NHRD
Network Journal, Vol. 2, No. 3, pp. 1-9.
Kopelman, R E, Prottas, D J, Thompson, C A and Jahn, E W (2006), “A multilevel
examination of work-life practices, Is more always better?” Journal of Managerial Issues,
Vol. 18, pp. 232-253.
Lobel, S A, & Kossek, E E (1996), “Human Resource Strategies to support diversity in work
and personal lifestyles: beyond the ‘family friendly’ organization”, in, Kossek, E E and
Lobel, S A, (ed.), Managing diversity, Human resource strategies for transforming the work
place, Blackwell, Cambridge, M A, pp. 221-243.
N Sekar, (2009), “Work-Life Balance – A Priority for Both Employee and Employer”,
NHRD Network Journal, Vol. 2, No. 3, pp. 76-78.
Rajadhyaksha, U, & Smita, S (2004), “Tracing a timeline for work and family research in
India”, Economic and Political Weekly, pp. 1674-1680.
Rupashree Baral & S Bhargava, (2009), “Work Life Balance Practices in Indian
Organizations: Challenges and Prospects”, NHRD Network Journal, Vol. 2, No. 3,
pp. 53-58.
S S Rao, Aiswarya Ramasundaram, (2011), “Exploring The Work To Family To Work
Relationship With Depression On Academic Women Employees With Select Demographic
Profile”, Abhigyan, Vol. XXXVII. No.2, pp. 52-64.
Sandeep K Krishnan, (2009), “Work Life Balance-Young Dilemma”, NHRD Network
Journal, Vol. 2, No. 3, pp. 104-105.
Shaffer, M A, Francesco, A M, Joplin, J R W, & Lau, T (2003), “Reconciling life roles: A
cross cultural model of work-Hong Kong”: Baptist University. Texas, USA: University of
Texas- EL’ Paso, pp. 1-47.
Social Development Canada (2004), “Balance and new workplace challenges-Frequently
asked questions for individuals”, NHRD Network Journal.
Thompson, C A, Beauvias, L L and Lyness, K S (1999), “When work-family benefits are
not enough: The influence of work-family culture on benefit utilization, organizational
attachment, and work-family conflict”, Journal of Vocational Bahavior, Vol. 54, No. 3,
392-415
Reading Habits of Post-Graduate Students in Select Business Schools and its Impact on
their Employability
Prof. Sharmila Mohapatra
Faculty, Business Communication, SIES College of Management Studies
Ms. Rashmi Udayshankar
Student of MMS (2012-14) SIES College of Management Studies
Ms. Ashita D’almeida
Student of MMS (2012-14) SIES College of Management Studies
----------------------------------------------------------------------------------------------------------------
Abstract
There has been an alarming increase in the number of Business Schools in India, which has
recently tripled to 4500. Every school is churning out a substantial number of graduates every
year, who aspire to get suitable and satisfying jobs. Out of this humungous number of
graduates, how many are capable enough and ready to be employed as a part of an already
globalized economy? Do the graduates have an awareness of the skill sets required for
employability and how are they equipping themselves for it?
The challenges for educational institutions in this regard are many. The journey from
education to employment is one that has been much debated by both educational institutions
of higher learning as well as corporate, the major employers of professionally qualified
youth. There appears to be a consensus with regard to the gap that exists between learning
and employability skills.
Globalisation has arrived, and it is here to stay. As a direct effect, the corporate world and the
requirements that an individual must fulfil to enter and survive in this world, have largely
evolved. Post globalization, a large portion of the workforce needs to tie in, connect or
network with the outside, which is where the aspect of quality working population matters.
We are in an era where technicality and subject knowledge does not suffice. We are in an era
where strong communication skills play a major role. We are in an era where fluency in
English, good reading and writing ability is no more a luxury, but a necessity. We are in an
era where social skills, sense of ethics and integrity and a right attitude make a big difference.
The proficiency of an individual in these aspects is the most crucial determinant of his
employability in today’s globalised scenario.
This research paper attempts to explore the preparedness of today’s young professionals to be
employed and the efforts being made by them therein. Area of focus is the closely-related,
vital aspect of employability such as their reading habits and overall awareness.
----------------------------------------------------------------------------------------------------------------
Key Words: Graduates, Employability, Reading, Proficiency, Awareness
Introduction
According to Professor Mantz Yorke ('Employability in Higher Education: what it is - what it
is not') ‘Employability is a set of achievements – skills, understandings and personal
attributes – that make graduates more likely to gain employment and be successful in their
chosen occupations, which benefits themselves, the workforce, the community and the
economy’
In simpler words, Employability can be defined as the ability and potential of an individual of
obtaining and sustaining satisfactory work on account of his/her achievement, learning’s and
knowledge of the domain and individual characteristics.
Most discussions concerning today’s workforce eventually turn to employability skills.
Finding workers who have employability or job readiness skills that help them fit into and
remain in the work environment is a real problem. Job readiness skills are clustered into three
skill sets: basic academic skills, higher order thinking skills, personal qualities. Employability
skills are those basic skills necessary for getting, keeping, and doing well on a job.
Employability is also about staying employed in their entire life, it is not similar to gaining an
initial job, on the contrary it is also about the capacity of the individual to perform in a
particular job in a particular period and be able to shift jobs in case of necessity.
A person's employability on one hand depends on the knowledge, skills and attitude of the
person. On the other hand market conditions and institutions also have huge impact on the
employability of the individual.
Hence, an exploratory study has been done with a view to gather information about student’s
perception towards their employability and their efforts towards making themselves more
employable and sellable to the companies in their preferred domain.
Literature Review
Any discussion about language skill sets (LSRW) lays greater emphasis on the last two with
reference to employability. In ranking the importance of the skills, students ranked writing as
their least competent skill and regarded speaking and writing as the most important skills
needed to master the language (Othman, 2005). The reading habits help in the promotion of
an individual’s personality as well as capability. Panigrahi and Panda, (1996); Eyre, (2005)
have talked about reading as the art of interpreting printed and written words, the most
effective process of conscious learning which influences the extent and accuracy of
information as well as the attitudes, morals, beliefs, judgment and action of readers. Regular
and systematic reading sharpens the intellect, refines the emotions, develops tastes and
provides perspective for one’s living and thereby prepares a person for effective participation
in social, religious, cultural, political and professional life (Loan 2011). Reading loads the
mind with new software says Satija (2002).
Reading maketh the man they say for it is reading which provides the means for widening
mental horizons and equipping the individual with opportunities for success. Empirical
studies of reading habits have been undertaken since ages. Norvell (1950) identifies age and
sex as two determinants affecting reading habits. Moyes (2000), Stenberg (2001) and Ross
(2002) reveal that females are heavier readers than males. Yilmaz (2000) found that majority
of the students (77.8%) did not have reading habits, whereas the smallest percentage (6.5%)
were heavy readers. Hastings and Henry (2006) reveal that 56% of the respondents spend less
than an hour a day on reading and 13% of them do not read at all. Igun and Adogbeji (2007)
found that nearly 61.5% of post-graduate students are motivated to read and study for
knowledge and skills while 22.5% are motivated primarily by the desire to pass the
examinations and tests. Kaur and Thiyagarajah (1999) reveal that while many students spend
3-5 hours per week in reading, 69.8% of them spend this time in reading literary works,
28.6% in reading newspapers and 25.4% on reading novels. Academic success at the tertiary
level is likely a multidimensional phenomenon that includes language proficiency, learning
and study strategies and certain personal characteristics (Stoynoff 1997).
Yorke and Knight (2003) define employability as a ― “A set of achievements – skills,
understandings and personal attributes – that make graduates more likely to gain employment
and be successful in their chosen occupations, which benefits themselves, the workforce, the
community and the economy”. Employability skills, while categorized in many different
ways, are generally divided into three skill sets: (a) basic academic skills, (b) higher-order
thinking skills and (c) personal qualities. The three skill sets are typically broken down into
more detailed skill sets. Robinson (2007) stresses the significance of the basic academic skills
for high job performance. Harvey (2001) mentioned in his report titled Employability and
Diversity; ―Employability has many definitions but they break down into two broad groups.
The first relate to the ability of the student to get (and retain and develop in) a job after
graduation. The other set are concerned with enhancing the students‟ attributes (skills,
knowledge, attitudes and abilities) and ultimately with empowering the student as a critical
life-long learner Hillage and Pollard, 1998; Harvey, (2001). Armstrong, Johnston, Bridges,
and Gessner(2003) echo something similar “A hallmark of professional behaviour is the
personal commitment to the ongoing acquisition of new knowledge”.
The review of literature suggests that the employability skills can be inculcated in students
provided of course there were an awareness, willingness and effort involved in acquiring
those skills.
Objectives of the Study
1. To gauge the extent of reading undertaken by post-graduate students, with respect to
general and academic genre.
2. To assess the preparedness of post-graduate students with respect to being employable
in the current competitive global scenario
Research Methodology
Sources of Data
The data for the study has been collected from two sources, namely primary and secondary.
The measurement tool that has been used to collect data is a survey questionnaire. The
survey method used is random sampling. The questionnaire consisted of 11 questions,
out of which maximum number of questions were of the close-ended type. The
questions were framed with the purpose of gauging the extent of the rudimentary
habit of reading among students, both on the general and professional front.
Additionally, the questions aimed at sensing the general awareness of the students and
the efforts being taken by them as a preparation for making themselves employable.
The questionnaire is distributed to students pursuing post-graduate courses at various
business schools.
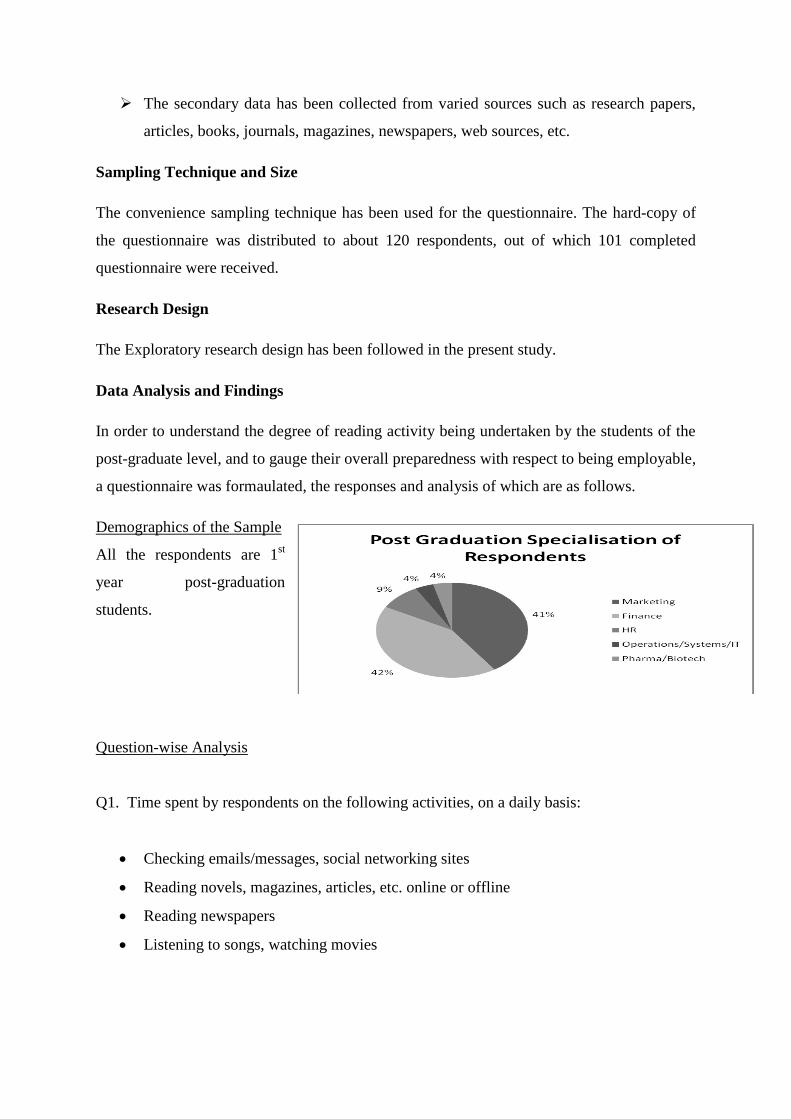
The secondary data has been collected from varied sources such as research papers,
articles, books, journals, magazines, newspapers, web sources, etc.
Sampling Technique and Size
The convenience sampling technique has been used for the questionnaire. The hard-copy of
the questionnaire was distributed to about 120 respondents, out of which 101 completed
questionnaire were received.
Research Design
The Exploratory research design has been followed in the present study.
Data Analysis and Findings
In order to understand the degree of reading activity being undertaken by the students of the
post-graduate level, and to gauge their overall preparedness with respect to being employable,
a questionnaire was formaulated, the responses and analysis of which are as follows.
Demographics of the Sample
All the respondents are 1st
year post-graduation
students.
Question-wise Analysis
Q1. Time spent by respondents on the following activities, on a daily basis:
Checking emails/messages, social networking sites
Reading novels, magazines, articles, etc. online or offline
Reading newspapers
Listening to songs, watching movies
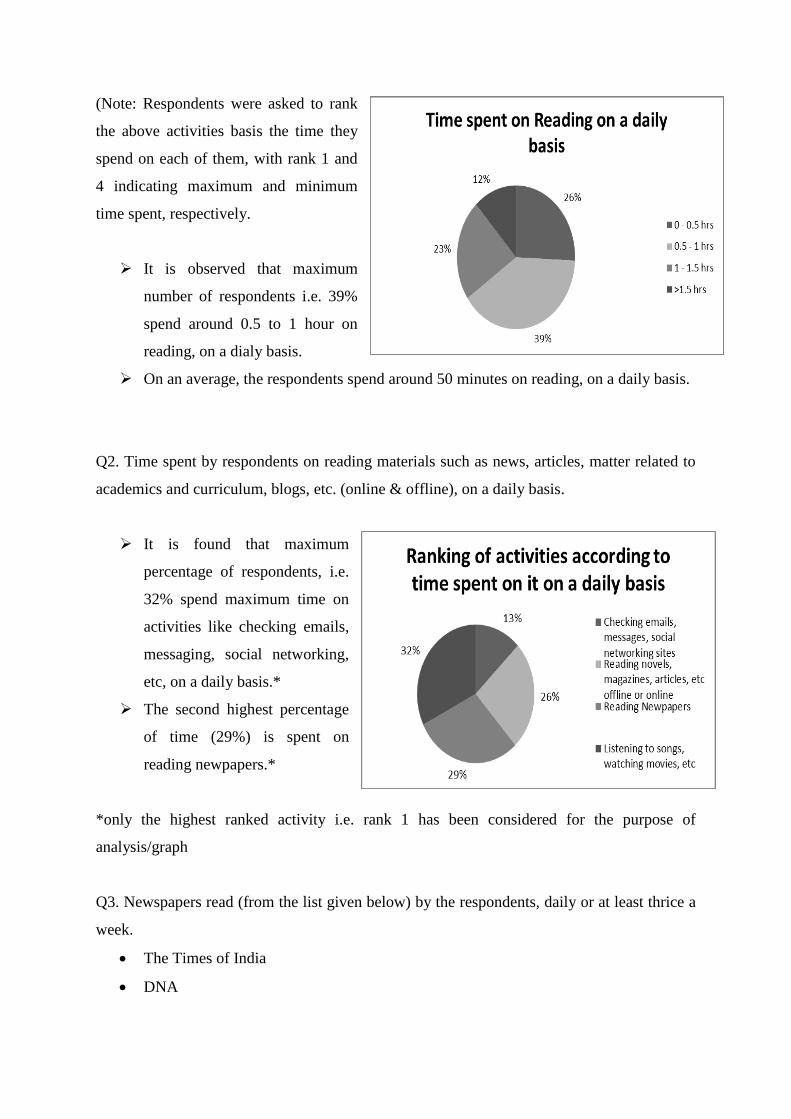
(Note: Respondents were asked to rank
the above activities basis the time they
spend on each of them, with rank 1 and
4 indicating maximum and minimum
time spent, respectively.
It is observed that maximum
number of respondents i.e. 39%
spend around 0.5 to 1 hour on
reading, on a dialy basis.
On an average, the respondents spend around 50 minutes on reading, on a daily basis.
Q2. Time spent by respondents on reading materials such as news, articles, matter related to
academics and curriculum, blogs, etc. (online & offline), on a daily basis.
It is found that maximum
percentage of respondents, i.e.
32% spend maximum time on
activities like checking emails,
messaging, social networking,
etc, on a daily basis.*
The second highest percentage
of time (29%) is spent on
reading newpapers.*
*only the highest ranked activity i.e. rank 1 has been considered for the purpose of
analysis/graph
Q3. Newspapers read (from the list given below) by the respondents, daily or at least thrice a
week.
The Times of India
DNA
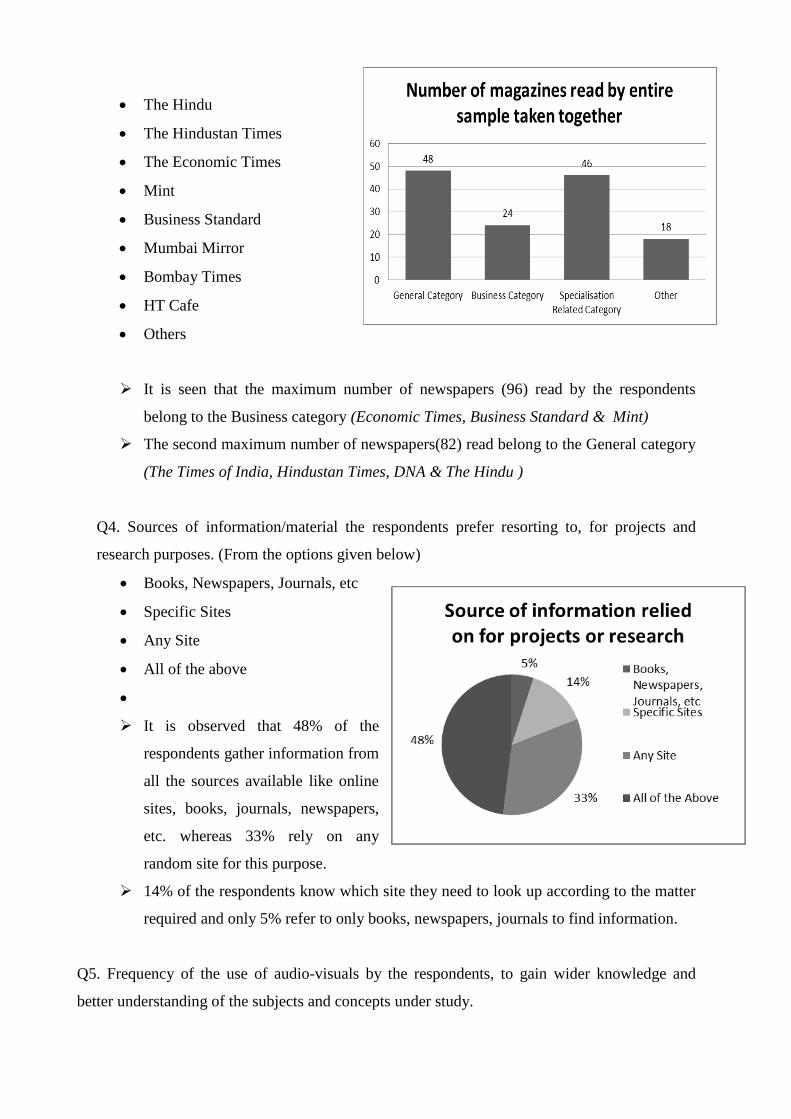
The Hindu
The Hindustan Times
The Economic Times
Mint
Business Standard
Mumbai Mirror
Bombay Times
HT Cafe
Others
It is seen that the maximum number of newspapers (96) read by the respondents
belong to the Business category (Economic Times, Business Standard & Mint)
The second maximum number of newspapers(82) read belong to the General category
(The Times of India, Hindustan Times, DNA & The Hindu )
Q4. Sources of information/material the respondents prefer resorting to, for projects and
research purposes. (From the options given below)
Books, Newspapers, Journals, etc
Specific Sites
Any Site
All of the above
It is observed that 48% of the
respondents gather information from
all the sources available like online
sites, books, journals, newspapers,
etc. whereas 33% rely on any
random site for this purpose.
14% of the respondents know which site they need to look up according to the matter
required and only 5% refer to only books, newspapers, journals to find information.
Q5. Frequency of the use of audio-visuals by the respondents, to gain wider knowledge and
better understanding of the subjects and concepts under study.
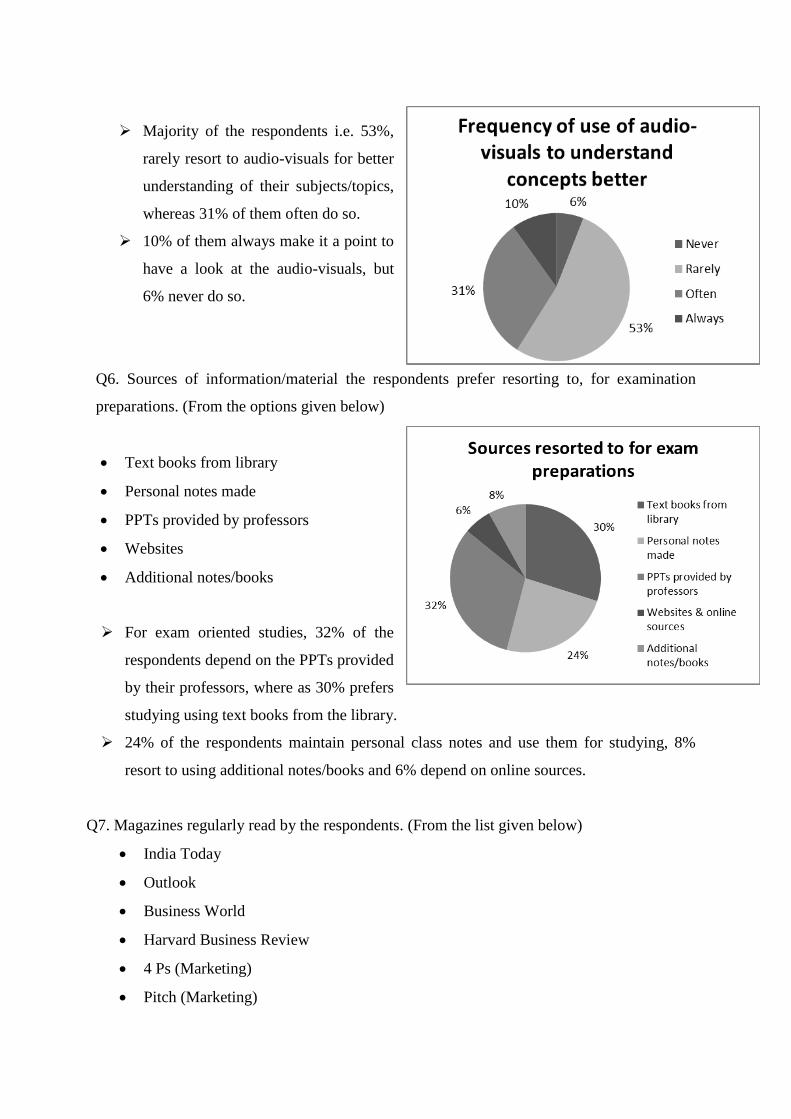
Majority of the respondents i.e. 53%,
rarely resort to audio-visuals for better
understanding of their subjects/topics,
whereas 31% of them often do so.
10% of them always make it a point to
have a look at the audio-visuals, but
6% never do so.
Q6. Sources of information/material the respondents prefer resorting to, for examination
preparations. (From the options given below)
Text books from library
Personal notes made
PPTs provided by professors
Websites
Additional notes/books
For exam oriented studies, 32% of the
respondents depend on the PPTs provided
by their professors, where as 30% prefers
studying using text books from the library.
24% of the respondents maintain personal class notes and use them for studying, 8%
resort to using additional notes/books and 6% depend on online sources.
Q7. Magazines regularly read by the respondents. (From the list given below)
India Today
Outlook
Business World
Harvard Business Review
4 Ps (Marketing)
Pitch (Marketing)
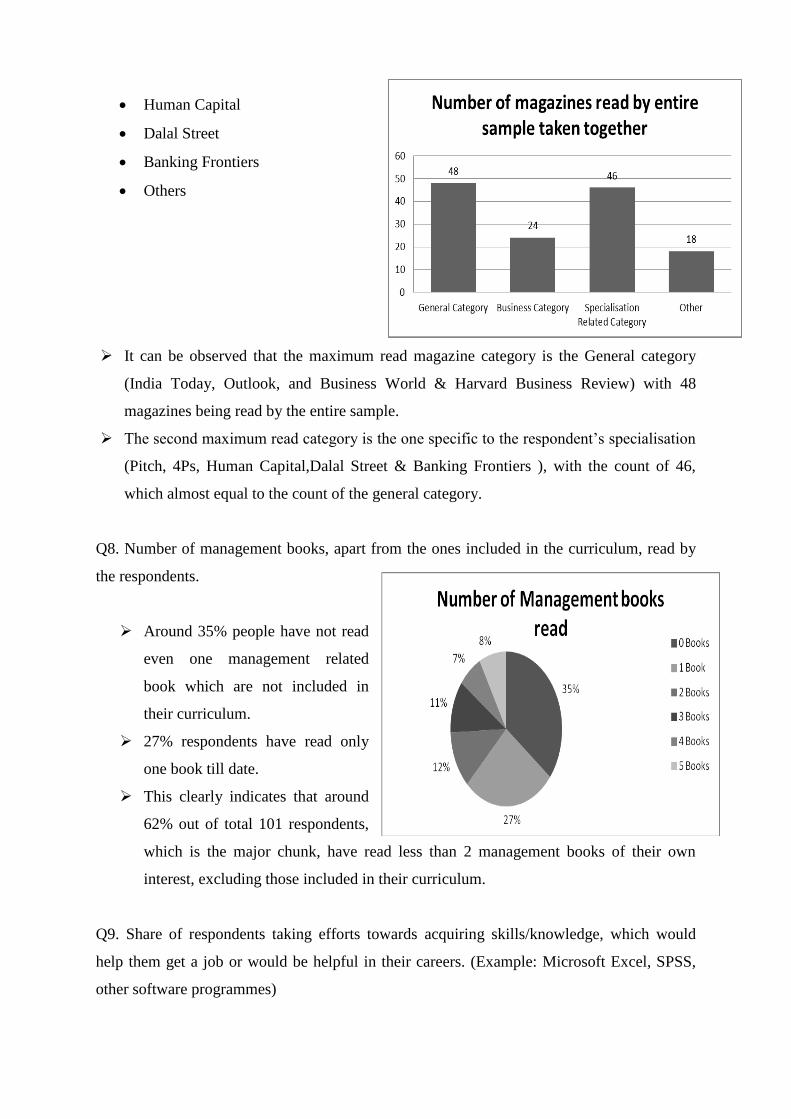
Human Capital
Dalal Street
Banking Frontiers
Others
It can be observed that the maximum read magazine category is the General category
(India Today, Outlook, and Business World & Harvard Business Review) with 48
magazines being read by the entire sample.
The second maximum read category is the one specific to the respondent’s specialisation
(Pitch, 4Ps, Human Capital,Dalal Street & Banking Frontiers ), with the count of 46,
which almost equal to the count of the general category.
Q8. Number of management books, apart from the ones included in the curriculum, read by
the respondents.
Around 35% people have not read
even one management related
book which are not included in
their curriculum.
27% respondents have read only
one book till date.
This clearly indicates that around
62% out of total 101 respondents,
which is the major chunk, have read less than 2 management books of their own
interest, excluding those included in their curriculum.
Q9. Share of respondents taking efforts towards acquiring skills/knowledge, which would
help them get a job or would be helpful in their careers. (Example: Microsoft Excel, SPSS,
other software programmes)
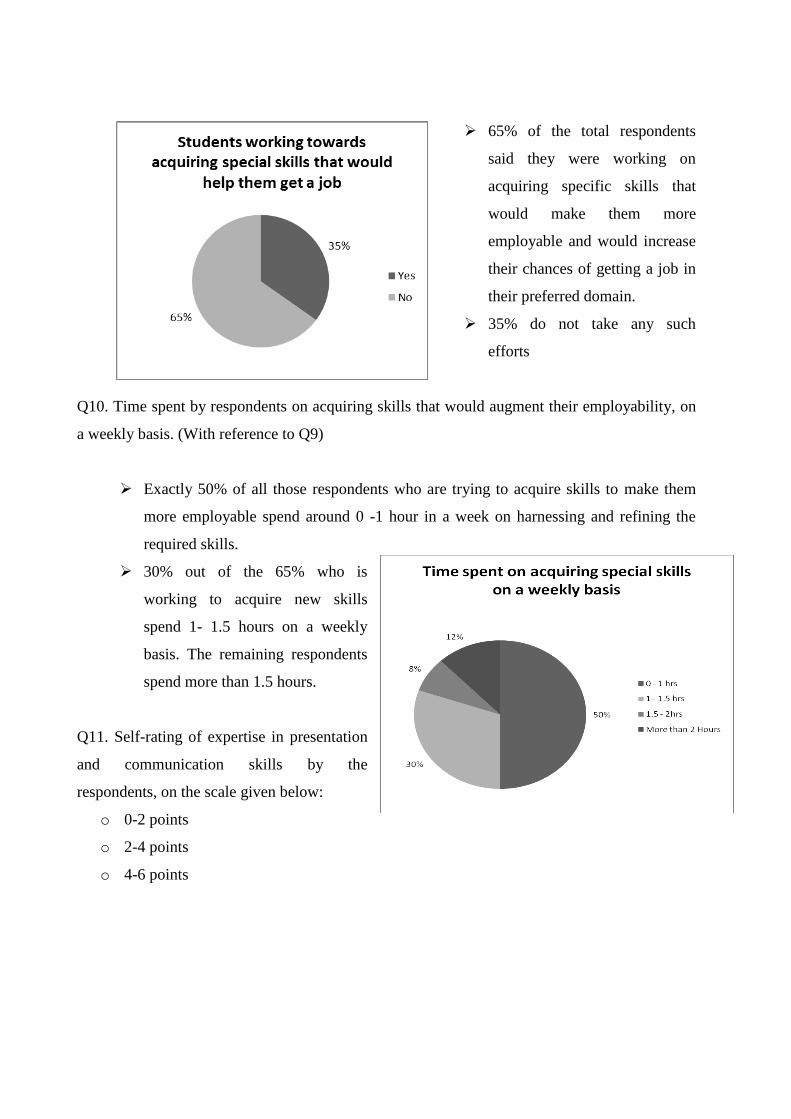
65% of the total respondents
said they were working on
acquiring specific skills that
would make them more
employable and would increase
their chances of getting a job in
their preferred domain.
35% do not take any such
efforts
Q10. Time spent by respondents on acquiring skills that would augment their employability, on
a weekly basis. (With reference to Q9)
Exactly 50% of all those respondents who are trying to acquire skills to make them
more employable spend around 0 -1 hour in a week on harnessing and refining the
required skills.
30% out of the 65% who is
working to acquire new skills
spend 1- 1.5 hours on a weekly
basis. The remaining respondents
spend more than 1.5 hours.
Q11. Self-rating of expertise in presentation
and communication skills by the
respondents, on the scale given below:
o 0-2 points
o 2-4 points
o 4-6 points
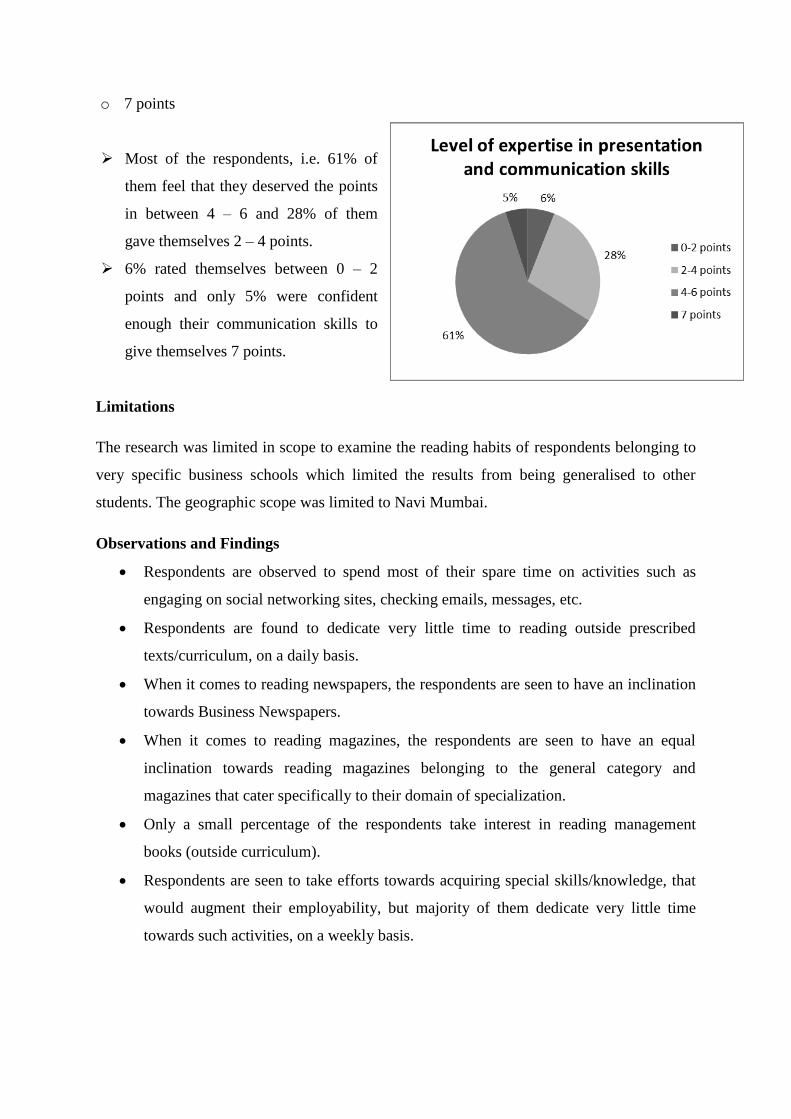
o 7 points
Most of the respondents, i.e. 61% of
them feel that they deserved the points
in between 4 – 6 and 28% of them
gave themselves 2 – 4 points.
6% rated themselves between 0 – 2
points and only 5% were confident
enough their communication skills to
give themselves 7 points.
Limitations
The research was limited in scope to examine the reading habits of respondents belonging to
very specific business schools which limited the results from being generalised to other
students. The geographic scope was limited to Navi Mumbai.
Observations and Findings
Respondents are observed to spend most of their spare time on activities such as
engaging on social networking sites, checking emails, messages, etc.
Respondents are found to dedicate very little time to reading outside prescribed
texts/curriculum, on a daily basis.
When it comes to reading newspapers, the respondents are seen to have an inclination
towards Business Newspapers.
When it comes to reading magazines, the respondents are seen to have an equal
inclination towards reading magazines belonging to the general category and
magazines that cater specifically to their domain of specialization.
Only a small percentage of the respondents take interest in reading management
books (outside curriculum).
Respondents are seen to take efforts towards acquiring special skills/knowledge, that
would augment their employability, but majority of them dedicate very little time
towards such activities, on a weekly basis.
Conclusion
This exploratory study was conducted with a very small sample size. The study revealed that
the wired generation has limited interest in reading beyond the prescribed texts. They spend a
large amount of time in checking e-mails, messaging, social networking, etc but reading
related, even to their related domain appears to be minimal. In the process their employability
skills are definitely getting hampered. The basic academic skills as well as the higher order
thinking skills require a concentrated amount of reading coupled with serious deliberations on
complex issues. With the focus shifting from reading to other activities, the quality of the
workforce may be compromised. The challenge therefore is to create the awareness,
willingness and the determination to make use of the new media for active learning rather
than mere leisure.
References
Armstrong, M. L, Johnston, B. A.,Bridges, R. A., & Gessner, B. A.(2003). The
importance of graduate education on reading for lifelong learning. Journal of
Continuing Education in Nursing 34(1).
Eyre, G. (2005).The development and practice of literacy: A voyage of discovery.
Retrieved from http://www.iasl-slo.org/ifla2005-eyre.doc
Harvey, L., (2001), ― Quality in Higher Education 7(2). Retrieved from
http://www0.bcu.ac.uk/crq/publications/goterburg.pdf
Hastings, C. and Henry, J. (2006) Reading is a closed book to today’s children.
Telegraph. Retrieved from http://www.telegraph.co.uk/news/1524595/Reading-is-a-
closed-book-t-today’s-children.html.
Hillage, J and Pollard, E. (1998) Employability: Developing a Framework for Policy
Analysis. Retrieved from https://www.education.gov.uk/publications/.../RB85.pdf
Igun, S.E.and Adobgeji.O.B.(2007) Study habits of postgraduates students in selected
Nigerian universities. Library Philosophy and Practice, November, Retrieved from
http://webpages.uidaho.edu/~mbolin/igun-adobgeji.pdf
Kaur, S and Thyigarajah, R.(1999) The English reading habits of ELLS students in
University Science Malaysia. Retrieved from
http://ultibase.rmit.edu.au/Articles/may00/thyiag1.html
Loan, A. Fayaz. (2011) Reading habits of rural and urban college students in the 21st
Century. Retrieved from
http://www.heacademy.ac.uk/assets/documents/employability/id460_embedding_emp
loyability_into_the_curriculum_338.pdf
Mantz Yorke (2004) - 'Employability in Higher Education: what it is - what it is not',
Higher Education Academy/ESECT. Retrieved from
http://www.employability.ed.ac.uk/What
Moyes, J. The idea that the net is killing book reading can be filed under fiction. The
Indepeendent May 16. Retrieved from http://www.independent.co.uk/arts-
entertainment/books/new/idea-that-the-net-is-killing-book-reading-can-be-filed-
under-fiction-718166.html
Norvell, G.W.(1950) The reading interests of young people. Washington D.C Health.
Othman, J. (2005). English Language Use among EFL Learners in Sunway University
College. Sunway Academic Journal.
Panigrahi, C. & Panda, K.C. (1996). Reading interests and information sources of
school going children: A case study of two English medium schools of Rourkela,
India. Malaysia Journal of Library and Information Science1. Retrieved from
http://ejum.fsktm.um.edu.my/ArticleInformation.aspx?ArticleID=205
Robinson, P. Jacquelyn (2000) The Workplace.Retrieved from
www.fremont.k12.ca.us/cms/lib04/.../189/employability-skills.pdf
Ross, C.S (2002), Reading in a digital age in G.E.Gorman (ed). The digital factor in
library and information sciences. Facet Publishing
Satija, M.P.(2002) Reading and Book Culture, Herald of library Science, 41(1/2)
Smithies, M (1982) Book reports and the reading habit. English Teaching Forum.
Stenberg, C.(2001) Reading Research in Sweden – a short survey retrieved from
http://archive.ifla.org/VIifla67/papers/181-113e.pdf
Stoynoff, S. (1997). Factors associated with international student’s academic
achievement. Journal of Instructional Psychology.
http://jistudents.files.worldpress.com2011/12/7-international-graduate-students.pdf
Yimaz, B (2000) Reading and library using habits of the students whose mother
tongus is Turkish in Vienna, Austria. Retrieved from
http://www.ifla.org/IV/ifla66/papers/084-152e.pdf.
Yorke, M and Knight, P. (2003) Embedding employability into the curriculum.
Retrieved from
http://www.heacademy.ac.uk/assets/documents/employability/id460_embedding_emp
loyability_into_the_curriculum_338.pdf
A Study of Contemporary Approaches of Brand Building
Prof. Mokhalles M. Mehdi
Assistant Professor of Marketing, MIS & IT
School of Business, The Assam Kaziranga University, Jorhat, Assam
----------------------------------------------------------------------------------------------------------------
Abstract
Brand is a capsule of prospect on the part of consumer and pledge on the part of supplier. The
aim of research is to identify the practices of building better brand. Research will recognize
the approaches that could use by the company to build a good reputation for their product in
the market. The research discusses the brand building practices using the examples such as
Dettol, Maaza and Lux. The present study is based on internal company data and secondary
information of different researches. The study brings forth that companies can use the key
approaches includes direct advertisements, co-branding technique, repositioning of the brand,
celebrity endorsements and sponsoring the events to build brand. The study also discuss the
contemporary approaches of brand building such as regional outreach programmes, road
shows and exhibitions, live experience of the products before customer buy, knowledge of
distribution channels, Know Your Customer (KYC) program, internet promotion, honouring
existing employees and corporate social responsibility. The research concludes that the
adopted different brand building practices increasing the brand value of numerous companies.
----------------------------------------------------------------------------------------------------------------
Keywords: Brand, Co-branding, Repositioning, Sponsor, Endorsement
Introduction
A brand is a name, symbol, logo, photograph and much more than that which is used to
communicate the message of a company or organization/institution to the target segment. It
has divided that a brand is related with two aspects such as customers and suppliers.
Customers are the key part of the acceptance of brand who bought the brand from the
organization due to its certain attributes. Suppliers are the major source of any brand that
developed and marketed the brand in the market. In a simple term, brand is a capsule of
expectation on the part of consumer and it’s a capsule of promise on the part of supplier
because capsules do consumption easier.
Majumdar, Ramanuj (2005) indicated that brand building is a conscious customer satisfaction
orientation process. The key objective of brand owner is to retain customers over their
competitors by using different types of promotional mix. Similarly, a customer feels satisfied
when the brand matches his/her expectations and when the outcome of brand is more than the
expectation customer was delighted and have become loyal to the customer. Strong brand
helps companies to increase their market potential. Brand building is part of a strategy aimed
at differentiating the offering companies try to build and fulfill the expectations of specific
groups of customers. Companies do so by consistently and repeatedly providing combination
of attributes – tangible, practical and symbolic, visible and invisible value – under conditions
that are economically viable for the company. First task in brand building is defining just
what the brand infuses into the product or service. Branding is not based on what goes on, but
what goes in. Brand building is a continuous process. It has been indicated in the Figure 1
that brand building model has three main steps: Input, Assessment and Outcomes. Input
includes about the main customer segments for that brand; understanding customer outlook;
assessment of substitutes; attracting customers or gaining the customer confidence through
packaging, promotion, dealer networks and supports, up gradation of product etc. Assessment
is the process of taking continuous feedback from the customer segments, dealer networks
and other stakeholders of the brand as well as scientific enquiry about the details of product
and target segment. Outcomes include:
Volume of the speculative consumers who have been attracted
Volume of profit has been increased.
To find the present market share of the brand.
To find the brand awareness among the consumers.
To find the brand loyalty among the consumers.
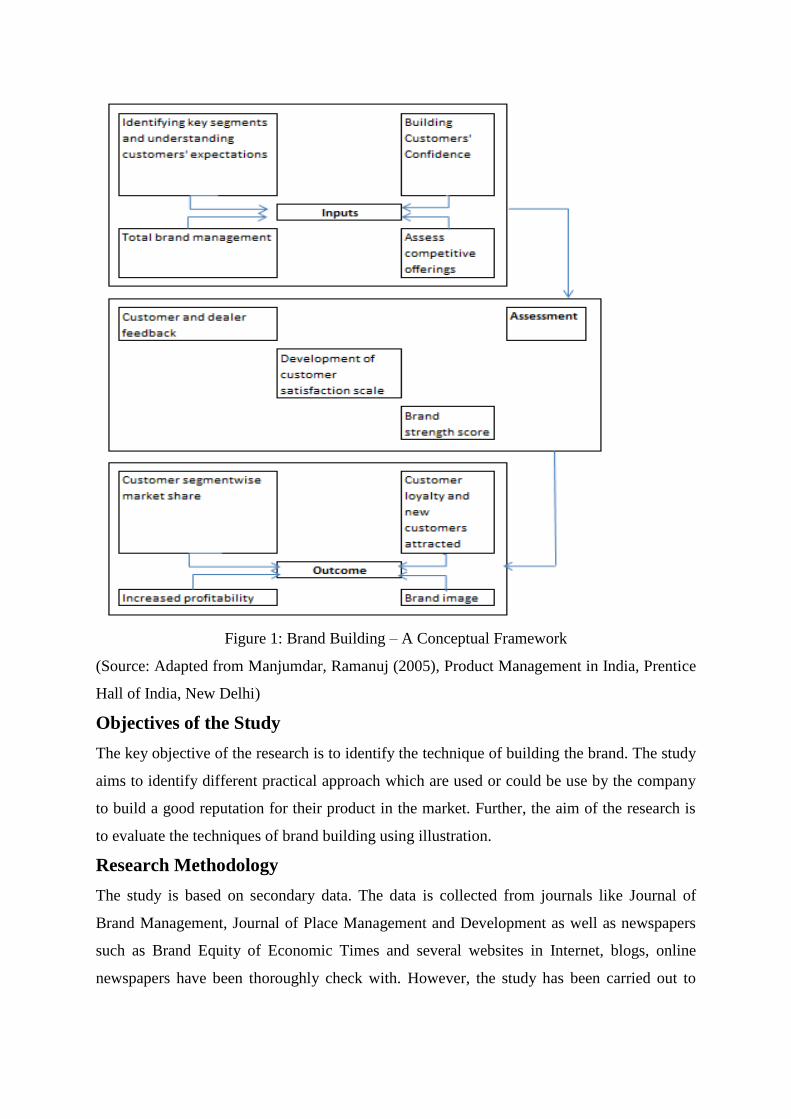
Figure 1: Brand Building – A Conceptual Framework
(Source: Adapted from Manjumdar, Ramanuj (2005), Product Management in India, Prentice
Hall of India, New Delhi)
Objectives of the Study
The key objective of the research is to identify the technique of building the brand. The study
aims to identify different practical approach which are used or could be use by the company
to build a good reputation for their product in the market. Further, the aim of the research is
to evaluate the techniques of brand building using illustration.
Research Methodology
The study is based on secondary data. The data is collected from journals like Journal of
Brand Management, Journal of Place Management and Development as well as newspapers
such as Brand Equity of Economic Times and several websites in Internet, blogs, online
newspapers have been thoroughly check with. However, the study has been carried out to
understand brand building with analysis of different examples. The study has been conducted
from the time period of March to August 2013.
The review and analysis is done in simple manner without using any jargons. Information has
been used to present research results so that results could be easily understood.
Results and Discussion
Brand has become one of the important aspects in contemporary times in every part of the
world in human life. People know only brands such as Brand Rahul Gandhi, Aamir Khan or
places like Kerala in India. Brand has occupied major part of our day to day life. Every where
only brands are visible. Brand awareness has been improved in certain cases due to the name
of the product because it is easy to pronounce or spell and the brand is distinctive in nature.
Few examples of simple brand names are Coca Cola as Coke, Tata, Dell and destination
brand namely Singapore, Malaysia and Kerala in India.
A brand can be build by using different approaches such as
1. Direct advertisement, e.g. TV campaign
2. Co-branding technique
3. Repositioning
4. Celebrity endorsements
5. Sponsorship
METHOD 1: Television advertisement in brand building
Advertisement facilitates to build a brand of a company in the target market. Brand building
is not only depending on the company but also on the creative agency because of proper
communication. An advertisement is the process of marketing communication to assist the
product to promote in the mind of consumer with certain attributes. Considering the example
of Maaza, one of the prominent juice brands in India provides mango experience to
consumers in every season. Even Brand Equity Most Trusted Brand Survey indicated that
Maaza become in 8th position in 2012 as compared 2011 ranked 32 making it the only
beverage brand in the Top 10. K.V. Sridhar, Chief Creative Officer - Indian subcontinent,
Leo Burnett, "When a brand finds a purpose in people's life then it is difficult not to love it”.
Maaza's purpose is to provide the authentic mango experience irrespective of seasonality.
Campaign – Story of Maaza advertisement in brand building
In the TV advertisement of Maaza a village family communicates the product by indicating
the availability of mangoes in all season to a police man. Maaza’s new advertisement shows
that actor Parineeti Chopra is a girl crazy about mangoes. Advertisement demonstrates that
Parineeti is a lovely girl and many boys want her attention in the neighbourhood. She told
people that her heart will belong to the person who can acquire mangoes for her in every
season and actor Imran Khan wins the race by getting her a Maaza. This point out that Maaza
has no season as love. The advertisement campaign Har Mausam Love, Har Mausam
Aam campaign was created by Leo Burnett and the tag line is Maaza Har Mausam Aam!
METHOD 2: Co-branding helps to build brand
Grossman (1997) indicated that Co-branding is an amalgamation of two or more brands for
the purpose of new product introduction, co-advertising, co-sponsoring or joint promotions.
Brand extensions are used to introduce new product or service which is not earlier associated
the brand (Aaker & Keller, 1990). Co-branding arrangement is possible only between the
equal partners’ in terms of strengths and characteristics.
A Co-branded extension is a Composite brand idea that includes the characteristics of two
fundamental concepts (Cohen and Murphy 1984; Park, Jun, and Shocker 1996) which is not
in a Solo-branded extension. Both the participating brands are associated with a set of
features that are combined according to a set of policies to outline the Composite brand
(Eysenck and Keanne 1990; Hampton 1987). Akula (2008) indicated that brands with varying
dimensions of attributes, benefits, values, culture, personality and users have the real power
to generate wealth. Brands, which are storing in these dimensions command respectable
position in terms of sales, reputation, image etc, in the market. A good example of Co-
branding is Citibank Co-branded with MTV to launch a Co-branded debit card and it is
beneficial to customers who can avail benefits at specific outlets called MTV Citibank club.
Marketers believe that Co-branding assists to build better brand in competitive environment.
Co-branding is used in the competitive market to increase market share of a company or to
expand existing market. Co-branding is good in the sense that it reduces investment of firm’s
resources such as cost, people and time. Each of partners is able to use their distribution
system and sales force to increase the revenue of company. However, it also reduces
competitive cost of the company.
Co-branding facilitates new brand to leverage the name of parent brand and build reputation
in market place. Rao and Ruekert (1994) indicate that Co-branding is the way to present a
new product to customer by existing parent brands.
Co-branding can fetch in two brands stronger in their own fields and can build better brand.
Best Examples in Co-branding is McDonald and Coke. Co-branding has become successful
to both the companies in this case. Co-branding has given business two both of the brands. It
has been seen that customers’ preferred Mc-Burger looks for Coke; hence if Co-branding
doesn’t exist then it should be an absolute loss for Coke. In Co-branding, brand managers
have to ensure that it should be equal from different industry segment and with relevance to
target audience of the brand. A good example is marketer can’t Co-brand Yatra.com with
Surf Excel or Ariel but can do Yatra.com or NDTV travels with McDonald or Pizza Hut.
Micromax and MTV Co-branding identify that both brands have similar target audience in
market (Mehdi, Mokhalles M., 2013). Both brands have shared a common vision focusing the
Indian youth. Micromax wants to reach Indian consumer base through mobile phone and
MTV wants to reach through music. The strength of both brands has complimented each
other and results shows that Micromax has increased sales after Co-branding initiative.
METHOD 3: Re-positioning helps to build better brand
Brand repositioning is changing or altering the positioning of a brand. Repositioning is done
keeping in mind that sometimes the earlier positioning may or may not work with brand.
Thus companies do the repositioning for that brand to increase the market demand for the
product. Illustrating few examples of repositioning below:
Case 1: Dettol Soap
Initially Dettol toilet soap was positioned as beauty soap. Dettol the parent brand was
positioned as anti-septic soap and liquid which aids to heal cuts and gashes. The positioning
has revealed that the extension of Dettol as beauty product was not in line with its core
values. Therefore, the company had repositioned the product as “germ-kill” soap and did well
after repositioning. The soap was repositioned to match the image of Dettol.
Case 2: Lipton Yellow Label Tea
Initially, Lipton Yellow Label Tea was positioned as premium, sophisticated and delicious
tea for its target customers. The advertisement that company has launched to introduce the
product in the market based on foreign theme and the participants in the advertisements were
foreigner. It was seen that the approach of the advertisements have not receive the favor from
the customers. As a result, company had repositioned the product with an Indian theme of
advertisement targeting Indian customer.
Case 3: Maharaja – the positioning
Maharaja Diswasher was primarily positioned as a sophisticated and aristocratic product. The
target customer for the product was upper crust. Positioning statement of the product was
“your guests get Swiss cheese, Italian Pizza …… you get stained glassware.” But Indian
housewives were not in favour of Dishwasher because of cultural reasons. Therefore, the
company has changed the message to target the Indian housewives with the positioning
statement “Bye, Bye Kanta Bai”. The repositioning indicates about the end of servant maid
despotism. The brand was repositioned as functional and relevant to the Indian housewife.
Case 4: Visa Card – the Positioning
In 1981, visa card was positioned in front of the customer with positioning statement “pay the
way the world does” to give its card about the feeling of global reach. Once the number of
cards launched was increased on the same theme, then in 1993 company repositioned itself as
“world’s most preferred card”. In 1995, to highlight the services company changed the
positioning statement to “Visa Power”. This focus on explaining the range of services
available with the card continues till date as “Visa power, go get it”.
The program “Lifebuoy Swastya Chetna” is an initiative run by Unilever in rural India to
train rural consumers on the value of personal hygiene and cleanliness. It positions the brand
as a germ-fighter because in rural area the common problem of hand-wash habits which
prevent dysentery. Another way Unilever positions the Lifebuoy from being a hygiene brand
to a health brand to reduce the chances of illness.
Tata Tea's latest "Jaago Re" campaign is another interesting example awakening
advertisement from the tea attributes of strength, taste and freshness. It has positioned as
awakening product to open the eyes and minds of an apathetic consumer group to both their
responsibilities and the social ills around them (voting and corruption).
There are many reasons for brand repositioning. Frequently stagnant sales are responsible for
repositioning exercises. Research has indicated several types of repositioning examining the
repositioning of several brands in Indian market such as growing significance to consumer,
augmenting use of occasions, building sober brand, decreasing sales, acquiring novel
customers, building the brand modern and fashionable, make the distinction between brands,
distorted market circumstances.
METHOD 4: Celebrity endorsements build brand
Celebrities are the individual who enjoy the warm recognition from the people and the fan.
The term Celebrity refers to an individual who is known to the public (actor, sports figure,
entertainer, etc.) for his or her achievements in areas other than that of the product endorsed
(Friedman and Friedman, 1979). Endorsement is a channel of communicating the brand to the
public. In brand endorsements celebrity acts as a spokesperson for that brand and certifies
about the brands capability to the customers. Aamir Khan in Coca Cola advertisement
certifies about the brand and point out that Thanda means Coca Cola.
In a market with a very high proliferation of local, regional and international brands, celebrity
endorsement was thought to provide a distinct differentiation (Roll, Martin, 2006).
McCracken's (1989) definition of a celebrity endorser is, "any individual who enjoys public
recognition and who uses this recognition on behalf of a consumer good by appearing with it
in an advertisement (marketing communications), is useful, because when celebrities are
depicted in marketing communications, they bring their own culturally related meanings,
thereto, irrespective of the required promotional role."
In India most likely the first advertisement endorsed by celebrities and still continuing for
long-term is the Lux soap (refer to Figure 4), is a brand and famous household name.
Recently it has been seen in the TV advertisement that Indian cine star Shahrukh Khan
endorsed the Hyundai Santro in the Indian market. Further, master-blaster Sachin Tendulkar
endorses the brands such as Pepsi in soft drinks, Boost in malted beverages, MRF in tyres,
Fiat Palio in cars, TVS Victor in two-wheelers, Colgate Total in toothpastes, Britannia in
biscuits, Visa in credit cards, Airtel in mobile services and Band-aid.
Celebrities may provide central information when an aspect of the celebrity matches the
product (as with beauty products and attractiveness; Kahle and Homer1985). Also, as
affective peripheral cues, celebrity endorsements may lead media weight to have an impact
on sales in mature categories (MacInnis, Rao, and Weiss 2002).
Kamins et al. (1989) indicated in his research that celebrities make advertisements credible
and increase message recall (Friedman and Friedman, 1979). Celebrities assist in the
acknowledgment of brand names (Petty, Cacioppo and Schumann 1983), create a positive
approach towards the brand (Kamins et al. 1989). Celebrity endorsements are assumed to
generate a greater likelihood of customers choosing the endorsed brand (Heath, McCarthy
and Mothers-baugh 1994; Kahle and Homer 1985; Kamins et al. 1989; Ohnian 1991).
METHOD 5: Sponsoring the events develop brand building
Sponsorship is an opportunity to communicate with the desired target audience to promote
the brand. Sponsorship refers to “provision of assistance either financial or in kind to as
activity by a commercial organization for the purpose of achieving commercial objectives”
(Meenaghan, 1983). Sports sponsorship makes possible to link the aspiration and passion of a
target audience to specific sports (Arun, 2004). In general, sponsorship holds a unique
position in the marketing mix as effective in building brand awareness, providing
differentiated marketing platforms, facilitating direct business benefits and providing
valuable networking and hospitality opportunities (ADREVIEW). Companies are hunting
tangible benefits from their different sponsorship program includes increase in sales, product
sampling, signage rights, merchandising, networking, client entertainment, publicity,
generation of awareness and media coverage.
Mullin, Hardy and Sutton (2007) define the term sponsorship as ‘the acquisition of rights to
affiliate or directly associate with a product or event for the purpose of deriving benefits
related to that affiliation or association. Dolphin (2003) suggests several objectives that
companies might have for deciding to enter into a sponsorship such as
1. Enhancing corporate image
2. Increase brand awareness
3. Stimulate sales
4. Corporate reputation
5. Alter public perceptions
6. Build relationships
7. Create goodwill
8. Enhance employee motivation
The most powerful way to introduce a new product or technology is publicity. Publicity is
more credible as well as more cost-effective than advertising. A sponsorship can be the
necessary lever to elevate the news value of a product or technology so that press coverage
results. The visibility of the product can also enhance the link between the brand and the
event (Aaker & Joachimsthaler 2000). Meenaghan (1994) indicated in his research that
sponsorship is an investment in the team, player or an event to associate commercially to
increase the visibility and top line of the company. Companies do the sponsorship to increase
the appeal of their brand in the market. Considering the example of Nike, this used a superior
resource, basket ball superstar Michael Jordan to produce a sustainable competitive
advantage. During a careful promotional campaign Nike made its “Air Jordan” range of
athletic footwear the biggest selling athletic shoe of all time.
Case: Hyundai builds brand with extended World Cup sponsorship
Sponsoring the World Cup has helped Hyundai raise its brand value. The automaker is
ranked 65 in the 100 best global brands by the brand consultancy Interbrand.
“According to the Interbrand consultancy, Hyundai has raised its brand value by 9.3 percent
in the last year, putting it just behind Volkswagen AG's Audi at No. 8 in the consultancy's
automaker listing, ahead of Porsche AG. The automaker has been very successful in building
its brand in major auto markets such as the United States and China and in emerging markets,
due in part to aggressive marketing actions, Interbrand said. In the U.S., Hyundai has created
a strong brand value with its sponsorship of the NFL Super Bowl, the Academy Awards and
the opening round of the PGA golf tournament in Hawaii.”
Interpretation
The paper is an attempt to note or construct the concepts that help to build the brand in
different ways and equally assist to evaluate the older brand building techniques. Research
has indicated that brand can be build using different approaches such as direct advertisement,
co-branding, repositioning, celebrity endorsements and sponsorship.
Research has pointed that TV advertisement build brand. It has been seen from the recent TV
advertisement of Maaza as well as brand equity survey indicated that Maaza have become in
8th
position in 2012 as compared to 2011 ranked 32. Co-branding or partnership branding
increases the demand of product among customers. Research have highlighted that McDonald
have a co-branding with Coca Cola and it has increases the sales of both the brands. Brand
repositioning is the key to build the ailing brand. Research have indicated that Dettol soap,
lipton yellow label tea, Visa Card all of them have undergone major repositioning. Majorly
companies do the repositioning due to stagnant sales. Celebrity endorsements play the
primary role in brand building. Coca Cola advertisements have shown that how Aamir Khan
is endorsing the brand and communicating the message Thanda means Coca Cola.
Considering the example of Lux soap endorsed by the celebrities and the process assist Lux
to become a household name in India. Research has indicated that celebrities make the
advertisements credible and increase the message of the brand. Sponsoring any events
facilitate to build brand. Sports sponsoring such World Cup Cricket event, Word Cup
Football event and even Tweenty20 Cricket event designate about the brand promotion by
different companies. Facts point out that sponsoring the world cup (FIFA) has helped
Hyundai raise its brand value. Brand consultancy Interbrand survey 2010 emphasize that
Hyundai automaker is ranked 65 in the 100 best global brands.
Considering the example of Canon, it has been seen that the company has adopted different
techniques for brand building. As a part of Corporate Social Responsibility, Canon had
launched the Green Cycle Program in 2010 for Printer and Cartridge E-Waste management.
Canon has tied up with authorized E-Waste recycler TIC Group India Pvt Ltd who would be
collecting and disposing the e-waste from the 45 OIC's. In addition, Canon initiated the 1
Month eye screening camp i-Care in 2011, and also undertook the initiative of making
Gurgaon green by planting more and more trees in Gurgaon. The company is expected to
invest over 35 lacs towards CSR activities this year.
Suggestions
Companies should decide on the following approach to build the brand:
Companies should go for regional outreach programmes and the campaign should be
a mix of above the-line (ATL) and below-the-line (BTL) activities to promote the
brand.
Companies should organize road shows and exhibitions as well as should give the
customer live experience of the products before they buy.
Companies should reach to the distribution channels for knowledge and sharing to
build brand.
Even the company should start the program such as know your customer (KYC)
program to get the better idea / insight about customers.
Now days, companies are trying to build their brand through Facebook, Twitter,
Linkedin, Youtube.
Companies are focusing on print (magazines and newspapers both), television, digital
(Internet) and out of Home (OOH) to promote the brand.
As a brand building strategy companies should honor their employees who have
completed the tenure 5-10 years. Further, a company should create a cell or club for
existing old employees to motivate or retain them in the organization.
Conclusion
The development of branding activities has radically changed the businesses and connected
the global market through business or product promotion. The new approach of brand
building has given rise to new ways of product promotion. Brand building allows the
managers and executives to in aspects such as development of market and product, which has
increases the brands market share in the competitive market and made them more available in
the global market.
Current research has indicated that brand building techniques will aid in promoting the brand
and the process will attract consumers and develop markets. Brand managers are thinking in
different ways in the competitive market to attract target consumers. This study will help
brand managers to understand the techniques of brand building by analyzing the approaches
adopted by Lux, Addidas, ITC, and Kingfisher to expand their customer base. As a result, this
study shows that there is an effect that brand building has an impact on increase of brand
value of the brands. This study will help brand managers to make different strategies for
overcoming the limitation of brand building techniques by knowing the different
characteristics.
Scope for Future Research:
As the review conducted was only confined to secondary data and internal company data,
results may vary if research is conducted with the help of primary data. If the survey is
conducted all over India, results may substantial differ. As the research was conducted from
existing secondary and internal company information, the result may not be the same if the
survey is conducted by using other company or brand information details.
References
Aaker, D. A. & Keller, K. L. (1990), “Consumer evaluations of brand extensions”,
Journal of Marketing, Vol. 54, No. 1, pp 27-41.
Aaker, David A. & Joachimsthaler, Erich (2000), Brand Leadership, Free Press, 2002.
Akula, R. (2008), “Co-Branding - An Innovative Strategy in Management”, Indian
Journal of Marketing, Vol. 38, No. 6
Arun, Sudhaman (2004), “Game, Set and Client Match”, Media Asia, May 9,
pp 28-29.
Cohen, B. and Murphy, Gregory L. (1984), “Models of Concepts”, Cognitive Science,
Vol. 8, No. 1, pp 27–58.
Dolphin, Richard R. (2003), “Sponsorship: Perspectives on its Strategic Role”, An
International Journal, Vol. 8, No.3, pp 173-186.
Eysenck, Michael W. and Keanne, Mark T. (1990), Cognitive Psychology, Lawrence
Erlbaum Associates, London, pp 50-100.
Fineweek (2007), “Big Bucks Still Back Sponsorship” ADREVIEW, pp 72-73.
Friedman, Hershey H. and Friedman, Linda (1979), "Endorser Effectiveness by
Product Type", Journal of Advertising Research, Vol. 19, No. 5, pp 63-71.
Grossman, R. P. (1997), “Co-branding in advertising”, Journal of Product Brand
Management, Vol. 6, No. 3, pp 191-201.
Hampton, James E. (1987), “Inheritance of Attributes in Natural Concept
Conjunctions”, Memory and Cognition, Vol. 15, No. 1, pp 55–71.
Heath, Timothy B., McCarthy, Michael S., and Mother-baugh, David L. (1994),
“Spokesperson Fame and Vividness Effects in the Context of Issue-Relevant
Thinking: The Moderating Role of Competitive Setting”, Journal of Consumer
Research, Vol. 20 (March), pp 520-34.
Kahle, Lynn B. and Homer, Pamela M. (1985), “Physical Attractiveness of Celebrity
Endorsers: A Social Adaptation Perspective”, Journal of Consumer Research, Vol.11
(March), pp 954-61.
Kamins, Michael A., Brand, Meribeth J., Hoeke, Stuwart A., and Moe, John C.
(1989), “Two-sided versus one-sided Celebrity Endorsements: The Impact on
Advertisement Effectiveness and Credibility”, Journal of Advertising, Vol. 18, No. 2,
pp 4-10.
MacInnis, D.J., Rao, A., and Weiss, A.M. (2002), “Assessing When Increased Media
Weight. Helps Sales of Real World Ads”, Journal of Marketing Research, Vol. 39,
No. 4, pp 391–407.
Majumdar, Ramanuj (2005), Product Management in India, Prentice Hall of India,
New Delhi.
McCracken, G. (1989), "Who is the Celebrity Endorser? Cultural Foundation of the
Endorsement Process", Journal of Consumer Research, Vol. 16 (December), pp 310-
321.
Mehdi, Mokhalles M. (2013), “Co-branding: A Case Study of Micromax and MTV”,
Indian Journal of Marketing, Vol. 43, No. 6, pp 54-60.
Meenaghan, John A. (1983), “Commercial Sponsorship”, European Journal of
Marketing, Vol. 17, No.7, pp 5-73.
Meenaghan, T. (1994), “Point of view: ambush marketing: immoral or imaginative
practice?”, Journal of Advertising Research, Vol. 34, pp. 77-88.
Mullin, Bernard J., Hardy, Stephen & Sutton, William A. (2007), Sport Marketing,
3rd ed. Champaign: Human Kinetics, cop. 2007.
Ohnian, Roobina (1991), “The impact of Celebrity Spokesperson Perceived Image on
Consumers’ Intention to Purchase”, Journal of Advertising Research, Vol. 31
(February/March), pp 46-54.
Park, C. Whan, Jun, Sung Youl and Shocker, Allan D. (1996), “Composite Brand
Alliances: An Investigation of Extension and Feedback Effects”, Journal of
Marketing Research, Vol. 33, No. 4, pp 453–466.
Petty, Richard E., Cacioppo, John T. and Schumann, David (1983), “Central and
Peripheral Routes to Advertising Effectiveness: The moderating role of involvement,”
Journal of Consumer Research, Vol. 10 (September), pp 135-46.
Rao, Akshay R. and Ruekert, Robert W. (1994), “Brand Alliances as Signals of
Product Quality”, Sloan Management Review, No. 36, No. 1, pp 87–97.
Roll, M. (2006), Asian Brand Strategy How Asia Builds Strong Brands, Palgrave
Macmillan, New York, NY, pp. 74-94.
http://www.afaqs.com/advertising/creative_showcase/?id=35135&media=TV,
accessed on June 5, 2013
Better branding, accessed on May 20, 2013
http://www.mckinsey.com/insights/marketing_sales/better_branding
http://www.canon.co.in/personal/web/company/about, accessed on April 25, 2013
http://europe.autonews.com/apps/pbcs.dll/article?AID=/20101208/ANE/101209865/1
198#axzz2aEUk6cwQ) , accessed on April 30, 2013
http://www.livemint.com/Leisure/jcy2jbHxGtsrpgD5HnBgCK/Spot-light--
Maaza.html, accessed on June 10, 2013
Most trusted brands of 2012, accessed on July 22, 2013
http://economictimes.indiatimes.com/features/brand-equity/most-trusted-brands-2012-
how-mango-drink-maaza-left-behind-colas-in-the-survey/articleshow/17111477.cms
http://www.rediff.com/money/column/new-techniques-of-brand-
building/20100702.htm, accessed on April 30, 2013
Repositioning is a strategy to build better brand, accessed on May 20, 2013
http://drypen.in/branding/brand-repositioning-and-types-of-brand-repositioning.html
What is New Maaza, accessed on July 22, 2013 http://www.coca-
colaindia.com/presscenter/whats_new-Maaza.html
Disclaimer
The comments and the perception about different brands or companies are author’s individual

comments and do not intend to criticize any brand or any company.
Role of Educational Institutions in Shaping the Future of a Country
Dr. Mahadappa G. Gonda
Principal, Ramsheth Thakur College of Commerce & Science
Kharghar, Navi Mumbai
---------------------------------------------------------------------------------------------------------------------
Abstract
A country is made up of not just with geographical boundaries or physical resources in that
geographical area but it is made up of the people who live together in a geographical area whose
boundaries are fixed and accepted globally. Thus a country is known and recognized by the type
of people, their values, attitude, skills, knowledge, and so on which they possess. Self
responsibility and self disciplined people of a country will become most valuable human asset of
a country and they can make the country developed. And it has been the responsibility of
educational institutions since ancient period to develop such valuable human asset of the country.
A country could get in the past good leaders, good doctors, real teachers, honest entrepreneurs,
good politicians, scientists, social workers etc. because the educational institutions were able to
play their role in this regard. Indian history reveals that the institutions like Nalanda, Taksha
sheela were world famous in developing such good human resource in olden days due to which
India was known as one of the developed country. Few countries in the globe today are known as
developed countries because of good educational institutions which developed good human
resource in those countries. Thus, shaping the future of a country more depends on the type of
people and the educational institutions have to play a very critical role in developing their
people. An attempt is made in this article to analyze the role of educational institutions in
shaping the future of India.
---------------------------------------------------------------------------------------------------------------------
Key Words: educational institutions, human asset, country, shaping the future

Introduction
Institutions, including educational institutions, which exist in a country have a specific role to
play and are expected to perform a particular responsibility for which they have been established.
And the role of educational institutions is to develop good human resource which will become
human capital for the job market. The educational institutions are expected to impart quality
education to the youth with certain human and ethical values so that the youth will become
responsible citizens. All types of institutions, like commercial, financial, manufacturing,
political, social, educational, research etc. are to exist and function in a country. And all such
institutions have been making use of the national resources for their survival and growth. If all
these institutes play their role and if they become self responsible, undoubtedly, that country will
develop and prosper. However among all the institutes in a country, the educational institutions
have a very vital role to play in developing right type of human resource who will become
responsible for effective functioning of other institutions.
The countries in the world since ancient period have been known and recognized by the type of
people who live in a country. India once up on a time was known as one of the most prosperous,
happiest and developed country in the world. Educational institutions like Nalanda and
Takshashila were capable of developing knowledgeable people who ultimately were able to rule
the country through various institutions to make it a good nation. The educational and social
institutions in those days in India were playing their role of developing good human resource
who ultimately become as asset. Due to self responsible and self disciplined people they
accepted certain responsibility as businessmen, politicians, teachers, and so on and made
effective use of the national resources for the welfare of the society. Thus countries can become
developed or remain underdeveloped because of their human resource rather than the physical
and infrastructural resources. However physical and infrastructural resources are also equally for
developmental activities but they can be developed if good human resources exist in the country.
And it is the prime and final responsibility of educational institutions to develop such good
human resource. An attempt is made in the present study to analyze to what extent the
educational institutions in India have been playing their real role in the present era in developing
good human resource.
Objectives of the Study
Education in general and higher education in particular is an important element and fundamental
input in the process of conversion of general population to human resource. And the activity of
developing good human resource will be possible only when quality education and relevant
education is imparted to the students by the educational institutions. Therefore the educational
institutions of a country need to become more responsible, transparent and need to play their true
role in the society for the better future of a country. An attempt is made in the present study to:
Analyze to what extent the educational institutions are playing their role in the process of
developing human resources
Analyze and understand the fundamental reasons of un-employability of the present
graduates
Make certain recommendations to the stake holders of higher education for making
higher education more useful for the youth
Research Methodology
The present study is mainly based on the secondary source of information like research articles
published by researchers in different types of research journals, information published in leading
national news papers like ‘the economic times’ and observations of the experts in the area of
education and recruiters from corporate sector. The researcher himself has been working in
higher education since last 31 years and has been making micro level experiments to develop
better graduates; his observations based on the experiments were also considered for the present
article. The researcher has accumulated first hand information through discussion with the stake
holders like principals/directors of the colleges/institutions and researchers of higher education
about the quality and relevance of higher education. Feedback on employability skills of the
candidates has been taken from the recruiters of corporate sector during campus placements and
during visit to HR personnel during summer internship of students of management courses.
Government resolutions on quality enhancement strategies like establishment of model
universities in each state and a model college in each district, introduction of Rashtriy Uchhatar
Shiksha Abhiyan (RUSA) are also used a source of information. The regulatory bodies in higher
education like University Grants Commission (UGC), All India Council for Technical Education
(AICTE), National Assessment and Accreditation Council (NAAC), National Board for
Accreditation (NBA), Association of Indian Universities (AIU) have been publishing the
quantitative data and qualitative information through their annual reports and through special
issues about higher education. Annual reports of state universities are also part of the secondary
source of information. The University News, a research journal exclusively devoted for
publishing the research articles on higher education in India has been the source of information.
Information and communication technology (ICT) has been an important source for data
collection.
Scope of the Present Study
The present study is confined mainly with the study of educational institutions of higher
education in Indian education system. Though there are four basic levels in education system in
India, like elementary education, secondary education, higher secondary education and higher
education, higher education is at the apex of Indian education system. All these levels in
education system are interrelated and interdependent and all are important in process of effective
education system. Ultimately the higher education is expected to teach certain job skills and
make the person knowledgeable so as to take some job for the welfare of the nation. Thus the
higher education and the institutions of higher education are to impart quality education so that
responsible human resources can be developed.
Review of Literature
The main role of educational institutions is to impart quality education to the young generation
so as to make them more valuable and useful for the country (Rashmi Soni, University News
2012). As per her article, higher education is responsible for training future professionals to
occupy strategic positions in the society. Consequently, the universities play a fundamental and
decisive role in enhancing knowledge, values and skills in the students. Higher education is a
powerful tool to build modern, value based, knowledge based, culture based, peaceful society
which can lead the country towards becoming superpower in the world (Satbir Singh Sehrawat
2012). Ved Prakash, former chairman of UGC said in his convocation address at B. R.
Ambedkar Open University, Hyderabad, on 20th
April 2012 ‘the goals of higher are to expand
the frontier of knowledge, share knowledge and enable the society to enjoy the fruits of their
intellectual pursuit’. Pratibha Patil, past president of India said in her convocation address at
Symbiosis International University, Pune on 3rd
Dec 2011, education should aim the youth to
become intellectually competent and technically skilled. Education without values is incomplete.
Education should impart values to the youth that makes them sensitive to fellow human beings.
The term education as per J Krishnamurthy ‘is a process of making a man to total human being
which means who is good in inward understanding like knowledge, capacity to perform and also
good in what he does outwardly (society)’by (Indira Sharma and Sonam Mehta 2013). He
further said that education is to prepare students for the actual life they are going to face in the
world with lots of opportunities and challenges. ‘Producing employable graduates is an
important responsibility of the university, but it is not sole responsibility and not in every case,
even its main responsibility’ said by Andre Beteille, chairman of ICSSR, in his convocation
speech at National University of juridical Kolkata, Feb 2010. The first prime minister of
independent India, Pandit Jawaharlal Neharu mentioned, ‘A university stands for humanism, for
tolerance for progress, for the adventure of ideas and the search for truth. If universities
discharge their duties adequately then it is well with the nation and the people. But if the temple
of learning itself becomes a home of narrow bigotry and petty objectives, how then will the
nation prosper or a people grow in stature’? (Jawaharlal Neharu, speeches, vol-1, 1958, GOI,
Publication)
APJ Abdul Kalam in his document India 2020, has mention ‘a mission of transforming India into
a developed nation has identified education as one of the core competencies among the five,
health and agriculture. Educational institutions are expected to become centres of change and
innovations and are expected to bring transformation in the society. Dr. D. S. Kothari, chairman
of Education Commission, has mentioned in education report 1966, ‘India’s destiny is being
shaped in four walls.’(education report document 1966). Which means India’s Future is being
shaped in four walls of the educational institutions. Though the system of imparting education
has been changing due to revolution in Information and Communication Technology (ICT), class
room teaching still retains its importance in the process of teaching and learning.
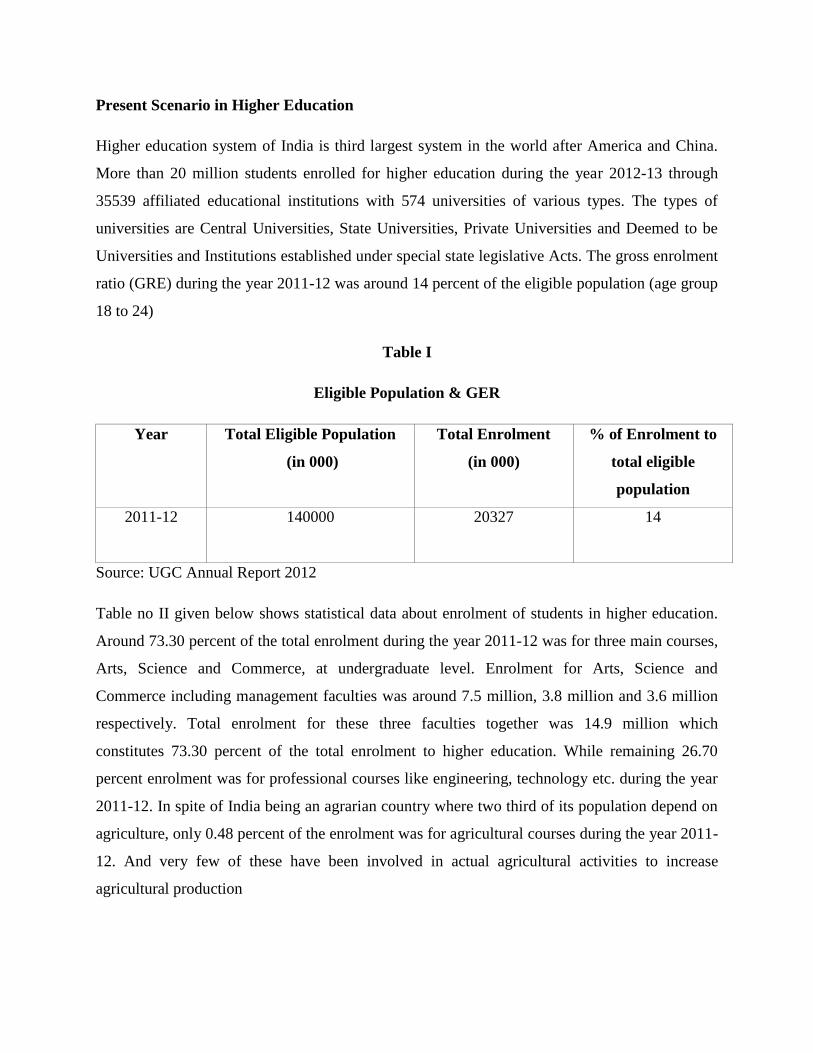
Present Scenario in Higher Education
Higher education system of India is third largest system in the world after America and China.
More than 20 million students enrolled for higher education during the year 2012-13 through
35539 affiliated educational institutions with 574 universities of various types. The types of
universities are Central Universities, State Universities, Private Universities and Deemed to be
Universities and Institutions established under special state legislative Acts. The gross enrolment
ratio (GRE) during the year 2011-12 was around 14 percent of the eligible population (age group
18 to 24)
Table I
Eligible Population & GER
Year Total Eligible Population
(in 000)
Total Enrolment
(in 000)
% of Enrolment to
total eligible
population
2011-12 140000
20327 14
Source: UGC Annual Report 2012
Table no II given below shows statistical data about enrolment of students in higher education.
Around 73.30 percent of the total enrolment during the year 2011-12 was for three main courses,
Arts, Science and Commerce, at undergraduate level. Enrolment for Arts, Science and
Commerce including management faculties was around 7.5 million, 3.8 million and 3.6 million
respectively. Total enrolment for these three faculties together was 14.9 million which
constitutes 73.30 percent of the total enrolment to higher education. While remaining 26.70
percent enrolment was for professional courses like engineering, technology etc. during the year
2011-12. In spite of India being an agrarian country where two third of its population depend on
agriculture, only 0.48 percent of the enrolment was for agricultural courses during the year 2011-
12. And very few of these have been involved in actual agricultural activities to increase
agricultural production
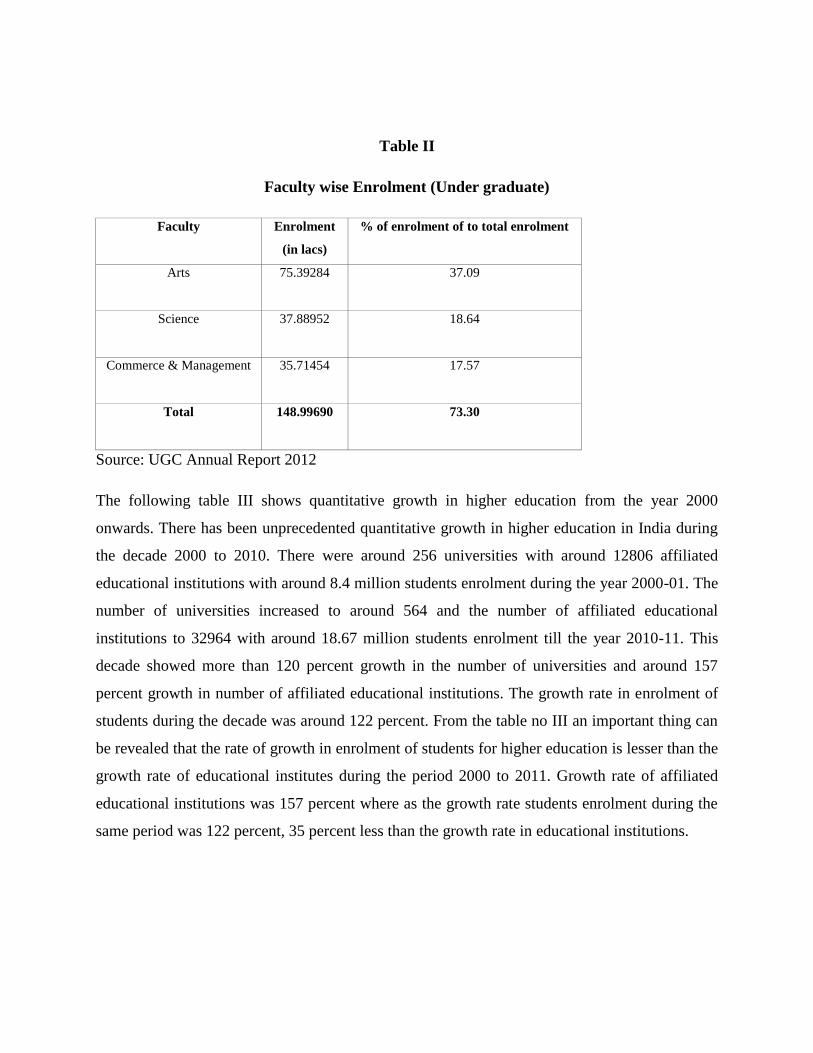
Table II
Faculty wise Enrolment (Under graduate)
Faculty Enrolment
(in lacs)
% of enrolment of to total enrolment
Arts 75.39284 37.09
Science 37.88952 18.64
Commerce & Management 35.71454 17.57
Total 148.99690 73.30
Source: UGC Annual Report 2012
The following table III shows quantitative growth in higher education from the year 2000
onwards. There has been unprecedented quantitative growth in higher education in India during
the decade 2000 to 2010. There were around 256 universities with around 12806 affiliated
educational institutions with around 8.4 million students enrolment during the year 2000-01. The
number of universities increased to around 564 and the number of affiliated educational
institutions to 32964 with around 18.67 million students enrolment till the year 2010-11. This
decade showed more than 120 percent growth in the number of universities and around 157
percent growth in number of affiliated educational institutions. The growth rate in enrolment of
students during the decade was around 122 percent. From the table no III an important thing can
be revealed that the rate of growth in enrolment of students for higher education is lesser than the
growth rate of educational institutes during the period 2000 to 2011. Growth rate of affiliated
educational institutions was 157 percent where as the growth rate students enrolment during the
same period was 122 percent, 35 percent less than the growth rate in educational institutions.
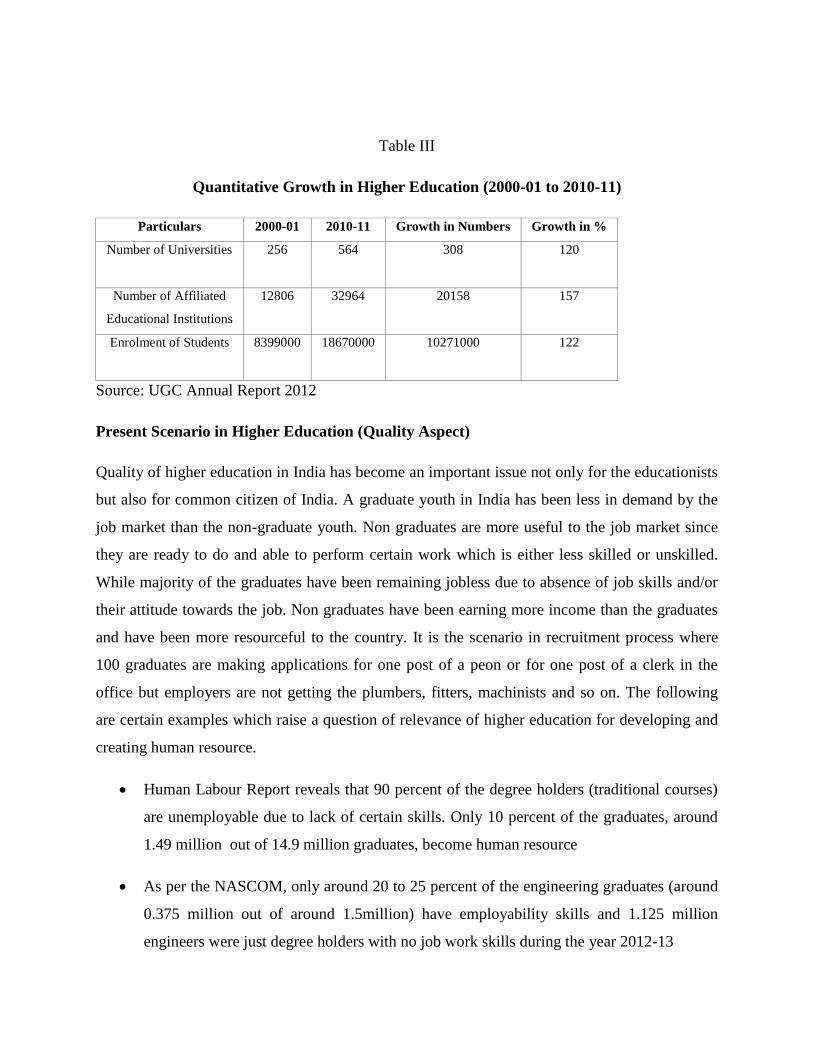
Table III
Quantitative Growth in Higher Education (2000-01 to 2010-11)
Particulars 2000-01 2010-11 Growth in Numbers Growth in %
Number of Universities 256 564 308 120
Number of Affiliated
Educational Institutions
12806 32964 20158 157
Enrolment of Students
8399000 18670000 10271000 122
Source: UGC Annual Report 2012
Present Scenario in Higher Education (Quality Aspect)
Quality of higher education in India has become an important issue not only for the educationists
but also for common citizen of India. A graduate youth in India has been less in demand by the
job market than the non-graduate youth. Non graduates are more useful to the job market since
they are ready to do and able to perform certain work which is either less skilled or unskilled.
While majority of the graduates have been remaining jobless due to absence of job skills and/or
their attitude towards the job. Non graduates have been earning more income than the graduates
and have been more resourceful to the country. It is the scenario in recruitment process where
100 graduates are making applications for one post of a peon or for one post of a clerk in the
office but employers are not getting the plumbers, fitters, machinists and so on. The following
are certain examples which raise a question of relevance of higher education for developing and
creating human resource.
Human Labour Report reveals that 90 percent of the degree holders (traditional courses)
are unemployable due to lack of certain skills. Only 10 percent of the graduates, around
1.49 million out of 14.9 million graduates, become human resource
As per the NASCOM, only around 20 to 25 percent of the engineering graduates (around
0.375 million out of around 1.5million) have employability skills and 1.125 million
engineers were just degree holders with no job work skills during the year 2012-13
Government aided educational institutions have been performing their duty just to fulfill
the conditions of the regulatory bodies to get regular grants from the government. And
the unaided (self funding) institutions have profit making approach from the education
and the task of converting population in to human resource has been taken very casual in
majority of all these institutions
Around 0.18 million MBAs were not able to get jobs as per their degree during the year
2012-13, one of the reasons was lack of skills to perform specific job. This shows
management education has become less relevant to the job market
Around 40 percent of the seats remained unfilled in the educational institution of
engineering and management courses during the year 2012-13 for non availability of
candidates. These degrees do not guarantee jobs to recover the cost of their education
The Maharashtra Public University Act 2011 (revised) has urged that ‘there is a need for
the relevant and quality education with appropriate skills’
The central government has designed a strategy known as ‘Rastriy Uchchatar Shiksha
Abhiyan’ (RUSA) to transform higher education, particularly improve quality of higher
education
The central government has taken steps of establish a Model University in each state and
a Model College in each district for improving the quality of higher education
Thousands of students have been enrolling with foreign universities for higher education
considering the quality of higher education in those countries guarantees job with good
salary in a global organization
Annual report of the American Institute of International Education ‘open door 2008’
stated that, 15 percent of the total students went to America for higher studies were from
India. And the main reason for this brain drain was the scarcity of adequate number of
high quality educational institutions in the native country
Not a single institution of higher education is in the list of top 200 institutions in the
world due to lack of global level standards in education
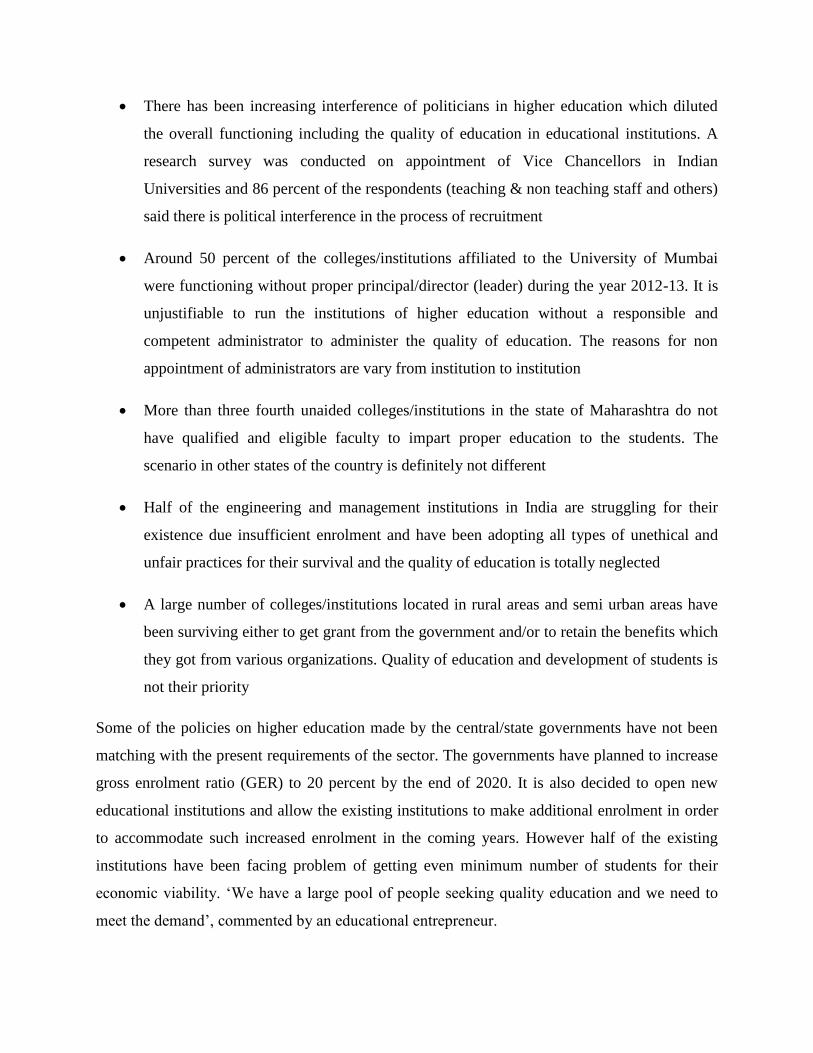
There has been increasing interference of politicians in higher education which diluted
the overall functioning including the quality of education in educational institutions. A
research survey was conducted on appointment of Vice Chancellors in Indian
Universities and 86 percent of the respondents (teaching & non teaching staff and others)
said there is political interference in the process of recruitment
Around 50 percent of the colleges/institutions affiliated to the University of Mumbai
were functioning without proper principal/director (leader) during the year 2012-13. It is
unjustifiable to run the institutions of higher education without a responsible and
competent administrator to administer the quality of education. The reasons for non
appointment of administrators are vary from institution to institution
More than three fourth unaided colleges/institutions in the state of Maharashtra do not
have qualified and eligible faculty to impart proper education to the students. The
scenario in other states of the country is definitely not different
Half of the engineering and management institutions in India are struggling for their
existence due insufficient enrolment and have been adopting all types of unethical and
unfair practices for their survival and the quality of education is totally neglected
A large number of colleges/institutions located in rural areas and semi urban areas have
been surviving either to get grant from the government and/or to retain the benefits which
they got from various organizations. Quality of education and development of students is
not their priority
Some of the policies on higher education made by the central/state governments have not been
matching with the present requirements of the sector. The governments have planned to increase
gross enrolment ratio (GER) to 20 percent by the end of 2020. It is also decided to open new
educational institutions and allow the existing institutions to make additional enrolment in order
to accommodate such increased enrolment in the coming years. However half of the existing
institutions have been facing problem of getting even minimum number of students for their
economic viability. ‘We have a large pool of people seeking quality education and we need to
meet the demand’, commented by an educational entrepreneur.
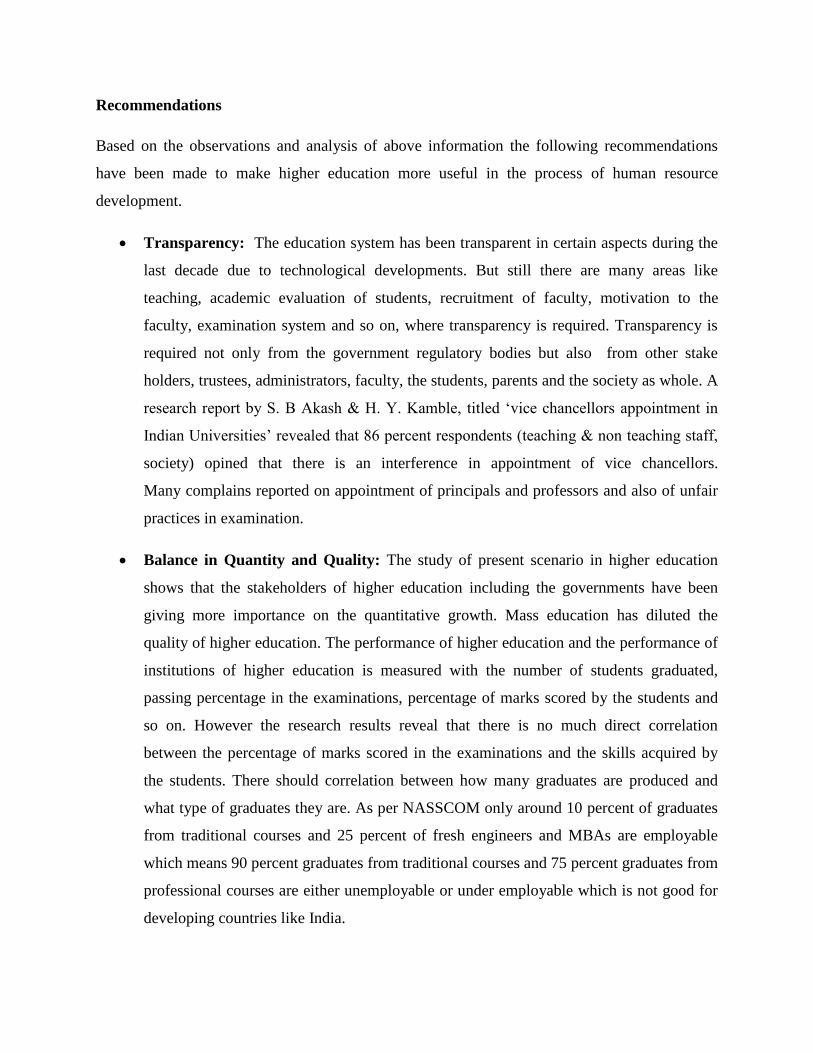
Recommendations
Based on the observations and analysis of above information the following recommendations
have been made to make higher education more useful in the process of human resource
development.
Transparency: The education system has been transparent in certain aspects during the
last decade due to technological developments. But still there are many areas like
teaching, academic evaluation of students, recruitment of faculty, motivation to the
faculty, examination system and so on, where transparency is required. Transparency is
required not only from the government regulatory bodies but also from other stake
holders, trustees, administrators, faculty, the students, parents and the society as whole. A
research report by S. B Akash & H. Y. Kamble, titled ‘vice chancellors appointment in
Indian Universities’ revealed that 86 percent respondents (teaching & non teaching staff,
society) opined that there is an interference in appointment of vice chancellors.
Many complains reported on appointment of principals and professors and also of unfair
practices in examination.
Balance in Quantity and Quality: The study of present scenario in higher education
shows that the stakeholders of higher education including the governments have been
giving more importance on the quantitative growth. Mass education has diluted the
quality of higher education. The performance of higher education and the performance of
institutions of higher education is measured with the number of students graduated,
passing percentage in the examinations, percentage of marks scored by the students and
so on. However the research results reveal that there is no much direct correlation
between the percentage of marks scored in the examinations and the skills acquired by
the students. There should correlation between how many graduates are produced and
what type of graduates they are. As per NASSCOM only around 10 percent of graduates
from traditional courses and 25 percent of fresh engineers and MBAs are employable
which means 90 percent graduates from traditional courses and 75 percent graduates from
professional courses are either unemployable or under employable which is not good for
developing countries like India.
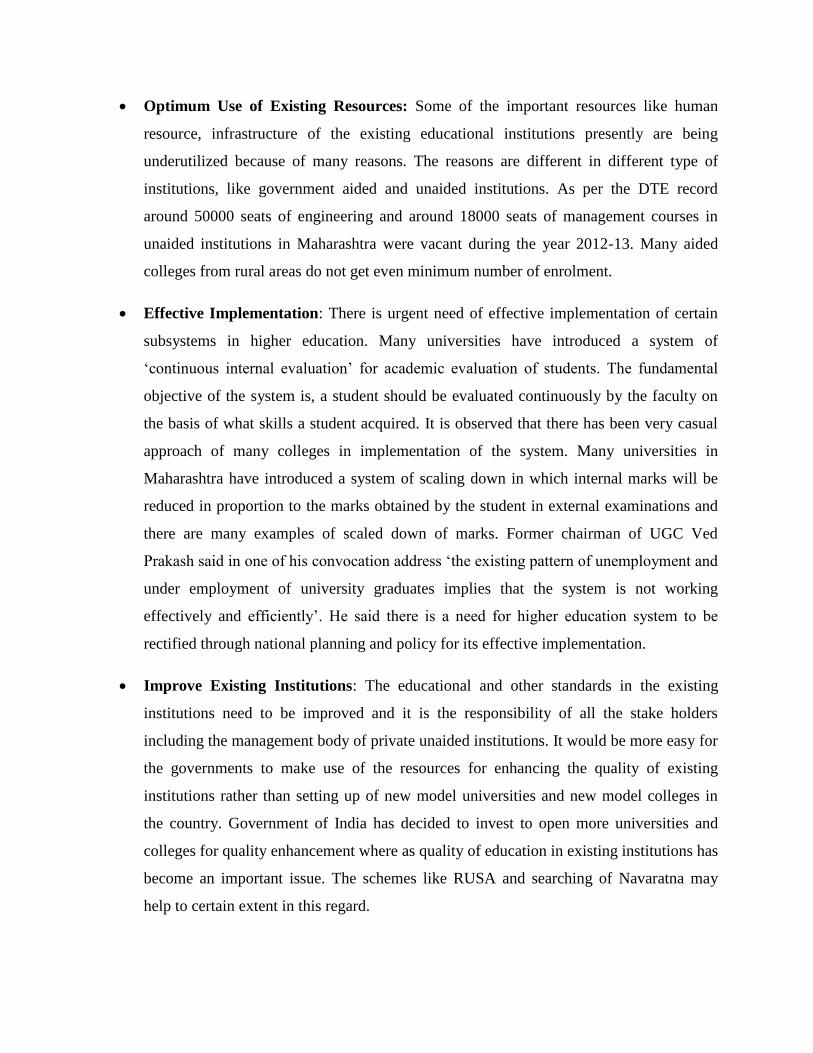
Optimum Use of Existing Resources: Some of the important resources like human
resource, infrastructure of the existing educational institutions presently are being
underutilized because of many reasons. The reasons are different in different type of
institutions, like government aided and unaided institutions. As per the DTE record
around 50000 seats of engineering and around 18000 seats of management courses in
unaided institutions in Maharashtra were vacant during the year 2012-13. Many aided
colleges from rural areas do not get even minimum number of enrolment.
Effective Implementation: There is urgent need of effective implementation of certain
subsystems in higher education. Many universities have introduced a system of
‘continuous internal evaluation’ for academic evaluation of students. The fundamental
objective of the system is, a student should be evaluated continuously by the faculty on
the basis of what skills a student acquired. It is observed that there has been very casual
approach of many colleges in implementation of the system. Many universities in
Maharashtra have introduced a system of scaling down in which internal marks will be
reduced in proportion to the marks obtained by the student in external examinations and
there are many examples of scaled down of marks. Former chairman of UGC Ved
Prakash said in one of his convocation address ‘the existing pattern of unemployment and
under employment of university graduates implies that the system is not working
effectively and efficiently’. He said there is a need for higher education system to be
rectified through national planning and policy for its effective implementation.
Improve Existing Institutions: The educational and other standards in the existing
institutions need to be improved and it is the responsibility of all the stake holders
including the management body of private unaided institutions. It would be more easy for
the governments to make use of the resources for enhancing the quality of existing
institutions rather than setting up of new model universities and new model colleges in
the country. Government of India has decided to invest to open more universities and
colleges for quality enhancement where as quality of education in existing institutions has
become an important issue. The schemes like RUSA and searching of Navaratna may
help to certain extent in this regard.
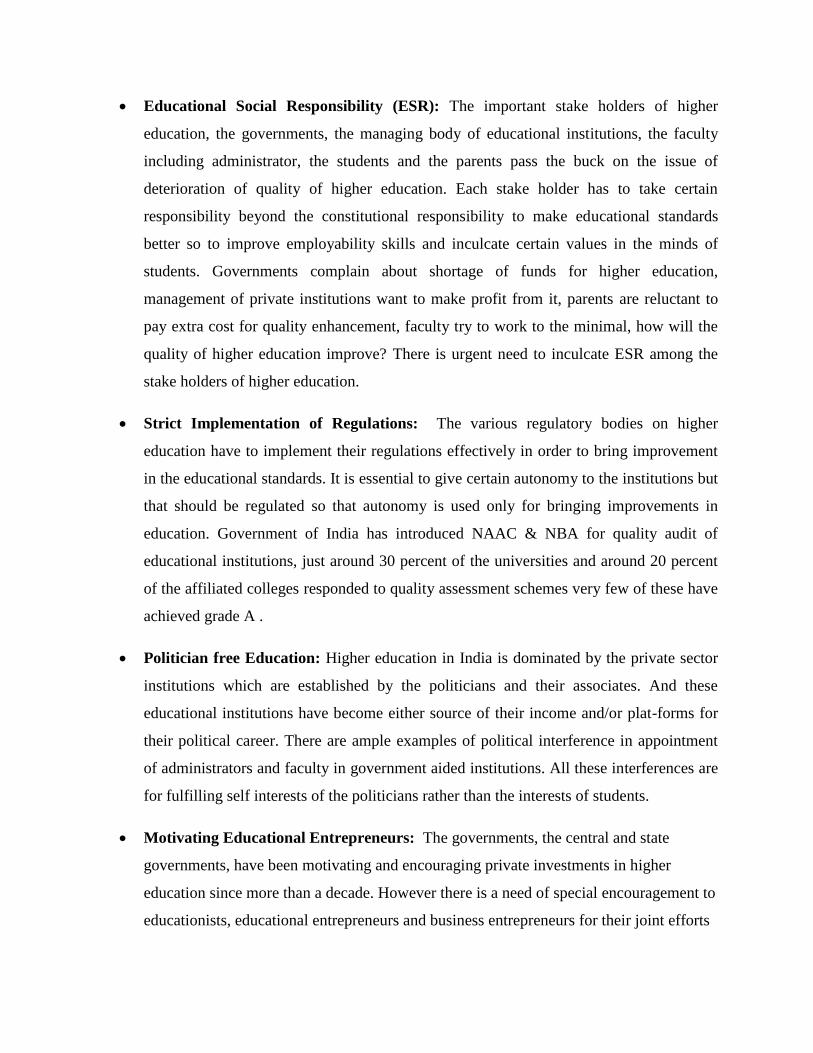
Educational Social Responsibility (ESR): The important stake holders of higher
education, the governments, the managing body of educational institutions, the faculty
including administrator, the students and the parents pass the buck on the issue of
deterioration of quality of higher education. Each stake holder has to take certain
responsibility beyond the constitutional responsibility to make educational standards
better so to improve employability skills and inculcate certain values in the minds of
students. Governments complain about shortage of funds for higher education,
management of private institutions want to make profit from it, parents are reluctant to
pay extra cost for quality enhancement, faculty try to work to the minimal, how will the
quality of higher education improve? There is urgent need to inculcate ESR among the
stake holders of higher education.
Strict Implementation of Regulations: The various regulatory bodies on higher
education have to implement their regulations effectively in order to bring improvement
in the educational standards. It is essential to give certain autonomy to the institutions but
that should be regulated so that autonomy is used only for bringing improvements in
education. Government of India has introduced NAAC & NBA for quality audit of
educational institutions, just around 30 percent of the universities and around 20 percent
of the affiliated colleges responded to quality assessment schemes very few of these have
achieved grade A .
Politician free Education: Higher education in India is dominated by the private sector
institutions which are established by the politicians and their associates. And these
educational institutions have become either source of their income and/or plat-forms for
their political career. There are ample examples of political interference in appointment
of administrators and faculty in government aided institutions. All these interferences are
for fulfilling self interests of the politicians rather than the interests of students.
Motivating Educational Entrepreneurs: The governments, the central and state
governments, have been motivating and encouraging private investments in higher
education since more than a decade. However there is a need of special encouragement to
educationists, educational entrepreneurs and business entrepreneurs for their joint efforts
to set up good institutions of higher education and to improve the quality of education in
the existing institutions. Eg Azim Premji foundation, Infosys Foundationetc.
References
Ashoka University, Private University, The Economic Times, dated 27th
Sept, 2013
Editor (2013) ‘ Rashtriya Uchachatar Shiksha Abhiyan’ University News, 51 (28) July
15-21, 2013, pages 61-95
Executive Summary (2013) ‘ Rashtriya Uchachatar Shikshs Abhiyan: National Higher
Education Development, Ministry of Human Resource Development in Association with
Tata Institute of Social Sciences’ University New 51 (28) July 15-21, 2013, pages 13-60
Jayanti S. Ravi (2013) ‘Pathway for Transformation of Higher Education’ University
News, Vol. 51 (28) July 15-21, page 8-12
J. Krishnamurthi (2013) ‘A New Horizon of Holistic Education’ University New, Vol.
51(31), Aug. 5-11, pages 3-6
K. Viyyanna Rao (2012) ‘An approach to Twelfth Five Year Plan, the UGC Roadmap’
University News, Vol. 50 (27), July 02-08-2012, page 1
Kamlesh Gupta & Manjeri Dameli (2013) ‘Contemporary Challenges in Higher
Education’ University News Vol. 51(32), Aug 12-18, pages 11-18
Mahadappa Gonda (2012) ‘ Sustainable Growth of Emerging Economies & Human
Resource, Indian Perspective’ Research Proceeding book, SIMSARC 2012, page 535-
541
Mahadappa Gonda (2012) ‘ Human Resource Development & Higher Education’ Journal
of Management Development & Research, Vol. II Issue 2, Dec 2012, page 61-68
S. B. Akash & H. Y. Kamble (2013) ‘Vice Chancellor’s Appointment in Indian
Universities’ University News Vol. 51(31), Aug 5-12, page 5-6
www.nmu.ac.in/portals/0/university act draft.pdf

www.ugc.ac.in/page/Annual-Report.aspx
www.ugc.ac.in/page/Annual-Report.apsx
The Economic Times, dated 28th
Sept, 2013
The Economics Times, dated 3rd
Oct, 2013