Embed Size (px)
Citation preview


Journal Editorial Board
Editor-in-Chief
Prof. Thomas Byeongnam YOON, PhD.
Founding Editor-in-Chief
ICACT Transactions on the Advanced Communications Technology (TACT)
Editors
Prof. Jun-Chul Chun, Kyonggi University, Korea Dr. JongWon Kim, GIST (Gwangju Institute of Science & Technology), Korea Dr. Xi Chen, State Grid Corparation of China, China Prof. Arash Dana, Islamic Azad university , Central Tehran Branch, Iran Dr. Pasquale Pace, University of Calabria - DEIS - Italy, Italy Dr. Mitch Haspel, Stochastikos Solutions R&D, Israel Prof. Shintaro Uno, Aichi University of Technology, Japan Dr. Tony Tsang, Hong Kong Polytechnic UNiversity, Hong Kong Prof. Kwang-Hoon Kim, Kyonggi University, Korea Prof. Rosilah Hassan, Universiti Kebangsaan Malaysia(UKM), Malaysia Dr. Sung Moon Shin, ETRI, Korea Dr. Takahiro Matsumoto, Yamaguchi University, Japan Dr. Christian Esteve Rothenberg, CPqD - R&D Center for. Telecommunications, Brazil Prof. Lakshmi Prasad Saikia, Assam down town University, India Prof. Moo Wan Kim, Tokyo University of Information Sciences, Japan Prof. Yong-Hee Jeon, Catholic Univ. of Daegu, Korea Dr. E.A.Mary Anita, Prathyusha Institute of Technology and Management, India Dr. Chun-Hsin Wang, Chung Hua University, Taiwan Prof. Wilaiporn Lee, King Mongkut’s University of Technology North, Thailand Dr. Zhi-Qiang Yao, XiangTan University, China Prof. Bin Shen, Chongqing Univ. of Posts and Telecommunications (CQUPT), China Prof. Vishal Bharti, Dronacharya College of Engineering, India Dr. Marsono, Muhammad Nadzir , Universiti Teknologi Malaysia, Malaysia Mr. Muhammad Yasir Malik, Samsung Electronics, Korea Prof. Yeonseung Ryu, Myongji University, Korea Dr. Kyuchang Kang, ETRI, Korea Prof. Plamena Zlateva, BAS(Bulgarian Academy of Sciences), Bulgaria Dr. Pasi Ojala, University of Oulu, Finland Prof. CheonShik Kim, Sejong University, Korea Dr. Anna bruno, University of Salento, Italy Prof. Jesuk Ko, Gwangju University, Korea Dr. Saba Mahmood, Air University Islamabad Pakistan, Pakistan Prof. Zhiming Cai, Macao University of Science and Technology, Macau Prof. Man Soo Han, Mokpo National Univ., Korea Mr. Jose Gutierrez, Aalborg University, Denmark
Copyright ⓒ 2017 GiRI (Global IT Research Institute)
Dr. Youssef SAID, Tunisie Telecom, Tunisia Dr. Noor Zaman, King Faisal University, Al Ahsa Hofuf, Saudi Arabia Dr. Srinivas Mantha, SASTRA University, Thanjavur, India Dr. Shahriar Mohammadi, KNTU University, Iran Prof. Beonsku An, Hongik University, korea Dr. Guanbo Zheng, University of Houston, USA Prof. Sangho Choe, The Catholic University of Korea, korea Dr. Gyanendra Prasad Joshi, Yeungnam University, korea Dr. Tae-Gyu Lee, Korea Institue of Industrial Technology(KITECH), korea Prof. Ilkyeun Ra, University of Colorado Denver, USA Dr. Yong Sun, Beijing University of Posts and Telecommunications, China Dr. Yulei Wu, Chinese Academy of Sciences, China Mr. Anup Thapa, Chosun University, korea Dr. Vo Nguyen Quoc Bao, Posts and Telecommunications Institute of Technology, Vietnam Dr. Harish Kumar, Bhagwant institute of technology, India Dr. Jin REN, North china university of technology, China Dr. Joseph Kandath, Electronics & Commn Engg, India Dr. Mohamed M. A. Moustafa, Arab Information Union (AIU), Egypt Dr. Mostafa Zaman Chowdhury, Kookmin University, Korea Prof. Francis C.M. Lau, Hong Kong Polytechnic University, Hong Kong Prof. Ju Bin Song, Kyung Hee University, korea Prof. KyungHi Chang, Inha University, Korea Prof. Sherif Welsen Shaker, Kuang-Chi Institute of Advanced Technology, China Prof. Seung-Hoon Hwang, Dongguk University, Korea Prof. Dal-Hwan Yoon, Semyung University, korea Prof. Chongyang ZHANG, Shanghai Jiao Tong University, China Dr. H K Lau, The Open University of Hong Kong, Honh Kong Prof. Ying-Ren Chien, Department of Electrical Engineering, National Ilan University, Taiwan Prof. Mai Yi-Ting, Hsiuping University of Science and Technology, Taiwan Dr. Sang-Hwan Ryu, Korea Railroad Research Institute, Korea Dr. Yung-Chien Shih, MediaTek Inc., Taiwan Dr. Kuan Hoong Poo, Multimedia University, Malaysia Dr. Michael Leung, CEng MIET SMIEEE, Hong Kong Dr. Abu sahman Bin mohd Supa'at, Universiti Teknologi Malaysia, Malaysia Prof. Amit Kumar Garg, Deenbandhu Chhotu Ram University of Science & Technology, India Dr. Jens Myrup Pedersen, Aalborg University, Denmark Dr. Augustine Ikechi Ukaegbu, KAIST, Korea Dr. Jamshid Sangirov, KAIST, Korea Prof. Ahmed Dooguy KORA, Ecole Sup. Multinationale des Telecommunications, Senegal Dr. Se-Jin Oh, Korea Astronomy & Space Science Institute, Korea Dr. Rajendra Prasad Mahajan, RGPV Bhopal, India Dr. Woo-Jin Byun, ETRI, Korea Dr. Mohammed M. Kadhum, School of Computing, Goodwin Hall, Queen's University , Canada Prof. Seong Gon Choi, Chungbuk National University, Korea Prof. Yao-Chung Chang, National Taitung University, Taiwan Dr. Abdallah Handoura, Engineering school of Gabes - Tunisia, Tunisia Dr. Gopal Chandra Manna, BSNL, India
Copyright ⓒ 2017 GiRI (Global IT Research Institute)
Dr. Il Kwon Cho, National Information Society Agency, Korea Prof. Jiann-Liang Chen, National Taiwan University of Science and Technology, Taiwan Prof. Ruay-Shiung Chang, National Dong Hwa University, Taiwan Dr. Vasaka Visoottiviseth, Mahidol University, Thailand Prof. Dae-Ki Kang, Dongseo University, Korea Dr. Yong-Sik Choi, Research Institute, IDLE co., ltd, Korea Dr. Xuena Peng, Northeastern University, China Dr. Ming-Shen Jian, National Formosa University, Taiwan Dr. Soobin Lee, KAIST Institute for IT Convergence, Korea Prof. Yongpan Liu, Tsinghua University, China Prof. Chih-Lin HU, National Central University, Taiwan Prof. Chen-Shie Ho, Oriental Institute of Technology, Taiwan Dr. Hyoung-Jun Kim, ETRI, Korea Prof. Bernard Cousin, IRISA/Universite de Rennes 1, France Prof. Eun-young Lee, Dongduk Woman s University, Korea Dr. Porkumaran K, NGP institute of technology India, India Dr. Feng CHENG, Hasso Plattner Institute at University of Potsdam, Germany Prof. El-Sayed M. El-Alfy, King Fahd University of Petroleum and Minerals, Saudi Arabia Prof. Lin You, Hangzhou Dianzi Univ, China Mr. Nicolai Kuntze, Fraunhofer Institute for Secure Information Technology, Germany Dr. Min-Hong Yun, ETRI, Korea Dr. Seong Joon Lee, Korea Electrotechnology Research Institute, korea Dr. Kwihoon Kim, ETRI, Korea Dr. Jin Woo HONG, Electronics and Telecommunications Research Inst., Korea Dr. Heeseok Choi, KISTI(Korea Institute of Science and Technology Information), korea Dr. Somkiat Kitjongthawonkul, Australian Catholic University, St Patrick's Campus, Australia Dr. Dae Won Kim, ETRI, Korea Dr. Ho-Jin CHOI, KAIST(Univ), Korea Dr. Su-Cheng HAW, Multimedia University, Faculty of Information Technology, Malaysia Dr. Myoung-Jin Kim, Soongsil University, Korea Dr. Gyu Myoung Lee, Institut Mines-Telecom, Telecom SudParis, France Dr. Dongkyun Kim, KISTI(Korea Institute of Science and Technology Information), Korea Prof. Yoonhee Kim, Sookmyung Women s University, Korea Prof. Li-Der Chou, National Central University, Taiwan Prof. Young Woong Ko, Hallym University, Korea Prof. Dimiter G. Velev, UNWE(University of National and World Economy), Bulgaria Dr. Tadasuke Minagawa, Meiji University, Japan Prof. Jun-Kyun Choi, KAIST (Univ.), Korea Dr. Brownson ObaridoaObele, Hyundai Mobis Multimedia R&D Lab , Korea Prof. Anisha Lal, VIT university, India Dr. kyeong kang, University of technology sydney, faculty of engineering and IT , Australia Prof. Chwen-Yea Lin, Tatung Institute of Commerce and Technology, Taiwan Dr. Ting Peng, Chang'an University, China Prof. ChaeSoo Kim, Donga University in Korea, Korea Prof. kirankumar M. joshi, m.s.uni.of baroda, India Dr. Chin-Feng Lin, National Taiwan Ocean University, Taiwan Dr. Chang-shin Chung, TTA(Telecommunications Technology Association), Korea
Copyright ⓒ 2017 GiRI (Global IT Research Institute)

Dr. Che-Sheng Chiu, Chunghwa Telecom Laboratories, Taiwan Dr. Chirawat Kotchasarn, RMUTT, Thailand Dr. Fateme Khalili, K.N.Toosi. University of Technology, Iran Dr. Izzeldin Ibrahim Mohamed Abdelaziz, Universiti Teknologi Malaysia , Malaysia Dr. Kamrul Hasan Talukder, Khulna University, Bangladesh Prof. HwaSung Kim, Kwangwoon University, Korea Prof. Jongsub Moon, CIST, Korea University, Korea Prof. Juinn-Horng Deng, Yuan Ze University, Taiwan Dr. Yen-Wen Lin, National Taichung University, Taiwan Prof. Junhui Zhao, Beijing Jiaotong University, China Dr. JaeGwan Kim, SamsungThales co, Korea Prof. Davar PISHVA, Ph.D., Asia Pacific University, Japan Ms. Hela Mliki, National School of Engineers of Sfax, Tunisia Prof. Amirmansour Nabavinejad, Ph.D., Sepahan Institute of Higher Education, Iran
Copyright ⓒ 2017 GiRI (Global IT Research Institute)

Editor Guide
Introduction for Editor or Reviewer
All the editor group members are to be assigned as a evaluator(editor or reviewer) to submitted journal
papers at the discretion of the Editor-in-Chief. It will be informed by eMail with a Member Login ID and
Password.
Once logined the Website via the Member Login menu in left as a evaluator, you can find out the paper
assigned to you. You can evaluate it there. All the results of the evaluation are supposed to be shown in
the Author Homepage in the real time manner. You can also enter the Author Homepage assigned to
you by the Paper ID and the author's eMail address shown in your Evaluation Webpage. In the Author
Homepage, you can communicate each other efficiently under the peer review policy. Please don't miss
it!
All the editor group members are supposed to be candidates of a part of the editorial board, depending
on their contribution which comes from history of ICACT TACT as an active evaluator. Because the main
contribution comes from sincere paper reviewing role.
Role of the Editor
The editor's primary responsibilities are to conduct the peer review process, and check the final camera-
ready manuscripts for any technical, grammatical or typographical errors.
As a member of the editorial board of the publication, the editor is responsible for ensuring that the
publication maintains the highest quality while adhering to the publication policies and procedures of
the ICACT TACT(Transactions on the Advanced Communications Technology).
For each paper that the editor-in-chief gets assigned, the Secretariat of ICACT Journal will send the
editor an eMail requesting the review process of the paper.
The editor is responsible to make a decision on an "accept", "reject", or "revision" to the Editor-in-Chief
via the Evaluation Webpage that can be shown in the Author Homepage also.
Deadlines for Regular Review
Editor-in-Chief will assign a evalaution group( a Editor and 2 reviewers) in a week upon receiving a
completed Journal paper submission. Evaluators are given 2 weeks to review the paper. Editors are
given a week to submit a recommendation to the Editor-in-Chief via the evaluation Webpage, once all or
enough of the reviews have come in. In revision case, authors have a maximum of a month to submit
their revised manuscripts. The deadlines for the regular review process are as follows:
Copyright ⓒ 2017 GiRI (Global IT Research Institute)

Evalution Procedure Deadline
Selection of Evaluation Group 1 week
Review processing 2 weeks
Editor's recommendation 1 week
Final Decision Noticing 1 week
Making Decisions on Manuscript
Editor will make a decision on the disposition of the manuscript, based on remarks of the reviewers. The
editor's recommendation must be well justified and explained in detail. In cases where the revision is
requested, these should be clearly indicated and explained. The editor must then promptly convey this
decision to the author. The author may contact the editor if instructions regarding amendments to the
manuscript are unclear. All these actions could be done via the evaluation system in this Website. The
guidelines of decisions for publication are as follows:
Decision Description Accept An accept decision means that an editor is accepting the paper with
no further modifications. The paper will not be seen again by the editor or by the reviewers.
Reject The manuscript is not suitable for the ICACT TACT publication.
Revision The paper is conditionally accepted with some requirements. A revision means that the paper should go back to the original reviewers for a second round of reviews. We strongly discourage editors from making a decision based on their own review of the manuscript if a revision had been previously required.
Role of the Reviewer
Reviewer Webpage:
Once logined the Member Login menu in left, you can find out papers assigned to you. You can also
login the Author Homepage assigned to you with the paper ID and author's eMail address. In there you
can communicate each other via a Communication Channel Box.
Quick Review Required:
You are given 2 weeks for the first round of review and 1 week for the second round of review. You must
agree that time is so important for the rapidly changing IT technologies and applications trend. Please
respect the deadline. Authors undoubtedly appreciate your quick review.
Copyright ⓒ 2017 GiRI (Global IT Research Institute)

Anonymity:
Do not identify yourself or your organization within the review text.
Review:
Reviewer will perform the paper review based on the main criteria provided below. Please provide
detailed public comments for each criterion, also available to the author.
How this manuscript advances this field of research and/or contributes something new to the literature?
Relevance of this manuscript to the readers of TACT? Is the manuscript technically sound? Is the paper clearly written and well organized? Are all figures and tables appropriately provided and are their resolution good quality? Does the introduction state the objectives of the manuscript encouraging the reader to read on? Are the references relevant and complete?
Supply missing references:
Please supply any information that you think will be useful to the author in revision for enhancing
quality of the paperor for convincing him/her of the mistakes.
Review Comments:
If you find any already known results related to the manuscript, please give references to earlier papers
which contain these or similar results. If the reasoning is incorrect or ambiguous, please indicate
specifically where and why. If you would like to suggest that the paper be rewritten, give specific
suggestions regarding which parts of the paper should be deleted, added or modified, and please
indicate how.
Copyright ⓒ 2017 GiRI (Global IT Research Institute)

Journal Procedure
Dear Author,
You can see all your paper information & progress.
Step 1. Journal Full Paper Submission
Using the Submit button, submit your journal paper through ICACT Website, then you will get new
paper ID of your journal, and send your journal Paper ID to the [email protected] for the review and
editorial processing. Once you got your Journal paper ID, never submit again! Journal Paper/CRF
Template
Step 2. Full Paper Review
Using the evaluation system in the ICACT Website, the editor, reviewer and author can communicate
each other for the good quality publication. It may take about 1 month.
Step 3. Acceptance Notification
It officially informs acceptance, revision, or reject of submitted full paper after the full paper review
process.
Status Action Acceptance Go to next Step.
Revision Re-submit Full Paper within 1 month after Revision Notification.
Reject Drop everything.
Step 4. Payment Registration
So far it's free of charge in case of the journal promotion paper from the registered ICACT conference
paper! But you have to regist it, because you need your Journal Paper Registration ID for submission of
the final CRF manuscripts in the next step's process. Once you get your Registration ID, send it to
[email protected] for further process.
Step 5. Camera Ready Form (CRF) Manuscripts Submission
After you have received the confirmation notice from secretariat of ICACT, and then you are allowed to
submit the final CRF manuscripts in PDF file form, the full paper and the Copyright Transfer Agreement.
Journal Paper Template, Copyright Form Template, BioAbstract Template,
Copyright ⓒ 2017 GiRI (Global IT Research Institute)

Journal Submission Guide
All the Out-Standing ICACT conference papers have been invited to this "ICACT Transactions on the
Advanced Communications Technology" Journal, and also welcome all the authors whose conference
paper has been accepted by the ICACT Technical Program Committee, if you could extend new contents
at least 30% more than pure content of your conference paper. Journal paper must be followed to
ensure full compliance with the IEEE Journal Template Form attached on this page.
How to submit your Journal paper and check the progress?
Step 1. Submit Using the Submit button, submit your journal paper through ICACT Website, then you will get new paper ID of your journal, and send your journal Paper ID to the [email protected] for the review and editorial processing. Once you got your Journal paper ID, never submit again! Using the Update button, you can change any information of journal paper related or upload new full journal paper.
Step 2. Confirm Secretariat is supposed to confirm all the necessary conditions of your journal paper to make it ready to review. In case of promotion from the conference paper to Journal paper, send us all the .DOC(or Latex) files of your ICACT conference paper and journal paper to evaluate the difference of the pure contents in between at least 30% more to avoid the self replication violation under scrutiny. The pure content does not include any reference list, acknowledgement, Appendix and author biography information.
Step 3. Review Upon completing the confirmation, it gets started the review process thru the Editor & Reviewer Guideline. Whenever you visit the Author Homepage, you can check the progress status of your paper there from start to end like this, " Confirm OK! -> Gets started the review process -> ...", in the Review Status column. Please don't miss it!
Copyright ⓒ 2017 GiRI (Global IT Research Institute)
6J
999
10182 Radio access and Transmission models for universal service
Idriss Saleh BACHAR*, Ahmed Dooguy KORA**, Roger Marcelin FAYE***, Christelle Aupetit-Berthelemot****
* Autorité de Régulation des Communications Electroniques et Postes, Ndjamena, TCHAD
**É cole Supérieure Multinationale des Télécommunications, Dakar, SENEGAL
*** É cole Supérieure Polytechnique, Dakar-Fann, SENEGAL
**** Xlim/SRI/Resyst, UMR-CNRS 7252, University of Limoges, FRANCE
Volume. 6 Issue. 3
1 Capacity-aware Key Partitioning Scheme for Heterogeneous Big Data Analytic Engines
Muhammad Hanif, Choonhwa Lee
Division of Computer Science and Engineering, Hanyang University, Seoul, Republic of Korea
Copyright © 2017 GiRI (Global IT Research Institute)

Abstract—Big data and cloud computing became the centre of
interest for the past decade. With the increase of data size and
different cloud application, the idea of big data analytics become
very popular both in industry and academia. The research
communities in industry and academia never stopped trying to
come up with the fast, robust, and fault tolerant analytic
engines. MapReduce becomes one of the popular big data
analytic engine over the past few years. Hadoop is a standard
implementation of MapReduce framework for running
data-intensive applications on the clusters of commodity servers.
By thoroughly studying the framework we find out that the
shuffle phase, all-to-all input data fetching phase in reduce task
significantly affect the application performance. There is a
problem of variance in both the intermediate key’s frequencies
and their distribution among data nodes throughout the cluster
in Hadoop’s MapReduce system. This variance in system causes
network overhead which leads to unfairness on the reduce input
among different data nodes in the cluster. Because of the above
problems, applications experience performance degradation due
to shuffle phase of MapReduce applications. We develop a new
novel algorithm; unlike previous systems our algorithm
considers each node’s capabilities as heuristics to decide a better
available trade-off for the locality and fairness in the system. By
comparing with the default Hadoop’s partitioning algorithm
and Leen partitioning algorithm: a). In case of 2 million
key-value pairs to process, on the average our approach achieve
better resource utilization by about 19%, and 9%, in that order;
b). In case of 3 million key-value pairs to process, our approach
achieve near optimal resource utilization by about 15%, and
7%, respectively.
Keyword—Cloud and Distributed Computing, Context-aware
Partitioning, Hadoop MapReduce, Heterogeneous Systems
I. INTRODUCTION
IG DATA [1] is getting bigger day by day with the
information coming from instrumented, steady supply
———————————————————————
Manuscript received April 26, 2017. This research work is follow-up of
the invited journal to an accepted eminent conference paper of the 18th
International Conference on Advance Communication Technology
(ICACT2016). This work is supported by the Basic Science Research
Program through the National Research Foundation of Korea (NRF) funded
by the Ministry of Science, ICT & Future Planning (No.
2017R1A2B4010395).
Muhammad Hanif is with the Department of Computer and Software
Engineering, Hanyang University, Wangsimni-ro 222, Seoul, Republic of
Korea. (E-mail: honeykhan@ hanyang.ac.kr).
Choonhwa Lee is with the Division of Computer Science and
Engineering, Hanyang University, Wangsimni-ro 222, Seoul, Republic of
Korea. (Corresponding author, Phone: +82-2-2220-1268; fax:
82-2-2220-1723; e-mail: lee@ hanyang.ac.kr).
chains transmitting real-time data about the variabilities in
everything from e-trading to weather. Furthermore, cautious
information has in full swing through amorphous digital
channels like social media, smart phones applications and
different IoT devices. This big amount of data has challenges
involve with it: data is big, it is fast, unstructured, has
enormous amount of sources, and contains graphics. Cloud
computing [2] becomes the interest point for both industry
and academia due to its scalable, distributed and fault tolerant
storage services and applications which have the aptitude to
handle the challenges associated with big data. The data
processing of big data in cloud and distributed computing
environment is one of the core delinquents and under the spot
light in research community for a while. MapReduce has
proven to be the most popular implementation of
computational processing framework which has the capability
of supporting distributed storage holding large scale data over
the distributed infrastructure like cloud computing.
Google’s MapReduce [3] programming model is an emerging
data intensive programming model for large scale data
parallel applications including data mining, web indexing,
multilinear subspace learning, business intelligence, and
scientific simulations. MapReduce facilitates users with an
easy parallel programming interface in distributed computing
paradigm. It is used for distributed fault tolerance for
supervision of multiple processing nodes in the clusters. One
of the most significant feature of MapReduce is its high
scalability that permits users to process massive amount of
data in short time. There are numerous fields that benefit from
MapReduce including bioinformatics [4], scientific analysis
[5], web data analytics, security [6], and machine learning [7].
Hadoop [8] [9]is a standard open-source implementation of
Google’s MapReduce programming model for processing
large amount of data in parallel. Hadoop was developed
predominantly by Yahoo; where it processes petabyte scale
data on tens of thousands of nodes [10] [11], and has been
successfully adopted by several companies including
Amazon, AOL, Facebook, and New York Times. For
example, AOL uses it for running behavioural pattern
analytics application which analyses the behavioural pattern
of their users so as to targeted services on the basis of their
location, interest and so on.
The Hadoop system runs on top of the Hadoop Distributed
File System [12], within which data is loaded, partitioned into
splits, and each split replicated across multiple nodes. Data
processing is co-located with data storage: when a file needs
to be processed, the Resource Manager consults a storage
Capacity-aware Key Partitioning Scheme for
Heterogeneous Big Data Analytic Engines
Muhammad Hanif, Choonhwa Lee
Division of Computer Science and Engineering, Hanyang University, Seoul, Republic of Korea
[email protected] , [email protected]
B
Copyright © 2017 GiRI (Global IT Research Institute)
ICACT Transactions on Advanced Communications Technology (TACT) Vol. 6, Issue 3, May 2017 999
metadata service to get the host node for each split, and then
system schedules a task on that node, so that data locality is
exploited efficiently. The map task processes a data split into
key/value pairs, on which hash partitioning function is
performed, on the appearance of each intermediate key
produced by any running map within the MapReduce system:
hash (Hash code (Intermediate-key) Modulo Reduce-ID)
These hashing results are stored in memory buffers. In the
reduce stage, a reducer takes a partition as input and performs
the user defined reduce function on the partition. The storage
distribution of the hash partition among the nodes affects the
network traffic and the balance of the hash partition size play
a significant role in the load-balancing among the reducer
nodes.
This work scrutinizes the problem of variance in both the
intermediate key’s frequencies and their distribution among
data nodes throughout the cluster in Hadoop’s MapReduce
system. This variance in system causes network overhead
which leads to unfairness on the reduce input among different
nodes in the cluster. Because of the above problems,
applications experience performance degradation due to
network overhead in the shuffle phase of MapReduce kind
applications. The current Hadoop’s default hash partitioning
and Leen [13] partitioning work well in case of the uniform
distribution of the data throughout the cluster in homogeneous
systems. But in case of heterogeneous machines cluster, the
system performance degrades due to the lack of consideration
of heterogeneity of nodes and also the random-ness
(non-uniform) in data distribution of data set throughout the
cluster.
To alleviate the problems of partitioning and computation
skew, we develop an algorithm which considers the node
heterogeneity (i.e. the capacity of each node in the cluster) as
heuristics to manage the data locality and fairness trade-off in
the system by load-balancing according to the capabilities of
nodes in the cluster. Our algorithm saves the network
bandwidth overindulgence during the copying phase of
intermediate data of MapReduce job along with balancing the
reducers input. It improves the data locality in the individual
nodes by decoupling mappers and reducer tasks, in this
manner having more control on keys dissemination in each
data node of the cluster.
Contribution of this work includes,
Extension of node/locality/fairness-aware execution
model for the partitioning scheme for Hadoop.
A node-aware or capacity-aware algorithm to
ascertain data locality and fair key distribution to
achieve load-balancing in cluster according to the
capabilities of nodes.
Automatize the suboptimal trade-off between locality,
load balancing, and fairness.
Mitigate the partitioning and computation skew and
achieve reduction in network overhead in the cluster
in comparison to default state of the art partitioning
schemes in heterogeneous environment.
The rest of the paper is organized as follows. Section 2
discusses the motivational background. Section 3 illuminates
the system architecture, while the proposed scheme is
discussed in section 4. The performance is evaluated in
section 5. Section 6 discusses the related work and the paper
is concluded in section 7.
II. MOTIVATIONAL BACKGROUND
There are different aspects of the Hadoop scheduler which
should be manipulated for the improvement of existing
schedulers and mitigating the problem with those existing
schedulers. Our main motivations of this work are some
assumptions made by existing schedulers and situations where
Hadoop’s existing schedulers perform worse. In this section,
we will justify our motivation of the work by going through
the limitations of the previous state of the art approaches and
demonstrating through motivational example by carrying out
a series of experiments to validate the aforementioned
problems in the current Hadoop implementation.
Hadoop's Limitations
Default Hadoop's system makes several implicit
assumptions:
i. All nodes in the cluster can perform work at roughly
the same rate i.e. the cluster is consist of
Homogeneous machines.
ii. Tasks progress at a constant rate throughout time.
iii. A task's progress score is evocative of fraction of its
total work that it has done. Specifically, in a
reduce task, the copy, sort and reduce phases each
take about 1/3 of the total time. Which is not the
case in real life examples, i.e. jobs and tasks can
be of different types such as CPU intensive, IO
intensive, or Memory intensive.
iv. Tasks incline to finish in waves, so a task with a low
progress score is likely a straggler.
v. Tasks in the same category (map or reduce) require
roughly the same amount of work [3].
As we shall see, assumptions 1 and 2 break down in a
virtualized data centre due to heterogeneity of the resources.
Assumptions 3 and 4 can break down in a homogeneous data
centre as well, and may cause Hadoop to perform poorly there
too. In fact, Yahoo disables speculative execution on some
jobs because it degrades performance, and monitors faulty
machines through other means. Facebook disables
speculation for reduce tasks in order to achieve better
performance [14] [15]. Assumption 5 is intrinsic in the
MapReduce paradigm, so we do not address it in this paper.
Leen's Limitations
Leen works well under some conditions and scenarios,
while there are certain situations where Leen cannot work
properly.
i. Leen assumption of uniform distribution of the keys
throughout the cluster’s nodes does not hold in most
of the real world situations, as the real world input
data set are usually distributed and non-uniform.
ii. It does not consider any heterogeneity, which is not the
case in real world system. Almost all the data centres
in the industry consists of heterogeneous machines
such as Amazon EC2 [16], Microsoft Azure [17]
iii. It does not consider the numbers of keys throughout the
cluster in calculation of the FLK, it just consider the
locality on the basis of average numbers of keys i.e.
Copyright © 2017 GiRI (Global IT Research Institute)
ICACT Transactions on Advanced Communications Technology (TACT) Vol. 6, Issue 3, May 2017 1000
mathematical mean value of it.
a. This hurt the load-balancing in the system
especially when best locality node is slower
one.
The 2nd point of consideration of only homogeneous
machines degrades the performance in both virtualized and
non-virtualized situations. In a non-virtualized data centre,
there may be multiple generations of hardware at the same
data centre as in case of upgrading some system to the new
generation whereas other remain intact. In a virtualized data
centre where multiple virtual machines run on each physical
host, such as Amazon EC2, co-location of VMs may cause
heterogeneity. In EC2, co-located VMs use a host’s full
bandwidth when there is no contention and share bandwidth
fairly when there is contention [16].
Motivational Example
As shown in Fig. 1, there are three nodes: Node1, Node2,
and Node3, with nine intermediate keys, ordered by their
influx during the map tasks execution. For the reference, we
use a similar example of nine keys like Leen [13] algorithm
and use it as a comparative example among the different
partitioning schemes. The sum of the entire nine keys
frequencies is 225 keys, distributed randomly in the cluster of
three data nodes, which is usually the case in distributed
infrastructure. Also the keys occurrences are wide-ranging
along with the dispersal among the data nodes.
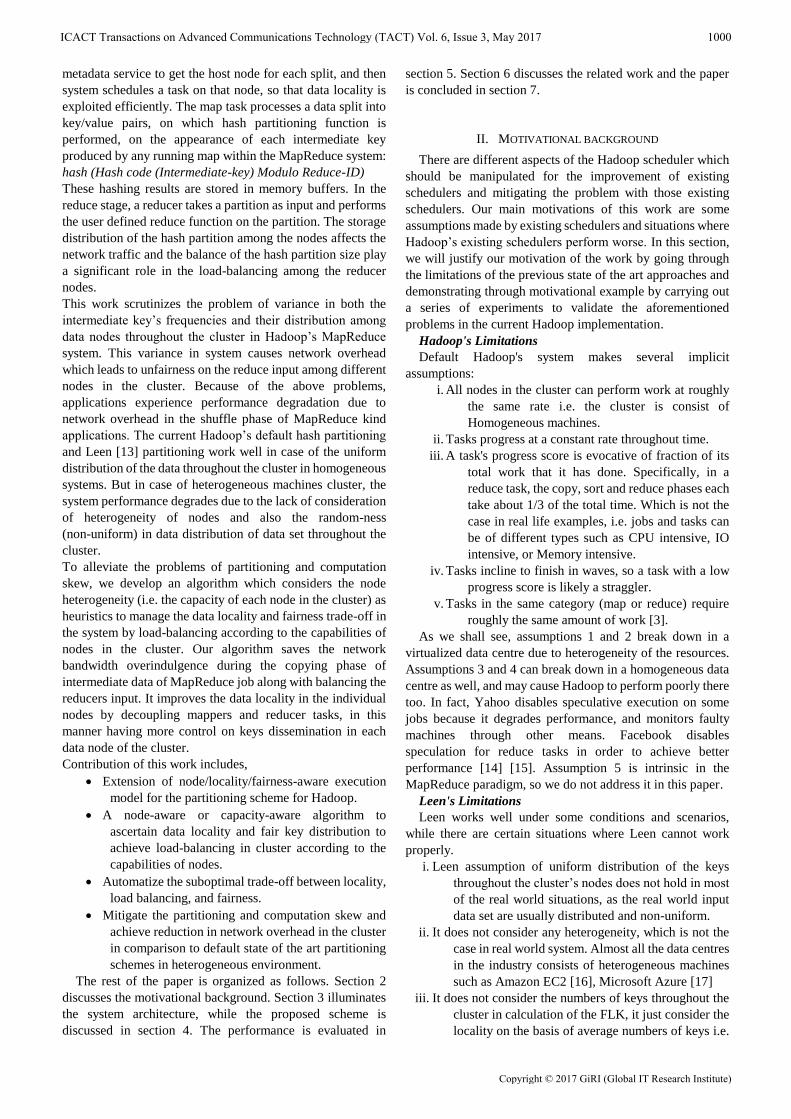
Fig. 1 shows that the key partitioning results using the
default Hadoop Hash partitioning, which is assigning K1, K4,
and K7 to Node1; K2, K5, and K8 to Node2; whereas K3, K6,
and K9 to Node3. So despite the fact that Node3 has the
highest processing capability, Node1 needs to process 81 out
of 225, Node2 needs to process 103 out of 225, and finally
Node3 needs to process 41 out of 225 key-value pairs leading
to non-optimal utilization of the resources. This clarify that it
is scant in case of the partitioning skew in terms of data size
which needs to be shuffled through the system network and
balance distribution of reducer’s input. We discern that the
data size needs to be transmitted through the network in the
shuffle phase is enormous, and the hash partitioning is
inadequate in the presence of partitioning skew. In this
example, the percentages of keys locally partitioned on each
of the three nodes are 23%, 37% and 33%, respectively. And
the Total Network Traffic is 156 keys out of 225 keys.
According to the processing power of the Nodes in the given
example shown in the Table.1, Node1 process 81 keys-value
pairs in 36 units of time, Node2 process its 103 key-value
pairs in 23 units of time, and Node3 process its 41 assigned
key-value pairs in 6 units of time, which prove the hypothesis
of non-optimal utilization resources that Node3 stay idle for
about 30 units of time (36 units for Node1 – 6 units for
Node3). This kind of situation creates different problems like
poor resource utilization and performance degradation
especially in heterogeneous environment.
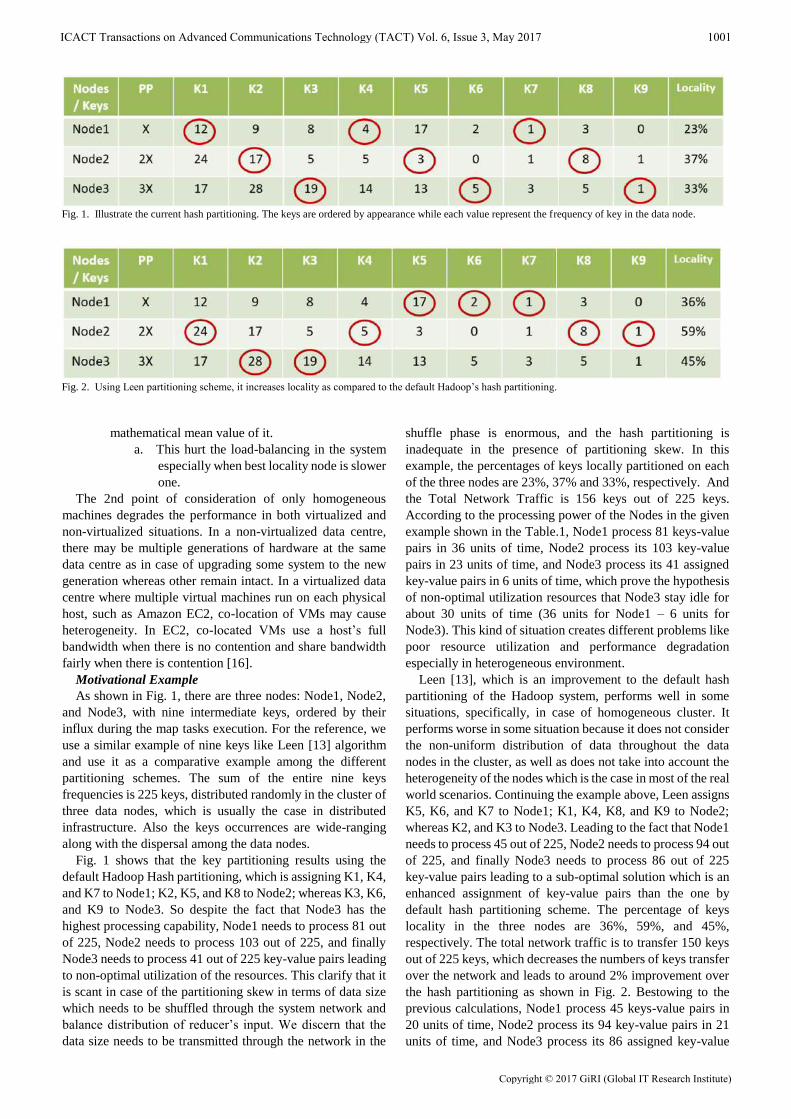
Leen [13], which is an improvement to the default hash
partitioning of the Hadoop system, performs well in some
situations, specifically, in case of homogeneous cluster. It
performs worse in some situation because it does not consider
the non-uniform distribution of data throughout the data
nodes in the cluster, as well as does not take into account the
heterogeneity of the nodes which is the case in most of the real
world scenarios. Continuing the example above, Leen assigns
K5, K6, and K7 to Node1; K1, K4, K8, and K9 to Node2;
whereas K2, and K3 to Node3. Leading to the fact that Node1
needs to process 45 out of 225, Node2 needs to process 94 out
of 225, and finally Node3 needs to process 86 out of 225
key-value pairs leading to a sub-optimal solution which is an
enhanced assignment of key-value pairs than the one by
default hash partitioning scheme. The percentage of keys
locality in the three nodes are 36%, 59%, and 45%,
respectively. The total network traffic is to transfer 150 keys
out of 225 keys, which decreases the numbers of keys transfer
over the network and leads to around 2% improvement over
the hash partitioning as shown in Fig. 2. Bestowing to the
previous calculations, Node1 process 45 keys-value pairs in
20 units of time, Node2 process its 94 key-value pairs in 21
units of time, and Node3 process its 86 assigned key-value
Fig. 1. Illustrate the current hash partitioning. The keys are ordered by appearance while each value represent the frequency of key in the data node.
Fig. 2. Using Leen partitioning scheme, it increases locality as compared to the default Hadoop’s hash partitioning.
Copyright © 2017 GiRI (Global IT Research Institute)
ICACT Transactions on Advanced Communications Technology (TACT) Vol. 6, Issue 3, May 2017 1001
pairs in 13 units of time, in which case Node3 stay idle only
for about 8 units of time instead of 30 units as in the case of
default hash partitioning (i.e. 21 units for Node2 – 13 units for
Node3). This example shows that the Leen partitioning
algorithm help the system to improve the utilization of the
whole cluster eventually.
By the above reasoning, we have to conclude that the
previous work lack of contemplation of the capacity
awareness of the nodes superintends any opportunities of the
reduction of the network traffic during the shuffle phase of the
MapReduce application execution, in case of heterogeneity in
the cluster. Also the load misbalancing data distribution of
reducer nodes occurs, i.e. 1). Nodes with higher capacity get
less amount of data leading to non-optimal utilization of
resources and under loading, 2). Lower capacity nodes getting
more data to process leading to performance degradation,
overloading, and straggler effect.
III. SYSTEM ARCHITECTURE
In this section, we will introduce the system architecture
and how the proposed system work in the specified
environment. As mentioned earlier, we decouple the mappers
and reducers in order to achieve more parallelism and keep
track of all the intermediate data keys frequencies and
distribution in the form of capacity-keys frequency table. In
order to meritoriously partition certain input data set of K
keys distributed over N nodes in a cluster, the system need to
find the best available solution in a space of possible
combinations. The system achieve it through the proposed
approach which will be explained in the forthcoming section.
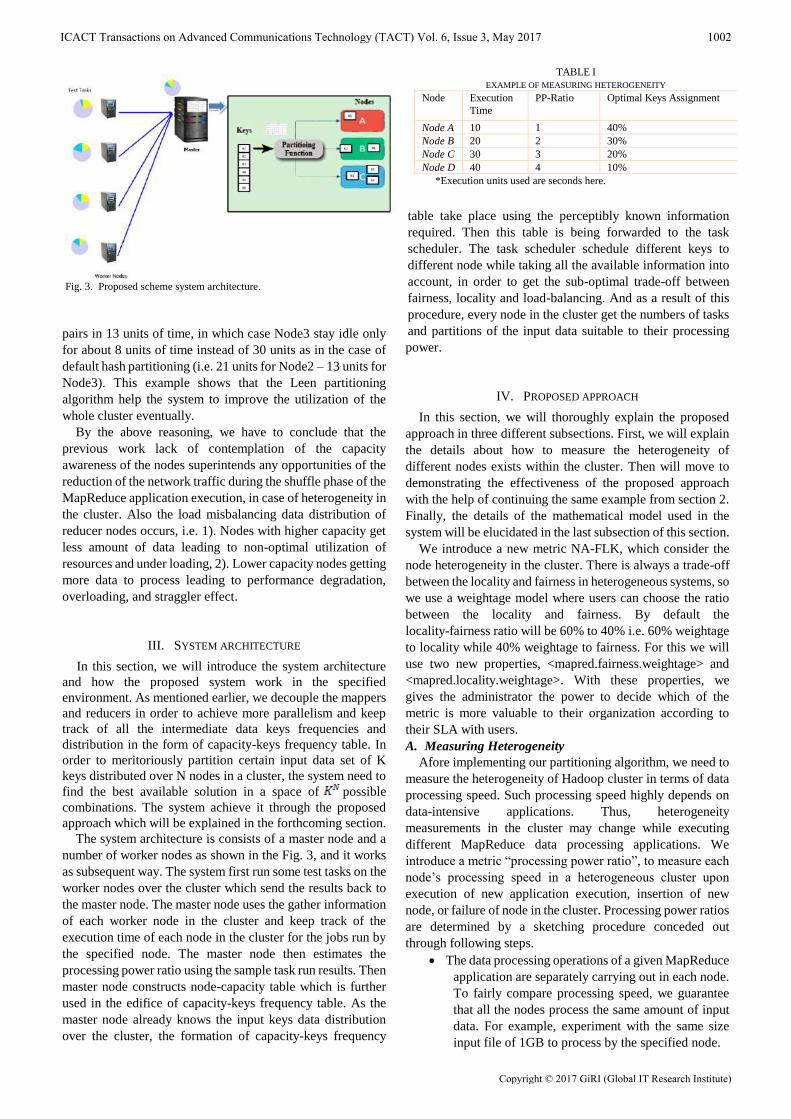
The system architecture is consists of a master node and a
number of worker nodes as shown in the Fig. 3, and it works
as subsequent way. The system first run some test tasks on the
worker nodes over the cluster which send the results back to
the master node. The master node uses the gather information
of each worker node in the cluster and keep track of the
execution time of each node in the cluster for the jobs run by
the specified node. The master node then estimates the
processing power ratio using the sample task run results. Then
master node constructs node-capacity table which is further
used in the edifice of capacity-keys frequency table. As the
master node already knows the input keys data distribution
over the cluster, the formation of capacity-keys frequency
table take place using the perceptibly known information
required. Then this table is being forwarded to the task
scheduler. The task scheduler schedule different keys to
different node while taking all the available information into
account, in order to get the sub-optimal trade-off between
fairness, locality and load-balancing. And as a result of this
procedure, every node in the cluster get the numbers of tasks
and partitions of the input data suitable to their processing
power.
IV. PROPOSED APPROACH
In this section, we will thoroughly explain the proposed
approach in three different subsections. First, we will explain
the details about how to measure the heterogeneity of
different nodes exists within the cluster. Then will move to
demonstrating the effectiveness of the proposed approach
with the help of continuing the same example from section 2.
Finally, the details of the mathematical model used in the
system will be elucidated in the last subsection of this section.
We introduce a new metric NA-FLK, which consider the
node heterogeneity in the cluster. There is always a trade-off
between the locality and fairness in heterogeneous systems, so
we use a weightage model where users can choose the ratio
between the locality and fairness. By default the
locality-fairness ratio will be 60% to 40% i.e. 60% weightage
to locality while 40% weightage to fairness. For this we will
use two new properties, <mapred.fairness.weightage> and
<mapred.locality.weightage>. With these properties, we
gives the administrator the power to decide which of the
metric is more valuable to their organization according to
their SLA with users.
A. Measuring Heterogeneity
Afore implementing our partitioning algorithm, we need to
measure the heterogeneity of Hadoop cluster in terms of data
processing speed. Such processing speed highly depends on
data-intensive applications. Thus, heterogeneity
measurements in the cluster may change while executing
different MapReduce data processing applications. We
introduce a metric “processing power ratio”, to measure each
node’s processing speed in a heterogeneous cluster upon
execution of new application execution, insertion of new
node, or failure of node in the cluster. Processing power ratios
are determined by a sketching procedure conceded out
through following steps.
The data processing operations of a given MapReduce
application are separately carrying out in each node.
To fairly compare processing speed, we guarantee
that all the nodes process the same amount of input
data. For example, experiment with the same size
input file of 1GB to process by the specified node.
TABLE I
EXAMPLE OF MEASURING HETEROGENEITY
Node Execution
Time
PP-Ratio Optimal Keys Assignment
Node A 10 1 40%
Node B 20 2 30%
Node C 30 3 20%
Node D 40 4 10%
*Execution units used are seconds here.
Fig. 3. Proposed scheme system architecture.
Copyright © 2017 GiRI (Global IT Research Institute)
ICACT Transactions on Advanced Communications Technology (TACT) Vol. 6, Issue 3, May 2017 1002

The response time of each node performing the data
processing operations will be recorded in an
Array-List data structure.
Shortest response time is used as a reference to
normalize the response time measurements.
The normalized processing powers ratios are
employed by the partitioning algorithm of the system
while taking decision of the trade-off between the
fairness, load-balancing, and locality.
Measuring Heterogeneity Example: Suppose that there
are four heterogeneous nodes: Node A, B, C and D, in a
Hadoop MapReduce cluster as shown in table 1. After
running a Hadoop application on each node, one collects the
response time of the application on node A, B, C and D is 10,
20, 30 and 40 seconds, respectively. The response time of the
application on node A is the shortest. Therefore, the
processing power ratio of node A with respect to this
application is set to 1, which becomes a reference used to
determine processing power ratios of node B, C and D. Thus,
the processing power ratios of node B, C and D are 2, 3 and 4,
respectively. Recall that the processing power capacity of
each node is quite stable with respect to any specified Hadoop
analytic application. Hence, the processing power ratios are
free of input file sizes. Table I shows the response times,
processing power ratios, and optimal keys assignment
percentage for each node in the cluster. As we can grasp, the
optimal keys assignment percentage with the value of 40% for
Node A is the highest, 30% for Node B, 20% for Node C, and
10% for Node D, so the scheduler with the suboptimal
solution will get the nearest possible values for each node in
the cluster leading to a load-balanced cluster.
B. Partitioning Example
Continuing with section 2-C motivational examples, where
the total network traffic was high and the locality was lower
than expected. Our proposed Capacity-aware scheme is very
much appropriate for the practical scenarios because it cover
most of the drawbacks of previously developed schemes. This
scheme can work in case of diverse non-uniformly distributed
data over the nodes, and also in case of heterogonous
machines in the system. Continuing with the motivational
example, as shown in Fig. 4, the proposed scheme NoLFA
assigns K7 to Node1; K1, K4, K8, and K9 to Node2; whereas
K2, K3, K5, and K6 to Node3. Prominently leading towards
the datum that Node1 needs to process 5 out of 225, Node2
needs to process 94 out of 225, and Node3 needs to process
126 out of 225 key-value pairs, which give us a near-optimal
solution of assignment of key-value pairs. The percentage of
keys locality in the three nodes are 2%, 59%, and 60%,
respectively. The total network traffic is to transfer 138 keys
out of 225 keys, which decreases the numbers of keys transfer
over the network and leads to around 8% improvement over
the hash partitioning scheme. According to the processing
power of the Nodes in the given example, Node1 process 5
keys-value pairs in 2 units of time, Node2 process its 94
key-value pairs in 21 units of time, and Node3 process its 126
assigned key-value pairs in 18 units of time. Thus, NoLFA
achieves better load-balancing according to the capabilities of
the nodes in the system.
C. Mathematical Model
Our proposed algorithm introduces heterogeneity
awareness into the default Hadoop scheduling system by
altering the hash key partitioning scheme while taking locality
of data and fairness into account. For the effective partitioning
of data set of K keys distributed over N nodes in cluster, there
will be best possible solution in K^N solutions. To find
suitable solution of all these possible ways, we use processing
power or capabilities of nodes as heuristic in the proposed
scheme. We keep in mind that for the best solution, we need to
find a good trade-off between the locality of keys-value pairs,
load-balancing, and fairness to the reduce nodes throughout
the cluster. After estimating the processing power of the
nodes, we need to find the optimal load for the reducers
depending on the numbers of reducers according to the SLA
based configuration of the cluster.
To calculate the suboptimal load for each reducer in the
cluster, we need to use the optimal load percentage table with
total data set,
For the locality of keys in a specified node, we use the
frequencies of keys partitioned to that node divided by the
optimal load for the specified node (instead of just the
athematic mean of all, which is wrong in most practical world
applications).
As we can see in the above equation, the locality of each node
j is the ration of partitioned keys to the Optimal Load from the
already calculated table. The best locality node is usually the
node which contains maximum frequencies of a key, and that
key is partitioned to that node. The fairness in the system
could be calculated as follows,
Fig. 4. Motivational Example: Using our Capacity-Aware partitioning scheme outperform both Hadoop’s hash partitioning and Leen partitioning.
Copyright © 2017 GiRI (Global IT Research Institute)
ICACT Transactions on Advanced Communications Technology (TACT) Vol. 6, Issue 3, May 2017 1003
where points to the frequency of key in the data node
, and represents the optimal load on
reducer according to their computing power. The best locality
indicates partitioning to the data node which has the
maximum frequencies for the key. The total network traffic in
the cluster can be calculated as,
With this formula, we can get an educated guess of the
network overhead in the cluster with the combined effect of
both the total intermediate data and each node assessed
locality.
V. PERFORMANCE EVALUATION
To evaluate the performance of the proposed algorithm, we
have designed and execute certain set of experiments with
different variations of keys and frequencies distribution. The
experimental results shows that the our proposed approach
NoLFA algorithm over-run Leen and Hash partitioning by
decreasing the total network traffic in the cluster as shown in
the Fig. 5. Hash partitioning is the default partitioning scheme
of the Hadoop data processing framework, which on the
average generates around 70% of the cluster’s network traffic,
whereas Leen improve it and crafts around 67% of network
traffic in the cluster on the average. And our algorithm
NoLFA outperforms both of the above partitioning scheme by
achieving on average better results, and creates around 61%
of the total network traffic. This is because of the fact that
NoLFA considers the capacity of each machine/node in the
cluster while taking the decision about the partitioning of
different keys to different nodes in the cluster.
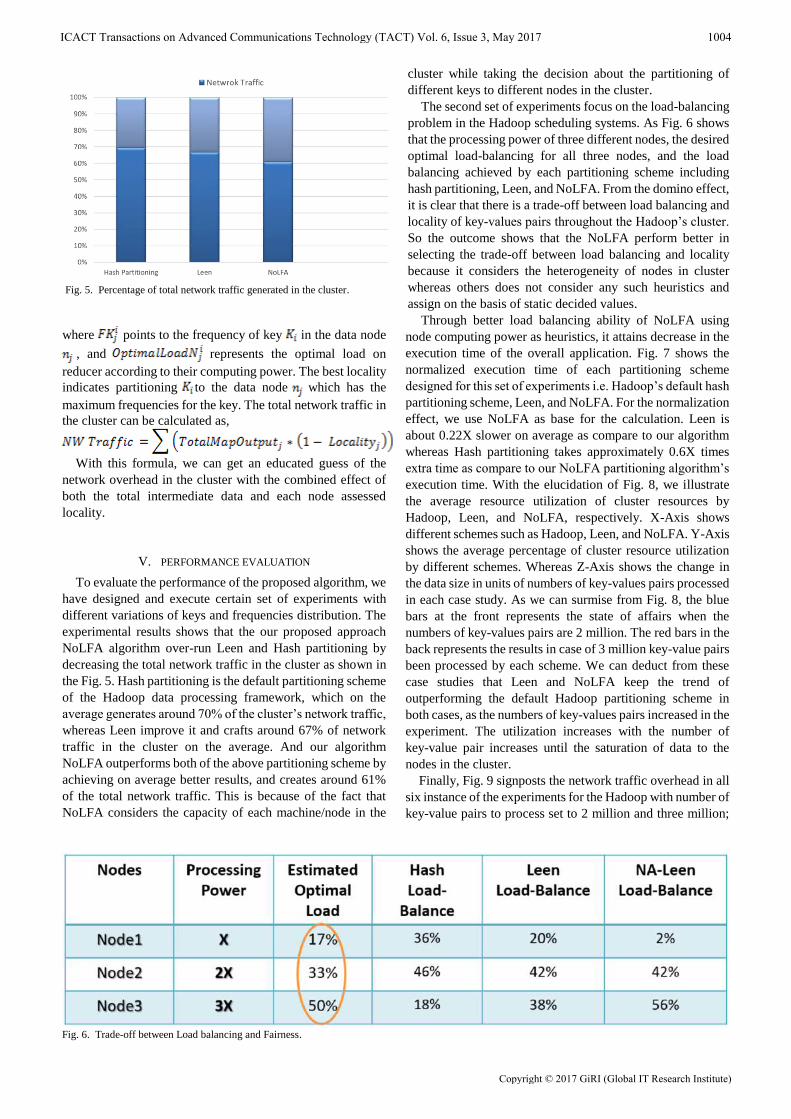
The second set of experiments focus on the load-balancing
problem in the Hadoop scheduling systems. As Fig. 6 shows
that the processing power of three different nodes, the desired
optimal load-balancing for all three nodes, and the load
balancing achieved by each partitioning scheme including
hash partitioning, Leen, and NoLFA. From the domino effect,
it is clear that there is a trade-off between load balancing and
locality of key-values pairs throughout the Hadoop’s cluster.
So the outcome shows that the NoLFA perform better in
selecting the trade-off between load balancing and locality
because it considers the heterogeneity of nodes in cluster
whereas others does not consider any such heuristics and
assign on the basis of static decided values.
Through better load balancing ability of NoLFA using
node computing power as heuristics, it attains decrease in the
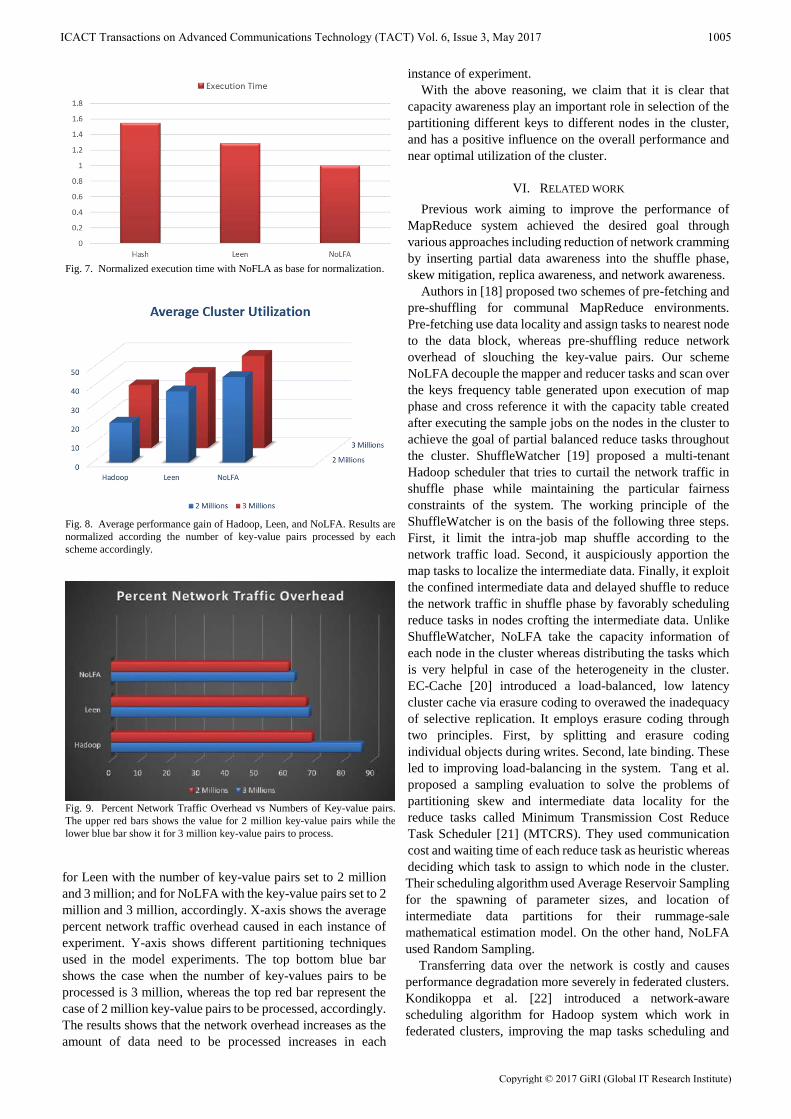
execution time of the overall application. Fig. 7 shows the
normalized execution time of each partitioning scheme
designed for this set of experiments i.e. Hadoop’s default hash
partitioning scheme, Leen, and NoLFA. For the normalization
effect, we use NoLFA as base for the calculation. Leen is
about 0.22X slower on average as compare to our algorithm
whereas Hash partitioning takes approximately 0.6X times
extra time as compare to our NoLFA partitioning algorithm’s
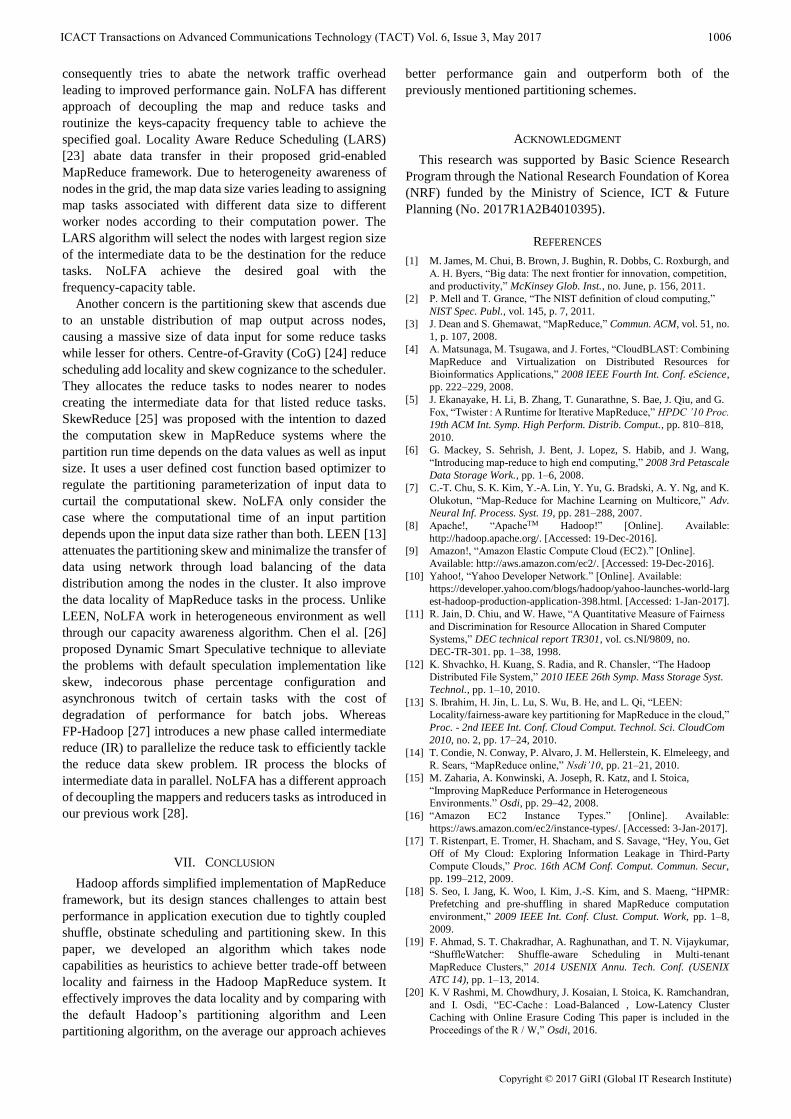
execution time. With the elucidation of Fig. 8, we illustrate
the average resource utilization of cluster resources by
Hadoop, Leen, and NoLFA, respectively. X-Axis shows
different schemes such as Hadoop, Leen, and NoLFA. Y-Axis
shows the average percentage of cluster resource utilization
by different schemes. Whereas Z-Axis shows the change in
the data size in units of numbers of key-values pairs processed
in each case study. As we can surmise from Fig. 8, the blue
bars at the front represents the state of affairs when the
numbers of key-values pairs are 2 million. The red bars in the
back represents the results in case of 3 million key-value pairs
been processed by each scheme. We can deduct from these
case studies that Leen and NoLFA keep the trend of
outperforming the default Hadoop partitioning scheme in
both cases, as the numbers of key-values pairs increased in the
experiment. The utilization increases with the number of
key-value pair increases until the saturation of data to the
nodes in the cluster.
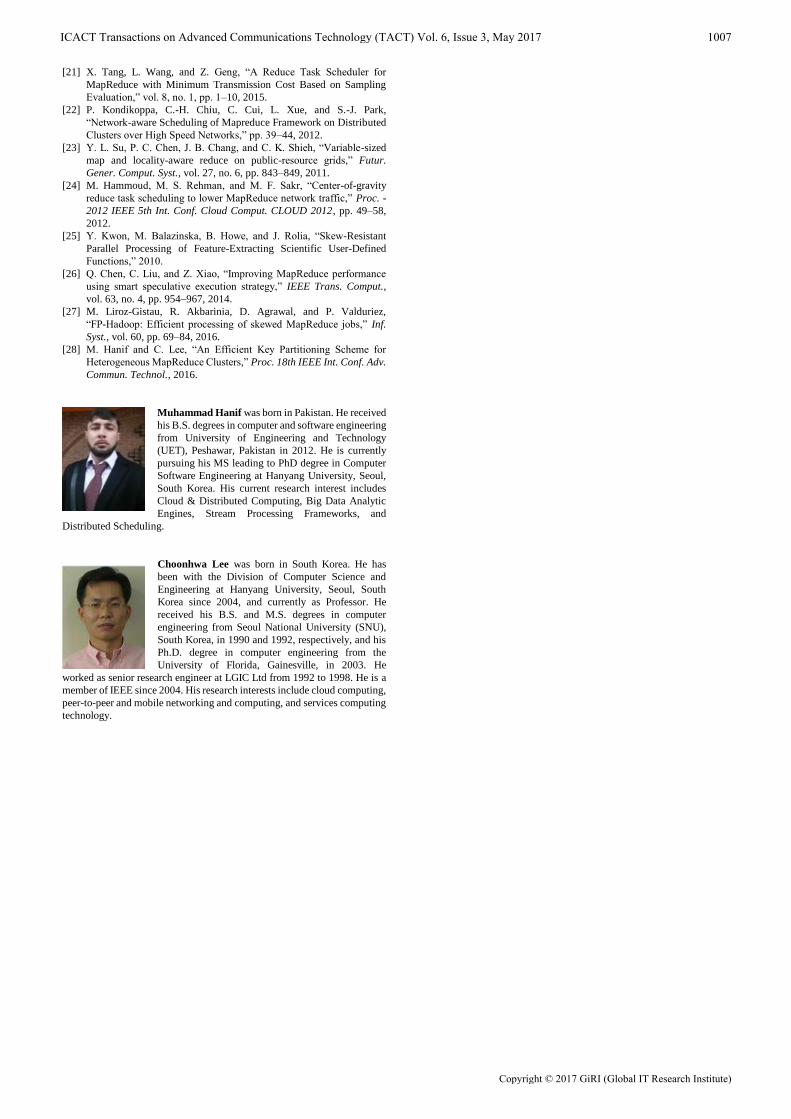
Finally, Fig. 9 signposts the network traffic overhead in all
six instance of the experiments for the Hadoop with number of
key-value pairs to process set to 2 million and three million;
Fig. 5. Percentage of total network traffic generated in the cluster.
Fig. 6. Trade-off between Load balancing and Fairness.
Copyright © 2017 GiRI (Global IT Research Institute)
ICACT Transactions on Advanced Communications Technology (TACT) Vol. 6, Issue 3, May 2017 1004
for Leen with the number of key-value pairs set to 2 million
and 3 million; and for NoLFA with the key-value pairs set to 2
million and 3 million, accordingly. X-axis shows the average
percent network traffic overhead caused in each instance of
experiment. Y-axis shows different partitioning techniques
used in the model experiments. The top bottom blue bar
shows the case when the number of key-values pairs to be
processed is 3 million, whereas the top red bar represent the
case of 2 million key-value pairs to be processed, accordingly.
The results shows that the network overhead increases as the
amount of data need to be processed increases in each
instance of experiment.
With the above reasoning, we claim that it is clear that
capacity awareness play an important role in selection of the
partitioning different keys to different nodes in the cluster,
and has a positive influence on the overall performance and
near optimal utilization of the cluster.
VI. RELATED WORK
Previous work aiming to improve the performance of
MapReduce system achieved the desired goal through
various approaches including reduction of network cramming
by inserting partial data awareness into the shuffle phase,
skew mitigation, replica awareness, and network awareness.
Authors in [18] proposed two schemes of pre-fetching and
pre-shuffling for communal MapReduce environments.
Pre-fetching use data locality and assign tasks to nearest node
to the data block, whereas pre-shuffling reduce network
overhead of slouching the key-value pairs. Our scheme
NoLFA decouple the mapper and reducer tasks and scan over
the keys frequency table generated upon execution of map
phase and cross reference it with the capacity table created
after executing the sample jobs on the nodes in the cluster to
achieve the goal of partial balanced reduce tasks throughout
the cluster. ShuffleWatcher [19] proposed a multi-tenant
Hadoop scheduler that tries to curtail the network traffic in
shuffle phase while maintaining the particular fairness
constraints of the system. The working principle of the
ShuffleWatcher is on the basis of the following three steps.
First, it limit the intra-job map shuffle according to the
network traffic load. Second, it auspiciously apportion the
map tasks to localize the intermediate data. Finally, it exploit
the confined intermediate data and delayed shuffle to reduce
the network traffic in shuffle phase by favorably scheduling
reduce tasks in nodes crofting the intermediate data. Unlike
ShuffleWatcher, NoLFA take the capacity information of
each node in the cluster whereas distributing the tasks which
is very helpful in case of the heterogeneity in the cluster.
EC-Cache [20] introduced a load-balanced, low latency
cluster cache via erasure coding to overawed the inadequacy
of selective replication. It employs erasure coding through
two principles. First, by splitting and erasure coding
individual objects during writes. Second, late binding. These
led to improving load-balancing in the system. Tang et al.
proposed a sampling evaluation to solve the problems of
partitioning skew and intermediate data locality for the
reduce tasks called Minimum Transmission Cost Reduce
Task Scheduler [21] (MTCRS). They used communication
cost and waiting time of each reduce task as heuristic whereas
deciding which task to assign to which node in the cluster.
Their scheduling algorithm used Average Reservoir Sampling
for the spawning of parameter sizes, and location of
intermediate data partitions for their rummage-sale
mathematical estimation model. On the other hand, NoLFA
used Random Sampling.
Transferring data over the network is costly and causes
performance degradation more severely in federated clusters.
Kondikoppa et al. [22] introduced a network-aware
scheduling algorithm for Hadoop system which work in
federated clusters, improving the map tasks scheduling and
Fig. 7. Normalized execution time with NoFLA as base for normalization.
Fig. 8. Average performance gain of Hadoop, Leen, and NoLFA. Results are
normalized according the number of key-value pairs processed by each
scheme accordingly.
Fig. 9. Percent Network Traffic Overhead vs Numbers of Key-value pairs.
The upper red bars shows the value for 2 million key-value pairs while the
lower blue bar show it for 3 million key-value pairs to process.
Copyright © 2017 GiRI (Global IT Research Institute)
ICACT Transactions on Advanced Communications Technology (TACT) Vol. 6, Issue 3, May 2017 1005
consequently tries to abate the network traffic overhead
leading to improved performance gain. NoLFA has different
approach of decoupling the map and reduce tasks and
routinize the keys-capacity frequency table to achieve the
specified goal. Locality Aware Reduce Scheduling (LARS)
[23] abate data transfer in their proposed grid-enabled
MapReduce framework. Due to heterogeneity awareness of
nodes in the grid, the map data size varies leading to assigning
map tasks associated with different data size to different
worker nodes according to their computation power. The
LARS algorithm will select the nodes with largest region size
of the intermediate data to be the destination for the reduce
tasks. NoLFA achieve the desired goal with the
frequency-capacity table.
Another concern is the partitioning skew that ascends due
to an unstable distribution of map output across nodes,
causing a massive size of data input for some reduce tasks
while lesser for others. Centre-of-Gravity (CoG) [24] reduce
scheduling add locality and skew cognizance to the scheduler.
They allocates the reduce tasks to nodes nearer to nodes
creating the intermediate data for that listed reduce tasks.
SkewReduce [25] was proposed with the intention to dazed
the computation skew in MapReduce systems where the
partition run time depends on the data values as well as input
size. It uses a user defined cost function based optimizer to
regulate the partitioning parameterization of input data to
curtail the computational skew. NoLFA only consider the
case where the computational time of an input partition
depends upon the input data size rather than both. LEEN [13]
attenuates the partitioning skew and minimalize the transfer of
data using network through load balancing of the data
distribution among the nodes in the cluster. It also improve
the data locality of MapReduce tasks in the process. Unlike
LEEN, NoLFA work in heterogeneous environment as well
through our capacity awareness algorithm. Chen el al. [26]
proposed Dynamic Smart Speculative technique to alleviate
the problems with default speculation implementation like
skew, indecorous phase percentage configuration and
asynchronous twitch of certain tasks with the cost of
degradation of performance for batch jobs. Whereas
FP-Hadoop [27] introduces a new phase called intermediate
reduce (IR) to parallelize the reduce task to efficiently tackle
the reduce data skew problem. IR process the blocks of
intermediate data in parallel. NoLFA has a different approach
of decoupling the mappers and reducers tasks as introduced in
our previous work [28].
VII. CONCLUSION
Hadoop affords simplified implementation of MapReduce
framework, but its design stances challenges to attain best
performance in application execution due to tightly coupled
shuffle, obstinate scheduling and partitioning skew. In this
paper, we developed an algorithm which takes node
capabilities as heuristics to achieve better trade-off between
locality and fairness in the Hadoop MapReduce system. It
effectively improves the data locality and by comparing with
the default Hadoop’s partitioning algorithm and Leen
partitioning algorithm, on the average our approach achieves
better performance gain and outperform both of the
previously mentioned partitioning schemes.
ACKNOWLEDGMENT
This research was supported by Basic Science Research
Program through the National Research Foundation of Korea
(NRF) funded by the Ministry of Science, ICT & Future
Planning (No. 2017R1A2B4010395).
REFERENCES
[1] M. James, M. Chui, B. Brown, J. Bughin, R. Dobbs, C. Roxburgh, and
A. H. Byers, “Big data: The next frontier for innovation, competition,
and productivity,” McKinsey Glob. Inst., no. June, p. 156, 2011.
[2] P. Mell and T. Grance, “The NIST definition of cloud computing,”
NIST Spec. Publ., vol. 145, p. 7, 2011.
[3] J. Dean and S. Ghemawat, “MapReduce,” Commun. ACM, vol. 51, no.
1, p. 107, 2008.
[4] A. Matsunaga, M. Tsugawa, and J. Fortes, “CloudBLAST: Combining
MapReduce and Virtualization on Distributed Resources for
Bioinformatics Applications,” 2008 IEEE Fourth Int. Conf. eScience,
pp. 222–229, 2008.
[5] J. Ekanayake, H. Li, B. Zhang, T. Gunarathne, S. Bae, J. Qiu, and G.
Fox, “Twister : A Runtime for Iterative MapReduce,” HPDC ’10 Proc.
19th ACM Int. Symp. High Perform. Distrib. Comput., pp. 810–818,
2010.
[6] G. Mackey, S. Sehrish, J. Bent, J. Lopez, S. Habib, and J. Wang,
“Introducing map-reduce to high end computing,” 2008 3rd Petascale
Data Storage Work., pp. 1–6, 2008.
[7] C.-T. Chu, S. K. Kim, Y.-A. Lin, Y. Yu, G. Bradski, A. Y. Ng, and K.
Olukotun, “Map-Reduce for Machine Learning on Multicore,” Adv.
Neural Inf. Process. Syst. 19, pp. 281–288, 2007.
[8] Apache!, “ApacheTM Hadoop!” [Online]. Available:
http://hadoop.apache.org/. [Accessed: 19-Dec-2016].
[9] Amazon!, “Amazon Elastic Compute Cloud (EC2).” [Online].
Available: http://aws.amazon.com/ec2/. [Accessed: 19-Dec-2016].
[10] Yahoo!, “Yahoo Developer Network.” [Online]. Available:
https://developer.yahoo.com/blogs/hadoop/yahoo-launches-world-larg
est-hadoop-production-application-398.html. [Accessed: 1-Jan-2017].
[11] R. Jain, D. Chiu, and W. Hawe, “A Quantitative Measure of Fairness
and Discrimination for Resource Allocation in Shared Computer
Systems,” DEC technical report TR301, vol. cs.NI/9809, no.
DEC-TR-301. pp. 1–38, 1998.
[12] K. Shvachko, H. Kuang, S. Radia, and R. Chansler, “The Hadoop
Distributed File System,” 2010 IEEE 26th Symp. Mass Storage Syst.
Technol., pp. 1–10, 2010.
[13] S. Ibrahim, H. Jin, L. Lu, S. Wu, B. He, and L. Qi, “LEEN:
Locality/fairness-aware key partitioning for MapReduce in the cloud,”
Proc. - 2nd IEEE Int. Conf. Cloud Comput. Technol. Sci. CloudCom
2010, no. 2, pp. 17–24, 2010.
[14] T. Condie, N. Conway, P. Alvaro, J. M. Hellerstein, K. Elmeleegy, and
R. Sears, “MapReduce online,” Nsdi’10, pp. 21–21, 2010.
[15] M. Zaharia, A. Konwinski, A. Joseph, R. Katz, and I. Stoica,
“Improving MapReduce Performance in Heterogeneous
Environments.” Osdi, pp. 29–42, 2008.
[16] “Amazon EC2 Instance Types.” [Online]. Available:
https://aws.amazon.com/ec2/instance-types/. [Accessed: 3-Jan-2017].
[17] T. Ristenpart, E. Tromer, H. Shacham, and S. Savage, “Hey, You, Get
Off of My Cloud: Exploring Information Leakage in Third-Party
Compute Clouds,” Proc. 16th ACM Conf. Comput. Commun. Secur,
pp. 199–212, 2009.
[18] S. Seo, I. Jang, K. Woo, I. Kim, J.-S. Kim, and S. Maeng, “HPMR:
Prefetching and pre-shuffling in shared MapReduce computation
environment,” 2009 IEEE Int. Conf. Clust. Comput. Work, pp. 1–8,
2009.
[19] F. Ahmad, S. T. Chakradhar, A. Raghunathan, and T. N. Vijaykumar,
“ShuffleWatcher: Shuffle-aware Scheduling in Multi-tenant
MapReduce Clusters,” 2014 USENIX Annu. Tech. Conf. (USENIX
ATC 14), pp. 1–13, 2014.
[20] K. V Rashmi, M. Chowdhury, J. Kosaian, I. Stoica, K. Ramchandran,
and I. Osdi, “EC-Cache : Load-Balanced , Low-Latency Cluster
Caching with Online Erasure Coding This paper is included in the
Proceedings of the R / W,” Osdi, 2016.
Copyright © 2017 GiRI (Global IT Research Institute)
ICACT Transactions on Advanced Communications Technology (TACT) Vol. 6, Issue 3, May 2017 1006
[21] X. Tang, L. Wang, and Z. Geng, “A Reduce Task Scheduler for
MapReduce with Minimum Transmission Cost Based on Sampling
Evaluation,” vol. 8, no. 1, pp. 1–10, 2015.
[22] P. Kondikoppa, C.-H. Chiu, C. Cui, L. Xue, and S.-J. Park,
“Network-aware Scheduling of Mapreduce Framework on Distributed
Clusters over High Speed Networks,” pp. 39–44, 2012.
[23] Y. L. Su, P. C. Chen, J. B. Chang, and C. K. Shieh, “Variable-sized
map and locality-aware reduce on public-resource grids,” Futur.
Gener. Comput. Syst., vol. 27, no. 6, pp. 843–849, 2011.
[24] M. Hammoud, M. S. Rehman, and M. F. Sakr, “Center-of-gravity
reduce task scheduling to lower MapReduce network traffic,” Proc. -
2012 IEEE 5th Int. Conf. Cloud Comput. CLOUD 2012, pp. 49–58,
2012.
[25] Y. Kwon, M. Balazinska, B. Howe, and J. Rolia, “Skew-Resistant
Parallel Processing of Feature-Extracting Scientific User-Defined
Functions,” 2010.
[26] Q. Chen, C. Liu, and Z. Xiao, “Improving MapReduce performance
using smart speculative execution strategy,” IEEE Trans. Comput.,
vol. 63, no. 4, pp. 954–967, 2014.
[27] M. Liroz-Gistau, R. Akbarinia, D. Agrawal, and P. Valduriez,
“FP-Hadoop: Efficient processing of skewed MapReduce jobs,” Inf.
Syst., vol. 60, pp. 69–84, 2016.
[28] M. Hanif and C. Lee, “An Efficient Key Partitioning Scheme for
Heterogeneous MapReduce Clusters,” Proc. 18th IEEE Int. Conf. Adv.
Commun. Technol., 2016.
Muhammad Hanif was born in Pakistan. He received
his B.S. degrees in computer and software engineering
from University of Engineering and Technology
(UET), Peshawar, Pakistan in 2012. He is currently
pursuing his MS leading to PhD degree in Computer
Software Engineering at Hanyang University, Seoul,
South Korea. His current research interest includes
Cloud & Distributed Computing, Big Data Analytic
Engines, Stream Processing Frameworks, and
Distributed Scheduling.
Choonhwa Lee was born in South Korea. He has
been with the Division of Computer Science and
Engineering at Hanyang University, Seoul, South
Korea since 2004, and currently as Professor. He
received his B.S. and M.S. degrees in computer
engineering from Seoul National University (SNU),
South Korea, in 1990 and 1992, respectively, and his
Ph.D. degree in computer engineering from the
University of Florida, Gainesville, in 2003. He
worked as senior research engineer at LGIC Ltd from 1992 to 1998. He is a
member of IEEE since 2004. His research interests include cloud computing,
peer-to-peer and mobile networking and computing, and services computing
technology.
Copyright © 2017 GiRI (Global IT Research Institute)
ICACT Transactions on Advanced Communications Technology (TACT) Vol. 6, Issue 3, May 2017 1007
Abstract—This paper proposes two mathematical models as a
decision tool for the choice of radio access and transmission
solutions adapted to a geographical region through universal
access. The first mathematical model integrates the formalism
related to engineering radio network access in general as well as
financial constraints imposed by the access and universal service
funds. The second mathematical model is the equivalent of the
first applied to radio transmission systems. Services considered
are voice and data services. This approach has helped to derive
two general expressions set for radio access and radio
transmission technologies. The coverage and capacity
deployment strategy has also been combined to clarify the
optimal implementation based on financial constraints. A case
study on the Ouaddai and Oura regions in Chad accompanied
by simulations curves for wireless technologies as Wi-Fi,
WiMAX, CDMA, and Open BTS for example has shown the
efficiency of such approach.
Keyword— access network model, radio access, radio access
model, radio transmission, radio transmission model, universal
access, universal service.
I. INTRODUCTION
nformation and Communication Technologies (ICT) are
crucial for the socio-economic development of peoples and
contribute to the emergence of countries.
However, according to geographical membership and/or
———————————————————————
Manuscript received on April 11, 2017. This work was supported in part
by Chad the Regulatory Authority for Electronic Communications and Posts
(ARCEP: Autorité de Régulation des Communications Electroniques et de la
Poste) and a follow-up of the invited journal to the outstanding paper of the
18th International Conference on Advanced Communications Technology
(ICACT 2016).
Dr. Idriss Saleh BACHAR (corresponding author: +235 66204775;
e-mail: [email protected]) is with the Regulatory Authority for Electronic
Communications and Posts (ARCEP Chad), BP 5808, Ndjamena, Chad. He
is currently the GENERAL DIRECTOR.
Pr Ahmed Dooguy KORA (email: [email protected]) is with Ecole
Superieure Multinationale des Telecommunications, Dakar, Senegal. He is
the Head of Research and Innovation Department.
Pr Roger Marcelin FAYE (email: [email protected]) is with the
Electrical Engineering Department of Ecole Supérieure Polytechnique,
Cheikh Anta Diop University, Dakar, Senegal.
Pr Christelle Aupetit-Berthelemot (email:
[email protected]) is with XLIM Laboratory, SRI axis,
Resyst Team, UMR CNRS 7252, University of Limoges, 16 rue Atlantis
87068 Limoges Cedex, France. She is professor at ENSIL.
socio-economic category, the access to ICT is achieved in a
non-egalitarian and disparate manner between peoples. This
technological gap is explained by the fact that neither the
needs for services, nor the purchasing power are the same.
This leads governments to define an investment policy
fostering rural areas in order to fill the gap with dense and
profitable areas. In order to raise tele-density and reduce the
disparities of access, the authorities and regulatory agencies
have introduced the concept of universal access and services
[1-4] by dedicating a fund called Universal Service Fund
(FSU).
Considering the convergence and neutrality of
technologies, communications infrastructures and the
associated services now have a central role in economic
organization [5-9]. In fact, access to these infrastructures and
services depend on the ability of countries and citizens to
participate in the flow of communications. For that reason,
they must put in place policies which will help to avoid the
exclusion of some categories of users or geographic areas
deemed to be of non-profitable nature by the operators.
In this context access and universal service could be
considered as a major problem. This is to ensure that quality
and price for consumer satisfaction as well as profitability
from the point of view of operators might be taken into
account. In order to respond to this problem, the solution
should come from pairing technical/economic approaches and
taking into account geographical constraints inherent to each
country.
Gasmi & Recuero Virto [8] have reviewed the provision
policies of telecommunications services in rural areas for
developing countries. They have shown that these policies
differ from those usually applied in advanced countries in
their basic objectives, technological strategies deployment,
the role of the market and institutional environments. Falch &
Henten [10] have studied the appropriate policy measures to
put in place in Europe to achieve universal access. They have
shown that it is interesting to implement a combination of
different technologies and strategies. Xavier [11] provides an
overview of the principal issues related to universal access
and the provision of universal service.
Access and universal service are influenced by accessibility
parameters, cost and feasibility of services. To this end, the
UAS policy should consider technological innovation as a
Radio access and Transmission models for
universal service
Idriss Saleh BACHAR*, Ahmed Dooguy KORA**, Roger Marcelin FAYE***, Christelle
Aupetit-Berthelemot****
* Autorité de Régulation des Communications Electroniques et Postes, BP 5808, Ndjamena, TCHAD
**École Supérieure Multinationale des Télécommunications, BP 10000, Dakar, SENEGAL
*** École Supérieure Polytechnique, BP 5085, Dakar-Fann, SENEGAL
**** Xlim/SRI/Resyst, UMR-CNRS 7252, University of Limoges, 16 rue Atlantis 87068 Limoges Cedex, FRANCE
[email protected], [email protected], [email protected], [email protected]
I
Copyright © 2017 GiRI (Global IT Research Institute)
ICACT Transactions on Advanced Communications Technology (TACT) Vol. 6, Issue 3, May 2017 1018

suitable solution for UAS, covering rural areas and / or
serving low-income populations.
In this paper, access radio and transmission technologies
model for universal service are proposed. We have
established a model of access network design common to
radio technologies as well as transmission which have been
adapted to universal service funds limitations. The number of
base stations based on the project duration for each radio
technology has been derived. This has made it possible to
decide the optimal strategy deployment coupling the radio
coverage for data and voice services. The efficiency of this
approach is shown thanks to the case study applied to Ouaddai
and Oura regions in Chad.
In the rest of this article Section 2 presents the modelling
approach for determining the different elements of the access
network and profitability model. Section 3 presents the radio
modelling approach for determining the different elements of
the transmission network and profitability model. Section 4
offers a case study that will highlight on the usefulness of the
approach. Finally, Section 4 concludes this communication.
II. RADIO ACCESS MODELLING APPROACH
The optimal network modelling approach proposed
consists in determining the optimal network architecture for
the universal access and service in an area. The
methodological approach to obtain this model is based on the
access network model and that of the transmission network.
The determination of the access network model of an area is
carried out based on the telecommunications engineering
parameters, notably those related to the demographic and
financial aspects. Thus, through this area data, the population
addressable to the universal access and the bandwidth and the
necessary number of base stations are determined, then the
investment and operation costs (CAPEX and OPEX) are
assessed in addition the energy related expenses and liabilities
are defined.
The population addressable to the universal service is
given by the expression:
(1)
where P is the population of the target area, PS the
population having access to the universal service and TN the
service penetration rate.
The bandwidth brought back to the addressable population
is determined based on the data rate/subscriber need, the data
rate by user supplied by an access technology and the
contention rate. It is expressed by the following relationship:
(2)
where DA represents the data rate per subscriber, PS the
population having access to the universal service and T the
contention rate.
It is worth noting that the data rate/subscriber
simultaneously takes the voice and data into consideration
and that the contention rate has to be taken so that, even in the
most unfavorable case, the voice minimum output is kept for
the user, which is translated by constraint expressing that the
access technology has to easily bear the cost of the subscribers
data rate needs. The determination of the necessary number of
base stations of the access area allies a coverage approach
with a capacity approach in order to avoid the network
oversizing and under-sizing problems. Thus, this number is
given by the following relationship:
(3)
where and
with SC the surface to cover and SBSC the surface covered
by a base station, CapBSX the bandwidth base station capacity
brought back to a technology X and this station use rate, m
and n are the coefficients related to the coverage and capacity
needs. From equation (3), the BSX is expressed in function of
m by the following expression:
(4)
The total cost of the investment expenses (CAPEX) of a
technology X is given by the expression:
(5)
where is the investment unit cost of a given
technology X.
As for the total cost of the operation expenses (OPEX) of a
technology X, taking into consideration its reducing
percentage , it is determined by the expression:
(6)
with , and
where is the operation unit cost of a base station
at year N brought back to technology X.
As a matter of fact, the operation decreases each year with a
positive constant reducing percentage . This decrease is due
to the fact that a piece of equipment is used, some mastery is
acquired which reduces the operation cost as the years go.
The access total cost of a technology X is the sum of total
CAPEX, OPEX total operation over the whole duration of the
project and allied expenses. The allied expenses include the
investment and operation expenses of the liability
infrastructures as well as those of energy workshops. Taking
into account, on the one hand, that the OPEX cost represents
5% of the CAPEX costs [12] and, on the other hand, that the
energy OPEX cost represents 25% of the CAPEX in energy
[12], the investment and operation costs of the liability
infrastructures as well as those of the energy workshops,
while simultaneously integrating the OPEX and CAPEX costs,
are determined by the following expressions:
(7)
(8)
with ci the liability infrastructure unit cost and ce the energy
unit cost.
Thus, the allied expenses CC are given by the expression:
(9)
whereas the access total cost is given by the following
relationship:
(10)
Expressing the OPEX summation of the access technology
and using equation (5), it is possible to write:
(11)
Copyright © 2017 GiRI (Global IT Research Institute)
ICACT Transactions on Advanced Communications Technology (TACT) Vol. 6, Issue 3, May 2017 1019

where and
The following expression is obtained:
(12)
Thus, the total cost of the access network is determined by
the following global expression:
(13)
In practice, a region or an area is the object of a commercial
launching when the total set of stations are deployed. This
simplifies the expression (13) which becomes:
(14)
(15)
For a given technology, it is possible to establish a
connection between the opex(BSX0) and the capex(BSX ).
Suppose in this case that this connection is α, then expression
(16) becomes:
(16)
Then, we can finally get BSX expression as follows:
(17)
In a given locality, the access technology X to choose will
be the one that will have the lowest access total cost CTAX
among all the technologies submitted to this algorithm.
This profitability makes it possible to evaluate the total
amount of the subsidy necessary to achieve the project but
also the adequate purchasing power (ARPU) needed to ensure
the population accessibility to the service. The analysis of the
model shows that the whole set of the expenses from which
the subsidy on the project duration is subtracted has to be
lower than what the operator will earn over the same duration
(number of subscribers over the project study duration
multiplied by the ARPU.
III. RADIO TRANSMISSION MODELLING APPROACH
The radio transmission model presents all the equations
that ensure the transmission of information between covered
area and the core of the network through the national
backbone. As with the access model, the elaboration of the
transmission model follows several steps. These steps are
presented through the following lines:
Determining the number of active relay stations to reach
the backbone is estimated with the following formula:
(18)
where the number of active relay stations NXT is determined
by the ratio of the distance between the operator network (D)
over the range of an XT (DXT) radio transmission technology.
Let’s consider that the cost of an active relay station is the
same as that of the main station. The verification of the
capacity provided by XT transmission technology consists in
reassuring that the throughput offered by the transmission
technology can withstand the throughput that will be
submitted to it during the entire study period of the project.
This is done based on the following inequality:
(19)
The (19) inequality above means that the capacity of the
transmission technology is greater than the sum of the total
off-net voice rate (A5voiceT * α) in addition to the total data
rate in the previous project year of study (A5dataT) to ensure
that the dimensioning is adapted throughout the duration of
study T of the project. The total CAPEX cost of the XT
transmission technology is given by the following formula:
(20)
The total CAPEX cost of transmission technology (B2XT) is
calculated by multiplying the number of active relay stations
plus the main station by the CAPEX of a transmission
technology station. The total cost of the OPEX of the XT
transmission technology is given by the following relation:
(21)
As for access technology, the OPEX transmission
technology is clean every year. Indeed, the latter is subject to
a decrease over the years due to the reduction coefficient ‘‘r’’
of the OPEX in transmission. One gets:
(22)
which represents the cost of the OPEX of a transmission
technology XT to year N; the number of transmission stations
is multiplied by the cost of OPEXs in year N. However,
OPEXs are reduced each year due to the progressive control
of the technology. The cost of the OPEX B3XTN is therefore a
geometric sequence based on (1-r) with r ≠ 1 and r ≠ 0.
Thus, one can easily determine the sum of the OPEX of the
radio transmission technology XT over the duration of the
project as follows:
(23)
This justifies the expression of the total cost of the OPEX
B3XT over the study duration T of the project.
In order for the operator to have access to the Internet, he must
pay an annual cost according to the total data throughput of a
specific year. To actually calculate this cost over the duration
of study T of the project, the following expression (24) can be
used:
(24)
where the total cost of Internet access (B3data) is
calculated by multiplying the total data rate over the entire
duration of the project ( ) by the cost per Mbps
which is set by the legislation of a given country (B6data).
Copyright © 2017 GiRI (Global IT Research Institute)
ICACT Transactions on Advanced Communications Technology (TACT) Vol. 6, Issue 3, May 2017 1020
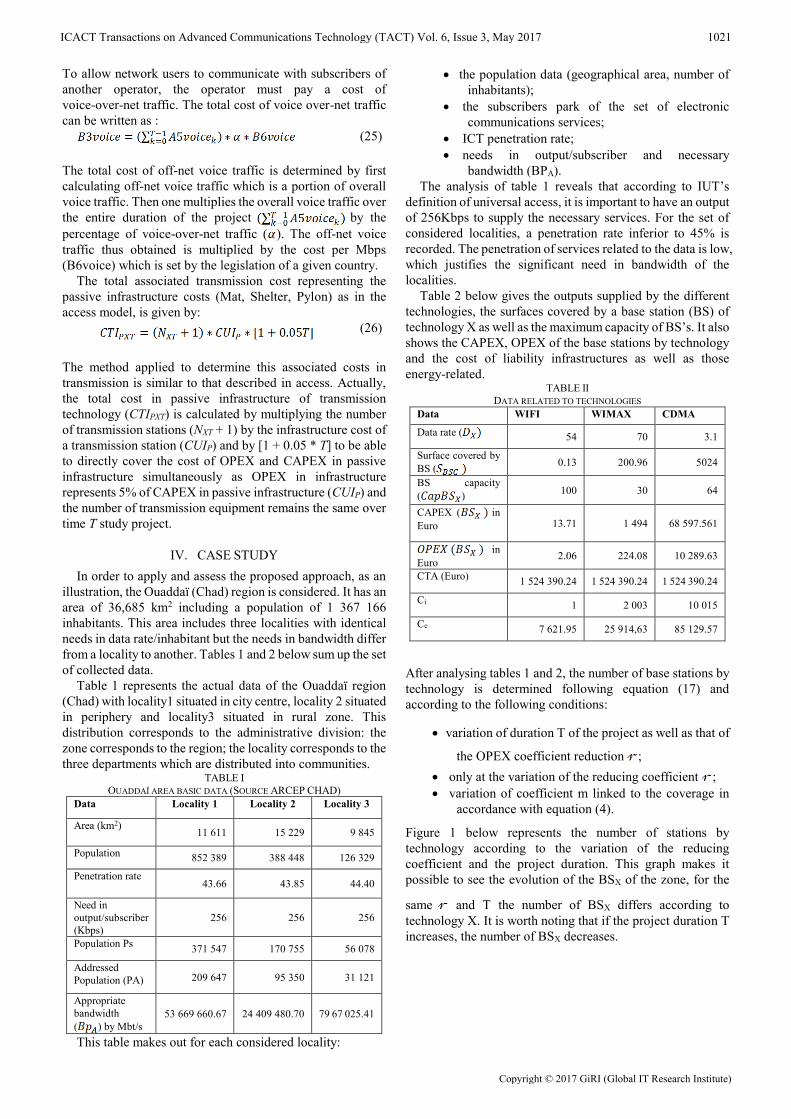
To allow network users to communicate with subscribers of
another operator, the operator must pay a cost of
voice-over-net traffic. The total cost of voice over-net traffic
can be written as :
(25)
The total cost of off-net voice traffic is determined by first
calculating off-net voice traffic which is a portion of overall
voice traffic. Then one multiplies the overall voice traffic over
the entire duration of the project by the
percentage of voice-over-net traffic ( ). The off-net voice
traffic thus obtained is multiplied by the cost per Mbps
(B6voice) which is set by the legislation of a given country.
The total associated transmission cost representing the
passive infrastructure costs (Mat, Shelter, Pylon) as in the
access model, is given by:
(26)
The method applied to determine this associated costs in
transmission is similar to that described in access. Actually,
the total cost in passive infrastructure of transmission
technology (CTIPXT) is calculated by multiplying the number
of transmission stations (NXT + 1) by the infrastructure cost of
a transmission station (CUIP) and by [1 + 0.05 * T] to be able
to directly cover the cost of OPEX and CAPEX in passive
infrastructure simultaneously as OPEX in infrastructure
represents 5% of CAPEX in passive infrastructure (CUIP) and
the number of transmission equipment remains the same over
time T study project.
IV. CASE STUDY
In order to apply and assess the proposed approach, as an
illustration, the Ouaddaï (Chad) region is considered. It has an
area of 36,685 km2 including a population of 1 367 166
inhabitants. This area includes three localities with identical
needs in data rate/inhabitant but the needs in bandwidth differ
from a locality to another. Tables 1 and 2 below sum up the set
of collected data.
Table 1 represents the actual data of the Ouaddaï region
(Chad) with locality1 situated in city centre, locality 2 situated
in periphery and locality3 situated in rural zone. This
distribution corresponds to the administrative division: the
zone corresponds to the region; the locality corresponds to the
three departments which are distributed into communities. TABLE I
OUADDAÏ AREA BASIC DATA (SOURCE ARCEP CHAD)
Data Locality 1 Locality 2 Locality 3
Area (km2) 11 611 15 229 9 845
Population 852 389 388 448 126 329
Penetration rate 43.66 43.85 44.40
Need in
output/subscriber
(Kbps)
256 256 256
Population Ps 371 547 170 755 56 078
Addressed
Population (PA) 209 647 95 350 31 121
Appropriate
bandwidth
( ) by Mbt/s
53 669 660.67 24 409 480.70 79 67 025.41
This table makes out for each considered locality:
the population data (geographical area, number of
inhabitants);
the subscribers park of the set of electronic
communications services;
ICT penetration rate;
needs in output/subscriber and necessary
bandwidth (BPA).
The analysis of table 1 reveals that according to IUT’s
definition of universal access, it is important to have an output
of 256Kbps to supply the necessary services. For the set of
considered localities, a penetration rate inferior to 45% is
recorded. The penetration of services related to the data is low,
which justifies the significant need in bandwidth of the
localities.
Table 2 below gives the outputs supplied by the different
technologies, the surfaces covered by a base station (BS) of
technology X as well as the maximum capacity of BS’s. It also
shows the CAPEX, OPEX of the base stations by technology
and the cost of liability infrastructures as well as those
energy-related. TABLE II
DATA RELATED TO TECHNOLOGIES
Data WIFI WIMAX CDMA
Data rate ( 54 70 3.1
Surface covered by
BS ( 0.13 200.96 5024
BS capacity
( ) 100 30 64
CAPEX ( in
Euro 13.71 1 494 68 597.561
in
Euro 2.06 224.08 10 289.63
CTA (Euro) 1 524 390.24 1 524 390.24 1 524 390.24
Ci 1 2 003 10 015
Ce 7 621.95 25 914,63 85 129.57
After analysing tables 1 and 2, the number of base stations by
technology is determined following equation (17) and
according to the following conditions:
variation of duration T of the project as well as that of
the OPEX coefficient reduction ;
only at the variation of the reducing coefficient ;
variation of coefficient m linked to the coverage in
accordance with equation (4).
Figure 1 below represents the number of stations by
technology according to the variation of the reducing
coefficient and the project duration. This graph makes it
possible to see the evolution of the BSX of the zone, for the
same and T the number of BSX differs according to
technology X. It is worth noting that if the project duration T
increases, the number of BSX decreases.
Copyright © 2017 GiRI (Global IT Research Institute)
ICACT Transactions on Advanced Communications Technology (TACT) Vol. 6, Issue 3, May 2017 1021
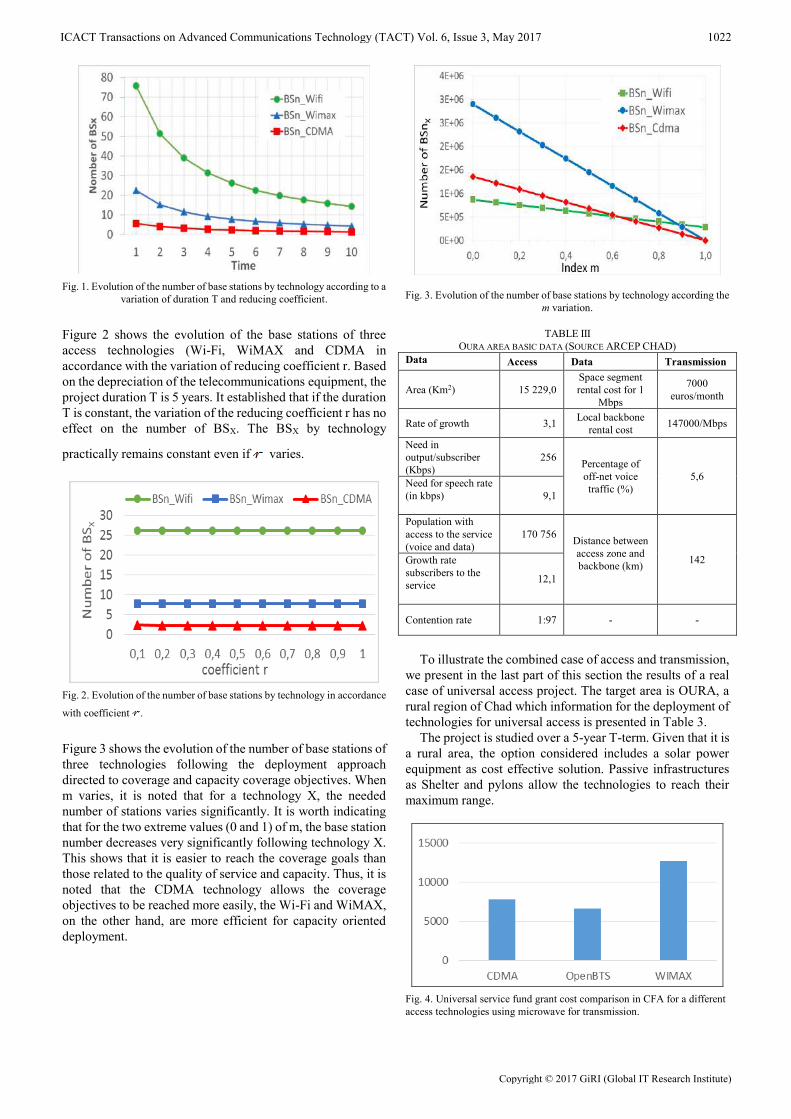
Fig. 1. Evolution of the number of base stations by technology according to a
variation of duration T and reducing coefficient.
Figure 2 shows the evolution of the base stations of three
access technologies (Wi-Fi, WiMAX and CDMA in
accordance with the variation of reducing coefficient r. Based
on the depreciation of the telecommunications equipment, the
project duration T is 5 years. It established that if the duration
T is constant, the variation of the reducing coefficient r has no
effect on the number of BSX. The BSX by technology
practically remains constant even if varies.
Fig. 2. Evolution of the number of base stations by technology in accordance
with coefficient .
Figure 3 shows the evolution of the number of base stations of
three technologies following the deployment approach
directed to coverage and capacity coverage objectives. When
m varies, it is noted that for a technology X, the needed
number of stations varies significantly. It is worth indicating
that for the two extreme values (0 and 1) of m, the base station
number decreases very significantly following technology X.
This shows that it is easier to reach the coverage goals than
those related to the quality of service and capacity. Thus, it is
noted that the CDMA technology allows the coverage
objectives to be reached more easily, the Wi-Fi and WiMAX,
on the other hand, are more efficient for capacity oriented
deployment.
Fig. 3. Evolution of the number of base stations by technology according the
m variation.
TABLE III
OURA AREA BASIC DATA (SOURCE ARCEP CHAD)
Data Access Data Transmission
Area (Km2) 15 229,0
Space segment
rental cost for 1
Mbps
7000
euros/month
Rate of growth 3,1 Local backbone
rental cost 147000/Mbps
Need in
output/subscriber
(Kbps)
256 Percentage of
off-net voice
traffic (%)
5,6 Need for speech rate
(in kbps)
9,1
Population with
access to the service
(voice and data)
170 756 Distance between
access zone and
backbone (km)
142 Growth rate
subscribers to the
service
12,1
Contention rate 1:97 - -
To illustrate the combined case of access and transmission,
we present in the last part of this section the results of a real
case of universal access project. The target area is OURA, a
rural region of Chad which information for the deployment of
technologies for universal access is presented in Table 3.
The project is studied over a 5-year T-term. Given that it is
a rural area, the option considered includes a solar power
equipment as cost effective solution. Passive infrastructures
as Shelter and pylons allow the technologies to reach their
maximum range.
Fig. 4. Universal service fund grant cost comparison in CFA for a different
access technologies using microwave for transmission.
Copyright © 2017 GiRI (Global IT Research Institute)
ICACT Transactions on Advanced Communications Technology (TACT) Vol. 6, Issue 3, May 2017 1022
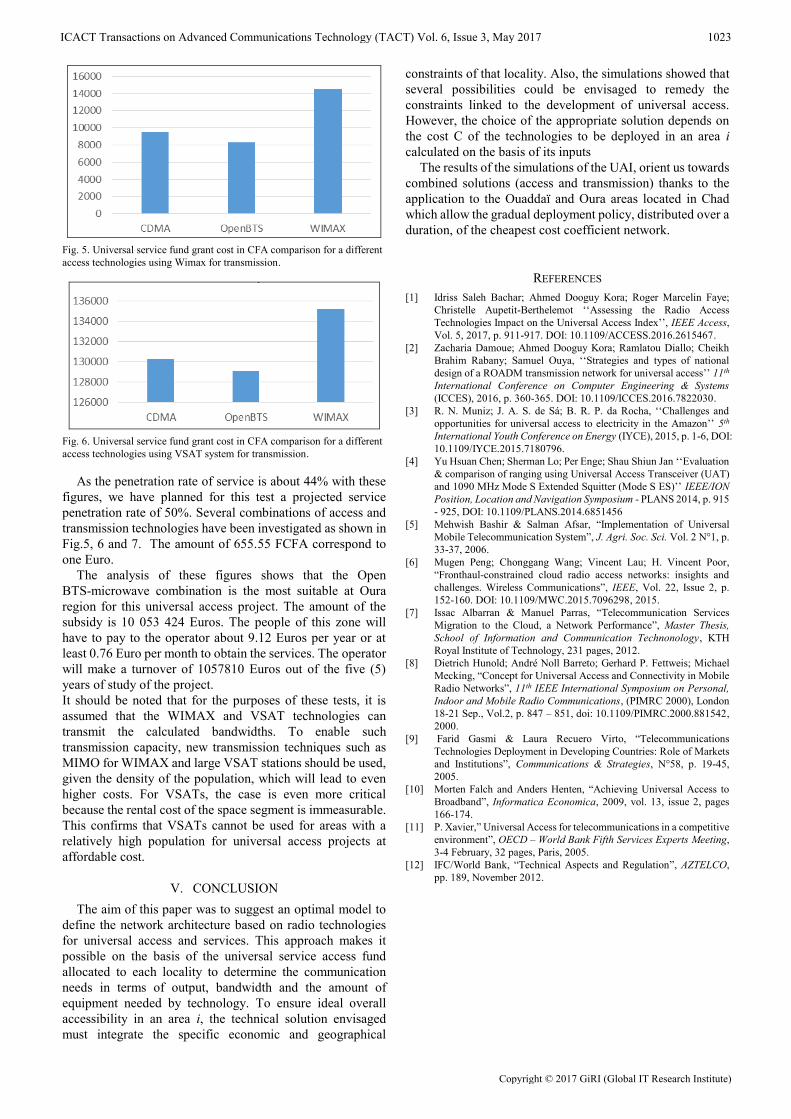
Fig. 5. Universal service fund grant cost in CFA comparison for a different
access technologies using Wimax for transmission.
Fig. 6. Universal service fund grant cost in CFA comparison for a different
access technologies using VSAT system for transmission.
As the penetration rate of service is about 44% with these
figures, we have planned for this test a projected service
penetration rate of 50%. Several combinations of access and
transmission technologies have been investigated as shown in
Fig.5, 6 and 7. The amount of 655.55 FCFA correspond to
one Euro.
The analysis of these figures shows that the Open
BTS-microwave combination is the most suitable at Oura
region for this universal access project. The amount of the
subsidy is 10 053 424 Euros. The people of this zone will
have to pay to the operator about 9.12 Euros per year or at
least 0.76 Euro per month to obtain the services. The operator
will make a turnover of 1057810 Euros out of the five (5)
years of study of the project.
It should be noted that for the purposes of these tests, it is
assumed that the WIMAX and VSAT technologies can
transmit the calculated bandwidths. To enable such
transmission capacity, new transmission techniques such as
MIMO for WIMAX and large VSAT stations should be used,
given the density of the population, which will lead to even
higher costs. For VSATs, the case is even more critical
because the rental cost of the space segment is immeasurable.
This confirms that VSATs cannot be used for areas with a
relatively high population for universal access projects at
affordable cost.
V. CONCLUSION
The aim of this paper was to suggest an optimal model to
define the network architecture based on radio technologies
for universal access and services. This approach makes it
possible on the basis of the universal service access fund
allocated to each locality to determine the communication
needs in terms of output, bandwidth and the amount of
equipment needed by technology. To ensure ideal overall
accessibility in an area i, the technical solution envisaged
must integrate the specific economic and geographical
constraints of that locality. Also, the simulations showed that
several possibilities could be envisaged to remedy the
constraints linked to the development of universal access.
However, the choice of the appropriate solution depends on
the cost C of the technologies to be deployed in an area i
calculated on the basis of its inputs
The results of the simulations of the UAI, orient us towards
combined solutions (access and transmission) thanks to the
application to the Ouaddaï and Oura areas located in Chad
which allow the gradual deployment policy, distributed over a
duration, of the cheapest cost coefficient network.
REFERENCES
[1] Idriss Saleh Bachar; Ahmed Dooguy Kora; Roger Marcelin Faye;
Christelle Aupetit-Berthelemot ‘‘Assessing the Radio Access
Technologies Impact on the Universal Access Index’’, IEEE Access,
Vol. 5, 2017, p. 911-917. DOI: 10.1109/ACCESS.2016.2615467.
[2] Zacharia Damoue; Ahmed Dooguy Kora; Ramlatou Diallo; Cheikh
Brahim Rabany; Samuel Ouya, ‘‘Strategies and types of national
design of a ROADM transmission network for universal access’’ 11th
International Conference on Computer Engineering & Systems
(ICCES), 2016, p. 360-365. DOI: 10.1109/ICCES.2016.7822030.
[3] R. N. Muniz; J. A. S. de Sá; B. R. P. da Rocha, ‘‘Challenges and
opportunities for universal access to electricity in the Amazon’’ 5th
International Youth Conference on Energy (IYCE), 2015, p. 1-6, DOI:
10.1109/IYCE.2015.7180796.
[4] Yu Hsuan Chen; Sherman Lo; Per Enge; Shau Shiun Jan ‘‘Evaluation
& comparison of ranging using Universal Access Transceiver (UAT)
and 1090 MHz Mode S Extended Squitter (Mode S ES)’’ IEEE/ION
Position, Location and Navigation Symposium - PLANS 2014, p. 915
- 925, DOI: 10.1109/PLANS.2014.6851456
[5] Mehwish Bashir & Salman Afsar, “Implementation of Universal
Mobile Telecommunication System”, J. Agri. Soc. Sci. Vol. 2 N°1, p.
33-37, 2006.
[6] Mugen Peng; Chonggang Wang; Vincent Lau; H. Vincent Poor,
“Fronthaul-constrained cloud radio access networks: insights and
challenges. Wireless Communications”, IEEE, Vol. 22, Issue 2, p.
152-160. DOI: 10.1109/MWC.2015.7096298, 2015.
[7] Issac Albarran & Manuel Parras, “Telecommunication Services
Migration to the Cloud, a Network Performance”, Master Thesis,
School of Information and Communication Technonology, KTH
Royal Institute of Technology, 231 pages, 2012.
[8] Dietrich Hunold; André Noll Barreto; Gerhard P. Fettweis; Michael
Mecking, “Concept for Universal Access and Connectivity in Mobile
Radio Networks”, 11th IEEE International Symposium on Personal,
Indoor and Mobile Radio Communications, (PIMRC 2000), London
18-21 Sep., Vol.2, p. 847 – 851, doi: 10.1109/PIMRC.2000.881542,
2000.
[9] Farid Gasmi & Laura Recuero Virto, “Telecommunications
Technologies Deployment in Developing Countries: Role of Markets
and Institutions”, Communications & Strategies, N°58, p. 19-45,
2005.
[10] Morten Falch and Anders Henten, “Achieving Universal Access to
Broadband”, Informatica Economica, 2009, vol. 13, issue 2, pages
166-174.
[11] P. Xavier,” Universal Access for telecommunications in a competitive
environment”, OECD – World Bank Fifth Services Experts Meeting,
3-4 February, 32 pages, Paris, 2005.
[12] IFC/World Bank, “Technical Aspects and Regulation”, AZTELCO,
pp. 189, November 2012.
Copyright © 2017 GiRI (Global IT Research Institute)
ICACT Transactions on Advanced Communications Technology (TACT) Vol. 6, Issue 3, May 2017 1023
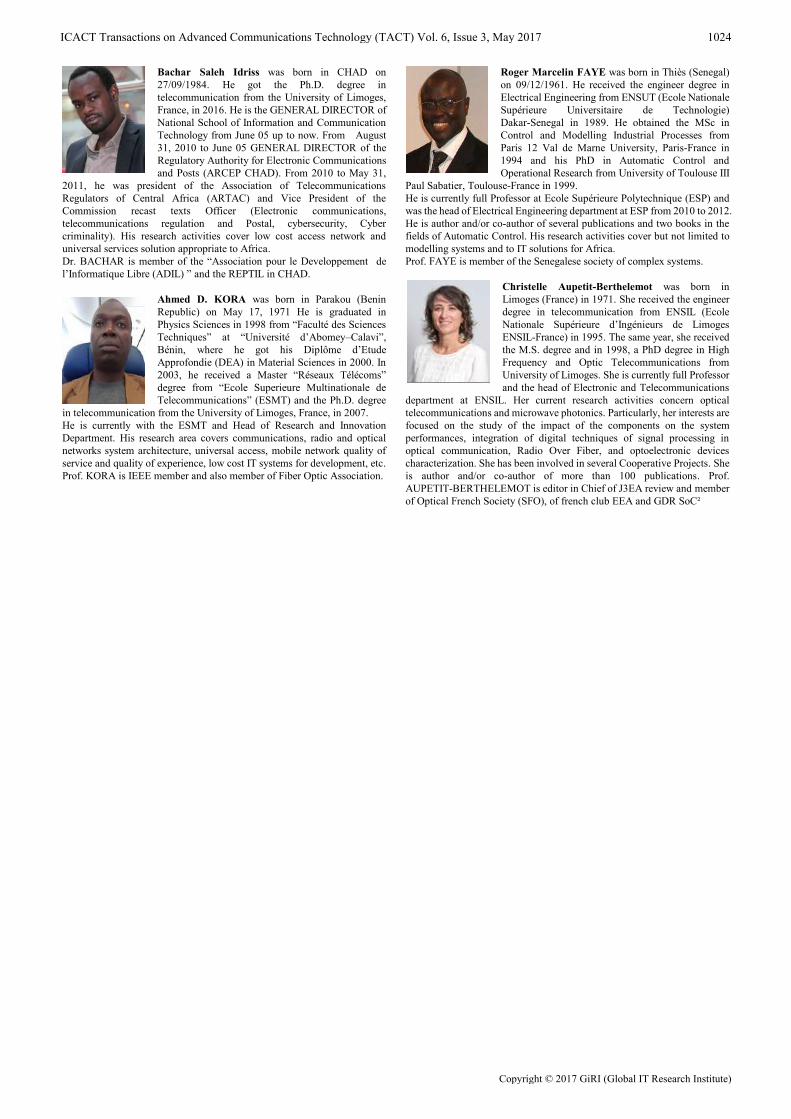
Bachar Saleh Idriss was born in CHAD on
27/09/1984. He got the Ph.D. degree in
telecommunication from the University of Limoges,
France, in 2016. He is the GENERAL DIRECTOR of
National School of Information and Communication
Technology from June 05 up to now. From August
31, 2010 to June 05 GENERAL DIRECTOR of the
Regulatory Authority for Electronic Communications
and Posts (ARCEP CHAD). From 2010 to May 31,
2011, he was president of the Association of Telecommunications
Regulators of Central Africa (ARTAC) and Vice President of the
Commission recast texts Officer (Electronic communications,
telecommunications regulation and Postal, cybersecurity, Cyber
criminality). His research activities cover low cost access network and
universal services solution appropriate to Africa.
Dr. BACHAR is member of the “Association pour le Developpement de
l’Informatique Libre (ADIL) ” and the REPTIL in CHAD.
Ahmed D. KORA was born in Parakou (Benin
Republic) on May 17, 1971 He is graduated in
Physics Sciences in 1998 from “Faculté des Sciences
Techniques” at “Université d’Abomey–Calavi”,
Bénin, where he got his Diplôme d’Etude
Approfondie (DEA) in Material Sciences in 2000. In
2003, he received a Master “Réseaux Télécoms”
degree from “Ecole Superieure Multinationale de
Telecommunications” (ESMT) and the Ph.D. degree
in telecommunication from the University of Limoges, France, in 2007.
He is currently with the ESMT and Head of Research and Innovation
Department. His research area covers communications, radio and optical
networks system architecture, universal access, mobile network quality of
service and quality of experience, low cost IT systems for development, etc.
Prof. KORA is IEEE member and also member of Fiber Optic Association.
Roger Marcelin FAYE was born in Thiès (Senegal)
on 09/12/1961. He received the engineer degree in
Electrical Engineering from ENSUT (Ecole Nationale
Supérieure Universitaire de Technologie)
Dakar-Senegal in 1989. He obtained the MSc in
Control and Modelling Industrial Processes from
Paris 12 Val de Marne University, Paris-France in
1994 and his PhD in Automatic Control and
Operational Research from University of Toulouse III
Paul Sabatier, Toulouse-France in 1999.
He is currently full Professor at Ecole Supérieure Polytechnique (ESP) and
was the head of Electrical Engineering department at ESP from 2010 to 2012.
He is author and/or co-author of several publications and two books in the
fields of Automatic Control. His research activities cover but not limited to
modelling systems and to IT solutions for Africa.
Prof. FAYE is member of the Senegalese society of complex systems.
Christelle Aupetit-Berthelemot was born in
Limoges (France) in 1971. She received the engineer
degree in telecommunication from ENSIL (Ecole
Nationale Supérieure d’Ingénieurs de Limoges
ENSIL-France) in 1995. The same year, she received
the M.S. degree and in 1998, a PhD degree in High
Frequency and Optic Telecommunications from
University of Limoges. She is currently full Professor
and the head of Electronic and Telecommunications
department at ENSIL. Her current research activities concern optical
telecommunications and microwave photonics. Particularly, her interests are
focused on the study of the impact of the components on the system
performances, integration of digital techniques of signal processing in
optical communication, Radio Over Fiber, and optoelectronic devices
characterization. She has been involved in several Cooperative Projects. She
is author and/or co-author of more than 100 publications. Prof.
AUPETIT-BERTHELEMOT is editor in Chief of J3EA review and member
of Optical French Society (SFO), of french club EEA and GDR SoC²
Copyright © 2017 GiRI (Global IT Research Institute)
ICACT Transactions on Advanced Communications Technology (TACT) Vol. 6, Issue 3, May 2017 1024