Embed Size (px)
Citation preview

Contents lists available at ScienceDirect
Journal of Accounting and Economics
Journal of Accounting and Economics 63 (2017) 358–384
http://d0165-41
n CorrE-m
journal homepage: www.elsevier.com/locate/jae
Benefits and costs of Sarbanes-Oxley Section 404(b)exemption: Evidence from small firms’ internal controldisclosures
Weili Ge a, Allison Koester b, Sarah McVay a,n
a Foster School of Business, University of Washington, United Statesb McDonough School of Business, Georgetown University, United States
a r t i c l e i n f o
Article history:Received 4 January 2016Received in revised form2 January 2017Accepted 9 January 2017Available online 21 March 2017
Keywords:Internal controls over financial reportingRegulationDisclosure accuracyNon-accelerated filersSection 404
x.doi.org/10.1016/j.jacceco.2017.01.00101/& 2017 Elsevier B.V. All rights reserved.
esponding author.ail addresses: [email protected] (W. Ge), alliso
a b s t r a c t
We quantify measurable benefits and costs of exempting firms from auditor oversight ofinternal control effectiveness disclosures. We measure the benefit of exemption as anaggregate $388 million in audit fee savings from 2007–2014. The costs stem from internalcontrol misreporting: an aggregate $719 million of lower operating performance due tonon-remediation and a $935 million delay in aggregate market value decline due to thefailure to disclose ineffective internal controls. The audit fee savings benefit shareholdersof all exempt firms, whereas the costs are borne by shareholders of only a fraction ofexempt firms (the internal control misreporters).
& 2017 Elsevier B.V. All rights reserved.
1. Introduction
Despite a decade of research on the Sarbanes-Oxley Act of 2002 (SOX), the net benefits and costs of the regulation remainelusive (Coates and Srinivasan, 2014). The most costly and hotly debated provision of SOX is Section 404(b), which requires auditoroversight of the effectiveness of firms’ internal control over financial reporting (hereafter internal controls). We investigatemeasurable benefits and costs of exempting firms from 404(b). Such an investigation is important for stakeholders of the morethan five thousand firms currently exempt from this regulation (PCAOB, 2015). In addition, our investigation provides timely anduseful information as Congress considers exempting additional firms (U.S. Congress, 2016a, 2016b).
Section 404(a) requires that management document, test, and assess the effectiveness of their firms’ internal controls,and Section 404(b) requires that auditors provide an independent opinion on client firms’ internal control effectiveness.Sections 404(a) and 404(b) became effective in 2004 for firms with a public float of at least $75 million. However, the highaudit fees associated with implementation motivated the SEC to issue numerous deferrals for firms with public floats of lessthan $75 million (e.g., Palmrose, 2010; Kinney and Shepardson, 2011; Coates and Srinivasan, 2014). For these firms (here-after “exempt firms”), the deferrals ultimately culminated in the implementation of 404(a) in 2007 and a permanent ex-emption from 404(b) in 2010.
We examine the measurable benefits and costs to shareholders that result from 404(b) exemption. Using audit feesavings as a proxy for the benefit of exemption, we compare the relative increase in audit fees of exempt firms and
[email protected] (A. Koester), [email protected] (S. McVay).
W. Ge et al. / Journal of Accounting and Economics 63 (2017) 358–384 359
non-exempt firms from 2003 to 2014.1 We attribute the 35.7 percent incremental increase in non-exempt firms’ audit feesto 404(b) compliance.2 If exempt firms had experienced this incremental 35.7 percent increase, the average exempt firmwould have paid an additional $73,165 in annual audit fees from 2007 through 2014 (or an estimated $585,320 per firm;$73,165�8 years). Thus, exemption results in an aggregate of $388 million in 404(b)-related audit fee savings for the 5,302exempt firm-years in our sample. This benefit accrues to shareholders of all exempt firms.
The key concern of exemption is that it leads to internal control misreporting (IC misreporting).3 IC misreporting imposesat least two measurable costs on current and prospective shareholders: lower operating performance due to non-re-mediation and market values that fail to reflect a firm's underlying internal control status. Prior research finds that changesto external reporting affect managerial decision-making by changing managers’ information sets (Shroff, 2017). Consistentwith these findings, accounting information generated by effective internal control systems is more useful for managerialdecision making, and firms that disclose and subsequently remediate ineffective internal controls experience an im-provement in operating performance (Cheng et al., 2013; Feng et al., 2015). We examine changes in future earnings to inferwhether firms experience lower operating performance stemming from non-remediation. Prior research also finds thatinvestors react negatively to the disclosure of ineffective internal controls (Hammersley et al., 2008). We measure marketvalues that fail to reflect a firm's underlying internal control status using future abnormal stock returns.
To identify IC misreporting, we estimate a prediction model of internal control effectiveness using non-exempt firms andapply the coefficients from this out-of-sample model to exempt firms. The prediction model explains 89 percent of the areaunder the ROC curve, indicating excellent discrimination (Hosmer and Lemeshow, 2000, p.162). We predict that 20.2 percentof exempt firms should disclose ineffective internal controls, whereas only 10.9 percent do so. Thus, we estimate that9.3 percent of exempt firms (¼20.2–10.9) disclose effective internal controls but maintain ineffective internal controls; weclassify these firms as “suspected IC misreporters.” Numerous tests validate our suspected IC misreporter classification.
We cannot assume that 404(b) compliance would fully curb IC misreporting, however, as prior research documents ICmisreporting even among firms subject to Section 404(b) (e.g., Rice and Weber, 2012; Rice et al., 2015; DeFond and Lennox,2017). To estimate the amount of IC misreporting that 404(b) would curb, we track 254 firms that reach the $75 millionpublic float size threshold and switch from exempt to non-exempt status. We find that 38.1 percent of suspected IC mis-reporters disclose ineffective internal controls once they become subject to 404(b). This 38.1 percent serves as our estimateof how much 404(b) curbs IC misreporting, suggesting that 404(b) compliance would lower IC misreporting from 9.3 to5.8 percent.
To assess the costs of IC misreporting we compare the future earnings and abnormal stock returns of exempt firms thatdisclose ineffective internal controls to those of suspected IC misreporters. Exempt firms that disclose ineffective internalcontrols experience a marked improvement in earnings in the three years following the disclosure, which we empiricallylink to the remediation of ineffective internal controls. In contrast, suspected IC misreporters do not experience a futureearnings improvement, on average. This finding is consistent with these firms failing to remediate their latent internalcontrol weaknesses and therefore relying on low quality internal information when making operating decisions. We esti-mate that the suspected IC misreporters in our sample fail to realize a present value of $1.7 million per firm in earnings inthe three years following their IC misreporting, which we attribute to their failure to remediate ineffective internal controls.The $1.7 million estimate is conditional on 404(b) curbing 38.1 percent of IC misreporting and a six percent discount rate.This cost, borne only by IC misreporter shareholders (or an estimated 9.3 percent of exempt firms in our sample), aggregatesto a total of $719 million. Discounting the future foregone earnings back to period t (i.e., the year of 404(b) exemption)allows the $719 million cost to be directly comparable to the $388 million audit fee savings.4
We also find that firms that disclose ineffective internal controls experience more negative abnormal stock returns in theyear of the disclosure, relative to suspected IC misreporters. Our evidence suggests that IC misreporting delays the stockprice incorporation of ineffective internal controls, in that stock price ultimately impounds this information as IC mis-reporters experience the negative consequences of ineffective internal controls such as a higher propensity to restate anddelist. We estimate that IC misreporting delays a market value decline of $2.2 million for the average IC misreporter,conditional on 404(b) curbing 38.1 percent of IC misreporting, aggregating to a total of $935 million. This cost is borne bynew shareholders who relied on the inaccurate internal control disclosures of IC misreporters. While lower future operatingperformance associated with IC misreporting is avoidable through remediation, the negative stock returns associated withIC misreporting are merely delayed.
We conclude with a bounds analysis to illustrate how various design choices affect our inferences. In our previouslydiscussed benefits analysis, we compare the change in audit fees between exempt firms and non-exempt firms with a
1 In our analyses, “non-exempt firms” are the smallest firms subject to 404(b) with market capitalizations of $300 million or less following Kinney andShepardson (2011).
2 The 35.7 percent incremental increase in audit fees is qualitatively similar to the increase in audit fees for firms that switch from exempt to non-exempt status (34.9 percent) and exempt firms that begin to voluntarily comply with 404(b) (29.7 percent).
3 Kinney and Shepardson (2011) provide evidence that a similar percentage of exempt firms disclose ineffective internal controls as non-exempt firms,yet exempt firms incur a fraction of the audit cost. The authors conclude that 404(a) could be a cost-effective alternative to 404(b), which implicitlyassumes that exempt firms have the same underlying distribution of ineffective internal controls as non-exempt firms. Their conclusion is premature,however, if exempt firms are more likely to maintain ineffective internal controls (i.e., exempt firms are more likely to misreport the effectiveness of theirinternal controls).
4 Undiscounted foregone earnings are $2.0 million per suspected IC misreporter and $866 million in the aggregate.

W. Ge et al. / Journal of Accounting and Economics 63 (2017) 358–384360
market capitalization of $300 million or less, and estimate aggregate audit fee savings due to exemption of $388 million. Theexpected benefits range from $354 million to $463 million when we compare exempt firms to non-exempt firms with amarket capitalization of less than $150 million or $200 million. In our previously discussed cost analyses, we define sus-pected IC misreporters as exempt firms that disclose effective internal controls and have a predicted score of maintainingineffective internal controls in the top 20th percentile. We estimate that operating performance of these suspected ICmisreporters is lower by $719 million. When we choose a cutoff value at the 10th, 15th, 25th, or 30th percentile, ourinferences that costs continue to exceed the benefits remain the same. For example, using the 15th (25th) percentile cutoffyields a cost estimate of $577 ($837) million. We focus on the top 20th percentile cutoff value throughout the paper becausethis threshold yields an IC misreporting rate of 10.6 percent, which is nearest to the 9.3 percent IC misreporting suggestedby our prediction model.
To conclude, we develop a prediction model that auditors, regulators, analysts, and investors can utilize to identify firmsmost likely to misreport their ineffective internal controls. This model indicates that 9.3 percent of exempt firms fail todisclose ineffective internal controls. Further analyses indicate that IC misreporting would fall by 38 percent (from 9.3 to5.8 percent) with the auditor oversight provided by Section 404(b). Overall, we find that the costs of exemption due to ICmisreporting ($719 million and $935 million) are larger than the benefit ($388 million in audit fee savings). On a per firmbasis, the costs are $1.7 million and $2.2 million, and the benefit is $585 thousand. However, it is difficult to make normativestatements about the overall net cost or benefit of exemption because the costs are borne by current and prospectiveshareholders of suspected IC misreporters (about 9.3 percent of exempt firms), whereas the benefits are realized byshareholders of all exempt firms.5
Our analyses of measurable costs and benefits of exemption to shareholders are one piece of information legislators canuse when deciding whether to exempt additional firms (U.S. Congress, 2011, 2012, 2016a, 2016b). Determining whetherexemption maximizes social welfare (Minnis and Shroff, 2017) is beyond the scope of our paper. In addition, we ac-knowledge that there are other important, but less separately measurable, benefits and costs of exemption (e.g., preservedmanager time). These potential benefits and costs are discussed in Section 2.2, and many are implicitly incorporated in ourfuture operating and stock return performance cost estimates.
Our paper proceeds as follows. In Section 2 we provide an overview of the internal control regulatory background andsummarize the potential benefits and costs of Section 404(b) exemption. In Section 3 we describe the sample and presentdescriptive statistics. In Section 4 we quantify the benefits of exemption, and in Section 5 we quantify the costs of exemption(with our prediction model described in Section 5.1). We conclude in Section 6.
2. Background and potential benefits and costs of Section 404(b) exemption
2.1. Background
The Sarbanes-Oxley Act of 2002 (SOX) contains three sections (302, 404a, and 404b) related to the disclosure of internalcontrol effectiveness. Under Section 302 (effective for all publicly traded firms for fiscal periods ending on or after August 29,2002), management is required to evaluate and disclose its conclusion about the effectiveness of firm controls and pro-cedures in each quarterly and annual report (SEC, 2002). Section 404(a) requires management to test the effectiveness of thefirm's internal control structure and procedures and to disclose its assessment in each annual report, while Section 404(b) requires auditors to test and include an auditor-provided opinion regarding their assessment of the same internal controlstructure and procedures in the firm's annual report (U.S. Congress, 2002).
The SEC classifies firms with public float (defined as aggregate worldwide market value of common equity held by non-affiliates as of the last business day of the firm's second quarter) between $75 and $700 million as “accelerated filers,” andfirms with greater than $700 million of public float as “large accelerated filers” (Rule 12b-2 of the Securities Exchange Act).We use the term “accelerated filers” to refer to both groups. Accelerated filers are subject to Sections 404(a) and 404(b) forfiscal years ending on or after November 15, 2004.
In the debate over the costs and benefits of Section 404, the costs to small firms have been of particular concern (seereview papers by Coates, 2007 and Coates and Srinivasan, 2014). In response to this concern, the SEC granted firms with lessthan $75 million in public float—the “non-accelerated filers”—multiple extensions in the Section 404 compliance deadline.Section 404(a) finally became effective for non-accelerated filers for fiscal years ending on or after December 15, 2007, morethan three years after the 404(a) and 404(b) effective date for accelerated filers. Lawmakers permanently exempted non-accelerated filers from complying with Section 404(b) in July 2010 (Section 989 G of the 2010 Dodd-Frank Act; U.S. Congress,2010). See Fig. 1 for a compliance timeline. Throughout the paper, we refer to non-accelerated filers as “exempt firms” andaccelerated filers with a market capitalization of $300 million or less as “non-exempt firms.”
5 Regarding who bears the cost, we find that insider ownership is on average 19.9 percent for exempt firms and 21.5 percent for suspected ICmisreporters (untabulated). Thus, 80.1 (78.5) percent of the benefits we present would apply to outside shareholders of exempt firms (suspected ICmisreporters).

Fig. 1. SOX Sections 404(a) and 404(b) Compliance Timeline. Notes: The SEC classifies firms with a public float (defined as aggregate worldwide market valueof common equity held by non-affiliates as of the last business day of the firm's most recently completed second quarter) between $75 million and $700million as “accelerated filers,” and firms with greater than $700 million of public float as “large accelerated filers.” For these firms, Sections 404(a) and 404(b) are effective for fiscal years ending on or after November 15, 2004. The SEC classifies firms with less than $75 million in public float (measured as of thelast day of the second quarter) as “non-accelerated filers” (i.e., “exempt firms” for the purposes of our study). For these firms, Section 404(a) was effectivefor fiscal years ending on or after December 15, 2007; the Section 404(b) compliance date was delayed multiple times before these firms were permanentlyexempted from 404(b) compliance in July 2010 (Section 989G of the Dodd-Frank Act).
W. Ge et al. / Journal of Accounting and Economics 63 (2017) 358–384 361
2.2. Potential benefits and costs of 404(b) exemption
2.2.1. The role of the auditorSection 404(b) proponents believe that managers seriously evaluate and disclose their firms' internal control effec-
tiveness only if auditors are involved. The SEC also acknowledges the importance of auditor oversight, stating that “there isstrong evidence that the auditor's role in auditing the effectiveness of [internal controls] improves the reliability of internalcontrol disclosures and financial reporting overall and is useful to investors” (SEC, 2011, p.8).6 Consistent with the im-portance of auditor oversight, Bedard et al. (2009) provide evidence that auditor intervention increases the disclosure ofmaterial weaknesses in internal control, and Bedard and Graham (2011) find that auditors detect 84 percent of ineffectiveinternal controls. That auditors identify the bulk of the ineffective internal controls is especially concerning for exempt firmshareholders given managers have a strong incentive to avoid reporting ineffective internal controls, in part because in-effective internal controls are considered a “red flag” by both sell-side and buy-side analysts (Brown et al., 2015; Brownet al., 2016). Thus, auditor oversight under 404(b) may be necessary to identify ineffective internal controls, and the absenceof such oversight may lead to IC misreporting.7
Others argue, however, that the higher audit fees associated with 404(b) bring little benefit. In particular, Kinney andShepardson (2011) find that similar proportions of non-exempt and exempt firms disclose ineffective internal controls, yetexempt firms incur only a fraction of the audit fees. The authors conclude that “for small firms, management internal controlreports and traditional financial audits may be a cost effective disclosure alternative to full application of SOX 404(b)”(p.413). An implicit assumption in Kinney and Shepardson (2011) is that internal control disclosures are accurate, and thatexempt and non-exempt firms have similar underlying distributions of ineffective internal controls.8 If these assumptionsare correct, 404(b) seems superfluous; if these assumptions do not hold, however, 404(b) might provide benefits notdocumented in prior research.
Kinney et al. (2013) further question the value of 404(b), for firms of any size, by arguing that auditors have difficultyidentifying ineffective internal controls absent a financial misstatement. They also note that “under existing auditing
6 Investors seem agree with the SEC. In an October 2011 letter to the U.S. House of Representatives Financial Services Committee opposing exemptionsfrom 404(b), the Chartered Financial Analysts Institute, Center for Audit Quality, and Council of Institutional Investors argued that compliance with Section404(b) has contributed to an increase in overall audit quality and that all investors should have the same level of protection regarding the effectiveness offirms’ internal controls regardless of firm size (CFA, 2011).
7 To the extent that auditors are more likely than managers to classify minor internal control issues as weaknesses, we over-identify suspected ICmisreporters. Over-identification biases against finding economically significant costs of IC misreporting.
8 Although exempt firms generally have less complicated accounting issues, they also have fewer resources to devote to implementing and maintaininga sophisticated internal control system, as well as fewer employees available to ensure that duties are fully segregated. Prior research documents that, onaverage, smaller firms are more likely to maintain ineffective controls (e.g., Ge and McVay, 2005). This suggests that more exempt firms should bedisclosing ineffective internal controls than non-exempt firms due to exempt firms’ smaller size.

W. Ge et al. / Journal of Accounting and Economics 63 (2017) 358–384362
standards (AU 550, which was later recodified as AS 2710), if management makes statements in unaudited portions of Form10-K that the auditor believes are a material misstatement of fact, such as providing a 404(a) assessment that controls areeffective when the auditor believes otherwise, the issue must be resolved prior to the issuance of the auditor's opinion”(p.811). This quote suggests that even in the absence of 404(b), auditors implicitly opine on firms’ internal control effec-tiveness, which again renders 404(b) superfluous.9 If this is the case, the benefits of exemption should exceed the costs ofexemption associated with IC misreporting.
2.2.2. Potential benefits of 404(b) exemptionThere are a number of potential benefits of 404(b) exemption. The most remarked upon and measurable benefit is 404(b)-
related audit fee savings (e.g., Iliev, 2010; Palmrose, 2010; Kinney and Shepardson, 2011). Another possible benefit of exemptionis that it frees up management and employee time that would otherwise be spent with auditors. To quantify this benefit,however, one must observe how much time managers and employees are spending with auditors and consider the counter-factual of what they would otherwise do with that time (Leuz andWysocki, 2016). A third possible benefit is lower firm litigationrisk and legal costs, to the extent that plaintiffs use auditor-provided internal control effectiveness disclosures as evidence ofmisbehavior as suggested by Coates and Srinivasan (2014). However, it is also possible that 404(b) exemption leads to higherlitigation risk. If ineffective internal controls go undiscovered, they cannot be remediated, and unremediated issues can lead torestatements that trigger litigation. In addition, evidence that ineffective internal controls were not discovered or were dis-covered but not remediated can indicate managerial negligence, which may also trigger litigation. While litigation risk can bemeasured, it is difficult to attribute any changes in litigation risk directly to ineffective internal controls (as opposed to re-statements or large stock price drops), and its relation with exemption is ex ante unclear. In this study we focus on audit feesavings, the most measurable benefit of 404(b) exemption. However, to the extent employee time and litigation affect earningsand stock returns in the next three years, their net effect should be captured in our costs analysis discussed in the next section.
2.2.3. Potential costs of 404(b) exemptionSection 404(b) exemption is costly to the extent that it results in firms’ failure to discover or disclose ineffective internal
controls (i.e., IC misreporting). Potential costs of IC misreporting include the operational consequences of non-remediation,market values that fail to reflect a firm's underlying internal control status, and lower earnings quality.
Regarding non-remediation costs, a number of studies have documented the operational consequences of ineffectiveinternal controls, such as inefficient investment or poor operating decisions due to poor information quality (Cheng et al.,2013; Feng et al., 2015). For example, Feng et al. (2015) find evidence that firms with ineffective inventory-related internalcontrols manage their inventory less effectively, presumably because poor internal information leads to suboptimal pro-duction, ordering, and obsolescence assessments. Prior research also provides evidence that managers were not fully awareof their firms’ ineffective controls (and related effects) prior to SOX 404(b) (Feng et al., 2009). If managers fail to discoverineffective internal controls, then managers are unlikely to remediate them. Another possibility is that managers discoverbut fail to disclose ineffective controls in order to further their ability to extract rents (e.g., Hochberg et al., 2009; Chenget al., 2013). If managers must discover and disclose ineffective internal controls before the internal controls can be re-mediated, then one likely cost of 404(b) exemption is lower future operating performance due to non-remediation among ICmisreporters. We measure this cost by examining changes in future earnings. We expect suspected IC misreporters toexhibit lower future operating performance relative to firms that discover, disclose, and remediate ineffective internalcontrols.10 This avoidable cost is borne by IC misreporter shareholders.
A second potential cost of IC misreporting results from market values that fail to reflect a firm's underlying internalcontrol status. Prior research finds some evidence of negative stock market reactions to the disclosure of ineffective internalcontrols (Hammersley et al., 2008), which suggests that firms that maintain ineffective internal controls can temporarilyavoid negative stock returns by inaccurately disclosing effective internal controls. Inaccurate disclosures merely delay thenegative stock returns until the negative consequences of ineffective internal controls, such as financial restatements orperformance-driven stock exchange delistings, are realized and impounded into price. This cost is largely borne by newinvestors who relied on inaccurate internal control disclosure when purchasing the stock of IC misreporters. To the extentthat some of the negative stock returns are avoidable through remediation (e.g., future restatements that result from in-effective internal controls are avoidable), the costs of non-remediation are borne by both new and existing shareholders ofIC misreporters. We measure this cost by comparing the abnormal stock returns of suspected IC misreporters with those offirms disclosing ineffective internal controls.
9 Lu et al. (2011) also highlight the costs of Section 404 and point to Canada's low-cost alternative of self-reported internal control disclosures in firms’MD&A. They document an association between these disclosures and accruals quality, which suggests that the disclosures are at least somewhat credible.Nevertheless, Zhao et al. (2015) conclude that auditor effort is more effective when control testing is required, suggesting that there are incrementalbenefits to Section 404(b).
10 For firms that discover and remediate ineffective internal controls, changes in future earnings captures improved operating performance net ofremediation costs (e.g., incremental audit fees, system implementation fees, depreciation and amortization expense on internal controls hardware andsoftware, employee time attributed to remediation, etc.). If managers generally discover and remediate ineffective internal controls without initiallydisclosing that their internal controls were ineffective, we will fail to find an association between suspected IC misreporting and future operatingperformance.

W. Ge et al. / Journal of Accounting and Economics 63 (2017) 358–384 363
A third possible cost of 404(b) exemption is lower financial reporting quality and the reduced credibility of the ac-counting information associated with it. Prior research concludes that 404(b) exemption has compromised the financialreporting quality of exempt firms (Krishnan and Yu, 2012; Holder et al., 2013). Prior research also documents, however, thatauditors are largely able to “audit around” ineffective internal controls, mitigating the effects on reported earnings (e.g.,Doyle et al., 2007a). Because it is difficult to disentangle the effects of internal controls from those of the auditors’ sub-stantive testing on earnings quality, we do not consider financial reporting quality as a separate measurable cost of ICmisreporting.
Gao et al. (2009) identify other possible costs of exemption driven by managers’ desire to stay below the exemptionthreshold (i.e., a public float of $75 million). They provide evidence that to avoid reaching this threshold, managers takestrategic actions such as making cash payouts to shareholders, making bad news disclosures, and reporting lower earnings.As these costs apply only to firms near the exemption threshold, we do not directly incorporate the costs of these actionsinto our analysis. However, to the extent these actions affect earnings and stock returns in the next three years, their neteffect is captured in our analysis.
In summary, we focus on two measurable costs of IC misreporting attributed to 404(b) exemption—lower operatingperformance due to non-remediation and market values that fail to reflect a firm's underlying internal control status—byexamining changes in future earnings and future stock returns for suspected IC misreporters. As previously noted, ourmeasures also capture a number of additional implications associated with exemption (e.g., the impact on legal fees, em-ployee time, cost of capital and thus the ability to invest, etc.). We summarize these potential benefits and costs of ex-emption in Appendix A.
3. Sample and descriptive statistics
3.1. Sample formation
We begin with the universe of 11,274 exempt firm-years from 2007 through 2014 with non-missing Section 404(a) internal control disclosure data from Audit Analytics, market capitalization and total assets greater than $5 million fromCompustat, and non-missing Central Indexing Key (CIK) and fiscal year end from Compustat. Because our goal is to examinethe accuracy of internal control disclosures absent 404(b), we exclude 1,427 firm-years of exempt firms that voluntarilycomply with 404(b) from our main analyses. Following Kinney and Shepardson (2011), we eliminate 4,269 non-exchange-traded firm-years, because exchange- and non-exchange-traded firms differ on a variety of dimensions (e.g., Leuz et al.,2008). In addition, IC misreporting is only important when investors expect truthful disclosure, and investors are generallyaware of non-exchange-traded firms’ poor disclosure practices (Jiang et al., 2016). Finally, we eliminate 276 observationswith missing variable values, yielding a final sample of 5,305 exempt firm-year observations.11
3.2. Sample internal control disclosure statistics
Table 1 lists the numbers and percentages of exempt firm-year internal control disclosures from 2007 through 2014.12
We find that, on average, 10.9 percent of exempt firms disclose an internal control weakness over this eight-year timeperiod; 13.6 percent disclose ineffective controls in 2007, and the percentage ranges from 9.2 to 14.2 percent in the sub-sequent seven years.13 As our exemption cost estimates are based on an internal control effectiveness prediction modelestimated using a sample of non-exempt firms with market capitalization of $300 million or less during the AuditingStandard No. 2 (AS2) audit regime (2004–2006), we also present internal control descriptive statistics for this group ofobservations.14 During the AS2 regime, 14.4 percent of non-exempt firms disclosed ineffective internal controls, which isnotably higher than the 8.0 percent figure for all other accelerated filers (i.e., firms with market capitalization of more than$300 million) during the same time period. These percentages are consistent with prior research documenting that largerfirms tend to have fewer internal control problems (e.g., Ge and McVay, 2005). For completeness, we present statistics forboth non-exempt firms and all other accelerated filers through 2014. In Appendix B we present descriptive statistics of thetypes of weaknesses disclosed within each classification. In general, exempt firms have more fundamental issues, such assegregation of duties, and fewer complexity-related weaknesses.
11 Due to the above restrictions, our final sample size is smaller than the five thousand exempt firms mentioned in the introduction (PCAOB, 2015).12 Among non-exempt firms, we use the auditor's internal control opinion (which is only different from the management opinion in one instance in
our sample). Among exempt firms, we use management's internal control opinion.13 Using a sample that requires only Audit Analytics data, Kinney and Shepardson (2011) report that 23.7 (22.4) percent of non-accelerated filers
(herein exempt firms) disclose ineffective internal controls in 2007 (2008). We calculate similar percentages (22.8 percent in 2007 and 27.9 percent in2008) when we use only Audit Analytics data (untabulated). Our final sample conditions on exchange status and data availability in Compustat, CRSP,Thomson Reuters, and GMI Ratings.
14 As we argue in Section 5.1.2, these years provide the best representation of the underlying internal control effectiveness within non-exempt firms.Non-exempt firms are defined as accelerated filers with an end-of-year market capitalization of $300 million or less in each of the three years centered onthe Section 404(b) effective date (i.e., fiscal years ending between November 15, 2003 and November 14, 2005). Kinney and Shepardson (2011) similarly usea $300 million market capitalization threshold to define non-exempt firms.

Table 1Internal Control Effectiveness Frequencies
Auditing StandardNo. 2 Regime
Auditing Standard No. 5 Regime
2004 2005 2006 Total 2007 2008 2009 2010 2011 2012 2013 2014 Total
Exempt Firms(Non-Accelerated Filers o $75 M public float)Firm-years with DisclosedIneffectivet¼1 78 70 70 77 70 63 69 80 577Total firm-years 575 711 758 770 669 640 617 562 5302% with DisclosedIneffectivet¼1 13.6% 9.8% 9.2% 10.0% 10.5% 9.8% 11.2% 14.2% 10.9%
Non-Exempt Firms(Accelerated Filers r $300 M MVE)Firm-years with DisclosedIneffectivet¼1 92 79 80 251 115 90 43 37 51 46 53 67 502Total firm-years 452 636 656 1744 1131 1344 845 662 798 708 537 604 6629% with DisclosedIneffectivet¼1 20.4% 12.4% 12.2% 14.4% 10.2% 6.7% 5.1% 5.6% 6.4% 6.5% 9.9% 11.1% 7.6%
All Other Accelerated Filers(Accelerated Filers 4 $300 M MVE)Firm-years with DisclosedIneffectivet¼1 245 174 165 584 120 31 28 42 50 61 82 95 509Total firm-years 2303 2424 2557 7284 2379 1955 2178 2307 2163 2304 2481 2476 18243% with DisclosedIneffectivet¼1 10.6% 7.2% 6.5% 8.0% 5.0% 1.6% 1.3% 1.8% 2.3% 2.6% 3.3% 3.8% 2.8%
Notes: This table presents internal control over financial reporting frequencies using data from Audit Analytics Section 404. We require firms to have non-missing total assets, market value of equity (MVE, defined as PRCC_F�CSHO), Central Indexing Keys (CIKs), and fiscal year ends (DATADATE) in Compustat.We delete firm-years with less than $5 million in total assets or market capitalization and non-accelerated filer firm-years that voluntarily comply withSection 404(b). Non-accelerated filers (exempt firms) are required to comply with SOX Section 404(a) for fiscal years ending on or after December 15, 2007.For these firms, the “2007” compliance year includes fiscal years ending between December 15, 2007 and December 14, 2008, the “2008” compliance yearincludes fiscal years ending between December 15, 2008 and December 14, 2009, etc. Accelerated filers are required to comply with SOX Sections 404(a) and 404(b) for fiscal years ending on or after November 15, 2004. For these firms, the “2004” compliance year includes fiscal years ending betweenNovember 15, 2004 and November 14, 2005, the “2005” compliance year includes fiscal years ending between November 15, 2005 and November 14, 2006,etc. “Non-exempt Firms” are defined as accelerated filers with an end-of-year market capitalization of $300 million or less in each of the three yearscentered on the Section 404(b) effective date (i.e., fiscal years ending between November 15, 2003 and November 14, 2005). “All other accelerated filers”are defined as accelerated filers not classified as non-exempt firms. Values in italics are presented only for descriptive purposes, and these observations arenot used in our analysis.
W. Ge et al. / Journal of Accounting and Economics 63 (2017) 358–384364
4. Benefits of 404(b) exemption
We estimate the key benefit of 404(b) exemption as the audit fee savings by exempt firms. To estimate audit fee savings,we compare the percentage increase in audit fees from 2003 to 2014 for non-exempt firms relative to exempt firms, andattribute the difference to 404(b) audit compliance costs.15 Because the increase in audit fees from 2003 to 2014 is partiallydriven by inflation, we convert audit fees into 2014 real dollars.
As reported in Table 2, Panel A, the mean exempt firm paid $204,830 in audit fees in 2003 and $259,163 in 2014, for amean increase of 26.5 percent. In contrast, the mean non-exempt firm paid $430,200 in audit fees in 2003 and $697,999 in2014, for a mean increase of 62.3 percent. We attribute this 35.7 percent incremental audit fee increase to 404(b) compliance, so it serves as our estimate of the percentage of audit fee savings from 404(b) exemption.16 In Panel B wemultiply this 35.7 percent by exempt firms’ mean audit fees in 2003 to estimate that the average exempt firm would haveexperienced an incremental $73,165 in annual audit fees if subject to 404(b). As there are 5,302 exempt firm-years in oursample, this translates to an aggregate audit fee savings of $388 million related to 404(b) exemption for our eight-yearsample period (2007–2014).
The $388 million is a ballpark estimate of the benefits of 404(b) exemption for the 5,305 exempt firm-years in our sample, asour calculation applies the full incremental increase in audit fees over time to each firm-year. Thus, the increase captures not justan initial shock to audit fees but also a long-term average percentage change, which is important given that non-exempt firms’audit fees increased significantly in 2004 (the first year of 404(b) compliance) and then declined over time (Table 2, Panel A).
To address the potential concern that the incremental increase in audit fees for non-exempt firms is due to systematicdifferences between exempt and non-exempt firms, we consider two alternative benchmarks that use exempt firms as theirown control. We first examine the change in audit fees for 238 firms that switch from “non-accelerated” to “accelerated”filer status and thus are subject to 404(b). In these “switching firms,” the average audit fee increased by 34.9 percent in thefirst year of 404(b) compliance (untabulated). We next examine the change in audit fees for 273 exempt firms in their first
15 Although exempt firms did not comply with SOX 404 until 2007, we begin our comparison in 2003 instead of 2006 as there was an overall increasein audit fees in the post-SOX era, and we want to avoid attributing this full increase to 404(b) compliance costs. By measuring both groups of firms over thesame period, we are able to attribute the incremental increase in audit fees among non-exempt firms to 404(b) compliance costs.
16 We note that our estimate of a 35.7 percent increase in audit fees is qualitatively similar to Iliev's (2010) finding that foreign firms with a public floatof just below the exemption threshold had 30 percent lower audit fees than did non-exempt foreign firms with a public float of just above the threshold.

Table 2Assessing the Audit Fee Benefit of 404(b) Exemption
Panel A: Mean Audit Fees by Year and Filing Status
Exempt Firms Non-Exempt Firms
Year 404(a)compliance year
N Mean audit fees(2014 real dollars)
Year 404(a) & (b)compliance year
N Mean audit fees(2014 real dollars)
2003 – 439 $204,830 2003 – 450 $430,2002004 – 472 $257,506 2004 1 451 $939,0692005 – 508 $275,143 2005 2 632 $781,0822006 – 514 $292,448 2006 3 640 $736,5272007 1 514 $287,216 2007 4 1029 $802,1432008 2 631 $290,824 2008 5 1225 $926,0902009 3 699 $287,291 2009 6 778 $759,9512010 4 713 $274,660 2010 7 627 $656,0362011 5 635 $266,030 2011 8 761 $700,2942012 6 617 $262,336 2012 9 677 $715,2032013 7 599 $254,737 2013 10 518 $663,0802014 8 547 $259,163 2014 11 585 $697,999
%Δ 2003 to 2014: 26.53% %Δ 2003 to 2014: 62.25%
Panel B: Estimate of Incremental Audit Fee Savings due to 404(b) Exemption
62.25% %Δ in mean audit fees paid by non-exempt firms (2003–2014) (Table 2, Panel A)–26.53% –%Δ in mean audit fees paid by exempt firms (2003–2014) (Table 2, Panel A)
35.72% Incremental %Δ in mean audit fees attributed to 404(b) compliancex $204,830 x Mean annual audit fees paid by exempt firms in 2003
$73,165 Estimated annual incremental cost of 404(b) compliance per exempt firm in our samplex 5302 x Number of exempt firm-years in our sample during the 404(b) exemption period (2007–2014)
$387,922,293 Aggregate incremental benefit of 404(b) exemption for all exempt firm-years in our sample during the 404(b) exemption period
Notes: All dollar values are in 2014 real dollars. All variables are defined in Appendix C, and all continuous variables are winsorized at the 1st and 99thpercentiles by fiscal year. “Exempt firms” are non-accelerated filers not subject to 404(b), and “non-exempt firms” are accelerated filers with marketcapitalization of $300 million or less in 2003 through 2005, following Kinney and Shepardson (2009).
W. Ge et al. / Journal of Accounting and Economics 63 (2017) 358–384 365
year of voluntary compliance with 404(b). The average voluntary complier experiences a 29.7 percent increase in audit feesthat year (untabulated).17 Both estimated percentages are qualitatively similar to the 35.7 percent increase reported inTable 2, corroborating our benefit estimate.
5. Costs of 404(b) exemption
To investigate whether 404(b) exemption results in the failure to discover and disclose ineffective internal controls, wemust first form an assessment of firms’ latent internal control effectiveness. In Section 5.1, we develop a prediction model ofinternal control effectiveness. In Section 5.2, we use this model to identify suspected IC misreporting among exempt firms.This analysis includes validity tests of our prediction model, as well as estimates of how much IC misreporting would becurbed by auditor oversight under 404(b). Finally, in Section 5.3, we estimate the potential costs of 404(b) exemption usingthe identification of suspected IC misreporters and the degree to which we expect 404(b) to curb IC misreporting. As apreview, we estimate that the cost of exemption related to lower operating performance from non-remediation is $719million, which is nearly double our estimated $388 million benefit of exemption from audit fee savings. This cost is borne byshareholders of IC misreporters (approximately 9.3 percent of exempt firms). We also estimate that the cost of exemptionrelated to the failure to disclose ineffective internal controls is $935 million—an economically significant cost borne by newshareholders relying on inaccurate internal control disclosures. In Section 5.4 we present bounds on our benefit and costestimates to illustrate how various assumptions affect our estimates.
17 The lower percentage increase is consistent with endogeneity in the choice to voluntarily comply (e.g., the voluntary firms might anticipate a lowerincrease in audit cost). Anecdotally it seems that many voluntary compliers do so in anticipation of becoming accelerated filers (non-exempt). For example,BSD Medical Corporation (now Perseon Corp) filed its first 404(b) report in 2010, when its public float was only $26.4 million, then filed in 2011 as anaccelerated filer with a float of $99.5 million. This anticipation issue is why we chose not to use the subsample of voluntary compliers to corroborate ourcost estimates. To the extent that expected future performance is correlated with the decision to voluntarily comply with 404(b), we do not want toattribute the increase in return on assets and stock returns for these firms to voluntary compliance.

W. Ge et al. / Journal of Accounting and Economics 63 (2017) 358–384366
5.1. Model of ineffective internal controls
5.1.1. Identifying ineffective internal controlsWe form a prediction model of internal control effectiveness using non-exempt firms and apply the estimated coeffi-
cients to exempt firms. The application of these out-of-sample parameters allows us to estimate the percentage of exemptfirms that disclose effective internal controls but appear to maintain ineffective internal controls (i.e., suspected ICmisreporters).
5.1.2. Prediction model of internal control effectivenessEq. (1a) includes 16 internal control effectiveness determinants from prior research (Ge and McVay, 2005; Doyle et al.,
2007b; Ashbaugh-Skaife et al., 2009), and one additional variable (Prior404302).18 The Prior404302 variable controls forwhether a firm has an internal control weakness disclosed in the previous year's 404 or the previous three quarters’ 302reports, and it takes into account the possibility that internal control quality might be persistent over time. With these 17variables, we estimate the following model:
β β β
β β β β
β β β β β β
β β β β ε
= + +
+ + + +
+ + + + + +
+ + + + + ( )
− − −
− − − − −
−
− − −
MaintainedIneffective Foreign M A Restructure
ExtrSalesGrowth ExtrInvGrowth AggLoss Restate
Seg Age LitigiousInd ComputerInd BankInd Size
Cash Governance InstOwn Prior404302
&
1a
t t t t t t t
t t t t t t t t
t t t t t t
t t t t t
1 1, 2 1, 3 1,
4 2, 5 2, 6 1, 7 2, 1
8 9 10 11 12 13 1
14 1 15 1 16 1 17
The dependent variable MaintainedIneffective is equal to one if a firm maintains ineffective internal controls in year t, and zerootherwise. As we want to identify firms that maintain ineffective internal controls and not just firms that disclose ineffectiveinternal controls, we set the MaintainedIneffective indicator variable equal to one if a firm either (1) discloses ineffective internalcontrols (DisclosedIneffective¼1; N¼251) or (2) discloses effective internal controls but either subsequently restates its year tfinancial statements as a result of internal control issues (N¼70, identified by Rice et al., 2015) or amends its year t Section 404(b) report to conclude that its internal controls were actually ineffective (N¼9, identified using Audit Analytics data).
We omit the model intercept in Eq. (1a) to avoid setting a baseline proportion of firms that maintain ineffective internalcontrols.19 Instead, we form our prediction solely on economic determinants without requiring the baseline proportion ofexempt firms that maintain ineffective internal controls to be similar to that of non-exempt firms. Independent variables aredefined in Appendix C.
We face several complications in deciding which firms to use in estimating, and which variables to use in forming, ourout-of-sample prediction model. The first complication relates to which observations to use in estimating Eq. (1a). Firmssubject to 404(b) are significantly larger than exempt firms, and internal control quality varies with firm size (Ge and McVay,2005), as do the types of disclosed weaknesses (see Appendix B). For this reason, we estimate our logistic model using firmssubject to 404(b) with a market capitalization of $300 million or less (measured in the three-year window centered on theinitial 404(b) compliance year). We refer to these observations as “non-exempt firms.”20
The second complication relates to which non-exempt firm years to use in estimating Eq. (1a). Table 1 reports amonotonic time-series decline in the percentage of non-exempt firms disclosing ineffective internal controls in their first sixyears of compliance (with an uptick in recent years). One reason for this decline is the remediation of ineffective internalcontrols. This trend is more modest for exempt firms, suggesting that exempt firms are less likely to remediate their dis-closed internal control problems.
Another reason for this decline is that accelerated filers were audited under two auditing regimes. Auditing Standard No.2 (AS2) was issued by the Public Company Accounting Oversight Board (PCAOB) in 2004 to provide guidance on auditinginternal controls over financial reporting. The standard, viewed as a “bottom up” approach, generated extensive auditordocumentation and testing of internal controls. In 2007 the cumbersome and costly AS2 was replaced with AuditingStandard No. 5 (AS5), which was later recodified as AS 2201. This standard is seen as a top-down, risk-based approach thatfocuses on the most important audit matters (e.g., Krishnan et al., 2011; PCAOB, 2015). AS5 permits auditors to rely on thework of others in the attestation process (e.g., less expensive employees or third-party vendors) and to conduct alternative
18 We use the average of year t–1 and year t values when measuring “flow” variables (e.g., ExtrSalesGrowtht-1,t) and “event” variables (e.g., M&At-1,t) tocapture of the effect of prior and current year performance and events on internal controls quality. The one exception is that we measure prior restate-ments (Restatet-2,t-1) in years t–2 and t–1 to avoid the confounding effect of concurrent restatements and material weakness disclosures. We measure firmsize (Sizet-1) and cash (Casht-1) at year t–1 because these two variables represent the firm's resources available for investment in internal controls duringthe year. Similarly, we measure governance (Governancet-1) and monitoring (InstOwnt-1) in year t–1, as governance in the prior period would be associatedwith the decision to maintain effective internal controls. Remaining variables are measured at the end of year t.
19 Recall that we expect these smaller firms to have a higher proportion of ineffective internal controls. Allowing an intercept yields a similar ROC curveof 0.896 (untabulated).
20 Re-estimating Eq. (1b) using accelerated filers with a market capitalization of $200 million or less results in a 57 percent sample size loss but yields aqualitatively similar ROC of 0.894 (untabulated). We use a market capitalization of $300 million or less to maintain consistency with prior literature (Kinneyand Shepardson, 2011) and to avoid basing our estimates on too small a sample. We use market capitalization as a proxy for public float, as the latter mustbe hand-collected. Gao et al. (2009) report a 0.78 correlation between market capitalization and public float.

W. Ge et al. / Journal of Accounting and Economics 63 (2017) 358–384 367
internal control testing procedures in place of time-consuming, elaborate internal control walk-throughs (Coates and Sri-nivasan, 2014). AS5 also eliminates unnecessary audit procedures, and is designed to be scalable to the size and complexityof each audit (PCAOB, 2014).
Although AS5 internal control audits are intended to be more efficient, many are concerned that AS5 fails to identifymany material weaknesses (e.g., PCAOB, 2009; PCAOB, 2013; PCAOB, 2014, PCAOB, 2015; DeFond and Lennox, 2017;Schroeder and Shepardson, 2016). To illustrate, the PCAOB's audit inspection report during the 2004–2006 AS2 regime failedto identify any flaws with internal control audits (PCAOB, 2007). However, by 2010 16 percent of Big 4 internal control auditsinspected by the PCAOB were deemed deficient. By 2013 the number had risen to 36 percent, leading PCAOB Board MemberJeanette Franzel to speculate that “there may be undisclosed [internal control] material weaknesses” (PCAOB, 2015). Becauseour purpose is to estimate the underlying existence of ineffective internal controls, we focus on the three years of non-exempt firms’ internal control disclosures under the AS2 audit regime (2004–2006), a period when internal control auditswere more likely to identify underlying internal controls weaknesses (Schroeder and Shepardson, 2016). In sum, we esti-mate Eq. (1a) using firms subject to 404(b) with market capitalizations of $300 million or less (referred to as “non-exemptfirms”) during the AS2 time period (2004–2006).
The third complication is which independent variables to include in our model. Prior research modeling internal controleffectiveness included accelerated filers of all sizes (e.g., Ge andMcVay, 2005; Doyle et al., 2007b; Ashbaugh-Skaife et al., 2009), soit is possible that some of the variables identified as significant in prior studies do not predict ineffective internal controls for oursample (the smallest of the firms subject to 404(b)).21 To address this issue, and to ensure objectivity, we estimate Eq. (1a) using abackward elimination technique that iteratively determines which of the 17 independent variables are significantly associatedwith our dependent variable (Lawless and Singhal, 1978). Specifically, we use a stepwise logistic regression and set the significancelevel for variable elimination at 15 percent.22 This procedure yields a model that includes only the variables significantly asso-ciated with maintaining ineffective internal controls. Retaining only significant coefficients is important because these coefficientsare used to predict the likelihood that exempt firms maintain ineffective internal controls. A similar procedure and significancelevel are used by Dechow et al. (2011) to form a prediction model of misstatements.
Table 3, Panel A provides the frequency of maintaining and disclosing ineffective internal controls for non-exempt ob-servations during the AS2 regime with data required to estimate Eq. (1a). Panel B provides descriptive statistics for the Eq.(1a) variables. Univariate relations are generally consistent with expectations.
We apply the stepwise logistic selection procedure and identify nine of the 17 independent variables as significantlyassociated with ineffective internal controls in year t. Thus, the final prediction model is as follows:
β β β β β
β β β β ε
= + + + +
+ + + + + ( )
− − −
− − −
MaintainedIneffective AggLoss Restate Seg Age BankInd
Size Cash InstOwn Prior404302 1b
t t t t t t t t
t t t t t
1 1, 2 2, 1 3 4 5
6 1 7 1 8 1 9
The parameter estimates from Eq. (1b) are provided in Table 3, Panel C. Although not directly comparable to priorresearch because of the time period examined and our focus on the smallest firms subject to 404(b), the coefficients aresignificant in the directions documented by prior research (Ge and McVay, 2005; Doyle et al., 2007b; Ashbaugh-Skaife et al.,2009). In particular, aggregate losses (AggLoss), restatements (Restate), the number of business and geographical segments(Seg), and the prior disclosure of a material weakness (Prior404302) all increase the likelihood of maintaining ineffectiveinternal controls. Older firms (Age), larger firms (Size), firms with more cash (Cash), and firms with higher institutionalownership (InstOwn) are all less likely to maintain ineffective internal controls.23 Industry also plays a significant role, withthe banking industry having a lower likelihood of maintaining ineffective internal controls (BankInd). Our model's areaunder the ROC curve is 0.887, which indicates excellent discrimination per Hosmer and Lemeshow (2000, p.162).
5.2. Identifying internal control misreporting among exempt firms
5.2.1. Applying our model to exempt firmsTo assess the cost of exemption, we require an estimate of IC misreporting absent 404(b). Thus, we apply the Eq. (1b) coef-
ficients developed using non-exempt firms’ data (presented in Table 3, Panel C) to the 5,305 exempt firm-years from 2007through 2014 to form an out-of-sample prediction of the likelihood that exempt firms maintain ineffective internal controls:
21 In exploratory analyses, we considered several additional variables not included by prior research that might be relevant in explaining exempt firms’internal control effectiveness (e.g., industry-adjusted number of employees, financial reporting complexity from Filzen and Peterson (2015), and strength ofemployee relations from the KLD STATs database). While the employee relations variable was retained by our backwards elimination technique and wasfound to have a negative relation with a firm's internal control effectiveness, we did not include this variable in our final Eq. (1b) model because it resultedin a 73 percent reduction in sample size (untabulated).
22 The ROC curve using a 10 (20) percent significance level for variable elimination is 0.887 (0.889), which suggests that the choice of significance levelhas little impact on explanatory power (untabulated).
23 Univariate t-tests of differences in means show that non-exempt firms maintaining ineffective internal controls are larger and engage in morecomplex transactions (i.e., they are more likely to have foreign operations, have more business segments, engage in M&A and restructuring, etc.) relative tonon-exempt firms maintaining effective internal controls (Table 3, Panel B). Consistent with complexity driving the association between size and ineffectiveinternal controls, after we control for complexity (Seg), larger firms are less likely to maintain ineffective internal controls (Table 3, Panel C).

Table 3Determinants of Maintaining Ineffective Internal Controls During the Auditing Standard No. 2 Regime (Non-Exempt Firms)
Panel A: DisclosedIneffectivet and MaintainedIneffectivet Frequencies after Imposing Eq. (1a) Data Requirements
2004 2005 2006 Total
Firm-years with DisclosedIneffectivet ¼1 92 79 80 251Total firm-years 452 636 656 1744% with DisclosedIneffectivet ¼1 20.4% 12.4% 12.2% 14.4%
Firm-years with MaintainedIneffectivet ¼1 127 105 98 330a
Total firm-years 452 636 656 1744% with MaintainedIneffectivet ¼1 28.1% 16.5% 14.9% 18.9%
Panel B: Descriptive Statistics
Variables
MaintainedIneffectivet ¼1 MaintainedIneffectivet ¼ 0(N ¼ 330) (N ¼ 1414)
Mean MedianPredicted Diff.(t-test of means) Mean Median
Foreignt-1,t 0.373 0.000 4*** 0.245 0.000M&At-1,t 0.445 0.000 4** 0.378 0.000Restructuret-1,t 0.133 0.000 4** 0.093 0.000ExtrSalesGrowtht-2,t 0.091 0.000 4 0.090 0.000ExtrInvGrowtht-2,t 0.100 0.000 4 0.088 0.000AggLosst-1,t 0.530 1.000 4*** 0.383 0.000Restatet-2,t-1 0.503 1.000 4*** 0.107 0.000Segt 4.212 4.000 4*** 3.152 2.000Aget 2.583 2.485 o** 2.510 2.485LitigiousIndt 0.233 0.000 ? 0.272 0.000ComputerIndt 0.179 0.000 4*** 0.093 0.000BankIndt 0.088 0.000 o*** 0.202 0.000Sizet-1 5.189 5.215 ?*** 5.078 5.080Casht-1 0.266 0.184 o 0.278 0.138Governancet-1 0.447 0.444 o** 0.492 0.444InstOwnt-1 0.167 0.000 o* 0.191 0.000Prior404302t 0.773 1.000 4*** 0.096 0.000
Panel C: Stepwise Logistic Determinants Model Output
Variables Pred. Y = MaintainedIneffectivet
AggLosst-1,t þ 0.301**(1.71)
Restatet-2,t-1 þ 0.940***(4.98)
Segt þ 0.072**(2.29)
Aget ̶ -0.344***(-2.76)
BankIndt - -0.714***(-2.41)
Sizet-1 – -0.361***(-4.68)
Casht-1 ̶ -1.088***(-3.34)
InstOwnt-1 ̶ -1.285***(-4.46)
Prior404302t þ 3.161***(17.65)
N Y¼1 330N Observations 1744ROC 0.887Standard Errors Clustered FirmProbability Threshold 0.150
Notes: All variables are defined in Appendix C, and all continuous variables are winsorized at the 1st and 99th percentiles by fiscal year. In Panel C we use alogistic specification, and z-statistics are presented below each coefficient. ***, **, and * indicate significance at the 1%, 5%, and 10% level, respectively, usingtwo-tailed (one-tailed) p-values for non-directional (directional) predictions.
a We identify 330 firm-years as having maintained ineffective internal controls (MaintainedIneffectivet ¼ 1) and 251 firm-years where the firm dis-closed ineffective controls in its Form 10-K (DisclosedIneffectivet ¼ 1). We also identify an additional 79 firm-years that restated their financial statementsand indicated that their internal controls were originally reported as effective but should have been deemed ineffective. Of these 79 observations, 70 wereidentified by Rice and Weber (2012) and Rice et al. (2015), and nine were identified by amended Section 404(b) reports within Form 10-K/A (AuditAnalytics).
W. Ge et al. / Journal of Accounting and Economics 63 (2017) 358–384368

W. Ge et al. / Journal of Accounting and Economics 63 (2017) 358–384 369
= × + × + × – ×
– × – × – × – ×
+ × ( )
− − −
− − −
PredictedValue AggLoss Restate Seg Age
BankInd Size Cash InstOwn
Prior404302
0.301 0.940 0.072 0.344
0.714 0.361 1.088 1.285
3.161 2
t t t t t t t
t t t t
t
1, 2, 1
1 1 1
To ease interpretation, we transform PredictedValue into PredictedProbability, a variable bound between zero and one,using the equation PredictedProbability ¼ e(PredictedValue) C (1 þ e(PredictedValue)). This monotonic transformation preserves therank of PredictedValue values. PredictedProbability values closer to one (zero) indicate a higher (lower) expected likelihoodthat a firm maintains ineffective internal controls.
5.2.2. Prediction model validity testsWe validate our Eq. (2) prediction model in several ways. Results from these tests are presented in Table 4, Panels A–D. First,
Table 4, Panel A presents descriptive statistics for the nine Eq. (2) variables for the 5,305 exempt firm-years. Variable differencesbetween exempt firms that disclose effective versus ineffective internal controls are similar to the results for non-exempt firmsreported in Table 3, Panel B. Re-estimating Eq. (1b) using exempt firm observations identifies eight of nine variables (all but thenumber of segments) as significant and yields an ROC curve of 0.902 (untabulated). To the extent that the determinants differbetween the two samples, we identify IC misreporting among exempt firms with error. Such classification error makes it moredifficult to find supporting evidence in our classification validity, cross-sectional, and “status switcher” tests (detailed in Section 5.2.3).
Second, we expect that firms disclosing ineffective internal controls have higher PredictedProbability values than firmsdisclosing effective internal controls. As illustrated in Panel B, the mean PredictedProbability value is 67.2 percent amongfirms disclosing ineffective internal controls, but only 14.5 percent among firms disclosing effective internal controls. Themean PredictedProbability value for the full sample is 0.202, indicating that 20.2 percent of exempt observations (1071 firm-years) maintain ineffective internal controls. However, only 10.9 percent (577 firm-years) disclose ineffective internal con-trols. Combined, these statistics suggest that 9.3 percent (¼20.2–10.9) of exempt firm-years inaccurately disclose effectiveinternal controls. Stated alternatively, within firms we predict to have ineffective internal controls, almost half misreporttheir internal control status (¼ [1071–577] C 1071 ¼ 46 percent).
Third, we form quintiles based on PredictedProbability values. If our model has no predictive ability, then firm-year observationsdisclosing effective and ineffective internal controls should be distributed uniformly across quintiles. In contrast, if our model canpredict whether firms maintain effective internal controls, then firm-years that disclose ineffective internal controls should clusterin the quintile with the highest PredictedProbability values (Dechow et al., 2011). Table 4, Panel C displays a monotonic decrease inthe number of firm-years disclosing ineffective internal controls (DisclosedIneffective¼1) across PredictedProbability quintiles, withclustering in the top quintile. To illustrate, 86.3 percent of the DisclosedIneffective¼1 observations are in the top PredictedProbabilityquintile, while only 2.1 percent are in the bottom quintile. In contrast, the number of firm-years disclosing effective internal controls(DisclosedIneffective¼0) is reasonably similar across the bottom four quintiles of PredictedProbability quintiles, with the smallestnumber in the top quintile, as expected.
We use the information in Panel C to classify the exempt observations disclosing effective internal controls (Dis-closedIneffective¼0) into two groups: firms suspected of misreporting internal control effectiveness (SuspectedIneffective¼1), andfirms deemed to be credibly disclosing effective internal controls (CrediblyEffective¼1). Fig. 2 provides a graphical presentation ofhow firms are classified for purposes of our subsequent analyses. SuspectedIneffective is an indicator variable set equal to one forthe 562 firm-years with DisclosedIneffective¼0 and a PredictedProbability value in the top quintile in Panel C (i.e., Pre-dictedProbabilityZ0.217). CrediblyEffective is an indicator variable set equal to one for firm-years with DisclosedIneffective¼0 and aPredictedProbability value in the four bottom quintiles in Panel C (i.e., PredictedProbabilityo0.217). Our SuspectedIneffective defi-nition yields a 10.6 percent suspected IC misreporting rate (¼562 C 5,305), which is qualitatively similar to the 9.3 percentsuspected IC misreporting rate based on the mean PredictedProbability value discussed in relation to Panel B. Our SuspectedI-neffective definition uses the PredictedProbability value at the 20th percentile as a cutoff. We assess the sensitivity of our costanalysis with alternative PredictedProbability value cutoffs ranging from the 10th to 30th percentile in Section 5.4.
To further validate this classification, we examine factors expected to be associated with suspected IC misreporting by com-paring SuspectedIneffective ¼ 1 and SuspectedIneffective ¼ 0 observations. These test results are presented in Table 4, Panel D. Wefirst investigate future realizations, beginning with how often managers amend their 404(a) reports to disclose ineffective internalcontrols. We find that 3.4 percent of suspected IC misreporters eventually amend their 404(a) reports to disclose ineffectiveinternal controls (Amend404(a)¼1), which is significantly more than the 0.4 percent of credibly effective firms that amend(po0.01). It is not surprising that we do not observe any 404(a) amendments by firms that originally disclose ineffective internalcontrols, as it is unlikely a firm would erroneously identify and disclose ineffective internal controls.
We next examine whether suspected IC misreporters are more likely than credibly effective firms, and similarly likely asdisclosed ineffective firms, to experience future restatements or stock market performance-related delistings. Turning first torestatements, we set the indicator variable Restatet equal to one if a firm's year t financial statement (the year of the 404(a) disclosure) is subsequently restated.24 We find that 16.4 percent of suspected IC misreporters restate their current period
24 Note that these restatements are not simply capturing 404(a) amendments, as 90 percent of our restatement sample firms do not modify their 404(a) opinion (untabulated).

Table 4Prediction Model Validity Tests (Exempt Firms)
Panel A: Determinants of Ineffective Internal Controls
Variables
DisclosedIneffectivet ¼ 1
Predicted Diff.
DisclosedIneffectivet ¼ 0(N¼577)
(t-test of means)
(N¼4725)
Mean Median Mean Median
AggLosst-1,t 0.610 1.000 4*** 0.508 1.000Restatet-2,t-1 0.296 0.000 4*** 0.083 0.000Segt 3.088 2.000 4*** 2.792 2.000Aget 2.366 2.398 o*** 2.645 2.708BankIndt 0.097 0.000 o*** 0.228 0.000Sizet-1 3.600 3.627 ? 3.603 3.665Casht-1 0.181 0.106 o*** 0.216 0.111InstOwnt-1 0.077 0.000 o*** 0.117 0.039Prior404302t 0.830 1.000 4*** 0.068 0.000
Panel B: PredictedProbabilityt Values by DisclosedIneffectivet Status
PredictedProbabilityt
N Percent Mean SD P25 P50 P75
DisclosedIneffectivet ¼ 0 4725 89.12% 0.145 0.178 0.056 0.089 0.143DisclosedIneffectivet ¼ 1 577 10.88% 0.672 0.263 0.622 0.763 0.850All Observations 5302 100.00% 0.202 0.250 0.059 0.098 0.178Test of Differences t ¼ 63.25*** z ¼ 32.07***
Panel C: PredictedProbabilityt Values by PredictedProbabilityt Quintile
DisclosedIneffectivet ¼ 1 DisclosedIneffectivet ¼ 0
Pooled Sample PredictedProbabilitytValues
PredictedProbabilitytValues
PredictedProbabilityt Quintiles N Percent N Percent Min Mean N Percent Min Mean
1 (highest) 1060 20.0% 498 86.3% 0.231 0.762 562 11.9% 0.217 0.5492 1060 20.0% 32 5.5% 0.119 0.157 1028 21.8% 0.119 0.1563 1061 20.0% 20 3.5% 0.081 0.098 1041 22.0% 0.080 0.0994 1060 20.0% 15 2.6% 0.055 0.063 1045 22.1% 0.054 0.0665 (lowest) 1061 20.0% 12 2.1% 0.028 0.042 1049 22.2% 0.007 0.041Total 5302 100.0% 577 100.0% 0.672 4725 100.0% 0.145
Panel D: Factors Associated with Suspected IC Misreporting
[1] [2] [3]DisclosedIneffectivet ¼ 1 SuspectedIneffectivet ¼ 1 CrediblyEffectivet ¼ 1
Variables N Mean Pred. Diff. N Mean Pred. Diff. N Mean
Future RealizationsAmend404(a)t 577 0.0% n/a 562 3.4% 4*** 4163 0.4%Restatet 577 11.8% ¼** 562 16.4% 4*** 4163 3.4%DelistPerformance 577 25.3% ? 562 23.8% 4*** 4163 13.1%
Discovery and DisclosureHighMAt-1,t 380 5.0% 4** 391 2.3% o* 2263 4.2%Big4t 577 11.8% 4 þ þ þ 561 18.0% ? 4161 20.3%ΔAudt 577 26.7% 4*** 562 18.7% ?*** 4163 9.1%
IncentivesDebtEquityIssuancet 577 52.0% o** 562 57.7% ?*** 4163 49.7%Zscoret 469 1.513 4** 442 0.331 o*** 2622 1.820
Notes: All variables are defined in Appendix C, and all continuous variables are winsorized at the 1st and 99th percentiles by fiscal year. ***, **, and* indicate significance at the 1%, 5%, and 10% level, respectively, using two-tailed (one-tailed) p-values for non-directional (directional) predictions. þ þ þ
indicates significance in the direction opposite to prediction at the 1% level using a two-tailed p-value.
W. Ge et al. / Journal of Accounting and Economics 63 (2017) 358–384370

Fig. 2. How Exempt Firms are Classified as DisclosedIneffectivet, SuspectedIneffectivet, and CrediblyEffectivet.Notes: All variables are defined in Appendix C.
W. Ge et al. / Journal of Accounting and Economics 63 (2017) 358–384 371
financial statements, whereas only 3.4 percent of credibly effective firms restate. Not only are suspected IC misreporters morelikely to restate than credibly effective firms (po0.01), but their restatement rate is significantly higher than the 11.8 percentrestatement rate among firms that disclose ineffective internal controls (po0.05). Turning to stock exchange delistings, we findthat suspected IC misreporters are more likely than credibly effective reporters (p o0.01), and approximately as likely as firmsreporting ineffective internal controls (p40.10), to delist due to poor performance (DelistPerformance¼1). These results furthervalidate our model's explanatory power in classifying firms that fail to identify or disclose ineffective internal controls.
We next consider how the accuracy of internal control effectiveness disclosure varies cross-sectionally with managerial abilityto discover, and incentives to disclose, weaknesses. The descriptions and predictions for each variable are discussed in Appendix D.Overall, we find that suspected IC misreporters are managed by lower-ability managers, relative to firms that disclose ineffectiveinternal controls (po0.05). Lower-ability managers are expected to be less capable of discovering internal control issues, so the ICmisreporting by these managers may be unintentional. Opposite our expectation, suspected IC misreporters are more likely tohave a Big 4 auditor than firms that disclose ineffective internal controls (po0.01). However, suspected IC misreporters aresignificantly less likely to experience an auditor change in year t relative to firms that disclose ineffective internal controls(po0.01). To the extent that new auditors scrutinize a client's internal control disclosures more carefully than continuing auditorsdo, this result is consistent with the notion that monitoring discourages IC misreporting.
Turning to our incentive variables for IC misreporting, we find that 57.7 percent of suspected IC misreporters issue new debt orequity in year t (DebtEquityIssuancet), but only 52.0 percent of firms disclosing ineffective internal controls do the same; thisdifference is significant (po0.05). We also find that suspected IC misreporters have significantly lower Z-scores (Zscoret) thanfirms disclosing ineffective internal controls (po0.05), which indicates higher bankruptcy risk. Taken together, these resultssuggest that IC misreporting is more likely when managerial ability to discover weaknesses is lower and when incentives to avoiddisclosure are stronger; this is consistent with our model identifying suspected IC misreporting.
5.2.3. Does 404(b) curb internal control misreporting?We next gauge the incremental impact of 404(b) on the discovery or disclosure of ineffective internal controls. As shown
above, we estimate that while 20.2 percent of exempt firms should disclose ineffective internal controls, only 10.9 percent actuallydo so, which suggests 9.3 percent of exempt firms are IC misreporters. Rice and Weber (2012) provide evidence that IC mis-reporting also occurs among accelerated filers that comply with 404(b). Based on Table 3, Panel A, we estimate that while 18.9percent of non-exempt firms should disclose ineffective internal controls (MaintainedIneffective ¼ 1), only 14.4 percent do so(DisclosedIneffective ¼ 1). This suggests that 4.5 percent of non-exempt firms are IC misreporters. The 4.5 percent figure representsa lower bound of non-exempt firm IC misreporting, because there are likely to be additional firms that inappropriately disclosedeffective internal controls but did not subsequently amend their 404(b) report or experience an internal control-related re-statement. Nevertheless, our estimate of 9.3 percent IC misreporting among exempt firms is greater than the 4.5 percent figure fornon-exempt firms, and suggests that IC misreporting is materially higher absent Section 404(b).
To more explicitly test whether Section 404(b) reduces inaccurate internal control disclosures, we consider how internalcontrol disclosures change when exempt firms become subject to 404(b). We examine the internal control disclosures of254 “switchers” (i.e., firms whose filing status changes from exempt to non-exempt) to provide evidence of whether the

Table 5Does 404(b) Curb the Failure to Discover or Disclose Ineffective Internal Controls?
Panel A: DisclosedIneffectivetþ1 for SwitchToAFtþ1¼1 Observations (N¼254)
[1] [2] [3]DisclosedIneffectivet ¼ 1
under 404(a)SuspectedIneffectivet ¼ 1
under 404(a)CrediblyEffectivet ¼ 1
under 404(a)
Disclosure under 404(b) N Percent N Percent N Percent
DisclosedIneffectivetþ1 ¼ 0 15 62.5% 13 61.9% 194 92.8%DisclosedIneffectivetþ1 ¼ 1 9 37.5% 8 38.1% 15 7.2%Total 24 100.0% 21 100.0% 209 100.0%
Panel B: Modeling DisclosedIneffectivetþ1 as a Function of Firms’ Switch to Non-Exempt Statustþ1 and Model Classification under 404(a) in year t
[1] [2] [3]Variables Pred. Y¼ DisclosedIneffectivetþ1 Y¼ DisclosedIneffectivetþ1 Y¼ DisclosedIneffectivetþ1
SwitchToAFtþ1 þ 1.752*** 0.889*** 0.712**(3.70) (3.75) (2.47)
SuspectedIneffectivet þ 1.034***(5.20)
SwitchToAFtþ1� SuspectedIneffectivet þ 1.040**(1.88)
Constant þ/- -2.237*** -3.086*** -3.271***(-13.21) (-34.68) (-32.22)
N Y¼1 46 168 168N Observations 415 3550 3550Sample SuspectedIneffectivet ¼ 1 SuspectedIneffectivet ¼ 1 SuspectedIneffectivet ¼ 1
& CrediblyEffectivet ¼ 1 & CrediblyEffectivet ¼ 1ROC 0.569 0.538 0.603Standard Errors Clustered Firm Firm Firm
Notes: All variables are defined in Appendix C, and all continuous variables are winsorized at the 1st and 99th percentiles by fiscal year.***, **, and * indicate significance at the 1%, 5%, and 10% level, respectively, using two-tailed (one-tailed) p-values for non-directional (directional)predictions.
W. Ge et al. / Journal of Accounting and Economics 63 (2017) 358–384372
same firm is more likely to disclose ineffective internal controls when subject to 404(b). Although this is a small sample ofobservations, a benefit of this analysis is that it uses a firm as its own control.
In Table 5, Panel A, we provide univariate comparisons of the 254 switchers’ internal controls disclosures in the yearprior to and the year of 404(b) compliance. In the year prior to auditor attestation, 21 switchers were classified as suspectedIC misreporters. Of these 21, eight (38.1 percent) disclose ineffective internal controls once subject to auditor attestationunder 404(b).25 This suggests that 404(b) compliance curbs suspected IC misreporting by an estimated 38.1 percent.26 Incontrast, of the 209 switchers that credibly disclosed effective internal controls in the year prior to auditor attestation, only15 (7.2 percent) disclose ineffective internal controls once subject to 404(b).
Our multivariate analysis in Panel B corroborates the Panel A univariate result that Section 404(b) curbs inaccurate internalcontrol disclosures. In Column 1, we consider only the 562 firms identified in year t as suspected IC misreporters. Of these, 415provide an internal control disclosure in tþ1 and thus can be included in the analysis. We create an indicator variable,SwitchToAFtþ1, equal to one for the 21 observations that switched to non-exempt status in year tþ1. We find that the coefficient onSwitchToAFtþ1 is positive and significant (po0.01), consistent with suspected IC misreporters being more likely to disclose in-effective internal controls once subject to 404(b). The coefficient on SwitchToAFtþ1 is lower in Column 2 (0.889 versus 1.752), wherewe include all exempt firms that reported effective internal controls in year t instead of only suspected IC misreporters. Weformalize this difference in Column 3, where we include main effects for SwitchToAFtþ1 and SuspectedIneffectivet, as well as aninteraction between the two variables. The positive and significant coefficient on SwitchToAFtþ1 illustrates that all firms are morelikely to disclose ineffective internal controls once subject to 404(b), and the positive and significant coefficient onSuspectedIneffectivet indicates that firms suspected of IC misreporting under 404(a) in year t are more likely to disclose ineffectiveinternal controls in tþ1, even if they are not subject to 404(b). The positive and statistically significant coefficient on the interactionterm indicates that suspected IC misreporters that become subject to 404(b) are more likely to disclose ineffective internal controls,relative to suspected IC misreporters that continue to be exempt from 404(b). This is consistent with the joint hypothesis that our
25 We view 38.1 percent as a conservative estimate, as it is likely that firms with known but undisclosed internal control weaknesses remediate prior tothe additional scrutiny of Section 404(b).
26 Thus, IC misreporting after firms become subject to Section 404(b) falls from 9.3 percent to 5.8 percent (¼ 0.093 � (1–0.381)) which is closer to the4.5 percent IC misreporting among the non-exempt firm-years we examine. DeFond and Lennox (2017) find that IC misreporting among non-exempt firmshas declined in more recent years, suggesting that 404(b) compliance may curb more than 38.1 percent.

W. Ge et al. / Journal of Accounting and Economics 63 (2017) 358–384 373
model identifies IC misreporters and that 404(b) improves disclosure accuracy. Note that our Table 5 analyses are within the AS5audit regime, so the benefit of 404(b) is present even in the absence of the more rigorous attestation procedures of AS2.
5.3. Estimating costs of 404(b) exemption
In this section, we estimate two costs of 404(b) exemption based on our identification of suspected IC misreporters and theextent that this IC misreporting is curbed by Section 404(b). The first is the cost of failing to remediate ineffective internal controls.Prior research documents that firms that publicly disclose ineffective internal controls tend to remediate these material weak-nesses and experience a subsequent improvement in operating performance (Feng et al., 2015). To the extent that IC misreportersdo not discover and disclose their internal control weaknesses, they are not expected to remediate these issues. Thus, loweroperating performance due to non-remediation is a cost of exemption. To empirically assess whether this actually occurs, weexamine the differences in future return on assets (ROA) between suspected IC misreporters, firms that disclose and remediateineffective internal controls, and firms that disclose but fail to remediate ineffective internal controls.
We present univariate comparisons in Table 6, Panel A and provide medians to avoid the influence of outliers. In yeartþ1, the ROA of credibly effective disclosers is statistically higher than the ROA of suspected IC misreporters. In contrast,suspected IC misreporters and firms that disclose ineffective internal controls report negative ROAs that are statisticallyindistinguishable. These findings are consistent with suspected IC misreporters inaccurately disclosing their internal controlstatus, on average. Firms disclosing ineffective internal controls report improved ROA values in years tþ2 and tþ3, con-sistent with operating performance improving upon remediation of these weaknesses. However, suspected IC misreporterscontinue to report negative ROA in years tþ2 and tþ3, consistent with these firms failing to remediate their internal controlweaknesses, on average. Inferences are similar using a constant sample of observations from tþ1 to tþ3 (untabulated).
Instead of assuming that the entire ROA differential between suspected IC misreporters and firms that disclose ineffectiveinternal controls is a result of remediation, we present a multivariate analysis in Table 6, Panel B, which tabulates firms’change in ROA from year t to tþ3. Although we do not capture the cost of remediation directly, these costs will generallyflow through ROA (e.g., depreciation expense of a new internal control system, SG&A related to employee time spent im-plementing new controls, etc.). We include the control variables that could explain firms’ changes in ROA from Feng et al.(2015). Column 1 of Panel B provides evidence that firms disclosing ineffective internal controls experience a 3.3 percentimprovement in ROA (po0.05), whereas suspected IC misreporters experience no improvement (p40.10). Column 2 cor-roborates our expectations that ROA improves more within firms that disclose ineffective internal controls and remediatethem in the following year (Remediatetþ1 coefficient¼0.047; po 0.05), relative to both firms that disclose but do notremediate ineffective internal controls (NoRemediatetþ1) and to suspected IC misreporters. Using the change in industry-adjusted ROA from t to tþ3 as the dependent variable yields similar inferences (untabulated).
It is possible that poor financial reporting quality could confound the estimates in Columns 1 and 2, given that firms withineffective internal controls tend to have lower-quality reported earnings (e.g., Doyle et al., 2007b). To mitigate this concern,we remove the 269 observations that subsequently restate their year t or tþ3 financial statements and present the resultsbased on this restricted sample in Columns 3 and 4. The DisclosedIneffective (Remediate) coefficient in Column 3 (4) remainsstatistically significant (po0.05 for both). Both coefficients appear larger in magnitude than results for the full sample ofobservations (Columns 1 and 2, respectively). This is consistent with some suspected IC misreporters overstating futurereported earnings, which introduces a downward bias to our cost estimate.
In Table 6, Panel C, we calculate the aggregate dollar value of the lower operating performance due to firms failing todiscover or disclose and then remediate ineffective internal controls. We estimate the cost of lower operating performanceby considering the difference between the change in ROA for firms that disclose ineffective controls and for suspected ICmisreporters, reported in Column 1 of Table 6, Panel B. The difference is reflected in the DisclosedIneffective coefficient(0.033) because the SuspectedIneffective coefficient is not statistically different from zero (p40.10).27 Thus, the “cost” ofsuspected IC misreporters failing to identify and disclose ineffective internal controls is 3.3 percent of total assets over threeyears. We convert total assets of suspected IC misreporters into 2014 real dollars so that our cost calculation is directlycomparable to our benefits calculation (which measures incremental audit fees in 2014 real dollars). The 426 non-over-lapping suspected IC misreporters have average assets of $159.9 million.28 Thus, a 3.3 percent increase in assets translates tolower operating performance of $5.3 million in the three years following the suspected IC misreporting. Since we estimatethat 404(b) eliminates only 38.1 percent of IC misreporting (see Section 5.2.3), lower operating performance amounts to 38.1percent of this cost, or $2.0 million per firm. Although suspected IC misreporters’ lower operating performance is realizedfrom t through tþ3, it is only statistically different from DisclosedIneffective firms in year tþ3. Thus, we discount the costestimate from year tþ3, applying a six percent discount rate and estimate that suspected IC misreporters forgo futureearnings with a present value of $1.7 million.29 Multiplying this per-firm value by the 426 non-overlapping suspected IC
27 Using the difference between the DisclosedIneffective coefficient of 0.03 and the SuspectedIneffective coefficient of 0.003 yields similar inferences(untabulated).
28 We remove 136 of the 562 SuspectedIneffectivet ¼ 1 observations also classified as a suspected IC misreporter in tþ1 through tþ3 to avoid double-counting a firm during the ΔROAt,tþ3 time period.
29 We select a six percent discount rate following Erickson et al. (2004). CFO perceptions of equity discount rates (Graham and Harvey, 2010) andestimates by academics during our cost estimate time period (e.g., http://pages.stern.nyu.edu/�adamodar/; last accessed November 21, 2016) yield a

Table 6Costs of 404(b) Exemption (Exempt Firms)Panel A: Future ROA by Internal Control Reporting Classification
[1] [2] [3]DisclosedIneffectivet ¼ 1 SuspectedIneffectivet ¼ 1 CrediblyEffectivet ¼ 1
Variables N Median Test of Diff. N Median Test of Diff. N Median
ROAtþ1 486 -2.76% n.s. 504 -3.19% *** 3,715 0.39%ROAtþ2 375 -0.84% n.s. 406 -2.35% *** 3,044 0.51%ROAtþ3 282 -0.26% ** 312 -1.85% *** 2,395 0.62%
Panel B: Assessing the Operating Performance Cost of Non-Remediation
[1] [2] [3] [4]Variables Pred. Y¼ ΔROAt,tþ3 Y¼ ΔROAt,tþ3 Y¼ ΔROAt,tþ3 Y¼ ΔROAt,tþ3
SuspectedIneffectivet ? 0.003 0.002 0.007 0.007(0.18) (0.16) (0.42) (0.40)
DisclosedIneffectivet þ/- 0.033** 0.037**(2.08) (2.02)
Remediatetþ1 þ 0.047** 0.055**(2.08) (2.16)
NoRemediatetþ1 þ/- 0.018 0.015(0.85) (0.59)
SalesGrowtht-2 to t þ -0.022*** -0.021*** -0.022** -0.022**(-2.82) (-2.79) (-2.53) (-2.50)
ROAt-1 – -0.102*** -0.100*** -0.105*** -0.104***(-2.75) (-2.70) (-2.64) (-2.59)
Losst ? 0.078*** 0.078*** 0.077*** 0.076***(7.51) (7.48) (6.72) (6.69)
Sizet þ -0.001 -0.001 0.001 0.000(-0.13) (-0.17) (0.14) (0.08)
Constant þ/- -0.017 -0.017 -0.026 -0.025(-0.63) (-0.61) (-0.88) (-0.86)
Β1¼β2 F¼2.40* – F¼1.69* –
Β1¼β3 – F¼3.11** – F¼2.76**N SuspectedIneffective ¼ 1 305 305 237 237N DisclosedIneffective ¼ 1 272 272 223 223N Remediate ¼ 1 – 119 – 103Total N 2,888 2,888 2,619a 2,619Adjusted R2 0.096 0.096 0.096 0.096Fixed effects Ind. & Yr. Ind. & Yr. Ind. & Yr. Ind. & Yr.Standard errors clustered by Firm Firm Firm Firm
Panel C: Cost Estimate of Suspected IC Misreporters’ Lower Operating Performance Attributed to 404(b) Exemption
3.30% Average ΔROAt,tþ3 for DisclosedIneffective ¼ 1 observations (Table 6, Panel B, Column 1, β2)–0.00% Average ΔROAt,tþ3 for SuspectedIneffective ¼ 1 observations (Table 6, Panel B, Column 1, β1)
3.30% Incremental difference in ΔROAt,tþ3 attributed to disclosing ineffective and remediating× $159,905,000 × Mean assetst for SuspectedIneffectivet = 1 observations
$5,276,865 Per-firm foregone operating improvements attributed to suspected IC misreporters’ inaccurate internal control disclosure� 38.1% � Reduction in IC misreporting attributed to 404(b) compliance (Table 5, Panel A, Column 2)
$2,010,486 Per-firm foregone operating improvements attributed to suspected IC misreporters’ inaccurate internal control disclosuresdue to 404(b) exemption
÷ (1.06)3 ÷ Present value adjustment (three years at six percent)
$1,688,042 Per-firm present-value of foregone operating improvements attributed to suspected IC misreporters’ inaccurate internalcontrol disclosures due to 404(b) exemption
× 426 � SuspectedIneffectivet = 1 observationsb
$719,106,083 Aggregate present-value of foregone operating improvements attributed to suspected IC misreporters’ inaccurate internalcontrol disclosures due to 404(b) exemption
W. Ge et al. / Journal of Accounting and Economics 63 (2017) 358–384374

Panel D: Future Abnormal Returns by Internal Control Reporting Classification
[1] [2] [3]DisclosedIneffectivet ¼ 1 SuspectedIneffectivet ¼ 1 CrediblyEffectivet ¼ 1
Variables N MedianTest ofDiff. N Median
Test ofDiff. N Median
AbRettþ1 403 -28.99% *** 434 -17.84% ** 3111 -8.33%AbRettþ1 through tþ2 403 -48.40% *** 434 -30.53% *** 3111 -12.01%AbRettþ1 through tþ3 403 -56.08% ** 434 -43.66% *** 3111 -12.87%AbRettþ1 through tþ4 403 -60.00% n.s. 434 -55.04% *** 3111 -9.81%
Panel E: Cost Estimate of Suspected IC Misreporters’ Delayed Decline in Market Values Attributed to 404(b) Exemption
56.08% Median negative AbRettþ1 through tþ3 for DisclosedIneffective ¼ 1 observations (Table 6, Panel D)× 43.66% – Median negative AbRett+1 through t+3 for SuspectedIneffective = 1 observations (Table 6, Panel D)
12.42% Incremental difference in median negative AbRettþ1 through tþ3 attributed to IC misreporting× $46,380,000 × Mean market valuet for SuspectedIneffective = 1 observations
$5,760,396 Per-firm delayed decline in market value attributed to suspected IC misreporters’ inaccurate internal control disclosures× 38.10% × Reduction in IC misreporting attributed to 404(b) compliance (Table 5, Panel A, Column 2)
$2,194,711 Per-firm delayed decline in market value attributed to suspected IC misreporters’ inaccurate internal control disclosures due to404(b) exemption
× 426 × SuspectedIneffectivet = 1 observationsb
$934,946,833 Aggregate delayed decline in market values attributed to suspected IC misreporters’ inaccurate internal control disclosures due to404(b) exemption
Notes: All dollar values are presented in 2014 real dollars. All variables are defined in Appendix C, and all continuous variables are winsorized at the 1st and99th percentiles by fiscal year. ***, **, and * indicate significance at the 1%, 5%, and 10% level, respectively, using two-tailed (one-tailed) p-values for non-directional (directional) predictions.
a The sample decreases in Columns 3 and 4 because we remove the 269 observations that subsequently restate their year t or tþ3 financial state-ments.
b We remove 136 of the 562 SuspectedIneffectivet¼1 observations also classified as a suspected IC misreporter in tþ1 through tþ3 to avoid double-counting a firm during the ΔROAt,tþ3 time period.
W. Ge et al. / Journal of Accounting and Economics 63 (2017) 358–384 375
misreporters yields an aggregated cost of $719.1 million. Undiscounted foregone earnings are $2.0 million per suspected ICmisreporter and $866 million in the aggregate. This cost is borne by IC misreporter shareholders. It is possible that loweroperating performance extends beyond year tþ3, which would suggest that our cost estimate is conservative.
We conduct multiple sensitivity analyses in relation to this cost estimate. Re-calculating Table 6, Panel C using the 3.7 percentdifference in ΔROAt,tþ3 from the sample of firms without restatements (Table 6, Panel B, Column 3) yields an estimated $960million in aggregate lower operating performance (untabulated). An alternative way to address the potential concern of financialreporting quality confounding our analyses is to examine cash from operations in place of net income. Doing this continues toyield a positive and significant DisclosedIneffective coefficient (in Column 3, β2¼0.023, po0.05; untabulated). This improvementcontinues to be concentrated within remediation firms (in Column 4, β2¼0.034, po0.05; untabulated).
The second cost is market values failing to reflect firms’ underlying internal control status. Long-term future abnormalstock returns (AbRettþ1,tþ i) are measured using buy-and-hold, size-adjusted returns calculated over one- to four-yearperiods, beginning on the first day of the fiscal year tþ1 so the return period includes the year t internal control statusannouncement. Abnormal returns reflect when the suspected IC misreporters’ poor performance is impounded into stockprice by investors. As a large percentage of exempt firms delist (see Table 4, Panel D), we include firms’ delisting returns inour return calculations. To capture the valuation impact of the disclosure, we first calculate AbRettþ1, which includes theperiod in which a firm discloses its internal control effectiveness in its Form 10-K. Table 6, Panel D shows that the mediansuspected IC misreporter experiences a –17.8 percent abnormal return in tþ1. This is larger than the –8.3 percent abnormalreturn for the median credibly effective firm (po0.05), but smaller than the –29.0 percent abnormal return for the medianfirm that discloses ineffective internal controls (po0.01).
To the extent that the difference in tþ1 returns between suspected IC misreporters and firms disclosing ineffectiveinternal controls is attributable to the knowledge of ineffective internal controls, this provides an estimate of the cost of thefailure to disclose ineffective internal controls. If so, we expect returns to converge over the next few years as the costsrelated to ineffective internal controls are realized among suspected IC misreporters. If we have misidentified suspected ICmisreporters, we would not expect such a convergence.
We present the cumulative returns for years tþ1 through tþ i, where i is equal to two through four, in Panel D. Thecumulative returns continue to be significantly different between the two groups in tþ2 and tþ3. By four years after the
(footnote continued)qualitatively similar discount rate (untabulated).
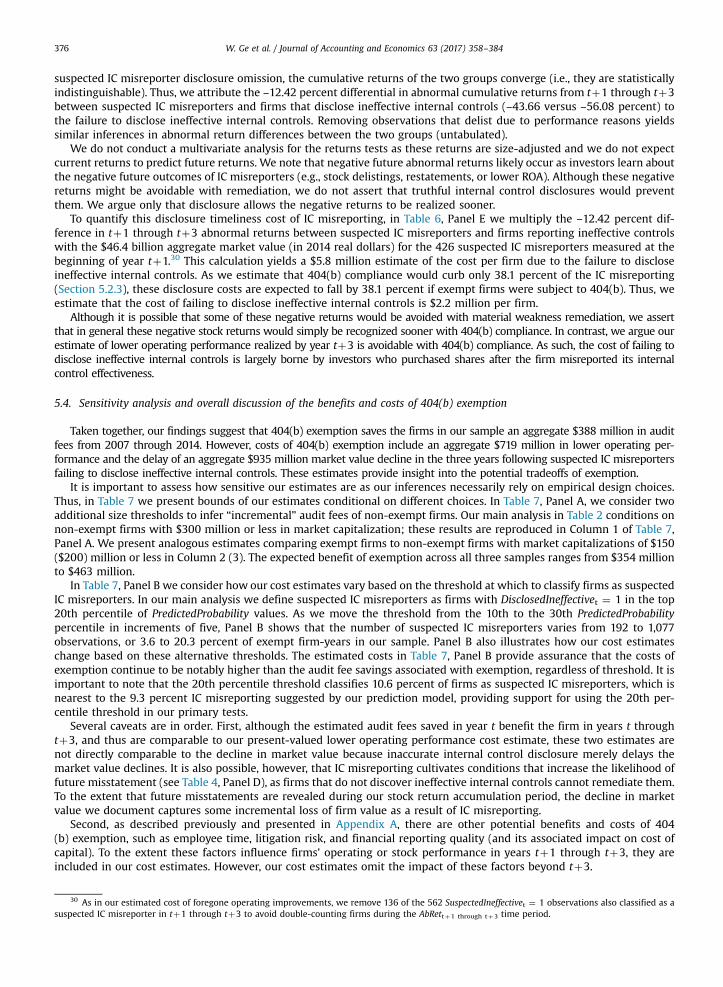
W. Ge et al. / Journal of Accounting and Economics 63 (2017) 358–384376
suspected IC misreporter disclosure omission, the cumulative returns of the two groups converge (i.e., they are statisticallyindistinguishable). Thus, we attribute the –12.42 percent differential in abnormal cumulative returns from tþ1 through tþ3between suspected IC misreporters and firms that disclose ineffective internal controls (–43.66 versus –56.08 percent) tothe failure to disclose ineffective internal controls. Removing observations that delist due to performance reasons yieldssimilar inferences in abnormal return differences between the two groups (untabulated).
We do not conduct a multivariate analysis for the returns tests as these returns are size-adjusted and we do not expectcurrent returns to predict future returns. We note that negative future abnormal returns likely occur as investors learn aboutthe negative future outcomes of IC misreporters (e.g., stock delistings, restatements, or lower ROA). Although these negativereturns might be avoidable with remediation, we do not assert that truthful internal control disclosures would preventthem. We argue only that disclosure allows the negative returns to be realized sooner.
To quantify this disclosure timeliness cost of IC misreporting, in Table 6, Panel E we multiply the –12.42 percent dif-ference in tþ1 through tþ3 abnormal returns between suspected IC misreporters and firms reporting ineffective controlswith the $46.4 billion aggregate market value (in 2014 real dollars) for the 426 suspected IC misreporters measured at thebeginning of year tþ1.30 This calculation yields a $5.8 million estimate of the cost per firm due to the failure to discloseineffective internal controls. As we estimate that 404(b) compliance would curb only 38.1 percent of the IC misreporting(Section 5.2.3), these disclosure costs are expected to fall by 38.1 percent if exempt firms were subject to 404(b). Thus, weestimate that the cost of failing to disclose ineffective internal controls is $2.2 million per firm.
Although it is possible that some of these negative returns would be avoided with material weakness remediation, we assertthat in general these negative stock returns would simply be recognized sooner with 404(b) compliance. In contrast, we argue ourestimate of lower operating performance realized by year tþ3 is avoidable with 404(b) compliance. As such, the cost of failing todisclose ineffective internal controls is largely borne by investors who purchased shares after the firm misreported its internalcontrol effectiveness.
5.4. Sensitivity analysis and overall discussion of the benefits and costs of 404(b) exemption
Taken together, our findings suggest that 404(b) exemption saves the firms in our sample an aggregate $388 million in auditfees from 2007 through 2014. However, costs of 404(b) exemption include an aggregate $719 million in lower operating per-formance and the delay of an aggregate $935 million market value decline in the three years following suspected IC misreportersfailing to disclose ineffective internal controls. These estimates provide insight into the potential tradeoffs of exemption.
It is important to assess how sensitive our estimates are as our inferences necessarily rely on empirical design choices.Thus, in Table 7 we present bounds of our estimates conditional on different choices. In Table 7, Panel A, we consider twoadditional size thresholds to infer “incremental” audit fees of non-exempt firms. Our main analysis in Table 2 conditions onnon-exempt firms with $300 million or less in market capitalization; these results are reproduced in Column 1 of Table 7,Panel A. We present analogous estimates comparing exempt firms to non-exempt firms with market capitalizations of $150($200) million or less in Column 2 (3). The expected benefit of exemption across all three samples ranges from $354 millionto $463 million.
In Table 7, Panel B we consider how our cost estimates vary based on the threshold at which to classify firms as suspectedIC misreporters. In our main analysis we define suspected IC misreporters as firms with DisclosedIneffectivet ¼ 1 in the top20th percentile of PredictedProbability values. As we move the threshold from the 10th to the 30th PredictedProbabilitypercentile in increments of five, Panel B shows that the number of suspected IC misreporters varies from 192 to 1,077observations, or 3.6 to 20.3 percent of exempt firm-years in our sample. Panel B also illustrates how our cost estimateschange based on these alternative thresholds. The estimated costs in Table 7, Panel B provide assurance that the costs ofexemption continue to be notably higher than the audit fee savings associated with exemption, regardless of threshold. It isimportant to note that the 20th percentile threshold classifies 10.6 percent of firms as suspected IC misreporters, which isnearest to the 9.3 percent IC misreporting suggested by our prediction model, providing support for using the 20th per-centile threshold in our primary tests.
Several caveats are in order. First, although the estimated audit fees saved in year t benefit the firm in years t throughtþ3, and thus are comparable to our present-valued lower operating performance cost estimate, these two estimates arenot directly comparable to the decline in market value because inaccurate internal control disclosure merely delays themarket value declines. It is also possible, however, that IC misreporting cultivates conditions that increase the likelihood offuture misstatement (see Table 4, Panel D), as firms that do not discover ineffective internal controls cannot remediate them.To the extent that future misstatements are revealed during our stock return accumulation period, the decline in marketvalue we document captures some incremental loss of firm value as a result of IC misreporting.
Second, as described previously and presented in Appendix A, there are other potential benefits and costs of 404(b) exemption, such as employee time, litigation risk, and financial reporting quality (and its associated impact on cost ofcapital). To the extent these factors influence firms’ operating or stock performance in years tþ1 through tþ3, they areincluded in our cost estimates. However, our cost estimates omit the impact of these factors beyond tþ3.
30 As in our estimated cost of foregone operating improvements, we remove 136 of the 562 SuspectedIneffectivet ¼ 1 observations also classified as asuspected IC misreporter in tþ1 through tþ3 to avoid double-counting firms during the AbRettþ1 through tþ3 time period.

Table 7Bounds of Benefits and Costs EstimatesPanel A: Benefits Bounds Based on Non-Exempt Firms Identified Using Different Size Thresholds
Year
404(a) & (b) Non-exempt firms with Non-exempt firms with Non-exempt firms withcompliance year market capitalization r $300M market capitalization r $150M market capitalization r $200M
(from Table 2, Panel A)
N Mean audit fees N Mean audit fees N Mean audit fees
2003 – 450 $430,200 193 $350,730 284 $361,0362004 1 451 $939,069 172 $866,313 288 $890,2342005 2 632 $781,082 242 $694,641 409 $718,7132006 3 640 $736,527 269 $662,854 409 $667,6382007 4 1,029 $802,143 529 $670,451 754 $731,8182008 5 1,225 $926,090 769 $862,700 938 $866,4732009 6 778 $759,951 362 $632,044 502 $670,5682010 7 627 $656,036 241 $540,578 382 $590,4482011 8 761 $700,294 339 $574,168 499 $624,5382012 9 677 $715,203 274 $581,342 431 $630,1672013 10 518 $663,080 176 $464,357 291 $555,6462014 11 585 $697,999 258 $558,064 366 $610,747
%Δ for non-exempt firms (2003–2014) 62.25% 59.11% 69.17%–%Δ for exempt firms (2003–2014) (Table 2, Panel A) -26.53% -26.53% -26.53%
Incremental %Δ 35.72% 32.58% 42.64%× Mean exempt firms’ 2003 audit fees (Table 2, Panel A) x $204,830 x $204,830 x $204,830
Annual incremental cost of 404(b) compliance $73,165 $66,744 $87,330× Exempt firm-years in our sample (2007–2014) x 5302 x 5302 x 5302
Aggregate incremental cost of 404(b) compliance $387,963,246 $353,875,800 $463,021,148
Panel B: Costs Bounds Based on Alternative Thresholds Used to Classify Suspected IC Misreporters
Top 20th Percentile(from Table 4, Panel C)
Top 10th
PercentileTop 15th
PercentileTop 25th
PercentileTop 30th
Percentile
PredictedProbability cutoff to classifySuspectedIneffective ¼ 1
0.217 0.737 0.469 0.178 0.152
Suspected IC Misreporters using alternativethreshold (N)
562 192 319 818 1,077
Suspected IC Misreporters using alternativethreshold (%)
10.6% 3.6% 6.0% 15.4% 20.3%
Lower operating performance:(β2 – β1) from Table 6, Panel C, Column 1 3.3% 3.3% 3.3% 3.3% 3.3%× Aggregate assetst for SuspectedIneffective¼1 x 68,120M x 27,317M x 54,636M x 79,258M x 88,145M× Reduction in IC misreporting due to 404(b) x 38.1% x 38.1% x 38.1% x 38.1% x 38.1%Estimated cost $856M $343M $687M $997M $1,108MC Present value adjustment C 1.063 C 1.063 C 1.063 C 1.063 C 1.063
Present value of estimated cost $719M $288M $577M $837M $930M
Delayed decline in market values:Diff in AbRettþ1 through tþ3 from Table 6, Panel E 12.42% 12.42% 12.42% 12.42% 12.42%× Aggregate market valuet for SuspectedIneffective¼1 x 19,758M x 8,519M x 14,316M x 24,657M x 29,458M× Reduction in IC misreporting due to 404(b) x 38.1% x 38.1% x 38.1% x 38.1% x 38.1%Estimated cost $935M $403M $677M $1,167M $1,394M
Notes: All dollar values are presented in 2014 real dollars. In Panel A, market capitalization is defined as stock price per share (PRCC_F) multiplied bynumber of common shares outstanding at year end (CSHO). In Panel B, we remove 136 of the 562 SuspectedIneffectivet¼1 observations also classified as asuspected IC misreporter in tþ1 through tþ3 when estimating the two costs of IC misreporting to avoid double-counting a firm during this three-yeartime period. All variables are defined in Appendix C and all continuous variables are winsorized at the 1st and 99th percentiles by fiscal year.
W. Ge et al. / Journal of Accounting and Economics 63 (2017) 358–384 377

W. Ge et al. / Journal of Accounting and Economics 63 (2017) 358–384378
Third, we attribute differences in audit fees from 2003 to 2014 between exempt and non-exempt firms to 404(b) compliance. The use of such a long measurement period makes it difficult to attribute observed changes to a specificregulatory event, such as 404(b) (Leuz and Wysocki, 2016). However, we take comfort in our finding that both firms thatswitch from exempt to non-exempt status and exempt firms that begin to voluntarily comply experience a similar per-centage increase in audit fees in the initial year of their 404(b) audit.
Fourth, we attribute differences in future changes in earnings and stock returns between firms disclosing ineffectiveinternal controls and suspected IC misreporters to IC misreporting. It is possible that suspected IC misreporters are sys-tematically different from firms that disclose ineffective internal controls, and that they experience lower future earningsand declines in market values for reasons other than IC misreporting. As we document that IC misreporting is associatedwith managers’ incentives and ability to discover and disclose ineffective internal controls, as well as ex-post amendmentsof firms’ original 404(a) opinions, it is unclear what these systematic differences would be. Thus, we conclude that ICmisreporting appears to at least partially contribute to these measured benefits and costs of exemption.
Finally, we study the benefits and costs of 404(b) exemption from a shareholder perspective. Determining whetherexemption maximizes social welfare (see Minnis and Shroff, 2017 for a discussion of the economic theory of regulation) isbeyond the scope of our paper. Because the costs of exemption are borne by a small subset of investors (an estimated9.3 percent of exempt firms), whereas the benefits of exemption are realized by investors of all exempt firms, it is difficult tomake normative statements about the overall net cost or benefit of 404(b) exemption even from a shareholder perspective.
6. Conclusion
We use non-accelerated filers’ permanent exemption from Section 404(b) as a setting to examine benefits and costs of reg-ulation from a shareholder perspective. We estimate that exempt firms in our sample save an aggregate $388 million in audit feesfrom 2007 through 2014. To assess the costs of Section 404(b) exemption, we develop a model of internal control effectivenessusing the smallest firms subject to 404(b), and apply the model coefficients to exempt firms. We estimate that 20.2 percent ofexempt firms should disclose ineffective internal controls, but only 10.9 percent do so. Thus, we infer that 9.3 percent of exemptfirms maintain ineffective internal controls but erroneously disclose effective internal controls. We assert that IC misreportingwould fall from 9.3 to 5.8 percent if these exempt firms were subject to 404(b). We estimate the costs of 404(b) exemption forsuspected IC misreporters as $719 million in lower operating performance due to non-remediation and $935 million delay inaggregate market value decline due to the failure to disclose ineffective internal controls.
It is somewhat puzzling that the managers of IC misreporters would incur such high net costs, especially given thatinsider ownership exceeds 20 percent in these firms (untabulated). It is likely that managers are not fully aware of theramifications of ineffective internal controls on their firm's operations. For example, in a survey of corporate insiders byAlexander et al. (2013), only 29.1 percent felt that Section 404 might have a positive effect on the efficiency of theircompany's operation, whereas approximately as many felt it hurt their company's operation. We leave an assessment ofwhether managers appear to exhibit evidence of learning over time regarding the benefits of 404 to future work.
Our study contributes to the ongoing debate regarding benefits and costs of exempting firms from Section 404(b). Al-though many investor advocacy groups disapproved of this exemption (CFA, 2011), Congress has expanded the exemption toadditional firms (U.S. Congress, 2012) and continues to consider legislation that would further expand the exemption (U.S.Congress, 2011, 2016a, 2016b). For example, as of December 2016, Congress is considering a proposed bill exempting firmswith a market value of less than $250 million from 404(b) compliance (U.S. Congress, 2016b). Our study contributes to thisdebate by generating estimates of benefits and costs of the 404(b) exemption. We also contribute to the literature byproviding auditors, analysts, and investors with a prediction model that can identify the subgroup of firms most likely tohave failed to discover or disclose ineffective internal controls.
Acknowledgements
We appreciate comments and suggestions received from Michelle Hanlon (the editor), Suraj Srinivasan (the reviewer), Ka-tharine Adame, Bill Baber, Joe Carcello, Asher Curtis, Dawn Matsumoto, Linda Myers (FARS Mid-Year Meeting discussant), Zoe-Vonna Palmrose, Katherine Schipper (PCAOB/JAR Conference discussant), Jaime Schmidt, Marcy Shepardson, Nemit Shroff, HollisSkaife, Quinn Swanquist, Brandon Szerwo, Kristen Valentine, and participants at Boston College, the FARS Mid-Year Meeting,Georgetown University, Georgia State University, Indiana University's auditing reading group, the PCAOB/JAR Conference onAuditing and Capital Markets, the Conference on the Convergence of Financial and Managerial Accounting (Temple University),the University of Tennessee, the University of Texas–Austin, and the Washington Area Research Symposium. We thank SarahRice, Dave Weber, and Biyu Wu for sharing their data on firms that disclose effective controls and subsequently restate theirfinancial statements due to an error stemming from ineffective internal controls. Ge and McVay would like to thank the MossAdams Professorship and Deloitte and Touche Professorship, respectively, at the University of Washington for financial support.Koester would like to thank Georgetown University's Center for Financial Markets and Policy for financial support.

W. Ge et al. / Journal of Accounting and Economics 63 (2017) 358–384 379
Appendix A
Possible Benefits and Costs of 404(b) Exemption
Possible benefits of 404(b) exemption
Who reaps the benefits?
Can the dollaramount be sepa-rately measured?If measurable, what are the underlying assumptions? If notmeasurable, why?
(1) Audit fee savings
Current shareholders Yes We attribute the incremental audit fee percentage increase betweennon-exempt and exempt firms to 404(b) compliance. To address thepotential concern that the incremental increase in audit fees is dueto systematic differences between exempt and non-exempt firms,we consider two alternative benchmarks that use a firm as its owncontrol: firms that switch from exempt to non-exempt status andfirms that voluntarily comply with 404(b).(2) Preserving managementand employee time thatwould otherwise be spentwith auditors during the404(b) engagement
Current shareholders
No While it is likely that additional employee time is preserved ifless comprehensive internal control testing is conducted whenfirms comply with 404(a) but not 404(b), it is difficult to sepa-rately estimate this benefit. Note however, that this benefitshould be captured within operating performance and stockreturns.(3) Lower litigation risk to theextent that auditor-pro-vided internal control dis-closures are used by plain-tiffs as evidence of mis-behavior (Coates and Sri-nivasan, 2014)
Current shareholders
No It is difficult to disentangle the litigation effects associated withineffective internal controls, as these will often coincide with otherevents such as restatements and large stock price drops. Moreover,it is not clear whether complying with 404(b) would necessarilyreduce litigation risk. It is also possible that 404(b) exemption leadsto a higher litigation risk because a firm's ineffective internal con-trols are less likely to be remediated, and therefore more likely tolead to litigation-triggering events such as restatements. To theextent it occurs in the next three years, litigation is captured withinoperating performance and stock returns.Possible costs of 404(b) exemption
Who bears the costs?
Can the dollaramount be sepa-rately measured?If measurable, what are the underlying assumptions? If notmeasurable, why?
(1) Lower operating perfor-mance due to non-remediation
Current shareholders
Yes We measure operating performance costs using three-yearchanges in future earnings. We show that, for firms disclosingand remediating ineffective internal controls, the improvementin three-year-ahead earnings is driven by remediation. Thisimprovement is already net of management and employee timespent implementing 404(b) as well as remediation costs (e.g.,system implementation fees). Thus, such foregone earningsimprovements are a cost for misreporters. This measure in-cludes the impact of IC misreporting on costs such as legal fees,employee time, and cost of capital and thus the ability to investduring the three years following IC misreporting.(2) Market values that fail toreflect a firm's underlyinginternal control status
Largely borne by new investorsrelying on inaccurate internalcontrols disclosures
Yes
We quantify the delayed market value decline using the differ-ence in abnormal stock returns from tþ1 through tþ3 betweensuspected IC misreporters and firms reporting ineffective con-trols, under the assumption that this difference is driven byinaccurate disclosure of internal control effectiveness by ICmisreporters.(3) Lower earnings quality
Current and prospectiveshareholdersNo
Prior research has documented that auditors are largely able to“audit around” ineffective internal controls, mitigating effects ofinternal controls on earnings quality (e.g., Doyle et al., 2007a).Because it is difficult to disentangle the effects of internal controlsfrom auditors’ substantive testing on earnings quality, we do notconsider financial reporting quality as a measurable cost of 404(b) exemption, although we provide indirect evidence with futurerestatements.(4) Actions to avoid com-pliance threshold
Current shareholders
Partially Gao et al. (2009) provide evidence of managers undertaking actionsif their firm approaches the $75 million public float exemptionthreshold (e.g., making cash payouts to shareholders, making badnews disclosures, and reporting lower earnings). We do not con-sider these costs directly because they apply only to firms ap-proaching the $75 million public float exemption threshold. Note,however, that these costs should be at least partially capturedwithin operating performance and stock returns (i.e., inefficientactions would lower these values, whereas avoiding unnecessaryregulation would increase these values).
W. Ge et al. / Journal of Accounting and Economics 63 (2017) 358–384380
Appendix B
Descriptive Analysis of Ineffective Internal Controls by Type
Table B1 reports frequencies for the four most common general and account-specific weaknesses disclosed by exemptfirms from 2007 through 2014; summed values exceed 100 percent because an individual firm can disclose multipleweaknesses. We report analogous frequencies for these same eight weaknesses for the smallest accelerated filers and allother accelerated filers during the AS2 regime.
The descriptive evidence presented in this panel indicates five points worth noting. First, exempt firms are more likely todisclose accounting personnel issues (67.4 percent) than the smallest accelerated filers and all other accelerated filers (55.8and 52.2 percent, respectively). Second, exempt firms are also more likely to disclose weaknesses related to segregation ofduties (34.5 percent) relative to the smallest and all other accelerated filers (21.5 and 15.9 percent, respectively). Im-plementing controls to address such issues requires hiring additional and expensive accounting personnel. Thus, the evi-dence is consistent with smaller firms having limited resources to allocate to internal controls (Ge and McVay, 2005;Ashbaugh-Skaife et al., 2007; Doyle et al., 2007b). Third, exempt firms are less likely to have material/numerous auditor oryear-end adjustments (48.9 percent) relative to the smallest and all other accelerated filers (70.9 and 67.1 percent, re-spectively). This difference might be due to less effective auditor oversight of exempt firms. Fourth, exempt firms are lesslikely to disclose information that identifies the underlying causes of their internal control weaknesses (41.1 percent) thanare the smallest and all other accelerated filers (7.2 and 3.1 percent, respectively). Because Section 404(a) requires firms todiscuss the nature and types of weaknesses identified, this finding is consistent with lower disclosure quality among smallerfirms. Finally, exempt firms disclose fewer material weaknesses related to revenue recognition and cost of sales (15.3 to 17.3percent) than are the smallest and all other accelerated filers (22.4 to 31.5 percent). This pattern is consistent with smallerfirms being less affected by internal control weaknesses associated with complex transactions.
Table B1Most Frequent Types of Disclosed Material Weaknesses in Internal Control.
Exempt Firms Non-Exempt All OtherFirms Accelerated Filers
(Non-Accelerated Filerso $75 M public float)
(Accelerated Filersr $300 M MVE)
(Accelerated Filers4 $300 M MVE)
(2007–2014, N¼577) (2004–2006, N¼251) (2004–2006, N¼584)
General issuesAccounting personnel (resources, competency, training) 67.42% 55.78% 52.23%Material/numerous auditor or year-end adjustments 48.87% 70.92% 67.12%Insufficient information to identify cause of weakness 41.07% 7.17% 3.08%Personnel: segregation of duties and design of controls 34.49% 21.51% 15.92%
Account-specific issuesAccounts/loans receivable, investments, and cash 18.72% 29.48% 22.43%Inventory, vendor, and/or cost of sales 17.33% 28.29% 22.43%Revenue recognition 15.25% 31.47% 30.65%Tax expense/benefit/deferral 12.65% 31.47% 37.50%
Notes: This appendix presents frequency information for the top four general and account-specific issues cited in exempt firms’ 404(a) opinions thatdisclose ineffective internal controls (DisclosedIneffectivet¼1) from 2007 through 2014. For comparison purposes, frequencies for these issues are alsopresented for the non-exempt firms and all other accelerated filers from the AS2 regime (2004 through 2006). Issue classifications are determined by theAudit Analytics variables ‘NOTEFF_ACC_REASON_KEYS’ and ‘NOTEFF_OTHER_REAS_KEYS.’

W. Ge et al. / Journal of Accounting and Economics 63 (2017) 358–384 381
Appendix C
Subsample Descriptions and Variable Definitions
Subsample descriptions
Subsample
DefinitionExempt Firms
Firms not required to comply with 404(b). Defined as non-accelerated filers (firms with a public float of less than $75 million)that provide a 404(a) opinion with at least $5 million in assets and market capitalization that are exchange-traded and do notvoluntarily comply with 404(b).Non-Exempt Firms
Firms required to comply with Section 404(b) with a market capitalization of $300 million or less. All Other AcceleratedFilersFirms required to comply with Section 404(b) with a market capitalization of more than $300 million.
Internal control effectiveness determinants variables
Variable Definition
Aget
Firm age. Defined as the natural log of the number of years a firm has been listed on Compustat as of year t. AggLosst-1,t Aggregate loss variable. Defined as ¼1 if a firm incurs an aggregate loss across years t�1 and t ((IBtþ IBt-1)o0), and ¼0 if((IBtþ IBt-1)40).
BankIndt Banking and financial services industry indicator. Defined as ¼1 if a firm is considered to be in industry 45 per the Fama andFrench (1997) 48-industry classification (SIC codes 6000, 6010–6036, 6040–6062, 6080–6082, 6090–6100, 6100–6113, 6120–6179, and 6190–6199) in year t, and ¼0 otherwise.
Casht-1
Cash and cash equivalents as a percentage of total assets (CHECAT) in year t�1. ComputerIndt Computer software industry indicator. Defined as ¼1 if a firm is considered to be in industry 36 per the Fama and French(1997) 48-industry classification (SIC codes 7370–7373 and 7375) in year t, and ¼0 otherwise.
DisclosedIneffectivet Disclosure of ineffective internal controls indicator. Defined as ¼1 if internal controls over financial reporting are disclosed asineffective (IC_IS_EFFECTIVE ¼ ‘N’) and ¼0 if internal controls over financial reporting are deemed effective(IC_IS_EFFECTIVE¼ ‘Y’). We require the internal controls opinion to be provided by a firm's external auditor for acceleratedfilers (IC_OP_TYPE¼ ‘a’) and by a firm's management for non-accelerated filers (IC_OP_TYPE¼ ‘m’). Source: Audit Analytics’Section 404 Internal Controls database.
ExtrInvGrowtht-2,t
Extreme inventory growth indicator. Defined as ¼1 if the percentage change in inventory from t�2 to t ((INVTt–INVTt-2)CINVTt-2) is in the top quintile in year t, and ¼0 otherwise.ExtrSalesGrowtht-2, t
Extreme sales growth indicator. Defined as ¼1 if the percentage change in sales from t�2 to t ((SALEt–SALEt-2)CSALEt-2) is inthe top quintile in year t, and ¼0 otherwise.Foreignt-1,t
Foreign operations indicator. Defined as ¼1 if pre-tax foreign income (PIFO) is non-zero and non-missing in years t�1 or t,and ¼0 otherwise.Governancet-1
Governance measure. Decile rank of Accounting and Governance Risk (AGR) values as measured in the fourth quarter in yeart�1. Source: GMI Ratings (www.msci.com)InstOwnt-1
Institutional investor ownership. Defined as the mean percentage of outstanding shares held by institutional investors(SHARES summed by CUSIP RDATE and divided by SHROUT1�1000) as of the most recent calendar quarter preceding the endof year t�1. Missing values are set ¼0. Source: Thomson Reuters Institutional (13 f) Holdings s34 Master File database.LitigiousIndt
Litigious industry indicator. Defined as ¼1 if a firm's SIC code is 2833–2836, 3570–3577, 3600–3674, 5200–5961, or 7370 inyear t, and ¼0 otherwise.MaintainedIneffectivet
Maintenance of ineffective internal controls indicator. Defined as ¼1 if a firm (1) discloses ineffective internal controls overfinancial reporting (DisclosedIneffectivet ¼1), (2) discloses effective internal controls in its Form 10-K and subsequently re-states its financial statements due to ineffective internal control issues from Rice et al. (2015), or (3) files an amended 404(b) opinion disclosing ineffective internal controls; and ¼0 otherwise. Source: (1) and (3) from Audit Analytics’ Section 404Internal Controls database and (2) from data provided by Sarah Rice, Dave Weber, and Biyu Wu.M&At-1,t
Mergers/acquisitions indicator. Defined as ¼1 if acquisitions (AQC), acquisitions’ income contribution (AQI), or acquisitions’sales contribution (AQS) is non-missing and non-zero in years t–1 or t, and ¼0 otherwise.Prior404302t
Prior internal controls effectiveness indicator. Defined as ¼1 if a firm's 404(a) opinion in year t–1 or 302 reports in the firstthree quarters of year t�1 indicate ineffective internal controls, and ¼0 if the reports indicate effective internal controls.Restatet-2,t-1
Restatements indicator. Defined as ¼1 if a firm restates its year t–2 or t–1 financial statements, and ¼0 otherwise. Source:Audit Analytics’ Non-Reliance Restatements database.Restructuret-1,t
Material restructuring indicator. Defined as ¼1 if the sum of pre-tax restructuring costs (RCP) as a percentage of total assets(AT) years t�1 and t is greater than 2 percent, and ¼0 otherwise.Segt
Number of business and geographical segments a firm discloses in its Form 10-K. Defined as a count of unique SID by firm-yearin year t. If segment disclosures are missing, then Seg ¼1. Source: Compustat Segments database.Sizet-1
Natural log of market capitalization (PRCC_F�CSHO) in year t–1.
W. Ge et al. / Journal of Accounting and Economics 63 (2017) 358–384382
Variables used to identify internal control disclosure accuracy (exempt firms only)
Variable
DefinitionCrediblyEffectivet
Credible disclosure of effective internal controls indicator. Defined as ¼1 if DisclosedIneffectivet ¼0 andPredictedProbabilityto0.217 (e.g., in the PredictedProbabilityt bottom four quintiles), and¼0 otherwise.PredictedProbabilityt
Expected likelihood a firm maintains ineffective internal controls in year t. Defined as equal to e(PredictedValue) C (1 þe(PredictedValue)). Values are bound between 0 and 1, with larger values indicating a greater likelihood.PredictedValuet
Ineffective internal control prediction score estimated from Eq. (2) SuspectedIneffectivet Suspected internal control misreporting of effective internal controls indicator. Defined as ¼1 if DisclosedIneffectivet¼0 andPredictedProbabilitytZ0.217 (e.g., in the PredictedProbabilityt top quintile), and ¼0 otherwise.
SwitchToAFtþ1 Switch to non-exempt status indicator. Defined as ¼1 if an observation is subject to 404(b) in year tþ1 and was exempt from404(b) in year t, and ¼0 otherwise.
Identification, disclosure, incentives, and ex-post realizations variables (exempt firms only)
Variable
DefinitionAbRettþ i through tþk
Buy-and-hold size-decile-adjusted return in years tþ i through tþk. Amend404(a)t Section 404(a) amendment to reflect ineffective internal controls indicator. Defined as ¼1 for firm-years where management disclosedeffective internal controls in Form 10-K but ineffective internal controls in Form 10-K/A relating to year t, and ¼0 otherwise. Source: AuditAnalytics’ Section 404 Internal Controls database and hand-collected restatements data from Rice andWeber (2012) and Rice et al. (2015).
Big4t
“Big 4” auditor indicator. Defined as ¼1 if ‘AU’ is equal to 4, 5, 6, or 7 (e.g., Ernst & Young, Deloitte, KPMG, and PwC, respectively),and ¼0 otherwise.DebtEquityIssuancet
External debt or equity financing indicator variable. Defined as ¼1 if the sum of the firm's issuance of long-term debt (DLTIS)and common or preferred stock (SSTK) is at least one percent of total assets (AT) in year t, and ¼0 otherwise. Missing values ofDLTIS and SSTK are reset to zero.DelistPerformance
Stock delisting due to poor firm performance indicator variable. Defined as ¼1 if a firm delists its stock due to poor firmperformance (500 r DLSTCD o 600) by December 31, 2015, and ¼0 otherwise. Source: CRSP.HighMAt-1,t
High managerial ability indicator. Defined as ¼1 if a firm's managerial ability score from Demerjian et al. (2012) is in the top decile ofindustry-year ranked scores in years t and t–1, and ¼0 otherwise. Source: http://faculty.washington.edu/smcvay/abilitydata.htmlLosst
Loss indicator variable. Defined as ¼1 if income before extraordinary items (IBt) o 0, and ¼0 if income before extraordinaryitems is greater than or equal to zero.NoRemediatetþ1
Failure to remediate internal control weakness(es) indicator. Defined as ¼1 if DisclosedIneffectivet¼1 andDisclosedIneffectivetþ1¼1, and ¼0 otherwise.Remediatetþ1
Remediation of internal control weakness(es) indicator. Defined as ¼1 if DisclosedIneffectivet¼1 and DisclosedIneffectivetþ1¼0,and ¼0 otherwise.Restatet
Restatements indicator. Defined as ¼1 if a firm restates its annual financial statements(RES_BEGIN_DATEo¼DATADATEo¼RES_END_DATE) originally filed in year t, and ¼0 otherwise. Source: Audit Analytics’Non-Reliance Restatements database.ROAtþ i
Return on assets (ROA) in year tþ i. ROA is defined as net income before extraordinary items (IBt) C average total assets ((ATtþATt-1)C2).SalesGrowtht-2 to t
Sales growth. Percentage change in sales from t�2 to t ((SALEt–SALEt-2) C SALEt-2). Sizet Natural log of market capitalization (PRCC_F � CSHO) in year t. Zscoret Altman Z-score calculated as 1.20� ((ACT–LCT)/AT)þ1.40� (RE/AT)þ3.30� ((NIþXINTþTXT)/AT)þ0.60� ((CSHO�PRCC_F)/LT)þ0.999� (SALE/AT).
ΔAudt Auditor change variable. Defined as ¼1 if Audit Analytics’ ‘AUDITOR_CHANGED’¼1 (a variable that indicates the departed auditorresigned or was dismissed from the audit engagement) and the auditor resignation date (DISMISS_DATE) occurs from the beginning ofyear t through the financial statement filing date of year t, and ¼0 otherwise. Source: Audit Analytics’ Auditor Changes database.
ΔROAt,tþ3
Change in ROA from t to tþ3 (ROAtþ3–ROAt). ROA is defined as net income before extraordinary items (IBt)Caverage total assets((ATtþATt-1)C2).Notes: All variables are from Compustat unless otherwise specified.
Appendix D
Predictions related to managers’ ability to discover and incentives to disclose weaknesses
We examine how internal control effectiveness disclosure accuracy varies cross-sectionally with managers’ ability to discoverand incentives to disclose weaknesses. Drawing on the literature, we posit several measures, which we discuss below.
Ashbaugh-Skaife et al. (2007) provide a conceptual model of the existence, discovery, and disclosure of internal controldeficiencies (their Fig. 1). We expect that managers with higher ability are better able to discover internal control issuesabsent the additional auditor oversight of 404(b), relative to their lower ability peers. We operationalize ability using amodification of the managerial ability measure constructed in Demerjian et al. (2012). By construction, managerial ability isorthogonal to firm performance. Prior research finds that this measure is associated with higher quality financial reporting

W. Ge et al. / Journal of Accounting and Economics 63 (2017) 358–384 383
(Demerjian et al., 2013) and more ex-post accurate internal control disclosures (Chen et al., 2015). Following Chen et al.(2015), HighMAt-1,t is an indicator variable set equal to one when a manager's ability score is in the top decile by Fama andFrench (1997) industry in years t–1 and t, and zero otherwise.
We also consider whether the firm is audited by a Big 4 auditor (Big4t) and whether the firm experienced an auditorchange (ΔAudt) in year t. Both of these variables have been shown to be associated with internal control weaknesses butrelate more to discovery and disclosure than to the underlying existence of an issue (e.g., Ashbaugh-Skaife et al., 2007). Weexpect that suspected IC misreporters are less likely to have a Big 4 auditor than firms that disclose ineffective internalcontrols. In addition, to the extent that new auditors more carefully scrutinize a client's internal control disclosures, weexpect suspected IC misreporters to be less likely to experience an auditor change in year t relative to firms that discloseineffective internal controls.
Finally, we consider two incentive variables for IC misreporting. The first is a capital market-based incentive: new debtand equity issuances of at least 1 percent of assets in year t (DebtEquityIssuancet¼1). Costello and Wittenberg-Moerman(2011) document that lenders increase interest rates and change debt contract design when a firm discloses ineffectiveinternal controls, and Hammersley et al. (2008) document negative equity market consequences of disclosing ineffectiveinternal controls. To the extent that managers perceive disclosing ineffective internal controls to have negative capitalmarket consequences, we expect firms that maintain ineffective internal controls and issue new capital to have greaterincentives to misreport. Our second incentive variable is the Altman Z-score, which measures the likelihood of bankruptcy.We expect that firms with a higher likelihood of bankruptcy are more likely to misreport because they have fewer resourcesfor improving internal controls. Even if they recognize the importance of internal controls for the firm, they lack resourcesand have incentives to avoid disclosures of ineffective internal controls, that might further increase the likelihood ofbankruptcy (e.g., by raising concerns by debtholders).
References
Alexander, C., Bauguess, S., Bernile, G., Lee, Y.H., Marietta-Westberg, J., 2013. Economic effects of SOX Section 404 compliance: a corporate insider per-spective. J. Account. Econ. 56, 267–290.
Ashbaugh-Skaife, H., Collins, D., Kinney, W., 2007. The discovery and reporting of internal control deficiencies prior to SOX-mandated audits. J. Account.Econ. 44, 166–192.
Ashbaugh-Skaife, H., Collins, D., Kinney, W., LaFond, R., 2009. The effect of SOX internal control deficiencies on firm risk and cost of equity. J. Account. Res.47 (1), 1–43.
Bedard, J., Graham, L., 2011. Factors associated with severity classification of Sarbanes-Oxley Section 404 internal control deficiencies. Account. Rev. 86 (3),825–855.
Bedard, J., Hoitash, R., Hoitash, U., 2009. Evidence from the United States on the effect of auditor involvement in assessing internal control over financialreporting. Int. J. Audit. 13, 105–125.
Brown, L., Call, A., Clement, M., Sharp, N., 2015. Inside the “black box” of sell-side financial analysts. J. Account. Res. 53 (1), 1–47.Brown, L., Call, A., Clement, M., Sharp, N., 2016. The activities of buy-side analysts and the determinants of their stock recommendations. Working paper,
Temple University, Arizona State University, University of Texas at Austin, and Texas A&M University.Chartered Financial Analyst Institute (CFA), 2011. Letter to the House Financial Services Committee. ⟨http://www.aicpa.org/Advocacy/Issues/Down
loadableDocuments/404b/CAQ-CII-CFA_404_letter_92011.pdf⟩ (last accessed 18.02.14).Chen, S., Lai, S., Liu, C., McVay, S., 2015. Managerial characteristics and internal controls. Working paper, National Taiwan University, Kainan University,
Xiamen University, and University of Washington.Cheng, M., Dhaliwal, D., Zhang, Y., 2013. Does investment efficiency improve after the disclosure of material weaknesses in internal control over financial
reporting? J. Account. Econ. 56 (1), 1–18.Coates IV, J.C., 2007. The goals and promise of the Sarbanes-Oxley Act. J. Econ. Perspect. 21, 91–116.Coates IV, J.C., Srinivasan, S., 2014. SOX after ten years: a multidisciplinary review. Account. Horiz. 28 (3), 627–671.Costello, A., Wittenberg-Moerman, R., 2011. The impact of financial reporting quality on debt contracting: evidence from internal control weakness reports.
J. Account. Res. 49, 97–136.Dechow, P., Ge, W., Larson, C., Sloan, R., 2011. Predicting material accounting misstatements. Contemp. Account. Res. 28 (1), 17–82.DeFond, M., Lennox, C., 2017. Do PCAOB inspections improve the quality of internal control audits? J. Account. Res. (forthcoming).Demerjian, P., Lev, B., Lewis, M., McVay, S., 2013. Managerial ability and earnings quality. Account. Rev. 88, 463–498.Demerjian, P., Lev, B., McVay, S., 2012. Quantifying managerial ability: a new measure and validity tests. Manag. Sci. 58 (7), 1229–1248.Doyle, J., Ge, W., McVay, S., 2007a. Accruals quality and internal control over financial reporting. Account. Rev. 82, 1141–1170.Doyle, J., Ge, W., McVay, S., 2007b. Determinants of weaknesses in internal control over financial reporting. J. Account. Econ. 44, 193–223.Erickson, M., Hanlon, M., Maydew, E., 2004. How much will firms pay for earnings that do not exist? Evidence of taxes paid on allegedly fraudulent
earnings. Account. Rev. 79 (2), 387–408.Fama, E., French, K., 1997. Industry cost of equity. J. Financ. Econ. 43 (2), 153–193.Feng, M., Li, C., McVay, S., 2009. Internal control and management guidance. J. Account. Econ. 48 (2–3), 190–209.Feng, M., Li, C., McVay, S., Skaife, H., 2015. Does ineffective internal control over financial reporting affect a firm's operations? Evidence from firms'
inventory management. Account. Rev. 90, 529–557.Filzen, J., Peterson, K., 2015. Financial statement complexity and meeting analysts' expectations. Contemp. Account. Res. 32 (4), 1560–1594.Gao, F., Wu, J., Zimmerman, J., 2009. Unintended consequences of granting small firms exemptions from securities regulation: evidence from the Sarbanes-
Oxley Act. J. Account. Res. 47 (2), 459–506.Ge, W., McVay, S., 2005. The disclosure of material weaknesses in internal control after the Sarbanes-Oxley Act. Account. Horiz. 19 (3), 137–158.Graham, J., Harvey, C., 2010. The equity risk premium in 2010 (Working paper). Duke University (Working paper) ⟨(https://ssrn.com/abstract¼1654026)⟩.Hammersley, J., Myers, L., Shakespeare, C., 2008. Market reaction to the disclosure of internal control weaknesses and to the characteristics of those
weaknesses under Section 302 of the Sarbanes Oxley Act of 2002. Rev. Account. Stud. 13 (1), 141–165.Hochberg, Y., Sapienza, P., Vissing-Jorgensen, A., 2009. A lobbying approach to evaluating the Sarbanes-Oxley Act of 2002. J. Account. Res. 47 (2), 519–583.Holder, A., Karim, K.E., Robin, A., 2013. Was Dodd-Frank justified in exempting small firms from Section 404b compliance? Account. Horiz. 27, 1–22.Hosmer, D., Lemeshow, S., 2000. In: Applied Logistic Regression2nd ed. John Wiley & Sons.Iliev, P., 2010. The effect of SOX Section 404: costs, earnings quality, and stock prices. J. Financ. 65 (3), 1163–1196.

W. Ge et al. / Journal of Accounting and Economics 63 (2017) 358–384384
Jiang, J., Petroni, K., Wang, I., 2016. Private intermediary innovation and market liquidity: evidence from the Pink Sheets market. Contemp. Account. Res. 33(3), 920–948.
Kinney, W., Martin, R., Shepardson, M., 2013. Reflections on a decade of SOX 404(b) audit production and alternatives. Account. Horiz. 27 (4), 799–813.Kinney, W., Shepardson, M., 2011. Do control effectiveness disclosures require SOX 404(b) internal control audits? A natural experiment with small U.S.
public companies. J. Account. Res. 49 (2), 413–448.Krishnan, J., Krishnan, J., Song, H., 2011. The effect of Auditing Standard No. 5 on audit fees. Audit.: A J. Pract. Theory 30 (4), 1–27.Krishnan, G., Yu, W., 2012. Do small firms benefit from auditor attestation of internal control effectiveness? Audit.: A J. Pract. Theory 34, 115–137.Lawless, J.F., Singhal, K., 1978. Efficient screening of non-normal regression models. Biometrics 34 (2), 318–327.Leuz, C., Triantis, A., Wang, T., 2008. Why do firms go dark? Causes and economic consequences of voluntary SEC deregistrations. J. Account. Econ. 45,
181–208.Leuz, C., Wysocki, P., 2016. The economics of disclosure and financial reporting regulation: evidence and suggestions for future research. J. Account. Res. 54
(2), 525–622.Lu, H., Richardson, G., Salterio, S., 2011. Direct and indirect effects on internal control weaknesses on accrual quality: evidence from a unique Canadian
regulatory setting. Contemp. Account. Res. 28 (2), 675–707.Minnis, M., Shroff, N., 2017. Why regulate private firm financial reporting? Account. Bus. Res. (forthcoming).Palmrose, Z.V., 2010. Balancing the costs and benefits of auditing and financial reporting regulation post-SOX, Part I: perspectives from the nexus at the SEC.
Account. Horiz. 24 (2), 313–326.Public Company Accounting Oversight Board. (PCAOB), 2007. Report on the PCAOB’s 2004, 2005, and 2006 inspection of domestic triennially inspected
firms. October 22. Washington D.C.Public Company Accounting Oversight Board. (PCAOB), 2009. PCAOB Release No. 2009-006. Report on the first-year implementation of Auditing Standard
No. 5, An audit of internal control over financial reporting that is integrated with an audit of financial statements. September 29. Washington D.C.Public Company Accounting Oversight Board. (PCAOB), 2013. Staff Practice Alert No. 11. Considerations for audits of internal control over financial reporting.
October 24. Washington D.C.Public Company Accounting Oversight Board. (PCAOB), 2014. Effective audits of internal control in the current “perfect storm.” Orlando, FL (March 26).
⟨http://pcaobus.org/News/Speech/Pages/03262014_IIA.aspx⟩ (last accessed 04.05.16).Public Company Accounting Oversight Board. (PCAOB), 2015. Current issues, trends, and open questions in audits of internal control over financial re-
porting. Chicago, IL (August 8). ⟨http://pcaobus.org/News/Speech/Pages/08102015_Franzel.aspx⟩ (last accessed 04.05.16).Rice, S., Weber, D., 2012. How effective is internal control reporting under SOX 404? Determinants of the (non-)disclosure of existing material weaknesses.
J. Account. Res. 50 (3), 811–843.Rice, S., Weber, D., Wu, B., 2015. Does SOX 404 have teeth? Consequences of the failure to report existing internal control weaknesses. Account. Rev. 90 (3),
1169–1200.Schroeder, J., Shepardson, M., 2016. Do SOX 404 control audits and management assessments improve overall internal control system quality? Account.
Rev. 91 (5), 1513–1541.Shroff, N., 2017. Corporate investment and changes in GAAP. Rev. Account. Stud. (forthcoming).Securities and Exchange Commission (SEC), 2002. Certification of disclosure in companies' quarterly and annual reports. Release Nos. 33-8124, 34-46427.
SEC, Washington, DC (August 29).Securities and Exchange Commission (SEC), 2011. Study and recommendation of Section 404(b) of the Sarbanes-Oxley Act of 2002 for issuers with public
float between $75 and $250 million. SEC, Washington, DC (April).U.S. Congress, 2002. The Sarbanes-Oxley Act of 2002. Public Law No. 107-204. Washington, D.C.: Government Printing Office. July 30, 2002.U.S. Congress, 2010. The Dodd-Frank Wall Street Reform and Consumer Protection Act. Washington, D.C.: Government Printing Office. July 21, 2010.U.S. Congress, 2011. Small Company Job Growth and Regulatory Relief Act. Washington, D.C.: H.R. 3213.U.S. Congress, 2012. The Jumpstart of Business Startups Act. Washington, D.C.: Government Printing Office. April 5, 2012.U.S. Congress. 2016a. The Fostering Innovation Act. Washington, D.C.: H.R. 4139.U.S. Congress. 2016b. The Financial CHOICE Act. Washington, D.C.Zhao, Y., Bedard, J., Hoitash, R., 2015. When does SOX 404 benefit financial reporting quality? Working paper.