Embed Size (px)
Citation preview

Accounting and Management
Journal of
Vol. 6 No. 1 pages: 1 - 114
UDC 336.717 / 657.3 / 657.6 / 658.8 ISSN 2459-5888
June2016Croatian Accountant


Journal ofAccounting and Management
Volume 6, No. 1, 2016Pages: 1 - 114
Zagreb, June 2016

Journal of Accounting and Management
FounderCroatian Accountant – Independent Association of Accountants,
Tax Advisors and Finance Professionals
Published by Croatian Accountant © Copyright 2016
UDC 336.717 / 657.3 / 657.6 / 658.8ISSN 2459-5888
Editor-in-ChiefĐurđica Jurić, PhD (CRO)
Editorial BoardTamara Cirkveni, PhD, Senior Lecturer (CRO)
Tatjana Dolinšek, MsC (SLO)Martina Herceg Rendeli, MA (CRO)
Ljerka Markota, PhD, College Professor (CRO)Urszula Michalik, PhD (POL)
Miroslawa Michalska-Suchanek, PhD (POL)Dolores Pušar Banović, PhD, Senior Lecturer (CRO)
Address of the Editorial OfficeHrvatski računovodja, HR – 10000 Zagreb, Vlaška 68
Phone: + 385 1 4699 700, Fax: + 385 1 4699 703e-mail: [email protected]
www.hrvatski-racunovodja.hr
Journal of Accounting and Management is published in two issues a year.
Journal of Accounting and Management is a free periodical of the Croatian Accountant – Independent Association of Accountants, Tax Advisors and Finance
Professionals.
Journal of Accounting and Management is indexed in HRČAK ( Portal of scientific and technical journals of the Republic of Croatia) .
All rights reserved. Authors are responsible for the linguistic and technical accuracy of their contributions.
Electronic version only.

FOREWORDDear readers,
we present the new, sixth volume of the Journal of Accounting and Management. We are proud to have created the place which gives us the opportunity to develop our profession and to comprise the latest cognitions in the fields of accounting and management. Year after year, we have been trying to provide a wide variety of quality topics, which will be continued in the future in order to provide the necessary knowledge and information.
The sensitive fields of accounting, taxes and management require a constant monitoring of their changes and new research works. Accordingly, we hope that this Journal will largely contribute to the accountancy profession and initiate further professional engagement. The inter-dependence between the accounting and the management presented in scientific and professional papers proves its importance in the today’s business world.
The Journal is on a completely open-access basis and is available for use to scholars, professionals and students.
We thank all the authors, co-authors and reviewers for their effort and willingness to share their knowledge and especially the readers and users of our Journal and we invite and welcome new submissions of articles
Editor-in-ChiefĐurđica Jurić, PhD, College Professor


V
CONTENTS
Dr. Tesfatsion Sahlu DestaScientific ReviewFINANCIAL PERFORMANCE OF “THE BEST AFRICAN BANKS”: A COMPARATIVE ANALYSIS THROUGH CAMEL RATING 1 - 20
Saša Muminović, PhDOriginal Scientific PaperEFFECT OF DEBT REDUCTION ON PROFITABILITY I N CASE OF SLOVENIAN DAIRY PROCESSING MARKET LEADER 21 - 32
Dubravka Paris, MAProfessional PaperHISTORY OF ACCOUNTING AND ACCOUNTANCY PROFESSION IN GREAT BRITAIN 33 - 44
Urszula Michalik, PhD; Mirosława Michalska-Suchanek, PhDProfessional PaperTHE PERSUASIVE FUNCTION OF RHETORIC IN ADVERTISING SLOGANS 45 - 58
Collins C. Ngwakwe; Samkele T. MtsweniOriginal Scientific PaperEXTENT OF SUSTAINABILITY ASSURANCE IN SOUTH AFRICAN MINING COMPANIES 59 - 74
Makomane Taba; Michael FakoyaPreliminary PaperCOST ACCOUNTING PRACTICES IN AFRICAN TRADITIONAL HEALING: A CASE STUDY OF MAKHUDUTHAMAGA TRADITIONAL HEALERS IN SOUTH AFRICA 75 - 88
Brian Muyambiri; Prof NM OdhiamboScientific ReviewTHE SEQUENCING OF FINANCIAL REFORMS AND BANK-BASED FINANCIAL DEVELOPMENT IN MAURITIUS 89 - 114
INSTRUCTIONS FOR AUTHORS 115PUBLICATION ETHICS AND PUBLICATION MALPRACTICE STATEMENT FOR JOURNAL OF ACCOUNTING AND MANAGEMENT 116


1
Journal of Accounting and Management, vol: 6; no: 1, 2016; page 1 - 20
Scientific ReviewUDC: 336.71 / 657.67
Paper received: 01/04/2016Paper accepted: 09/05/2016
FINANCIAL PERFORMANCE OF “THE BEST AFRICAN BANKS”: A COMPARATIVE ANALYSIS THROUGH CAMEL RATING
Dr. Tesfatsion Sahlu Desta Department of Financial Governance, College of Accounting Sciences, University of South Africa, Pretoria, South Africa [email protected]
ABSTRACTThis study analyzed the financial performance of the African banks. Only seven
banks were observed among the 30 African best banks as identified by the Global Finance Magazine. These banks have complete and consolidated financial statements for a period of the recent three fiscal years (i.e. 2012 to 2014). It has applied the CAMEL composite and component rating. The study found that the banks are rated as strong and satisfactory when rated in terms of capital adequacy ratio and earnings ability. Conversely, they were rated as less satisfactory, deficient and critically deficient when rated in terms of asset quality, management quality and liquidity. All the banks were aggregately rated as composite 3 (i.e. Fair). Standard Bank of South Africa Ltd. (South Africa) ranked last among the banks under study, but it was selected as the winner best regional bank by the Global Finance Magazine in 2015. The banks are recommended to employ the CAMEL composite and component rating on a periodic basis in order to withstand business fluctuations and vulnerability to outside influences. Similarly, institutions like the Global Finance Magazine are recommended to apply the CAMEL composite and component rating while ranking best banks. Finally, further research is worth pursuing for constructing a complete ratio’s rating scale and weight for all ratios that constitute the composite CAMEL components.
Keywords: Banking, Component, Composite, Evaluation, Ratio.

2
Tesfatsion Sahlu Desta; FINANCIAL PERFORMANCE OF “THE BEST AFRICAN BANKS”... Journal of Accounting and Management, vol: 6; no: 1, 2016; page 1 - 20
1. INTRODUCTION
This study dealt with the comparative analysis of the financial perfor-mance of the African commercial banks. Commercial bank mainly plays an in-termediary role between the depositor and borrower. It helps attain optimum allocation of scarce national resources through accumulation of savings in the form of deposits from surplus economic units and provide this deposit to defi-cit economic units in the form of loans and advances. This indicates that com-mercial bank is at the heart of an economy’s success.
Jha and Hui (2012) explain that; “Financial sector is the backbone of the economy of a country. It works as
a facilitator for achieving sustained economic growth through providing efficient monetary intermediation. A strong financial system promotes in-vestment by financing productive business opportunities, mobilizing sav-ings, efficiently allocating resources and makes easy the trade of goods and services (p. 7601).”
Conversely, the Asian financial crisis in the 1990s and the world financial crisis in the 2007-2009 that is followed by the economic crisis learned that commercial banks are not only at the heart of economic success but also they are at the heart of the financial and economic crisis. It is, thus, obligatory to un-dertake periodic monitoring, supervision and regulation of commercial banks in order to make sure that they are financially healthy and sound.
Evaluation and analysis of the financial performance of banks are impor-tant for all internal and external users such as the bank managers, depositors, creditors, investors, employees, and regulators. Banks are expected, among others, to attain their short-term profit maximization, which is often measured by return on equity (ROE), return on asset (ROA) or net interest margin (NIM) and long-term wealth maximization goals, which is usually measured by earn-ings per share (EPS) or market price per share (MPS).
Periodic financial performance evaluation is, thus, compulsory in order to prove whether the banks’ short term and long term goals have been achieved and the stakeholders’ interest, that is, relevant economic needs of various stakeholders. Periodic performance evaluation is meaningful as long as the trend analysis (intra analysis) is supported by the cross-sectional (inter analy-sis). Such type of analysis help banks takes reactive and proactive measures with regard to overcoming their shortcomings, sustaining their strengths, and lesson from similar firms.
Ongore and Kusa (2013) support that; “Commercial banks play a vital role in the economic resource allocation of
countries. They channel funds from depositors to investors continuously.

3
Tesfatsion Sahlu Desta; FINANCIAL PERFORMANCE OF “THE BEST AFRICAN BANKS”... Journal of Accounting and Management, vol: 6; no: 1, 2016; page 1 - 20
They can do so, if they generate the necessary income to cover their op-erational cost they incur in the due course. In other words, for sustainable intermediation function, banks need to be profitable. Beyond the inter-mediation function, the financial performance of banks has critical im-plications for economic growth of countries. Good financial performance rewards the shareholders for their investment. This, in turn, encourages additional investment and brings about economic growth. On the other hand, poor banking performances can lead to banking failure and crisis, which have negative repercussions on the economic growth (p. 237).”
Bank performance can be influenced by internal factors (bank specific) and macroeconomic (external) factors such as GDP and inflation. This study is based on the bank specific factors that affect the performance of commercial banks (Ongore & Kusa, 2013). Among the widely used internal (bank specific) factors based performance measurements, ceteris paribus, are financial ratio analysis, data envelopment analysis (DEA), and CAMELS.
CAMELS rating is a financial performance evaluation system often applied to the banking industry, which is originally developed by the Uniform Financial Institutions Rating System (UFIRS). It is a composite rating system based on the financial ratios of the bank’s financial statements. The banks under evalu-ation are rated from 1 (best) to 5 (worst) in each of the CAMELS dimensions in order to identify the best and worst banks. Accordingly, the stakeholders are expected to take necessary reactive and proactive measures towards the pros-perity of the banks.
The CAMEL model is the most widely used model by researchers and the bank managers as well as the central banks have been implementing the CAMEL framework for evaluating the financial performance of banks (Baral, 2005; Dang, 2011). Dang (2011) argues that the CAMELS framework often used by scholars to proxy the internal (bank specific) factors. CAMELS refer to the portfolio of financial indexes that indicate the financial performance (health) of a firm. It stands for cap-ital adequacy, asset quality, management efficiency, earnings ability, liquidity and sensitivity to market risk (CAMELS).
The purpose of this study is, thus, to evaluate and rate the financial perfor-mance of the selected African commercial banks for the period of 2012 - 2014 in order to help bank’s stakeholders such as regulators, supervisors, owners and management identify and take corrective measures on emerging prob-lems before they become out-of-bound.
The next sections present the review of literature that is related and relevant to the bank-specific factor based bank’s financial performance measure opted for this study (i.e. CAMELS), the problem statement for undertaking this study, the objective of this study, the research methodology applied to this study, the re-

4
Tesfatsion Sahlu Desta; FINANCIAL PERFORMANCE OF “THE BEST AFRICAN BANKS”... Journal of Accounting and Management, vol: 6; no: 1, 2016; page 1 - 20
sults and discussions followed by the conclusions and recommendations that are driven from the research findings.
2. REVIEW OF LITERATURE
2.1. THEORETICAL LITERATURE
Ongore and Kusa (2013) state that; “Profit is the ultimate goal of commercial banks. All the strategies de-
signed and activities performed thereof are meant to realize this grand objective. However, this does not mean that commercial banks have no other goals. Commercial banks could also have additional social and eco-nomic goals (p. 239).”
The Corporate Annual Reports (CARs) comprise three reports: statutory, discretionary, and contextual report (Cronje, 2007:261-264). Among these re-ports, the statutory report (i.e. The financial statements) provides quantitative information that is helpful to measure the profitability of banks by using the alternative methods of financial performance measures such as the ratio anal-ysis, DEA, and CAMELS.
This study applied the CAMELS model for evaluating and analyzing the financial performance of the African commercial banks. According to Sarker (2006:8), CAMELS ratings generally assess the overall soundness of the banks, and identify and/or predict different risk factors that may contribute to turn the bank into a problem or failed bank. The components of CAMELS are further described as follows (Athanasoglou et al., 2005; Dang, 2011; FDIC, 2015; Ilho-movich, 2009; Ong &Teh, 2013; Sangmi & Nazir, 2010; Sarker, 2006):
§Capital adequacy refers to the adequacy of the amount of own fund (capital) available to support the bank’s business and act as a buffer in case of adverse situation or any shock. It is judged on the basis of capi-tal adequacy ratio (CAR). CAR shows the internal strength of the bank to withstand losses during the crisis.
§Asset quality refers to the quality of the bank’s loan which is the ma-jor asset that generates the major share of its income. It is measured by the nonperforming loan ratio (NPLR). It measures the risk facing a bank, i.e., the loss derived from delinquent loans. The lower the ratio the better the bank performing.
§Management efficiency refers to the quality of the bank’s management in deploying its resources efficiently, income maximization, and reduc-ing operating costs. Among others, it can be captured by different fi-

5
Tesfatsion Sahlu Desta; FINANCIAL PERFORMANCE OF “THE BEST AFRICAN BANKS”... Journal of Accounting and Management, vol: 6; no: 1, 2016; page 1 - 20
nancial ratios like total asset growth, loan growth rate, and earnings growth rate.
§Earnings ability refers to how losses are absorbed and capital is aug-mented. Strong earnings profile of banks reflects the ability to support present and future operations.
§Liquidity management refers to the ability of the bank to fulfill its obliga-tions, mainly of depositors. It can be measured by different ratios such as, ceteris paribus, customer deposit to total assets, total loan to customer deposit, and cash to deposit.
§Sensitivity to market risk reflects the degree to which changes in inter-est rates, foreign exchange rates, commodity prices, or equity prices can adversely affect a financial institution’s earnings or economic capi-tal.
The Uniform Financial Institution Rating System (UFIRS) which is common-ly referred to as CAMELS rating was proved to be an effective internal supervi-sory tool for evaluating the soundness of a financial firm. The bank supervisory authorities assign each bank a score on a scale of one (best) to five (worst) for each factor. If a bank has an average score less than two it is considered to be a high-quality institution, while banks with scores greater than three are con-sidered to be less-than-satisfactory establishments (UFIRS, 1997:1-9, as cited by Dang, 2011:16-25).
According to the Federal Deposit Insurance Corporation (FDIC, 2015), fol-lowing is the detail of the CAMELS composite ratings range from 1 to 5:
§Composite “1”- Institutions in this group are basically sound in every respect.
§Composite “2”-Institutions in this group are fundamentally sound, but may reflect modest weaknesses correctable in the normal course of business.
§Composite “3”- Institutions in this category exhibit financial, opera-tional, or compliance weaknesses ranging from moderately severe to unsatisfactory.
§Composite “4”- Institutions in this group have an immoderate volume of serious financial weaknesses or a combination of other conditions that are unsatisfactory.
§Composite “5”-This category is reserved for institutions with an ex-tremely high immediate or near term probability of failure.
Note that this study exempts the “sensitivity to market risk” ratio because of lack of information that is helpful to measure it. Therefore, the CAMEL model com-

6
Tesfatsion Sahlu Desta; FINANCIAL PERFORMANCE OF “THE BEST AFRICAN BANKS”... Journal of Accounting and Management, vol: 6; no: 1, 2016; page 1 - 20
prising of the remaining five ratios (i.e. Capital adequacy, asset quality, manage-ment efficiency, earnings ability, and liquidity) were employed.
The American International Assurance (AIA) described the composite CAMEL rating as a tool to select the best banks among potential banks by evaluating the level of their financial performance (AIA, 1996). It also helps to propose bank’s exposure to operational, financial and market risks based on the composite rating of an individual bank. The AIA’s CAMEL ratios, formula and criteria are presented in Table 1 below.
Table 1: AIA’s CAMEL Approach for Bank Analysis
CAMEL Ratios Formula Criteria
CapitalAdequacy
Capital AdequacyRatio
(Tier 1 Capital – Goodwill) + Tier 2 CapitalRisk-Weighted Assets >8%
Equity Capital to Total Assets Total Capital/Total Assets >4-6%
Asset Quality
NPLs to Total Loans NPLs/Total Loans <1%NPLs to Total Equity NPLs/Total Equity <1%
Allowance for Loan Loss Ratio Allowance for Loan Loss/Total Loans >1.5%
Provision for Loan Loss Ratio Provision for Loan Loss/Total Loans >100%
Management Quality
Total Asset Growth Rate Average of Historical Asset Growth Rate Nominal GNP Growth
Loan Growth Rate Average of Historical Loan Growth Rate Nominal GNP Growth
Earning Growth Rate Average of Historical Earning Growth Rate >10-15%
Earnings Ability
Net Interest Income Margin (NIM) Net Interest Income/Average Earning Assets >4.5%
Cost to Income Ratio Operating Expenses (Excludes Provision Loss)Net Interest Income + Non-Interest Income <70%
Return on Assets (ROA) Net Interest Income/Asset Growth Rate >1%
Return on Equity (ROE) Net Interest IncomeShareholder’s Equity Growth Rate >15%
Liquidity
Customer Deposits to Total Assets Total Customer Deposits/Total Assets >75%
Total Loan to Customer Deposits (LTD) Total Loans/Total Customer Deposits <80%
Source: AIA (1996), Babar and Zeb (2011) and Sarwar and Asif (2011)
Table 2 below presents the rating, rating range, rating analysis and inter-pretation of the CAMEL component and composite rating.
7
Tesfatsion Sahlu Desta; FINANCIAL PERFORMANCE OF “THE BEST AFRICAN BANKS”... Journal of Accounting and Management, vol: 6; no: 1, 2016; page 1 - 20
Table 2: The CAMEL’s Composite Rating
Rating Rating Range Rating Analysis Interpretation
1 1.0 - 1.4 Strong (or outstanding) The bank is basically good in every aspect. 2 1.6 - 2.4 Satisfactory (or superior) The bank is primarily good, but has several
identified weaknesses. 3 2.6 - 3.4 Fair (or average), with some
categories to be watched The bank have financial, operational, or compliance weaknesses that would give reasons for supervisory concern.
4 3.6 - 4.4 Marginal (or under perform), with some risk of failure
The bank has serious financial weaknesses that could damage future capability to ensure normal growth and development.
5 4.6 - 5.0 Unsatisfactory (or doubtful), with a high degree of failure
The bank has critical financial weaknesses that will give a probability of failure to be extremely high in the near future.
Source: AAA (1996) and Sarker (2006)
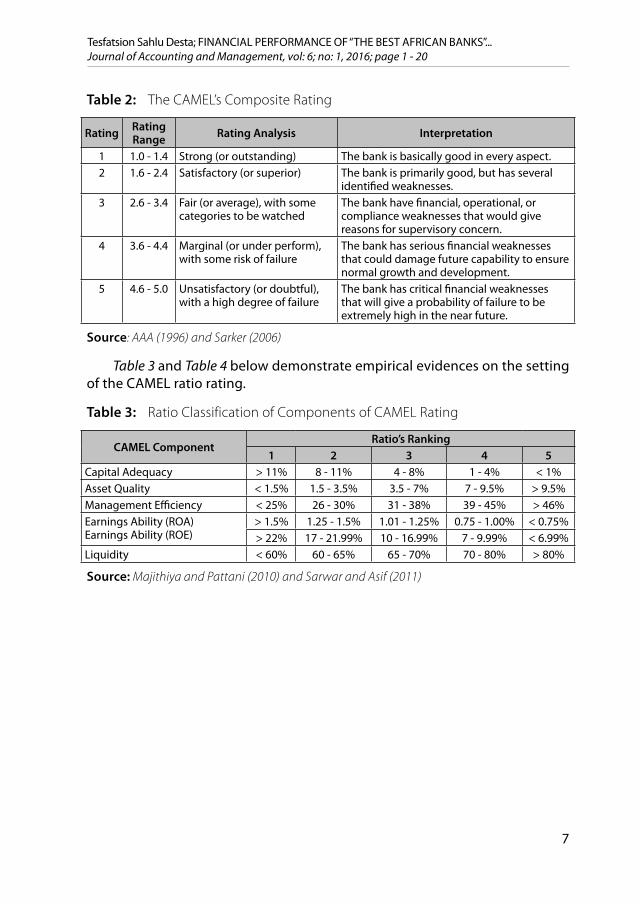
Table 3 and Table 4 below demonstrate empirical evidences on the setting of the CAMEL ratio rating.
Table 3: Ratio Classification of Components of CAMEL Rating
CAMEL ComponentRatio’s Ranking
1 2 3 4 5Capital Adequacy > 11% 8 - 11% 4 - 8% 1 - 4% < 1%Asset Quality < 1.5% 1.5 - 3.5% 3.5 - 7% 7 - 9.5% > 9.5%Management Efficiency < 25% 26 - 30% 31 - 38% 39 - 45% > 46%Earnings Ability (ROA)Earnings Ability (ROE)
> 1.5% 1.25 - 1.5% 1.01 - 1.25% 0.75 - 1.00% < 0.75%> 22% 17 - 21.99% 10 - 16.99% 7 - 9.99% < 6.99%
Liquidity < 60% 60 - 65% 65 - 70% 70 - 80% > 80%
Source: Majithiya and Pattani (2010) and Sarwar and Asif (2011)

8
Tesfatsion Sahlu Desta; FINANCIAL PERFORMANCE OF “THE BEST AFRICAN BANKS”... Journal of Accounting and Management, vol: 6; no: 1, 2016; page 1 - 20
Table 4: Ratio Classification of Components of CAMEL Rating
CAMEL ComponentRatio’s Rating
1 2 3 4 5Capital Adequacy Ratio > 15% 12 – 14.99% 8 – 11.99% 7 – 7.99% < 6.99%Asset Quality Ratio (NPLs/TL) < 1.25% < 2.5 – 1.26% < 3.5 – 2.6% < 5.5 – 3.6% > 5.6%Management Efficiency (Cost/Income)
< 25% 30 - 26% 38 - 31% 45 - 39% > 46%
Earnings Ability (ROA)Earnings Ability (ROE)
> 1% 0.9 – 0.8% 0.35 – 0.7% 0.25 – 0.34% < 0.24%> 22% 17 - 21.99% 10 - 16.99% 7 - 9.99% < 6.99%
Liquidity (TL/TD)Liquidity (Circulating Assets/TA)
≤ 55% 62 - 56% 68 - 63% 80 - 69% ≥ 81% ≥ 50% 45% - 49.99% 38% - 44.99% 33% - 37.99% ≤ 32%
Sensitivity Ratio ≤ 25% 30% - 26% 37% - 31% 42% - 38% ≥ 43%
Source: Babar and Zeb (2011)
2.2. EMPIRICAL LITERATURE
The empirical evidences that are related and relevant to the measurement of a bank’s financial performance through CAMEL rating are presented in this section.
Rozzani and Rahman (2013:40) find that management quality had achieved an overall best rating, which is inconsistent with the findings of Babar and Zeb (2011) and Sarwar and Asif (2011), where the component of capital adequacy achieved the best rating in Pakistan. Besides, Christopoulos et al. (2011:13-14) show a continuous decreasing trend in the capital ratio over the years. This means that its financial situation was not good and continued to get worse each year. Its bad and doubtful claims were very high while its access to capital markets was difficult for Lehman Brothers.
According to Christopoulos et al. (2011), the result of the asset quality ra-tio tended to increase over the years. It implies a low ability to detect, measure, monitor and regulate credit risks, while at the same time considering its bad and doubtful claims for the Lehman Brothers. The policy adopted in issuing loans was proven to be the worst. By granting loans to insolvent, high-risk bor-rowers, it led to an increase of its non-performing loans each year, namely its bad and doubtful loans.
Highest rating in the management quality displays a strong growth of these banks as well as high competency of its employees, which would help the bank grow in the future (Majithiya & Pattani, 2010). On the contrary, Christopoulos et al. (2011:14) show a continuous decreasing trend in the management ratio over the years. It infers that many of the loans were bad, approved as a result of the poor borrower assessment, a task that falls within the responsibilities of the management of the Lehman Brothers.

9
Tesfatsion Sahlu Desta; FINANCIAL PERFORMANCE OF “THE BEST AFRICAN BANKS”... Journal of Accounting and Management, vol: 6; no: 1, 2016; page 1 - 20
Earning quality is rated weak, which could be caused by the banks’ rigid lend-ing policies and strict lending criteria (Rozzani & Rahman, 2013:41; Sarwar & Asif, 2011). Besides, an assessment of the Lehman Brothers’ earnings ratio reveals that its profits are low and insufficient. This ring a bell that the bank would face survival issues in periods of potential instability or unexpected risks should it not improve its profits and quality of profits (Christopoulos et al., 2011:15).
Moreover, Christopoulos et al. (2011:15) report that the Lehman Brothers’ liquidity ratio computed by total loans to total deposits is satisfactory. This means that its loans were less than its deposits. This could indicate that the bank issued part of its loans using the funds available from its deposits and was in a position to withhold part of these funds as a reserve. To the contrary, the liquidity ratio computed by circulating assets to total assets is low. There-fore, in the event of an emergency, the bank would not be able to directly liq-uidate 60% of its total cash reserves, claims against other banking institutions and transaction portfolios, as well as, its investments in derivatives. In total, it is apparent that the bank’s liquidity status, as compared with its liabilities was poor while its management had no contingency plan that could produce the required flexibility when needed.
Hasbi and Haruman (2011:74) find that an increase in capital adequacy ratio (CAR), nonperforming financing (NPF), level of efficiency (OEOI) and financing to deposit ratio (FDR) have increased, but return on asset (ROA) experience slow-down. The Islamic bank focuses excessively on higher profit sharing for attract-ing customers switching from the conventional banks through larger financing, such as lending to big companies. Besides, it uses all deposited funds added us-ing internal equity to take profit-sharing or wide spread margin,instead of care-ful and prudent credit management and risk management.
Ongore and Kusa (2013:248), in their study on commercial banks in Kenya, report that the capital adequacy (measured by total capital to total asset) and management efficiency (measured by total operating revenue to total profit) have a statistically significant positive effect on the ROA and NIM, capital ad-equacy has a significant negative effect on ROE and asset quality (measured by non-performing loans to total loans) has a significant negative effect on the ROA, ROE, and NIM. But, the effect of liquidity (measured by total loans to total customer deposit) is not significant. The result on capital adequacy indicates an inconsistent effect on banks’ financial performance, that is, it has a positive impact on the ROA and NIM, but it has a negative impact on the ROE.
In a study on commercial banks in Uganda, Frederick (2014:9-10) finds that management efficiency (measured by operating costs to total income) and asset quality (measured by loan loss provision to total loan) have a statisti-cally significant negative effect and earnings ability (measured by net interest

10
Tesfatsion Sahlu Desta; FINANCIAL PERFORMANCE OF “THE BEST AFRICAN BANKS”... Journal of Accounting and Management, vol: 6; no: 1, 2016; page 1 - 20
margin to total assets) has a statistically significant positive effect on the per-formance of domestic commercial banks as measured by the ROA. However, capital adequacy (measured by equity capital to total assets) has no statisti-cally significant effect on the ROA. On the other hand, capital adequacy, as-set quality and management efficiency have a statistically significant negative effect and earnings ability has a statistically significant positive effect on the performance of domestic commercial banks as measured by ROE. This study demonstrates an inconsistent result of the explanatory variables when applied to the ROA and ROE; for instance, capital adequacy has a significant negative effect on ROE, but not on the ROA.
Cekrezi (2015:10-11) reveals that capital adequacy (measured by total eq-uity to total assets) and liquidity (measured by total loans to total assets) have a statistically significant negative effect on the performance of commercial banks in Albania as measured by ROA.
Jha and Hui (2012:7609), in their study on Nepal’s commercial banks, ex-plain that (1) capital adequacy (measured by Tier 1 capital + Tier 2 capital/risk weighted assets) and management efficiency (measured by interest expense/total loans) have a statistically significant negative impact, earnings ability (measured by net interest income/total earning assets) has a significant posi-tive effect, and asset quality (measured by non-performing loans/total loans) and liquidity (credit/deposit) have no significant impact on ROA; and (2) capi-tal adequacy has a statistically significant positive impact, but asset quality, management efficiency, earnings ability, and liquidity have no significant im-pact on ROE. This finding shows that CAMEL has different results when applied to ROA and ROE. For example, the management efficiency and earnings ability have a significant effect on ROA, but not on ROE.
In an analysis on financial performance of Ethiopian commercial banks, Geta-hun (2015:51-52) reports that (1) asset quality (measured by provision for loan/to-tal loan) and management efficiency (measured by non-interest expense/net in-terest income + non-interest income loan) have a statistically significant negative effect, earnings ability (measured by net interest income/total interest income) and liquidity (measured by total loan/total deposit) have a significant positive ef-fect and capital adequacy (measured by gross capital/total assets) has no signifi-cant effect on commercial banks’ ROA; and (2) capital adequacy and management efficiency have a significant negative effect, earnings ability and liquidity have a significant positive effect, and asset quality has no significant effect on commercial banks’ ROE. This study demonstrates that the CAMEL model helps to rate banks’ financial performance; however, it demonstrates a different result as applied to ROA and ROE. For example, asset quality has a significant effect on ROA, but not on ROE and capital adequacy has a significant effect on ROE, but not on ROA.

11
Tesfatsion Sahlu Desta; FINANCIAL PERFORMANCE OF “THE BEST AFRICAN BANKS”... Journal of Accounting and Management, vol: 6; no: 1, 2016; page 1 - 20
In summary, the above reviewed literature depicts that the CAMEL model can be applied to measure and evaluate the financial performance of commercial banks. However, the results were not consistent when the CAMEL components are applied to ROA, ROE and NIM. The literature also shows that the ratios that were used to compute the CAMEL components are not consistent, that is, different re-searchers employed different ratios. For instance, the researchers applied the total loans to total customer deposit, total loan/total deposit or total loans to total assets for computing the liquidity position of the commercial banks. Therefore, it can be concluded that commercial banks are rated differently when the CAMEL compo-nents are applied to ROA, ROE and NIM.
On the other hand, empirical studies revealed that Ferrouhi (2014), Ginev-icius and Podviezko (2011), Rozzani and Rahman (2013) and Sangmi and Nazir (2010) have employed the composite CAMEL ratings for comparative analysis of the financial performance of commercial banks in Morocco, Lithuania, Bang-ladesh, Malaysia and India.
Although the CAMELS composite rating has been used for internal control and for supervisory as well as regulatory purpose, the aforementioned empiri-cal evidences confirmed that researchers have been employing the composite rating for identifying strong as well as the weak financial performance of com-mercial banks.
3. PROBLEM STATEMENT
Commercial banks serve as an intermediation and one’s nation money stock. Evaluation of their performance is indisputably important to depositors, owners, investors, managers and regulators. Periodic measurement and evalu-ation of their performance is vital for ensuring their financial soundness and management’s quality.
As can be seen from the reviewed literature above, application of the CAM-EL components to ROA, ROE and NIM for evaluating the financial condition and performance of commercial banks portrayed inconsistent results. Howev-er, Muhammad (2009) claims that the composite CAMEL rating has been used as a precursor for reflecting accurate and consistent evaluations of commercial bank’s inner strength and exposure to market risks. Dang (2011:27) states that this rating was used by the American government during the financial crisis of 2008 for identifying which banks need special help.
Therefore, this study carried out periodic financial measures and evalu-ates the financial performance of the African commercial banks by employing the composite CAMEL ratings for a period of three years (i.e. 2012 – 2014). It helps examine how strong or weak they are and generate a composite index to

12
Tesfatsion Sahlu Desta; FINANCIAL PERFORMANCE OF “THE BEST AFRICAN BANKS”... Journal of Accounting and Management, vol: 6; no: 1, 2016; page 1 - 20
stakeholders such as management, owners, regulators and supervisors for the timely warning to minimize adverse effects on banks. For this reason, Barker and Holdsworth (1993) and Gaytan and Johnson (2002) argue that the com-posite CAMEL rating is very much popular among regulators due to its effec-tiveness. Besides, Dang (2011:39) confirms that the CAMEL rating is significant to banking supervision and is currently popular among regulators worldwide.
4. METHODOLOGIES
Seven of the 30 best banks, as identified by the Global Finance Magazine (2015), were observed. These banks were purposively selected based on the following criteria: Identified as the best banks in Africa in 2015 by the Global Finance Magazine (2015), has complete (not partial) consolidated financial statement for the recent three years (2012 - 2014), that is, available as a public domain in the Bureau van Dijk Bankscope (2016) and guided by consistent com-mon accounting reporting standards, that is, IFRS.
Congruent with the arguments made under the problem statement in sec-tion 3 above, the study employed the CAMEL composite ratings that range from 1 to 5 as applied by the AIA’s CAMEL for bank analysis (Dang, 2011:16-26). The CAMEL’s component, ratio, formula and criteria applied to this study are presented in Table 1 above.
5. RESULTS AND DISCUSSIONS
The following CAMEL components, ratios and rating are adapted and em-ployed while rating the African bank’s financial performance by taking into account Table 1, Table 3 and Table 4 as a reference. Accordingly, Table 5 below presents the components and ratio’s rating employed for this study.
Table 5: Ratio Classification of Components of CAMEL Rating
CAMEL ComponentRatio’s Rating
1 2 3 4 5Capital Adequacy Ratio > 15% 12 – 14.99% 8 – 11.99% 7 – 7.99% < 6.99%Asset Quality Ratio (NPLs/TL) < 1.25% < 2.5 – 1.26% < 3.5 – 2.6% < 5.5 – 3.6% > 5.6%Management Efficiency (Cost/Income) < 25% 30 - 26% 38 - 31% 45 - 39% > 46%Earnings Ability (ROA) > 1.5% 1.25 - 1.5% 1.01 - 1.25% 0.75 - 1.00% < 0.75%
(ROE) > 22% 17 - 21.99% 10 - 16.99% 7 - 9.99% < 6.99%Liquidity (TL/TD) < 55% 62 - 56% 68 - 63% 80 - 69% > 81%
Source: Adopted from Babar and Zeb (2011) and Rozzani and Rahman (2013)
The CAMEL ratio results are presented below in Table 6 through Table 9.

13
Tesfatsion Sahlu Desta; FINANCIAL PERFORMANCE OF “THE BEST AFRICAN BANKS”... Journal of Accounting and Management, vol: 6; no: 1, 2016; page 1 - 20
Table 6: Banks’ Ratio for the Year 2014
CAMEL Components
CAMELRatios
2014 (%)AB-Morocco
BdK-Rwanda
BWL-Namibia
EGHL-Kenya
FRB-S. Africa
SB-S. Africa
SCB-Botswana
Capital Adequacy CAR 12.63 26.30 14.10 21.00 16.10 14.60 16.10Asset Quality NPLs/TLs 6.75 6.57 0.68 4.31 2.42 3.74 0.73Management Quality C/I 30.30 34.95 48.07 48.62 48.51 42.08 61.87
Earnings AbilityRoA 1.29 4.05 2.39 5.50 1.57 1.10 2.76RoE 13.22 22.85 21.03 31.09 22.55 14.51 28.05
Liquidity TLs/CD 105.36 76.00 108.51 90.22 107.61 99.36 81.60Source: Author
Table 7: Banks’ Ratio for the Year 2013
CAMEL Components
CAMELRatios
2013 (%)AB-Morocco
BdK-Rwanda
BWL-Namibia
EGHL-Kenya
FRB-S.Africa
SB-S.Africa
SCB-Botswana
Capital Adequacy CAR 12.72 23.70 14.90 26.00 14.90 15.50 19.80Asset Quality NPLs/TLs 6.26 6.94 0.86 5.21 2.95 3.82 0.62Management Quality C/I 34.25 31.64 49.01 43.61 47.93 40.21 55.02
Earnings AbilityRoA 1.33 3.51 2.23 5.10 1.48 1.04 3.33RoE 13.93 20.96 21.76 29.26 22.40 14.08 32.09
Liquidity TLs/CD 109.94 75.53 131.00 90.88 104.54 97.78 80.72
Source: Author
Table 8: Banks’ Ratio for the Year 2012
CAMEL Components
CAMEL Ratios
2012 (%)AB-Morocco
BdK-Rwanda
BWL-Namibia
EGHL-Kenya
FRB-S.Africa
SB-S.Africa
SCB-Botswana
Capital Adequacy CAR 11.94 23.20 12.60 32.00 14.80 14.80 22.40Asset Quality NPLs/TLs 5.05 6.53 1.08 3.08 3.45 3.71 10.24Management Quality C/I 37.90 43.15 52.91 44.43 47.58 42.45 54.87
Earnings AbilityRoA 1.47 3.86 1.98 5.49 1.41 1.25 2.93RoE 16.11 18.90 21.69 32.62 22.18 19.65 32.13
Liquidity TLs/CD 112.94 91.56 128.32 83.37 111.80 94.92 69.77
Source: Author

14
Tesfatsion Sahlu Desta; FINANCIAL PERFORMANCE OF “THE BEST AFRICAN BANKS”... Journal of Accounting and Management, vol: 6; no: 1, 2016; page 1 - 20
Table 9: Aggregate Banks’ Ratio for the Year 2012-2014
CAMEL Components
CAMELRatios
Aggregate for 2012 – 2014 (%)AB-Morocco
BdK-Rwanda
BWL-Namibia
EGHL-Kenya
FRB-S.Africa
SB-S.Africa
SCB-Botswana
Capital Adequacy CAR 12.43[2] 24.40[1] 13.87[2] 26.33[1] 15.27[1] 14.97[2] 19.43[1]Asset Quality NPLs/TLs 6.02[5] 6.68[5] 0.87[1] 4.20[4] 2.94[3] 3.76[4] 3.86[4]Management Quality C/I 34.15[3] 36.58[3] 50.00[5] 45.55[5] 48.00[5] 41.58[4] 57.25[5]
Earnings AbilityRoA 1.36[2] 3.81[1] 2.20[1] 5.36[1] 1.49[2] 1.13[3] 3.01[1]RoE 14.42[3] 20.90[2] 21.49[2] 30.99[1] 22.38[1] 16.08[3] 30.76[1]Combined [2] [1] [1] [1] [1] [3] [1]
Liquidity TLs/CD 109.41[5] 81.03[5] 122.61[5] 88.16[5] 107.98[5] 97.35[5] 77.36[4]Combined Average Rate (Ʃr/n) 3.33 2.83 2.67 2.83 2.83 3.5 2.67Ranking 3 2 1 2 2 4 1Composite Rating 3 3 3 3 3 3 3Rating Analysis Fair Fair Fair Fair Fair Fair Fair
Source: Author* Σr = Sum of the six ratio ratings of a specific bank; n= Number of ratios (i.e. 6)** AB= Attijariwafa Bank (Morocco); BdK= Banque de Kigali (Rwanda); BWL= Bank Windhoek Limited (Namibia);
EGHL= Equity Group Holdings Limited (Kenya); FRB= First Rand Bank Ltd (South Africa); SB= Standard Bank of South Africa Ltd. (South Africa) and Standard Chartered Bank Botswana Ltd (Botswana)
*** Note that the component ratios that are fitted to the ratios under Table 3 and Table 4 above are considered for this analysis. The specific ratings of the CAMEL components (i.e. Component ratings) are presented in the brackets. Moreover, the ratio rating is in line with Table 2 and Table 5 above.
The following discussions are in line with the Uniform Financial Institutions Rating System (UFIRS, 1997). The composite and component ratings are based on a 1 to 5 numerical scale as demonstrated in Table 2 above.
The results in Table 9 above revealed that the banks’ specific CAMEL com-ponents are rated from 1 to 5. Besides, the banks’ overall CAMEL composite rating indicated that all the banks are rated as composite 3, that is, fair with some components to be watched, where their combined average composite rate falls within the 2.6 - 3.5 range (Table 2); however, the result shows a clear difference among the banks specific performance (i.e. Component rating) as discussed below.
According to the Capital Adequacy’s rating, all banks fulfil beyond the Basel III’s minimum total capital adequacy ratio (CAR) of 8%, yet, there is an undeni-able difference among the specific bank ratings. Banque de Kigali (Rwanda), Equity Group Holdings Limited (Kenya), First Rand Bank Ltd (South Africa) and Standard Chartered Bank Botswana Ltd (Botswana) are rated 1, that is, they are maintaining strong capital level relative to their risk profile. Whereas, Attijari-wafa Bank (Morocco), Bank Windhoek Limited (Namibia) and Standard Bank of South Africa Ltd. (South Africa) are rated 2, that is, they are maintaining a satis-

15
Tesfatsion Sahlu Desta; FINANCIAL PERFORMANCE OF “THE BEST AFRICAN BANKS”... Journal of Accounting and Management, vol: 6; no: 1, 2016; page 1 - 20
factory capital level relative to their risk profile. This result is consistent with the finding of Sangmi and Nazir (2010) who state that such strong and satisfactory capital level is the sign of banks’ survival in times of crisis and also opportuni-ties to expand in the future that reflects the inner strength of banks. The result shows that the banks are financially sound, complied with the statutory capital regulations and able to sustain reasonable losses. Thus, the banks may attract more future deposits and lift up their lending capacity.
The Asset Quality’s rating indicated that Bank Windhoek Limited (Namibia) is rated 1, that is, it has strong asset quality, where its credit administration and risk management practice is strong; First Rand Bank Ltd (South Africa) is rated 3, that is, it has less than satisfactory asset quality, where its credit administration and risk management practice is less satisfactory and ; Equity Group Holdings Limited (Kenya), Standard Bank of South Africa Ltd. (South Af-rica) and Standard Chartered Bank Botswana Ltd (Botswana) are rated 4, that is, they have deficient asset quality, where their credit administration and risk management practice is deficient and Attijariwafa Bank (Morocco) and Banque de Kigali (Rwanda) are rated 5, that is, they have critically deficient asset qual-ity, where their credit administration and risk management practice is critically deficient. In summary, the banks’ quality of their credit is deficient and critically deficient (except for two banks). This implies that the banks are not good at detecting, measuring, monitoring and regulating credit risks, that is, probably caused by relaxing lending policies and lending criteria, and lenient credit con-trol (Christopulous et al., 2011; Rozzani & Rahman, 2013; Sarwar & Asif, 2011). Thus, their future credit financing (i.e. Payment of interest on deposits as well as withdrawal of deposits), deposit mobilization and lending capacity will be adversely influenced.
The Management Quality’s rating revealed that Attijariwafa Bank (Mo-rocco) and Banque de Kigali (Rwanda) are rated 3, that is, their management and board performance is less than satisfactory, where their risk management practice is less satisfactory; Standard Bank of South Africa Ltd. (South Africa) is rated 4, that is, its management and board performance is deficient, where its risk management practice is deficient and its level of risk exposure is ex-cessive and Bank Windhoek Limited (Namibia), Equity Group Holdings Limited (Kenya), First Rand Bank Ltd (South Africa) and Standard Chartered Bank Bot-swana Ltd (Botswana) are rated 5, that is, their management and board perfor-mance is critically deficient, where their risk management practice is critically deficient and their level of risk exposure is too excessive. In total all the banks management quality is less satisfactory, deficient and critically deficient. Such finding is against the findings of Majithiya and Pattani (2011) who reported that banks’ management quality displayed the strong growth of the banks as well as the high competency of its employees. It implies that there is serious

16
Tesfatsion Sahlu Desta; FINANCIAL PERFORMANCE OF “THE BEST AFRICAN BANKS”... Journal of Accounting and Management, vol: 6; no: 1, 2016; page 1 - 20
problem which calls for instant supervisory concern due to the banks’ financial, operational and compliance weakness which will damage future capability to ensure normal growth and development.
The combined Earnings Ability’s rating showed that Bank Windhoek Limited (Namibia), Equity Group Holdings Limited (Kenya), First Rand Bank Ltd (South Africa), Standard Chartered Bank Botswana Ltd (Botswana) and Banque de Ki-gali (Rwanda) are rated 1, that is, their earnings ability is strong, where earn-ings are more than sufficient to support operations and maintain adequate capital and allowance levels; Attijariwafa Bank (Morocco) is rated 2, that is, its earnings ability is satisfactory, where earnings are sufficient to support opera-tions and maintain an adequate capital and allowance levels and Standard Bank of South Africa Ltd. (South Africa) is rated 3, that is, its earnings ability is less satisfactory, where earnings may not fully support operations and provide for the accretion of capital and allowance levels. Except Standard Bank, the re-maining six banks are rated as strong and satisfactory which may be caused by banks’ relaxed lending policies and lending criteria (Rozzani & Rahman, 2013; Sarwar & Asif, 2011).
According to the Liquidity’s rating, the Standard Chartered Bank Botswana Ltd (Botswana) is rated 4, that is, its liquidity level is deficient, where its funds management practice is inadequate and Banque de Kigali (Rwanda), Bank Windhoek Limited (Namibia), Equity Group Holdings Limited (Kenya), First Rand Bank Ltd (South Africa), Attijariwafa Bank (Morocco) and Standard Bank of South Africa Ltd. (South Africa) are rated 5, that is, their liquidity level is criti-cally deficient, where their funds management practice is critically inadequate. Such finding affirms Sangmi and Nazir (2010) who explain that the weak rat-ing of liquidity displays an unbalanced mixture of liquid and non-liquid assets where banks would be unable to meet its liability obligations during times when demand arises. Besides, Hasbi and Haruman (2011) state that the banks may be forced to cover bank deposit withdrawals made by customers from their banks’ own equity. The study, hence, indicates that there is a serious prob-lem that demands immediate action and careful loan and deposit monitoring.
In summary, following the composite rating, Table 9 above showed that Bank Windhoek Limited (Namibia) and Standard Chartered Bank Botswana Ltd (Botswana) are ranked first; Banque de Kigali (Rwanda), Equity Group Hold-ings Limited (Kenya) and First Rand Bank Ltd (South Africa) second; Attijari-wafa Bank (Morocco) third and Standard Bank of South Africa Ltd. (South Af-rica) fourth. However, all the banks are aggregately rated and falls under the composite 3, that is, their composite financial performance rating is fair with some categories to be watched. The result disclosed that the banks’ manage-ment and board performance on risk management (i.e. Asset quality and man-

17
Tesfatsion Sahlu Desta; FINANCIAL PERFORMANCE OF “THE BEST AFRICAN BANKS”... Journal of Accounting and Management, vol: 6; no: 1, 2016; page 1 - 20
agement quality) and funds management (i.e. Liquidity) range from moderate to severe. This rating exhibits some degree of supervisory concern on some components which may expose the banks to be less capable of withstanding business fluctuations and vulnerable to outside influences.
6. CONCLUSIONS AND RECOMMENDATIONS
The study addressed the seven banks that were among the best African banks as identified by the Global Finance Magazine (2015). These banks were purposely selected for having complete (not partial) financial statements for the latest three years (i.e. 2012 – 2014).
Four banks rated as strong and three of them rated as satisfactory when rated by the capital adequacy ratio (CAR). All banks fulfill above the Basel III’s minimum requirement for capital adequacy ratio (CAR), that is, greater than 8%. Besides, five banks rated as strong, one as satisfactory and another one as less satisfactory when rated in terms of combined earnings ability.
Almost all banks exhibit supervisory concern when rated in terms of as-set quality, management quality and liquidity. They are rated as less satisfac-tory, deficient and critically deficient. This is may be the result of unsafe and unsound risk management, fund management practices and noncompliance with laws and regulation.
The results showed that all the banks are aggregately rated and fall under the composite rate 3, that is, fair. This composite rating often indicates that rea-sonable problems exist which require an immediate action and careful moni-toring. It means the banks are less capable of withstanding and more vulnera-ble to credit, market and other risks. Besides, the Standard Bank of South Africa Ltd. (South Africa) that was identified as the winner best regional bank in Africa by the Global Finance Magazine (2015) is, however, on the verge of composite rate 4 and ranked the last among the seven banks under study.
The study concluded that the composite CAMEL rating reveals variations among the observed banks. Even if all the banks are compositely rated as fair, they have differences when each component and their aggregate average is considered. This variation helps to compare and rank banks based on their fi-nancial performance apart from triggering regulatory, supervisory and admin-istrative concerns that must be addressed.
The empirical evidences reviewed above depict that the application of CAMEL to ROA, ROE and NIM portrays an inconsistent result regarding bank’s financial performance. It may be improper to rank the banks as a strong or a weak performer when the ROA, ROE and NIM are treated independently. Conversely, the CAMEL composite rating constitutes of many financial ratios

18
Tesfatsion Sahlu Desta; FINANCIAL PERFORMANCE OF “THE BEST AFRICAN BANKS”... Journal of Accounting and Management, vol: 6; no: 1, 2016; page 1 - 20
including the ROA, ROE and NIM. It helps to evaluate the bank’s financial per-formance in a holistic manner by considering more financial ratios. Any given bank may take a lesson from the individual as well as composite (aggregate) ratio and rating. As a result, compared to the ROA, ROE and NIM, the composite CAMEL rating is a better model for evaluating the banks’ financial performance and for conveying constructive remarks on risk management, funds manage-ment and compliance with laws and regulations.
The banks are recommended to employ the composite CAMEL rating model on a periodic basis (at least once a year) in order to identify the com-ponents along with their associated specific ratios that need special attention. This will help bank managers for enduring financial and economic stresses and complying with laws and regulations. Moreover, institutions like the Global Fi-nance Magazine are recommended to apply the CAMEL composite and com-ponent rating for ranking banks.
Finally, the study was not carried without limitations. First, the CAMEL model comprises many financial ratios for evaluating the soundness of a firm financial and operational performance. For instance, an empirical study such as the AIA (1996) details the 15 specific ratios to be considered under each component of the CAMEL. Besides, empirical evidences report that prior re-searchers have tried to make the CAMEL composite and component ratings more objective and easy to use in constructing ratio’s rating scale (Babar & Zeb, 2011; Majithiya & Pattani, 2010; Sarwar & Asif, 2011). These ratio’s rating scales didn’t fully cover the AIA’s 15 ratios. As a result, this study accounts only the six financial ratios that are rated by the empirical researchers. Second, the composite CAMEL rating, in addition to its quantitative ratio analysis, is accom-panied by subjective judgements. Thus, further research is recommended and worthy to construct a complete ratio’s rating scale for all the ratios constructed by the AIA and the weight that deserves for each ratio so that the composite rating be relatively objective.
7. REFERENCES1. AIA. (1996). CAMEL approach to bank analysis by AIA. Credit Risk Management, New York. 2. Athanasoglou, P.P., Sophocles, N.B., &Matthaios, D.D. (2005).Bank-specific, industry-specific and
macroeconomic determinants of bank profitability. Working paper, Bank of Greece, 1(1), 3-4.3. Babar, H.Z., & Zeb, G. (2011). CAMELS rating system for banking industry in Pakistan: Does
CAMELS system provide similar rating as PACRA system in assessing the performance of banks in Pakistan? (Master Thesis). Umea School of Business, Umea Universitet, Pakistan.
4. Baral, K.J. (2005). Health check-up of commercial banks in the framework of CAMEL: A case study of joint venture banks in Nepal. The Journal of Nepalese Business Studies, 2(1), 14-35.
5. Barker, D., & Holdsworth, D. (1993). The causes of bank failures in the 1980s. Research Paper No. 9325, Federal Reserve Bank of New York.

19
Tesfatsion Sahlu Desta; FINANCIAL PERFORMANCE OF “THE BEST AFRICAN BANKS”... Journal of Accounting and Management, vol: 6; no: 1, 2016; page 1 - 20
6. Bureau van Dijk Bankscope. (2016). Bankscope: World banking information source. Available at https://bankscope.bvdinfo.com/version- 201629/home.serv? (Accessed 17 February 2016 at 9:30 a.m.).
7. Cekrezi, A. (2015). Factors affecting performance of commercial banks in Albania. The Euro-pean Proceedings of Social & Behavioral Sciences (EpSBS), BE-ci 2015 May, Department of Finance and Accounting, University “A.Xhuvani”, Elbasan, Albania, eISSN:2357-1330.
8. Christopoulos, A.G., Mylonakis, J., & Diktapanidis, P. (2011). Could Lehman Brothers’ col-lapse be anticipated? An examination using CAMELS rating system. International Business Research, 4(2), 11-19.
9. Cronje, C.J. (2007). Corporate annual reports (CARs): Accounting practices in transition (Ph.D. Thesis). University of Pretoria, Pretoria, South Africa.
10. Dang, U. (2011).The CAMEL rating system in banking supervision: A case study. Arcada Uni-versity of Applied Sciences, International Business.
11. Federal Deposit Insurance Corporation. (2015). Risk management manual of examination policies. Retrieved on January 26, 2016 at 10:36 a.m. from www.fdic.gov/regulations/safety/manual
12. Ferrouhi, El-M. (2014). Moroccan banks analysis using CAMEL model. International Journal of Economics and Financial Issues, 4(3), 622-627.
13. Frederick, N.K. (2014). Factors affecting performance of commercial banks in Uganda: A case for domestic commercial banks. Proceedings of 25th International Business Research Confer-ence, 13-14 January 2014, Taj Hotel, Cape Town, South Africa, ISBN:978-1-922069-42-9.
14. Gaytán, A., & Johnson, C.A. (2002). A review of the literature on early warning systems for banking crises. Central Bank of Chile Working Papers, No. 183. Santiago, Chile.
15. Getahun, M. (2015).Analyzing financial performance of commercial banks in Ethiopia: CAMEL approach (Master Thesis). Addis Ababa University, Addis Ababa, Ethiopia.
16. Ginevicius, R., & Podviezko, A. (2011). A framework of evaluation of commercial banks. Intel-lectual Economics, 1(9), 37-53.
17. Global Finance Magazine. (2015). The world’s best emerging markets banks in Africa 2015. Global Finance Magazine, March 11, 2015. Retrieved on February 17, 2016 from https://www.gfmag.com/media/press-releases/global-finance-names-worlds-best-emerging- mar-kets-banks-africa-2015?
18. Hasbi, H., & Haruman, T. (2011). Banking: According to Islamic Sharia concepts and its perfor-mance in Indonesia. International Review of Business Research Papers, 7(1), 60-76.
19. Ilhomovich, S.E. (2009).Factors affecting the performance of foreign banks in Malaysia (Mas-ter thesis).College of Business (Finance and Banking), Malaysia.
20. Jha, S., & Hui, X. (2012). A comparison of financial performance of commercial banks: A case study of Nepal. African Journal of Business Management, 6(25), 7601-7611.
21. Majithiya, R., & Pattani, A. (2010). Rating the performance of the bank through CAMELS model (Post Diploma thesis), Tolani Institute of Management Studies, India.
22. Muhammad, H. (2009). Banks and CAMELS. Available at: http://ezinearticles.Com/?Banks-And-CamelsandId=2565867 (Retrieved October 15, 2011).
23. Ong, T. S., &Teh, B. H. (2013).Factors affecting the profitability of Malaysian commercial banks. African Journal of Business Management, 7(8), 649-660.
24. Ongore, V.O., &Kusa, G.B. (2013).Determinants of financial performance of commercial banks in Kenya. International Journal of Economics and Financial Issues, 3(1), 237-252.
25. Rozzani, N., & Rahman, R.A. (2013). CAMELS and performance evaluation of banks in Ma-laysia: Conventional versus Islamic. Journal of Islamic Finance and Business Research, 2(1), 36-45.
26. Sangmi, M., & Nazir, T. (2010). Analyzing financial performance of commercial banks in India: Application of CAMEL model. Pakistan Journal of Commerce and Social Sciences, 4(1), 40-55.

20
Tesfatsion Sahlu Desta; FINANCIAL PERFORMANCE OF “THE BEST AFRICAN BANKS”... Journal of Accounting and Management, vol: 6; no: 1, 2016; page 1 - 20
27. Sarker, A.A. (2006). CAMELS rating system in the context of Islamic banking: A proposed ‘S’ for Shariah framework. Journal of Islamic Economics, Banking and Finance, 2(2), 1-26.
28. Sarwar, A., & Asif, S. (2011). Safety & soundness of financial sector of Pakistan: CAMEL rating application. Interdisciplinary Journal of Contemporary Research in Business, 3(2), 624-630.
29. Uniform Financial Institutions Rating System. (1997). Statements of Policy. The United States: Federal Deposit Insurance Corporation (FDIC).
30. Yakob, R., Yusob, Z., Radam, A., & Ismail, N. (2012). CAMEL rating approach to assess the insurance operators’ financial strength. Jurnal Ekonomi Malaysia, 46(2), 3 - 15.
FINANCIJSKO POSLOVANJE “NAJBOLJIH AFRIČKIH BANAKA”: KOMPARATIVNA ANALIZA POMOĆU SUSTAVA OCJENJIVANJA CAMEL
SAŽETAK RADA:Ova studija analizira financijsko poslovanje Afričkih banaka. Između trideset naj-
boljih banaka identificiranih od strane Global Finance Magazine promatrano ih je se-dam koje imaju cjelovite i konsolidirane financijske izvještaje za razdoblje posljednje tri fiskalne godine (2012. do 2014.). U radu se primjenjuje sustav CAMEL za analizu i ocjenjivanje.
Studija je pokazala da su banke procijenjene kao snažne kada su procjenjivane u okviru adekvatnosti kapitala i mogućnosti ostvarenja dobiti. Obzirom na kvalitetu menadžmenta, likvidnost i kvalitetu aktive ocijenjene su kao manje zadovoljavajuće, nedostatne te manjkave.
Sve banke u cjelini označene su ocjenom tri (dobar).Standard Bank of South Africa Ltd. (South Africa) ocijenjena je najlošijom od svih
banaka obuhvaćenih studijom, no od strane Global Finance Magazina ocijenjena je najboljom regionalnom bankom u 2015. godini.
Bankama je preporučeno da periodično koriste sustav ocjenjivanja CAMEL kako bi izbjegle poslovne fluktuacije i ranjivost uzrokovane vanjskim čimbenicima.
U skladu s preporukom bankama, isto se preporučuje i institucijama poput Global Finance Magazine pri procjenjivanju najboljih banaka.
Naposljetku, preporuča se daljnje istraživanje kako bi se napravila potpuna skala procjene i težine svih dijelova koje čine sastavne dijelove sustava CAMEL
Ključne riječi: bankarstvo, sastavni dio, dio, procjena, omjer.

21
Journal of Accounting and Management, vol: 6; no: 1, 2016; page 21 - 32
Original Scientific PaperUDK: 658.14/658.8
Paper received: 31/03/2016Paper accepted: 19/04/2016
EFFECT OF DEBT REDUCTION ON PROFITABILITY IN CASE OF SLOVENIAN DAIRY PROCESSING MARKET LEADER
Saša Muminović, PhD, AquafilSLO d.o.o., Aquafil Group, Ljubljana, [email protected]
ABSTRACTThe indebtedness level in absolute figures, observed in isolation and by itself,
does not provide an answer if the company or industry is over over-indebted or not. The indebtedness must be observed in combination with indicators that indicate how the value has been created or how the borrowed money was used. In the beginning of the crisis in the Slovenian dairy processing industry, represented by market leader, followed the trend of debt reduction. However, this reduction did not improve the profitability performance of the industry.
Key words: Indebtedness, dairy processing industry, crisis, profitability
1. INTRODUCTION
Slovenian economy was stricken twice by the crisis: first in 2009 with a sharp fall of GDP of 7.8% and again in 2012 with GDP fall of 2.7%. It was the end of an era of cheap money combined with no capital restrictions and stable economy that was used for stock market speculation (Vidakovic & Zbašnik, 2014)
During the crisis period, inflation was low and even threatening to enter deflation area (Table 1). Despite debt reduction since 2009 - the beginning of the crisis - Slovenian corporate indebtedness is high and profitability is low. Companies with financial debt exceeding EBITDA by a factor of five account for

22
Saša Muminović; EFFECT OF DEBT REDUCTION .. Journal of Accounting and Management, vol: 6; no: 1, 2016; page 21 - 32
about 80% of financial debt, but represent only one third of companies (Sila, 2015). Debt reduction had negative effect in overall economy via lower activ-ity and investment (IMAD, 2014). Credit crunch made that worse. For example, data from 2011 reveal that the change in lending to customers in four major banks in Slovenia decreased for 653 mil. EUR (SPIRIT). In Slovenia, the crisis was not concentrated in the real estate and construction sectors like in other coun-tries but it was rather cross-sectorial (European Commission, 2014).
Table 1.: HICP - inflation rate / Annual average rate of change Real GDP growth rate – volume / Percentage change on previous year
2006 2007 2008 2009 2010 2011 2012 2013 2014Inflation 2.5% 3.8% 5.5% 0.9% 2.1% 2.1% 2.8% 1.9% 0.4%GDP growth 5.7% 6.9% 3.3% -7.8% 1.2% 0.6% -2.7% -1.1% 3.0%
Source: Eurostat dataset, Code: tec00118 and Code: tec00115
Although Slovenian food sector does not demonstrate overall compara-tive advantages, area Manufacture of dairy products (C10.5) demonstrates clear comparative advantages (According to the Slovenia’s Smart Specialisation Strategy S4). In 2014, dairy processing industry had 12.3% share in total as-sets, 16.9% share in total revenue and 14.7% share in EBITDA in the area C 10 - Manufacture of food products. Looking forward, in the same year, it had 0.9% share in total assets, 1.2% share in total revenue and 0.8% share in EBITDA in the area C - Manufacturing (AJPES).
Paradoxically, the best years for Slovenian dairy processing industry were years 2008 and 2009 – Chart 1. This indicates that crisis effect was seen in the following years. It could be also seen that industry suffered losses in years af-ter Slovenia joined the EU in 2004, facing the new wider competition on fi-nal products area and in area of milk collection. In four years after joining EU (2004-2007), profitability of Slovenian dairy plants was very poor and the accu-mulated four-year loss was 35 mil. EUR with negative ROE indicator up to 25% (Muminović & Pavlović, 2012).
In addition, the Slovenian market is very concentrated. Looking at the milk collection data, according to Van Berkun (2009), intake by market leader and another two companies in 2007 was 90% of total milk production processed.

23
Saša Muminović; EFFECT OF DEBT REDUCTION .. Journal of Accounting and Management, vol: 6; no: 1, 2016; page 21 - 32
Chart 1: EBITDA and Net result of Slovenian dairy processing industry
Page 3 of 11
Source: AJPES and Author’s calculation
Taking in consideration the trends in Slovenian economy regarding debt reduction, the
importance of Slovenian dairy processing industry and problems it faced, the aim of this
paper is to analyse if Slovenian dairy processing industry, represented by market leader,
followed the trend of debt reduction and how it was implicated on its profitability.
2. METODOLOGY
The working hypothesis is that changes in indebtedness had an impact on companies’
profitability. In order to test the above assumptions, the following statistical hypotheses have
been developed:
H1 ...Slovenian dairy processing leader decreased its debt, as it was the case for the
whole economy in Slovenia.
H2 ...Changes in indebtedness had impact on profitability.
This research is conducted on the biggest Slovenian company in the dairy processing
industry. Its annual financial reports in succession from 2006 to 2014 were reviewed. Selected
company covers 58.8% and 61.3% of total assets of companies in area C10.5 – Manufacture
of dairy products in Slovenia, in the year 2013 and 2014 respectively. In addition, market
leader covered 57.2% and 56.9% of sales revenues in the same years.
For the indebtedness analysis, common well-known indicators were used: Total debt
/EBITDA, financial debt /EBITDA, financial debt / total debt, financial debt / total asset, long
term debt/total debt.
Return on assets (ROA – operating income divided by total assets) and return on
equity (ROE – as net income divided by owner's equity) ratios are proxy variables for
company's profitability (e.g. O’Regan, 2006; Chapman, 2012; Muminović & Pavlović, 2012
-20,000,000
-10,000,000
0
10,000,000
20,000,000
30,000,000
2006 2007 2008 2009 2010 2011 2012 2013 2014
EBITDA Net result
Source: AJPES and Author’s calculation
Taking in consideration the trends in Slovenian economy regarding debt reduction, the importance of Slovenian dairy processing industry and prob-lems it faced, the aim of this paper is to analyse if Slovenian dairy processing industry, represented by market leader, followed the trend of debt reduction and how it was implicated on its profitability.
2. METODOLOGY
The working hypothesis is that changes in indebtedness had an impact on companies’ profitability. In order to test the above assumptions, the following statistical hypotheses have been developed:
H1 ...Slovenian dairy processing leader decreased its debt, as it was the case for the whole economy in Slovenia.
H2 ...Changes in indebtedness had impact on profitability. This research is conducted on the biggest Slovenian company in the dairy
processing industry. Its annual financial reports in succession from 2006 to 2014 were reviewed. Selected company covers 58.8% and 61.3% of total assets of companies in area C10.5 – Manufacture of dairy products in Slovenia, in the year 2013 and 2014 respectively. In addition, market leader covered 57.2% and 56.9% of sales revenues in the same years.
For the indebtedness analysis, common well-known indicators were used: Total debt /EBITDA, financial debt /EBITDA, financial debt / total debt, financial debt / total asset, long term debt/total debt.

24
Saša Muminović; EFFECT OF DEBT REDUCTION .. Journal of Accounting and Management, vol: 6; no: 1, 2016; page 21 - 32
Return on assets (ROA – operating income divided by total assets) and re-turn on equity (ROE – as net income divided by owner’s equity) ratios are proxy variables for company’s profitability (e.g. O’Regan, 2006; Chapman, 2012; Muminović & Pavlović, 2012 and Muminović, & Aljinović Barać, 2015) and ex-pected association with indebtedness is positive. Namely, the reason for debt is anticipation of future economic benefits.
3. INDEBTEDNESS ANALYSIS
In absolute figures, in 2014, for the observed company the total debt de-creased for 22.3 mil.EUR, or 32% with respect to the year 2006. In fact, the debt reduction begun in 2009 for 15.6% compared to the previous year and again in 2010 for 32% compared to 2008 (Chart 2).
Meanwhile, the financial debt in 2009 dropped for 7.3 mil. EUR (22%) with compared to previous year. Comparing the level of financial debt in 2006 and 2014, the decrease was 55.2% or 21.2 mil. EUR.
Above-mentioned absolute figures could mislead because they do not provide the information about the level of activity of business. The level of indebtedness cannot be observed separately, in isolation, but as a ratio indica-tor.
Relatively measured, indebtedness by indicator Total debt /EBITDA com-panies could be observed in three groups (IMAD, 2014):
with negative indicator Total debt /EBITDA due to the negative EBITDA, with indicator 5>Total debt /EBITDA >= 0 and with indicator 5<Total debt /EBITDA – as over-indebted.
That grouping is not unique. It could be also found another interval of what is the optimum in indebtedness i.e. Entities in normal financial state show debt/ EBITDA ratio less than 3. Ratios higher than 4 or 5 usually set off alarms because they indicate that a company is likely to face difficulties in handling its debt burden, and thus is less likely to be able to raise addition-al loans required to grow and expand the business (IFRS financial reporting and analysis software).

25
Saša Muminović; EFFECT OF DEBT REDUCTION .. Journal of Accounting and Management, vol: 6; no: 1, 2016; page 21 - 32
Table 2: Market leader indebtedness indicators
2006 2007 2008 2009 2010 2011 2012 2013 2014Total debt /EBITDA -11.97 10.79 3.83 3.65 4.18 5.71 5.16 6.86 4.52Financial debt /EBITDA -6.64 6.29 2.10 1.85 1.76 2.59 2.49 2.63 1.66Financial debt / total debt 0.55 0.58 0.55 0.51 0.42 0.45 0.48 0.38 0.37Financial debt / total asset 0.33 0.34 0.31 0.25 0.19 0.23 0.23 0.19 0.17Long term debt/total debt 0.43 0.46 0.36 0.31 0.25 0.29 0.30 0.36 0.36
Source: Author’s calculations
Chart 2: Indebtedness of Slovenian dairy processing market leader (in mil.EUR)
Page 5 of 11
Source: AJPES and Author’s calculation
In 2009, when debt reduction was significant, indicator Total debt /EBITDA did not
improve significantly compared to 2008. It had improved in year 2008, before the crisis. In
following years, the indicator Total debt /EBITDA get worse and was in range 4.18 – 6.86
(Table 2).
The indicator financial debt / EBITDA is a representation of financial debt size compared
to EBITDA. Financial debt represents the amount of obligations the company owes that are
non-operational in nature. A ratio less than one indicates that the financial debt is less in size
relative to earnings (EBITDA). In Table 2, it can be seen that indicator financial debt /
EBITDA had never been less than one in period 2006-2014. However, in 2008 (before the
crisis begun) it decreased sharply from 6.29% to 2.10%. In following years the indicator was
in range 1.76 (2010) – 2.63(2013). That smaller amount of financial debt relative to EBITDA
does not indicate potential solvency issues.
The overall debt reduction was in the fact connected to financial debt reduction mostly
due to the credit crunch in Slovenia. In Table 2, it can be observed that from 2010, the share
of financial debt decreased in total debt and that share of financial debt decreased in total
assets. Before the crisis, the share of financial debt in total debt was in the range of 0.55-
0.58%, and in following years it was decreasing and reached 0.37% in 2014. Financial debt
share in financing total asset was 0.34 in 2007 and it was also decreasing in following years to
0.17% in 2014.
The values of the last selected indicator, the share of long-term debt in total debt, is also
presented in Table 2. It could be seen that time structure of debt was moved toward short term
financing.
-15.00
-10.00
-5.00
0.00
5.00
10.00
15.00
-20,000,000
0
20,000,000
40,000,000
60,000,000
80,000,000
2006 2007 2008 2009 2010 2011 2012 2013 2014
EBITDA total debt Financial debt
Total debt /EBITDA Financial debt /EBITDA
Source: AJPES and Author’s calculation
In 2009, when debt reduction was significant, indicator Total debt /EBITDA did not improve significantly compared to 2008. It had improved in year 2008, before the crisis. In following years, the indicator Total debt /EBITDA get worse and was in range 4.18 – 6.86 (Table 2).
The indicator financial debt / EBITDA is a representation of financial debt size compared to EBITDA. Financial debt represents the amount of obligations the company owes that are non-operational in nature. A ratio less than one indicates that the financial debt is less in size relative to earnings (EBITDA). In Table 2, it can be seen that indicator financial debt / EBITDA had never been less than one in period 2006-2014. However, in 2008 (before the crisis begun) it decreased sharply from 6.29% to 2.10%. In following years the indicator was

26
Saša Muminović; EFFECT OF DEBT REDUCTION .. Journal of Accounting and Management, vol: 6; no: 1, 2016; page 21 - 32
in range 1.76 (2010) – 2.63(2013). That smaller amount of financial debt relative to EBITDA does not indicate potential solvency issues.
The overall debt reduction was in the fact connected to financial debt re-duction mostly due to the credit crunch in Slovenia. In Table 2, it can be ob-served that from 2010, the share of financial debt decreased in total debt and that share of financial debt decreased in total assets. Before the crisis, the share of financial debt in total debt was in the range of 0.55-0.58%, and in following years it was decreasing and reached 0.37% in 2014. Financial debt share in financing total asset was 0.34 in 2007 and it was also decreasing in following years to 0.17% in 2014.
The values of the last selected indicator, the share of long-term debt in total debt, is also presented in Table 2. It could be seen that time structure of debt was moved toward short term financing.
4. INDEBTEDNESS AND PROFITABILITY
The positive relationship between changes in indebtedness and profit-ability measured by ROA and ROE indicates that additional borrowing gen-erates result. If there is no correlation the additional debt was not put in the function of business.
Chart 3: Profitability of Slovenian dairy processing market leader
Page 6 of 11
4. INDEBTEDNESS AND PROFITABILITY
The positive relationship between changes in indebtedness and profitability measured by
ROA and ROE indicates that additional borrowing generates result. If there is no correlation
the additional debt was not put in the function of business.
Chart 3: Profitability of Slovenian dairy processing market leader
Source: AJPES and Author’s calculation
Table 3: Regression Statistics
ROA changes vs TOTAL DEBT
changes
ROE changes vs TOTAL
DEBT changes
ROA changes vs FINANCIAL DEBT changes
ROE changes vs FINANCIAL
DEBT changes Multiple R 66.8% 73.7% 65.9% 71.7% R Square 44.6% 54.3% 43.4% 51.5% Adjusted R Square 36.6% 47.8% 35.4% 44.5% Standard Error 3.9% 8.0% 3.9% 8.3% Significance F 0.0494 0.0235 0.0535 0.0296 t Stat 2.372 2.883 2.319 2.724 P-value 0.049 0.024 0.053 0.030 Observations 9 9 9 9
Source: Author’s calculations
The degree of relationship between changes in profitability measured by ROA or ROE due
to the indebtedness changes shows medium positive (or strong) correlation (Table 3; Chart 4,
-0.30
-0.20
-0.10
0.00
0.10
0.20
2006 2007 2008 2009 2010 2011 2012 2013 2014
ROA ROE
Source: AJPES and Author’s calculation

27
Saša Muminović; EFFECT OF DEBT REDUCTION .. Journal of Accounting and Management, vol: 6; no: 1, 2016; page 21 - 32
Table 3: Regression Statistics
ROA changes vs TOTAL
DEBT changes
ROE changes vs TOTAL
DEBT changes
ROA changes vs FINANCIAL
DEBT changes
ROE changes vs FINANCIAL
DEBT changes
Multiple R 66.8% 73.7% 65.9% 71.7%R Square 44.6% 54.3% 43.4% 51.5%Adjusted R Square 36.6% 47.8% 35.4% 44.5%Standard Error 3.9% 8.0% 3.9% 8.3%Significance F 0.0494 0.0235 0.0535 0.0296t Stat 2.372 2.883 2.319 2.724P-value 0.049 0.024 0.053 0.030Observations 9 9 9 9Source: Author’s calculations
The degree of relationship between changes in profitability measured by ROA or ROE due to the indebtedness changes shows medium positive (or strong) correlation (Table 3; Chart 4, Chart 5, Chart 6, Chart 7). A statisti-cal measure of how well the regression line approximates the real data points or coefficient of determination was 0.446 for ROA changes vs TOTAL DEBT changes; 0.543 for ROE changes vs TOTAL DEBT changes; 0.434 for ROA chang-es vs FINANCIAL DEBT changes and 0.515 for ROE changes vs FINANCIAL DEBT changes. Values of t-tests and F-test are also presented in Table 3.
The higher degree of relationship (Multiple R) between changes in profit-ability measured by ROE than the one measured by ROA was expected due to the financial expenses, which are not considered in ROA calculation.

28
Saša Muminović; EFFECT OF DEBT REDUCTION .. Journal of Accounting and Management, vol: 6; no: 1, 2016; page 21 - 32
Chart 4: Total debt /EBITDA Line Fit Plot
Page 7 of 11
Chart 5, Chart 6, Chart 7). A statistical measure of how well the regression line approximates
the real data points or coefficient of determination was 0.446 for ROA changes vs TOTAL
DEBT changes; 0.543 for ROE changes vs TOTAL DEBT changes; 0.434 for ROA changes
vs FINANCIAL DEBT changes and 0.515 for ROE changes vs FINANCIAL DEBT changes.
Values of t-tests and F-test are also presented in Table 3.
The higher degree of relationship (Multiple R) between changes in profitability measured
by ROE than the one measured by ROA was expected due to the financial expenses, which
are not considered in ROA calculation.
Chart 4: Total debt /EBITDA Line Fit Plot
Source: Author’s calculation
The result indicates that with the increase of the debt increased the profitability and with
debt reduction the profitability decreased. Chart 5: Financial debt /EBITDA Line Fit Plot
-0.15
-0.10
-0.05
0.00
0.05
0.10
-15.00 -10.00 -5.00 0.00 5.00 10.00 15.00 RO
A
total debt /EBITDA
ROA Predicted ROA Linear (Predicted ROA)
Source: Author’s calculation
The result indicates that with the increase of the debt increased the profit-ability and with debt reduction the profitability decreased.
Chart 5: Financial debt /EBITDA Line Fit Plot
Page 8 of 11
Source: Author’s calculation Chart 6: Total debt /EBITDA Line Fit Plot
Source: Author’s calculation Chart 7: Financial debt /EBITDA Line Fit Plot
Source: Author’s calculation
5. CONCLUSION
-0.15
-0.10
-0.05
0.00
0.05
0.10
-8.00 -6.00 -4.00 -2.00 0.00 2.00 4.00 6.00 8.00
RO
A
finan.debt/EBITDA
ROA Predicted ROA Linear (Predicted ROA)
-0.30
-0.20
-0.10
0.00
0.10
0.20
-15.00 -10.00 -5.00 0.00 5.00 10.00 15.00
RO
E
total debt /EBITDA
ROE Predicted ROE Linear (Predicted ROE)
-0.30
-0.20
-0.10
0.00
0.10
0.20
-8.00 -6.00 -4.00 -2.00 0.00 2.00 4.00 6.00 8.00
RO
E
finan.debt/EBITDA
ROE Predicted ROE Linear (Predicted ROE)
Source: Author’s calculation

29
Saša Muminović; EFFECT OF DEBT REDUCTION .. Journal of Accounting and Management, vol: 6; no: 1, 2016; page 21 - 32
Chart 6 Total debt /EBITDA Line Fit Plot
Page 8 of 11
Source: Author’s calculation Chart 6: Total debt /EBITDA Line Fit Plot
Source: Author’s calculation Chart 7: Financial debt /EBITDA Line Fit Plot
Source: Author’s calculation
5. CONCLUSION
-0.15
-0.10
-0.05
0.00
0.05
0.10
-8.00 -6.00 -4.00 -2.00 0.00 2.00 4.00 6.00 8.00
RO
A
finan.debt/EBITDA
ROA Predicted ROA Linear (Predicted ROA)
-0.30
-0.20
-0.10
0.00
0.10
0.20
-15.00 -10.00 -5.00 0.00 5.00 10.00 15.00
RO
E
total debt /EBITDA
ROE Predicted ROE Linear (Predicted ROE)
-0.30
-0.20
-0.10
0.00
0.10
0.20
-8.00 -6.00 -4.00 -2.00 0.00 2.00 4.00 6.00 8.00
RO
E
finan.debt/EBITDA
ROE Predicted ROE Linear (Predicted ROE)
Source: Author’s calculation
Chart 7: Financial debt /EBITDA Line Fit Plot
Page 8 of 11
Source: Author’s calculation Chart 6: Total debt /EBITDA Line Fit Plot
Source: Author’s calculation Chart 7: Financial debt /EBITDA Line Fit Plot
Source: Author’s calculation
5. CONCLUSION
-0.15
-0.10
-0.05
0.00
0.05
0.10
-8.00 -6.00 -4.00 -2.00 0.00 2.00 4.00 6.00 8.00
RO
A
finan.debt/EBITDA
ROA Predicted ROA Linear (Predicted ROA)
-0.30
-0.20
-0.10
0.00
0.10
0.20
-15.00 -10.00 -5.00 0.00 5.00 10.00 15.00
RO
E
total debt /EBITDA
ROE Predicted ROE Linear (Predicted ROE)
-0.30
-0.20
-0.10
0.00
0.10
0.20
-8.00 -6.00 -4.00 -2.00 0.00 2.00 4.00 6.00 8.00
RO
E
finan.debt/EBITDA
ROE Predicted ROE Linear (Predicted ROE)
Source: Author’s calculation
5. CONCLUSION
Even though it is very important in overall company`s performance, in-debtedness of a company itself is not important if the funds are used well (profitability issue) and the debt repayments are regular (liquidity issue).

30
Saša Muminović; EFFECT OF DEBT REDUCTION .. Journal of Accounting and Management, vol: 6; no: 1, 2016; page 21 - 32
The case of the market leader of Slovenian dairy processing industry pre-sented in this paper showed that debt reduction was significant in absolute figures and relatively. Also, it had impact on profitability measured by ROA and ROE indicators. That pointed out that borrowed money was properly in the function of core business and that debt reduction and credit crunch created problems in Slovenian dairy industry represented here by market leader. So, the both hypothesis of this research were confirmed.
Of course, debt reduction cannot take all blame for bad results: in last ob-served year– 2014 the profitability increased. There are numerous factors that could be analysed, such as prices, competition, milk quotas in the past, capac-ity usage (which is approximately up to 70% -IMAD, 2008) productivity and efficiency. This could be explored in further research.
REFERENCES1. The Agency of the Republic of Slovenia for Public Legal Records and Related Services -
AJPES http://www.ajpes.si/?language=english (accessed: February 2016).2. Chapman, R.J. (2012). Appendix 5: Financial Ratios, in Simple Tools and Techniques for
Enterprise Risk Management, Second Edition, John Wiley & Sons, Ltd., Chichester, West Sussex, UK.
3. European Commission (2014). Macroeconomic Imbalances, Slovenia 2014. Occasional Pa-pers 187, March 2014.
4. EUROSTAT, www.eurostat.eu (accessed: February 2016).5. Institute of Macroeconomic Analysis and Development - IMAD (2014). Indebtedness and
deleveraging of Slovenian firms, Economic Issues 2014. http://www.umar.gov.si/fileadmin/user_upload/publikacije/izzivi/2014/an-EI14_splet.pdf (accessed: March, 2015)
6. Institute of Macroeconomic Analysis and Development - IMAD (2008). Ekonomsko ogledalo, 1. http://www.umar.gov.si/fileadmin/user_upload/publikacije/eo/2008/og0108/eo0108.pdf#15 (accessed: March, 2015)
7. IFRS financial reporting and analysis software, http://www.readyratios.com/reference/debt/debt_ebitda_ratio.html (accessed: : February, 2016)
8. Ljubljanske mlekarne: http://www.l-m.si/sl/o-nas.html#letna-porocila9. Muminović, S., Pavlović, V. (2012). Profitability of Dairy Industry in Slovenia, Croatia and
Serbia. Mljekarstvo 62 (2), 96-110.10. Muminović, S. & Aljinović Barać, Ž. (2015). Does productivity affect profitability in dairy pro-
cessing industry? Evidence from Slovenia, Croatia and Serbia. Mljekarstvo 65 (4), 269-27911. O’Regan, P. (2006). Financial Information Analysis, John Wiley and Sons, Glasgow.12. Sila, U. (2015), “Restoring the financial sector and corporate deleveraging in Slovenia”, OECD
Economics Department Working Papers, No. 1243, OECD Publishing, Paris. http://dx.doi.org/10.1787/5jrxml3x8vq0-en (accessed: February, 2016)
13. Slovenia’s Smart Specialisation Strategy S4 / Slovenska Strategija Pametne Specializacije – S4, September 2015 http://www.svrk.gov.si/fileadmin/svrk.gov.si/pageuploads/Dokumen-ti_za_objavo_na_vstopni_strani/S4_dokument_potrjeno_na_VRS_150920.pdf (accessed: February 2016).
14. Slovenian Public Agency for Entrepreneurship, Internationalization, Foreign Investment and Technology - SPIRIT Slovenia. http://www.investslovenia.org/business-environment/financial-market/financial-service-sector/ (accessed: : February, 2016)

31
Saša Muminović; EFFECT OF DEBT REDUCTION .. Journal of Accounting and Management, vol: 6; no: 1, 2016; page 21 - 32
15. Van Berkun, S. (2009). An Assessment of the Competitiveness of the Dairy supply Chain in New Member States, Candidate and Potential Candidate Countries. AgriPolicy, Enlargement Network for Agripolicy Analysis,http://www.euroqualityfiles.net/AgriPolicy/Report%202.1/AgriPolicy%20Synthesis%20report%20Dairy%20Chain%20Analysis%20May%202009.pdf. (accessed: : February, 2016)
16. Vidakovic, N. & Zbašnik, D. (2014). Capital Flows, Credit Crunch and Deleveraging Dynamics: The Case of Slovenia, Croatia and Hungary in Comparison. MPRA Paper https://mpra.ub.uni-muenchen.de/63958/ (accessed: : February, 2016)
UČINAK SMANJENJA DUGA NA PROFITABILNOST NA PRIMJERU SLOVENSKOG VODEĆEG PROIZVOĐAČA MLJEKARSKIH PROIZVODA
SAŽETAK RADA:Sama razina zaduženosti u absolutnom iznosu promatrana izolirano, sama po sebi
ne daje odgovor da li je trgovačko drtuštvo ili industija prezadužena ili ne. Zadužensot se mora promatrati u kombinaciji s indikatorima koji ukazuju na stvaranje vrijednosti, odnosno da li se i kako se pozajmljena sredstva koriste. S početkom krize u Sloveniji i industrija prerade mlijeka u Sloveniji, predstavljena tržišnim liderom, pratila je trend razduživanja, ali razduživanje u absolutnom iznosu nije značajno poboljšalo perfor-manse profitabilnosti.
Ključne riječi: zaduženost, mliječna industrija, kriza, profitabilnost


33
Journal of Accounting and Management, vol: 6; no: 1, 2016; page 33 - 44
Professional PaperUDK: 657.3.
Paper received: 04/05/2016Paper accepted: 16/05/2016
HISTORY OF ACCOUNTING AND ACCOUNTANCY PROFESSION IN GREAT BRITAIN
Dubravka Paris, MA, RRiF College of Financial Management, Zagreb, [email protected]
ABSTRACTAccounting has always been a part of our history, but it became prominent when
monetary systems were introduced. The article presents the important events in the English history from the Middle Ages till today and includes the most important per-sons who lived in these periods. Due to the fact that the primary goal of the article is to present the history of accounting and accountancy profession, the review starts with the period of the 14th century when accountants were mentioned for the first time. It presents the development of accounting and accountancy professions and their im-portance in all the periods of human history.
Key words: accounting, accountancy profession, double-entry bookkeeping, history of Great Britain, associations of accountants, ICAEW.
1. INTRODUCTION
The history of accounting and accountancy profession is thousands of years old. The early development of accounting dates back to the ancient Mesopotamia and is closely related to developments in writing, counting and money and early auditing systems by Egyptians and Babylonians.
When medieval England moved towards a monetary economy in the 13th century, merchants depended on bookkeeping to oversee a great number of transactions financed by bank loans. The important breakthrough took place

34
Dubravka Paris, HISTORY OF ACCOUNTING... Journal of Accounting and Management, vol: 6; no: 1, 2016; page 33 - 44
through the introduction of double-entry bookkeeping system in the 15th century.
The expansion of commerce and business expanded the role of the account-ant. The knowledge of accounting methods was often picked up through expe-rience at work, with basic double-entry bookkeeping being taught at school. There were few professional accountants before the nineteenth century, and their business was at first largely based on dealing with the affairs of bankrupts. The emergence of a corporate sector created a demand for skilled auditors and investigators. The modern profession of the chartered accountant originated in Scotland in the nineteenth century. During this time, accountants often be-longed to the same associations as solicitors. The accountancy profession is con-stantly improving and has become one of the most appreciated professions.
2. BEGINNINGS OF ACCOUNTANCY PROFESSION
The period of the 14th and 15th centuries was marked by the beginning of the Hundred Year’s War and the epidemic of bubonic plague, which killed one third of England. Among five kings who ruled England in this period, the most famous and historically important ruler was Henry VIII (1491-1547).
Around the year of 1300, accountants are mentioned in historical records for the first time in the Statute of Westminster indicating they are considered important.
Italy is important in this period due to the fact that in 1327 early books from the commune of Genoa display an early form of bookkeeping. The Italian trading period sees sophisticated accounting systems developed within bank-ing houses. Double-entry bookkeeping is discovered. In 1494 Luca Pacioli de-scribes double-entry bookkeeping in his work Summa di Arithmetica, printed in Venice.
3. RENAISSANCE
It was under Henry VIII that England started exploring the globe and trad-ing outside Europe, which was greatly developed to colonial proportions un-der his daughters Mary I and especially Elizabeth I.
The great Virgin Queen Elizabeth I played an important role in the first golden age of England. It was an age of great navigators like Sir Francis Drake and Sir Walter Raleigh, an age of enlightenment with the philosopher of Fran-cis Bacon and the playwrights such as Christopher Marlowe and William Shake-speare.

35
Dubravka Paris, HISTORY OF ACCOUNTING... Journal of Accounting and Management, vol: 6; no: 1, 2016; page 33 - 44
In 1543 an English work by Hugh Oldcastle with the title A Profitable Trea-tyce dealing with Debitor and Creditor was printed in London. After three years the English translation of Jan Ympyn Christoffels’ work entitled A Notable and very excellente woorke, expressyng and declaryng the maner and forme how to kepe a boke of accomptes or reconynges was printed in Antwerp. In 1553 the third book in English on double-entry bookkeeping entitled The Maner and fourme how to kepe a perfecte reconyng, after the order of...debitour and credi-tour by James Peele is printed in London by the King’s Printer, Richard Grafton. Grafton is credited by historians for introducing double-entry book-keeping to England.
4. RESTORATION (17TH CENTURY)
The 17th century England is characterized by religious troubles and the Civil War. The King James’ successor Charles I was eager to unify Britain and Ire-land, which eventually culminated in the English Civil War (1642-1658). Charles was beheaded and the puritan leader of the Parliamentarians Oliver Cromwell ruled the country until his death in 1658.
These events were followed by the period of Restoration under the reign of Charles II, who was the patron of the arts and sciences
Despite 14 illegitimate children, he was succeeded by his Catholic and un-popular brother James, whose religious inclinations and despotism led to his quick removal from power in the Glorius Revolution of 1688.
His Protestant daughter Mary married to his equally Protestant nephew William of Orange. During this period the Parliament ratified that all kings and queens would have to be Protestant from then on.
In view of accounting the year of 1635 saw another English work printed: The Merchants’ Mirror, or directions for the perfect ordering and keeping of ac-counts, framed by the way of Debitour and Creditour after the Italian manner, by Richard Dafforne. Robert Colinson printed in 1683 the first Scottish book on accountancy entitled Idea Rationaria, or the perfect accomptant, necessary for all merchants.
5. GEORGIAN ERA (18TH CENTURY)
The period between 1660 to1727 was characterized by the reign of George I. When he arrived in England he did not speak a word of English. The king’s inability to communicate well with his government and subjects led him to appoint a Prime Minister. This marked a turning point in the British politics, as future monarchs remained more passive figures, letting the Prime Minister reign the country.

36
Dubravka Paris, HISTORY OF ACCOUNTING... Journal of Accounting and Management, vol: 6; no: 1, 2016; page 33 - 44
His son George II was a powerful ruler. The British Empire expanded con-siderably during his reign.
Among some notable changes, important is the replacement of the Julian Calendar by the Gregorian Calendar in 1752.
George III had one of the most troubled reigns in the British history. He came to the throne during the SevenYears’ War (1756-1763), after which the UK acquired New France (Quebec), Florida and most of French India. In 1776, the American War of Independence started after the British government imposed a series of taxes on the colonies. Seven years later the French Revolution broke out.
With the development of investment in stocks, import and export activi-ties were reaching the peak. Accordingly, the accounting profession had to evolve and adapt to maintain the movement of assets and profits within vari-ous industries.
In 1780 Josiah Wade founded “Tribe Clarke and Company” – the account-ancy firm in Bristol. This company is the oldest firm to trace its continuous ex-istence.
6. VICTORIAN AGE (19TH CENTURY)
During the early years of the 19th century Britain had to face the ambitions of Napoleon to conquer the whole of Europe. Two famous victories – Admi-ral’s Nelson’ naval victory at Trafalgar and Wellington’s victory at Waterloo rein-forced the international position of the United Kingdom.
Another notable fact of this period is the start of the Industrial Revolution with James Watt’s invention of steam engine and the introduction of mecha-nisation of the manufacturing industry. Great industrial cities emerged as the new economic centres of the country.
In 1837 queen Victoria came to the throne. Britain asserted its hegemony on virtually every part of the globe. However, this resulted in numerous wars (Opium Wars, Boer Wars, the Crimean War). The latter years of her reign were characterized by the legalisation of trade unions, introduction of universal ed-ucation and universal suffrage.
More experienced accountants needed to pass on their beliefs as to what constituted sound accounting practice to newcomers, and this led to the writ-ing of textbooks and the publication of dedicated periodicals. The most im-portant of these was The Accountant, which was founded in 1876, and con-tained many articles by accountants debating issues of financial reporting and accounting measurement.

37
Dubravka Paris, HISTORY OF ACCOUNTING... Journal of Accounting and Management, vol: 6; no: 1, 2016; page 33 - 44
Important books on accounting principles from the late nineteenth and early twentieth centuries include Francis Pixley’s Auditors: Their Duties and Responsibilities (1881), Ewing Matheson’s The Depreciation of Factories (1884), Emile Garcke and John Manger Fells’s Factory Accounts (1887) and Lawrence Dicksee’s Auditing: A Practical Manual for Auditors (1892) and Advanced Ac-counting (1903).
In 1831 A Bankruptcy Act was passed mentioning accountants alongside merchants and bankers as properly skilled to conduct audits. It is the first pub-lic recognition of accountants. In 1842 the Relief of Insolvent Debtors Act cre-ates a new source of labour for accountants as it requires debtors owing less than £300 to attach a statement of debts when petitioning the Bankruptcy Court. In the period between 1853 a number of institutes of accountants were established in Scotland.
The Companies Act, passed in 1862, established the role of Official Liqui-dator, a person responsible for proceedings in the liquidation of public com-panies.
In the period from 1870 to 1877, bodies of accountants form in London, Liverpool, Manchester and Sheffield. The ICAEW starts its early life as a volun-tary association called the Institute of Accountants in London. At first it does not admit practitioners from the provinces. This was not done until 1872. The idea to establish a professional association of accountants by means of the Royal Charter was initiated by William Quilter, who formed a voluntary Associa-tion called the Institute of Accountants in London in 1870. They signed a draft copy of the rules and regulations for the new Institute of Accountants, which was formed in the same year.
In 1871 The Council of the Institute of Accountants in London appoints a committee of examiners for new entrants. Candidates are examined viva voce (by oral interview).
In 1872 a special meeting of the Council of the Institute of Accountants in London was held to discuss widening the scope of the Institute to include accountants from the provinces. Membership is accordingly widened to ac-countants throughout the UK. The name is changed from Institute of Account-ants in London to Institute of Accountants.
In 1877 the Institute of Accountants begins to prepare an index of useful cases affecting the profession. Relevant reference, law books and reports are purchased and copies of the accounts of railway, banking, and other public companies are requested for the Institute’s Library. A clerk’s register is estab-lished, including the examination system for the admission of new associate members.
38
Dubravka Paris, HISTORY OF ACCOUNTING... Journal of Accounting and Management, vol: 6; no: 1, 2016; page 33 - 44
In 1878 the Council of the Institute of Accountants resolved to improve its status by incorporation through an Act of Parliament. In the following year the Companies Act was passed requiring all banks to have properly audited accounts.
In 1880 the Royal Charter Order in Council was signed by Queen Victoria creating the new professional body called The Institute of Chartered Account-ants in England & Wales (ICAEW)..
The following years comprised the early organisation of ICAEW, the setting of standards for professional conduct, the construction of Chartered Account-ants’ Hall and the first application for ICAEW membership made by a woman.
In 1883 a new Bankruptcy Act was passed establishing the position of Offi-cial Receiver. This removed insolvency from accountants. Thereafter, all monies held by trustees in bankruptcy had to be turned over to the Board of Trade’s Bankruptcy Estates Account. The ICAEW Council was criticised for not protest-ing against it.
In 1888 The ICAEW refused admission to the first application for member-ship made by a woman, Mary Harris Smith.
In 1893 the Chartered Accountants’ Hall was opened. In the same year the Society of Accountants and Auditors proposed strengthening the profession. Its recommendations became the Public Accountants Bill No. 1 calling for their members and those of the ICAEW alone to constitute the profession and bar all others from practising. A Public Accountants Bill No. 2 was drafted by the ICAEW calling for the registration their members to prevent all others from practising as public accountants. However, both failed.
7. FIRST WORLD WAR
Victoria’s numerous children married in about all European families, which owned her the title of “grandmother of Europe”. When Franz Ferdinand of Aus-tria was assassinated in Sarajevo and Austria declared war on Serbia, it was in turn allied to France, Russia and the UK. The First World War left nearly 1 million Britons dead and financially ruined the country. The nation was disillusioned with the government and monarchy.
The World War One brought an increase in accountancy work and account-ants gained expertise in managing companies and banks, particularly those of enemy states. Accountants assisted in the control of costs in relation to the production of ammunitions: management accounting is born. Wartime taxes increased the amount of taxation work available to accountants.

39
Dubravka Paris, HISTORY OF ACCOUNTING... Journal of Accounting and Management, vol: 6; no: 1, 2016; page 33 - 44
In 1914 the Prince of Wales National Relief Fund was formed. A Board of Audit Control was appointed to supervise income and control distribution. Lo-cal committees throughout the UK were formed and Institute members oper-ated it for no remuneration. The Local Legislative Committee created an ‘audit clause’ by stating that where professional audit is used, the standards of the ICAEW and those of Society of Incorporated Accountants and Auditors alone should apply. This prevented new bodies of accountants from undertaking this range of work.
In 1918 the Society of Incorporated Accountants and Auditors changed their rules to allow the admission of women.
8. PERIOD BETWEEN TWO WARS
Since the end of the World War I there had been a major downturn in the British economy. Government promised a higher standard of living and secu-rity of employment. However, the productivity rate was falling rapidly due to the fact that it was a great effort to keep the traditional industries (cotton, coal mining and shipbuilding), which was difficult among the growing competi-tion. The political program of the Labour Party increased social security meas-ures. Workers received the “dole”, which was probably the reason why there were no greater social unrests or revolutions.
Further mass unemployment resulted when Chancellor of the Exchequer Winston Churchill returned Britain to the gold standard in 1925. The return was made at the old pre-war gold and dollar value of the pound. As a result, the pound was devalued; British goods (coal, steel, machinery, textiles, ships, car-go rates and other goods and services) became over-priced, and Britain’s share of the world export market declined rapidly. The resulting unemployment and wage cuts caused serious repercussions in the industrial areas, where strikes became common.
In the 1930’s things improved a little under a national government. The abandonment of the gold standard and the decision to let the pound find its own value against the US dollar made British export prices more competitive in world markets. Agriculture was protected through introduction of protec-tive tariff and import quotas in 1931. A building boom followed the increase in population. Old industries were replaced by new ones such as automobiles, electrical manufactures, and chemicals.
In 1919 Mary Harris Smith, a public accountant with a London Practice who was refused admission to the ICAEW because she was a woman in 1888, applied to join the Society of Incorporated Accountants and Auditors. The So-ciety made her an Honorary Fellow as they had previously given up Council

40
Dubravka Paris, HISTORY OF ACCOUNTING... Journal of Accounting and Management, vol: 6; no: 1, 2016; page 33 - 44
powers to elect members in special cases without examination. In the same year the Sex Disqualification (Removal) Act was passed making it illegal for the ICAEW to bar women from membership. Mary Harris Smith renewed her ap-plication and became the first woman Chartered Accountant in the world. In 1920 Miss H. M. Claridge, the daughter of the President of the ICAEW that year, is the first woman to be admitted to the Society of Incorporated Accountants and Auditors by examination.
In 1923 British Association of Accountants and Auditors was formed. Four years later the Faculty of Auditors was formed.
In 1929 Sir Thomas Robinson, Chairman of the House of Commons Com-mittee, called for the accounting professionals to set up a register of properly qualified persons to prevent unqualified persons from practising under the definition of the Revenue Act 1903 and the Income Tax Act 1918. In 1931 the Association of International Accountants was formed. In the period from 1933 till the beginning of the Second World War a number of associations of ac-countants working in various fields of industry were formed.
9. SECOND WORLD WAR
When Edward VIII abdicated in 1936, he was succeeded by his brother George VI. In this period the Nazis in Germany were becoming more menacing as Hitler grew more powerful and aggressive. Finally, Britain was forced to de-clare war to Germany after the German invasion of Poland in September 1939. Sir Winston Churchill became the war-time Prime Minister in 1940.
During the World War Two the area around Moorgate Place was badly damaged during bombing raids on London but the Chartered Accountants’ Hall escaped save with a few broken windows. Approximately 3000 Institute members, over a quarter of the membership, served with the Armed Forces.
In 1939 the Association of Certified and Corporate Accountants was formed following the merger of the Corporation of Accountants in Scotland and the London Association of Certified Accountants.
In 1941 the value of accountants in the management of the war effort started a movement to give non-practising members some influence in the ICAEW and possibly representation on the Council.
In 1945, ICAEW organised weekend ‘refresher’ courses and regional lec-tures for returning servicemen in the profession. This later developed into a programme of ‘Continuing Professional Development’ that is still in operation today.

41
Dubravka Paris, HISTORY OF ACCOUNTING... Journal of Accounting and Management, vol: 6; no: 1, 2016; page 33 - 44
10. POSTWAR PERIOD
In 1945 the UK was bankrupt and its industry destroyed. It was gradual-ly dismantled by granting independence to its former colonies in the period from 1947 to 1980’s. Most of these ex-colonies formed the Commonwealth of Nations (approx.. 1.8 bn people).
Elizabeth II ascended the throne in 1952. Although she tried to rehabilitate the image of the monarchy, her children did not, making the headlines of the tabloid newspapers.
The 70’s brought the oil crisis and the collapse of the British industry. The Conservative Prime Minister Margaret Thatcher privatised railways and closed down inefficient factories, which resulted in the increased gap between the rich and the poor.
Thatcher was succeeded in her party by the unpopular John Major. How-ever in 1997, Tony Blair became a Prime Minister. His liberal policies and the support of the neo-conservative US President George W.Bush disappointed many Leftists.
The 1950s and early 1960s were a period of complacency for accountants, who were experiencing a boom in the profession. Several thousand account-ants were qualifying annually, and accountancy careers became attractive to university graduates.
During the 1950s and 1960s, the largest accounting firms became increas-ingly international, with long-standing British firms merging with leading North American firms and US firms such as Arthur Andersen opening offices in London and other British cities. The “Big Eight” accounting firms had their own procedures for attempting to ensure consistent practice from one office to another, and this helped to create a climate for accounting standards issued by an authoritative organisation. The Accountants International Study Group (AISG) was established in 1966 to bring together representatives from the USA, Canada and the UK in order to identify best accounting practice.
The year of 1968 is very important for the accountancy profession. The ICAEW proposed two major changes to the profession. Firstly, a merger of the ICAEW, ICAS, ICAI, the Association of Certified Corporate Accountants, the In-stitute of Cost and Works Accountants and the Institute of Municipal Treas-urers and Accountants into three geographical Institutes in England & Wales, Scotland and Ireland. Secondly, a reduction of the number of qualifications to two: the Chartered Accountant (signifying highly qualified) and the Licentiate Accountant (less qualified).
In the 70s a number of associations changed their names. In 1973, the Fac-ulty of Auditors was absorbed by the British Association of Accountants and

42
Dubravka Paris, HISTORY OF ACCOUNTING... Journal of Accounting and Management, vol: 6; no: 1, 2016; page 33 - 44
Auditors. In the same year the International Association of Book-keepers was founded.
In 1977 the International Federation of Accountants (IFAC) was founded.
11. CONTEMPORARY ENGLAND (21ST CENTURY)
Nowadays, the English economy relies primarily on services. The main in-dustries are tourism, education, music, fashion, prestige cars and food.
In 2002 the International Accounting Standards were adopted by the Eu-ropean Union with changeover target of 2005. In the same year the Proceeds of Crime Act made it an offence for accountants not to report suspicions about their clients to the National Criminal Intelligence Service (NCIS).
In 2003 the Institute of Company Accountants merged with the Associa-tion of International Accountants.
CONCLUSION
Accounting is an almost ancient system of keeping and maintaining the financial records of a business. It has always been a part of our history, but it became prominent when monetary systems were introduced.
The most significant development with regards to modern accounting oc-curred during the Renaissance period in Italy. In 1494 the accountancy world was revolutionised by an Italian friar by the name of Luca Pacioli and his book ‘Summa de Artihmetica, Geometria, Proportioni et Proportionalita’. He de-scribed and explained many accounting practices that are still used today, in-cluding double entry book keeping, the use of ledgers, inventories, liabilities and expense accounts.
As the various industries of the world have developed, so too have their accounting needs. This is most apparent during the industrial revolution. As production and manufacturing industries were developing, businesses needed more effective ways of cost accounting.In1854 the first professional accounting institution was formed in Scotland, making the accountancy pro-fession official. Since the formulation of the ‘chartered account’ the profession has grown rapidly. Spreading to every corner of the globe, the need for an accountant is a must, especially within business. Accountants can help with many aspects of business whether it is designing and setting up an accounting system or simply ensuring that tax payments are correct.
The profession has a rich heritage steeped in a cross cultural history, from humble beginnings in the15th century Italy to the forefront of the financial world. The profession has never been more popular.

43
Dubravka Paris, HISTORY OF ACCOUNTING... Journal of Accounting and Management, vol: 6; no: 1, 2016; page 33 - 44
REFERENCES1. Oxford English Dictionary, Oxford University Press, 20102. Don McCubbrey. “A short history of accounting and double entry bookkeeping.” Business
Fundamentals. Boundless, 21 Jul. 2015. Retrieved 25 Apr. 20163. Parker, R. H. and Yamey, B. S. (eds) (1994) Accounting History: Some British Contributions.
Oxford University Press, Oxford.4. Bryer, R. A. (2000a) The history of accounting and the transition to capitalism in England. Part
one: Theory, Accounting, Organizations and Society, Vol. 25, No. 2, pp. 131-162.5. Bryer, R. A. (2000b) The history of accounting and the transition to capitalism in England.
Part two: Evidence, Accounting, Organizations and Society, Vol. 25, Nos. 4-5, pp. 327-381.6. Edey, H. C. and Panitpakdi, P. (1956) British company accounting and the law: 1844-1900,
in Littleton, A. C. and Yamey, B. S. (eds) Studies in the History of Accounting, pp. 356-379. Sweet and Maxwell, London.
7. Edwards, J. R. (1979) The accounting profession and disclosure in published reports, 1925-1935, in Lee, T. A. and Parker, R. H. (eds) The Evolution of Corporate Financial Reporting, pp. 275-298. Nelson, Sunbury-on-Thames.
8. Edwards, J. R. (1989) A History of Financial Accounting. Routledge, London.9. Berndt, R. (1980) A History of the English Language, VEB Verlag Enzyklopaedie, Leipzig10. Baugh, A.C. and Cable, T. (1989): A History of the English Language, Routledge, New York.11. Hoad, T.F. (1986): The Concise Oxford Dictionary of English Etymology, Oxford University
Press, Oxford.12. History of England - https://en.wikipedia.org/wiki/History_of_England 13. A Brief History of England - http://www.eupedia.com/england/english_history.shtml14. Jenkins, S.: A Short History of Britain, Profile Books Ltd, London15. Dictionary of Accounting Terms - http://www.alphadictionary.com/directory/Specialty_Dic-
tionaries/Accounting/

POVIJEST RAČUNOVODSTVA I RAČUNOVODSTVENE STRUKE U VELIKOJ BRITANIJI
SAŽETAK RADA:Računovodstvo je oduvijek dio ljudske povijesti, ali je postalo osobito važno
uvođenjem monetarnog sustava. Članak predstavlja najvažnije povijesne trenutke u Engleskoj od srednjeg vijeka do danas, kao i najvažnije osobe koje su živjele u tim razdobljima. Obzirom da je osnovni cilj članka predstaviti povijest računovodstva i ra-čunovodstvene struke, pregled započinje s razdobljem četrnaestog stoljeća kada se računovođe kao struka spominju po prvi put. Članak daje prikaz razvoja računovod-stva i računovodstvene struke i naglašava njihovu važnost u svim razdobljima ljudske povijesti.
Ključne riječi: računovodstvo, računovodstvena struka, dvostavno knjigovod-stvo, povijest Velike Britanije, udruge računovođa, ICAEW.

45
Journal of Accounting and Management, vol: 6; no: 1, 2016; page 45 - 58
Professional PaperUDK: 658.8
Paper received: 06/04/2016Paper accepted: 16/05/2016
THE PERSUASIVE FUNCTION OF RHETORIC IN ADVERTISING SLOGANS
Urszula Michalik, PhDThe University of Silesia, Katowice, PolandThe University of Silesia, Katowice, [email protected]ława Michalska-Suchanek, PhDThe University of Silesia, Katowice, PolandThe Gliwice Academy of Entrepreneurship, Gliwice, Poland
ABSTRACTThe current article discusses the use and purpose of rhetorical figures in adverti-
sing slogans. The choice of words and techniques used by copywriters may strengthen the conviction of prospective buyers that by buying an offered product they may get more than products or services i.e. they may get the features they are looking for, and they may fulfil their needs and achieve satisfaction. The body of 49 advertising slogans of cars and airplanes has been chosen for the analysis. The choice is not a random one since all the slogans concern very popular means of transportation, and focus on fea-tures which are very important, and therefore sought by both drivers and passengers. Finally, the features have been used to create a schema for the advertised products.
Key words: slogan, rhetorical figures, identity, schema, persuasion, competition
INTRODUCTION
The omnipresence of advertising messages causes that many people may not notice some of them, or even ignore them. Thus, copywriters have a very challenging and difficult task to perform since they not only have to attract and sustain people’s attention to what they ‘say’ about a product, but they

46
Urszula Michalik,et al., THE PERSUASIVE FUNCTION... Journal of Accounting and Management, vol: 6; no: 1, 2016; page 45 - 58
also have to use methods and techniques that make people remember the message. They have to bear in mind that contemporary customers can choose from a large number of offers, and as a result they are becoming more and more sophisticated, demanding and fastidious. What is more, there is a cut-throat competition in most of the markets, and every company has to be very watchful if it does not want to lose the edge. One of the devices, which is a part of almost every advertisement is a slogan, whose persuasive power is consid-erable and as such it deserves to be investigated.
1. THE FUNCTION AND POWER OF RHETORIC AND PERSUASION.
Every effort companies make to sell something makes use of persuasion. Most of the definitions of persuasion include words such as motivation, influ-ence, values, beliefs and wants. Even the simplest ones that are provided by dictionaries, for example, “ Persuasion is the process of persuading someone to do or believe something” refer to its power to influence somebody’s decisions and actions.1 The definition of persuasion that seems to be very relevant for the purpose of the present article comes from Harvard Business School „Persuasion is a process that enables you to change or reinforce others’ attitudes, opinions or behaviours […]. What is more, persuasion is not only a matter of making a rational case but also of presenting information in a way that appeals to fundamental human emotions. It’s about positioning an idea, approach, or solution in a way that appeals to the people who are affected by it”2. In the light of the above fea-tures and characteristics persuasion is often linked to rhetoric, which also aims at attracting attention, influencing and gaining compliance of the recipient of the message. The rhetor, through using appropriate techniques can convince his/her audience to his/her point of view and influence their ways of thinking, and/or making a decision “The user of rhetoric peddles choices, even though most peo-ple naturally resist making choices unless forced to do so”.3 Copywriters use rhe-torical figures, which are modes of persuasion used to reach and win customers as well influence their purchasing decisions. They employ a variety of techniques and strategies, which are supported by the language they choose to convey mes-sages to an audience. The power of language and its ability to penetrate entire communities and their cultures, its ability to shape a world view is enormous and can never be underestimated4. The rhetorical devices that have been employed
1 MacMillan English Dictionary For Advanced Learners. Bloomsberry Publishing: Oxford 2002, p.1057.2 Persuading people. Expert Solutions to Everyday Challenges. Boston, Massachusetts: Harvard Business
Press 2008, p. 4.3 Hart, R.P.,Daughton, S.: Modern rhetorical criticism (third edition).New York: Allyn& Bacon 2005, p.86.4 c.f. Čulenová, E.: Jazyk. Matricaaleboplášť? Banská Bystrica: Fakultahumanitných vied Univerzity Mateja Bela
2012, p. 136.
47
Urszula Michalik,et al., THE PERSUASIVE FUNCTION... Journal of Accounting and Management, vol: 6; no: 1, 2016; page 45 - 58
in the analysed slogans are as follows: alliteration, hyperbole, rhyme, repetition, personification, rhetorical question, idiom, simile, oxymoron as well as gram-matical forms such as pronouns, verbs, nouns and adjectives.
2. SLOGAN AS A FUNDAMENTAL ASPECT OF ADVERTISEMENT
Given the large number of advertisements that bombard us on a daily ba-sis it is obvious that we cannot remember most of what we see or hear. Thus, a slogan which is usually short, seems to be one of the easiest ways to attract and hold our attention. The word slogan comes from a Celtic word slaugh= army +gharim+war, which can be understood as a ‘war cry’. Therefore, the lan-guage used in slogans is often perceived as a powerful weapon.5 Slogans are used to establish brand’s identity, raise awareness of a product, stimulate in-terest, create a desired image and secure a position on the market that will enable the company not only to reach its sales targets, but also effectively compete with rival products. The definition of a slogan that comprises most of its features has been provided by Ranju and MukeshTrehan “It is a short, simple phrase or a catchy sentence which is easy to remember, sweet, easily pronounceable, pleasing to ear […]. It should be related to product-features, product-quality, product superiority, etc. Sometimes a brand-name of a prod-uct is also mentioned in a slogan and helps increase the chance that it will be remembered (popular slogans can be used for number of years). Slogans can also act as headlines. Slogans are also called punch lines or jingles”6. To sum up the most important features of slogans they are: short (usually 3-5 words); should inform about the features of a product e.g. Protection on all sides (Audi); should be simple e.g. Always Coca-Cola; should differentiate the brand and refer to the needs of the customer, e.g. Designed to save lives (Volvo); should recall the brand name e.g. Have you driven Ford lately?; shouldinclude a key benefite.g. Hospitality at the highest leveland be memorable e.g. Skoda Simply clever(Skoda). Since slogans are one of the key methods to make a positive im-pression and encourage purchase they should be carefully invented. The rea-son is that they should be compatible with other marketing and advertising strategies employed by companies; should inform customers about conditions and situations in which a particular brand is a good choice and how potential buyers will benefit from a particular product. The knowledge they may gain from a slogan can be considerable and concern product attributes, functions, benefits and its purpose. This is what advertising actually aims to achieve i.e. inform about what people need and want to know before making a purchas-ing decision.
5 cf. Kwaciak, B.: Co trzeba wiedzieć reklamie. Kraków: Wydawnictwo Profesjonalnej Szkoły Biznesu 1997, p. 107.6 Mukesh,T.: Advertising andSales Management. New Delhi: V.K. (India) Enterprises 2006, p.121.

48
Urszula Michalik,et al., THE PERSUASIVE FUNCTION... Journal of Accounting and Management, vol: 6; no: 1, 2016; page 45 - 58
3. ANALYSIS OF CHOSEN SLOGANS
The analyzed slogans are part of advertising messages of the following car makes: Toyota, Mercedes, Jaguar, Dodge, Hyundai, KIA, Ford, Alfa Romeo, Skoda, Honda, Citroen, BMW, Volkswagen, Chevrolet, Volvo, Nissan, Subaru, Land Rover, Peugeot and airlines: Delta Airlines, Emirates, Virgin America, Qa-tar Airways and KLM. They have been grouped and analyzed according to the rhetorical figures they employ.
3.1. Alliteration- also known as ‘head rhyme’ or ‘initial rhyme’ is a stylistic device in which words that have the same first consonant sound occur close together in a series. Such arrangement of letters makes a slogan definitely eas-ier to notice and remember, and also more interesting.
Today, Tomorrow, Toyota (Toyota)Don’t dream it. Drive it ( Jaguar)Building a better airline, not just a bigger one ( Delta Airlines)The use of alliteration in the above slogans draws attention to the follow-
ing features and key benefits of offered products: continuous availability and reliability (Today, Tomorrow, Toyota); assurance of the realisation of what cus-tomers dream about (Don’t dream it. Drive it), and declaration that the com-pany’s policy of growth is not realised at the expense of the quality it offers.
3.2. Hyperbole- a rhetorical device that purposefully uses exaggeration. The aim is to emphasize something, to stir imagination and to intensify emo-tions. The use of hyperbole in slogans allows copywriters to focus on product qualities.
Visit new worlds with our inflight entertainment (Emirates)Loaded with adrenaline (Dodge Nitro)Chevrolet. An American revolution (Chevrolet)Designed to save lives (Volvo)The above usage of hyperbole allowed copywriters to focus on such ben-
efits and features of offered products as: promise to take customers to ‘new worlds’ (clearly there is only one world, but the company offers some unique experience, which is enhanced by pleasurable moments (Visit new worlds with our inflight entertainment); promise to experience something that customers will find exciting (Loaded with adrenaline)7; assurance that the product is rev-olutionary (Chevrolet. An American revolution) and just like revolution, which
7 Adrenaline is a ‘chemical produced by your adrenal glans that make your heart beat faster and gives you more energy’ (Macmillan English Dictionary for Advanced Learners. 2002 p.19) and thus it is characteristic of human beings, and not inanimate objects such as cars. Thus, using the notion of adrenaline in a slogan is an example of hyperbole.

49
Urszula Michalik,et al., THE PERSUASIVE FUNCTION... Journal of Accounting and Management, vol: 6; no: 1, 2016; page 45 - 58
is ‘a major change’ offers something new that will improve product quality and performance; guarantee that a product will meet one of the most important and sought features i.e. safety (Designed to save lives).
3.3. Rhyme- a figure of speech where similar sounds (or the same sounds) are repeated. As a result the slogan is more interesting and easier to remember.
Never being bored on board (Delta airlines) Guess where and we’ll fly you there ( Emirates)Grace…space…pace ( Jaguar)Mean but green (Toyota)Rhyme has been used in the above slogans to highlight the following fea-
tures and benefits of advertised products: entertainment during flight (Never being bored on board), which will make the journey pleasant, and in some cases may help passengers who suffer from ‘fear of flight’ to divert their attention from what they find a scary experience; promise to take passengers to any destina-tion they wish to reach (Guess where and we’ll fly you there); assurance that the product is attractive, pleasant and interesting, provides a lot of room for pas-sengers and thus it is comfortable, allows the user to achieve speed, which is no doubt one of the features customers look for most often when they decide to buy a car (Grace…space…pace); information that a product is environmentally friendly (today more and more people are becoming aware of the need to pro-tect our endangered planet) and at the same time excellent (Mean but green).
3.4. Repetition – a rhetorical device where a word or phrase is repeated in order to emphasize its importance in the whole message.
Loyalty programmes should be loyal (Delta airlines)New thinking. New possibilities (Hyundai)Get in. Get happy (Volkswagen)The above examples of the usage of repetition draw attention and empha-
size the following features and benefits: the possibility to take advantage of loyalty programmes8, which are marketing strategies employed by companies aiming at encouraging customers to continue to buy products they offer, and in this way have the possibility to e.g. save money as they can buy something cheaper or get something for free. Moreover, the company ensures that the airline will be loyal to its customers, and as such it deserves to be trusted and relied upon (Loyalty programmes should be loyal). Another slogan contains in-formation that the company has adopted new ways of thinking, which in case of businesses can mean implementing new ideas and new solutions both in
8 Sharp, Byron and Anne Sharp, “Loyalty Programs and Their Influence on Repeat-Purchase Loyalty Patterns”. International Journal of Research in Marketing, 14 (5), 1997, pp. 473-86.

50
Urszula Michalik,et al., THE PERSUASIVE FUNCTION... Journal of Accounting and Management, vol: 6; no: 1, 2016; page 45 - 58
terms of the technical side of products, as well as good customer service and comfort (such approach creates new possibilities for both the company and its customers (New thinking. New possibilities); assurance that the customer will not only be satisfied with the product performance, but even happy- the only thing he/she should do is to get in and start the car (Get in. Get happy).
3.5.Personification- a figure of speech in which a thing, an idea or an ani-mal is given human attributes. The non-human objects are portrayed in such a way that we feel they have the ability to act or feel like human beings.
The car that cares (KIA)Jaguar. Born to perform ( Jaguar)Skoda. Simply clever (Skoda)The above slogans use personification as a way to stress the following fea-
tures and benefits offered by products: the use of a verb ‘to care’ with reference to a product can have many meanings as it may be a signal that it is designed to make customers comfortable and safe, but also that the product is eco-nomical and e.g. environmentally friendly (The car that cares); the message included in the slogan Jaguar. Born to perform is unambiguous and it conveys information that a product has been designed to fulfil all the needs and re-quirements of a customer i.e. it will ‘perform’ and do what it is expected to do (as such it may be read as reliable, safe or ,for example, economical; the mes-sage in the slogan Skoda. Simply clever is ‘simple’ i.e. that the product is good and effective.
3.6. Rhetorical question- rhetorical questions, unlike other types of ques-tions which need to be answered, do not require a response. Fahnestock calls them ‘questions that are really statements’9. The rhetorical question itself im-plies an answer and/or makes it easy to understand. It draws attention, evokes emotions and causes that people are more focused on the content of such question, and think about their own opinions.
Why pay more for a car ? (Citroen C1) Could you ever love life on the road (Honda Accord)Isn’t it lovely having room to play with (Skoda Roomster)Who could ask for anything more? (Toyota)Is it Love? - BMW. The above rhetorical questions refer to the following features and benefits
offered by products: cheap price, which is a feature that enhances the chance that a customer will purchase a product (Why pay more for a car ?); the ample
9 Fahnestock, J.: Rhetorical Style. The Uses of Language of Persuasion. Oxford University Press, Inc.: Oxford 2011, p.300.

51
Urszula Michalik,et al., THE PERSUASIVE FUNCTION... Journal of Accounting and Management, vol: 6; no: 1, 2016; page 45 - 58
physical space the product offers gives the customer an opportunity to use it for a purpose that he/she needs e.g. to transport things, or just ensures com-fort for passengers (Isn’t it lovely having room to play with); the message con-tained in the question Could you ever love life on the road can be read and un-derstood in many ways and mean, for example, that the car is comfortable or easy and fun to drive; assurance that a product will satisfy every need, meet every requirement of every customer (Who could ask for anything more?); the question Is it Love? suggests that what a product is or what it offers may be just like love, which is one of the strongest emotions experienced by people (as the definition of ‘love’ explains, love is the feeling of liking and caring for someone) and thus, those who will buy the product may find it reliable and attractive.
3.7. Idiom- a rhetorical device whose aim is to make language richer and spicier, and thus it makes the message more attractive. It cannot be inter-preted literally.
Love at first flight (Virgin America)Do you only feel at home at home? (Emirates)The use of an idiom in a slogan Love at first flight is a very clever linguistic
trick since the copywriter changed one word in the original idiom Love at first sight (the message it contains may be an indication that passengers will be more than satisfied with the product, and will ‘love’ all it offers; another slogan that uses an idiom indicates that the product offers its customers something that will make them feel as if they were at home (the connotations with home for many people mean comfort, safety and pleasant environment (Do you only feel at home at home?).
3.8. Oxymoron- an expression that uses words that have opposite mean-ings. The rhetorical purpose is often to highlight and juxtapose two opposite features in order to create not only an interesting effect, but draw attention to something that can have two different features.
The little big car (Renault)The slogan The little big car purposefully refers to features that are sought
by some customers i.e. there are customers who look for cars that are small (this may mean that they are economical and easier to park), and at the same time ‘big’ figuratively meaning that they are reliable.
3.9. Imperative mood- this mood is the most natural part of persuasion. However, in advertising it is rather used to propose or suggest something, and is rarely used as a command.
Enjoy 5-star luxury in the sky on Qatar AirwaysArrive beautifully (Virgin America)Do something memorable ( Toyota Aygo)

52
Urszula Michalik,et al., THE PERSUASIVE FUNCTION... Journal of Accounting and Management, vol: 6; no: 1, 2016; page 45 - 58
Ford. Feel the difference (Ford)Drive future. Today (Renault)The rhetorical purpose of using imperative mood in the above slogans is
to highlight the following features and benefits: luxury that passengers can enjoy on board i.e. As an advertisement of Qatar Airways explains luxury can mean ‘sophisticated and elegant cabin. Our open and spacious design is complemented by award-winning service. Generous storage will keep your belongings within reach, sophisticated LED lighting will help you adjust to changing time zones and an attentive crew will look after all of your needs. Settle into unparalleled comfort, and adapt your personal space to suit your needs. Lounge on an ottoman, catch some sleep or make productive use of your time with a large work surface. Your seat also features ample stowage op-tions, a vast selection of in-flight entertainment and a contemporary setting for world-class cuisine10(Enjoy 5-star luxury in the sky on Qatar Airways); the slogan Do something memorable allows many different readings such as e.g. indication that the conditions offered by airline guarantee that the passenger will reach his/her destination safely, and in good physical condition, promise that using a product will be an enjoyable and valuable experience that will be remembered by the customer; an imperative mood in the slogan Ford. Feel the difference is an invitation to experience something that will allow customers to enjoy features that are not offered by other products, in this way making it unique; the imperative Drive future. Today contains information that a product is a cutting-edge one i.e. it not only uses sophisticated technology and solu-tions that are ahead of the times, but it uses them already today.
Moreover, there are slogans that do not employ rhetorical figures, but achieve persuasive goals through using such grammatical forms as pronouns, nouns, verbs and adjectives.
3.10. Pronouns – the use of pronouns, especially the second person singu-lar or plural pronoun you, or its possessive form your, as well as the first person plural pronoun we or its possessive form our are used by copywriters to em-phasize that the message is addressed to the reader (you). Such approach may help establish a closer relationship with readers, make them feel important, and emphasize that what a company does or proposes is always focused on customers’ wants and needs.
Your private cabin, your personal crew, your premium place (Qatar Airways)You order it. We bring it (Virgin America)With your miles you can now fly further (Qatar Airways)Everything we do is driven by you ( Ford)
10 http://www.qatarairways.com/global/en/business-class.page (retrieved 26th January 2016)

53
Urszula Michalik,et al., THE PERSUASIVE FUNCTION... Journal of Accounting and Management, vol: 6; no: 1, 2016; page 45 - 58
Drive your dreams (Toyota)Without heart We would be mere machines (Alfa Romeo)The use of the second person personal pronoun ‘you’ and its possessive
form ‘your’ in the above slogans has been an opportunity for the companies not only to create an atmosphere of closeness and indicate that customers matter and are treated as equal ‘partners’, but also to highlight features and benefits offered by products such as private space on board, which ensures comfort and the chance to travel in a relaxing atmosphere, being served by crew that will take care and will be at a disposal of individual passengers only, good and comfortable place on board (Your private cabin, your personal crew, your premium place); assurance that the company is ready to satisfy customer needs (You order it. We bring it); the chance for frequent passengers11 to get an extra bonus and get a discount or a free place on board (With your miles you can now fly further); assurance that satisfying the customer needs and requirements are of top priority on the list of company goals (Everything we do is driven by you); information that the product will fulfil customers’ dreams (Drive your dreams) and that the company is not only interested in making good quality products, but also cares about customers in terms of good, per-sonal service, friendly relations and atmosphere (Without heart We would be mere machines).
3.11. VerbsThere is no doubt that the choice of verbs may enhance the chances to in-
vigorate the message, and increase the persuasive power of a slogan. The verb can not only attract attention, but also make the reader think about something it refers to and focus on a feature that copywriters wish to highlight.
You can with a Nissan (Nissan)Just imagine what Citroen can do for you (Citroen)Volkswagen Polo. Built to protect (Volkswagen)The verb ‘to protect’ in Volkswagen Polo. Built to protect assures custom-
ers about one of the most important features they are looking for i.e. safety (the product has been designed to prevent danger); the use of modal verbs can also help convince customers that the product has the power to fulfil their needs and meet their requirements as in You can with a Nissan, Just im-agine what Citroen can do for you . ‘You can’ means ‘ you will’ be able to get, do, achieve what you want if you purchase our product.
11 A frequent-flyer program (FFP) is a loyalty program offered by an airline. Many airlines have frequent-flyer programs designed to encourage airline customers enrolled in the program to accumulate points (also called miles, kilometers or segments) which may then be redeemed for air travel or other rewards (https://en.wikipedia.org/wiki/Frequent-flyer_program (retrieved 26th January 2016).

54
Urszula Michalik,et al., THE PERSUASIVE FUNCTION... Journal of Accounting and Management, vol: 6; no: 1, 2016; page 45 - 58
3.12. NounsSome of the analysed slogans consist of only or mostly nouns, which ex-
plicitly state the features or benefits a company offers and wants to highlight. Design. Innovation. Performance (Jaguar XF)A joy to drive. A pleasure to own (Mercedes-Benz C-Class)Sophistication and Ruggedness (Subaru Outback)Hospitality at the highest level (Qatar Airways)Quality is job one– Ford (Ford)Chrysler. Drive = Love (Chrysler)The true definition of luxury. Yours – Honda (Honda)The above slogans all contain nouns that practically do not need any com-
ment as they state features that are most sought, and often considered to be ‘a must’ by customers who wish to purchase a car, or use an airline service. Thus, design, innovation and sophistication indicate that a company uses new technology, always looks for new solutions and strives to cater to the needs of modern customers; performance, speed and effectiveness of a machine or vehicle refer to the strength and ability to deal with difficult conditions; rug-gedness and quality which “in manufacturing, is a measure of excellence or a state of being free from defects, deficiencies and significantvariations”12; luxury, which can not only mean very good and comfortable conditions and high quality, but can also be a status symbol, which is important for some peo-ple who choose a product, and hospitality assuring customers that they will receive good service and treatment. Nouns can also refer to emotions such as joy, pleasure or love, which apart from rational arguments, as stated by Kin-neavy13 are indispensable and very strong elements of persuasion.
3.13. Adjectives (degree)There are also slogans that realize their purpose and achieve persuasive
power by using adjectives only.The reliable airline (KLM)The most agile. The most responsive. Land Rover ever (Land Rover)More economical. Less pollutant (Peugeot)The adjectives used in the above slogans point out features that are de-
sired by customers i.e. agile, which refers to the ability to move quickly and easily; responsive, which refers to the ability to react in the way that is needed, suitable or right for a particular situation; reliable and economical, which al-lows to save money and less pollutant i.e. environmentally friendly.
12 http://www.businessdictionary.com/definition/quality.html (retrieved 28th January 2016).13 cf. Kinneavy, J.: Theory of discourse. Englewood Cliffs: Prentice Hall 1971, p. 45.
55
Urszula Michalik,et al., THE PERSUASIVE FUNCTION... Journal of Accounting and Management, vol: 6; no: 1, 2016; page 45 - 58
CONCLUSION
The above analysis of the chosen slogans looked at the purpose of rhetori-cal figures they employ in order to attract, interest and convince prospective customers about the features and benefits of advertised products. The anal-ysis has been qualitative, investigated the use of rhetorical figures and also focused on a pragmatic meaning of particular words i.e. words which signify crucial or significant features of cars and airline services, or conjure up images e.g. an image of luxury. As stated by Cook, a pragmatic meaning is about ‘what a word or utterance means and does in a particular context”14. In line with the above definition the advertised products claim to be reliable, exciting, revolutionary, new, safe, economical, cheap, effective, attractive, innovative and sophisticated, pleasant and interesting, comfortable, environmental-ly friendly, fulfill customers wants, needs and desires, ensure high quality, growth as one of the major priorities companies have, offer new ideas and so-lutions, assure good customer service, make customers satisfied and happy and are fun to use.
Taken the above considerations, it can be stated that conscious choice of words and the deliberate rhetorical efforts undertaken by copywriters to cre-ate interesting and eye-catching slogans aim at achieving particular emphasis and effect, and thus they enhance their appeal. If copywriters create a good slogan there is a chance that it will be remembered and used for a long period of time, and that it will increase the plausibility of arguments they advance or illustrate. Of course, words sometimes change their meanings “[…] it has been long known that the meanings of words change over time, and cultural histori-ans have taken advantage of this knowledge in offering new interpretations of past texts”15. However, we hope that it will not be too presumptuous to claim that some words e.g. safety, reliability or quality always have positive conno-tations, and are very important in the description of features of many products, especially products where safety and reliability are of key importance.Such words are a kind of schema ‘ […] an organized template of background knowl-edge that a single item fits into, as window fits into the schema for house’16. In this vein, the features in the analysed slogans fit into the schema of a car or a plane. Still, there is one thing that needs to be remembered by copywriters i.e. that the response of the target recipients depends on the personality, cultural, linguistic, economic, legal and regulatory conditions. Yet, this issue is a subject for another analysis that will take these factors into consideration.
14 Cook, G.: The Discourse of advertising. Second edition. London, New York. ROUTLEGE, Taylor& Francis Group: London, New York2005,p.103.
15 Smith, J.J.: The Power of Words. In: Caie, G.D, Hough, C., Wotherspoon, I.(eds.): Amsterdam, New York, NY, 2006.p.160
16 Op.cit. Fahnestock, J.,p. 353.

REFERENCES1. Cook, G.: The Discourse of advertising. Second edition. London, New York. ROUTLEGE, Tay-
lor& Francis Group: London, New York2005.2. Čulenová, E.: Jazyk. Matricaaleboplášť? BanskáBystrica: Fakultahumanitných vied Univerzity-
Mateja Bela 2012. 3. Fahnestock, J.: Rhetorical Style. The Uses of Language of Persuasion. Oxford University Press,
Inc. Oxford 2011.4. Hart, R.P., Daughton, S.: Modern rhetorical criticism (third edition). New York: Allyn&Bacon
2004.5. Kinneavy, J.: Theory of discourse. Englewood Cliffs: Prentice Hall 1971.6. Kwaciak, B.:Co trzeba wiedzieć reklamie. Kraków: Wydawnictwo Profesjonalnej Szkoły Bi-
znesu 19977. Mukesh,T.: Advertising andSales Management. New Delhi: V.K. (India) Enterprises 2006.
8. Sharp, Byron and Anne Sharp: Loyalty Programs and Their Influenec on Repeat-Pur-chase Loyalty Patterns, in: International Journal of Research in Marketing, 14 (5) 1997.
9. Smith, J.J.: The Power of Words. In: Caie, G.D, Hough, C., Wotherspoon, I.(eds.): Amsterdam, New York, NY, 2006.
10. MacMillan English Dictionary For Advanced Learners, Bloomsberry Publishing, Oxford, 200211. Persuading people. Expert Solutions to Everyday Challenges. Boston, Massachusetts: Har-
vard Business Press 2008.Internet sources:http://www.qatarairways.com/global/en/business-class.page (retrieved 26th January 2016)http://www.businessdictionary.com/definition/quality.html(retrieved 28th January 2016)

57
Urszula Michalik,et al., THE PERSUASIVE FUNCTION... Journal of Accounting and Management, vol: 6; no: 1, 2016; page 45 - 58
RETORIČKA FUNKCIJA UVJERAVANJA U REKLAMNIM SLOGANIMA
SAŽETAK RADA: Članak govori o korištenju i namjeni retoričkih figura u reklamnim sloganima .
Izbor riječi i tehnike koje koriste autori reklamnih poruka mogu bolje uvjeriti potenci-jalne kupce kako se kupnjom ponuđenog proizvoda može dobiti više od proizvoda ili usluge, odnosno ti proizvodi mogu poprimiti upravo one značajke koje kupci traže te zadovolljiti njihove potrebe. Ovaj članak obuhvaća analizu 49 reklamnih slogana za automobile i zrakoplove Izbor nije slučajan jer su svi slogani vezani uz vrlo popularna prijevozna sredstva i usredotočeni na karakteristike koje su vrlo važne, i shodno tomu, tražene kako od vozača tako i putnika.
U konačnici, značajke su iskorištene za stvaranje sheme reklamiranih proizvoda tj automobila i aviona.
Ključne riječi: slogan, retorička figura , identitet, sheme, uvjeravanje , konkurencija


59
Journal of Accounting and Management, vol: 6; no: 1, 2016; page 59 - 74
Original Scientific PaperUDK: 658.14
Paper received: 15/02/2016Paper accepted: 09/05/2016
EXTENT OF SUSTAINABILITY ASSURANCE IN SOUTH AFRICAN MINING COMPANIES
Collins C. NgwakweTurfloop Graduate School of Leadership, University of Limpopo, South [email protected] Samkele T. MtsweniTurfloop Graduate School of Leadership, University of Limpopo, South [email protected]
ABSTRACTThis paper examined whether selected South African mining companies obtain
sustainability report assurance and whether the sustainability reports are internally or externally assured. The methodological approach is a combination of qualitative and quantitative analysis of assurance elements in sustainability reports. Findings indicate that a considerable number of mining companies are complying with the requirements of the King III assurance requirement; however, there is still room for improvement mostly in the external assurance requirement. The study finds that the lack of external assurance from some firms may stem from apparent optional nature of sustainability guidelines. Major finding from the t-test of difference in mean-assu-rance levels indicate that, whilst it is commendable that companies are responding to assurance requirement, however it took approximately four years for all the sampled companies to adjust toward a significant response to King III requirement for assuran-ce of sustainability reports. Hence the paper recommends amongst others, that policy makers should allow ample time when initiating new sustainability guidelines and/or policies to enable firms to adjust. External assurance of sustainability reports should be made obligatory and that assurance work should be made to rest in the hands of qualified experts, such as the chartered accountants, to instil greater compliance and

60
Collins C. Ngwakwe, et.al., EXTENT OF SUSTAINABILITY ASSURANCE... Journal of Accounting and Management, vol: 6; no: 1, 2016; page 59 - 74
desired credibility in sustainability reports. It is also recommended that future studies may look into the extent of independence and objectivity of external assurers of su-stainability in the mining firms.
Key words: sustainability accounting, sustainability assurance, sustainability reporting, mining companies
1. INTRODUCTION
Sustainability reporting provides a useful tool to navigate social and en-vironmental conflicts that subsist between the society and mining companies (Lins, Althof and Meek, 2008). As an essential accountability tool, mining com-panies have the opportunity to demonstrate in their sustainability reports a wide range of their environment, social and governance practices (Lins et al., 2008). according to Global Reporting Initiative (GRI), sustainability reporting refers to “the practice of measuring, disclosing and being accountable to internal and external stakeholders for organisation performance towards the goal of sus-tainable development” (GRI, 2011, p.3).
Sustainability reporting is significant to corporates given its potential to increase the image, reputation and profitability of the business (de Leaniz & del Bosque, 2013). Hence, Kalkstein (2013) suggests that if companies develop their sustainability reports accurately, it could enhance productivity and ef-ficiency through process optimisation.
Whilst sustainability reporting is vital for companies’ image and for inter-nal and external stakeholders, the assurance of sustainability reports is very es-sential (Jones et al, 2015) to enhance the credibility of reports. This then brings the concept of sustainability reporting assurance. Sustainability reporting as-surance is a certification process that increases the trustworthiness, accuracy and robustness of the disclosed information (GRI, 2013). According to KPMG (2011), sustainability reporting assurance ensures transparent communica-tion of non-financial sustainability data and the assurance serves as a mecha-nism for reducing the risks of probable deceptive information (KPMG, 2011). Accordingly, assurance of sustainability reporting is pertinent as it enhances the reliability and credibility of corporate information that is vital for decision-making (KPMG, 2011) and therefore improves the transparency and trust in corporate information disclosure (Dando & Swift, 2003). Accordingly, this pa-per is inclined on the following objectives: to examine how mining firms are complying with the requirement to obtain assurance reports and to determine whose services the mining companies employ to obtain assurance (internal or external).

61
Collins C. Ngwakwe, et.al., EXTENT OF SUSTAINABILITY ASSURANCE... Journal of Accounting and Management, vol: 6; no: 1, 2016; page 59 - 74
The paper is organized as follows: the section after the introduction re-views the related literature. Following this is the methodology, data presen-tation and the analysis. The last section presents the discussion, conclusion recommendations.
2. RELATED LITERATURE
Companies in many countries are progressively adhering to publication of separate sustainability reports (Kolk, & Perego, 2010; Simnet et al 2009), yet in some countries, companies merge the financial reports to the sustainability elements to produce integrated reports (Atkins & Maroun, 2015). However it is prepared (singly or integrative), the sustainability element (in some instanc-es) receive independent assurance either from independent auditors or from private consultants. Whilst using diverse methodologies, extant research has sought to understand the factors that warrant companies’ initiatives to secure sustainability disclosure assurance and the selection of certification supplier (auditors or private consultants) (Kolk, & Perego, 2010; Simnet et al 2009). Most of the findings bolster the contention that organizations trying to upgrade the validity of their reports and enhance their corporate repute will probably have their sustainability reports assured, notwithstanding the choice of the assurance provider. It has also been found that companies located in countries with shareholder orientation are more prone to hiring professional auditors to provide sustainability assurance (Simnet et al 2009; Kolk, & Perego, 2010). Not-withstanding though, it is believed that assurance of sustainability disclosure may be dependent on corporate profitability and size (Sierra et al, 2013) and that sustainability assurance service is currently being controlled by major four auditing firms (Sierra et al, 2013) for the apparent reason that shareholders tend to rely more on the certification of professional auditors (Kolk, & Perego, 2010).
External sustainability accountability pressures, firm’s resource endow-ment and competences propel the embrace of sustainability assurance (Pere-go & Kolk, 2012). Differing qualities of certification guidelines and kind of as-surance suppliers contribute to shape the nature of sustainability assurance opinions (Gürtürk & Hahn, 2015; Junior et al, 2014; Perego & Kolk, 2012; Perego, 2009). There is apparent disproportion of momentum amongst firms’ practice of sustainability assurance initiatives in the developmental phases of sustaina-bility assurance initiatives (Peters & Romi, 2014; Perego & Kolk, 2012). There are doubts about the independence of assurors given apparent degree of man-agement intervention in the sustainability assurance process and there are dis-parities between assurance opinions by auditors and assurance opinions from consultants (O’Dwyer & Owen, 2005). Accordingly, non-auditors assurance

62
Collins C. Ngwakwe, et.al., EXTENT OF SUSTAINABILITY ASSURANCE... Journal of Accounting and Management, vol: 6; no: 1, 2016; page 59 - 74
suppliers affect the quality of assurance opinion (Perego, 2009). The publica-tion of assurance opinion has been found to influence user’s assessment of the credibility of sustainability reports and users prefer assurance opinions issued by professional auditors (Hodge et al, 2009). Research on the demand side of sustainability assurance has also shed light on why firms are keen to obtain assurance statements; external institutions such as the regulators and/or so-cially responsible investment indices contribute to influence the commitment of firms to obtain assurance (Wong & Millington, 2014). The King III code of cor-porate governance in South Africa recommends assurance statement as a vital component of sustainability repots. This has shaped the adoption of sustain-ability assurance by companies quoted in the Johannesburg Stock Exchange (JSE) since the JSE requires its companies to apply the King III assurance recom-mendations (Ackers & Eccles, 2015; JSE 2014c); accordingly, this paper provides an evaluation of how South African mining firms have progressed towards the King III sustainability assurance recommendation. This assessment provides companies, regulators, researchers, the academia and users of sustainability information further insight about the response rate between the time of issu-ing sustainability pronouncements and the time of response by companies.
3. METHODOLOGY
The study focused on South African mining companies that are listed in the Johannesburg Stock Exchange (JSE) Socially Responsible Investing (SRI) Index. The population was drawn from the list of mining companies that are listed in the JSE SRI Index. The reason for this is that the companies in the SRI index are required to obtain assurance on their sustainability disclosures. As at the time of this study in 2014, there were a total of 15 mining companies that qualified for the 2014 JSE SRI Index (JSE, 2014a; JSE 2014b) and since this num-ber was not too large, and the data is publicly available, all the 15 companies were examined, which is 100% of the population.
4 DATA ANALYSIS
A mixed approach of qualitative and quantitative was used in the analysis of data. The qualitative data analysis is suitable for this study as it addresses what the study seeks to achieve. Techniques such as narrative, interpretation, confirmation and presentation of tables and graphs are applied in different stages of the analysis. Additionally, a quantitative approach is also applied since the interpreted qualitative information is assigned numerical values and placed in tables under different years. Doing this thus displays apparent dif-ferences between years in the values assigned to the phenomenon being in-

63
Collins C. Ngwakwe, et.al., EXTENT OF SUSTAINABILITY ASSURANCE... Journal of Accounting and Management, vol: 6; no: 1, 2016; page 59 - 74
terpreted (sustainability assurance). Given the differences in values between the years, the researcher thus applies a t-test differential analysis to evaluate possible significant difference in the mean values assigned to the external as-surance levels between two different years.
In an attempt to assign values to levels of sustainability assurance compli-ance, a dichotomous aggregate (Vreeland, 2006) measure of compliance ap-proach was applied - that is a coding arrangement where the authour assigns a number/percentage to indicate compliance or non-compliance to the re-quired compliance items (Vreeland, 2006). According to Vreeland (2006), this measure allows the authour to accommodate partial compliance. The scores were assigned in compliance with Killick (1995) who used the dichotomous aggregate approach in which he assigned 80% as full compliance and 20% as partial or non-compliance. Following this scoring therefore, the compliance scoring to sustainability assurance requirement was as follows:
Assurance was sub-divided into two (on a total 5 point scale): Independent external assurance: 4 (or 80%); and self- assurance: 1 (or 20%); total = 5 (100%).
The values indicated above were assigned to companies according to whether they employed an external assurer or used internal assurer (self-assur-ance). Given that the interest is on external assurance, score (4) was assigned to companies that used external assurers thus indicating a better credibility on sustainability reports. Accordingly Table 4.1 presents a comparative Analysis of external assurance of sustainability report by 15 mining companies in the JSE SRI index whose names are not disclosed for commercial confidence.
Data Presentation

64
Collins C. Ngwakwe, et.al., EXTENT OF SUSTAINABILITY ASSURANCE... Journal of Accounting and Management, vol: 6; no: 1, 2016; page 59 - 74
Table 4.1: Comparative Analysis of External Assurance of Sustainability Report by Companies (in no sequential order) 2008-2013
Companies2008
External. Assurance
2010 External.
Assurance
2011 External.
Assurance
2012 External.
Assurance
2013 External.
Assurance
Total Company
PerformanceA 4 4 4 4 4 20
B 0 0 4 4 4 12
C 4 4 4 4 4 20
D 4 0 4 4 4 16
E 0 0 0 0 4 4
F 4 4 0 4 4 16
G 0 4 0 4 4 12
H 4 4 0 4 4 16
I 4 4 4 4 4 20
J 4 4 4 4 4 20
K 4 4 4 4 4 20
L 4 4 4 4 4 20
M 4 4 0 4 4 16
N 0 4 4 0 4 12
O 0 0 0 0 4 4
Yearly total performance
40 44 36 48 60 228
Table 4.1 provides a comparative analysis of how companies obtained external assurances over the years. As strict listing requirements in JSE rein-forced over the years, requiring companies to obtain independent assurance of sustainability report for companies listed in the SRI index, some companies were consistent in obtaining independent opinion. An interesting observation though, in 2011 when King III was already in effect, most companies backslide. In 2011 most companies did not have an independent opinion as compared to other years. However, in 2012 there was an improvement as most companies obtained external audit opinion and 2013 with all companies complying with the G3 guide, King III and JSE SRI listing requirements. Figures 4.1 & 4.2 show a graphical representation of the progression performance of external sustainability assurance of all companies sampled yearly. Figure 4.3 represents total sustainability assurance performance per company 2008 – 2013.

65
Collins C. Ngwakwe, et.al., EXTENT OF SUSTAINABILITY ASSURANCE... Journal of Accounting and Management, vol: 6; no: 1, 2016; page 59 - 74
Figure 4.1 Yearly Total of External Sustainability Assurance Performance for All the Sample Companies
6
From the graph above one can visualise a progression in sustainability assurance between 2008 and 2013. Figure 4.2 below also shows this progression. Figure 4.2 Yearly Total of External Assurance Performance for All the Sample Companies
4044
36
48
60
0
10
20
30
40
50
60
70
4044
36
48
60
0
10
20
30
40
50
60
70
Yearly Total of External Assurance Performance for All the Sample Companies
From the graph above one can visualise a progression in sustainability as-surance between 2008 and 2013. Figure 4.2 below also shows this progression.
Figure 4.2 Yearly Total of External Assurance Performance for All the Sample Companies
6
From the graph above one can visualise a progression in sustainability assurance between 2008 and 2013. Figure 4.2 below also shows this progression. Figure 4.2 Yearly Total of External Assurance Performance for All the Sample Companies
4044
36
48
60
0
10
20
30
40
50
60
70
4044
36
48
60
0
10
20
30
40
50
60
70
Yearly Total of External Assurance Performance for All the Sample Companies

66
Collins C. Ngwakwe, et.al., EXTENT OF SUSTAINABILITY ASSURANCE... Journal of Accounting and Management, vol: 6; no: 1, 2016; page 59 - 74
Figure 4.3 Total Sustainability Assurance Performance per Company 2008 - 2013
7
Figure 4.3 Total Sustainability Assurance Performance per Company 2008 - 2013
Figure 4.3 shows the total sustainability assurance per company for each year. It is clear that companies with a 20 score maintained a steady compliance in terms of obtaining external assurance opinion. However, as can be seen from the graph above, many of the mining companies score below 20, and this indicates that many companies are still using internal assurance and are yet to reach the level of external assurance to enhance credibility of sustainability reports. The preceding results therefore show that some companies have strived toward a yearly compliance with external assurance, but many companies are yet to reach yearly compliance with external assurance. T-test of Difference in Means Before and After the King III Requirement for
External Assurance of Sustainability Reports A visual observation from the above data, table and figures indicates that mining companies appear to perform better in obtaining external assurance year by year from 2009, when the King III initiated the requirement for external assurance and which became operational in 2010. Given the observable difference in years regarding external assurance, the following tables (Table 4.2 – Table 4.5) present a t-test of difference in mean external assurance compliance levels between 2008 before the King III pronouncement and 2010 when external assurance become operational. Table 4.2 t-Test: Paired Two Sample for Means
Mean Difference Between 2008 and 2010 level of External Assurance of Sustainability Reports
2008Ext.Ass
ur. 2010
Ext.Assur
Mean 2.66666666
7 2.93333333
3
Variance 3.80952381 3.35238095
2 Observations 15 15 Hypothesised Mean Difference 0
20
12
2016
4
1612
1620 20 20 20
1612
4
05
10152025
A B C D E F G H I J K L M N O
Total External Assurance Performance Per Company 2008-2013
Figure 4.3 shows the total sustainability assurance per company for each year. It is clear that companies with a 20 score maintained a steady compliance in terms of obtaining external assurance opinion. However, as can be seen from the graph above, many of the mining companies score below 20, and this indicates that many companies are still using internal assurance and are yet to reach the level of external assurance to enhance credibility of sustainability re-ports. The preceding results therefore show that some companies have strived toward a yearly compliance with external assurance, but many companies are yet to reach yearly compliance with external assurance.
T-test of Difference in Means Before and After the King III Requirement for External Assurance of Sustainability Reports
A visual observation from the above data, table and figures indicates that mining companies appear to perform better in obtaining external assurance year by year from 2009, when the King III initiated the requirement for external assurance and which became operational in 2010. Given the observable dif-ference in years regarding external assurance, the following tables (Table 4.2 – Table 4.5) present a t-test of difference in mean external assurance compli-ance levels between 2008 before the King III pronouncement and 2010 when external assurance become operational.

67
Collins C. Ngwakwe, et.al., EXTENT OF SUSTAINABILITY ASSURANCE... Journal of Accounting and Management, vol: 6; no: 1, 2016; page 59 - 74
Table 4.2 t-Test: Paired Two Sample for Means
Mean Difference Between 2008 and 2010 level of External Assurance of Sustainability Reports
2008 Ext. Assur. 2010 Ext. Assur.
Mean 2.666666667 2.933333333
Variance 3.80952381 3.352380952
Observations 15 15
Hypothesised Mean Difference 0
Df 14
t Stat -0.564076075
P(T<=t) one-tail 0.290813418
t Critical one-tail 1.761310136
P(T<=t) two-tail 0.581626837
t Critical two-tail 2.144786688
Tested at 5% significance level; the above result in Table 4.2 indicates that there is no significant difference between 2008 and 2010. The P-Values of 0.29 and 0.58 indicate that this result is not significant at any acceptable level be-cause these values are greater than 5%. This may mean that mining firms were still learning and adjusting to the requirements for external assurance.
Table 4.3 t-Test: Paired Two Sample for Means
Mean Difference Between 2008 and 2011 level of External Assurance of Sustainability Reports
2008 Ext. Assur. 2011 Ext. Assur.
Mean 2.666666667 2.4
Variance 3.80952381 4.114285714
Observations 15 15
Hypothesised Mean Difference 0
Df 14
t Stat 0.434958836
P(T<=t) one-tail 0.335111164
t Critical one-tail 1.761310136
P(T<=t) two-tail 0.670222328
t Critical two-tail 2.144786688
Tested at 5% significance level, the above table 4.3 shows that there is no significant difference between 2008 and 2011 level of external assurance. The P-Value of 0.33 and 0.67 indicate that this result is not significant at any accept-able level because these values are greater than 5%. This means companies were still learning and adjusting to the new requirement by King III.

68
Collins C. Ngwakwe, et.al., EXTENT OF SUSTAINABILITY ASSURANCE... Journal of Accounting and Management, vol: 6; no: 1, 2016; page 59 - 74
Table 4.4 t-Test: Paired Two Sample for Means
Mean Difference Between 2008 and 2012 level of External Assurance of Sustainability Reports
2008 Ext. Assur. 2012 Ext. Assur.
Mean 2.666666667 3.2
Variance 3.80952381 2.742857143
Observations 15 15
Hypothesised Mean Difference 0
Df 14
t Stat -1.467598771
P(T<=t) one-tail 0.082158949
t Critical one-tail 1.761310136
P(T<=t) two-tail 0.164317898
t Critical two-tail 2.144786688
Tested at 5% significance level; the above result in Table 4.4 indicates that there is no significant difference between 2008 and 2010. The P-Values of 0.089 and 0.164 indicate that this result is not significant at any acceptable level be-cause these values are greater than 5%. This may mean that mining firms were still learning and adjusting to the requirements for external assurance.
Table 4.5 t-Test: Paired Two Sample for Means
Mean Difference Between 2008 and 2013 level of External Assurance of Sustainability Reports
2008 Ext. Assur. 2013 Ext. Assur
Mean 2.666666667 4
Variance 3.80952381 0
Observations 15 15
Hypothesised Mean Difference 0
Df 14
t Stat -2.645751311
P(T<=t) one-tail 0.009593811
t Critical one-tail 1.761310136
P(T<=t) two-tail 0.019187621
t Critical two-tail 2.144786688
Tested at 5% significance level, the T-test of difference in Table 4.5 gives a 0.01% probability, which is less than 5%. This therefore shows that there is a significance difference in external assurance between 2008 and 2013, with the mean difference of 2013 being higher than 2008. This means it took 4 years for
69
Collins C. Ngwakwe, et.al., EXTENT OF SUSTAINABILITY ASSURANCE... Journal of Accounting and Management, vol: 6; no: 1, 2016; page 59 - 74
companies to learn and adjust to new sustainability reporting requirements, hence in 2013 companies responded more in obtaining external assurance.
5. DISCUSSION OF FINDINGS
The study intended to investigate the extent to which mining firms com-ply with the assurance requirement of sustainability reports. Secondary data were used in this study. The major source of secondary data for analysis is the published sustainability reports of the mining companies. The data collected is the assurance content and type from the sustainability reports of mining companies from 2008- 2013. A dichotomous aggregate measure of compli-ance approach was applied; that is a coding arrangement where a number/percentage to indicate compliance and non-compliance to required compli-ance items (Vreeland, 2006).
With regards to objective one which seeks to determine whether mining companies obtain assurance of their sustainability reports, it was found that, over the years from 2010 to 2012, some companies obtained assurance and some did not. However, in 2013 all mining companies’ reports showed that they obtained assurance of their sustainability reports. This could be contrib-uted to the pressure from stakeholders who demand credibility of the reports. The credibility of sustainable reports is a concerning issue presently and also, who assures that the sustainability reports are credible.
Related studies confirm that there is still a concern in terms of credibility of sustainability reports. Empirical evidence reveals that sustainability reports in some mining companies appear misleading (Böhling & Murguía, 2014). For example, sustainability reporting ambiguity was highlighted in previous stud-ies, which includes inter alia, in Tanzanian, Australian and South African mining firms (Emel et al., 2012; Loussikian, 2014; Maubane et al., 2014).
The second objective looks into whether examined mining companies employ the services of external assurers. The importance of external assurance is that it ensures the company’s sustainability information provided is accu-rate, and reliable; thereby supporting the credibility of information used in decision-making.
The study found that in 2008, before the new King III report, a consider-able number of mining companies did not have assurance statements in their sustainability reports, neither by their internal audit committees, nor by inde-pendent or external assurors. This simply means that their reports were not assured.
In 2010, the year in which King III was made effective, almost all min-ing companies had self-assurance statements in their reports. Self-assurance

meant companies used internal services for the assurance of their reports. This means companies responded to the King requirements. However, not all companies employed the services of external assurors. In 2011 there was a de-crease in sustainability assurance, internally and externally. It could be that companies were still uncertain or adjusting to the new requirement by King III. In 2012 companies improved as their internal and external assurance were done in their sustainability reports. There were fewer companies though that still lacked internal and external assurance.
The year 2013 showed a significant improvement as all sustainability re-ports studied were compliant to the King III requirements. It took companies four years to comply. This means companies needed time to adjust and imple-ment the new requirements. It is important to note that it takes companies time to adjust to new regulations. Policy makers and other authorities should give companies time whenever new legislation or a new regulation is pro-claimed.
6. CONCLUSION AND RECOMMENDATIONS
This study examined the extent of sustainability reporting assurance com-pliance in selected South African mining companies. The study focused on the 15 South African mining companies that are listed in the Socially Responsible Index (SRI) of the Johannesburg Stock Exchange (JSE). It made use of second-ary archival data from the sustainability reports of the mining companies. The analysis method was a mix of qualitative and quantitative. In order to address the aim of this study as reflected in the title, two objectives were stated: to examine how mining firms are complying with the requirement to obtain as-surance reports; and to determine whose services the mining companies em-ploy to obtain assurance reports (internal or external). Answers to the above objectives were supported by the data retrieved from the companies’ sustain-ability reports and from the review of related literature. Findings from the data analysis provided answers to the first and second objectives. All the mining companies studied are making use of self-assurance, but a few of the mining companies are also obtaining independent external assurance on their sus-tainability reports. This thus shows that although the mining firms are obtain-ing sustainability assurance, they need to improve upon the independence of assurance opinion by engaging the services of independent external assurers (external auditors) to add credibility to their assurance report.
The South African King III code plays a significant role in mining compa-nies’ response to sustainability challenges. The majority of the JSE SRI listed mining companies’ integrated reports contained sustainability reports. Select-

71
Collins C. Ngwakwe, et.al., EXTENT OF SUSTAINABILITY ASSURANCE... Journal of Accounting and Management, vol: 6; no: 1, 2016; page 59 - 74
ed companies did not have sustainability reports and did not conduct either internal or external assurances in 2008 and after 2010. With time, companies were slowly adopting the new requirements and in 2013 all companies had their sustainability report assured internally and externally.
However, it took companies time to adjust to the new requirement of obtaining independent opinion from external assurors. The time it took com-panies to comply, should be taken into consideration when policy makers change regulations. The implication therefore is that policy makers and the JSE should provide enough time for companies to learn, adjust and adopt the new sustainability reporting requirements. Time is important for any regulation to enable companies to comply. Another concern is in regards to the extent of independence and objectivity of external assurors. Hence, some previous re-searchers have scrutinized sustainability assurance reports of mining compa-nies to ascertain the degree of credibility (Fonseca, 2010).
Given the findings that it took the mining firms up to five years to respond fully to the requirement of assurance, the paper recommends that policy mak-ers should consider time lag in proposing new environmental and sustainabil-ity policies, this will enable firms to prepare and properly adjust themselves to accommodate new sustainability regulations. It is also recommended that future studies may look into the extent of independence and objectivity of external assurers in sustainability assurance in South African mining firms.
REFERENCES 1. Ackers, B., & Eccles, N. S. (2015). Mandatory corporate social responsibility assurance prac-
tices: the case of King III in South Africa. Accounting, Auditing & Accountability Journal, 28(4), 515-550.
2. Atkins, J., & Maroun, W. (2015). Integrated reporting in South Africa in 2012: Perspectives from South African institutional investors. Meditari Accountancy Research, 23(2), 197-221.
3. Böhling, K. & Murguía, D.I., 2014, Sustainability reporting in the mining sector: Why institu-tional dynamics of reporting disappoint beliefs in its potentials for increased corporate ac-countability, Paper prepared for Conference on Regulatory Governance between Global and Local ECPR Standing Group on Regulatory Governance Barcelona, Spain, June 25-27, 2014.
4. Dando, N., & Swift, T. (2003). Transparency and assurance minding the credibility gap. Jour-nal of Business Ethics, 44(2-3), 195-200.
5. de Leaniz, P. M. G., & del Bosque, I. R. (2013, April). Relational Capital: The Role of Sustainabil-ity in Developing Corporate Reputation. In European Conference on Intellectual Capital (p. 539). Academic Conferences International Limited.
6. Emel, J.,Madoshi, H. & Wangari, E. (2012) Problems with Reporting and Evaluating Mining industry community development projects: a case study from Tanzania, Sustainability, 4 (12), 257–77.
7. Fonseca, A. (2010). How credible are mining corporations’ sustainability reports? A critical analysis of external assurance under the requirements of the international council on mining and metals. Corporate Social Responsibility and Environmental Management, 17(6), 355-370.
72
Collins C. Ngwakwe, et.al., EXTENT OF SUSTAINABILITY ASSURANCE... Journal of Accounting and Management, vol: 6; no: 1, 2016; page 59 - 74
8. Global Reporting Initiative (GRI) (2011) Sustainability Reporting Guidelines, available at: https://www.globalreporting.org/resourcelibrary/G3.1-Guidelines-Incl-Technical-Protocol.pdf
9. Global Reporting Initiative (GRI), (2013), the external assurance of sustainability reporting, available at: https://www.globalreporting.org/resourcelibrary/GRI-Assurance.pdf
10. Gürtürk, A., & Hahn, R. (2015). An Empirical Assessment of Assurance Statements in Sustain-ability Reports: Smoke Screens or Enlightening Information?. Journal of Cleaner Production (doi: 10.1016/j. jclepro. 2015.09. 089).
11. Hodge, K., Subramaniam, N., & Stewart, J. (2009). Assurance of sustainability reports: Impact on report users’ confidence and perceptions of information credibility. Australian accounting review, 19(3), 178-194.
12. Johannesburg Stock Exchange, (JSE) (2014a) SRI Index results and announcements, available at: https://www.jse.co.za/content/JSEPresentationItems/2014Resultspresentation.pdf
13. Johannesburg Stock Exchange, (JSE), (2014b) SRI Index celebrates 10 years with record num-ber of constituents, available from:
14. https://www.jse.co.za/content/JSEPresentationItems/2014SRIAnnualResultsPressRelease.pdf 15. Johannesburg Stock Exchange (JSE) (2014c) SRI Index Background and Criteria, available at:16. https://www.jse.co.za/content/JSERulesPoliciesandRegulationItems/Background%20
and%20Criteria%202014.pdf [Accessed Jan 20 2016]17. Jones, P., Comfort, D., & Hillier, D. (2015). Materiality and external assurance in corporate
sustainability reporting: An exploratory study of UK house builders. Property Management, 33(5), 430-450.
18. Junior, R. M., Best, P. J., & Cotter, J. (2014). Sustainability reporting and assurance: a historical analysis on a world-wide phenomenon. Journal of Business Ethics, 120(1), 1-11.
19. Kalkstein, A., 2013, Companies’ benefits for and barriers to preparing a sustainability report, Pepperdine, viewed May 30, 2014, from https://bschool.pepperdine.edu/studentblog/index.php/the-growing-importance-of-sustainability-reporting/
20. Killick, T. (1995) IMF programs in developing countries: Design and impact, London: Rout-ledge.
21. Kolk, A., & Perego, P. (2010). Determinants of the adoption of sustainability assurance state-ments: an international investigation. Business Strategy and the Environment, 19(3), 182-198.
22. Kolk, A (2008) Accountability, Business strategy and the environment, 17 (1), pp. 1-15.23. KPMG (2011) KPMG International survery of corporate responsibility reporting 2011, avail-
able from: https://www.kpmg.com/PT/pt/IssuesAndInsights/Documents/corporate-respon-sibility2011.pdf
24. Lins, C., Althoff, R. & Meek, A. (2008) Sustainability reporting in the mining sector: value as-sociation and materiality, Fundacao Brasileira: FBDS.
25. Loussikian, K. (2014) ‘Reporting ‘misrepresents Business Sustainability: Study’, The Conversa-tion Trust, viewed March 30, 2014, from http://theconversation .com/reporting-misrepre-sents-business-sustainability-study-24771#omment_356871
26. Maubane, P. ,Prinsloo, A. & Rooyen, N., (2014) ‘Sustainability Reporting Patterns of Compa-nies Listed on the Johannesburg Securities Exchange’, Public Relations Review, April 2014.
27. O’Dwyer, B., & Owen, D. L. (2005). Assurance statement practice in environmental, social and sustainability reporting: a critical evaluation. The British Accounting Review, 37(2), 205-229.
28. Perego, P. (2009). Causes and consequences of choosing different assurance providers: An international study of sustainability reporting. International Journal of Management, 26(3), 412-425.
29. Perego, P., & Kolk, A. (2012). Multinationals’ accountability on sustainability: The evolution of third-party assurance of sustainability reports. Journal of Business Ethics, 110(2), 173-190.

73
Collins C. Ngwakwe, et.al., EXTENT OF SUSTAINABILITY ASSURANCE... Journal of Accounting and Management, vol: 6; no: 1, 2016; page 59 - 74
30. Peters, G. F., & Romi, A. M. (2014). The association between sustainability governance charac-teristics and the assurance of corporate sustainability reports. Auditing: A Journal of
31. Responsibility Reporting 201132. Sierra, L., Zorio, A., & García-Benau, M. A. (2013). Sustainable Development and Assurance of
Corporate Social Responsibility Reports Published by Ibex-35 Companies. Corporate Social Responsibility and Environmental Management, 20(6), 359-370.
33. Simnett, R., Vanstraelen, A., & Chua, W. F. (2009). Assurance on sustainability reports: An international comparison. The Accounting Review, 84(3), 937-967.
34. Vreeland, J. R. (2006). IMF program compliance: Aggregate index versus policy specific research strategies. The Review of International Organizations, 1(4), 359-378.
35. Wong, R., & Millington, A. (2014). Corporate social disclosures: a user perspective on assur-ance. Accounting, Auditing & Accountability Journal, 27(5), 863-887.

74
Collins C. Ngwakwe, et.al., EXTENT OF SUSTAINABILITY ASSURANCE... Journal of Accounting and Management, vol: 6; no: 1, 2016; page 59 - 74
OPSEG OSIGURANJA ODRŽIVOG RAZVOJA U JUŽNOAFRIČKIM RUDARSKIM TVRTKAMA
SAŽETAK RADA:Ovaj rad istražuje u kojem opsegu odabrane južnoafričke rudarske tvrtke imaju
osigurano Izvješće o održivom razvoju te vrednuju li se putem vanjskog ili internog vrednovanja.
Metodološki pristup kombinacija je kvalitativne i kvantitativne analize elemenata osiguranja u izvješćima o održivom razvoju. Nalazi pokazuju da je značajan dio rudar-skih tvrtki u skladu s zahtjevima King III osiguranja. Međutim, postoji prostora za na-predak posebice u zahtjevima vanjskog osiguranja i vrednovanja. Studija je pokazala pomanjkanje vanjskog osiguranja od strane određenih tvrtki te otklon od smjernica održivog razvoja. Nalazi pokazuju da, iako je pozitivno da tvrtke odgovaraju zahtjevi-ma osiguranja održivog razvoja potrebno je otprilike četiri godine da se iste usklade sa zahtjevima King III osiguranja izvještaja o održivosti. Stoga se preporuča da, između ostalog, donositelji odluka pri izradi smjernica i/ili politika održivog razvoja osiguraju tvrtkama dovoljno vremena za prilagodbu. Vanjsko vrednovanje izvještaja o održivosti trebalo bi biti obvezno te vođeno od strane kvalificiranih stručnjaka, primjerice ovla-štenih računovođa kako bi se osigurala bolja usklađenost i vjerodostojnost izvještaja o održivosti. Preporuča se da buduće studije prouče opseg nezavisnosti i objektivnosti vanjskih prosuditelja izvještaja o održivom razvoju u rudarskim tvrtkama.
Ključne riječi: računovodstvo održivog razvoja, osiguranje održivog razvoja, izvješćivanje o održivom razvoju, rudarske tvrtke,

75
Journal of Accounting and Management, vol: 6; no: 1, 2016; page 75 - 88
Preliminary PaperUDK: 657.3
Paper received: 31/03/2016Paper accepted: 27/05/2016
COST ACCOUNTING PRACTICES IN AFRICAN TRADITIONAL HEALING: A CASE STUDY OF MAKHUDUTHAMAGA TRADITIONAL HEALERS IN SOUTH AFRICA
Makomane TabaDepartment of Financial Management, School of Accountancy, University of Limpopo; Private Bag X1106, Sovenga 0727. [email protected] FakoyaDepartment of Financial Management, School of Accountancy, University of Limpopo; Private Bag X1106, Sovenga [email protected]
ABSTRACTThe study examines the challenges and potentials of adopting cost accounting
practices in African traditional healing. Although cost accounting is more prevalent in the private sector and the public sector, it is unpopular in African traditional healing. This study examines the necessity and benefits of adopting cost accounting practices to improve product and service pricing in African traditional healing. An exploratory case study that utilises focus group interviews of traditional healers at the Makhuduthamaga Local Municipality in South Africa was conducted. Findings revealed the need to improve decision-making in traditional healing through the integration of cost accounting princi-ples for appropriate costing of products and services through the provision of accurate cost accounting information. The study recommends the development of a unique cost accounting model for use by traditional healers in South Africa.
Key words: Cost accounting practices; Traditional healing practices; South Africa; traditional healers; traditional medicines; product costing; Traditional Healers Organisation.

76
Makomane Taba, et,al. COST ACCOUNTING PRACTICES.. Journal of Accounting and Management, vol: 6; no: 1, 2016; page 75 - 88
1. INTRODUCTION
Cost accounting is seen as one of the most effective management tools in strengthening organisation performance through effective decision making and systematic cost accounting formulation and implementation. Although cost accounting is more prevalent in the private sector and the public sector since the concept was first developed (Andon, Baxter & Chua, 2007; Effiong, 2012; Kludacz, 2012; Kuchta & Zabek, 2011; Livia & Györgyi, 2013; Bierer & Götze, 2012; Lotfi & Mansourabad, 2012; Speklé & Verbeeten, 2014; Boyd & Cox III, 2010); its use among African traditional healing practitioners, especially in South Africa, is still unpopular. Many reforms have been made to the tradi-tional healing sector in South Africa since becoming a democratic nation in 1994, and this has resulted in increased awareness about the importance of the services provided by traditional healers (Moagi, 2009). Kayne (2009) men-tions that there are almost 200 000 traditional healers in South Africa com-pared to about 25 000 medical doctors. In addition, Kale (1995) reports that about 80% of South Africa’s black population use the services of traditional healers before consulting medical doctors. In contrast, Mander, Ntuli, Died-erichs and Mavundla (2007:190) claim that “seventy-two percent of the Black African population in South Africa is estimated to use traditional medicine, accounting for some 26.6 million consumers.” However, there are claims and counter-claims regarding the statistics of the number of black South Africans patronising these traditional healers as their first point of consultation and medication. Notwithstanding these claims, it appears that traditional healing practices is quite popular among traditional Africans. As such, a health ser-vice sector as important as traditional healing in South Africa requires effec-tive management control systems to improve its planning, control and deci-sion making processes. While many studies were conducted on the costing of orthodox medicine (Gilmer et al., 2012; Bassett et al., 2014), there are a few studies that focus on the use of cost accounting systems to improve planning and management control systems in traditional healing practices especially in South Africa. It is in this context that the study examines the challenges and potentials of adopting cost accounting practices in African traditional heal-ing. The following sections discuss understanding cost accounting and African traditional healing, regulations of traditional healing practices in South Africa, the economic importance of traditional healing practices, the methodological approach, results, conclusions and recommendation as well as limitation of the study.

77
Makomane Taba, et,al. COST ACCOUNTING PRACTICES.. Journal of Accounting and Management, vol: 6; no: 1, 2016; page 75 - 88
2. UNDERSTANDING COST ACCOUNTING
According to Thakur (2011), cost accounting is the process of accounting for cost, income and expenditure relating to the production of goods and ser-vices rendered and is part of a management innovations design to reinvent both the public sector and the private sector. Cost accounting is an effective management tool to transform any bureaucratic system in both the public and private sectors to a more responsive and innovative administration (Wickra-masinghe & Alawattage, 2012). Cost and management accounting systems provide information for planning, control and decision making within an or-ganisation by focusing on determining the cost of projects, processes or prod-ucts (McNabb & Schafer, 2004). Cost accounting was developed because of the limitations of financial accounting (Alex, 2012; Livia & Györgyi, 2013). Hence, traditional healers in South Africa are likely to benefit from the adoption of cost accounting systems so that they can improve their product and service pricing.
2.1. UNDERSTANDING AFRICAN TRADITIONAL HEALING
Traditional healing in South Africa is intertwined with cultural and religious beliefs (Truter, 2007). Moagi (2009) describes a traditional healer as someone that possesses the gift of receiving spiritual guidance from the ancestral world by focusing not only on physical conditions, but also on the psychological, spiritual and social aspects of individuals, families and communities. Moreo-ver, in South Africa, traditional healers are seen as major providers of primary health care services and are known to provide social and cultural stability. Ndhlalambi (2009) explains that in South Africa, the traditional health system can be described as a holistic approach that focuses on the whole person’s health rather than particular organs or disorders; the body, spirit and environ-ment are all considered important to one’s health. Again, Moagi (2009) reflects that traditional healing practices in South Africa undergoes different stages, from the identification of the cause or discovery of ailments through supernat-ural divination to the removal of the hostile sources of sicknesses. Kale (1995) assumes that since a large proportion of the South African population consults through traditional healers confirms that traditional healing is a much valued component of the peoples’ lives. Basically, traditional healing in South Africa consists of two main categories: traditional healers and traditional medicines. Gqaleni et al. (2007) estimated that there are about 150,000 to 200,000 tradi-tional healers in South Africa belonging to about 100 separate associations. This confirms their importance within the society. Hence, the use of cost ac-counting practices may well help to improve their services.

78
Makomane Taba, et,al. COST ACCOUNTING PRACTICES.. Journal of Accounting and Management, vol: 6; no: 1, 2016; page 75 - 88
2.2. REGULATION OF AFRICAN TRADITIONAL HEALING IN SOUTH AFRICA
Despite certain areas of progress in South Africa since 1994, there still exist some disparities in health provision (Benatar, 2013). Richter (2003) lists leg-islations like the Witchcraft Suppression Act of 1957 and the Witchcraft Sup-pression Amendment Act of 1970 which prohibited traditional healers from practicing their trade as early as 1891. Notwithstanding that these laws were abolished with the advent of democracy in the country in 1994, traditional health practitioners and traditional medicines practices were still governed by the Witchcraft Suppression Amendment Act of 1970, hence the practice was still regarded as witchcraft under the Act. However, a new Traditional Health Practitioners Act was passed in 2004 and amended in 2007 to transform and regulate traditional healing practices in South Africa. The Act established a body to regulate the practices of some 200,000 or more traditional healers in South Africa (Moagi, 2009).
Incidentally, the regulation of South African traditional healers has not gone unchallenged because non-governmental organisations like the Doc-tors for Life International was totally opposed to the Act and the creation of the Institute of Traditional Heath Practice Council saddled with the issuance of licenses to practitioners. Despite all of these efforts, Moagi (2009) notes that traditional healers are yet to succeed in having their practices recognised as a legitimate health care provider like the conventional health practitioners. Tra-ditional healing was still regarded as a secret cult which had to be tolerated as one of the peculiarities of the African community (Rautenbach, 2011).
In contrast, the Traditional Health Practitioners Act of 2007 promotes the traditional healing philosophy as the use of indigenous African techniques, principles, theories, ideologies, beliefs, opinions, customs and the uses of traditional medicines communicated from ancestors to descendants or from generations to generations, with or without written documentation. In addi-tion, Gqaleni et al. (2007) indicate that the Act classifies traditional healers as diviners, herbalists, prophets or faith healers, traditional surgeons and birth attendants. The Traditional Healing Council is responsible for the registration of practitioners, the establishment of educational standards for registration and the general regulation of the health care professions (Gqaleni et al., 2007). Unfortunately, Tshehla (2015) recognises that the Council does not have the capacity to deliver satisfactorily on its mandate because of the difficulty in se-lecting genuine or credible practitioners from the bogus ones for registration purposes

79
Makomane Taba, et,al. COST ACCOUNTING PRACTICES.. Journal of Accounting and Management, vol: 6; no: 1, 2016; page 75 - 88
2.3. ECONOMIC IMPORTANCE OF TRADITIONAL MEDICINE AROUND THE WORLD
While traditional healing practices have been institutionalised and com-mercialised in South Africa and globally, there is no recorded information that identified the total expenditure and revenue from traditional health practices. Kayne (2009) reports that the traditional medicine trade in South Africa is a large and growing industry. However, Muela, Mushi and Ribera (2000) found disparities in fees charged by orthodox and traditional healing practices. For example, Muela et al. (2000) found that in Tanzania, the cost of treating malaria in an orthodox hospital is around $1.70, consisting of consultation of $0.50, lab services of $0.85 and drugs for $0.35, while Ngoma (fees for traditional healers’ basic therapy) cost about $10.70 consisting of about $1 for divination and be-tween $5 and $15 for treatment. Depending of the wealth or financial situation of the client, such treatment goes up to $50 or more. On the other hand, Pesek, Helton and Nair (2006) report that the world market for traditional medicine based on traditional healing knowledge has been estimated at $60 billion in 2009 (Robinson & Zhang, 2011; WHO, 2013). For example, Endashaw (2007) states that the traditional medicines’ industry in Ethiopia has remained an in-formal industry while the global value of herbal plants is estimated to be US$ 500 billion with the USA, Germany, China, India, Chile and Egypt playing the major role. Furthermore, Kayne (2009) estimates that there are about 27 mil-lion consumers of traditional medicines in South Africa and that the African healing trade contributes an estimated $193 million to the national economy with 771 plant species used for traditional medicine with a cost of about $320 per kilogram. The practical problem, however, is that the pricing of traditional healing in South Africa is unsubstantiated as the recently established Institute of Traditional Healing Council is yet to regulate the pricing of the products and services of the African traditional healing. Hence, the adoption of cost ac-counting systems into traditional healing practices will be significant to im-prove their product and pricing decisions.
3. METHODOLOGY
This study used an exploratory study method given that cost accounting practices is a relatively new phenomenon in African traditional especially in South Africa. In order to understand the experiences of the traditional healers about issues relating to product costing in African traditional healing, in-depth interviews were used. The research strategy was developed so that the tradi-tional healers could share their story to help resolve the research questions. The researchers used the focus group interviews, direct observations, docu-

80
Makomane Taba, et,al. COST ACCOUNTING PRACTICES.. Journal of Accounting and Management, vol: 6; no: 1, 2016; page 75 - 88
mentary analyses, newspapers and analyses of secondary sources approaches. Fieldwork was carried out in the Makhuduthamaga Local Municipality in South Africa during June 2015 in a focus group of seven traditional healers. De Vaus (2001) and Fox (2006) regard an interview as a conversation with a purpose. According to Bless and Higson-Smith (2006), an interview involves direct per-sonal contact with the participant who is asked to answer questions relating to the research problem.
Data were collected through semi-structured questions since the study area is both sensitive and under-researched. Rajasekar et al. (2006) regard the qualitative research approach as a non-numerical, descriptive, applying rea-soning and using words and to get the meaning, feeling and to describe the research situation. De Vaus (2001) claims that the objective of a qualitative re-search design is to ensure that evidence obtained answers the research ques-tions as unambiguously as possible. According to Folkestad (2008), the research design serves as a guide to the systematic collection of data. The unit analysed for this study was the Traditional Healers Organisation in the Makhuduthama-ga Local Municipality under the National Department of Health of South Af-rica. The Traditional Healers Organisation is a non-statutory, professional or-ganisation for traditional health practitioners who subscribe to the Traditional Healers Practitioners Act 2007. This organisation is responsible for organising, training, certifying traditional health practitioners and fighting for members’ rights to practice in tradition healing. They also assure the values, quality of treatment, efficacy, safety and ethical standards of member practitioners and have knowledge about traditional healing of different kinds of ailments and share this knowledge through their training programmes. The purpose of us-ing the Traditional Healers Organisation in Makhuduthamaga Local Municipal-ity as the unit for analysis was because they granted access to the researchers who understand and speak their local language (Sepedi) which made it easier to gather the necessary information and data. Special attention was given to providing clarification and finding of possible reasons for explaining cost ac-counting in traditional healing. The researcher categorised the responses to check for similarities.
The data analysis entails organising and arranging the information ob-tained in a logical order whereby data are categorised and arranged into mean-ingful groupings to scrutinise common themes and patterns. Respondents are registered members of the Makhuduthamaga Local Municipality Traditional Healers Organisation. They were informed of the purpose of the interview and the place, date and time of the interview were agreed upon. The locations of the interviews varied depending on interviewees’ convenience. In order to conduct the interview, appointments with the interviewees were set with

81
Makomane Taba, et,al. COST ACCOUNTING PRACTICES.. Journal of Accounting and Management, vol: 6; no: 1, 2016; page 75 - 88
their consent. The interview was not only based on the pre-set questions by the researcher but also included questions that the researcher thought would be necessary to achieve the purpose of the study. The method of recording responses from interviews was done with a video-recorder. A focus group al-lows the researcher to collect information from a small group, while observing non-verbal behaviour and guiding and probing the participants so that all the information required can be uncovered.
3.1. DOCUMENTATION
As content analysis is part of getting evidence for this study, relevant sup-porting documentation was analysed. The material were the official documents such as, Traditional Healers Organisation (THO) profile, THO Code of Conduct and Grievance Procedures policy, THO Code of Ethics and Behaviour Policy, Identification of target groups of traditional health practitioners for training, Guidelines for formulating policies on training of healers, South African Char-ter of Religious Rights and Freedom, THO Code of Ethics, Heritage Transforma-tion Charter, Declaration on traditional medicine and Traditional Health Prac-titioners Act 2007. Since the records are maintained not for research purposes, but for regulations and administration, the information required may not be recorded at all or only partly recorded.
3.2. DIRECT OBSERVATION
Direct observation was carried out during the site visits and field work. The selection of traditional healers visited was based on the recommendation of the chairperson of the traditional healers’ organisation in the Makhuduthama-ga Local Municipality. The visit involved meeting with traditional healers at the discretion and approval of the chairperson within the Makhuduthamaga Local Municipality. Direct observation was used to observe the practice of cost ac-counting in African traditional healing.
3.3. DATA ANALYSIS
Qualitative data generated from the interview were analysed using the thematic analysis technique. The common themes were developed and sup-ported through verbatim quotes. Using the research questions as tools for analysis, the researcher highlighted the relevant texts which are critical for this study. According to Lancaster (2005), data analysis refers to the process of turning data into information in developing concepts, theories, explanations and understanding. A content analysis was carried out to retrieve any useful information that addresses the research questions from the association’s re-cords. For this study, the researcher read the documents, interview transcripts

82
Makomane Taba, et,al. COST ACCOUNTING PRACTICES.. Journal of Accounting and Management, vol: 6; no: 1, 2016; page 75 - 88
and notes repeatedly as documentary materials proved useful in addressing the research questions.
3.4. ANALYSIS OF INTERVIEW DATA
Analysing qualitative data is basically a process of organising, categoris-ing and meaningfully interpreting a large volume of words obtained from in-terviews, field notes or documentary surveys. Creswell (2009) and Folkestad (2008) argue that, regardless of the different ways of analysing the data, any analysis technique has to be anchored to the conceptual framework and tied up to the research objectives of the study. As qualitative data involve a huge amount of written and spoken data, a researcher should look for a sound way to begin the analyses or else a researcher will simply drown in the stream of data. While there are no hard and fast rules as to how to commence the data analyses, suggestions by Creswell (2009) proposed a three phase qualitative data analysis such as data reduction, data display and conclusion drawing as useful to the researcher.
4. FINDINGS
The focus group questions are divided into related themes. The role of cost accounting in traditional healing in the revitalisation of the current health care system is critical. The introductory focus group showed that cost accounting can be implemented in African traditional healing in a practical, simple and tailor-made way for the business. It is also observed that cost accounting is not necessary practiced in traditional healing within the group but they have an arbitrary approach to deciding service charges.
Necessity of cost accounting in African traditional healingMost of the traditional healers in the focus group agree that adopting a
modified cost accounting system will improve traditional healing practices. The first impression of the investigation suggests possible reasons for the tra-ditional healers using cost accounting and the necessity of cost accounting in African traditional healing. It soon appeared that these traditional healers, though, have benchmark charges to determine the unit price of the products and services; the majority of them charge their clients in an unregulated man-ner. Findings indicate that following from the benchmark charges, most of the traditional healers charge their clients based on their affluence. This means that clients are charge based on their economic status.
Responding to a consideration of adopting cost accounting as a useful tool to turnaround their business practices, the traditional healers believe that since the use of cost accounting had been successful in other types of busi-

83
Makomane Taba, et,al. COST ACCOUNTING PRACTICES.. Journal of Accounting and Management, vol: 6; no: 1, 2016; page 75 - 88
nesses, they believe it will also be useful to determine their charges as well as improve their decision-making processes. It cannot be said that the traditional healers partially use cost accounting in their traditional healing processes be-cause there is no formal record keeping of cost determination.
Findings highlight the fact that many traditional healers believe that if they were aware of cost accounting practices, pricing of their products and services would have been more realistic and would have enabled them to de-cide whether to increase charges or not. Most of the traditional healers were not aware of cost accounting practices, as a result they have never thought about pricing their products and services differently and appropriately as it has been very difficult to price and measure the production costs.
Cost accounting information will enable traditional healers to determine monthly budgets, annual costs and revenue of the products and services as they continue to provide the services diligently if implemented. They hope to explore cost accounting potentials to address health care and economic needs of the country by adequately determining service costs and charges. Hence, there is a need to facilitate decisions in traditional healing through cost ac-counting principles regarding the appropriate costing of products and ser-vices through the provision of accurate cost accounting information. The next section will explain the conclusion of the findings for the reason of the partial usage of cost accounting in African traditional healing.
Usage of cost accounting in African traditional healing.The lack of available literature to determine the extent of cost accounting
practices to improve product and service pricing in African traditional healing, especially in South Africa, suggests a gap regarding its application. Findings reveal potential challenges to the application of cost accounting in African tra-ditional healing to include lack of costing skills among traditional healers. This lack of costing skills is due mainly to the fact that only a few of the practition-ers have education beyond the high school level. But traditional healers will be able to utilise cost accounting functions to capture the entire process flow of the products and services. The traditional healers believe that if they are able to adopt and use cost accounting like their modern medical practitioners counterpart, it will raise their level of acceptance by the society and improve their patronage. Due to their non-exposure to cost accounting, the traditional healers were never requested by the Traditional Healers Organisation to gen-erate cost-related information about their practices for unified price regulation in treating their clients.
The traditional healers are confident that cost accounting will be able to assist them to prepare a cost accounting data-base for their products and ser-vices and maximise inventory valuation. The data gained from the focus group

84
Makomane Taba, et,al. COST ACCOUNTING PRACTICES.. Journal of Accounting and Management, vol: 6; no: 1, 2016; page 75 - 88
interview showed the lack of exposure to cost accounting practices neither have any of them contracted a professional to help generate cost information regarding their business. The traditional healers in this focus group have there-fore requested the researcher to assist in training them on how to adopt cost accounting into their practices.
They hoped that cost accounting will assist them in drawing up annual budgets and cost statements which will include a medication inventory since some of their medications are stored up for months with no appropriate expiry date. Most of their product inventory are difficult to value because they lack proper storage while they find it difficult to determine the value of products used for specific clients. Hence, there is a need to facilitate decisions in tradi-tional healing by introducing cost accounting practices to provide accurate cost accounting information to improve their decision-making processes in general.
5. CONCLUSIONS
The importance of cost accounting practices in both private and public organisations has been explained. Cost accounting has the potential to benefit the traditional healers as well, although it cannot be stated as a precondition for success. The lack of cost accounting skills among the majority of uneducat-ed traditional healing practitioners is a major challenge as found by this study. The use of an arbitrary pricing regime is a major reason for inconsistency in regulating traditional healing practices. There is a clear need for cost account-ing skills training for traditional healers just like for every business person. This will enable them to prepare annual financial reports that will enable their ser-vices to be subjected to tax by the authorities. One benefit of cost accounting will be to provide traditional healers with a comprehensive data-base for their products and services. This will serve as a future reference point for all cost-related issues. As with any qualitative study, there are limitations as to the gen-eralisability and reliability of the findings. As such, some of the findings may not be generalizable. However, this study provides a starting point for future study into the area of cost accounting in traditional healing.
5.1. RECOMMENDATIONS FOR FUTURE RESEARCH
Cost accounting systems can be implemented in African traditional healing as more practical, simple and tailor-made. The policy makers will find the adop-tion of cost accounting systems in African traditional healing a useful step at integrating the practice into a main stream health care system and to develop strategies to protect clients from unscrupulous practitioners who are in the busi-

85
Makomane Taba, et,al. COST ACCOUNTING PRACTICES.. Journal of Accounting and Management, vol: 6; no: 1, 2016; page 75 - 88
ness to exploit the vulnerable. There is potential for further study to develop a tailor-made cost accounting system for traditional healing practices especially in local languages that will meet the yearning of uneducated practitioners.
ACKNOWLEDGEMENT
Special thanks to the members of the Makhuduthamaga Traditional Heal-ers Association and the broader Traditional Health Organisation of South Af-rica for granting permission to be our focus group for the conduct of these in-depth interviews.
REFERENCES 1 Alex, K. 2012. Cost Accounting. Pearson Education. India2 Andon, P., Baxter, J. & Chua, W.F. 2007. Accounting change as relational drifting: A field
study of experiments with performance measurement. Management Accounting Research, 18(2):273-308.
3 Bassett, I.V., Govindasamy, D., Erlwanger, A.S., Hyle, E.P., Kranzer, K., Van Schaik, N., Noubary, F., Paltiel, A.D., Wood, R., Walensky, R.P. and Losina, E., 2014. Mobile HIV screening in Cape Town, South Africa: clinical impact, cost and cost-effectiveness. PLoS One, 9(1):85197.
4 Benatar, S. 2013. The challenges of health disparities in South Africa. The South African Medi-cal Journal, 103(3):154-155
5 Bierer, A. & Götze, U. 2012. Energy Cost Accounting: Conventional and Flow-oriented Ap-proaches. Journal of Competitiveness, 4(2):128-144.
6 Bless, C., Higson-Smith, C. & Kajee, A. 2006. Fundamentals of Social Research Methods: An African perspective, 4th edition. Cape Town: Juta and Company.
7 Boyd, L.H. & Cox III, J.F. 2010. Optimal decision making using cost accounting information. International Journal of Production Research, 40(8):1879-1898.
8 Creswell, J.W. 2009. Research Design: Qualitative, Quantitative and Mixed Methods Ap-proaches, 3rd edition. Los Angeles: Sage Publications Inc.
9 De Vaus, l.D.A. 2001. Surveys in Social Research, 5th edition. London: Routledge. 10 Effiong, S.A. 2012. Applicability of the Synchronized Models of Modified Current and Histori-
cal Cost Accounting Methods on the Reported Profits. Research Journal of Finance and Accounting, 3(9):127-136.
11 Endashaw, B. 2007. Study on Actual Situation of Medicinal Plants in Ethiopia. Japan Associa-tion for International Collaboration of Agriculture and Forestry, 2:1-9.
12 Folkestad, B. 2008. Analysing interview data: Possibilities and challenges. Eurosphere Online Working Paper Series, 13.
13 Fox, N., 2006. Using interviews in a research project. Trent RDSU. 14 Gilmer, T.P., O’Connor, P.J., Sperl‐Hillen, J.M., Rush, W.A., Johnson, P.E., Amundson, G.H., Asche,
S.E. & Ekstrom, H.L. 2012. Cost‐Effectiveness of an Electronic Medical Record Based Clinical Decision Support System. Health Services Research, 47(6):2137-2158.
15 Gqaleni, N., Moodley, I., Kruger, H., Ntuli, A. & McLeod, H. 2007. Traditional and complemen-tary medicine. South African Health Review, 12:175–88.
16 Kale, R. 1995. Traditional healers in South Africa: a parallel health care system. BMJ: British Medical Journal, 310(6988):1182.
17 Kayne, S.B. 2009. Introduction to traditional medicine. Complementary and Alternative Medicine, 2nd Edition, Pharmaceutical Press, London, pp.1-24.

18 Kludacz, M. 2012. The principles of cost accounting in Polish hospitals. In Proceedings in EIIC-1st Electronic International Interdisciplinary Conference (No. 1), 3-7 September.
19 Kuchta, D. & Zabek, S. 2011. Activity Based Costing for health care institution. 8th Interna-tional Conference on Enterprise System, Accounting and Logistic (8th ICESAL, 2011), 11-12 July. Thassos Island: Greece.
20 Lancaster, G. 2005. Research Methods in Management: A concise introduction in manage-ment and business consultancy. Oxford: Butterworth-Heineman.
21 Livia, R. & Györgyi, P. 2013. Current Cost Accounting Methods: Challenge for Accounting Profession. University of Novi Sad, Faculty of Economics. Subotica, Serbia.
22 Lotfi, A. & Mansourabad, M.A. 2012. The investigation and explaining of activity- based cost-ing (ABC). Journal of Basic and Applied Scientific Research, 2(3):2860-2864.
23 Mander, M., Ntuli, L., Diederichs, N. & Mavundla, K., 2007. Economics of the traditional medi-cine trade in South Africa: health care delivery. South African Health Review, 189-196.
24 McNabb, D.E. & Schafer, E.L. 2004. Developing small business cost accounting systems: A Live Case Study Approach. Pacific Lutheran University.
25 Moagi, L. 2009. Transformation of the South African health care system with regard to African traditional healers: The social effects of inclusion and regulation. International NGO Journal, 4 (4):116-126.
26 Muela, S.H., Mushi, A.K. & Ribera, J.M., 2000. The paradox of the cost and affordability of tra-ditional and government health services in Tanzania. Health Policy and Planning, 15(3):296-302.
27 Ndhlalambi, M. 2009. Strengthening the capacity of traditional health practitioners to re-spond to HIV/AIDS and TB in Kwazulu Natal, South Africa. AMREF Case Studies, 2009:26-55.
28 Pesek, T., Helton, L. & Nair, M. 2006. Healing Across Cultures: Learning from Traditions. Eco Health, 3(2):114-118.
29 Rajasekar, S., Philominathan, P. & Chinnathambi, V. 2006. Research Methodology. ArXIV Phys-ics. <http://arxiv.org/abs/physics/0601009v2 > Accessed 22 May 2015.
30 Rautenbach, C. 2011. Institutionalisation of African traditional medicine in South Africa: Healing powers of the law. Journal of Contemporary Roman-Dutch Law, 74:28-46.
31 Richter, M. 2003. Traditional Medicines and Traditional Healers in South Africa. Discussion paper prepared for the Treatment Action Campaign and AIDS Law Project: 27 November.
32 Robinson, M.M. & Zhang, X. 2011. The world medicines situation 2011. World Health Oor-ganisation.
33 Speklé, R.F. & Verbeeten, F.H. 2014. The use of performance measurement systems in the public sector: effects on performance. Management Accounting Research, 25(2):131-146.
34 Thakur, S. 2011. Medicinal Plants used by Tribal Inhabitants of Sirmoyr District. Himachal Pradesh. Indian Journal of Science and Research, 2(4):125-127.
35 Tshehla, B., 2015. Traditional health practitioners and the authority to issue medical certifi-cates. SAMJ: South African Medical Journal, 105(4):279-280.
36 Wickramasinghe, D. & Alawattage, C. 2012. Management Accounting Change: Approaches and Perspectives. London: Routledge.

87
Makomane Taba, et,al. COST ACCOUNTING PRACTICES.. Journal of Accounting and Management, vol: 6; no: 1, 2016; page 75 - 88
RAČUNOVODSTVO TROŠKOVA U AFRIČKOM TRADICIONALNOM LIJEČENJU: STUDIJA SLUČAJA TRADICIONALNIH ISCJELITELJA MAKHUDUTHAMAGA U JUŽNOJ AFRICI
SAŽETAK RADA:Studija istražuje izazove i potencijale usvajanja računovodstva troškova u afričkoj
tradicionalnoj iscjeliteljskoj praksi. Iako računovodstvo troškova prevladava u privat-nom I javnom sektoru nije usvojeno u afričkom tradicionalnom liječenju. Ova studija istražuje nužnost i prednosti usvajanja prakse troškovnog računovodstva kako bi se poboljšali proizvodi I usluga u afričkom tradicionalnom liječenju. Istraživačka studi-ja provodila se na fokus grupama tradicionalnih iscjelitelja Makhuduthamaga općine u Južnoj Africi provođenjem grupnih intervjua. Nalazi istraživanja pokazuju potrebu za poboljšanjem procesa donošenja poslovnih odluka kroz integraciju principa troš-kovnog računovodstva i pružanjem ispravnih računovodstvenih informacija. Studija preporuča razvoj jedinstvenog modela računovodstva troškova koji bi koristili tradici-onalni iscjelitelji u Južnoj Africi.
Ključne riječi: računovodstva troškova; tradicionalne iscjliteljske prakse; Južna Afrika; tradicionalni iscjelitelji; tradicionalna medicina; trošak proizvoda; Udruženje tradicionalnih iscjelitelja.


89
Journal of Accounting and Management, vol: 6; no: 1, 2016; page 89 - 114
Scientific ReviewUDK: 658.14
Paper received: 04/02/2016Paper accepted: 09/05/2016
THE SEQUENCING OF FINANCIAL REFORMS AND BANK-BASED FINANCIAL DEVELOPMENT IN MAURITIUS
Brian Muyambiri1
Department of Economics, University of South AfricaPretoria, South [email protected] / [email protected] Prof NM OdhiamboDepartment of Economics; University of South AfricaPretoria, South [email protected] / [email protected]
ABSTRACTThis paper presents the sequencing of the financial reforms and financial sector
development in Mauritius. With the aid of selected data from the World Development Indicators and the Financial Structure database, the paper also gives an analysis of the resultant changes (due to reforms) in the banking sector of Mauritius during the post-financial reform period. Inclinations show increased financial development, which can mainly be explained by increased personal credit, deposits and financial products, and increased bank competition. The maintenance of a stable macroecono-mic environment, as well as a strong prudential regulation and supervision landscape, are some of the factors that have enabled financial development to become a success in Mauritius.
Keywords: financial development, financial reforms, Mauritius, monetary policy
1 Corresponding Author [Doctoral Student, Economics Department, University of South Africa, Pretoria]

90
Brian Muyambiri, et.al.; THE SEQUENCING OF FINANCIAL REFORMS... Journal of Accounting and Management, vol: 6; no: 1, 2016; page 89 - 114
1. INTRODUCTION
The financial sector has been attested as one of the fundamental back-bones for economic growth. On the other hand, some researchers have been saying the opposite – economic growth leads to financial sector development. The discussion and research on the financial development-economic growth nexus has been the subject of a number of recent and not so recent studies. However, the process of financial development for a number of African coun-tries has not been fully documented in a chronological manner in such way that one can follow through on the resultant successes or failures achieved as far as financial development is concerned. Notable among these countries, due to its above average economic performance, is the Republic of Mauritius. Since its independence, Mauritius has made notable economic strides that have seen its development being relatively incomparable to most African countries. Starting as an economy mainly driven by sugar production, Mauri-tius has grown into one of Africa’s success stories. Its exceptional growth was based on a number of economic stages and strategies that worked together to achieve the expected objectives. Prior to its independence in 1968, Mauritius was a low-income plantation economy based, to a great extent, on one crop, i.e. sugar. Sugar was produced on a regular basis for supply to the colonisers of the day, Great Britain, and all other manufacturing activities were centred on sugar production and its complement products like tea. Following independ-ence, a number of strategies were put in place to expand the economy’s abil-ity to be self-sufficient and for diversification. Initially, the import substitution strategy (ISI) was adopted. Protectionism and the establishment of a develop-ment bank so as to provide a systematic flow of alternative subsidised finance to new and upcoming industries and investment projects (Jouan, 2005:3). Count down more than 40 years later, the economy of Mauritius is one of the most robust relative to other African economies and has a formidable financial services sector. Due to radical levels of growth the GDP of the economy neces-sitated the Mauritian government to put up a financial liberalisation policy at the beginning of the 1990s. The financial sector was taken as being of much importance in attaining national and international financial intermediation standards that would lead to even higher economic performance (Sobhee & Bhowon, 2007:31). Given the view of the government of Mauritius, the pa-per gives an overview of the chronological evolution of financial reforms and bank-based financial development in Mauritius. In addition, an analysis of the progression and performance of financial intermediaries with particular em-phasis on bank market development gives some concluding remarks and sug-gestions.

91
Brian Muyambiri, et.al.; THE SEQUENCING OF FINANCIAL REFORMS... Journal of Accounting and Management, vol: 6; no: 1, 2016; page 89 - 114
The rest of the paper is structured as follows. The second section provides an initial outline of how monetary policy and financial sector reforms have progressed in Mauritius over the years. The third section gives a summary of the chronological evolution of the banking sector in Mauritius. The fourth sec-tion provides a discussion of the trends in specific financial sector and bank-performance development. The final section gives some concluding remarks.
2. MONETARY POLICY AND FINANCIAL SECTOR REFORMS IN MAURITIUS
Monetary policy in Mauritius, as in all other countries, is spearheaded by the central bank, that is the Bank of Mauritius. Despite the evolution of mon-etary policy through the years since the creation of the Bank of Mauritius in 1967, the handling of monetary policy has taken on a larger implication with the advent of the process of economic and financial liberalisation in the late 1980s and 1990s. During the financial liberalisation period, a number of finan-cial reforms were implemented. These include, amongst others: i) the devel-opment of the capital and money markets; ii) the promotion of a wide range of financial institutions and instruments; iii) competition within the financial system; iv) world integration; v) the setting up of an appropriate regulatory framework; and vi) the establishment of a market-based monetary control sys-tem (see Jankee, 1999: 14).
Before the gradual process of financial liberalisation in the late 1980s, policy mainly focused on setting maxima on the credit expansion by banks through the enactment of high reserve requirements. Moreover, interest rate guidelines that were based on directed lower interest rate policy to high pri-ority sectors (for example, the sugar plantations). Though the main objective of monetary policy was to encourage investment, the control of the financial sector by the state managed to discourage financial deepening which led to lower levels of competition amongst financial institutions.
During the financial liberalisation period, exchange controls were re-moved; a more flexible exchange rate regime replaced the previous basket-peg regime, and policy switched from direct control to indirect monetary manage-ment. However, the use of the Lombard Facility up until December 2006 made the Bank of Mauritius (BOM) the lender of first resort rather than the lender of last resort. Under the Lombard Facility, the Bank of Mauritius stood ready to provide overnight-collateralised advances to banks at their initiative. The rate payable for use of this facility, the Lombard Rate, acted as a signal of the monetary policy stance of the Bank. In addition, the Lombard rate signalled changes in market interest rates and was used to ensure appropriate liquidity

92
Brian Muyambiri, et.al.; THE SEQUENCING OF FINANCIAL REFORMS... Journal of Accounting and Management, vol: 6; no: 1, 2016; page 89 - 114
levels in the economy. The main operations conducted by the Bank to manage liquidity are the sale/purchase of Bank of Mauritius Bills, and repurchase trans-actions (Heerah-Pampusa et al., 2006:25). In December 2006, the Repo Rate eventually replaced the Lombard Rate as the key policy rate to signal changes in its monetary policy stance (Tsangarides, 2010:5). A standing facility without any borrowing quota and through which the Bank provides a collateralised overnight facility to banks was also introduced in replacement of the Lombard Facility. The rate of interest chargeable on the Standing Facility was set at 400 basis points above the Repo Rate (BOM Annual Report, 2007:7). The change in accommodation policy enhanced the inter-borrowing relationship amongst banks in the market mainly because the money market rate has been relatively much lower than the Lombard rate. In addition, upon the enactment of the Bank of Mauritius Act of 2004, the Monetary Policy Committee (MPC) was insti-tuted. The MPC, which includes the BOM Governor and two Deputy Governors, two Board Directors and four members as appointed by the Minister, has been formulating the monetary policy of the Bank of Mauritius since 2007 (Tsan-garides, 2010:5). The advance of monetary policy and financial sector reforms from 1987 onwards is presented in Table 1 below.
Table 1: Sequencing of Monetary Policy and Financial Sector Reforms
1987 • Removalofexchangecontroloncurrentaccount(endedin1992)1988 • Liberalizationofinterestrates1989 • LiberalizationofExchangeRateControls1991 • IssueofBankofMauritiusBills
• Auctioningofbills• Gradualeliminationofdirectedcreditprogramme• Firstphaseofopenmarketoperationsbeginswithtreasurybillsintheprimarymar-
ket• Liberalizationofcapitalaccount(endedin1994)
1992 • Abolitionofceilingsoncredittoprioritysectors• Accommodationpolicyreviewedsothatbankshavingliquiditydeficitseekreserves
from the interbank market before seeking refinancing from the central bank1993 • Abolitionofcreditceilingsonnon-prioritysectors
• Impositionofacredit-depositratio• Minimumrisk-weightedcapitaladequacyratioof8%
1994 • February–SettingupoftheSecondaryMarketCellatBankofMauritius• June–BankRatelinkedwithweightedaverageyieldofTreasuryBilloverpreceding
12 weeks plus a margin• July–SuspensionofExchangeControlAct• July–EstablishmentoftheInterbankForeignExchangeMarket
1995 • July–BankratelinkedtooverallyieldonTreasuryBillsatmostrecentauctionplusmargin
1996 • July–Abolitionofcredit-depositratio• July–Impositionof15%limitontheoverallforeignexchangeexposure• December–BankratelinkedtooverallyieldonTreasurybillsatmostrecentauction
plus a margin phasing out of the high reserve requirement begins

93
Brian Muyambiri, et.al.; THE SEQUENCING OF FINANCIAL REFORMS... Journal of Accounting and Management, vol: 6; no: 1, 2016; page 89 - 114
1997 • July–Cashratiobroughtdownto6%andnon-cashliquidassetratioto0%1998 • July–Issueof728daysTreasuryBills
• December–Creationofsecondarymarketintreasurybillsthroughoverthecounter(OTC) sales of treasury bills to individuals and non-financial institutions
• Phasingoutofthehighreserverequirementends1999 • December–Issueof30-dayTreasurybills
• Introduction of Reversed REPOTransactionsmarking the second phase of openmarket operations which allowed the central bank to influence the liquidity of the banking sector
• IntroductionoftheLombardFacility2000 • November–IntroductionofSwapTransactions
• December–IntroductionoftheMauritiusAutomatedClearingandSettlementSys-tem
2001 • June–IntroductionofStockExchangeofMauritiusAutomatedTradingSystem(SE-MATS)
2002 • EstablishmentofPrimarydealersystem• BankofMauritiusthereforeceaseditsoverthecountersaleofGovernmentofMau-
ritius Treasury Bills to individuals and non-financial institutions.• TheestablishedprimarydealerswereBarclaysBankPLC,StatebankofMauritius
Ltd, The Hong Kong and Shanghai Banking Corporation Limited and The Mauritius Commercial Bank Ltd
2003 • December–TradingofTreasury/BankofMauritiusBillsontheStockExchange2005 • November–EstablishmentofaCreditInformationBureau2006 • TheReporate introducedreplacingtheLombardfacilityasthekeypolicyrateto
signal changes in its monetary policy stance• Reporatesetat8.5%• AstandingfacilityintroducedtoreplacetheLombardfacility
2010 • RepoRatecutby100basispointsto4.75percent
Source: Jankee (2006); Bank of Mauritius Reports (various issues)
3. SUMMARY OF MAURITIUS’ BANKING SECTOR DEVELOPMENT
A look at the history of the Mauritian banking sector shows that it started in the early 1800s. It has, however, experienced a number of bank closures and entries throughout its more than 200 years of existence. The Bank of Mauritius is the central bank in Mauritius. Banking sector development in Mauritius has been characterised by major diversification of products and services amongst banks; as some banks have ventured into non-bank financial services. Some of the products and services offered by the Mauritian banking sector include: leasing and asset management; private equity; stockbroking; investment ser-vices; specialist services in cross-border transactions; trustee and fiduciary services; wealth management and private banking; and remittance services. In addition, the emergence of non-bank financial institutions, banking sector mergers and acquisitions, and the development of the offshore banking sec-tor has made significant contributions to the financial landscape in Mauritius.

94
Brian Muyambiri, et.al.; THE SEQUENCING OF FINANCIAL REFORMS... Journal of Accounting and Management, vol: 6; no: 1, 2016; page 89 - 114
Table 2 presents a summary of the historical background of the banking sector in Mauritius and its legal reforms from 1810 onwards.
Table 2: Summary of Financial Development in Mauritius (1810 – 2012)
1810 • ColonialBankofMauritius,BourbonandDependenciesestablished1813 • Colonial Bank ofMauritius, Bourbon and Dependencies closed down in
September because it did not have prior authorization from the Secretary of State
• LaBanquedeL’ileMaurice(BankofMauritius)establishedinDecember1826 • LaBanquedeL’ileMauriceliquidated1831 • BanquedeMauriceestablished1838 • MauritiusCommercialBank(MCB)incorporated(initiallyasBanqueCom-
merciale de I’isle Maurice)1848 • BanquedeMauricestoppedoperationsduetothe1847Londonfinancial
crisis leaving the MCB as a monopoly banking institution1852 • OrientalBankCorporationestablished1859 • CharteredMercantileBankofIndiaestablished1881 • BanqueFranco-Egyptienneestablished1865 • CharteredMercantileBankofIndiastoppedoperations1885 • OrientalBankCorporationexitedthemarket1886 • NouvelleBanqueOrientalestartsoperations1889 • BanqueFranco-Egyptienneexitedthemarket1892 • NouvelleBanqueOrientaleexitsthemarketleavingMCBasthemonopoly
bank in MauritiusLate 1800s and
early 1900s• Foreignbanksestablished localbranchesanda few locally incorporated
banks (e.g. the Post Office Savings Bank) but MCBs dominant position con-tinued
1916 • TheHongKongandShanghaiBankingCorporationLimitedestablishedabranch (formerly known as The Mercantile Bank Limited).
1919 • BarclaysBankMauritiusstartsoperations1955 • MauritiusCommercialBankbecamealimitedliabilitycompany1959 • P.T.BankInternasionalIndonesiaTbk.(Bll)established1962 • BankofBarodaestablished1964 • HabibBankLimitedsetsupabranchinMauritius1966 • BankofMauritiusActenacted1967 • CreationoftheCentralBank1973 • StateCommercialBankLtdestablishedbythegovernment,laterrenamed
State Bank of Mauritius1986 • Liberalization of exchange controls onboth current and capital transac-
tions1988 • Offshorebanksallowedtooperate
• BramerBankingCorporationLtdestablished(formerlyknownasSouthEastAsian Bank Ltd)
• StockExchangeAct1988

95
Brian Muyambiri, et.al.; THE SEQUENCING OF FINANCIAL REFORMS... Journal of Accounting and Management, vol: 6; no: 1, 2016; page 89 - 114
1989 • StockExchangeofMauritiuscreated• BarclaysBankMauritiusbecomesfirstbanktobegrantedanoffshorebank-
ing license • BankingAct,effectiveon1January.
1991 • Banque InternationaledesMascareignes Limitee commencesoperationsas an offshore banking business
1992 • MauritianOffshoreBusinessActivitiesAct (MOBA)enactedgiving rise tothe Mauritian Offshore Business Activities Authority (MOBAA), which was set up to regulate and supervise the non-bank offshore sector.
• MauritiusOffshoreBusinessActivitiesAuthoritybecomestheregulatorofthe offshore sector
1993 • AbolitionofCreditceilings.1994 • The liberalization of capital controls/the establishment of an inter-bank
foreign exchange market and the adoption of the managed float of the ex-change rate
• StateBankofMauritiusopensitsfirstoverseasbranchinMumbaiIndia.1995 • StateBankofMauritiuslistedonStockExchangeofMauritius
• DeutscheBankstartsoperations1997 • SouthAfricanBankNedcoracquires20.1%ofStateBankofMauritius
• StateBankofMauritiusopenssecondbranchinIndiainChennai• InvestecBank(Mauritius)Limitedestablished
1998 • StateBankofMauritiusopensthirdbranchinIndiainHyderabad2001 • FinancialServicesDevelopmentActwhichenabledtheconceptionofthe
Financial Services Commission (FSC)• StandardBank(Mauritius)Limitedstartsoperations(November)
2002 • Financial IntelligenceandAnti-MoneyLaunderingAct introducedpavingthe way for the creation of the Financial Intelligence Unit (FIU)
• BankOneLimitedcommencesbusinessoperations• BarclaysBanktakesoverBanqueNationaledeParisIntercontinentaleMau-
ritius (BNPI)• StandardCharteredBank(Mauritius)Limitedestablished
2003 • MauritiusPostandCooperativeBankLtdestablishedthroughamergerofthe New Cooperative Bank Ltd with the Post Office Savings Bank
2004 • BanqueInternationaledesMascareignesLimitéechangesitsnametoMas-careignes International Bank Ltd when it became a wholly owned subsidi-ary of Financiére Océor
• BanquedesMascareignesLtéeanothersubsidiaryofsubsidiaryofFinan-ciére Océor began operations in Mauritius as a domestic banking business
• RevisionoftheBankingActandBankofMauritiusAct2005 • WiththecomingoftheBankingAct2004,MascareignesInternationalBank
Ltd merged its operations with Banque des Mascareignes Ltée2006 • HSBCstartsoperations2007 • FormationofaMonetaryPolicyCommitteeandtheenactmentoftheFi-
nancial Services Act• AfrAsiaBankfounded• BankOneLimitedacquiredthroughajointventurebetweenalocalgroup
CIEL Investment Limited and the Kenyan group, Investment and Mortgages Bank Ltd.

96
Brian Muyambiri, et.al.; THE SEQUENCING OF FINANCIAL REFORMS... Journal of Accounting and Management, vol: 6; no: 1, 2016; page 89 - 114
2008 • SBI (Mauritius) Ltd established through the amalgamation of the IndianOcean International Bank Ltd (IOIB) and SBI International (Mauritius) Ltd (SBIIML)
2010 • ABCBankingCorporationLtdpreviouslyknownasABCFinanceandLeas-ing Ltd granted its banking license
2012 • BanyanTreeBankLimitedgrantedbankinglicense(6September)2013 • BanyanTreeBankLimitedstartsoperations(18February)
Source: Jouan (2005), Seetanah, B., Padachi, K., Hosany, J., & Seetanah, B. (2011), Bank of Mau-ritius Annual Reports (various issues)
4. TRENDS IN FINANCIAL SECTOR DEVELOPMENT IN MAURITIUS
A number of financial development indicators are employed in this sec-tion as a discussion of the trends in financial development in Mauritius are ironed out.
4.1 M2 TO GDP
The ratio of broad money, M2 to GDP is the measure of financial develop-ment that shows the real size of the financial sector in a country. A higher ratio of M2 to GDP implies a larger financial sector and improved financial interme-diation. In addition to being a measure of financial deepening, the M2 to GDP ratio is a measure of money supply relative to the size of the economy. Prior to the gradual liberalisation, the M2/GDP ratio for Mauritius averaged just above 40%. By 1986, with the liberalisation of exchange controls on both current and capital transactions the M2/GDP ratio increased to above 50% levels. Due to increased offshore banking services provision, the size of the Mauritian finan-cial services sector appears to have continuously gained prominence over the years. By the early 1990s it was more than 60% of the GDP, hitting the 80% mark by year 2000. It progressively improved hitting its maxima of 102% by 2005 and from then onwards has been on a steadily maintained average of 100% of GDP. Given the resultant leap brought about by financial liberalisation, it is safe to say that the trends before 1986 show a holding back of the capacity of the financial sector maybe due to financial repression which tended to distract rather than promote financial sector investment and business initiatives. After the changes in policy (domestic and international liberalisation) in the period 1986 to 1994, the financial sector began to turn potential into reality.

97
Brian Muyambiri, et.al.; THE SEQUENCING OF FINANCIAL REFORMS... Journal of Accounting and Management, vol: 6; no: 1, 2016; page 89 - 114
Figure 1: Ratio of M2 to GDP
10
Figure 1: Ratio of M2 to GDP
Source: World Bank, World Development Indicators, 2014
More so, according to the M2/GDP ratio, the level of financial deepening appears to have improved extensively. With banks diversifying into non-bank financial services which include leasing, factoring, asset management, private equity, stockbroking, registry, investor services business, specialist services in cross-border transactions, specialist finance and lending, trustee and fiduciary services, Islamic banking, remittance services, wealth management and private banking, the increased financial widening and deepening was inevitable. The M2/GDP ratio tends to measure the size and depth of the financial sector and its development. Therefore, the resurgent increase in the M2/GDP ratio also shows that the size of the financial sector also increased comprehensively, even relative to other sectors as it is now counted as one of the main economic sectors in Mauritius. The effect of financial liberalisation is noticeable and was mainly steered by macroeconomic stability and the achievement of prudential regulation and supervision, and more so, the gradual approach to financial liberalisation (Galbis, 1994:98).
4.2 Deposit Money Bank Assets to GDP The deposit money bank asset to GDP ratio gives evidence of the importance of financial services relative to the size of the economy (Beck, et al, 2010:82). In other words, as the GDP expands, the deposit money bank assets to GDP ratio is also expected to expand. The trends of the deposit money bank assets to GDP ratio in Mauritius show that from the early 1960s – through the establishment of the Bank of Mauritius in 1967 – to the gradual introduction of financial reforms in the mid-1980s, deposit money bank assets appear to have
Source: World Bank, World Development Indicators, 2014
More so, according to the M2/GDP ratio, the level of financial deepening appears to have improved extensively. With banks diversifying into non-bank financial services which include leasing, factoring, asset management, private equity, stockbroking, registry, investor services business, specialist services in cross-border transactions, specialist finance and lending, trustee and fiduciary services, Islamic banking, remittance services, wealth management and pri-vate banking, the increased financial widening and deepening was inevitable. The M2/GDP ratio tends to measure the size and depth of the financial sector and its development. Therefore, the resurgent increase in the M2/GDP ratio also shows that the size of the financial sector also increased comprehensively, even relative to other sectors as it is now counted as one of the main economic sectors in Mauritius. The effect of financial liberalisation is noticeable and was mainly steered by macroeconomic stability and the achievement of prudential regulation and supervision, and more so, the gradual approach to financial liberalisation (Galbis, 1994:98).
4.2 DEPOSIT MONEY BANK ASSETS TO GDP
The deposit money bank asset to GDP ratio gives evidence of the im-portance of financial services relative to the size of the economy (Beck, et al, 2010:82). In other words, as the GDP expands, the deposit money bank assets to GDP ratio is also expected to expand. The trends of the deposit money bank

98
Brian Muyambiri, et.al.; THE SEQUENCING OF FINANCIAL REFORMS... Journal of Accounting and Management, vol: 6; no: 1, 2016; page 89 - 114
assets to GDP ratio in Mauritius show that from the early 1960s – through the establishment of the Bank of Mauritius in 1967 – to the gradual introduction of financial reforms in the mid-1980s, deposit money bank assets appear to have been slowly and steadily increasing. Specifically, the ratio of deposit money bank assets to GDP increased by about 15%, from the early 1960s to 1984. However, following the financial sector reforms, there has been a significant increase in the ratio of deposit money bank assets to GDP. By 2011, for exam-ple, the deposit money bank assets accounted for more than 105% of GDP as compared to 34% in 1984 and 19% in 1964. This shows that financial liberali-sation has enhanced financial development and increased investment in the banking industry. Figure 2 shows the trend of the deposit money bank assets as a percentage of GDP during the period 1960 to 2010.
Figure 2: Deposit Money Bank Assets to GDP (%)
11
been slowly and steadily increasing. Specifically, the ratio of deposit money bank assets to GDP increased by about 15%, from the early 1960s to 1984. However, following the financial sector reforms, there has been a significant increase in the ratio of deposit money bank assets to GDP. By 2011, for example, the deposit money bank assets accounted for more than 105% of GDP as compared to 34% in 1984 and 19% in 1964. This shows that financial liberalisation has enhanced financial development and increased investment in the banking industry. Figure 2 shows the trend of the deposit money bank assets as a percentage of GDP during the period 1960 to 2010. Figure 2: Deposit Money Bank Assets to GDP (%)
Source: Financial Structure Database- Beck, Demirgüç-Kunt, & Levine (2000, 2010) Čihák, Demirgüç-Kunt, Feyen, and Levine (2012).
4.3 Real Interest Rate For Mauritius, before the 1980s, given the highly unpredictable inflation and repressed interest rate policy, it is possible that real interest rates were generally negative. The notion of negative real interest rates is expected given that the Bank of Mauritius had a restrictive and a financially repressive monetary policy that had set the prime lending rate for particular strategic sectors of the economy and the commercial bank interest rates for each class of deposits. However, from 1980 to 1990 real interest rates were below 7% levels, inflation levels for the same period averaged just below 10%. With the liberalisation of interest rates in 1988, real interest rate levels began to gradually increase. The gradual increase was mainly due to the ongoing liberalisation of the financial sector. Other probable reasons for the rise in real interest rates after liberalisation include continuous reduction in the cost of intermediation (Jouan, 2005:216), and the
Source: Financial Structure Database- Beck, Demirgüç-Kunt, & Levine (2000, 2010) Čihák, Demirgüç-Kunt, Feyen, and Levine (2012).
4.3 REAL INTEREST RATE
For Mauritius, before the 1980s, given the highly unpredictable inflation and repressed interest rate policy, it is possible that real interest rates were generally negative. The notion of negative real interest rates is expected given that the Bank of Mauritius had a restrictive and a financially repressive mon-etary policy that had set the prime lending rate for particular strategic sectors of the economy and the commercial bank interest rates for each class of de-

99
Brian Muyambiri, et.al.; THE SEQUENCING OF FINANCIAL REFORMS... Journal of Accounting and Management, vol: 6; no: 1, 2016; page 89 - 114
posits. However, from 1980 to 1990 real interest rates were below 7% levels, inflation levels for the same period averaged just below 10%. With the liber-alisation of interest rates in 1988, real interest rate levels began to gradually increase. The gradual increase was mainly due to the ongoing liberalisation of the financial sector. Other probable reasons for the rise in real interest rates after liberalisation include continuous reduction in the cost of intermediation (Jouan, 2005:216), and the increasing amount of loanable funds and advances to the private sector – due to a shift from below-equilibrium interest rate levels to higher equilibrium levels.
The liberalisation of exchange rate controls followed in 1989, the gradual elimination of the directed credit programme, the first phase of open-market operations began with treasury bills in the primary market and the gradual liber-alisation of capital account followed in 1991. Furthermore, in 1992, credit ceilings to priority sectors were abolished and the BOM’s accommodation policy was re-viewed so that banks having liquidity deficit seek reserves from the interbank market before seeking refinancing from the central bank. These reforms came in with increased interest rates while inflation remained rather stable at below 10% levels. Hence, the overall effect of liberalisation of the financial sector inclusive of interest rate liberalisation was the gradual increase in the real interest rates. The increase continues until the year 2000 in which real interest rates reached a maximum of 18%. From 2001 onwards, real interest rates, though volatile, began to steadily decline until they reached 5.3% by 2012.
Figure 3: Real Interest Rate
12
increasing amount of loanable funds and advances to the private sector – due to a shift from below-equilibrium interest rate levels to higher equilibrium levels. The liberalisation of exchange rate controls followed in 1989, the gradual elimination of the directed credit programme, the first phase of open-market operations began with treasury bills in the primary market and the gradual liberalisation of capital account followed in 1991. Furthermore, in 1992, credit ceilings to priority sectors were abolished and the BOM’s accommodation policy was reviewed so that banks having liquidity deficit seek reserves from the interbank market before seeking refinancing from the central bank. These reforms came in with increased interest rates while inflation remained rather stable at below 10% levels. Hence, the overall effect of liberalisation of the financial sector inclusive of interest rate liberalisation was the gradual increase in the real interest rates. The increase continues until the year 2000 in which real interest rates reached a maximum of 18%. From 2001 onwards, real interest rates, though volatile, began to steadily decline until they reached 5.3% by 2012.
Figure 3: Real Interest Rate
Source: World Bank, World Development Indicators, 2014 The decrease in real interest rates after 2001, although attributed to financial liberalisation, could also be attributed to the loosened financial market liquidity controls by the BOM. For example, from 1996 the BOM abolished the maintenance of the credit-deposit ratio, gradually phased out the use high reserve requirement, engaged in open-market operations, instituted the creation of a secondary market in treasury bills through over the counter (OTC) sales of treasury bills to individuals and non-financial institutions and introduced the reversed
Source: World Bank, World Development Indicators, 2014

100
Brian Muyambiri, et.al.; THE SEQUENCING OF FINANCIAL REFORMS... Journal of Accounting and Management, vol: 6; no: 1, 2016; page 89 - 114
The decrease in real interest rates after 2001, although attributed to financial liberalisation, could also be attributed to the loosened financial market liquidity controls by the BOM. For example, from 1996 the BOM abolished the mainte-nance of the credit-deposit ratio, gradually phased out the use high reserve re-quirement, engaged in open-market operations, instituted the creation of a sec-ondary market in treasury bills through over the counter (OTC) sales of treasury bills to individuals and non-financial institutions and introduced the reversed REPO transactions marking. These reforms enabled the central bank to influence the liquidity of the banking sector and the interest rates in the market therefore having an indirect effect on the real interest rate. Furthermore, the monetary policy stance of the nation became reactive to the happenings in the market. For instance, the Lombard rate, which was the Bank’s signalling mechanism of its monetary policy stance, was reduced on four occasions during 2003 by a total of 125 basis points with banks reacting in tandem to policy changes. These policy changes were geared towards stimulating investment and enhancing economic growth through reduced lending rates.
4.4 INTEREST RATE MARGINS
The gist of financial sector liberalization is usually to reduce the interest rate spreads, to increase the availability of financial resources through in-creased savings, to enhance efficiency in credit allocation, and to increase in-vestments (Ngumi, 2014:9). Upon financial liberalization, an initial increase in the spread between lending and deposit rates is expected due to the increased equilibrium-lending rates. This theoretical link is supported by Shaw’s (1973) theoretical framework, which mainly focuses on the increased debt-interme-diation capabilities of banks due to financial liberalisation (Shaw, 1973). But as the financial sector becomes more efficient, the interest rate margin spread should eventually start to narrow. Moreover, for the case of Mauritius, finan-cial liberalization was accompanied by a reduction in the reserve requirement, which in turn should increase loanable funds, putting downward pressure on the cost of funds. Therefore, expectations arising due to these developments are that the interest rate margin should decrease over time.

101
Brian Muyambiri, et.al.; THE SEQUENCING OF FINANCIAL REFORMS... Journal of Accounting and Management, vol: 6; no: 1, 2016; page 89 - 114
Figure 4: Interest Rate Spread (Lending Rate minus deposit rate, %)
14
Source: Source: World Bank, World Development Indicators, 2014 Conversely, for Mauritius, the interest rate margin continued to rise, meaning that lending rates rose much faster during and after the reform years than deposit rates (see Figure 4). Before 1992, the interest rate margin had a mean of below 6%. From 1993 onwards, interest rate margins went beyond 6% and continued to steadily rise until they almost reached 14% levels in 2005. Margins declined sharply thereon, reaching minima of 0.5% by 2010 and then marginally rising to 2.4% by 2012. The rather unstoppable and uncontrollable rise in the interest rate margin in Mauritius points to a financial sector characterised by oligopolistic behaviour of a few commercial banks and state dominance, that is, limited financial sector competition (Senbet and Otchere, 2006:28). The resultant decrease in the interest rate margin from 2006 onwards maybe attributed to increased competition arising from the entry of a number of banking entities and non-bank financial institutions, the increasing stock market capitalisation and also to the international financial crisis of 2008. Nevertheless for the Mauritius case the interest rate margin reflects the prevalence of market power and compensates for the quality of loans (Ramful, 2001:20).
Source: Source: World Bank, World Development Indicators, 2014
Conversely, for Mauritius, the interest rate margin continued to rise, mean-ing that lending rates rose much faster during and after the reform years than deposit rates (see Figure 4). Before 1992, the interest rate margin had a mean of below 6%. From 1993 onwards, interest rate margins went beyond 6% and continued to steadily rise until they almost reached 14% levels in 2005. Margins declined sharply thereon, reaching minima of 0.5% by 2010 and then margin-ally rising to 2.4% by 2012. The rather unstoppable and uncontrollable rise in the interest rate margin in Mauritius points to a financial sector characterised by oligopolistic behaviour of a few commercial banks and state dominance, that is, limited financial sector competition (Senbet and Otchere, 2006:28). The resultant decrease in the interest rate margin from 2006 onwards maybe at-tributed to increased competition arising from the entry of a number of bank-ing entities and non-bank financial institutions, the increasing stock market capitalisation and also to the international financial crisis of 2008. Neverthe-less for the Mauritius case the interest rate margin reflects the prevalence of market power and compensates for the quality of loans (Ramful, 2001:20).
4.5 SAVINGS
From 1978, Mauritius had a domestic savings rate of 18% of GDP, which

102
Brian Muyambiri, et.al.; THE SEQUENCING OF FINANCIAL REFORMS... Journal of Accounting and Management, vol: 6; no: 1, 2016; page 89 - 114
steeped down to 10% of GDP by 1980. By the advent of financial liberalisation, the gross domestic savings rate of Mauritius started to increase in such a way that it reached up to 28.5% of GDP by 1986. From 1987 to 2003, gross domestic savings averaged 25% of GDP, only to sharply decline to 14.7% by 2006 and eventually 12.7% of GDP by 2012.
After financial liberalisation, as supported by Fry (1978), expectations were that the savings would increase, due mainly to the ripple effects of increased real interest rates that would have resulted from increased competition among financial institutions and the rather permissive stable inflation rate
The effects of the increased real interest rates on savings may be explained through their substitution effect and income effect on consumption and sav-ings. The substitution effect arising from increased real interest rates will lead to a preference to save while currently postponing consumption. Given the allowing stable inflation rate and the increasing interest rates, deferring cur-rent consumption for later becomes less costly and more beneficial in the fu-ture. On the other hand, increased real interest rates might lead to increased consumption due to increased interest income; however, if the substitution effect remains relatively greater than the opposing income effect, savings are expected to continuously increase or maintain their levels vis-à-vis the GDP.
Figure 5: Gross Savings as a Percentage of GDP
16
Figure 5: Gross Savings as a Percentage of GDP
Source: World Bank, World Development Indicators, 2014
The decreasing savings rate after 2001 closely mirrors the decreasing trends in the real interest rate after 2000 and the interest rate margins after 2005. Therefore, the decrease in savings might be explained by a decrease in real return for savings that led savings to be used for other alternatives not only limited to consumption. A look at the market capitalisation of the Stock Exchange of Mauritius seems to confirm that there was increased investment in the capital market during the period of decreasing savings.
4.6 Trends on Credit Despite the measures of financial development already discussed in preceding sections there is need to assess other measures that pertain to credit provision in the market. Financial development should lead to increased credit provision to all sectors by the financial sector, especially after financial liberalisation. Therefore, the extent to which the financial sector is a provider of loanable funds to both the public and the private sector is a necessary and good measure of the level of financial development. The two measures of financial sector deepening and development for assessing credit provision in Mauritius that are employed in this section are the net domestic credit to GDP ratio and the domestic credit to the private sector to GDP ratio. The net domestic credit to GDP ratio is the sum of net claims on the central government and claims on other sectors of the domestic economy
Source: World Bank, World Development Indicators, 2014
The decreasing savings rate after 2001 closely mirrors the decreasing trends in the real interest rate after 2000 and the interest rate margins after

103
Brian Muyambiri, et.al.; THE SEQUENCING OF FINANCIAL REFORMS... Journal of Accounting and Management, vol: 6; no: 1, 2016; page 89 - 114
2005. Therefore, the decrease in savings might be explained by a decrease in real return for savings that led savings to be used for other alternatives not only limited to consumption. A look at the market capitalisation of the Stock Exchange of Mauritius seems to confirm that there was increased investment in the capital market during the period of decreasing savings.
4.6 TRENDS ON CREDIT
Despite the measures of financial development already discussed in pre-ceding sections there is need to assess other measures that pertain to credit provision in the market. Financial development should lead to increased credit provision to all sectors by the financial sector, especially after financial liberali-sation. Therefore, the extent to which the financial sector is a provider of loan-able funds to both the public and the private sector is a necessary and good measure of the level of financial development. The two measures of financial sector deepening and development for assessing credit provision in Mauritius that are employed in this section are the net domestic credit to GDP ratio and the domestic credit to the private sector to GDP ratio. The net domestic credit to GDP ratio is the sum of net claims on the central government and claims on other sectors of the domestic economy expressed as a percentage of GDP. The domestic credit to private sector refers to financial resources provided to the private sector, such as through loans, purchases of non-equity securities, and trade credits and other accounts receivable that establish a claim for repay-ment (WDI, 2014).
The domestic credit to the private sector to GDP ratio trend shows that, de-spite maintaining above 20% levels, it marginally declined from 1976 onwards until 1985. The net domestic credit to GDP ratio in the same period (1976 to 1985) was generally ascending. With the advent of the financial liberalisation period, the domestic credit to the private sector to GDP ratio shows a gradual ascend which is only matched by the net domestic credit to GDP ratio after 1990. In addition, the gap between the two ratios seems to have narrowed after financial liberalisation. Financial development speared on by financial lib-eralisation appears to have opened a door for the once not included sectors in the private markets. In addition, increased competition for credit seems to have translated into an appreciation of the private sector as creditworthy than the status quo before liberalisation. However, it should be noted that increased financial sector competition may lead to decreased savings and even invest-ment as they indulge in excessive credit provision for consumption purposes. This may be due to short-termism, preference for high returns and prevailing liquidity in the banking sector (Adegbite & Adetiloye, 2013:214). In the banks’ lending decisions for investment purposes, the ability to repay is a significant
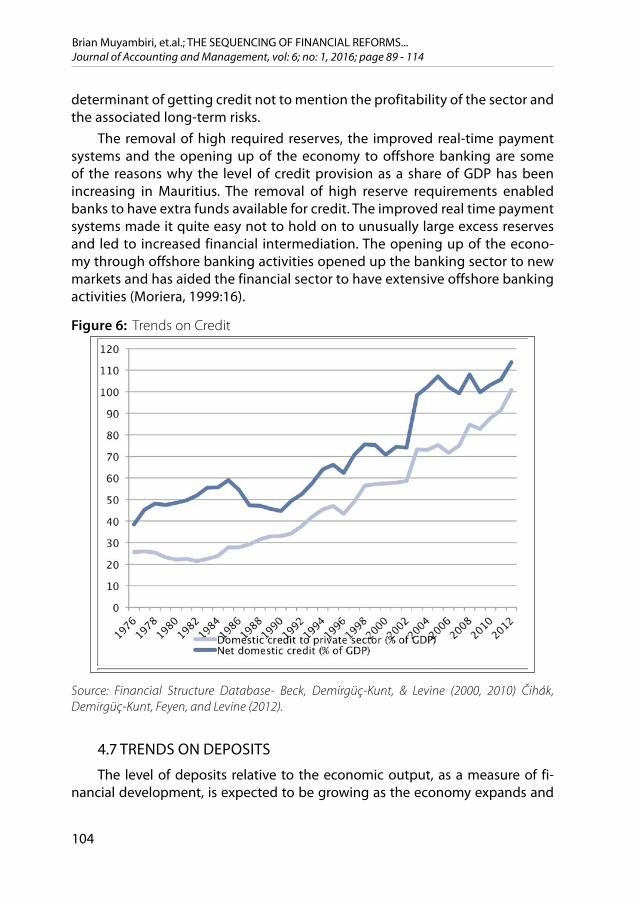
104
Brian Muyambiri, et.al.; THE SEQUENCING OF FINANCIAL REFORMS... Journal of Accounting and Management, vol: 6; no: 1, 2016; page 89 - 114
determinant of getting credit not to mention the profitability of the sector and the associated long-term risks.
The removal of high required reserves, the improved real-time payment systems and the opening up of the economy to offshore banking are some of the reasons why the level of credit provision as a share of GDP has been increasing in Mauritius. The removal of high reserve requirements enabled banks to have extra funds available for credit. The improved real time payment systems made it quite easy not to hold on to unusually large excess reserves and led to increased financial intermediation. The opening up of the econo-my through offshore banking activities opened up the banking sector to new markets and has aided the financial sector to have extensive offshore banking activities (Moriera, 1999:16).
Figure 6: Trends on Credit
18
Figure 6: Trends on Credit
Source: Financial Structure Database- Beck, Demirgüç-Kunt, & Levine (2000, 2010) Čihák, Demirgüç-Kunt, Feyen, and Levine (2012).
4.7 Trends on Deposits The level of deposits relative to the economic output, as a measure of financial development, is expected to be growing as the economy expands and as liberalisation policies are put in place. Deposits to financial institutions are liabilities from which they used to create money for themselves and also earn a profit from such financial intermediation. Furthermore, the increased mobilisation of deposits relative to the GDP tend to imply confidence with the banking industry and increased efficiency in either payment systems or savings, or both. The two ratios to be used to evaluate if the financial sector is an efficient mobiliser of deposits are the bank deposits to GDP ratio and the Bank credit to bank deposits ratio. Expectations on the bank deposits to GDP ratio are that it should be increasing to show that there is increased financial development that is reacting accordingly with any movements in national income. The bank credit to bank deposits ratio is expected to be increasing as more deposits are translated into credit otherwise deposits are more of sight deposits than long-term ones or banks are holding more excess liquidity than they should, or both.
Source: Financial Structure Database- Beck, Demirgüç-Kunt, & Levine (2000, 2010) Čihák, Demirgüç-Kunt, Feyen, and Levine (2012).
4.7 TRENDS ON DEPOSITS
The level of deposits relative to the economic output, as a measure of fi-nancial development, is expected to be growing as the economy expands and

105
Brian Muyambiri, et.al.; THE SEQUENCING OF FINANCIAL REFORMS... Journal of Accounting and Management, vol: 6; no: 1, 2016; page 89 - 114
as liberalisation policies are put in place. Deposits to financial institutions are liabilities from which they used to create money for themselves and also earn a profit from such financial intermediation. Furthermore, the increased mobilisa-tion of deposits relative to the GDP tend to imply confidence with the banking industry and increased efficiency in either payment systems or savings, or both. The two ratios to be used to evaluate if the financial sector is an efficient mobi-liser of deposits are the bank deposits to GDP ratio and the Bank credit to bank deposits ratio. Expectations on the bank deposits to GDP ratio are that it should be increasing to show that there is increased financial development that is re-acting accordingly with any movements in national income. The bank credit to bank deposits ratio is expected to be increasing as more deposits are translated into credit otherwise deposits are more of sight deposits than long-term ones or banks are holding more excess liquidity than they should, or both.
Figure 7: Bank Deposits to GDP and Bank Credit to Bank Deposits (%)
19
Source: Financial Structure Database – Beck, Demirgüç-Kunt, & Levine (2000, 2010) Čihák, Demirgüç-Kunt, Feyen, and Levine (2012).
From the above-illustrated trends, though the ratio of bank deposits to GDP started at just above 20% in early 1960s it gradually ascended through the years to 90% by 2011. Notably, the ratio of bank deposits to GDP was increasing at an increasing rate with the advent of financial liberalisation in the mid 1980s from whence it surpassed the 40% mark. By 1993, deposits accounted for more than 60% of GDP. The increasing trend of deposits relative to GDP can best be explained by the opening up of the financial services sector both domestically and internationally (increased offshore banking activities) and more so the increasing real interest rate which was boosted by stable inflation rates. Notably, after 2003, the ratio of bank deposits to GDP, driven mainly by the opening up of the financial sector, continued to increase – despite declining real interest rates.
On the other hand, the bank credit to bank deposit ratio reveals that the banking sector was far more efficient in converting deposits into credit in the earlier years than it became in the later years – due to the non-prevalence of repressive forces in the later years. The maximum share of credit it managed to obtain was 109% in 1962; from thereon it has been experiencing stretches of declines (rather than inclines) as the ratio of credit to deposits generally averaged between 60% to 80% for the period 1961 to 1990.
Source: Financial Structure Database – Beck, Demirgüç-Kunt, & Levine (2000, 2010) Čihák, Demirgüç-Kunt, Feyen, and Levine (2012).
From the above-illustrated trends, though the ratio of bank deposits to GDP started at just above 20% in early 1960s it gradually ascended through the years to 90% by 2011. Notably, the ratio of bank deposits to GDP was increas-ing at an increasing rate with the advent of financial liberalisation in the mid 1980s from whence it surpassed the 40% mark. By 1993, deposits accounted

106
Brian Muyambiri, et.al.; THE SEQUENCING OF FINANCIAL REFORMS... Journal of Accounting and Management, vol: 6; no: 1, 2016; page 89 - 114
for more than 60% of GDP. The increasing trend of deposits relative to GDP can best be explained by the opening up of the financial services sector both do-mestically and internationally (increased offshore banking activities) and more so the increasing real interest rate which was boosted by stable inflation rates. Notably, after 2003, the ratio of bank deposits to GDP, driven mainly by the opening up of the financial sector, continued to increase – despite declining real interest rates.
On the other hand, the bank credit to bank deposit ratio reveals that the banking sector was far more efficient in converting deposits into credit in the earlier years than it became in the later years – due to the non-prevalence of repressive forces in the later years. The maximum share of credit it managed to obtain was 109% in 1962; from thereon it has been experiencing stretches of declines (rather than inclines) as the ratio of credit to deposits generally aver-aged between 60% to 80% for the period 1961 to 1990.
From the year 1991 onwards, the ratio of bank credit to bank deposits has been on a general ascent, although it did not manage to eclipse the levels that had existed in the early 1960s. However, it should be noted that the bank credit to bank deposits ratio contains demand deposits, that is, it is the private credit by deposit money banks as a share of demand, time and saving deposits in deposit money banks. The extent to which demand deposits account for the total deposits might be the reason why the ratio tends to show the inef-ficiency of money creation by banks. If the bulk of the deposits are short-term deposits, that is, mainly six-month fixed deposits, call and current account de-posits, then the deposit base that financial institutions have to create credit is not sufficient enough to accommodate such as expected since most of the deposits are relatively sight deposits. The other reason that might have signifi-cantly hampered the performance of financial institutions in the provision of credit is the influx of substantial offshore banking based deposits that are be-ing directed to the capital market rather than the money market. Furthermore, there are a number of non-bank financial institutions that offer products and services that compete directly with those offered by banks, and these form part of the unaccounted-for competition for deposits in the market. Inherently, in the later years, the gap that used to exist between bank deposits to GDP and bank credit to bank deposits has been obliterated as the level of bank deposits continues its ascent.
4.8 OTHER BANK PERFORMANCE MEASURES
Since financial depth ratios tend to measure the size of the financial inter-mediary sector, it is necessary to accommodate other financial system meas-ures that can be an accurate proxy for the functioning of the financial system
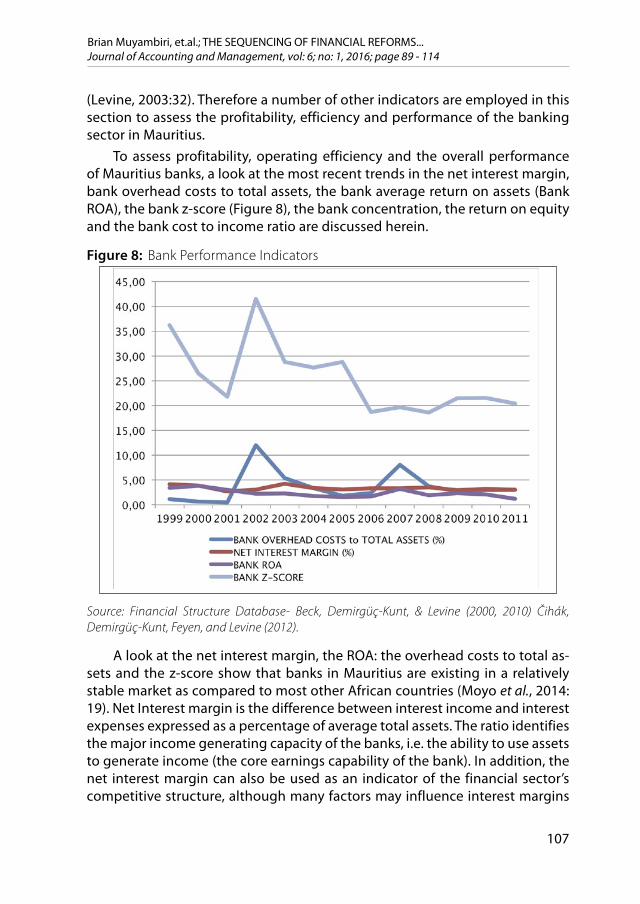
107
Brian Muyambiri, et.al.; THE SEQUENCING OF FINANCIAL REFORMS... Journal of Accounting and Management, vol: 6; no: 1, 2016; page 89 - 114
(Levine, 2003:32). Therefore a number of other indicators are employed in this section to assess the profitability, efficiency and performance of the banking sector in Mauritius.
To assess profitability, operating efficiency and the overall performance of Mauritius banks, a look at the most recent trends in the net interest margin, bank overhead costs to total assets, the bank average return on assets (Bank ROA), the bank z-score (Figure 8), the bank concentration, the return on equity and the bank cost to income ratio are discussed herein.
Figure 8: Bank Performance Indicators
21
Figure 8: Bank Performance Indicators
Source: Financial Structure Database- Beck, Demirgüç-Kunt, & Levine (2000, 2010) Čihák, Demirgüç-Kunt, Feyen, and Levine (2012). A look at the net interest margin, the ROA: the overhead costs to total assets and the z-score show that banks in Mauritius are existing in a relatively stable market as compared to most other African countries (Moyo et al., 2014: 19). Net Interest margin is the difference between interest income and interest expenses expressed as a percentage of average total assets. The ratio identifies the major income generating capacity of the banks, i.e. the ability to use assets to generate income (the core earnings capability of the bank). In addition, the net interest margin can also be used as an indicator of the financial sector's competitive structure, although many factors may influence interest margins (Beck et al, 2000:601).
On the average, the net interest margin for the Mauritius banking sector has remained largely stable due, most likely, to the rising share over this period of treasury bills in total assets and the increased incidence of sight deposits that cannot be used to generate interest income. Implications on the banking sector’s competitive structure from the stable net interest margin seem to point to an oligopolistic competitive structure in which banks are more inclined to non-price (interest rate) competition. In an oligopolistic market, the market is made up of a few large banks; because the size of the banks is very large, its actions will affect the market conditions due to the fact that in the oligopoly market, there are a small number of banks and each bank is large enough that its actions will affect the market conditions. However, in other cases of oligopoly, they will be lead firms or, in this
Source: Financial Structure Database- Beck, Demirgüç-Kunt, & Levine (2000, 2010) Čihák, Demirgüç-Kunt, Feyen, and Levine (2012).
A look at the net interest margin, the ROA: the overhead costs to total as-sets and the z-score show that banks in Mauritius are existing in a relatively stable market as compared to most other African countries (Moyo et al., 2014: 19). Net Interest margin is the difference between interest income and interest expenses expressed as a percentage of average total assets. The ratio identifies the major income generating capacity of the banks, i.e. the ability to use assets to generate income (the core earnings capability of the bank). In addition, the net interest margin can also be used as an indicator of the financial sector’s competitive structure, although many factors may influence interest margins

108
Brian Muyambiri, et.al.; THE SEQUENCING OF FINANCIAL REFORMS... Journal of Accounting and Management, vol: 6; no: 1, 2016; page 89 - 114
(Beck et al, 2000:601).On the average, the net interest margin for the Mauritius banking sector
has remained largely stable due, most likely, to the rising share over this period of treasury bills in total assets and the increased incidence of sight deposits that cannot be used to generate interest income. Implications on the bank-ing sector’s competitive structure from the stable net interest margin seem to point to an oligopolistic competitive structure in which banks are more in-clined to non-price (interest rate) competition. In an oligopolistic market, the market is made up of a few large banks; because the size of the banks is very large, its actions will affect the market conditions due to the fact that in the oligopoly market, there are a small number of banks and each bank is large enough that its actions will affect the market conditions. However, in other cases of oligopoly, they will be lead firms or, in this case, banks that dominate the market despite the existence of many other small banks. Therefore, the structure in the market (the existence of dominant banks) tends to determine the conduct of the whole banking market and inherently the performance of the industry. A look at the concentration level is required to validate the exist-ence of oligopoly and its extent thereof.
The z-score, reflects the extent to which banks are able to absorb losses and is, therefore, an indicator of banking stability, is the ratio of return on as-sets plus capital-asset-ratio to the standard deviation of return on assets. The higher the z-score, the more stable the bank. The z-score shows that Mauritian banking sector is more stable than that of South Africa and Botswana because it averages 20% while those of South Africa and Botswana average 8.1% and 14.1%, respectively for the same period.

109
Brian Muyambiri, et.al.; THE SEQUENCING OF FINANCIAL REFORMS... Journal of Accounting and Management, vol: 6; no: 1, 2016; page 89 - 114
Figure 9: Other Bank Performance Indicators
22
case, banks that dominate the market despite the existence of many other small banks. Therefore, the structure in the market (the existence of dominant banks) tends to determine the conduct of the whole banking market and inherently the performance of the industry. A look at the concentration level is required to validate the existence of oligopoly and its extent thereof.
The z-score, reflects the extent to which banks are able to absorb losses and is, therefore, an indicator of banking stability, is the ratio of return on assets plus capital-asset-ratio to the standard deviation of return on assets. The higher the z-score, the more stable the bank. The z-score shows that Mauritian banking sector is more stable than that of South Africa and Botswana because it averages 20% while those of South Africa and Botswana average 8.1% and 14.1%, respectively for the same period.
The stability of the Mauritian banking sector is also proven by the unchanging trends on the average of the bank overhead costs to total assets and the bank average return on assets.
Financial development can also be analysed using measures of concentration in the banking system. It is assumed that a less concentrated (and presumably more competitive) banking system reflects a greater level of financial development which is better suited to serve the diverse and emergent needs of a growing economy. In
0,00
10,00
20,00
30,00
40,00
50,00
60,00
70,00
80,00
90,00
100,00
1999200020012002200320042005200620072008200920102011BANK CONCENTRATION (%)BANK ROEBANK COST to INCOME RATIO (%)
Source: Financial Structure Database- Beck, Demirgüç-Kunt, & Levine (2000, 2010) Čihák, Demirgüç-Kunt, Feyen, and Levine (2012).

110
Brian Muyambiri, et.al.; THE SEQUENCING OF FINANCIAL REFORMS... Journal of Accounting and Management, vol: 6; no: 1, 2016; page 89 - 114
The stability of the Mauritian banking sector is also proven by the un-changing trends on the average of the bank overhead costs to total assets and the bank average return on assets.
Financial development can also be analysed using measures of concentra-tion in the banking system. It is assumed that a less concentrated (and pre-sumably more competitive) banking system reflects a greater level of financial development which is better suited to serve the diverse and emergent needs of a growing economy. In addition, access to financial sector products can be either improved or decreased by, among other things, the concentration lev-els in the economy. For example, a very high concentration of banks that are very much against lending to small to medium enterprises (due to they being a high risk client than household consumer credit) might stifle the growth of domestic companies and hence economic growth. However, the effect of con-centration levels in the financial sector is also highly dependent on other as-pects of the economy, including the economy’s development plans, the bank-ing environment being promoted and the openness of the financial sector to international players.
The degree of concentration in the banking sector as measured by the three-bank concentration ratio, which measures the market share of the larg-est three banks in the economy, shows a noticeable decrease from 92% in 1999 to 50% by 2011. The decreased trend in the concentration ratio can be explained by the increased entry into the banking sector by many banks that seem to have diluted the market. The opening of new banks appears to have induced increased competition and efficiency. The bank cost to income ratio shows a rather volatile trend that has eventually capsized at below 40% levels from 2008 onwards showing greater efficiency than in the latter years. There-fore, the entry of these new commercial banks has made a significant impact on the market structure and the competitiveness in the banking sector.
5. CONCLUSION
The aim of this article was to provide a sequential analysis of financial re-forms and banking sector development in Mauritius. In addition, an analysis of the resultant changes (due to reforms) in the banking sector of Mauritius is discussed. Though the existence of the banking sector dates back to 1810, the institution of major financial reforms was made in the mid- 1980s. These reforms led to the opening up of the financial sector to both domestic and international investors. In addition, the use of repressive financial sector po-lices was reduced as the Bank of Mauritius adeptly moved away from direct policy instruments to indirect ones. Notable for Mauritius is the success of her

111
Brian Muyambiri, et.al.; THE SEQUENCING OF FINANCIAL REFORMS... Journal of Accounting and Management, vol: 6; no: 1, 2016; page 89 - 114
economic reforms. The success can be attributed to controlled and well-main-tained fiduciary management principles and other intra-industry policies (ISI, EPZ, etc.). In addition, the maintenance of a stable macroeconomic environ-ment, a strong prudential regulation and supervision landscape in Mauritius are some of the factors that enabled financial development to be a success. The institution of financial reforms has resulted in a number of significant ben-efits for the economy. For example, before significant financial reforms were put in place, two banks, the MCB and the State Bank of Mauritius, mainly domi-nated the financial sector of Mauritius. Eventually, with the gradual liberalisa-tion of the sector, the level of bank concentration has decreased from above 90% levels before year 2000 to just below 50% in 2012. Therefore, there has been a marked increase in bank competition which has in turn led to greater efficiency and a higher than average z-score. Moreover, financial development in Mauritius has been characterised by major diversification of products and services amongst banks as banks also ventured in non-bank financial services. Products and services offered include leasing, factoring, asset management, private equity, stockbroking, registry, investor services business, specialist ser-vices in cross border transactions, specialist finance and lending, trustee and fiduciary services, Islamic banking, remittance services, wealth management and private banking, showing increased financial widening and deepening. Even though the development of the banking sector in Mauritius has been more of a success than a failure, there is need to take note that banking sector development is only a partial solution to complex development issues and it can only be effective when it works in unison with other government interventions. For example, with the advent of the 21st century, it appears the level of gross domestic savings as a percentage of GDP have declined. This gives rise to a number of research questions that were not specifically answered by this research. Given that the Stock Exchange of Mauritius was automated, has the increased efficiency (if inherent) resulted in decreased savings? How does the capital market interact with the banking sector? Further research might need to be employed to evaluate the pros and cons of gradual financial sector liberalisation and the big-bang approach with special focus being given to economies in Africa.
REFERENCES1. Adegbite, E. O., & Adetiloye, K. A. 2013. Financial Globalisation and Domestic Investment in
Developing Countries: Evidence from Nigeria. Mediterranean Journal of Social Sciences, 4(6): 213-221.
2. Bank of Mauritius Annual Report (Various Issues). Port Louis: Bank of Mauritius.3. Bank of Mauritius Bank Supervision Annual Report (Various Issues). Port Louis: Bank of Mauritius.4. Beck, T., Demirgüç-Kunt, A., & Levine, R. 2000. A new database on the structure and develop-
ment of the financial sector. The World Bank Economic Review, 14(3): 597-605.5. Beck, T., Demirgüç-Kunt, A., & Levine, R. 2010. Financial institutions and markets across coun-
tries and over time: The updated financial development and structure database. The World Bank Economic Review, 24(1): 77-92.

112
Brian Muyambiri, et.al.; THE SEQUENCING OF FINANCIAL REFORMS... Journal of Accounting and Management, vol: 6; no: 1, 2016; page 89 - 114
6. Čihák, M, Demirgüç-Kunt, A., Feyen, F., and Levine, R. 2012. Benchmarking Financial Development Around the World, World Bank Policy Research Working Paper 6175.
7. Galbis, V. 1994. Sequencing of Financial Sector Reforms-A Review (EPub) (No. 94-101). Interna-tional Monetary Fund.
8. Heerah-Pampusa, M., Khodabocus, W., Morarjee, V., & Bissessur, J. N. 2006. A Primer on Infla-tion, Occasional Paper Series, 1: 1-30
9. Jankee, K. 2006. Banking Controls, Financial Deepening and Economic Growth in Mauritius. African Review of Money Finance and Banking, 75-96.
10. Jankee, K. 1999. Financial Liberalisation and Monetary Control Reform in Mauritius. Research Journal–University of Mauritius, 2: 9-28
11. Jouan, J. K. 2005. Financial Liberalisation in Mauritius and the Finance-Growth Nexus, Unpub-lished Doctoral thesis, Edinburgh Napier University, United Kingdom
12. Levine, R. 2003. More on finance and growth: more finance, more growth?. Federal Reserve Bank of St. Louis Review, 85(July/August 2003).
13. Moriera, E. P. 1999. Financial Liberalization and the Sequencing of Reforms: African Countries Experiences. A program for the African Development Bank.
14. Moyo, J., Nandwa, B., Council, D. E., Oduor, J., & Simpasa, A. 2014. Financial Sector Reforms, Competition and Banking System Stability in Sub-Saharan Africa. New Perspectives.
15. Ngumi, P. M. 2014. Effect of bank innovations on financial performance of commercial banks in Kenya, Unpublished Doctoral thesis, Jomo Kenyatta University Of Agriculture And Technol-ogy, Kenya
16. Ramful, P. 2001. The determinants of interest rate spread: empirical evidence on the Mauri-tian banking sector. Bank of Mauritius. <https://www.bom.mu/pdf/Research_and_Publica-tions/Research_Papers/spread.htm> Accessed 25 November 2014
17. Seetanah, B., Padachi, K., Hosany, J., & Seetanah, B. 2011. Determinants of Financial Develop-ment: The Case of Mauritius. In Finance and Corporate Governance Conference.
18. Senbet, L. W., & Otchere, I. 2006. Financial sector reforms in Africa: perspectives on issues and policies. Annual World Bank Conference on Development Economics 2006: Growth and Integra-tion: 81-120.
19. Shaw, E.S. 1973. Financial Deepening in Economic Development, New York: Oxford University Press.
20. Sobhee, S. K., & Bhowon, V. 2007. Deepening integration in SADC: Mauritius-achievement and coming challenges. Friedrich Ebert Foundation.
21. Tsangarides, C. G. 2010. Monetary policy transmission in Mauritius using a VAR analysis. Inter-national Monetary Fund.
22. World Bank Group (Ed.). 2014. World Development Indicators 2014. Washington, DC: World Bank. doi:10.1596/978-1-4648-0163-1. License: Creative Commons Attribution CC BY 3.0 IGO

113
Brian Muyambiri, et.al.; THE SEQUENCING OF FINANCIAL REFORMS... Journal of Accounting and Management, vol: 6; no: 1, 2016; page 89 - 114
TIJEK FINANCIJSKE REFORME I RAZVOJ BANKARSKOG SEKTORA NA MAURICIJUSU
SAŽETAK RADA:Rad predstavlja tijek financijske reforme i razvoj financijskog sektorana Mauricijusu.Uz pomoć odabranih podataka World Development Indicators and the Financial
Structure baze podataka rad daje analizu promjena koje proizlaze iz reformi bankar-skog sektora na Mauricijusu tijekom post financijskog reformskog perioda. Povećani financijski razvoj najbolje se može objasniti povećanjem osobnih kredita, depozita, ra-zvojem financijskih proizvoda te povećanom konkurentnošću banaka. Održavanje sta-bilnog makroekonomskog okruženja, jake bonitetne regulative te nazdora neki su od glavnih faktora koji su omogućili uspješan razvoj financijskog sektora na Mauricijusu.
Ključne riječi: financijski razvoj, financijska reforma, Mauricijus, monetarna politika

Journal of Accounting and Management
115
INSTRUCTIONS FOR AUTHORS
All the papers dealing with the topics of accounting and management are welcome. All the submitted papers are considered for publication and have been blindly peer-reviewed by two independent reviewers.
The papers are categorized in the scientific, professional and other papers:o Original scientific paper contains previously unpublished original re-
sults of scientific research;o Preliminary communication presents the primary findings of research
in progress, which requires urgent publication, but without the level of deep and thorough study required for the original scientific paper;
o Review article contains a detailed and comprehensive critical review of a certain problem area, but with no significant originality of the ob-tained results;
o Professional paper contains the information and experience relevant for a certain profession, but without scientific characteristics.
o Case study contains a description and detailed information about the particular subject or small group.
The Editorial Board determines the category of the paper, based on the reviewers’ proposals.
The Journal of Accounting and Management is published in two issues a year.
All the papers should be submitted by mail or email to the address of the Editorial Office. The authors are obliged to follow these instructions:
1. The manuscripts should be written in English.2. The manuscript should be submitted in a MS Word format. 3. A cover page should be supplied, containing the title of the paper,
name(s) and address(es) of the author(s), including the telephone number, e-mail address and the name and postal address of the author(s) home institution.
4. The full paper should not exceed 10 single-spaced pages of text (font: Times New Roman, size 12) including graphs, tables, endnotes and references.
5. The paper should begin with an abstract of not more than 900 charac-ters and maximum 5 key words
6. The Editors reserve the right to make editorial changes in order to ad-just the style of the paper to the Journal.
7. The manuscripts are not returned.8. No payment is made to the authors for publication of the paper and
the author receives one copy of the Journal.
116
Journal of Accounting and Management
PUBLICATION ETHICS AND PUBLICATION MALPRACTICE STATEMENT FOR JOURNAL OF ACCOUNTING AND MANAGEMENT
Our ethic statements are based on the Committee on Publication Ethics Best Practice Guidelines for Journal Editors developed by the Committee on Publication Ethics (COPE).
Duties of Editors________________________________________Publication decisionsThe editorial board is responsible for deciding which of the articles sub-
mitted to the journal should be published.The editorial board will be guided by the policies of the journal and con-
strained by legal requirements related to libel, copyright infringement and plagiarism. Members of the editorial board will confer and refer to reviewers recommendations in making this decision.
EqualityAn editor, member of the editorial board or reviewer must evaluate manu-
scripts for their intellectual content without regard to race, gender, political philosophy, sexual orientation, ethnic origin, citizenship, or religious belief of the authors.
ConfidentialityThe review process takes place in two stages. In the first stage the editor
must not disclose any information about a submitted manuscript to anyone other than the corresponding author, reviewers, potential reviewers, and other editorial advisers. This stage concludes with an agreement between the author and reviewers about the continuation of their cooperation in the open review-ing forum in which issues of confidentiality do not arise.
Disclosure and conflicts of interestUnpublished materials disclosed in a submitted manuscript must not be
used in an editor’s, reviewer’s or any other reader’s own research without the express written consent of the author.

Journal of Accounting and Management
117
Duties of Reviewers________________________________________Contribution to Editorial DecisionsReviewers assist the editorial board in making editorial decisions and
through the editorial communications during the open review process with the author may also assist the author in improving the paper.
Qualification of Reviewers Any selected referee who feels unqualified to review the research reported
in a manuscript or knows that its prompt review will be impossible should no-tify the editor and excuse himself from the review process. The editorial board is responsible for ensuring the competence of the reviewers
Promptness Authors will normally receive feedback about the acceptance of his/her
paper for the reviewing process within three weeks and in another three weeks s(he) will normally receive the first response from the reviewers.
The editorial board is responsible for ensuring the promptness of respons-es in the open review process.
ConfidentialityAny manuscripts received for review in the open review process are sub-
jected to the criteria of enhancing their rationality through the mutual rational controls of critical discussion.
Establishing Standards of Objectivity through Critical DiscussionReviews should be conducted objectively. Authors are encouraged to
make explicit the internal criteria they use to evaluate the validity of their contributions to knowledge. Personal criticism of the author is inappropriate. Referees should express their views clearly with supporting arguments in the spirit of enhancing the quality of the paper through the mutual rational con-trols of critical discussion.
Acknowledgement of SourcesReviewers should identify relevant published work that has not been cited
by the authors. References to the ideas of others should be accompanied by the relevant citation. A reviewer should also call to the editor’s attention any substantial similarity or overlap between the manuscript under consideration and any other published paper of which they have personal knowledge.
Disclosure and Conflict of InterestInformation or ideas obtained through peer review must only be used
with the explicit agreement of the participants in the peer review. Reviewers

118
Journal of Accounting and Management
should not consider manuscripts in which they have conflicts of interest result-ing from competitive, collaborative, or other relationships or connections with any of the authors, companies, or institutions connected to the papers.
Duties of Authors________________________________________Reporting standardsAuthors of reports of original research should present an accurate account
of the work performed as well as an objective discussion of its significance. Un-derlying data should be represented accurately in the paper. A paper should contain sufficient detail and references to permit others to judge the validity of the contributions to knowledge. Authors are asked to provide the raw data in connection with a paper for editorial review, and should be prepared to pro-vide public access to such data and should in any event be prepared to retain such data for at least two years after publication.
Fraudulent or knowingly inaccurate statements constitute unethical be-havior and are unacceptable.
We believe it is important to emphasise that the editorial board is not re-sponsible for copyrights and for any ethical consequences of the publication of any particular contribution (written or in the form of multimedia). However, we expect that all people providing sources of data for published accounts have been given informed consent and that no one in any way involved in the processes of the research has been coerced into co-operation or is unknow-ingly being co-opted. Authors should have written permission of parents to include photos or videos of children and juveniles into research accounts.
Originality and PlagiarismThe Editorial Board of JAM recognise different cultural beliefs about the
acceptability of quoting the ideas of others as if they were one’s own. The doc-uments concerning the submission of papers for JAM review recognise these different cultural beliefs and emphasise the statement that ‘authors should ensure that they have written entirely original works, and if the authors have used the work and/or words of others that this has been appropriately cited or quoted.’
Concurrent PublicationSubmitting the same manuscript to more than one journal concurrently,
constitutes unethical publishing behaviour and is unacceptable.

Journal of Accounting and Management
119
Authorship of the PaperAuthorship should be limited to those who have made a significant contribu-
tion to the conception, design, execution, or interpretation of the reported study. All those who have made significant contributions should be listed as co-authors. Where there are others who have participated in certain substantive aspects of the research project, they should be acknowledged or listed as contributors.
The corresponding author should ensure that all appropriate co-authors and no inappropriate co-authors are included on the paper, and that all co-au-thors have seen and approved the final version of the paper and have agreed to its submission for publication.
Disclosure and Conflicts of InterestAll authors should disclose in their manuscript any financial or other sub-
stantive conflict of interest that might be construed to influence the results or interpretation of their manuscript. All sources of financial support for the project should be disclosed.
Fundamental errors in published worksWhen an author or reader discovers a significant error or inaccuracy in the
published work, it is the author’s obligation to promptly notify the journal edi-tor and work with the editor to retract or correct the paper.