Embed Size (px)
Citation preview

J. of Advancement in Engineering and Technology Volume 7 / Issue 2 ISSN: 2348-2931 1
JOURNAL OF ADVANCEMENT IN
ENGINEERING AND TECHNOLOGY
Journal homepage: www.scienceq.org/JAET.php Research Article Open Access
Remediation of Heavy Metals from Petroleum Sludge Impacted Soils using Organic
Waste Useh Mercy Uwem1,3*, Dauda Mary Sunday3, Abdulrahman Funke Wosilat3 and Useh Uwem Jonah2 1Chemistry Advanced Research Centre, Sheda Science and Technology Complex, Abuja, Nigeria 2Department of Pollution Control, Ecological Fund Office, Federal Secretariat Phase 2, Abuja, Nigeria 3Department of Chemistry, University of Abuja, Abuja, Nigeria
*Corresponding author:Useh Mercy Uwem, E-mail: [email protected]
Received: October02, 2018, Accepted: November 05, 2018, Published: November05, 2018.
ABSTRACT Soil infectivity caused by heavy metals has increasingly received worldwide attention due to their high toxicity, thus its remediation
is a priority. Petroleum sludge impacted soil samples around Warri Refinery and Petrochemical Company (WRPC), Delta State,
Nigeria, were subjected to bioremediation of heavy metals (Cr, Cd, Pb, Ni, Cu, Co, Mn, Fe and Zn) using agro-waste from Moringa
Oleifera seed (3:1) and monitored for contaminants reduction for 90 days at 30 days interval. Results obtained were compared with
that of the control soil sample collected 8.5 km away from WRPC. At the end of 90 days, the percentage removal of all the heavy
metals was between 65.00 % and 88.32 % which showed a successful bioremediation. Metal indicators like Enrichment Factor
(EF) and Geoaccumulation Index (Igeo) were employed to assess the intensity of contamination. At the end of the study, EF
revealed no to minor enrichment except for Cr and Pb. The computed Igeo further confirmed that all the studied sites were
decontaminated except for Cr and Pb. When the portion of soil to biostimulant was varied (3:2) and observed for another 30 days,
the EF and Igeo revealed that addition of higher mix ratio did not produce a corresponding increase in the removal of residual
metals as expected. From the results, the applied organic fertilization treatment has proven to be effective to accelerate
bioremediation of petroleum sludge impacted soils.
Keywords:heavy metals; toxicity; moringa seed; bioremediation; soil; petroleum
1. INTRODUCTION Rapid growth of industrialization and extraction of natural
resources in developing countries like Nigeria have led to the
generation of huge volume of wastes and consequential
environmental degradation [1]. In the Niger Delta region of
Nigeria being one of the oil-rich states, petroleum industries are
renowned for the discharge of large quantities of toxic wastes
and untreated effluents to the immediate environment which
poses significant impacts to the ecosystem. Poor waste disposal
of petroleum sludge, as a direct result of refining activities, affect
the properties of soils with the build-up of high concentrations of
heavy metals in the affected sites [2,3,4]. Heavy metals
contamination in the environment is a major concern due to their
toxicity and threat to the environment and human life. As
chemical hazards, heavy metals are non-biodegradable and can
remain almost indefinitely in the soil environment. However,
their availability to biota can change considerably depending on
their chemical speciation in the soil [1,5]. Metals are essential to
the biological functions of plants and animals but at elevated
levels, they interfere with metabolic reactions in systems of
organisms. There are well documented health and environmental
risks associated with heavy metals, thus its treatment has become
a priority [6,7]. Various approaches used to remedy heavy metal
contaminated soils include physical and chemical systems like
land filling, encapsulation, fixation, leaching, etc, but most of
these methods are not economically viable, and they do not
ensure restoration without residual effects. Alternatively,
bioremediation is a promising field of research with more
economically and environmentally sound approach, which gives
reliable and simple technologies over chemical and physical
processes. Bioremediation is a technique that utilizes the
biological mechanisms inherent in microbes and plants to
eradicate hazardous contaminants and restore the ecosystem to its
original condition [8,9,10]. It is employed to break down
xenobiotics and mitigate toxic heavy metals, by altering them
into elements with little or no toxicity, henceforth forming
innocuous products [11,12]. With the objective of improving the
process of bioremediation, diverse approaches can be employed,
dependent of the type of the contaminated environment. One of
these approaches, biostimulation, involves encouraging the
growth of indigenous microorganisms in the contaminated sites
by supplying them with the optimum levels of nutrients essential
for their metabolism [13,14,15]. Consequently, the rate of
biodegradation can be amplified. The primary advantage of
biostimulation is that bioremediation will be undertaken by
already present native microorganisms that are well-suited to the
environment, and are well distributed spatially within the
subsurface [16,17]. Recent advancements have proven successful
via the addition of organic fertilizers to increase the
bioavailability of microbes within the medium [18,19,20]. The
application of organic amendments such as agro-waste from
Moringa Oleifera seed in metal-contaminated soils could cause
differences in the soil microbial population by changing pH,
decreasing the solubility of heavy metals and increasing
autochthonous microbial biomass. Moringa Oleifera seed cake
(MOSC) is a byproduct, obtained after oil is extracted from the
seeds. These wastes are considered useless to the ordinary man,
but research has shown that such wastes are useful material to

J. of Advancement in Engineering and Technology Volume 7 / Issue 2 ISSN: 2348-2931 2
modify the soil physical and chemical properties [21]. It is
extensively used in various ways: it has been shown to possess
effective coagulant properties to flocculate particles in
wastewater treatment [22,23], it has biosorption behavior for the
removal of toxic heavy metals from water bodies and soils
[24,25], it has been shown to increase soil physicochemical
properties and have great support for microbial growth [21,26]
when acting as organic fertilizer etc. However, its use as a
biostimulant in remediation of oily sludge impacted soils has not
been given much adequate attention. It is evident that employing
MOSC in soil remediation will not only remove the heavy
metals, but will increase soil fertility and at the same time solve
the problem of waste management. This paper explores the use of
plant-derived organic fertilizer, agro-waste from Moringa
Oleifera seed in biotransformation and removal of heavy metals
from petroleum sludge impacted soils.
2. MATERIALS AND METHODS
2.1 Description of Sampling Sites
The Niger Delta is one of the world’s largest deltas and makes up
approximately 7% of the land area of Nigeria. It has been
reported to cover an area of approximately 75,000 km2,
representing about 7.5 % of Nigeria [1]. The region has about
5284 oil wells and 527 flow stations of crude oil processing with
more than 7000 km of oil and gas pipeline traversing across the
whole land area (Figure 1). Delta State which is being nicknamed
“The Big Heart of the Nation” lies approximately between
Longitude 5°00 and 6°.45' East and Latitude 5°00 and 6°.30'
North of the equator. It is located in the southern Nigeria with an
area of 17,698 km2 (6,833 sq mi) and a population of 4,112,445
as at 2006 [27]. It is made up of 25 Local Government Areas and
comprising mainly five major ethnic groups: Urhobo, Isoko,
Anioma and Ukwani, Ijaw and Itsekiri. Warri is the biggest
commercial city in the state where the refinery is located. The
major people in Warri comprise the Urhobos, Ijaws and Itsekiris
[28].
The oil spill impacted communities (Itsekiri) are situated
between Latitudes 5030’N and 5033’N of the Equator and
Longitudes 5045’E of the Prime Meridian, in Warri South Local
Government Area of Delta State. Climatologically, the study area
has a mean annual rainfall of 3200 mm and mean temperature of
about 28°C. Topography is flat, with an average elevation of
about 13 m above sea level. The flat and low relief features often
encourage flooding after rain events. The drainage pattern is
dendritic with major tributaries emptying into the Forcados
River. The vegetation of the area is tropical rain forest type,
comprising abundant trees and grasses. The soils in the study
area exhibits a wide range of colours from milky white through
brown to very dark brown; and they vary in types and texture
from loamy to sandy and clayey types according to the United
States Department of Agriculture (USDA) classification. Warri
people are mainly farmers, civil servants, businessmen and
women, artisans and entrepreneurs [1]. Due to frequent oil spills
from the sludge pits as a result of refining operations from the
Warri Refinery and Petrochemical Company (WRPC), the
Itsekiri people are faced with the problem of environmental
degradation.
Figure 1: Map of Delta State showing the Study Area
2.2 Sample Collection, Handling and Preservation US EPA (SW-846) guidelines were applied, using composite
sampling for collecting sediment samples where sub-samples
were collected from randomly selected locations in an area. Five
(5) oily sludge samples were collected from the discharge pit of
WRPC with core sampler in a 500 mL wide-mouth glass jar and
pooled. Also, fifty (50) soil samples were randomly collected
using soil auger from the depth of 0-15 cm from five selected oil-
impacted communities (Ubeji – 500 m, Ekpan – 1.5 km, Aja-
Etan – 2.5 km, Ifie-Kporo – 3.0 km, Ijala-Ikenren – 3.8 km from
WRPC and were coded A, B, C, D and E respectively) and stored
in sealed polythene bags. There were ten (10) replicates for each
sampling site and the sub-samples were thoroughly mixed to
obtain a representative sample of each. A control sample was
also collected 8.5 km away from WRPC. These were stored in
well-labeled amber glass bottles with teflon-lined screw cap, held
at 4°C immediately in a cooler of ice and transported to the
laboratory for pre-treatment and analyses [1]. On reaching the
laboratory, stones and debris were removed and the samples were
used as arrived for the treatment with agricultural waste from
J. of Advancement in Engineering and Technology Volume 7 / Issue 2 ISSN: 2348-2931 3
Moringa Oleifera seed. All analyses were carried out in
triplicates to minimise error.
2.3 Preparation of Moringa Oleifera Seed Cake (MOSC)
The Moringa Oleifera (MO) seed pods were purchased from
Kubwa market, FCT, Abuja, Nigeria. They were dehusked and
pulverized. The oil in the seed was extracted by hexane using
soxhlet extraction method. About 100 g of MO seed powder were
poured into an extraction thimble. 1 L of hexane solvent was
poured into a round bottom flask. After setting up the soxhlet
apparatus, it was heated for 1 hr and the oil was extracted. After
extraction, the seed cake was sun dried and pulverized. It was
then stored in a clean polyethylene container [29,30].
2.4 Sample Treatment
The samples used for the study were field-moist soil samples, no
air-dried material was used. With the soil samples, the agro-
waste from moringa seed used as organic fertilizer was added to
enhance biodegradation of the contaminant, and the whole
mixture was mixed using a mixer. The ratio of organic fertilizer
to contaminated soil was one part (20 g) of fertilizer to three
parts (60 g) of soil [31,32]. The treated soils were kept under
controlled humidity 60 % of field capacity, in the ambient
laboratory conditions with temperature (28 ± 4 °C), under
subdued light to serve as abiotic factors. The rate of
bioremediation was studied as a function of time. Heavy metal
removal was measured by monitoring the heavy metal
concentrations of the samples after 30 days, after 60 days and
after 90 days. The contents of the experiment were manually
mixed twice a week to allow aeration and homogenous mixture
of the materials [33,34].
At 30 days interval, samples were collected and air-dried for two
weeks at ambient temperature, rolled manually with a steel roller,
sieved to remove stones and debris. These were further grounded
with mortar and pestle until very fine fraction was achieved, it
was sieved through a 2-mm stainless steel mesh to get a test
sample of <2 mm fraction. Both devices were cleaned after each
sample had been processed to avoid cross-contamination. These
were properly stored in well-labeled air-tight containers until
analysis [4].
2.5 Reagents
All chemicals and reagents were of analytical grade and of
highest purity possible. They were supplied by BDH Labs (UK).
BDH Chemicals Limited Poole England.
2.6 Heavy Metals Analysis
A test portion of 1.00 g of each soil sample was digested using
the conventional aqua regia (3:1, v/v, HCl to HNO3) digestion
procedure. The soil sample was weighed and transferred into the
digestion vessel (250 ml glass beaker covered with watch glass).
20 ml of freshly prepared aqua regia mixture was added and
mixed by swirling. This was moistened with a little deionized
distilled water. Thereafter, the digestion vessel was placed on a
heating mantle for 2 h at 110 oC until about 5 ml of digest
remained in the flask. The vessel was removed and allowed to
cool for 15 min. Then, another 20 ml of freshly prepared aqua
regia mixture was added and boiling was repeated until the digest
cleared up. After evaporation to near dryness, the sample was
allowed to cool and was diluted with 20 ml of 2 % (v/v with
H2O) HNO3. This was transferred into a 100 ml volumetric flask
after filtering through Whatman no. 42 paper and was made to
volume with deionized distilled water. The blank solutions were
undergoing the same digestion procedure as that of the sample.
All digestions were carried out in triplicates for each sample and
the amounts of trace metals recorded as mean value. The extracts
were analysed for heavy metals (Cr, Cd, Pb, Ni, Cu, Co, Mn, Fe
and Zn) using atomic absorption spectrophotometer (AAS) iCE
3000 Series 3000 at their respective wavelength (357.9, 228.8,
283.3, 232.0, 324.8, 240.7, 279.5, 248.3 and 213.9 nm) according
to APHA method [35].
2.7 Preparation of Calibration Standards
For calibration of the instrument, a series of five standard
solutions were prepared by serial dilution of the stock standard
solutions (1000 mg/l) of the metals to be analyzed.
2.8 Determination of Heavy Metals in Sample Matrices
The digested soil samples were analyzed for the heavy metal
concentrations such as Cr, Cd, Pb, Ni, Cu, Co, Mn, Fe and Zn
using Atomic Absorption Spectrometer (FAAS) (AAS iCE 3000
Series). Final concentration of element in the samples was
calculated as:
Concentration (mg/kg) = Concentration (mg/L) x V ---Equ. (1)
W
Where: V is the final volume of the digested solution (100 ml)
W is the weight of the sample (1.00 g).
2.9 Statistical Analysis
Data analysis involved simple descriptive and univariate
summary statistics such as mean, standard deviation and
percentage. The heavy metals were the main index for evaluating
bioremediation in the different soil samples. Hence, the heavy
metals data were subjected to analysis of variance (ANOVA) to
compare the variability in metal removal in the different soil
samples over time. Two-way ANOVA with replication showed
that the metal losses across the different soil samples over time
was significant at the 0.01 probability level (significance level of
1%; p = 0.01), in accordance with Schmuller (2005). All the
statistical analyses were performed using statistical software
SPSS Windows version 16.0 [1].
2.10 Toxicity Assessment of Sediment Samples
Some geochemical assessment techniques, including enrichment
factor (EF) and geoaccumulation index (Igeo), were used in order
to determine the levels of metal contamination in the sediments
in focus [36]. The computation of enrichment factor (EF) has
been adopted to evaluate the impact of anthropogenic activities
related to the metal abundance in sediments. According to Moez
et al., [37], EF is defined by the following equation:
EF = (Cx/CFe) sample ------------------------------------ (Equ. 2)
(Cx/CFe) crust
whereby
• Fe (iron) is chosen as a natural element of reference
• (CX/CFe) sample is the ratio between concentration of the
element “X” and that of Fe in the sediment sample
• (CX/CFe) crust is the ratio between concentration of the
element “X” and that of Fe in unpolluted reference baseline.
According to Birch [38], calculated EF values could be
interpreted as follows:
• EF ≤ 1: no enrichment;
• 1 < EF < 3: minor enrichment;
J. of Advancement in Engineering and Technology Volume 7 / Issue 2 ISSN: 2348-2931 4
• 3 < EF < 5: moderate enrichment;
• 5 < EF < 10: moderate-to-severe enrichment;
• 10 < EF < 25: severe enrichment;
• 25 < EF < 50: very severe enrichment;
• EF > 50: extremely severe enrichment.
The study of geoaccumulation index (Igeo) could be relevant in
the examination of the contamination level of the sediment
samples affected by metals. In Maurizio’s [39] view, Igeo can be
obtained by the following equation:
---------------------------- (Equ. 3)
whereby Cn is the concentration of the metal (n) in sampled and
analyzed sediment and Bn is the background concentration of the
same metal (n) and the factor 1.5 is the background matrix
correction factor due to lithogenic effects [40]
According to Maurizio’s [39], calculated I geo values could be
interpreted as follows:
Igeo ≤ 0: Uncontaminated
0 <Igeo < 1: From uncontaminated to moderately contaminated
1 <Igeo < 2: Moderately contaminated
2 <Igeo < 3: From moderately contaminated to strongly
contaminated
3 <Igeo < 4: Strongly contaminated
4 <Igeo < 5: From strongly to extremely contaminated
Igeo > 5: Extremely contaminated
3. RESULTS AND DISCUSSION
Remediation of heavy metals was carried out by treatment of
contaminated soils with MOSC for 90 days as indicated in Tab.
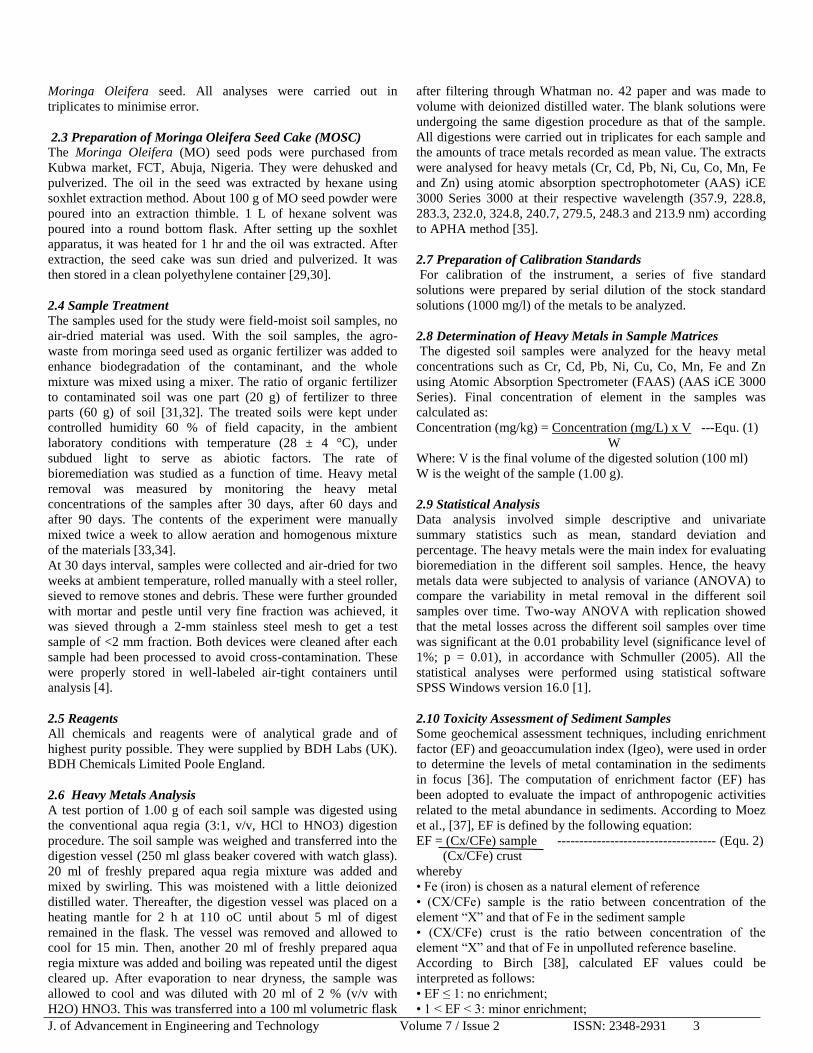
1- 4. From our previous studies, it was observed that the soil
samples were highly contaminated with all the studied metals
except Ni which was found only in the sludge and site A. Also,
the concentrations of heavy metals were seen to increase as a
result of the proximity of each site to the refinery except for Cr in
site E and Co in site D [1]. After the first 30 days of remediation
studies, the concentrations of Co and Fe reduced to values lower
than their control values at day 1 (10.90±0.03 mg/kg and
6057.13±2.12 mg/kg respectively) in all the studied sites (Tables
1 and 2) and the reduction was statistically significant (p < 0.01)
[1]. The concentration of Cd was lower than the control value at
day 1(0.60±1.13 mg/kg) only in site E (0.58±0.00 mg/kg),
however, this reduction was not statistically significant (p >
0.01). The concentrations of other metals were still higher than
their control values at day 1 after the first 30 days of treatment,
however, remediation was feasible for all the heavy metals in all
the sites.
At 60 days of remediation studies, in addition to Co, Fe and Cd,
the concentrations of Cu was seen to decrease to values lower
than its control value at day 1 (6.69±0.01 mg/kg) except in sites
A and B while Zn concentration was lower than its control value
at day 1 (245.85±0.03 mg/kg) in site E (212.39±0.17 mg/kg)
only. The concentrations of all the metals were observed to
decline consistently, but the reduction was not statistically
significant (p > 0.01) as compared to their control counterparts at
day 1 (Table 1 and 3).
Table 1: Heavy Metals concentrations of the Samples at day 1 (mg/kg)
HEAVY
METALS
SITE A SITE B SITE C SITE D SITE E CONTROL
Cr 166.79±0.27 116.71±0.21 97.86±0.05 83.55±0.10 90.88±0.13 23.89±0.10
Cd 3.56±0.06 2.26±0.02 1.82±1.07 1.57±0.36 1.10±2.83 0.60±1.13
Pb 157.64±0.16 144.94±0.15 126.18±0.12 119.54±0.16 112.98±0.11 28.49±0.07
Ni 29.64±0.03 ND ND ND ND ND
Cu 26.10±0.01 20.22±0.02 19.99±0.01 14.27±0.08 11.33±0.08 6.69±0.01
Co 22.90±0.03 11.56±0.02 11.46±0.02 13.60±0.02 11.96±0.03 10.90±0.03
Mn 8004.22±0.30 7945.51±0.66 6111.75±1.25 5760.99±1.01 5628.10±0.23 2011.07±0.33
Fe 10313.45±2.31 10061.91±1.96 9484.92±0.71 8567.82±1.41 7429.79±1.44 6057.13±2.12
Zn 916.33±0.23 673.92±0.15 604.93±0.11 577.22±0.15 515.44±0.20 245.85±0.03
ND = not detected

J. of Advancement in Engineering and Technology Volume 7 / Issue 2 ISSN: 2348-2931 5
Table 2: Heavy Metals Concentrations of the Samples after 30 days (mg/kg)
HEAVY
METALS
SITE A SITE B SITE C SITE D SITE E CONTROL
Cr 79.89±0.04 58.17±0.07 52.91±0.05 45.10±0.07 45.20±0.04 9.84±0.02
Cd 1.64±0.00 1.60±0.01 1.05±0.00 0.88±0.00 0.58±0.00 0.33±0.00
Pb 78.94±0.03 72.31±0.03 63.09±0.02 58.92±0.03 57.52±0.03 13.28±0.01
Ni 15.63±0.02 ND ND ND ND ND
Cu 12.51±0.02 12.24±0.02 11.61±0.02 8.89±0.02 7.41±0.02 3.17±0.01
Co 8.02±0.04 5.65±0.02 4.99±0.02 5.51±0.01 4.67±0.01 3.46±0.02
Mn 4230.68±1.45 4107.60±1.07 3259.71±1.46 3011.44±0.63 2925.58±0.45 1033.01±0.47
Fe 5521.56±0.45 5229.89±0.42 4943.89±0.00 4474.15±0.52 3866.32±0.36 3308.98±0.80
Zn 509.94±0.30 373.92±0.37 355.36±0.60 315.76±0.27 300.33±0.32 165.64±0.51
ND = not detected
Table 3: Heavy Metals Concentrations of the Samples after 60 days (mg/kg)
HEAVY
METALS
SITE A SITE B SITE C SITE D SITE E CONTROL
Cr 60.99±0.02 48.93±0.08 34.50±0.08 30.63±0.03 27.25±0.10 5.52±0.02
Cd 1.05±0.00 1.02±0.00 0.86±0.00 0.74±0.00 0.44±0.00 0.21±0.00
Pb 57.60±0.06 54.09±0.04 48.30±0.02 44.00±0.03 35.13±0.13 7.80±0.03
Ni 10.75±0.01 ND ND ND ND ND
Cu 8.79±0.03 6.82±0.03 5.04±0.03 4.96±0.02 3.96±0.01 2.28±0.01
Co 6.52±0.03 4.50±0.02 3.99±0.02 3.98±0.02 4.08±0.00 2.82±0.01
Mn 3216.24±2.38 3138.32±2.98 2511.85±0.60 2397.95±1.06 2335.26±0.82 829.55±0.47
Fe 4538.56±1.36 4314.51±1.51 4117.04±1.65 3705.64±1.63 3246.36±1.96 2766.64±1.91
Zn 405.05±0.13 301.07±0.28 268.73±0.22 252.60±0.18 212.39±0.17 92.78±0.17
ND = not detected

J. of Advancement in Engineering and Technology Volume 7 / Issue 2 ISSN: 2348-2931 6
Table 4: Heavy Metals Concentrations of the Samples after 90 days (mg/kg)
HEAVY
METALS
SITE A SITE B SITE C SITE D SITE E CONTROL
Cr 33.02±0.04 22.98±0.03 21.43±0.02 16.68±0.03 17.65±0.03 3.98±0.00
Cd 0.84±0.00 0.59±0.00 0.52±0.00 0.42±0.00 0.34±0.00 0.21±0.00
Pb 39.45±0.05 35.87±0.04 30.91±0.03 27.70±0.02 26.46±0.01 5.94±0.00
Ni 6.15±0.01 ND ND ND ND ND
Cu 6.03±0.01 4.61±0.01 4.36±0.01 3.35±0.00 2.45±0.01 1.56±0.00
Co 4.62±0.01 3.92±0.01 2.87±0.01 2.94±0.00 4.04±0.00 2.01±0.00
Mn 1883.76±0.91 1832.06±1.35 1439.10±0.43 1397.30±0.36 1338.20±0.55 459.19±0.53
Fe 2465.58±1.28 2368.48±0.75 2238.98±0.87 2017.42±0.69 1709.01±1.12 1461.96±0.74
Zn 207.03±0.29 167.52±0.08 152.32±0.09 67.42±0.76 121.35±0.11 74.22±0.19
ND = not detected
At 90 days which was the end of the treatability studies, the
concentrations of Cr and Cd were observed to reduce to values
lower than their control values at day 1 (23.89±0.10 mg/kg and
0.60±1.13 mg/kg respectively) in all the sites except in site A
which was very close to the refinery. The concentration of Pb
compared to its control value at day 1 (28.49±0.07 mg/kg) was
seen to decrease only in sites D and E which were farther away
from the refinery, while sites A, B and C still had higher values
of Pb though remediation was feasible (Table 4). Ni was detected
only in site A and there was a consistent reduction of Ni
throughout the treatability studies. This is in variance with
previous studies carried out by Rakesh and Raju [41] who
reported that addition of organic amendment decreased the
solubility of As, Cd, Cu, Mo, and Pb while the solubility of Ni
and Zn was not changed. The variation observed maybe due to
the different concentration and composition of petrochemicals
applied in the research. The concentrations of Cu, Co, Mn, Fe
and Zn demonstrated reduction to values lower than their control
counterparts at day 1 indicating that remediation was statistically
significant (p < 0.01) (Table 4). Generally, there was significant
decrease of all the heavy metals in all the sites from day 1 to day
90 which was the end of the treatability studies. Specifically, site
A which had the highest metal concentration also showed the
highest metal removal compared to the control which was also
treated with the agro-waste. This may be attributed to the nutrient
imbalance in the control site since it was not contaminated. This
is in agreement with Rajendran et al., [42] who reported that
microbial interactions with small quantities of metals do not exert
a major impact on metal distribution in the environment, whereas
interaction with larger quantities are required in energy
metabolism to have noticeable impact. The presence of one
heavy metal may affect the availability of another in the soil and
hence plant. This shows that, antagonistic and synergistic
behaviours exist among heavy metals. Sana et al., [43] reported
that the inhibitory effect of Mn on the total amount of
mineralized C was antagonized by the presence of Cd. In
contrast, Cu was reported to increase the toxicity of Zn in spring
barley [44]. This implies that the interrelationship between heavy
metals is quite complex; thus more research is needed in this
area.
0
10
20
30
40
50
60
70
80
90
SITE A SITE B SITE C SITE D SITE E CONTROL
% R
em
ov
al o
f M
eta
ls a
t d
ay
90
Cr
Cd
Pb
Ni
Cu
Co
Mn
Fe
Zn
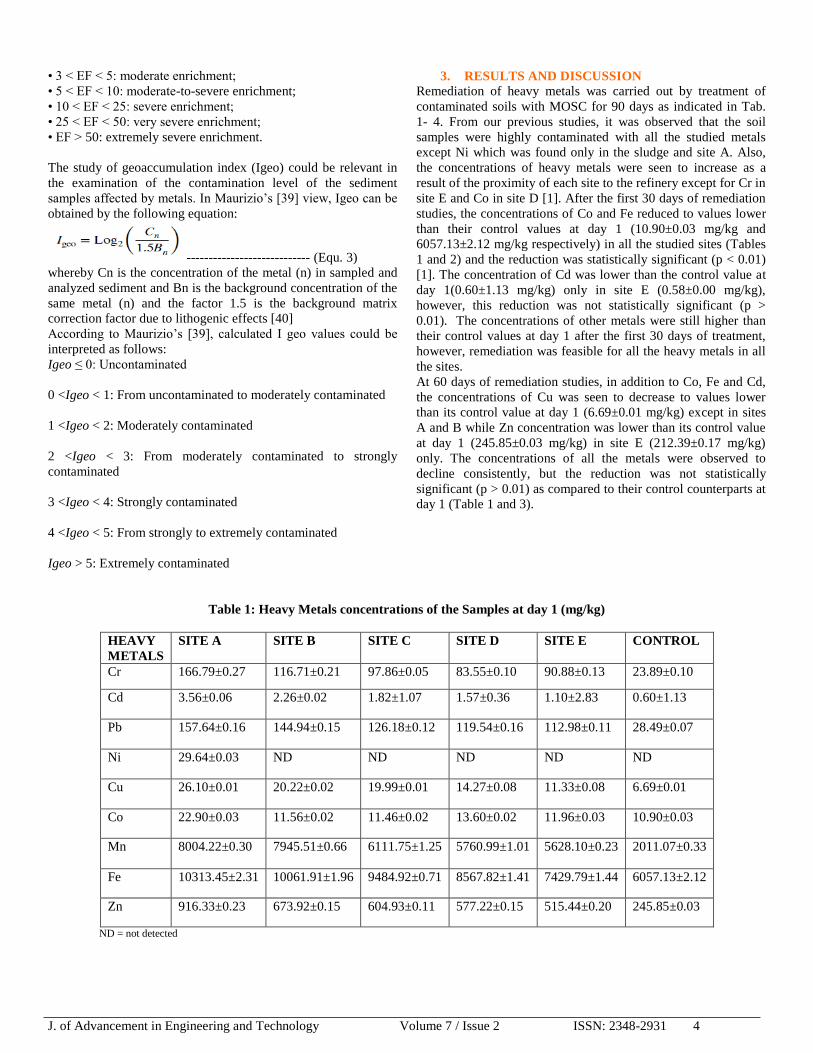
Fig. 2: Percentage Removal of Heavy Metals at day 90
The percentage removal of the metals conducted at the end of the
treatability studies is depicted in Fig. 2. It was observed that the
percentage removal of Cr, Pb, Co and Mn were higher in their
control samples (83.34 %, 79.15 %, 81.56 % and 77.17 %
respectively) than the contaminated sites while Cd, Fe and Zn
had the least percentage removal (65.00 %, 75. 86 % and 69.81
% respectively) at their control sites. From the graph, it was
revealed that Cr had relatively the highest percentage removal
except in site D, however, the effect of its residual concentration
is not yet known but can be determined by employing some
metal indicators like Enrichment Factor (EF) and
Geoaccumulation Index (Igeo). In general, the percentage
removal of all the heavy metals was between 65.00 % and 88.32
% which showed a successful bioremediation. According to
Guarino et al., [45], a bioremediation activity has successfully
occurs when 65 % or more heavy metals were removed from the
system.

J. of Advancement in Engineering and Technology Volume 7 / Issue 2 ISSN: 2348-2931 7
-1
-0.5
0
0.5
1
1.5
2
SITE A SITE B SITE C SITE D SITE E
Ge
oa
ccu
mu
latio
n In
de
x a
t d
ay
30
Cr
Cd
Pb
Ni
Cu
Co
Mn
Fe
Zn
Fig. 3: EF and Igeo of Heavy Metals at day 30 (mg/kg)
Table 5: (Igeo) classification and ranges of heavy metals in the Samples at day 30 (mg/kg) Igeo Cl
as
se
s
Level of
Contamination
Cr Cd Pb Ni Cu Co Mn Fe Zn
Igeo ≤ 0 0 Uncontaminated - - - Sites
A, B, C,
D, E
- Sites
A, B,
C, D, E
- Sites C,
D, E
-
0 < Igeo < 1 1 From
Uncontaminated to moderately
contaminated
- Sites
C, D, E
- - Sites
A, B, C, D, E
- Sites
B, C, D, E
Sites A,
B
Sites
B, C, D, E
1 < Igeo < 2 2 Moderately contaminated
Sites A, B,
C, D, E
Sites A, B
Sites A, B, C,
D, E
- - - Sites A - Site A
2 < Igeo < 3 3 From moderately contaminated to
strongly
contaminated
- - - - - - - - -
3 < Igeo < 4 4 Strongly
contaminated
- - - - - - - - -
4 < Igeo < 5 5 From strongly to extremely
contaminated
- - - - - - - - -
Igeo > 5 6 Extremely
contaminated
- - - - - - - - -
a b

J. of Advancement in Engineering and Technology Volume 7 / Issue 2 ISSN: 2348-2931 8
-0.5
0
0.5
1
1.5
2
2.5
SITE A SITE B SITE C SITE D SITE E
Ge
oa
ccu
mu
latio
n In
de
x a
t d
ay
60
Cr
Cd
Pb
Ni
Cu
Co
Mn
Fe
Zn
Fig. 4: EF and Igeo of Heavy Metals at day 60 (mg/kg)
Table 6: (Igeo) classification and ranges of heavy metals in the Samples at day 60 (mg/kg)
Igeo Cl
as
se
s
Level of
Contamination
Cr Cd Pb Ni Cu Co Mn Fe Zn
Igeo ≤ 0 0 Uncontaminated - - - Sites A, B, C,
D, E
- Sites A, B,
C, D,
E
- Sites B, C, D,
E
-
0 < Igeo < 1 1 From Uncontaminated
to moderately
contaminated
- Sites D, E
- - Sites A, B,
C, D, E
- Sites B, C, D,
E
Site A Sites A, B, C,
D, E
1 < Igeo < 2 2 Moderately contaminated
Sites A, B,
C, D, E
Sites A, B, C
Sites A, B, C,
D, E
- - - Site A - -
2 < Igeo < 3 3 From moderately
contaminated to strongly
contaminated
- - - - - - - - -
3 < Igeo < 4 4 Strongly
contaminated
- - - - - - - - -
4 < Igeo < 5 5 From strongly to extremely
contaminated
- - - - - - - - -
Igeo > 5 6 Extremely
contaminated
- - - - - - - - -
b a

J. of Advancement in Engineering and Technology Volume 7 / Issue 2 ISSN: 2348-2931 9
Fig. 5: EF and Igeo of Heavy Metals at day 90 (mg/kg)
Table 7: (Igeo) classification and ranges of heavy metals in the Samples at day 90 (mg/kg)
Igeo Cl
as
se
s
Level of
Contamination
Cr Cd Pb Ni Cu Co Mn Fe Zn
Igeo ≤ 0 0 Uncontaminated - - - Sites
A, B, C,
D, E
- Sites
A, B,
C, D, E
- Sites A,
B, C, D,
E
Sites D,
E
0 < Igeo < 1 1 From
Uncontaminated
to moderately contaminated
- Sites
A, B,
C, D, E
- - Sites
A, B,
C, D, E
- Sites
A, B, C,
D, E
- Sites
A, B, C
1 < Igeo < 2 2 Moderately
contaminated
Sites
A, B,
C, D, E
- Sites A,
B, C,
D, E
- - - - - -
2 < Igeo < 3 3 From moderately contaminated to
strongly
contaminated
- - - - - - - - -
3 < Igeo < 4 4 Strongly contaminated
- - - - - - - - -
4 < Igeo < 5 5 From strongly to
extremely
contaminated
- - - - - - - - -
Igeo > 5 6 Extremely contaminated
- - - - - - - - -
b a
J. of Advancement in Engineering and Technology Volume 7 / Issue 2 ISSN: 2348-2931 10
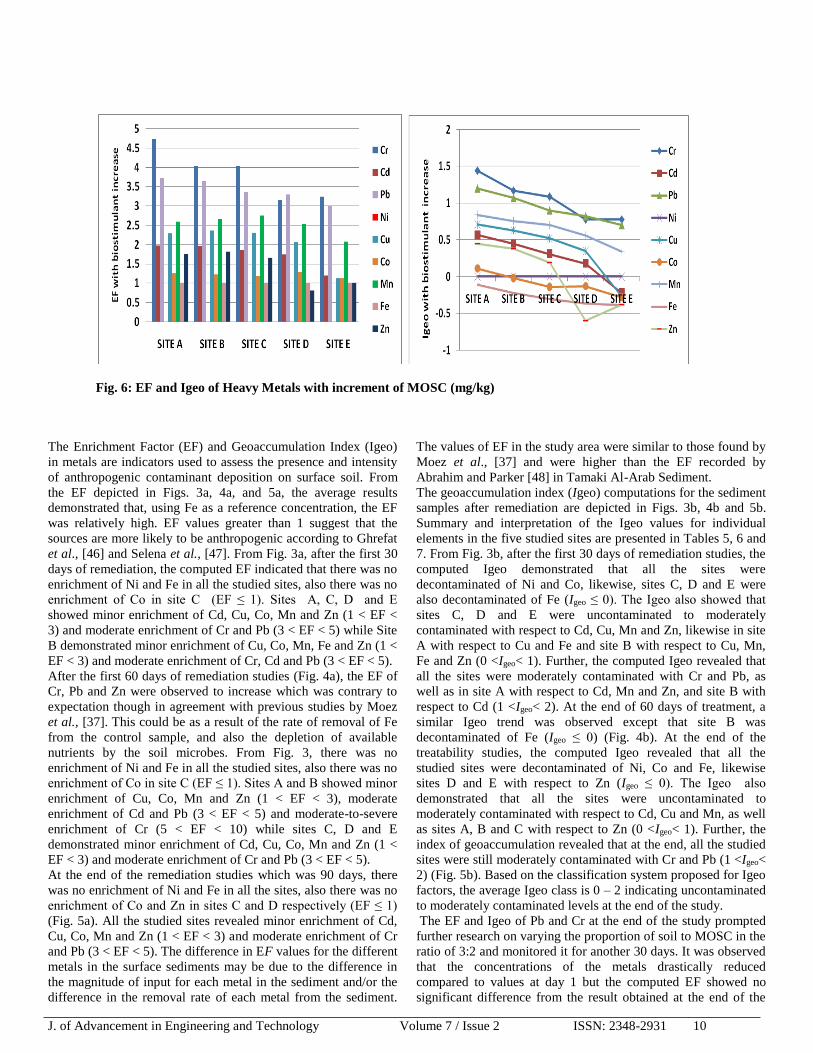
Fig. 6: EF and Igeo of Heavy Metals with increment of MOSC (mg/kg)
The Enrichment Factor (EF) and Geoaccumulation Index (Igeo)
in metals are indicators used to assess the presence and intensity
of anthropogenic contaminant deposition on surface soil. From
the EF depicted in Figs. 3a, 4a, and 5a, the average results
demonstrated that, using Fe as a reference concentration, the EF
was relatively high. EF values greater than 1 suggest that the
sources are more likely to be anthropogenic according to Ghrefat
et al., [46] and Selena et al., [47]. From Fig. 3a, after the first 30
days of remediation, the computed EF indicated that there was no
enrichment of Ni and Fe in all the studied sites, also there was no
enrichment of Co in site C (EF ≤ 1). Sites A, C, D and E
showed minor enrichment of Cd, Cu, Co, Mn and Zn (1 < EF <
3) and moderate enrichment of Cr and Pb (3 < EF < 5) while Site
B demonstrated minor enrichment of Cu, Co, Mn, Fe and Zn (1 <
EF < 3) and moderate enrichment of Cr, Cd and Pb (3 < EF < 5).
After the first 60 days of remediation studies (Fig. 4a), the EF of
Cr, Pb and Zn were observed to increase which was contrary to
expectation though in agreement with previous studies by Moez
et al., [37]. This could be as a result of the rate of removal of Fe
from the control sample, and also the depletion of available
nutrients by the soil microbes. From Fig. 3, there was no
enrichment of Ni and Fe in all the studied sites, also there was no
enrichment of Co in site C (EF ≤ 1). Sites A and B showed minor
enrichment of Cu, Co, Mn and Zn (1 < EF < 3), moderate
enrichment of Cd and Pb (3 < EF < 5) and moderate-to-severe
enrichment of Cr (5 < EF < 10) while sites C, D and E
demonstrated minor enrichment of Cd, Cu, Co, Mn and Zn (1 <
EF < 3) and moderate enrichment of Cr and Pb (3 < EF < 5).
At the end of the remediation studies which was 90 days, there
was no enrichment of Ni and Fe in all the sites, also there was no
enrichment of Co and Zn in sites C and D respectively (EF ≤ 1)
(Fig. 5a). All the studied sites revealed minor enrichment of Cd,
Cu, Co, Mn and Zn (1 < EF < 3) and moderate enrichment of Cr
and Pb (3 < EF < 5). The difference in EF values for the different
metals in the surface sediments may be due to the difference in
the magnitude of input for each metal in the sediment and/or the
difference in the removal rate of each metal from the sediment.
The values of EF in the study area were similar to those found by
Moez et al., [37] and were higher than the EF recorded by
Abrahim and Parker [48] in Tamaki Al-Arab Sediment.
The geoaccumulation index (Igeo) computations for the sediment
samples after remediation are depicted in Figs. 3b, 4b and 5b.
Summary and interpretation of the Igeo values for individual
elements in the five studied sites are presented in Tables 5, 6 and
7. From Fig. 3b, after the first 30 days of remediation studies, the
computed Igeo demonstrated that all the sites were
decontaminated of Ni and Co, likewise, sites C, D and E were
also decontaminated of Fe (Igeo ≤ 0). The Igeo also showed that
sites C, D and E were uncontaminated to moderately
contaminated with respect to Cd, Cu, Mn and Zn, likewise in site
A with respect to Cu and Fe and site B with respect to Cu, Mn,
Fe and Zn (0 <Igeo< 1). Further, the computed Igeo revealed that
all the sites were moderately contaminated with Cr and Pb, as
well as in site A with respect to Cd, Mn and Zn, and site B with
respect to Cd (1 <Igeo< 2). At the end of 60 days of treatment, a
similar Igeo trend was observed except that site B was
decontaminated of Fe (Igeo ≤ 0) (Fig. 4b). At the end of the
treatability studies, the computed Igeo revealed that all the
studied sites were decontaminated of Ni, Co and Fe, likewise
sites D and E with respect to Zn (Igeo ≤ 0). The Igeo also
demonstrated that all the sites were uncontaminated to
moderately contaminated with respect to Cd, Cu and Mn, as well
as sites A, B and C with respect to Zn (0 <Igeo< 1). Further, the
index of geoaccumulation revealed that at the end, all the studied
sites were still moderately contaminated with Cr and Pb (1 <Igeo<
2) (Fig. 5b). Based on the classification system proposed for Igeo
factors, the average Igeo class is 0 – 2 indicating uncontaminated
to moderately contaminated levels at the end of the study.
The EF and Igeo of Pb and Cr at the end of the study prompted
further research on varying the proportion of soil to MOSC in the
ratio of 3:2 and monitored it for another 30 days. It was observed
that the concentrations of the metals drastically reduced
compared to values at day 1 but the computed EF showed no
significant difference from the result obtained at the end of the

J. of Advancement in Engineering and Technology Volume 7 / Issue 2 ISSN: 2348-2931 11
study period (Fig. 6). The computed Igeo further demonstrated
that there was no significant difference from the Igeo result
observed at the end of the study period except that in addition,
site E was decontaminated with respect to Cd and Cu (Igeo ≤ 0)
(Fig. 6). The Igeo also revealed that sites D and E were
uncontaminated to moderately contaminated with respect to Cr
and Pb as well as site C with respect to Pb (0 <Igeo< 1) while sites
A and B still showed moderate contamination of Cr and Pb
likewise site C with respect to Cr (1 <Igeo< 2) (Fig. 6). This
indicated that there could be potential for improvement with time
by using higher concentration of MOSC. However, the observed
improvement was not proven to be significant. Addition of
higher mix ratio did not produce a corresponding increase in the
removal of residual metals as expected. In other words,
functional or genetic diversity of soil microorganisms was not
greatly affected by biostimulant increment, probably because of
the reduction of competition among microbial population due to
the increase in resources, as nutrient contents in amended soils. It
has been reported that excessive nutrient availability can also
inhibit the bioremediation of contaminants [43,49,50].
Bioremediation emerges as a simple and eco-friendly technology
over the conventional methods for remediation of soil due to the
complexity and environmental hazards associated with them.
However, this research has shown that bioremediation
technology also has limitations; several microorganisms cannot
really break toxic metals like Pb and Cr into harmless
metabolites, and these have inhibitory effects on microbial
activity. Modification in the outer membrane proteins of bacteria
with potential bioremediation properties for improving metal
binding abilities is the likely way to enhance their capacity for
biotransformation of toxic metals in all the possible
adverse/stress conditions and multiple-heavy-metal-contaminated
environments.
Significant difference between the concentrations of heavy
metals observed in this study proved that, MOSC have an
undiscovered and unexplored potential for the remediation of
metals in the soil. Variance in the removal of heavy metal in
different sites could be attributed to the fact that some soil
microbe tend to be more specific and sensitive to one metal but
have higher tolerance to other metals. Microbiological processes
in the soil can either solubilize metals, thereby increasing their
bioavailability and potential toxicity, or immobilize them, hence
reduce the bioavailability of these metals. These
biotransformations are important components of biogeochemical
cycles of metals exploited in bioremediation of metal
contaminated soils.
4. CONCLUSION
Bioremediation is measured to be very safe and obliging
technology as it depends on microbes that occur naturally in the
soil and pose no hazard to environment and the people living in
the area. Biological processes are often highly specific. Important
site factors required for success include the presence of
metabolically capable microbial populations, suitable
environmental growth conditions, and appropriate levels of
nutrients and contaminants. There is no doubt that
bioremediation is in the process of paving a way to greener
pastures. Regardless of which aspect of bioremediation that is
used, this technology offers an efficient and cost effective way to
treat contaminated soil. After 90 days of treatment, it was
observed that the studied heavy metals except Cr and Pb
biodegraded to levels that are no more toxic to the environment.
The computed EF and Igeo of Pb and Cr at the end of the study
prompted further research on varying the proportion of soil to
MOSC in the ratio of 3:2 and monitored it for another 30 days. It
was observed that the concentrations of the metals drastically
reduced compared to values at day 1 but the computed EF and
Igeo showed no significant difference from the result obtained at
the end of the study period. Addition of higher mix ratio did not
produce a corresponding increase in the removal of residual
metals as expected, probably because of the reduction of
competition among microbial population due to the increase in
resources, as nutrient contents in amended soils. This research
has shown that bioremediation technology though being simple
and eco-friendly, is not without some limitations; several
microorganisms cannot really break toxic metals like Pb and Cr
into harmless metabolites, and these have inhibitory effects on
microbial activity. However, bioremediation using organic
amendment have been confirmed to have the ability to transform
most heavy metals to less toxic forms. From this study, it can be
concluded that MOSC has high potential of removing heavy
metals from a contaminated soil. The sanitization of these natural
resources is important for the preservation of nature and
environment using bioremediation process.
REFERENCES 1. Useh, M. U. and Dauda, M. S. (2018). Heavy Metals
Contamination and their Potential Toxicity in Petroleum
Sludge Impacted Soils from Itsekiri Communities, Delta
State, Nigeria Chemical Science International Journal. 24(1):
1-15.
2. Obiajunwa, E. I., Pelemo, D. A., Owolabi, S. A., Fasasi, M.
K. and Johnson-Fatokun, F. O. (2002). Characterization of
heavy metal pollutants of soils and sediments around a crude-
oil production terminal using EDXRF. Nuclear Instruments
and Methods in Physics Research, Section B: Beam
Interactions with Materials and Atoms. 19(4): 61-64.
3. Useh, M. U. and Ikokoh, P. P. (2016). Assessment of Heavy
Metals Concentration of Crude Oil Polluted Soil and Water in
Some Coastal Communities of Akwa Ibom State, Nigeria.
International Journal of Environmental Chemistry. 1(1): 9-
13.
4. Useh, M. U., Useh, U. J. and Dauda, M. S. (2017).
Characterization of Environmental Samples around an
Indigenous Refinery in Nigeria. Biochemistry and Molecular
Biology. 2(6): 73-79.
5. Ogheneruemu, A. E. and Iruobe, F. A. (2015).Bioremediation
of heavy metals and petroleum hydrocarbons in diesel
contaminated soil with the earthworm:Eudrilus eugeniae.
SpringerPlus 4(7):540-548.
6. Zabbey, N. and Tanee, F. G. (2016). Assessment of
asymmetric mangrove restoration trials in Ogoniland, Niger
Delta, Nigeria: lessons for future intervention. Ecol. Restor.
3(4): 245–257.
7. Tiecher, T. L., Ceretta, C. A., Ferreira, P. A., Lourenzi, C. R.
and Girotto, E. (2016). The potential of Zea mays L. in
remediating copper and zinc contaminated soils for grapevine
production. Geoderma. 26(2): 52–61.
8. Abhijit, G., Jyoti, J., Aditya, S., Ridhi, S., Candy, S. and
Gaganjot, K. (2016). Microbes as Potential Tool for

J. of Advancement in Engineering and Technology Volume 7 / Issue 2 ISSN: 2348-2931 12
Remediation of Heavy Metals. Journal of Microbial &
Biochemical Technology. 8(4): 364-372.
9. Karami, A. and Shamsuddin, Z. H. (2010). Bioremediation of
heavy metals with several efficiency enhancer methods. Afr J
Biotechnol. 9(5): 89–98.
10. Yao, Z., Li, J., Xie, H. and Yu, C. (2012). Review on
remediation technologies of soil contaminated by heavy
metals. Procedia Environ. Sci. 1(6): 722–729.
11. Eslami, E. R. and Joodat, S. H. (2018). Bioremediation of oil
and heavy metal contaminated soil in construction sites: a
case study of using bioventing-biosparging and
phytoextraction techniques. Journal of Geology and Physics.
4(3): 356-362.
12. Samuel, O. A. and Percy C. O., 2015. Heavy Metals and
Total Petroleum Hydrocarbon Concentrations in Surface
Water of Esi River, Western Niger Delta. Research Journal
of Environmental Sciences. 9(4): 88-100.
13. Chaineau, C. H., Rougeux, G., Yepremian, C. and Oudot, J.
(2005). Effects of nutrient concentration on the
biodegradation of crude oil and associated microbial
populations in the soil. Soil Biol Biochem. 3(7): 90–97.
14. Hou, D. and Al-Tabbaa, A. (2014). Sustainability: a new
imperative in contaminated land remediation. Environ. Sci.
Policy. 3(9): 25–34.
15. Ali, H., Khan, E. and Sajad, M. A. (2013). Bioremediation of
heavy metals—concepts and applications. Chemosphere.
91(7): 869–881.
16. Riser-Roberts, E. (2010). Remediation of Petroleum
Contaminated Soils: Biological, Physical and Chemical
Processes. 2nd ed. Vol. 3. Florida : CRC Press. Pp. 576-608.
17. Jiang, Y., Brassington, K.J., Prpich, G., Paton, G.I., Semple,
K.T., Pollard, S.T. and Coulon, F. (2016). Insights into the
biodegradation of weathered hydrocarbons in contaminated
soils by bioaugmentation and nutrient stimulation.
Chemosphere. 16(1): 300–307.
18. Andreea, B., Valer, M. and Ioana, M. S. (2015). The Effect
of Organic Fertilizer from Farm Animals on the
Bioremediation Process of Soil Polluted with Petroleum
Hydrocarbons. Pro Environ. 8(5): 468-475.
19. Liu, W., Luo, Y., Teng, Y. and Liz, M. (2010).
Bioremediation of oily sludge contaminated soil by
stimulating indigenous microbes. Environ Geochem Health.
32(1): 23-29.
20. Verma, J. P. and Jaiswal, D. K. (2016). Book review:
advances in biodegradation and bioremediation of industrial
waste. Front Microbiol. 6(4): 1–2.
21. Emmanuel, S. A., Emmanuel, B. S., Zaku S. G and Thomas
S. A. (2011). Biodiversity and agricultural productivity
enhancement in Nigeria: application of processed Moringa
oleifera seeds for improved organic farming. Agric and Bio J
of North America. 2(5): 867-871.
22. Ndibewu, P.P., Mnisi, R.L., Mokgalaka, S.N. and McCrindle,
R.I. (2011). Heavy Metal Removal in Aqueous System Using
Moringa oleifera: A Review. Journal of Material Science and
Engineering. 6(4): 843-853.
23. Suhartini, S., Hidayat, N. and Rosaliana, E. (2013). Influence
of Powdered Moringa oleiferaSeeds and Natural Filter Media
on the Characteristics of Tapioca Starch Wastewater.
International Journal of Recycling of Organic Waste in
Agriculture. 2(6): 1-11.
24. Vikashni, N., Matakite, M., Kanayathu, K. and
Subramanium, S. (2012). Water Purification using Moringa
oleiferaand other locally available seeds in Fiji for Heavy
Metal removal. International Journal of Applied Science and
Technology. 2(7): 125-129.
25. Agboun, T. D., Apugo-Nwosu, T. U., Mohammed, J. A.,
Ameh A. O., Abubakar , G., Mustapha, M. and Okoro, P.
(2016). Potentials of Using Moringa oleifera Seeds in the
Bioremediation of Soil Contaminated by Crude Oil. British
Journal of Applied Science & Technology. 15(1): 1-8.
26. Meneghel, A.P., Affonso Jr., C.G., Fernanda, R., Douglas,
D.C., Lindino, C.A. and Strey, L. (2013). Biosorption of
Cadmium from Water Using Moringa (Moringa
oleiferaLam.) Seeds. Water, Air, & Soil Pollution. 2(24):
1383-1390.
27. Elum, Z. A., Mopipi, K. and Henri-Ukoha, A. (2016). Oil
exploitation and its socioeconomic effects on the Niger Delta
region of Nigeria. Environ. Sci. Pollut. Res. 2(3): 880–889.
28. K. Sam, F. Coulon and G. Prpich, “A multi-attribute
methodology for the prioritisation of oil contaminated sites in
the Niger Delta,” Sci. Total Environ. 5(9): 1323–1332, 2017.
29. Mangale S.M., Chonde S.G., Jadhav A.S. and Raut, P.D.
(2012). Study of Moringa oleifera(Drumstick) Seed as
Natural Absorbent for River Water Treatment. Journal of
Natural Product Plant Resource. 2(1): 89-100.
30. Vikashni, N., Matakite, M., Kanayathu, K. and
Subramanium, S. (2012). Water Purification using Moringa
oleiferaand other locally available seeds in Fiji for Heavy
Metal removal. International Journal of Applied Science and
Technology. 2(7): 125-129.
31. Ajani A. O. (2017). Effectiveness of organic fertilizer as a
biostimulating agent for the removal of naphthalene in soil.
Appl. J. Envir. Eng. Sci. 3(1): 77-89.
32. Lim, M.W., Lau, E. and Von, P. E. (2016). A comprehensive
guide of remediation technologies for oil contaminated soil
— present works and future directions. Mar. Pollut. Bull.
3(7): 356-367.
33. Nima H., Saeid G., and Mohammad, A. (2010).
Characterization of oily sludge from a Tehran oil refinery.
Waste Management & Research. 28(5): 921–927.
34. Surajudeen, A. A.and Adaji, B. O. (2009). Comparison of
Biostimulation and Bioaugmentation Techniques for the
Remediation of Used Motor Oil Contaminated Soil. Brazilian
Archives of Biology and Technology. 52(3): 747-754.
35. American Public Health Association. (2009). Standard
Methods for the Examination of Water and Wastewater,
APHA, AWWA, WEF/2009, APHA Publication. 20th ed.,
Washington DC.
36. Saxena, S., Srivastava, R. K., Samaddar, A. B. (2013).
Environmental analysis -water, soil and air. 2nd edition, Agro
Botanical Pulishers (India). Pp.123-148.
37. Moez, B., Houda, B., Ridha, A. and Chafal, A. (2018).
Assessment of heavy metals contamination and their potential
toxicity in the surface sediments of Sfax Solar Saltern,
Tunisia. Environmental Earth Science. 7(7): 27-49.
38. Birch, G. F. (2003). A scheme for assessing human impacts
on coastal aquatic environments using sediments. In:
Woodcoffe CD, Furness RA (eds) Coastal GIS: An integrated
approach to Australian coastal issues. Wollongong University
Papers in Center for Maritime Policy, 14, Australia.
39. Maurizio, B. (2016). The importance of enrichment factor
(EF) and geoaccumulation index (Igeo) to evaluate the soil
contamination. Geology and Geophysics. 5(3):1-4.

J. of Advancement in Engineering and Technology Volume 7 / Issue 2 ISSN: 2348-2931 13
40. Chen, J., Zhou, H. C., Wang, C., Zhu, C. Q. and Tam, N. F.
(2015). Short-term enhancement effect of nitrogen addition
on microbial degradation and plant uptake of polybrominated
diphenyl ethers (PBDEs) in contaminated mangrove soil. J
Hazard Mater. 3(8): 84–92.
41. Rakesh, M. S. and Raju, N. S. (2013). Correlation of heavy
metal contamination with soil properties of industrial areas of
Mysore, Karnataka, India by cluster analysis. International
Research Journal of Environment Sciences, vol. 2, no. 10,
22–27.
42. Rajendran, P. H., Muthukrishnan, J. I. and Gunasekaran, P.
U. (2013). Microbes in Heavy Metal Remediation. Indian
Journal of Environ. Biology. Vol. 4, no. 1, 937-949.
43. Sana, K., Muhammad, S., Nabeel, K. N., Behzad, M. and
Irshad, B. (2016). A comparison of technologies for
remediation of heavy metal contaminated soils. Journal of
Geochemical Exploration, Elsevier. 8(2): 247 - 268.
44. Namgay, T., Singh, B. and Singh, B. P. (2010). Influence of
biochar application to soil on the availabilityof As, Cd,Cu,
Pb, and Zn to maize (Zeamays L.). Soil Research, vol. 48, no.
6, pp. 638–647.
45. Guarino, C., David, B. J. and Azaizeh, M. G. (2017).
Assessment of three approaches of bioremediation (Natural
Attenuation, Landfarming and Bioagumentation – Assisted
Landfarming) for a petroleum hydrocarbons contaminated
soil. Chemosphere. 1(7): 10-16.
46. Ghrefat, H.A. Abu-Rukah, Y. and Rosen, M.A. (2011).
Application of geoaccumulation index and enrichment factor
for assessing metal contamination in the sediments of Kafrain
Dam, Jordan. Environ. Monit. Assess. 17(8): 95–109.
47. Selena, M., Alessandro, C., Massimo, P. and Giacomo, C.
(2012). Remediation of Heavy Metals Contaminated Soils by
Ball Milling.Chemical Engineering Transactions. 2(8): 187-
192.
48. Abrahim, G. M. and Parker, R. J. (2016). Assessment of
heavy metal enrichment factors and the degree of
contamination in sediments from Tamaki, Auckland, New
Zealand. Environ Monit Assess.13(6): 227–238.
49. Fauziah, S. H., Jayanthi, B. 1., Emenike, C. U., Agamuthu,
T. (2017). Remediation of Heavy Metal Contaminated Soil
Using Potential Microbes Isolated from a Closed Disposal
Site International Journal of Bioscience, Biochemistry and
Bioinformatics. 7(4): 23-34.
50. Deborah, S. and Sebastin, R. J. (2016). Bioremediation of
heavy metals from distilleries effluent using
microbes.Journal of Applied and Advanced Research. 1(2):
23–28.
Citation:Useh Mercy Uwemet al. (2018).Remediation of Heavy Metals from Petroleum Sludge Impacted Soils using Organic
Waste,J. of Advancement in Engineering and Technology, V7I2.01. DOI: 10.5281/zenodo.1481686.
Copyright:© 2018:Useh Mercy Uwem.This is an open-access article distributed under the terms of the Creative Commons Attribution License, which permits unrestricted use, distribution, and reproduction in any medium, provided the original author and source are credited.