Embed Size (px)
Citation preview
Journal of African Earth Sciences 56 (2010) 167–178
Contents lists available at ScienceDirect
Journal of African Earth Sciences
journal homepage: www.elsevier .com/locate / ja f rearsc i
Quantifying 3D post-accretionary tectonic strain in the Arabian–Nubian Shield:Superimposition of the Oko Shear Zone on the Nakasib Suture,Red Sea Hills, Sudan
Mohamed G. Abdelsalam *
Department of Geological Sciences and Engineering, Missouri University of Science and Technology, 1400 North Bishop Avenue, 129 McNutt Hall, Rolla, MO 65401, United States
a r t i c l e i n f o a b s t r a c t
Article history:Received 5 March 2009Received in revised form 18 June 2009Accepted 5 July 2009Available online 16 July 2009
Keywords:3D tectonic strainArabian–Nubian ShieldNakasib SutureOko Shear ZonePost-accretionary structures
1464-343X/$ - see front matter � 2009 Elsevier Ltd. Adoi:10.1016/j.jafrearsci.2009.07.003
* Tel.: +1 573 341 4100; fax: +1 573 341 6935.E-mail address: [email protected]
Deformed conglomeratic clasts exposed along the Neoproterozoic Nakasib Suture and the Oko Shear Zoneare used to calculate three-dimensional (3D) tectonic strain associated with the latter to quantify strainassociated with post-accretionary deformational belts in the Arabian–Nubian Shield. The Nakasib Sutureis a NE-trending fold and thrust belt that is sinistrally offset (�10 km) by the cross-cutting NNW- to NW-trending strike-slip faults of the Oko Shear Zone. The Nakasib Suture was formed as a result of collisionbetween the Haya terrane and the Gebeit terrane at �750 Ma ago. The Oko Shear Zone was subsequentlyformed as a result of an E–W directed shortening of the Arabian–Nubian Shield due to collision betweenEast and West Gondwana at �670–610 Ma ago. This analysis indicates the following: (1) The NakasibSuture is dominated by flattening strain with the flattening plane of the associated strain ellipsoid ori-ented at 21�/77�SE. This flattening deformation is interpreted to be associated with nappe emplacementfrom north to south. (2) Some regions along the Nakasib Suture are characterized by constriction strainthat might be due to refolding of the early nappes about NE-trending axes. (3) The Oko Shear Zone ischaracterized by constriction strain, with the XY plane of the strain ellipsoid oriented at 171�/68�E.The strain ellipsoid associated with the Oko Shear Zone manifests superimposition of E–W shorteningon the NE-trending fold and thrust belt associated with the Nakasib Suture. (4) The tectonic strain ofthe Oko Shear Zone, superimposed over the structures of the Nakasib Suture, is characterized by a strainellipsoid whose flattening plane is oriented at 21�/49�W. The strain ellipsoid of the tectonic strain has amajor axis with a quadratic elongation of 3.6 and an orientation of 357�/25�, an intermediate axis with aquadratic elongation of 1.2 and an orientation of 231�/30�, and a minor axis with a quadratic elongationof 0.25 and an orientation of 115�/18�. This suggests that the post-accretionary deformation of the Ara-bian–Nubian Shield was superimposed as a NW–SE directed shortening that created early N–S shorteningzones and late NW-trending sinistral strike-slip faults.
� 2009 Elsevier Ltd. All rights reserved.
1. Introduction
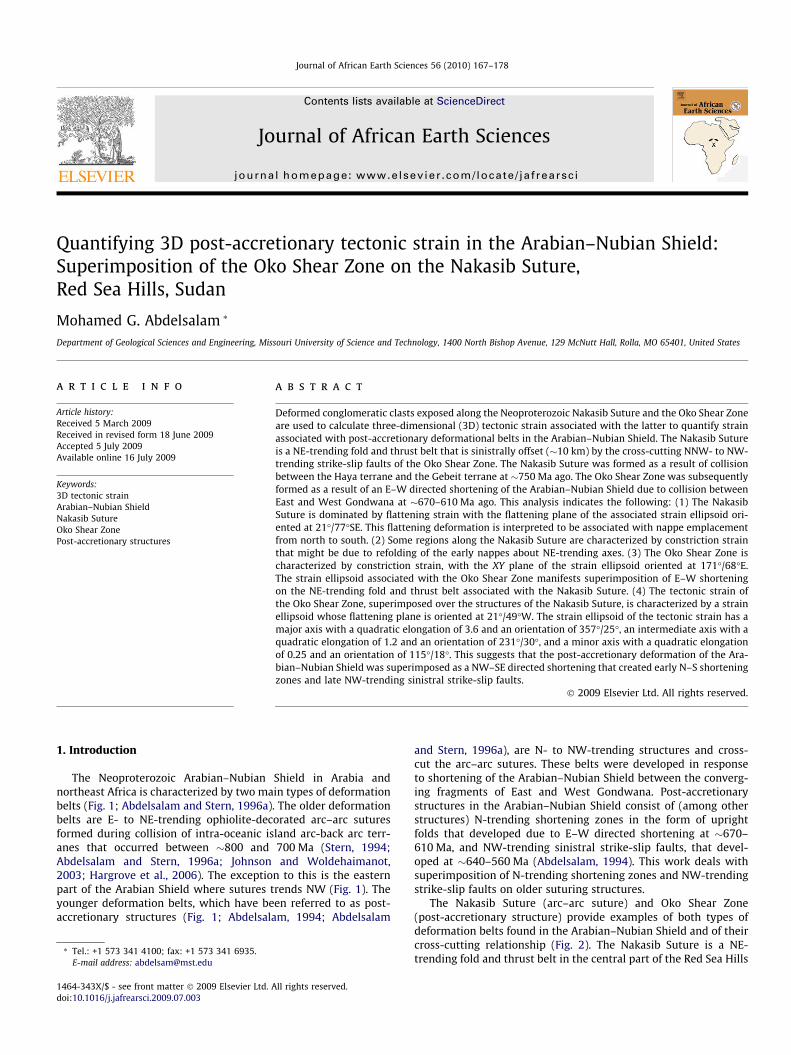
The Neoproterozoic Arabian–Nubian Shield in Arabia andnortheast Africa is characterized by two main types of deformationbelts (Fig. 1; Abdelsalam and Stern, 1996a). The older deformationbelts are E- to NE-trending ophiolite-decorated arc–arc suturesformed during collision of intra-oceanic island arc-back arc terr-anes that occurred between �800 and 700 Ma (Stern, 1994;Abdelsalam and Stern, 1996a; Johnson and Woldehaimanot,2003; Hargrove et al., 2006). The exception to this is the easternpart of the Arabian Shield where sutures trends NW (Fig. 1). Theyounger deformation belts, which have been referred to as post-accretionary structures (Fig. 1; Abdelsalam, 1994; Abdelsalam
ll rights reserved.
and Stern, 1996a), are N- to NW-trending structures and cross-cut the arc–arc sutures. These belts were developed in responseto shortening of the Arabian–Nubian Shield between the converg-ing fragments of East and West Gondwana. Post-accretionarystructures in the Arabian–Nubian Shield consist of (among otherstructures) N-trending shortening zones in the form of uprightfolds that developed due to E–W directed shortening at �670–610 Ma, and NW-trending sinistral strike-slip faults, that devel-oped at �640–560 Ma (Abdelsalam, 1994). This work deals withsuperimposition of N-trending shortening zones and NW-trendingstrike-slip faults on older suturing structures.
The Nakasib Suture (arc–arc suture) and Oko Shear Zone(post-accretionary structure) provide examples of both types ofdeformation belts found in the Arabian–Nubian Shield and of theircross-cutting relationship (Fig. 2). The Nakasib Suture is a NE-trending fold and thrust belt in the central part of the Red Sea Hills
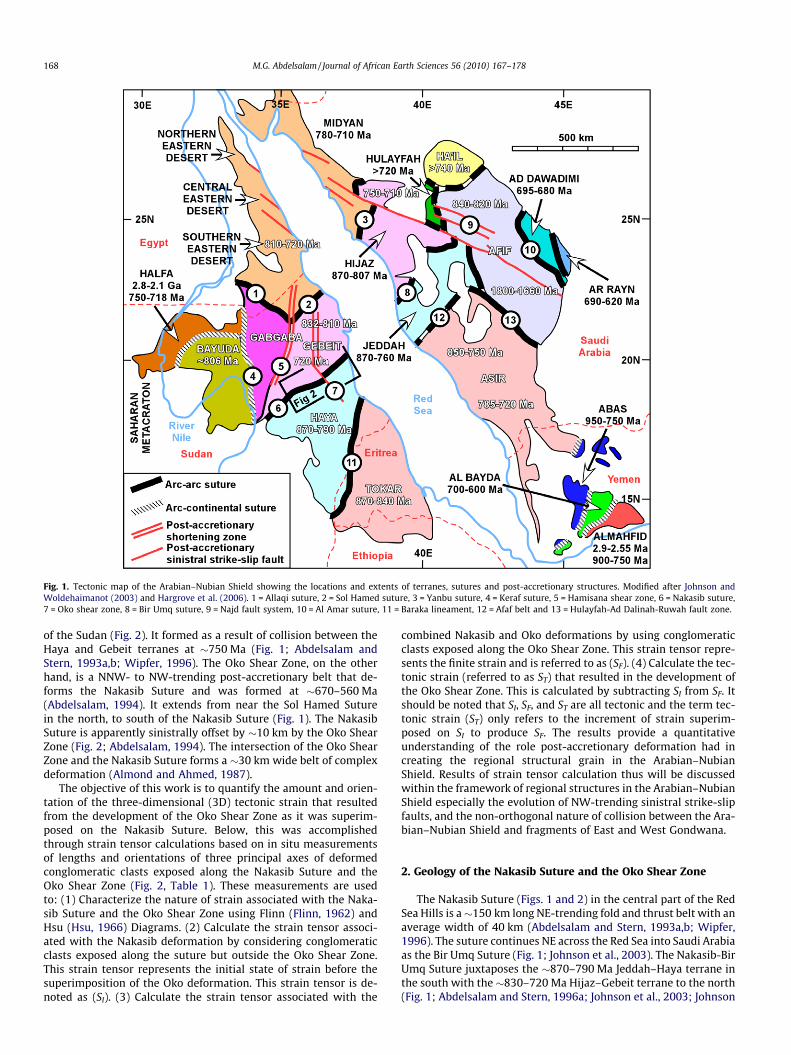
Fig. 1. Tectonic map of the Arabian–Nubian Shield showing the locations and extents of terranes, sutures and post-accretionary structures. Modified after Johnson andWoldehaimanot (2003) and Hargrove et al. (2006). 1 = Allaqi suture, 2 = Sol Hamed suture, 3 = Yanbu suture, 4 = Keraf suture, 5 = Hamisana shear zone, 6 = Nakasib suture,7 = Oko shear zone, 8 = Bir Umq suture, 9 = Najd fault system, 10 = Al Amar suture, 11 = Baraka lineament, 12 = Afaf belt and 13 = Hulayfah-Ad Dalinah-Ruwah fault zone.
168 M.G. Abdelsalam / Journal of African Earth Sciences 56 (2010) 167–178
of the Sudan (Fig. 2). It formed as a result of collision between theHaya and Gebeit terranes at �750 Ma (Fig. 1; Abdelsalam andStern, 1993a,b; Wipfer, 1996). The Oko Shear Zone, on the otherhand, is a NNW- to NW-trending post-accretionary belt that de-forms the Nakasib Suture and was formed at �670–560 Ma(Abdelsalam, 1994). It extends from near the Sol Hamed Suturein the north, to south of the Nakasib Suture (Fig. 1). The NakasibSuture is apparently sinistrally offset by �10 km by the Oko ShearZone (Fig. 2; Abdelsalam, 1994). The intersection of the Oko ShearZone and the Nakasib Suture forms a �30 km wide belt of complexdeformation (Almond and Ahmed, 1987).
The objective of this work is to quantify the amount and orien-tation of the three-dimensional (3D) tectonic strain that resultedfrom the development of the Oko Shear Zone as it was superim-posed on the Nakasib Suture. Below, this was accomplishedthrough strain tensor calculations based on in situ measurementsof lengths and orientations of three principal axes of deformedconglomeratic clasts exposed along the Nakasib Suture and theOko Shear Zone (Fig. 2, Table 1). These measurements are usedto: (1) Characterize the nature of strain associated with the Naka-sib Suture and the Oko Shear Zone using Flinn (Flinn, 1962) andHsu (Hsu, 1966) Diagrams. (2) Calculate the strain tensor associ-ated with the Nakasib deformation by considering conglomeraticclasts exposed along the suture but outside the Oko Shear Zone.This strain tensor represents the initial state of strain before thesuperimposition of the Oko deformation. This strain tensor is de-noted as (SI). (3) Calculate the strain tensor associated with the
combined Nakasib and Oko deformations by using conglomeraticclasts exposed along the Oko Shear Zone. This strain tensor repre-sents the finite strain and is referred to as (SF). (4) Calculate the tec-tonic strain (referred to as ST) that resulted in the development ofthe Oko Shear Zone. This is calculated by subtracting SI from SF. Itshould be noted that SI, SF, and ST are all tectonic and the term tec-tonic strain (ST) only refers to the increment of strain superim-posed on SI to produce SF. The results provide a quantitativeunderstanding of the role post-accretionary deformation had increating the regional structural grain in the Arabian–NubianShield. Results of strain tensor calculation thus will be discussedwithin the framework of regional structures in the Arabian–NubianShield especially the evolution of NW-trending sinistral strike-slipfaults, and the non-orthogonal nature of collision between the Ara-bian–Nubian Shield and fragments of East and West Gondwana.
2. Geology of the Nakasib Suture and the Oko Shear Zone
The Nakasib Suture (Figs. 1 and 2) in the central part of the RedSea Hills is a�150 km long NE-trending fold and thrust belt with anaverage width of 40 km (Abdelsalam and Stern, 1993a,b; Wipfer,1996). The suture continues NE across the Red Sea into Saudi Arabiaas the Bir Umq Suture (Fig. 1; Johnson et al., 2003). The Nakasib-BirUmq Suture juxtaposes the �870–790 Ma Jeddah–Haya terrane inthe south with the �830–720 Ma Hijaz–Gebeit terrane to the north(Fig. 1; Abdelsalam and Stern, 1996a; Johnson et al., 2003; Johnson
Fig. 2. Geological map of the Nakasib Suture and the Oko Shear Zone. The location of strain measurements from the Nakasib Suture are shown as open circles whereas thosefrom the Oko Shear Zone are shown as nested circles. Numbers corresponds to those in Table 1. SA = Shalhout Antiform and OS = Olig Synform.
M.G. Abdelsalam / Journal of African Earth Sciences 56 (2010) 167–178 169
and Woldehaimanot, 2003). Deformation across the Nakasib-BirUmq Suture probably occurred at �780–760 Ma (Abdelsalam,1994; Stern and Abdelsalam, 1998; Johnson et al., 2003). The sinis-tral strike-slip faults of the Oko Shear Zone apparently offset theNakasib Suture by �10 km (Fig. 2). These cross-cutting structuresform N- to NNW-trending, 30 km wide complex deformational belt(Almond and Ahmed, 1987; Abdelsalam, 1994).
The geology of the Nakasib Suture and the Oko Shear Zone is out-lined in Abdelsalam and Stern (1993a,b) and Abdelsalam (1994).Five tectono-stratigraphic groups were identified across the suture(Fig. 2). These are from south to north, the Arbaat volcanics, the sed-imentary rocks of the Salatib group and the Meritri group, the Naka-sib ophiolites, and the volcanic and sedimentary rocks of theShalhout group (Fig. 2). These groups are separated by thrustsand intruded by syn-tectonic and post-tectonic granitoids (Fig. 2).
The Arbaat volcanic rocks are �780 Ma old, thoeliitic, rift-re-lated mafic volcanic rocks with subordinate felsic volcanic rocksand siliciclastic sedimentary rocks. The Salatib and Meritri groupsare composed of siliciclastic sedimentary rocks as well as felsictuffs, ignimbrites, and rhyolites. The Meritri group is characterizedby a �2 km thick polymict conglomerate with predominantlyplutonic clasts in the northeastern part of the Nakasib Suture andpredominantly volcanic clasts to the southwest. Abdelsalam andStern (1993a) suggested that the Arbaat, Salatib, and Meritrigroups signify development of a passive margin on the northernflank of the Haya terrane prior to collision between that Hayaand Gebeit terranes and the formation of the Nakasib Suture.
The Nakasib ophiolites are mafic–ultramafic fragments whichoccur along the Nakasib Suture and mark the limbs of theNE-trending Shalhout antiform (Fig. 2). Features diagnostic to
ophiolites have been identified, including pillow-structures andcumulate layering in gabbroic bodies. These ophiolitic fragmentsare dominantly NE-trending along the Nakasib Suture to the eastand west of the Oko Shear Zone. However, within the Oko ShearZone the trend of ophiolite fragments change to N and NW dueto subsequent deformation.
The Shalhout group occupies the region to the north of theNakasib ophiolites (Fig. 2). It is made-up of felsic and intermediatevolcanics, tuff, agglomerate, ignimberite, fine turbidite, and minorlimestone beds. Geochemical data suggests that these rocks arearc-related (Abdelsalam and Stern, 1993a).
Polymict conglomerates from the Meritri group have been usedin this study as strain markers. These conglomerates are matrix-supported and occupy the core of the Olig synform (Fig. 2). Thematrix consists of lithic wacke and minor carbonates. The clastsare comprised of granites, granodiorites, diorites, rhyolites,ignimbrites and carbonates, with a few clastic sedimentary rocks.Plutonic clasts are the most abundant and they make up �50% ofthe total clasts. Volcanic clasts account for �35% and sedimentaryclasts represent �15%.
3. Structural evolution
Fig. 3, adopted from Abdelsalam and Stern (1993c), summarizesthe structural evolution of the Nakasib Suture and the Oko ShearZone. Deformation associated with both the Nakasib Suture andthe Oko Shear Zone occurred under low greenschist faciesmetamorphism (Abdelsalam and Stern, 1993a,b; Abdelsalam,1994). This is particularly evident from the mineral assemblagesof the metamorphosed mafic volcanic rocks where typical low
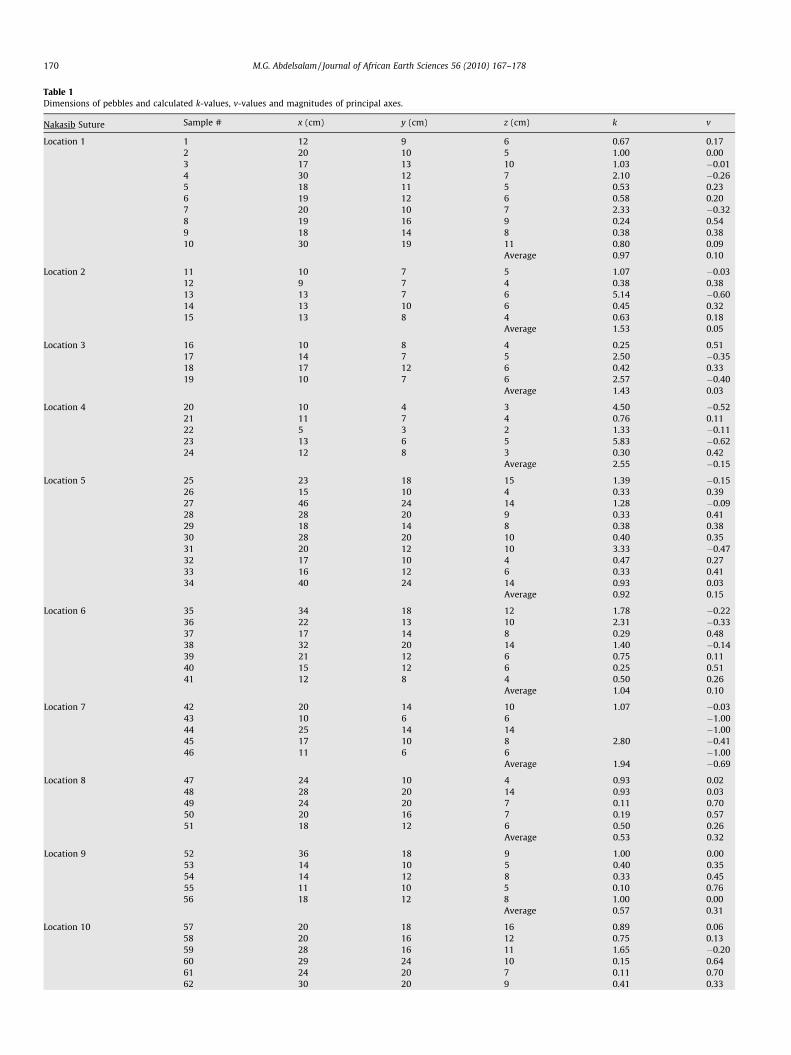
Table 1Dimensions of pebbles and calculated k-values, v-values and magnitudes of principal axes.
Nakasib Suture Sample # x (cm) y (cm) z (cm) k v
Location 1 1 12 9 6 0.67 0.172 20 10 5 1.00 0.003 17 13 10 1.03 �0.014 30 12 7 2.10 �0.265 18 11 5 0.53 0.236 19 12 6 0.58 0.207 20 10 7 2.33 �0.328 19 16 9 0.24 0.549 18 14 8 0.38 0.3810 30 19 11 0.80 0.09
Average 0.97 0.10
Location 2 11 10 7 5 1.07 �0.0312 9 7 4 0.38 0.3813 13 7 6 5.14 �0.6014 13 10 6 0.45 0.3215 13 8 4 0.63 0.18
Average 1.53 0.05
Location 3 16 10 8 4 0.25 0.5117 14 7 5 2.50 �0.3518 17 12 6 0.42 0.3319 10 7 6 2.57 �0.40
Average 1.43 0.03
Location 4 20 10 4 3 4.50 �0.5221 11 7 4 0.76 0.1122 5 3 2 1.33 �0.1123 13 6 5 5.83 �0.6224 12 8 3 0.30 0.42
Average 2.55 �0.15
Location 5 25 23 18 15 1.39 �0.1526 15 10 4 0.33 0.3927 46 24 14 1.28 �0.0928 28 20 9 0.33 0.4129 18 14 8 0.38 0.3830 28 20 10 0.40 0.3531 20 12 10 3.33 �0.4732 17 10 4 0.47 0.2733 16 12 6 0.33 0.4134 40 24 14 0.93 0.03
Average 0.92 0.15
Location 6 35 34 18 12 1.78 �0.2236 22 13 10 2.31 �0.3337 17 14 8 0.29 0.4838 32 20 14 1.40 �0.1439 21 12 6 0.75 0.1140 15 12 6 0.25 0.5141 12 8 4 0.50 0.26
Average 1.04 0.10
Location 7 42 20 14 10 1.07 �0.0343 10 6 6 �1.0044 25 14 14 �1.0045 17 10 8 2.80 �0.4146 11 6 6 �1.00
Average 1.94 �0.69
Location 8 47 24 10 4 0.93 0.0248 28 20 14 0.93 0.0349 24 20 7 0.11 0.7050 20 16 7 0.19 0.5751 18 12 6 0.50 0.26
Average 0.53 0.32
Location 9 52 36 18 9 1.00 0.0053 14 10 5 0.40 0.3554 14 12 8 0.33 0.4555 11 10 5 0.10 0.7656 18 12 8 1.00 0.00
Average 0.57 0.31
Location 10 57 20 18 16 0.89 0.0658 20 16 12 0.75 0.1359 28 16 11 1.65 �0.2060 29 24 10 0.15 0.6461 24 20 7 0.11 0.7062 30 20 9 0.41 0.33
170 M.G. Abdelsalam / Journal of African Earth Sciences 56 (2010) 167–178
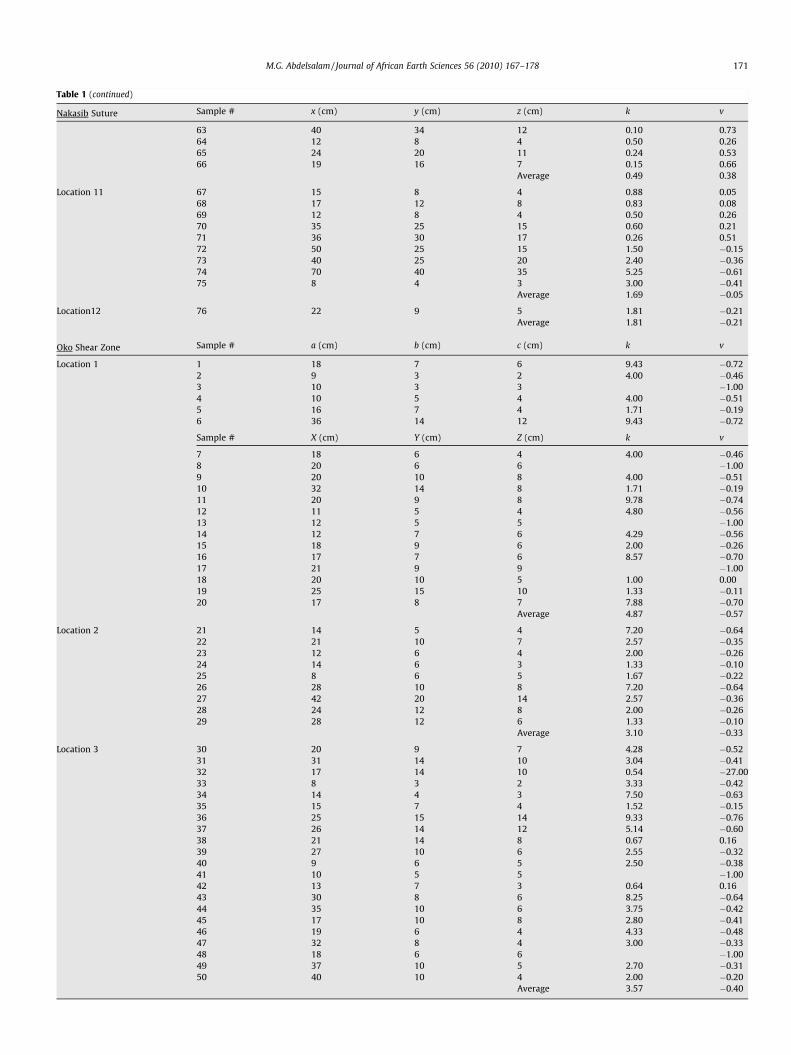
Table 1 (continued)
Nakasib Suture Sample # x (cm) y (cm) z (cm) k v
63 40 34 12 0.10 0.7364 12 8 4 0.50 0.2665 24 20 11 0.24 0.5366 19 16 7 0.15 0.66
Average 0.49 0.38
Location 11 67 15 8 4 0.88 0.0568 17 12 8 0.83 0.0869 12 8 4 0.50 0.2670 35 25 15 0.60 0.2171 36 30 17 0.26 0.5172 50 25 15 1.50 �0.1573 40 25 20 2.40 �0.3674 70 40 35 5.25 �0.6175 8 4 3 3.00 �0.41
Average 1.69 �0.05
Location12 76 22 9 5 1.81 �0.21Average 1.81 �0.21
Oko Shear Zone Sample # a (cm) b (cm) c (cm) k v
Location 1 1 18 7 6 9.43 �0.722 9 3 2 4.00 �0.463 10 3 3 �1.004 10 5 4 4.00 �0.515 16 7 4 1.71 �0.196 36 14 12 9.43 �0.72
Sample # X (cm) Y (cm) Z (cm) k v
7 18 6 4 4.00 �0.468 20 6 6 �1.009 20 10 8 4.00 �0.5110 32 14 8 1.71 �0.1911 20 9 8 9.78 �0.7412 11 5 4 4.80 �0.5613 12 5 5 �1.0014 12 7 6 4.29 �0.5615 18 9 6 2.00 �0.2616 17 7 6 8.57 �0.7017 21 9 9 �1.0018 20 10 5 1.00 0.0019 25 15 10 1.33 �0.1120 17 8 7 7.88 �0.70
Average 4.87 �0.57
Location 2 21 14 5 4 7.20 �0.6422 21 10 7 2.57 �0.3523 12 6 4 2.00 �0.2624 14 6 3 1.33 �0.1025 8 6 5 1.67 �0.2226 28 10 8 7.20 �0.6427 42 20 14 2.57 �0.3628 24 12 8 2.00 �0.2629 28 12 6 1.33 �0.10
Average 3.10 �0.33
Location 3 30 20 9 7 4.28 �0.5231 31 14 10 3.04 �0.4132 17 14 10 0.54 �27.0033 8 3 2 3.33 �0.4234 14 4 3 7.50 �0.6335 15 7 4 1.52 �0.1536 25 15 14 9.33 �0.7637 26 14 12 5.14 �0.6038 21 14 8 0.67 0.1639 27 10 6 2.55 �0.3240 9 6 5 2.50 �0.3841 10 5 5 �1.0042 13 7 3 0.64 0.1643 30 8 6 8.25 �0.6444 35 10 6 3.75 �0.4245 17 10 8 2.80 �0.4146 19 6 4 4.33 �0.4847 32 8 4 3.00 �0.3348 18 6 6 �1.0049 37 10 5 2.70 �0.3150 40 10 4 2.00 �0.20
Average 3.57 �0.40
M.G. Abdelsalam / Journal of African Earth Sciences 56 (2010) 167–178 171
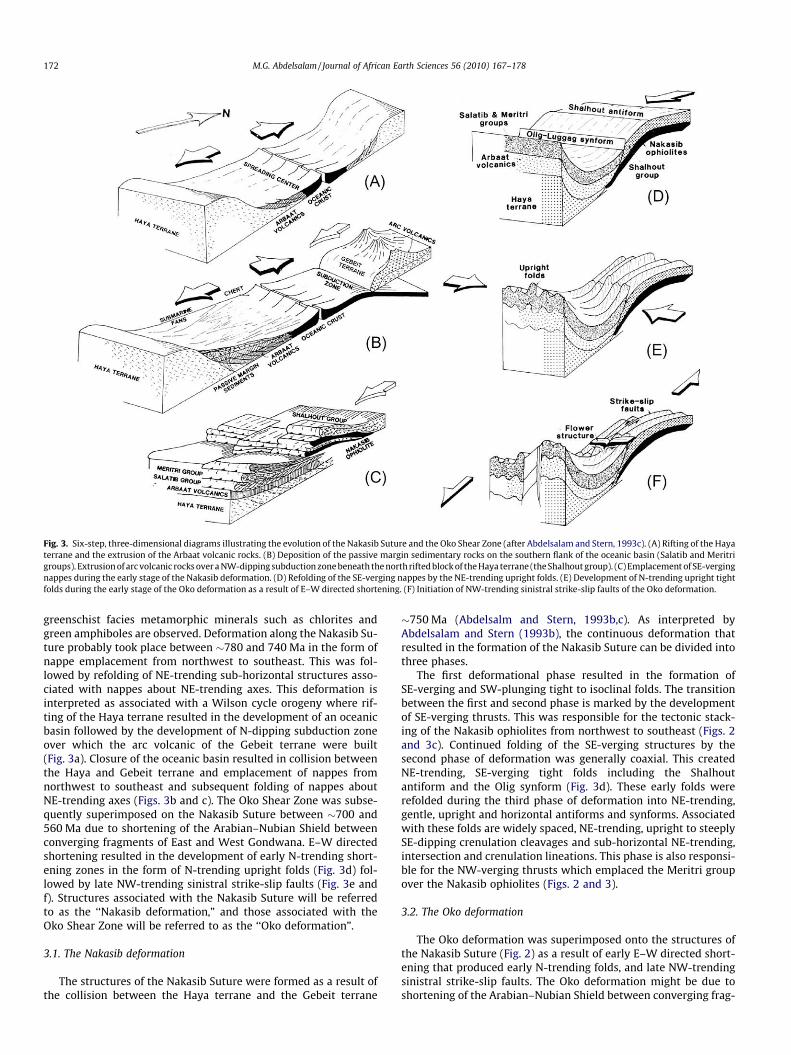
Fig. 3. Six-step, three-dimensional diagrams illustrating the evolution of the Nakasib Suture and the Oko Shear Zone (after Abdelsalam and Stern, 1993c). (A) Rifting of the Hayaterrane and the extrusion of the Arbaat volcanic rocks. (B) Deposition of the passive margin sedimentary rocks on the southern flank of the oceanic basin (Salatib and Meritrigroups). Extrusion of arc volcanic rocks over a NW-dipping subduction zone beneath the north rifted block of the Haya terrane (the Shalhout group). (C) Emplacement of SE-vergingnappes during the early stage of the Nakasib deformation. (D) Refolding of the SE-verging nappes by the NE-trending upright folds. (E) Development of N-trending upright tightfolds during the early stage of the Oko deformation as a result of E–W directed shortening. (F) Initiation of NW-trending sinistral strike-slip faults of the Oko deformation.
172 M.G. Abdelsalam / Journal of African Earth Sciences 56 (2010) 167–178
greenschist facies metamorphic minerals such as chlorites andgreen amphiboles are observed. Deformation along the Nakasib Su-ture probably took place between �780 and 740 Ma in the form ofnappe emplacement from northwest to southeast. This was fol-lowed by refolding of NE-trending sub-horizontal structures asso-ciated with nappes about NE-trending axes. This deformation isinterpreted as associated with a Wilson cycle orogeny where rif-ting of the Haya terrane resulted in the development of an oceanicbasin followed by the development of N-dipping subduction zoneover which the arc volcanic of the Gebeit terrane were built(Fig. 3a). Closure of the oceanic basin resulted in collision betweenthe Haya and Gebeit terrane and emplacement of nappes fromnorthwest to southeast and subsequent folding of nappes aboutNE-trending axes (Figs. 3b and c). The Oko Shear Zone was subse-quently superimposed on the Nakasib Suture between �700 and560 Ma due to shortening of the Arabian–Nubian Shield betweenconverging fragments of East and West Gondwana. E–W directedshortening resulted in the development of early N-trending short-ening zones in the form of N-trending upright folds (Fig. 3d) fol-lowed by late NW-trending sinistral strike-slip faults (Fig. 3e andf). Structures associated with the Nakasib Suture will be referredto as the ‘‘Nakasib deformation,” and those associated with theOko Shear Zone will be referred to as the ‘‘Oko deformation”.
3.1. The Nakasib deformation
The structures of the Nakasib Suture were formed as a result ofthe collision between the Haya terrane and the Gebeit terrane
�750 Ma (Abdelsalm and Stern, 1993b,c). As interpreted byAbdelsalam and Stern (1993b), the continuous deformation thatresulted in the formation of the Nakasib Suture can be divided intothree phases.
The first deformational phase resulted in the formation ofSE-verging and SW-plunging tight to isoclinal folds. The transitionbetween the first and second phase is marked by the developmentof SE-verging thrusts. This was responsible for the tectonic stack-ing of the Nakasib ophiolites from northwest to southeast (Figs. 2and 3c). Continued folding of the SE-verging structures by thesecond phase of deformation was generally coaxial. This createdNE-trending, SE-verging tight folds including the Shalhoutantiform and the Olig synform (Fig. 3d). These early folds wererefolded during the third phase of deformation into NE-trending,gentle, upright and horizontal antiforms and synforms. Associatedwith these folds are widely spaced, NE-trending, upright to steeplySE-dipping crenulation cleavages and sub-horizontal NE-trending,intersection and crenulation lineations. This phase is also responsi-ble for the NW-verging thrusts which emplaced the Meritri groupover the Nakasib ophiolites (Figs. 2 and 3).
3.2. The Oko deformation
The Oko deformation was superimposed onto the structures ofthe Nakasib Suture (Fig. 2) as a result of early E–W directed short-ening that produced early N-trending folds, and late NW-trendingsinistral strike-slip faults. The Oko deformation might be due toshortening of the Arabian–Nubian Shield between converging frag-
M.G. Abdelsalam / Journal of African Earth Sciences 56 (2010) 167–178 173
ments of East and West Gondwana at �670–610 Ma (Abdelsalam,1994).
The Oko deformation can be divided into three phases. The firstphase of deformation, initiated by E–W directed shortening andproduced N- to NNW-trending upright folds that are generallytight to isoclinal (Fig. 3e). This folding culminated with the forma-tion of the strike-slip faults of the second phase of deformation at�640–560 Ma (Fig. 3f). These strike-slip faults formed as a conju-gate set of steeply dipping NW- to NNW-trending sinistral strike-slip faults and NE-trending dextral strike-slip faults along theinflection planes of the first phase folds (Fig. 3f). The NW- toNNW-trending sinistral strike-slip faults dominated, rotating theNE-trending Nakasib structures to a northward orientation adja-cent to their fault planes. The NE-trending dextral strike-slip faults,in contrast, are not well developed in the Oko Shear Zone.
The deformation continued during the third phase of deforma-tion to form E- and W-verging thrust sheets constituting a flowerstructure (Fig. 3f), with sub-horizontal kinks and buckles that de-form the steeply dipping underlying fabric. The flower structuresare likely derived from the strike-slip faults.
4. Strain analysis
The conglomerate clasts used as strain markers in this studyare from the Meritri Group along the Nakasib Suture, includingits intersection with the Oko Shear Zone. In situ measurementsof the length of the long, intermediate and short axes of theclasts, as well as the trend and plunge of their long and shortaxes, were made during the winter of 1990. The trend and plungeof the clasts intermediate axes were constructed to be perpendic-ular to the orientations of their long and short axes. Locations ofthe measurements are shown in Fig. 2. A total of 76 clasts from12 locations were measured along the Nakasib Suture, with anadditional 50 clasts measured from three locations within theOko Shear Zone. The number of clasts measured per locationranges from 1 to 10 for the Nakasib Suture and from 9 to 21for the Oko Shear Zone (Table 1). The length of the long axes ofthe clasts ranges between 5 and 70 cm and the length of the shortaxes ranges between 2 and 34 cm (Table 1). These measurementsdo not directly correspond to the 3D strain ellipsoid. Rather, theyrepresent the shape of the clasts which might manifests both ini-tial ellipticity and tectonic strain.
4.1. Clasts rheology, shapes, orientations, and nature of strainellipsoids
All conglomeratic clasts used in this study are estimated to be de-formed through ductile strain. No signs of cataclasis deformation,solution pressure, or veining are observed in the clasts. Table 1shows the results of the length measurements on X–Y and Y–Z planesof the inferred strain ellipsoid measured from individual clasts. Fromthat the two-dimensional (2D) ellipticity (R) on the X–Y (Rxy) andY–Z (Ryz) planes, and the three-dimensional clast shape (k-values)were calculated using the equations below (Flinn, 1962).
Rxy ¼ x=y ð1ÞRyz ¼ y=z ð2Þ
where
x = the length of the long axis in cm,y = the length of the intermediate axis in cm,z = the length of the short axis in cm,Rxy and Ryz are used to calculate the k-values of individualclasts (Table 1) using the equation:
k ¼ ðRxy� 1Þ=ðRyz� 1Þ ð3Þ
A k-value of 1 indicates plane strain, k-values greater than 1indicate constriction strain (prolate or cigar-shaped strain ellip-soid), and k-values less than 1 indicate flattening strain. The higherthe k-value above 1 the more constriction strain. The lower thek-value below 1 the more flattened the strain ellipsoid.
Similarly, the Rxy and Ryz values are used to calculate the v-val-ues and Es-values (Hsu, 1966) of individual clasts (Table 1) usingthe equations:
v ¼ ðln Ryz� ln RxyÞ= ln Rxz ð4ÞEs ¼ ½ðln RxyÞ2 þ ðln RyzÞ2 þ ðln RzxÞ2�=ð31=2Þ ð5Þ
where
Rzx ¼ z=x ð6Þ
Plane strain has a v-value of zero. Negative v-values indicateconstriction strain whereas positive v-values indicate flatteningstrain. Higher positive v-values indicate more flattening and lowernegative v-values indicate more constriction. On the other hand,Es-values quantify the departure of the strain ellipsoid from theperfect sphere which has an Es-value of zero. The higher the Es-va-lue the more flattening or constriction.
Rxy and Ryz for all conglomeratic clasts from the Nakasib Sutureand Oko Shear Zone are plotted to produce a Flinn Diagram (Fig. 4a;Flinn, 1962) whereas the v and Es-values are plotted to produce aHsu Diagram (Fig. 4b; Hsu, 1966). The averaged k-values per loca-tion for conglomeratic clasts from the Nakasib Suture are foundto be ranging from 0.49 to 2.55 and v-values ranging from -0.69to 0.38 (Table 1). The average k-values per location for conglomer-atic clasts from the Oko Shear Zone are ranging from 3.1 to 4.87 andv-values ranging from �0.57 to �0.33 (Table 1). This indicates thatthe majority of the Nakasib clasts are flattened whereas the major-ity of the Oko clasts are deformed by constriction strain. This is alsoshown by the Flinn and the Hsu Diagrams (Fig. 4a and b). In addi-tion, the data shown in Flinn Diagram can be interpreted as thatthe initial flattening strain within the Nakasib Suture was replacedby constriction strain with the onset of the Oko deformation indi-cating a deformation path that started with flattening strain andwas subsequently changed into a constriction strain (Fig. 4a).
Plot of the average k- and v-values for individual locations alongthe Nakasib Suture and the Oko Shear Zone is shown in Fig. 5. Thek-values and v-values along the central part of the Nakasib Sutureindicate flattening strain (k-values < 1 and positive v-values),although some k- and v-values indicate minor constriction strain(k-values > 1 and negative v-values). This constriction strain canbe explained as resulting from refolding of earlier structures asso-ciated with SE-verging nappes by subsequent NE-trending folds(Fig. 3d). In contrast, the k-values and v-values from within theOko Shear Zone reveal a high degree of constriction strain through-out the zone (Fig. 5).
The orientation of the major and minor axes of conglomeraticclasts for the Nakasib Suture and the Oko Shear Zone is shown inFig. 6. The orientations of the intermediate axes are determinedto be perpendicular to both the major and minor axes. The result-ing average orientations of the principal axes of the strain ellip-soids for the Nakasib Suture and the Oko Shear Zone are plottedon equal-area stereonets and are shown in Fig. 7a and b. Stereonetplots show that the overall orientation of the clasts from the Naka-sib Suture long axis is 193�/31�, intermediate axis is 42�/56�, andshort axis is 291�/14�. The Oko Shear Zone has a major axis withan orientation of 100�/67�, an intermediate axis with an orienta-tion of 354�/8�, and a minor axis with an orientation of 261�/22�.
The quadratic elongation for the principal axes for both theNakasib Suture and the Oko Shear Zone, k1, k2 and k3, are calcu-lated using the equations:
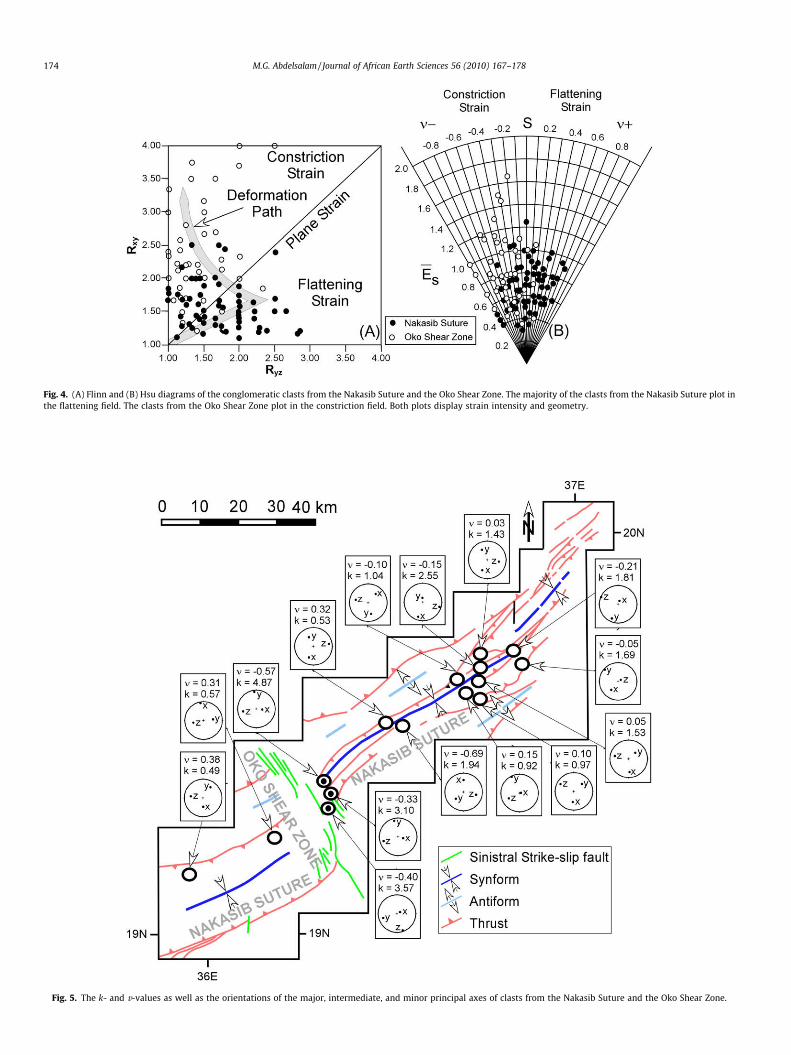
Fig. 5. The k- and v-values as well as the orientations of the major, intermediate, and minor principal axes of clasts from the Nakasib Suture and the Oko Shear Zone.
Fig. 4. (A) Flinn and (B) Hsu diagrams of the conglomeratic clasts from the Nakasib Suture and the Oko Shear Zone. The majority of the clasts from the Nakasib Suture plot inthe flattening field. The clasts from the Oko Shear Zone plot in the constriction field. Both plots display strain intensity and geometry.
174 M.G. Abdelsalam / Journal of African Earth Sciences 56 (2010) 167–178
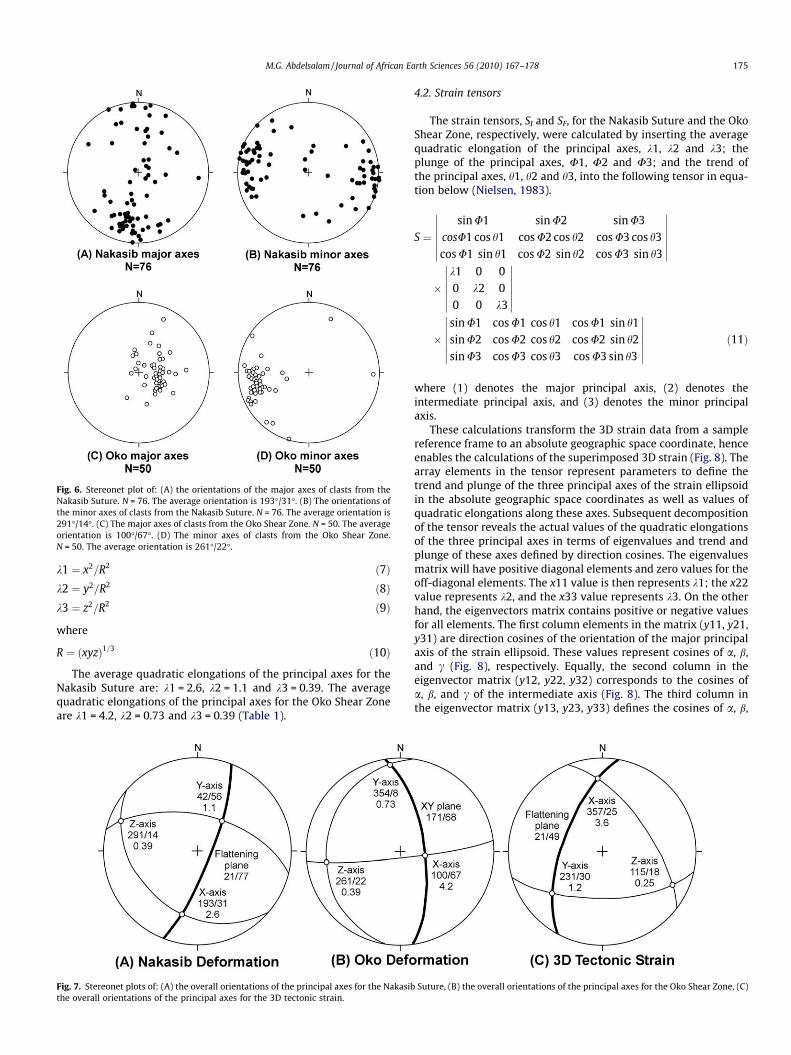
Fig. 6. Stereonet plot of: (A) the orientations of the major axes of clasts from theNakasib Suture. N = 76. The average orientation is 193�/31�. (B) The orientations ofthe minor axes of clasts from the Nakasib Suture. N = 76. The average orientation is291�/14�. (C) The major axes of clasts from the Oko Shear Zone. N = 50. The averageorientation is 100�/67�. (D) The minor axes of clasts from the Oko Shear Zone.N = 50. The average orientation is 261�/22�.
M.G. Abdelsalam / Journal of African Earth Sciences 56 (2010) 167–178 175
k1 ¼ x2=R2 ð7Þk2 ¼ y2=R2 ð8Þk3 ¼ z2=R2 ð9Þ
where
R ¼ ðxyzÞ1=3 ð10Þ
The average quadratic elongations of the principal axes for theNakasib Suture are: k1 = 2.6, k2 = 1.1 and k3 = 0.39. The averagequadratic elongations of the principal axes for the Oko Shear Zoneare k1 = 4.2, k2 = 0.73 and k3 = 0.39 (Table 1).
Fig. 7. Stereonet plots of: (A) the overall orientations of the principal axes for the Nakasibthe overall orientations of the principal axes for the 3D tectonic strain.
4.2. Strain tensors
The strain tensors, SI and SF, for the Nakasib Suture and the OkoShear Zone, respectively, were calculated by inserting the averagequadratic elongation of the principal axes, k1, k2 and k3; theplunge of the principal axes, U1, U2 and U3; and the trend ofthe principal axes, h1, h2 and h3, into the following tensor in equa-tion below (Nielsen, 1983).
S ¼sin U1 sin U2 sin U3
cosU1 cos h1 cos U2 cos h2 cos U3 cos h3cos U1 sin h1 cos U2 sin h2 cos U3 sin h3
�������
�������
�k1 0 00 k2 00 0 k3
�������
�������
�sin U1 cos U1 cos h1 cos U1 sin h1sin U2 cos U2 cos h2 cos U2 sin h2sin U3 cos U3 cos h3 cos U3 sin h3
�������
�������
ð11Þ
where (1) denotes the major principal axis, (2) denotes theintermediate principal axis, and (3) denotes the minor principalaxis.
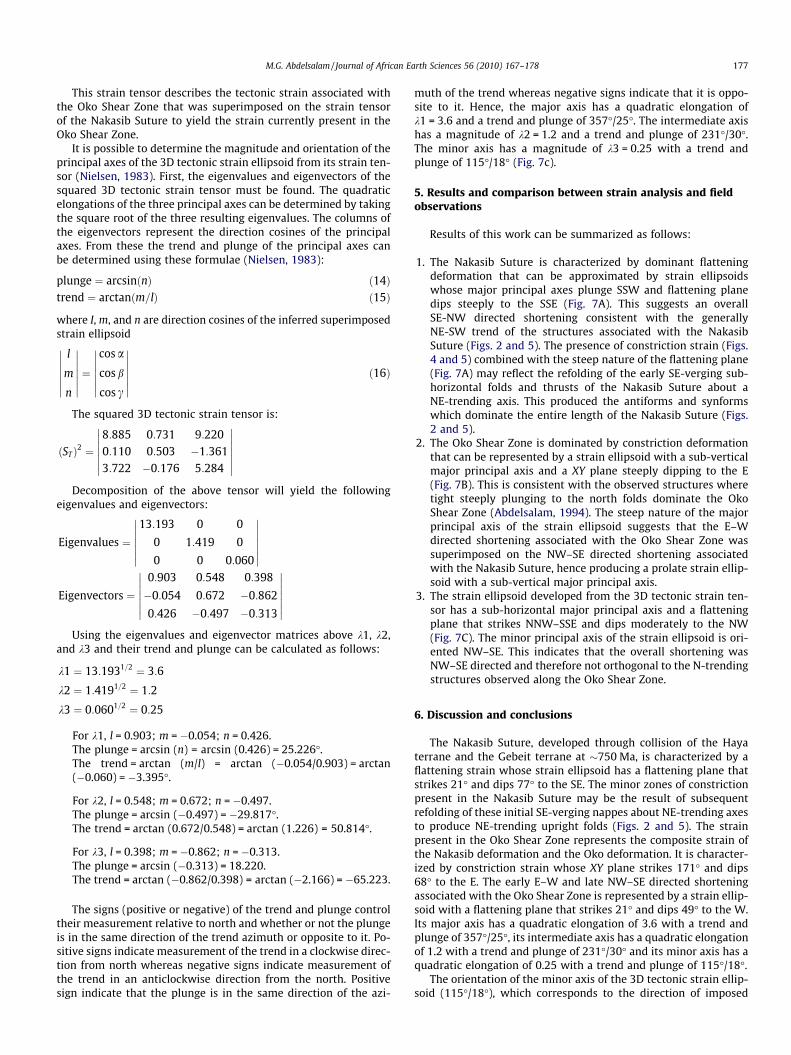
These calculations transform the 3D strain data from a samplereference frame to an absolute geographic space coordinate, henceenables the calculations of the superimposed 3D strain (Fig. 8). Thearray elements in the tensor represent parameters to define thetrend and plunge of the three principal axes of the strain ellipsoidin the absolute geographic space coordinates as well as values ofquadratic elongations along these axes. Subsequent decompositionof the tensor reveals the actual values of the quadratic elongationsof the three principal axes in terms of eigenvalues and trend andplunge of these axes defined by direction cosines. The eigenvaluesmatrix will have positive diagonal elements and zero values for theoff-diagonal elements. The x11 value is then represents k1; the x22value represents k2, and the x33 value represents k3. On the otherhand, the eigenvectors matrix contains positive or negative valuesfor all elements. The first column elements in the matrix (y11, y21,y31) are direction cosines of the orientation of the major principalaxis of the strain ellipsoid. These values represent cosines of a, b,and c (Fig. 8), respectively. Equally, the second column in theeigenvector matrix (y12, y22, y32) corresponds to the cosines ofa, b, and c of the intermediate axis (Fig. 8). The third column inthe eigenvector matrix (y13, y23, y33) defines the cosines of a, b,
Suture, (B) the overall orientations of the principal axes for the Oko Shear Zone, (C)
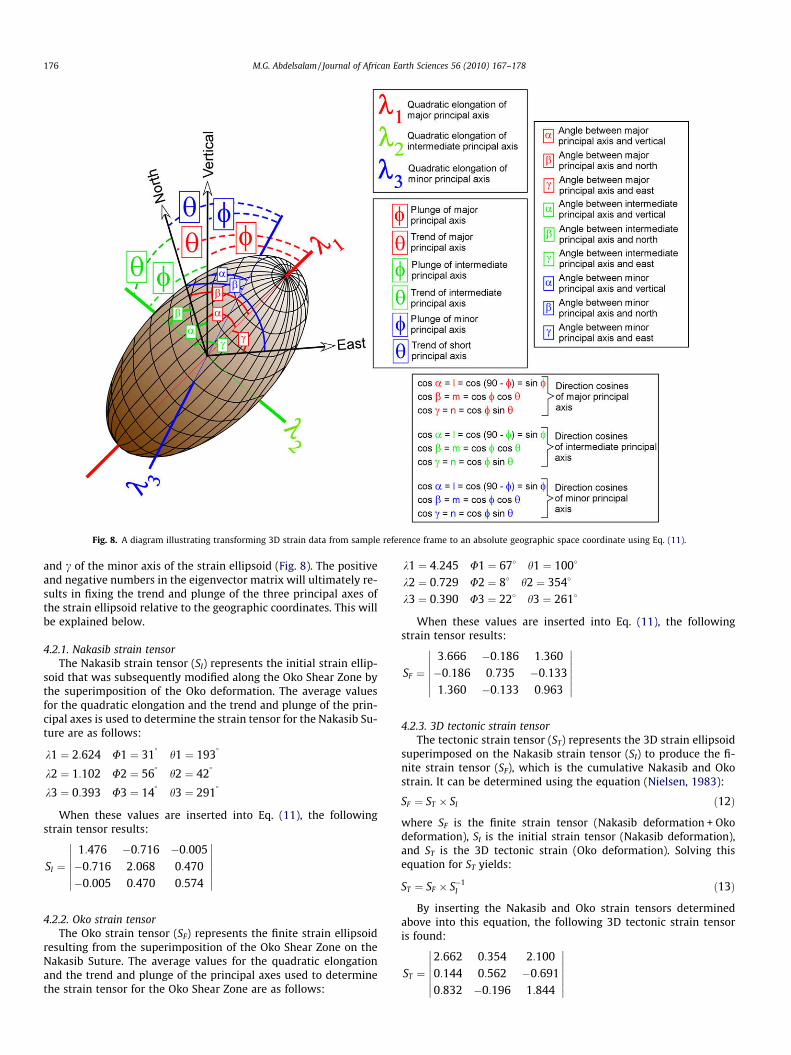
Fig. 8. A diagram illustrating transforming 3D strain data from sample reference frame to an absolute geographic space coordinate using Eq. (11).
176 M.G. Abdelsalam / Journal of African Earth Sciences 56 (2010) 167–178
and c of the minor axis of the strain ellipsoid (Fig. 8). The positiveand negative numbers in the eigenvector matrix will ultimately re-sults in fixing the trend and plunge of the three principal axes ofthe strain ellipsoid relative to the geographic coordinates. This willbe explained below.
4.2.1. Nakasib strain tensorThe Nakasib strain tensor (SI) represents the initial strain ellip-
soid that was subsequently modified along the Oko Shear Zone bythe superimposition of the Oko deformation. The average valuesfor the quadratic elongation and the trend and plunge of the prin-cipal axes is used to determine the strain tensor for the Nakasib Su-ture are as follows:
k1 ¼ 2:624 U1 ¼ 31�
h1 ¼ 193�
k2 ¼ 1:102 U2 ¼ 56�
h2 ¼ 42�
k3 ¼ 0:393 U3 ¼ 14�
h3 ¼ 291�
When these values are inserted into Eq. (11), the followingstrain tensor results:
SI ¼1:476 �0:716 �0:005�0:716 2:068 0:470�0:005 0:470 0:574
�������
�������
4.2.2. Oko strain tensorThe Oko strain tensor (SF) represents the finite strain ellipsoid
resulting from the superimposition of the Oko Shear Zone on theNakasib Suture. The average values for the quadratic elongationand the trend and plunge of the principal axes used to determinethe strain tensor for the Oko Shear Zone are as follows:
k1 ¼ 4:245 U1 ¼ 67� h1 ¼ 100�
k2 ¼ 0:729 U2 ¼ 8� h2 ¼ 354�
k3 ¼ 0:390 U3 ¼ 22� h3 ¼ 261�
When these values are inserted into Eq. (11), the followingstrain tensor results:
SF ¼3:666 �0:186 1:360�0:186 0:735 �0:1331:360 �0:133 0:963
�������
�������
4.2.3. 3D tectonic strain tensorThe tectonic strain tensor (ST) represents the 3D strain ellipsoid
superimposed on the Nakasib strain tensor (SI) to produce the fi-nite strain tensor (SF), which is the cumulative Nakasib and Okostrain. It can be determined using the equation (Nielsen, 1983):
SF ¼ ST � SI ð12Þ
where SF is the finite strain tensor (Nakasib deformation + Okodeformation), SI is the initial strain tensor (Nakasib deformation),and ST is the 3D tectonic strain (Oko deformation). Solving thisequation for ST yields:
ST ¼ SF � S�1I ð13Þ
By inserting the Nakasib and Oko strain tensors determinedabove into this equation, the following 3D tectonic strain tensoris found:
ST ¼2:662 0:354 2:1000:144 0:562 �0:6910:832 �0:196 1:844
�������
�������
M.G. Abdelsalam / Journal of African Earth Sciences 56 (2010) 167–178 177
This strain tensor describes the tectonic strain associated withthe Oko Shear Zone that was superimposed on the strain tensorof the Nakasib Suture to yield the strain currently present in theOko Shear Zone.
It is possible to determine the magnitude and orientation of theprincipal axes of the 3D tectonic strain ellipsoid from its strain ten-sor (Nielsen, 1983). First, the eigenvalues and eigenvectors of thesquared 3D tectonic strain tensor must be found. The quadraticelongations of the three principal axes can be determined by takingthe square root of the three resulting eigenvalues. The columns ofthe eigenvectors represent the direction cosines of the principalaxes. From these the trend and plunge of the principal axes canbe determined using these formulae (Nielsen, 1983):
plunge ¼ arcsinðnÞ ð14Þtrend ¼ arctanðm=lÞ ð15Þ
where I, m, and n are direction cosines of the inferred superimposedstrain ellipsoid
l
m
n
�������
�������
¼cos a
cos b
cos c
�������
�������
ð16Þ
The squared 3D tectonic strain tensor is:
ðSTÞ2 ¼8:885 0:731 9:2200:110 0:503 �1:3613:722 �0:176 5:284
�������
�������
Decomposition of the above tensor will yield the followingeigenvalues and eigenvectors:
Eigenvalues ¼13:193 0 0
0 1:419 0
0 0 0:060
�������
�������
Eigenvectors ¼0:903 0:548 0:398
�0:054 0:672 �0:862
0:426 �0:497 �0:313
�������
�������
Using the eigenvalues and eigenvector matrices above k1, k2,and k3 and their trend and plunge can be calculated as follows:
k1 ¼ 13:1931=2 ¼ 3:6
k2 ¼ 1:4191=2 ¼ 1:2
k3 ¼ 0:0601=2 ¼ 0:25
For k1, l = 0.903; m = �0.054; n = 0.426.The plunge = arcsin (n) = arcsin (0.426) = 25.226�.The trend = arctan (m/l) = arctan (�0.054/0.903) = arctan(�0.060) = �3.395�.
For k2, l = 0.548; m = 0.672; n = �0.497.The plunge = arcsin (�0.497) = �29.817�.The trend = arctan (0.672/0.548) = arctan (1.226) = 50.814�.
For k3, l = 0.398; m = �0.862; n = �0.313.The plunge = arcsin (�0.313) = 18.220.The trend = arctan (�0.862/0.398) = arctan (�2.166) = �65.223.
The signs (positive or negative) of the trend and plunge controltheir measurement relative to north and whether or not the plungeis in the same direction of the trend azimuth or opposite to it. Po-sitive signs indicate measurement of the trend in a clockwise direc-tion from north whereas negative signs indicate measurement ofthe trend in an anticlockwise direction from the north. Positivesign indicate that the plunge is in the same direction of the azi-
muth of the trend whereas negative signs indicate that it is oppo-site to it. Hence, the major axis has a quadratic elongation ofk1 = 3.6 and a trend and plunge of 357�/25�. The intermediate axishas a magnitude of k2 = 1.2 and a trend and plunge of 231�/30�.The minor axis has a magnitude of k3 = 0.25 with a trend andplunge of 115�/18� (Fig. 7c).
5. Results and comparison between strain analysis and fieldobservations
Results of this work can be summarized as follows:
1. The Nakasib Suture is characterized by dominant flatteningdeformation that can be approximated by strain ellipsoidswhose major principal axes plunge SSW and flattening planedips steeply to the SSE (Fig. 7A). This suggests an overallSE-NW directed shortening consistent with the generallyNE-SW trend of the structures associated with the NakasibSuture (Figs. 2 and 5). The presence of constriction strain (Figs.4 and 5) combined with the steep nature of the flattening plane(Fig. 7A) may reflect the refolding of the early SE-verging sub-horizontal folds and thrusts of the Nakasib Suture about aNE-trending axis. This produced the antiforms and synformswhich dominate the entire length of the Nakasib Suture (Figs.2 and 5).
2. The Oko Shear Zone is dominated by constriction deformationthat can be represented by a strain ellipsoid with a sub-verticalmajor principal axis and a XY plane steeply dipping to the E(Fig. 7B). This is consistent with the observed structures wheretight steeply plunging to the north folds dominate the OkoShear Zone (Abdelsalam, 1994). The steep nature of the majorprincipal axis of the strain ellipsoid suggests that the E–Wdirected shortening associated with the Oko Shear Zone wassuperimposed on the NW–SE directed shortening associatedwith the Nakasib Suture, hence producing a prolate strain ellip-soid with a sub-vertical major principal axis.
3. The strain ellipsoid developed from the 3D tectonic strain ten-sor has a sub-horizontal major principal axis and a flatteningplane that strikes NNW–SSE and dips moderately to the NW(Fig. 7C). The minor principal axis of the strain ellipsoid is ori-ented NW–SE. This indicates that the overall shortening wasNW–SE directed and therefore not orthogonal to the N-trendingstructures observed along the Oko Shear Zone.
6. Discussion and conclusions
The Nakasib Suture, developed through collision of the Hayaterrane and the Gebeit terrane at �750 Ma, is characterized by aflattening strain whose strain ellipsoid has a flattening plane thatstrikes 21� and dips 77� to the SE. The minor zones of constrictionpresent in the Nakasib Suture may be the result of subsequentrefolding of these initial SE-verging nappes about NE-trending axesto produce NE-trending upright folds (Figs. 2 and 5). The strainpresent in the Oko Shear Zone represents the composite strain ofthe Nakasib deformation and the Oko deformation. It is character-ized by constriction strain whose XY plane strikes 171� and dips68� to the E. The early E–W and late NW–SE directed shorteningassociated with the Oko Shear Zone is represented by a strain ellip-soid with a flattening plane that strikes 21� and dips 49� to the W.Its major axis has a quadratic elongation of 3.6 with a trend andplunge of 357�/25�, its intermediate axis has a quadratic elongationof 1.2 with a trend and plunge of 231�/30� and its minor axis has aquadratic elongation of 0.25 with a trend and plunge of 115�/18�.
The orientation of the minor axis of the 3D tectonic strain ellip-soid (115�/18�), which corresponds to the direction of imposed
178 M.G. Abdelsalam / Journal of African Earth Sciences 56 (2010) 167–178
shortening, is not completely orthogonal to many of the N-trend-ing shortening zones of the Arabian–Nubian Shield, especially theOko Shear Zone and the Hamisana Shear Zone (Fig. 1). TheseN-trending shortening zones have been interpreted as due toE–W directed shortening imposed on the Arabian–Nubian Shielddue to convergence between East and West Gondwana. (Sternet al., 1990; Miller and Dixon, 1992; Abdelsalam, 1994; de Wallet al., 2001). The non-orthogonal relationship between the calcu-lated orientation of the imposed shortening and the orientationof the shortening zones can be explained as follows: (1) shorteningin the Arabian–Nubian Shield might have started as perfectly E–Wdirected but was rotated into a more ESE–WNW directed in a laterstage; or (2) shortening was imposed as ESE–WNW directedthroughout convergence between East and West Gondwana. How-ever, strain localization within the Arabian–Nubian Shield intoN-trending shortening zones might be due to N-trending control-ling zones of lithospheric dimension, such as lithospheric attenua-tion (Stern et al., 1990). However, the presence of NW-trendingstretching lineation that has been interpreted as approximatingplate motions of East and West Gondwana (Shackleton, 1986), aswell as the conclusion that collision between East and WestGondwana was oblique (Berhe, 1990), make results of this worksupport the explanation that convergence between East and WestGondwana was dominantly non-orthogonal. This is further sup-ported by the fact that at least the tectonic boundary (Keraf Suturein Fig. 1) between the Arabian–Nubian Shield and West Gondwana(represented by the Saharan Metacraton of Abdelsalam et al.(2002)) in northern Sudan is defined by a transpressional zoneassociated with an overall sinistral transpression (Abdelsalamet al., 1995, 1998; Abdelsalam and Stern, 1996b). However, thisinterpretation should be taken with the understanding that it as-sumes the absence of within-plate deformation except within dis-crete deformation belts where strain was homogeneouslyaccommodated. Although this assumption is difficult to adopt formany orogenic belts, it might not be far from accurate in the Ara-bian–Nubian Shield given the linear and discrete nature of defor-mation belts, especially in its central and southern parts.
The relationship between N-trending shortening zones andNW-trending sinistral strike-slip zones within the Arabian–NubianShield has been explained by that the NW-trending structureswere developed as zones of high shear strain within an overallE–W shortening strain that produced the N-trending structures(Abdelsalam, 1994). This interpretation requires the presence ofNE-trending dextral strike-slip faults in the Arabian–Nubian Shieldas complementary conjugate set to the NW-trending sinistralstrike-slip faults. Such NE-trending dextral strike-slip faults havebeen reported in the Arabian–Nubian Shield, although not welldeveloped (Berhe, 1990; Stern et al., 1990). Considering that theearly N–S trending shortening zones and late NW-trending sinis-tral strike-slip faults of the Arabian–Nubian Shield resulted froma post-accretionary ESE–WNW directed shortening, then it is morelikely that NW-trending sinistral-strike slip faults will prevail overNE-trending dextral strike-slip faults if the two evolved as conju-gate sets. This explains why the NW-trending sinistral strike slipfaults dominated over the complimentary NE-trending dextralstrike-slip faults.
Acknowledgements
The field work in the Nakasib Suture and the Oko Shear Zonewas partially supported by the Geological Authority of the Sudan
(GRAS). The author would like to thank Tahir Belo for assistanceduring strain data collection. The author also thank Dr. David Dunnfor review and comments during the preparation of the manu-script. Thanks are also due to two anonymous reviewers for de-tailed comments and constructive criticism.
References
Abdelsalam, M.G., 1994. The Oko Shear Zone, Sudan: post-accretionary deformationin the Arabian–Nubian Shield. Journal of the Geological Society of London 151,767–776.
Abdelsalam, M.G., Stern, R.J., 1993a. Tectonic evolution of the Nakasib suture, RedSea Hills, Sudan: evidence for a late Precambrian Wilson cycle. Journal of theGeological Society of London. 150, 393–404.
Abdelsalam, M.G., Stern, R.J., 1993b. Structure of the late Proterozoic Nakasibsuture, Sudan. Journal of the Geological Society of London 150, 1065–1074.
Abdelsalam, M.G., Stern, R.J., 1993c. Timing of events along the Nakasib suture andthe Oko shear zone, Sudan. In: Thorweihe, U., Schandelmeier, H. (Eds.),Geoscientific Research in Northeast Africa. Balkema, Rotterdam, pp. 99–103.
Abdelsalam, M.G., Stern, R.J., 1996a. Sutures and shear zones in the Arabian–NubianShield. Journal of African Earth Sciences 23, 289–310.
Abdelsalam, M.G., Stern, R.J., 1996b. Mapping Precambrian structures in theSaharan Desert with SIR-C/X-SAR Radar. Journal of Geophysical Research 101,23063–23076.
Abdelsalam, M.G., Stern, R.J., Schandelmeier, H., Sultan, M., 1995. Deformationalhistory of the Keraf Zone in NE Sudan, revealed by Shuttle Imaging Radar.Journal of Geology 103, 475–491.
Abdelsalam, M.G., Stern, R.J., Copeland, P., Elfaki, E.M., Elhur, B., Ibrahim, F.M., 1998.The Neoproterozoic Keraf suture in NE Sudan; Sinistral transpression along theeastern margin of West Gondwana. Journal of Geology 106, 133–147.
Abdelsalam, M.G., Liegeois, J.-P., Stern, R.J., 2002. The Saharan Metacraton. Journal ofAfrican Earth Sciences 34, 119–136.
Almond, D.C., Ahmed, F., 1987. Ductile shear zones on northern Red Sea Hills, Sudanand their implication for crustal collision. Geological Journal 22, 175–184.
Berhe, S.M., 1990. Ophiolites in northeast and east Africa; implication forProterozoic crustal growth. Journal of the Geological Society, London 147, 41–57.
de Wall, H., Greiling, R.O., Fouad Sadek, M., 2001. Post-collisional shortening in thelate Pan-African Hamisana high strain zone, SE Egypt: field and magnetic fabricevidence. Precambrian Research 107, 179–194.
Flinn, D., 1962. On folding during three-dimensional progressive deformation.Geological Society of London Quaternary Journal 118, 385–433.
Hargrove, U.S., Stern, R.J., Kimura, J.-I., Manton, W.I., Johnson, P.R., 2006. Howjuvenile is the Arabian–Nubian Shield? Evidence from Nd isotopes and pre-Neoproterozoic inherited zircons in the Bir Umq suture zone, Saudi Arabia.Earth and Planetary Science Letters 252, 308–326.
Hsu, T.C., 1966. The characterization of coaxial and non-coaxial strain paths. Journalof Strain Analysis 1, 216–222.
Johnson, P.R., Woldehaimanot, B., 2003. Development of the Arabian–NubianShield: Perspectives on accretion and deformation in the northern EastAfrican Orogen and assembly of Gondwana. In: Yoshida, M., Dasgupta, S.,Windley, B. (Eds.), Proterozoic East Gondwana: Supercontinent Assembly andBreakup, vol. 206. Special Publication of the Geological Society, London,London, pp. 289–325.
Johnson, P.R., Abdelsalam, M.G., Stern, R.J., 2003. The Bi’r Umq-Nakasib suture in theArabian–Nubian Shield: a key to understanding crustal growth in the EastAfrican Orogen. Gondwana Research 6, 523–530.
Miller, M.M., Dixon, T.H., 1992. Late Proterozoic evolution of the north part of theHamisana zone, northeast Sudan: constraints on Pan-African accretionarytectonics. Journal of the Geological Society, London 149, 743–750.
Nielsen, K.C., 1983. Pebble population ellipsoid: a three-dimensional algebraicdescription of sedimentary fabric. Journal of Geology 91, 103–112.
Shackleton, R.M., 1986. Precambrian collision tectonics in Africa. In: Coward, M.P.,Ries, A.C. (Eds.), Collision Tectonics, vol. 19. Geological Society of London SpecialPublication, pp. 329–349.
Stern, R.J., 1994. Arc assembly and continental collision in the Neoproterozoic eastAfrican Orogen: implication for the consolidation of Gondwanaland. AnnualReview of Earth and Planetary Science 22, 319–351.
Stern, R.J., Abdelsalam, M.G., 1998. Formation of juvenile continental crust in theArabian–Nubian Shield; Evidence from granitic rocks of the Nakasib suture, NESudan. Geologische Rundschau 87, 150–160.
Stern, R.J., Nielsen, K.C., Best, E., Sultan, M., 1990. Orientation of late Precambriansutures in the Arabian–Nubian Shield. Geology 18, 1103–1106.
Wipfler, E.L., 1996. Transpressive structures in the Neoproterozoic Ariab-NakasibBelt, northeast Sudan: evidence for suturing by oblique collision. Journal ofAfrican Earth Sciences 23, 347–362.