Embed Size (px)
Citation preview

Journal of Alzheimer’s Disease 24 (2011) 125–136DOI 10.3233/JAD-2010-100450IOS Press
125
Differential Cognitive Deterioration inDementia: A Two Year Longitudinal Study
Samuel R. Chamberlaina,b,∗, Andrew D. Blackwella,b, Pradeep J. Nathana,b,c, Geoff Hammonda,Trevor W. Robbinsa,b, John R. Hodgesd, Albert Michaela, James M. Semplea,Edward T. Bullmorea,b,c,1 and Barbara J. Sahakiana,b,1
aDepartment of Psychiatry, University of Cambridge School of Clinical Medicine, Addenbrooke’s Hospital,Cambridge, UKbBehavioural and Clinical Neuroscience Institute (BCNI), University of Cambridge, Cambridge, UKcGlaxoSmithKline, Clinical Unit Cambridge, Addenbrooke’s Centre for Clinical Investigations,Cambridge, UKdThe Prince of Wales Medical Research Institute, Prince of Wales Hospital, Sydney, Australia
Handling Associate Editor: Paulo Caramelli
Accepted 15 November 2010
Abstract. The ability to predict cognitive deterioration in patients with dementia holds valuable potential for clinical trials andearly intervention. This study identified cognitive domains deteriorating differentially over time as well as baseline predictorsof subsequent cognitive decline in patients referred to a memory clinic. Twenty-six subjects with Alzheimer’s disease (AD) and43 subjects with Subjective Memory Impairment (SMI) were entered into a longitudinal study in which cognitive function wasassessed at baseline and at 8-monthly intervals for 2 years, using a range of well-validated measures. Thirty-seven patients withdepression and 39 healthy controls were also longitudinally assessed. AD was associated with disproportionate deteriorationover time on general measures of cognitive function, multiple measures of mnemonic processing, mental fluency (letter andcategory), and aspects of motor speed. SMI showed restricted relative cognitive deterioration on general measures of cognitivefunction, on a subset of memory measures, and on letter but not category fluency. Secondary analysis showed that earliestdetectable ADAS-cog and MMSE decline in AD was at 16 months, while several specific neuropsychological indices weresensitive as early as 8 months (graded naming test, semantic naming, and the category/letter fluency tests). In combination,baseline/early changes in cognitive performance, alongside clinical measures, predicted 48% of disease progression over twoyears in memory impaired patients as a whole. These findings have implications for identifying patients likely to benefit fromdisease modifying agents, and for designing, powering, enriching, and implementing future clinical trials. Follow-up studies inindependent populations are needed to validate predictive algorithms identified.
Keywords: Alzheimer’s disease, cognition, dementia, enrichment, longitudinal, prediction, semantic
Supplementary data available online: http://www.j-alz.com/issues/24/vol24-1.html#supplementarydata01
INTRODUCTION
Alzheimer’s disease (AD) is a chronic degenerativedisorder affecting almost 26.6 million people today,
1Joint senior authors.∗Correspondence to: Samuel R. Chamberlain, Tel.: +44 1223
767040; Fax: +44 1223 336968; E-mail: [email protected].
and whose prevalence is expected to quadruple by 2050[1]. Dementia is prevalent, particularly with increas-ing age [2], and is thought to contribute to 11.2% ofyears lived with disability by people over the age of60 years [3]. In the UK, it is estimated that approx-imately 43% of prevalent cases require a high levelof care, with costs amounting to approximately £5.2billion (US$8.4billion) per annum [4, 5].
ISSN 1387-2877/11/$27.50 © 2011 – IOS Press and the authors. All rights reserved

126 S.R. Chamberlain et al. / Differential Cognitive Deterioration in Dementia: A Two Year Longitudinal Study
The identification of biomarkers capable of detect-ing AD in the early stages, and of predicting the rateand nature of cognitive deterioration, would be of con-siderable social and economic importance with theprospect of effective treatments that retard the pro-gression of, or ameliorate, this devastating disease [6].For example, it is estimated that if interventions coulddelay both the disease onset and progression by even1 year, there would be nearly 9.2 million fewer casesof AD in 2050 [1]. Although a definite diagnosis ofAD has to be based on neuropathological features,its early detection and subsequent assessment dependson a combination of clinical, pathophysiological (i.e.,amyloid PET scanning and cerebrospinal fluid levelsof amyloid-� and tau), and neuropsychological criteria[6]. Objective biomarkers, such as neuropsychologicalmeasures, would be valuable in drug development andin clinical trials, for enabling recruitment of ‘enriched’samples, and for determining appropriate sample sizesto adequately power novel studies [7].
Accepted criteria for a diagnosis of probable ADrequires deficits in two or more areas of cogni-tion, one of which must be memory, in additionto other criteria based on neuropsychological tests[8]. Neuropsychological tests, such as those in theCambridge Neuropsychological Test Automated Bat-tery (CANTAB), have been validated in patientswith well-defined neurosurgical cortical excisions. Themain elements of CANTAB have already been testedin probable (subsequently confirmed) cases of AD in amemory clinic setting, including longitudinal follow-up of some patients [9–12] and in a double blind,placebo controlled trial of the acetylcholinesteraseinhibitor Tacrine [13]. The pattern of cognitive deficitsshown on CANTAB fits quite well with the gener-ally accepted pattern of neural progression for thedisease. Thus, tests particularly sensitive to temporallobe (including hippocampal) damage are, generallyspeaking, more sensitive to impairments in AD thantests shown to be sensitive to frontal lobe dysfunction[9, 10]. Normative data are available for many of thesetests from a large (n ≈ 800) sample of healthy com-munity dwelling elderly volunteers and acceptable togood test-retest reliability has been confirmed.
Though AD and its prodrome have been linkedextensively to neurocognitive dysfunction, less isknown regarding whether specific domains deteri-orate over time, and whether there is differentialdeterioration in people with these disorders, as com-pared to the healthy population or to patients withdepression (which has itself been linked to cognitiveproblems [14]) and potentially deleterious effects of
repeated mood episodes on neuropsychological func-tion (particularly relating to hippocampal status) [15].Depression often co-presents with dementia, makingclinical and neuropsychological disentanglement com-plex in some cases [16].
The current paper reports results from a two year lon-gitudinal study conducted in patients with AD, patientswith subjective memory problems not meeting ADcriteria (i.e., Subjective Memory Impairment, SMI),patients with depression, and healthy controls. TheSMI group was recruited on the basis of self-reportedproblems with memory rather than objective memorydeficits to provide a naturalistic sample for comparisonpurposes. As such, it was felt that findings with respectto any differential cognitive decline over time in thisgroup would be highly clinical relevant, including interms of proof-of-concept clinical trials. It should benoted that our definition of SMI differs from that ofmild cognitive impairment (MCI). SMI refers to non-demented patients with memory complaint; MCI refersmore selectively to non-demented patients with mem-ory complaint, as well as normal activities of dailyliving, normal general cognitive function, and abnor-mal memory for age [17].
In previous reports based on this sample, it wasshown that baseline performance on a Paired Asso-ciates Learning (PAL) memory test distinguishedpatients with AD from patients with depression, andfrom healthy control subjects [11]. Moreover, the entryvariables were capable of predicting development offormal dementia in recruited SMI subjects over twoyears [18]. Thus, risk factors associated with AD devel-opment were older age at study entry, worse baselineperformance on a measure from the PAL test, andworse baseline performance on the Graded NamingTest. The current paper presents the full longitudinaldata from this study, and uses growth curve model-ing to examine for differential deterioration of specificcognitive measures over time in clinical groups of inter-est compared to healthy volunteers. We also identifycomposite measures capable of optimally predictingoverall neurocognitive decline over the study period.
MATERIALS AND METHODS
This study was conducted at the MemoryClinic, Addenbrooke’s Hospital, Cambridge, UnitedKingdom. Participants were aged <80 years and hadno history of cerebrovascular events (including tran-sient ischemic attacks or strokes), serious head injurywhich required surgical intervention, and did not

S.R. Chamberlain et al. / Differential Cognitive Deterioration in Dementia: A Two Year Longitudinal Study 127
have vascular dementia, epilepsy, uncontrolled dia-betes, schizophrenia, bipolar disorder or depression,extrapyramidal signs, hallucinations, active treatmentfor cancer, recent chronic treatment with benzodi-azepines/neuroleptics/anticonvulsants or benzodiaz-epines at the time of testing. Verbal IQ was assessedusing the National Adult Reading Test (NART) [19],and depressive mood with the Geriatric DepressionScale [20].
Patients with mild AD (n = 26), and patients withsubjective memory complaints (SMI, n = 43), enteredthe study after diagnosis and preliminary clinical andneuropsychological screening. Together, the AD andSMI subjects comprised a sample of subjects present-ing to memory clinic. AD was diagnosed accordingto the NINCDS-ADRDA criteria and tests based onthem, including the Hachinski scale, Dementia RatingScale, Judgment of Line Orientation, Complex Fig-ure Test, Object Matching (Unusual Views) and digitspan [8]. AD patients also received SPECT or CT scanswhich were used together with other clinical features todefine possible exclusion criteria arising from non-ADpathology (e.g., lobar atrophy, multi-infarct dementia,Lewy body dementia) group. In the AD group, onlymild AD patients not fulfilling DSM-IV criteria fordepression were enrolled. In the SMI group, patientswith subjective memory complaints who did not ful-fil the NINCDS-ADRDA criteria for AD, and whowere free from DSM-IV depressive disorders, wereenrolled.
Thirty-seven subjects meeting DSM-IV criteria forMajor Depressive Disorder and with MMSE scores>24 were recruited from psychiatric departments inBury St. Edmunds and Cambridge (n = 37). In order toprovide comparator data and to identify cognitive func-tions declining over time in normalcy, n = 39 healthycontrols free from DSM-IV diagnoses and subjectivememory complaints (with MMSE >24), were recruitedfrom amongst spouses and friends of patients, andthrough an advertisement placed in the Alzheimer’sDisease Society newsletter.
Neuropsychological assessment
Recruits were tested on a range of pen/paper andcomputerized tests at baseline and then at 8-monthly(±30 day) intervals for two years. Neuropsychologi-cal tests are listed separately below along with a briefdescription of each task and salient output variables.Please refer to the citations for details of validationand descriptions of the tasks.
Pen/paper tests
Mini Mental State Examination (MMSE)This is a screening test for dementia. It gives a total
score of 0–30 [21].
ADAS-cogA scale for assessing cognitive symptoms in AD.
The scores (maximum = 70) represent the number oferrors [22].
Wechsler Logical MemoryThis test examines free recall of 2 story passages
after a 30 minute delay [23]. The maximum score,representing total items recalled is 50. Higher scoresrepresent superior performance.
Baddeley doors test (doors recognition)This is a test of 4-choice recognition of photographs
of doors (2 lists of 12). The maximum score is 24, withhigher scores representing better performance [24].
Graded Naming Test (GNT)This test assesses object-naming ability [25]. Thirty
different line drawings are displayed, one at a time. Thesubject must identify (i.e., name) the object depictedin each drawing. The scores represent the number ofitems correctly named (maximum = 30).
Semantic Naming TestSubjects name line drawings, from 8 semantic
categories (e.g., vehicles – sledge, train. . .) (maxi-mum = 64) [26].
Warrington Short Recognition Memory Test(SRMT)
This is a 2-choice recognition test of visually pre-sented words and photographs of male faces (list of 25for each) [27]. The maximum scores are 25 for eachsub-test (words, faces).
Category and letter fluency testsThe category fluency test examines the ability to
spontaneously generate names of items from 3 cat-egories, namely animals, fruit, and household items,each in 60 seconds [28, 29]. The total score representstotal items named. Higher scores indicate superior per-formance. The letter fluency test is similar except thatsubjects must name items beginning with the letters F,A, and S.

128 S.R. Chamberlain et al. / Differential Cognitive Deterioration in Dementia: A Two Year Longitudinal Study
Computerized tests
Delayed-Matching-To-Sample (DMS)A 4-choice recognition test of abstract patterns shar-
ing color or pattern with distracters (10 trials at eachtime delay). The key outcome variable is total correctout of a maximum of 10 at the hardest 12-second delay[9, 30].
Rapid Visual Information Processing (RVP)RVP is a test of continuous performance and visual
sustained attention [31]. A white box appears in thecenter of the computer screen, and digits from 2 to 9appear in a pseudo-random order within the box at arate of 100 digits per minute. Subjects are requestedto detect target sequences of digits (i.e., 2-4-6, 3-5-7,4-6-8) and to register responses using the press pad.The key outcome variables are RVP A′ (representingthe ability to detect targets, range 0–1, with 1 repre-senting perfect detection) and mean response latency.
Visuospatial Paired Associates Learning (PAL)This test assesses visual memory and learning [9].
Boxes are displayed on the screen and are opened in arandomized order. One or more boxes contain a pattern.The patterns are then displayed in the middle of thescreen, one at a time, and the subject must touch the boxwhere the pattern was originally located. If the subjectmakes an error, the patterns are re-presented to remindthe subject of their locations. The key outcome measureis the total number of errors made, which is corrected totake into account stages that were failed /not attempted.Secondary measures are the number of stages passed(maximum 8, with higher scores representing superiorperformance), and total numbers of errors made on the6-level (hard) difficulty stage.
Intra/Extra Dimensional set shift (IED)IED is a test of the ability to acquire an attentional set
and show flexibility following negative feedback [32].Two stimuli are presented on-screen on each trial, andthe subject has to learn the relevant stimulus dimen-sion. The key outcome measure is the number of stagessuccessfully completed, out of a maximum of 9.
One Touch Stockings of Cambridge test (OTS)This test examines the ability to plan a sequence
of ball movements on-screen in order to obtain agoal arrangement predetermined by the computer [33].Executive planning is assessed in terms of the numberof attempts taken to select the correct number of moves
needed at the 5-level difficult of the task. Higher scoresindicate worse performance.
Choice Reaction Time (5-choice reaction time,CRT)
The CRT assesses speed of response to visual stim-uli appearing on-screen [13], in one of five locations.The two outcome variables are accuracy (total hits,maximum 25) and mean response latency.
Pattern Recognition Memory (PRM)This is a test of visual pattern recognition memory
in a 2-choice forced discrimination paradigm [9]. Thesubject is presented with two series of 12 visual pat-terns, presented one at a time. In the recognition phase,the subject is required to choose between a pattern theyhave already seen and a novel pattern. The key outcomemeasure is the percentage of correct patterns chosen.The key outcome measure is the percentage of patternscorrectly chosen.
Spatial Recognition Memory (SRM)This is a 2-choice recognition test of locations of
white boxes on a computer screen (4 lists of 5) [9].The key outcome variable is the percentage of correctchoices, with higher scores reflecting superior perfor-mance.
Statistical methodology
Data were analyzed using the Statistical Packagefor the Social Sciences (SPSS) version 15. Differencesin baseline characteristics between the groups wereassessed by one-way analyses of variance (ANOVAs)with follow-up Least Significant Difference (LSD)tests as appropriate. Changes in cognition over timein the four groups of interest were explored by meansof random effects regression, including a group bytime interaction effect. In order to compare the rateof change across conditions over the 24 months, arandom effect linear model was implemented usingthe MIXED procedure within SPSS. A linear growthmodel with a random effect of individual and slope wasdeveloped for each of the outcomes, using the groupcondition as a baseline factor in addition to a predic-tor of slope. Multiple comparisons were minimizedby focusing only on primary measures from each taskof interest. Slope coefficients (group by time) interac-tions were interpreted and compared across conditionsto assess differential rates of change. Advantages ofthis approach are that it allows for the inclusion of

S.R. Chamberlain et al. / Differential Cognitive Deterioration in Dementia: A Two Year Longitudinal Study 129
individuals with partially missing data and that it isnatively suited for the assessment of slope as opposedto mean change (as in an ANOVA). We also conducteda secondary analysis to compare whether performancedeteriorated between baseline and follow-up timepoints in each separate group, using within-subjectt-tests (these results are reported in the Supplementarydata, available online: http://www.j-alz.com/issues/24/vol24-1.html#supplementarydata01). Significancewas defined as p < 0.05 uncorrected. Where data weremissing from the raw datasheets, no imputation formissing data was made in SPSS unless otherwiseexplicitly indicated – therefore, the current analysisshould be considered ‘per protocol’.
Multiple regression analyses were then conductedin order to identify those combinations of cognitive,clinical, and demographic variables that optimallypredicted ADAS-cog deterioration over 24 months(including early change scores, i.e., the calculated dif-ference in performance from baseline to the time pointin question). Since the aim was to identify ‘best possi-ble’ predictive algorithms, both primary and secondarymeasures from cognitive tasks were included in thisanalysis. Analyses were conducted first in the com-bined AD-SMI group and then in the AD and SMIgroups separately, using a step-wise approach.
Finally, a supplementary principal components anal-ysis was used to explore the factor structure of baselinevariables. Underlying factors were identified by meansof maximal 25 iterations, with varimax rotation. Thenumber of factors for a given model was decidedon the basis of screen plot inspection. Factor anal-ysis was deemed valid where the subject-to-variableratio was 3 : 1 or greater, and where the variable-to-factor ratio was 3 or greater [34]. Minimal sample sizerequirements necessitated that the principal compo-nents analysis was restricted to the AD-SMI combinedgroup. Measures loading heavily on the identifiedfactors were defined as exhibiting a relationship ofr ≥ 0.70.
RESULTS
Baseline characteristics of the sample
As can be seen in Table 1, the study groups exhib-ited mean ages in the order of 60–70 years. Depressedpatients were significantly younger than the three othergroups (p < 0.01), which did not differ from eachother for age (all p > 0.05). As expected, the depressedgroup showed significantly higher Geriatric Depres-sion Scale (GDS) scores than the three other groups
Table 1Baseline demographic characteristics (mean, SD) of each studygroup (AD = Alzheimer’s disease, SMI = Subjective Memory
Impairment, Depressed patients, Controls)
AD SMI Depression Controls
N 26 43 37 39Age (yrs) 68.5 (8.2) 64.9 (9.1) 60.4 (8.3) 64.5 (8.7)M : F 09 : 17 20 : 23 17 : 20 14 : 25MMSE 21 (3) 27.8 (2.4) 28.2 (1.6) 29.2 (1.2)ADAS-cog 22.2 (5.8) 11.2 (5.9) 9.3 (3.9) 6.7 (2.4)NART-IQ 108.4 (10.1) 118.4 (7.2) 111.2 (9.5) 119.2 (7.7)GDS 7.5 (4.7) 9.1 (5.4) 22 (5.7) 4.1 (2.7)
MMSE – Mini Mental State Examination; ADAS-cog – Alzheimer’sDisease Assessment Scale, cognitive; NART-IQ – National AdultReading Test IQ; GDS – Geriatric Depression Scale.
(all p < 0.01). The AD and SMI groups also showedsignificantly higher GDS scores than healthy volun-teers (both p < 0.01) but the mean scores were beneaththreshold for clinically significant depression (milddepression 10+; severe depression 20+). The groupsdid not differ significantly on gender ratios [Chi-square(df = 3) = 1.746, p > 0.10]. Of the AD patients, 4 werereceiving Donepezil at study entry, and 2 Rivastig-mine. Of the SMI patients, 1 was receiving Donepezilat study entry. Eleven SMI patients (26%) converted toAD during the study period.
In terms of broad intellectual functioning, mean IQscores were all well above 100 for all the groups, withAD patients exhibiting significantly lower IQs than theSMI and healthy volunteer groups (both p < 0.01). Thedepressed patients showed IQs comparable to the ADgroup (p > 0.10), i.e., lower IQ scores than the SMI andhealthy control groups (both p < 0.01). On MMSE, ADpatients had lower scores than all three other groups (allp < 0.01) as expected. SMI patients had lower MMSEscores than healthy volunteers (p < 0.01) but did notdiffer from the depressed patients (p > 0.10). Withrespect to baseline ADAS-cog, AD patients showedhigher scores than all three other groups (all p < 0.01);and the SMI and depressed groups showed higherscores than the healthy volunteers (both p < 0.05).
Growth curve modeling
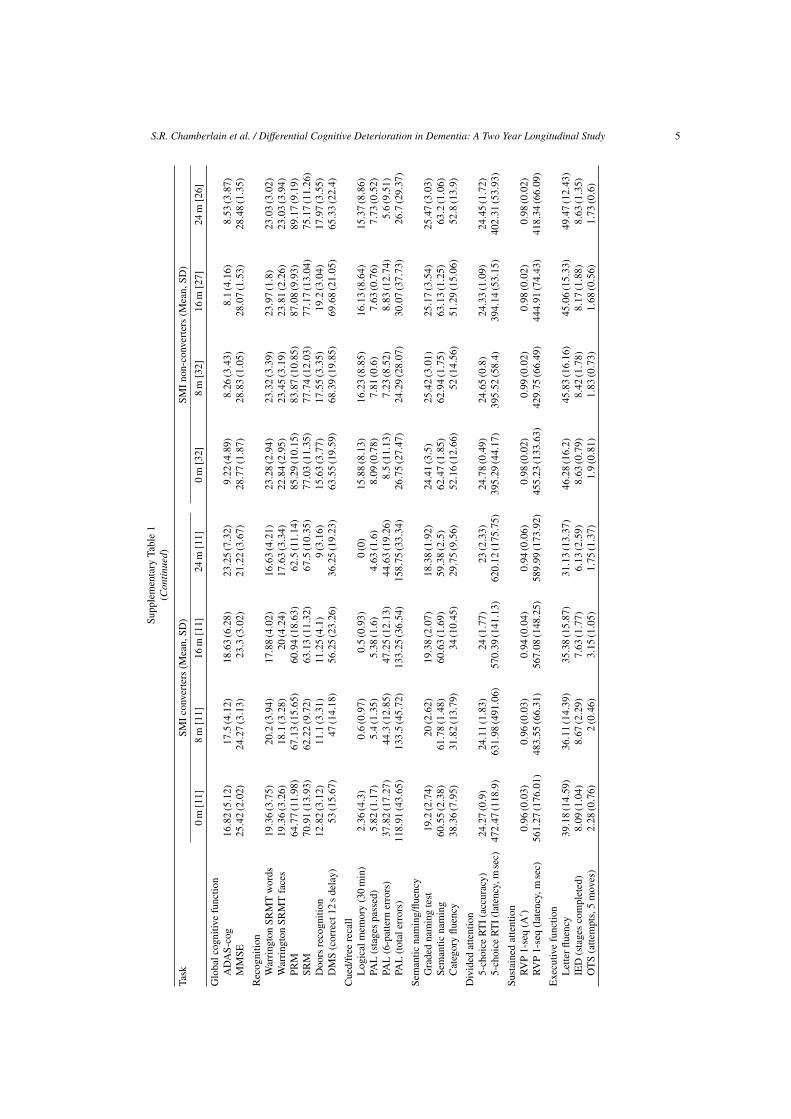
Figures 1 and 2 indicate mean performances for eachgroup for pen/paper and computerized tests respec-tively (see Supplementary Table 1 and SupplementaryFigures 1 and 2 for full data, including subgroupsof SMI who did and did not convert]. Results of thegrowth curve analysis are presented in Table 2, whichindicates mean trajectory differences between eachclinical group and the healthy controls (left columns)

130 S.R. Chamberlain et al. / Differential Cognitive Deterioration in Dementia: A Two Year Longitudinal Study
05
101520253035
0 8 16 24
ADAS-cog
AD SMI DEP CON
05
101520253035
0 8 16 24
MMSE
AD SMI DEP CON
05
1015202530
0 8 16 24
Warrington Recognition: Words
AD SMI DEP CON
05
1015202530
0 8 16 24
Warrington Recognition: Faces
AD SMI DEP CON
0
5
10
15
20
25
0 8 16 24
Doors recognition
AD SMI DEP CON
05
1015202530
0 8 16 24
Wechsler Logical Memory
AD SMI DEP CON
05
1015202530
0 8 16 24
Graded Naming Test
AD SMI DEP CON
010203040506070
0 8 16 24
Semantic Naming Test
AD SMI DEP CON
01020304050607080
0 8 16 24
Category Fluency
AD SMI DEP CON
0102030405060
0 8 16 24
Letter Fluency
AD SMI DEP CON
Fig. 1. Performance on pen/paper measures over time in each group. X-axis corresponds to months since baseline, y-axis to performancemeasure.

S.R. Chamberlain et al. / Differential Cognitive Deterioration in Dementia: A Two Year Longitudinal Study 131
0
20
40
60
80
100
0 8 16 24
Pattern Recognition Memory
AD SMI DEP CON
0102030405060708090
0 8 16 24
Spatial Recognition Memory
AD SMI DEP CON
0102030405060708090
1 2 3 4
Delayed Matching to Sample
AD SMI DEP CON
020406080
100120140160180200
0 8 16 24
PAL total errors
AD SMI DEP CON
2121.5
2222.5
2323.5
2424.5
25
0 8 16 24
CRT: accuracy
AD SMI DEP CON
0100200300400500600700
0 8 16 24
CRT: reaction times
AD SMI DEP CON
0.840.860.88
0.90.920.940.960.98
11.02
0 8 16 24
RVIP A'
AD SMI DEP CON
0100200300400500600700
0 8 16 24
RVIP latency to respond
AD SMI DEP CON
00.5
11.5
22.5
33.5
4
0 8 16 24
OTS: moves taken to obtain correct solution
AD SMI DEP CON
Fig. 2. Performance on computerised measures over time in each group. X-axis corresponds to months since baseline, y-axis to performancemeasure.

132 S.R. Chamberlain et al. / Differential Cognitive Deterioration in Dementia: A Two Year Longitudinal Study
Table 2Summary of growth curve analysis
Task Deviation in slope (condition by time) coefficient (Est (SE))* Significant comparisons of slope
Alzheimer’s SMI Depressed Controls (numbers refer to groups; plainfont p < 0.05, bold font p < 0.01)
Global cognitive functionADAS-cog 3.92 (0.42) 0.88 (0.34) 0.17 (0.35) – 1v2, 1v3, 1v4, 2v3, 2v4MMSE −1.84 (0.26) −0.48 (0.21) −0.32 (0.22) – 1v2, 1v3, 1v4, 2v4
RecognitionWarrington SRMT words −0.35 (0.28) −0.19 (0.23) 0.26 (0.24) – No sig. differencesWarrington SRMT faces −1.13 (0.28) −0.34 (0.23) 0.14 (0.24) – 1v2, 1v3, 1v4, 2v3PRM −1.82 (0.97) −0.45 (0.79) −0.68 (0.83) – No sig. differencesSRM −0.95 (1.10) −1.18 (0.91) −0.54 (0.95) – No sig. differencesDoors recognition −1.93 (0.31) −0.78 (0.25) −0.36 (0.26) – 1v2, 1v3, 1v4, 2v4DMS (correct, 12 s delay) −6.16 (1.93) −4.12 (1.56) −2.30 (1.66) – 1v4, 2v4
Cued/free recallLogical memory (30 min) −1.20 (0.47) −1.29 (0.39) −0.92 (0.41) – 1v4, 2v4, 3v4PAL (stages passed) −0.10 (0.08) −0.05 (0.07) 0.16 (0.07) – 1v3, 2v3, 3v4PAL (6-pattern errors) 1.04 (0.90) 0.24 (0.74) 0.83 (0.78) – 1v3PAL (total errors) 6.24 (1.95) 4.45 (1.59) −1.60 (1.68) – 1v2, 1v3, 1v4, 2v3, 2v4Semantic naming/fluencyGraded naming test −1.06 (0.28) −0.01 (0.23) 0.29 (0.24) – 1v2, 1v3, 1v4Semantic naming −2.40 (0.28) −0.14 (0.23) −0.28 (0.24) – 1v2, 1v3, 1v4Category fluency −4.42 (1.98) −1.39 (1.63) −0.40 (1.71) – 1v3, 1v4
Divided attention5-choice RTI (accuracy) −0.27 (0.16) −0.19 (0.13) −0.02 (0.13) – No sig. differences5-choice RTI (latency, m sec) −0.25 (0.16) −0.17 (0.13) 0.02 (0.13) – #
Sustained attentionRVP (A′) 0.002 (0.004) 0.002 (0.003) 0.008 (0.003) – 2v3, 3v4RVP (latency, m sec) 30.6 (12.5) −1.9 (9.9) −5.6 (10.4) – 1v2, 1v3, 1v4
Executive functionLetter fluency −4.37 (0.9) −1.59 (7.6) −0.64 (0.79) – 1v2, 1v3, 1v4, 2v4IED (stages completed) −0.19 (0.19) −0.22 (0.16) 0.03 (0.16) – #OTS (attempts, 5 moves) −0.26 (0.15) <−0.001 −0.02 (0.07) – No sig. differences
# Negative residual variance in the model estimates, indicating possible model over fit.
and significant pairwise differential rates of changebetween groups (right column). Findings are discussedin more detail below.
Pen/paper tests
Slope of change differed significantly between ADand all other groups on the ADAS-cog and MMSE.This was attributable to deterioration in AD versusall other groups over time. Patients with SMI exhib-ited significantly different gradients on both measurescompared to healthy volunteers over time, again due torelative deterioration over time in patients. Depressedpatients did not differ significantly from healthy volun-teers on ADAS-cog and MMSE rates of change. SMIdiffered on slope for ADAS-cog but not MMSE versusdepressed subjects.
On the Wechsler Logical Memory test, gradient ofchange differed significantly from healthy volunteersfor AD, SMI, and depressed patients. The three clin-ical groups did not show a differential rate of changecompared to each other. While the healthy controlsnumerically improved on logical memory over time,the other groups tended to remain static or to dete-
riorate. For Baddeley doors recognition, AD casesdiffered significantly from all other groups on slopeof change over time. SMI differed significantly fromhealthy controls on this measure, while depressedpatients did not differ significantly from healthy partic-ipants. While door recognition numerically decreasedover time in AD, other groups showed increased scores,but to a lesser degree in SMI compared to depressedpatients and controls. For the GNT, AD cases showedsignificantly different slope of change versus all othergroups, due to deterioration over time (other groupswere relatively stable or improved numerically). Thesame pattern of results was found on the SemanticNaming test. For the Warrington Short RecognitionMemory Test, an interesting dissociation was foundbetween performance on word and face stimuli. Forword stimuli, there were no differential rates of changeover time between any groups. For face stimuli, ADcases differed significantly from all other groups ongradient of change. SMI differed significantly fromdepressed cases but not from controls. While wordrecognition was relatively stable over time in allgroups, face recognition numerically declined overtime in the AD patients and to a lesser degree in the SMI

S.R. Chamberlain et al. / Differential Cognitive Deterioration in Dementia: A Two Year Longitudinal Study 133
patients, while depressed patients and controls werestable or numerically increased their performance overtime. On category fluency, AD differed significantlyfrom healthy controls and depressed patients on rates ofchange. SMI and depressed patients did not differ fromhealthy controls on the slope of change. While cate-gory fluency reduced over time in AD, performancewas relatively stable in the other groups overall. Forletter fluency, AD differed significantly on slope ver-sus all other groups. SMI patients differed significantlyfrom healthy controls but not from depressed patients.Depressed cases did not differ significantly from thehealthy controls on this measure. Patients with ADdeteriorated over time while other groups were stableor improved performance somewhat.
Computerized tests
On the DMS test measure, slopes of change in ADand SMI groups differed significantly from the healthyvolunteers. Depressed patients did not differ signifi-cantly from healthy recruits on this measure. AD andSMI declined overall, numerically, while depressedpatients and controls were stable or improved. Forthe RVP test of sustained attention A′ measure, slopeof change differed significantly between SMI anddepressed groups; and between depressed and healthycontrol groups. This was due to relatively steeperimprovement over time in depressed cases versusSMI and healthy control groups. For RVIP latency torespond, slope of change differed significantly betweenAD and all other groups, who did not differ fromeach other on this measure. AD cases showed steeperlengthening of reaction times over time than the othergroups. On PAL total errors, patients with AD dif-fered significantly from all other groups on rate ofchange. Patients with SMI differed significantly fromdepressed patients and healthy recruits, who did notdiffer significantly from each other on this measure.Findings were attributable to increased errors over timein AD and SMI with relative stability or reductionsin errors over time in the depressed patients and inthe controls. On the OTS test of executive planning,rates of change in performance over time did not dif-fer significantly between any of the groups; it can beseen graphically nonetheless that AD patients initiallyrequired numerically more moves to obtain correctsolutions, and that their performance normalized tothat of the other groups over time. Other groups werelikely at ceiling. No differential change over time wasfound for CRT accuracy, PRM, and SRM performance.On the latency measure from CRT, there was negativeresidual variance in the model, i.e., group comparisons
on slope were not reported. Descriptively, AD patientswere increasingly numerically slower on the task overtime, while other groups were relatively stable.
Baseline predictors of subsequent ADAS-cogdeterioration
Combined AD-SMI groupA model was identified that accounted for
approximately 50% of the variance in two yearADAS-cog deterioration in the AD-SMI group[F(3,33) = 10.148, p < 0.001; R square = 0.480,adjusted R square = 0.433]. Two year ADAS-cogdecline was predicted by: 23.886 − (1.481 × BaselinePAL stages passed) − (1.265 × Baseline IED stagespassed) + (0.425 × Early change ADAS-cog score)(see Supplementary data for breakdown of betacoefficients and other measures for each predictivevariable).
AD groupNo models approached useful predictive signifi-
cance (the most significant model accounted only for16% of the variance).
SMI groupA model was identified that accounted for
approximately 60% of the variance in two yearADAS-cog deterioration [F(5,37) = 10.929, p < 0.001;R square = 0.596, adjusted R square = 0.542]. Two-year ADAS-cog deterioration was predicted by:2.630 + (3.221 × sex [1 = male, 2 = female]) + (0.182× PAL 6-stage errors early change score) + (0.679 ×ADAS-cog early change score) − (0.087 × Baselinespatial recognition memory) − (75.955 × Earlychange RVP A′ score).
DISCUSSION
This study evaluated cognitive function over twoyears in AD, SMI, depressed patients and healthycontrols, using a comprehensive neuropsychologicalbattery of tests. We identified selective differential ratesof change in performance between study groups usinggrowth curve modeling on a subset of the cognitivedomains assessed. Further, we identified a combinationof clinical and cognitive measures (at baseline, and at8-months) that successfully predicted approximately50% of the variance in two year ADAS-cog deteriora-tion in patients referred to memory clinic (combinedAD-SMI sample); and 60% of the variance when theSMI patients were considered alone.
134 S.R. Chamberlain et al. / Differential Cognitive Deterioration in Dementia: A Two Year Longitudinal Study
Differential and selective cognitive change overtime
The selection of appropriate tests and sample sizesfor interventional trials in patients with AD and pro-dromal memory problems necessitates knowledge ofcognitive measures that are differentially sensitive tothe deterioration over time and disease progression.The findings from this study can be used to formu-late power calculations in such future interventionalstudies, and to determine whether change in an indi-vidual’s performance is outside what would ordinarilybe expected. In this study, selective deterioration acrossmultiple cognitive domains occurred in AD and in SMIgroups relative to healthy volunteers, and in most casesrelative to people with depression too. This is impor-tant since it is conceivable that some of the cognitivedeterioration reported in previous AD literature couldhave been attributable to deleterious effects of depres-sive episodes on brain function rather than effects ofthe pathophysiology of AD itself.
AD was characterized by disproportionate deteri-oration over time on general measures of cognitivefunction (ADAS-cog, and MMSE), multiple measuresof mnemonic processing (Warrington face recognition,doors recognition, delayed matching to sample, Logi-cal memory, PAL, GNT, semantic naming), and aspectsof motor speed (RVIP latency to respond). Interest-ingly, disproportionate deterioration over time was notseen for more abstract pattern recognition memory orspatial recognition memory, suggesting that difficul-ties may be restricted to aspects of memory that arechallenging (e.g., PAL), or related to the types of stim-uli likely to be experienced in day-to-day life. Aspectsof mental fluency also deteriorated disproportionatelyin AD (category and letter fluency), while executivefunction (OTS and RVIP sustained attention) did notdeteriorate disproportionately versus controls.
SMI cases showed a more restricted pattern of rel-ative cognitive deterioration versus healthy volunteersover time than AD. Specifically, they showed dis-proportionate deterioration on general measures ofcognitive function (ADAS-cog, MMSE), on a subset ofmemory measures (doors recognition, delayed match-ing to sample, logical memory), and on letter but notcategory fluency.
In regard to measures deteriorating earliest, sec-ondary analysis (see Supplement online Figure 3)indicated that the earliest detectable ADAS-cog andMMSE decline in AD (in terms of significant changecompared to group baseline) was at 16 months whileseveral specific neuropsychological indices were sen-
sitive to decline as early as 8 months. Tests found tobe sensitive to decline at 8-months were the gradednaming test (GNT), semantic naming, and the cate-gory/letter fluency tests. These findings are preliminarygiven that this was a secondary analysis.
In a longitudinal study assessing cognition every6-months over two years, profound deterioration onPAL was evident from 6-months onwards in the groupof participants with Questionable Dementia (QD) [35].In QD recruits with PAL deterioration, all convertedto probable dementia by the study end point. In ourstudy, we found some deterioration on PAL measuresover time in SMI participants who did convert (meanincrease of approximately 30 PAL total-errors over twoyears), but to a numerically lesser degree than that seenin this prior work (mean increase of approximately100 PAL total-errors in the prior study, over a similartime frame). This discrepancy could stem from differ-ences in methodologies (e.g., recruitment and inclusioncriteria) between the two studies.
It is important to consider several potential limita-tions. Data were analyzed per protocol, so attrition ofcases may have led to an underestimation of true cogni-tive decline occurring in the clinical samples. Dropoutrates were 10–30% in the current study, highest inthe AD group. In a previous two year observationalcohort study of patients newly referred to dementiaclinics, dropout was 55% overall [36]. In a two yearcohort study of patients with AD, dropout was ∼40%[37]. Clinical trials in MCI have reported all causedropout rates of ∼30–40% across similar timeframes[38]. Therefore, dropout rates reported here com-pare favorably with other studies. We did not assessspecific reasons for dropout. Previous data suggestimportant factors in the context of AD include refusal,death, institutionalization, and loss to follow-up [37].Dropout may have introduced bias, for example, thoserecruits most likely to show cognitive deteriorationmay have been the most likely to drop out from thestudy.
Another potential limitation is that the conversionrate in SMI was relatively low (26%), suggesting thatsome subjects in this group comprised ‘worried well’,i.e., persons with apparent subjective memory com-plaints that were not associated with gross underlyingpathology. Decline in this group may have been lim-ited by selecting subjects at enrolment with subjectiveas opposed to objective memory impairment, withoutcorroboration by an informant. This would have dimin-ished the ability to detect deterioration associated withthe prodromal stages of disease, in the SMI group as awhole. Consequentially, the SMI group was somewhat

S.R. Chamberlain et al. / Differential Cognitive Deterioration in Dementia: A Two Year Longitudinal Study 135
heterogeneous, and these findings may not generalizeto other studies using different recruitment methods(e.g., objective rather than subjective memory impair-ment criteria at entry for those with memory problemsnot fulfilling full criteria for AD). The inclusion of adepression control group was useful for showing rel-ative stability of cognition over time in this group;however, depressed subjects showed lower IQ thanthe AD subjects; this may reflect bias attributable tothe different recruitment sources used for these twogroups. Lastly, six AD patients took cholinesteraseinhibitors during the study; the current study was nei-ther designed nor powered to evaluate effects of thesemedications on cognition.
Predicting two year decline in ADAS-cog
This study sought to identify potential predictors ofADAS-cog deterioration in AD and SMI subjects. Theanalyses in the AD-SMI group are likely to be morerepresentative of those reporting to memory clinicthan assessment of either subgroup alone. Combinedgroup analysis also provides greater power to detectpredictors.
The ability to predict the likelihood of AD and SMIsubjects showing deterioration on ADAS-cog overtime (and/or the magnitude of such deterioration), onthe basis of baseline and early (8-month) changes inperformance, would be extremely valuable for sampleenrichment. Best fit models of 24-month ADAS-cogdeterioration were generated by entering all baselineand early change scores into multiple regression anal-yses. When considering the combined AD-SMI group,50% of the variance in ADAS-cog deterioration wassuccessfully accounted for by a model comprisingbaseline performance on PAL (stages passed) and theIED test (stages passed), along with 8-month deterio-ration scores for ADAS-cog. The best-fit model for theAD group alone was somewhat less efficient, account-ing for only 16% of the variance. In the SMI subjects,60% of the variance in ADAS-cog deterioration wasaccounted for by a model including gender (females,worse outcome), PAL (6-stage errors), baseline spa-tial recognition memory, and early change scores forADAS-cog and RVP A prime. The current findingsmay not generalize to other subject samples/studies.There are potential limitations of such modeling, e.g.,overfit. Given the pilot nature of this study, trialsof these algorithms in separate populations will berequired in order to validate them. Also, the inclusionof early change scores implies the need to study sub-jects for a time before formally enrolling them into
a clinical trial; this represents a potential pragmaticlimitation.
Now that these salient variables have been identified,future interventional studies could hone in on spe-cific baseline/early displayed features of study recruitslikely to maximize the ability to show benefits of novelagents. Future studies could seek to validate the for-mulae in independent memory clinic samples, to seeif it is capable of successfully predicting ADAS-cogdeterioration on the basis of baseline and early changescores.
Summary
This paper comprises a rich dataset from a two-yearlongitudinal study in patients with memory dysfunc-tion, along with depressive and healthy control groups.It represents a valuable source of information for guid-ing the selection of appropriately sensitive and reliablecognitive measures in future AD/SMI interventionalstudies; for powering of such studies; for defining whatconstitutes unexpectedly good or poor outcomes inindividuals; and, potentially, for enriching samples.
ACKNOWLEDGMENTS
The authors thank Dr E. Marshall and Mrs C.Wightwick for assistance with document prepara-tion and statistics. This study was co-funded bythe Medical Research Council and GlaxoSmithKline.Cambridge Cognition markets the CANTAB battery.Dr S.R. Chamberlain consults for Cambridge Cogni-tion, P1Vital, and Shire; and has received honorariafrom Cambridge Cognition for work on this project.Dr A.D. Blackwell is an employee of Cambridge Cog-nition. Prof. E.T. Bullmore and Prof. P.J. Nathan areemployees of GlaxoSmithKline. Prof. T.W. Robbinsand B.J. Sahakian consult for Cambridge Cognition.The Behavioural and Clinical Neuroscience Instituteis jointly funded by the Medical Research Council andWellcome Trust.
Authors’ disclosures available online (http://www.j-alz.com/disclosures/view.php?id=679).
REFERENCES
[1] Brookmeyer R, Johnsona E, Ziegler-Grahamb K, ArrighicHM (2007) Forecasting the global burden of Alzheimer’sdisease. Alzheimers Dement 3, 186-191.
[2] Plassman BL, Langa KM, Fisher GG, Heeringa SG, WeirDR, Ofstedal MB, Burke JR, Hurd MD, Potter GG, RodgersWL, Steffens DC, Willis RJ, Wallace RB (2007) Prevalence

136 S.R. Chamberlain et al. / Differential Cognitive Deterioration in Dementia: A Two Year Longitudinal Study
of dementia in the United States: the aging, demographics,and memory study. Neuroepidemiology 29, 125-132.
[3] WHO (2003) World Heath Report: Shaping the Future, WHO,Geneva.
[4] Comas-Herrera A, Wittenberg R, Pickard I, Knapp M (2005)Cognitive impairment in older people: its implications forfuture demand for services and costs. PSSRU DiscussionPaper, 1728.
[5] Comas-Herrera A, Wittenberg R, Pickard L, Knapp M (2007)Cognitive impairment in older people: future demand forlong-term care services and the associated costs. Int J GeriatrPsychiatry 22, 1037-1045.
[6] Dubois B, Feldman HH, Jacova C, Cummings JL, DekoskyST, Barberger-Gateau P, Delacourte A, Frisoni G, Fox NC,Galasko D, Gauthier S, Hampel H, Jicha GA, Meguro K,O’Brien J, Pasquier F, Robert P, Rossor M, Salloway S,Sarazin M, de Souza LC, Stern Y, Visser PJ, Scheltens P(2010) Revising the definition of Alzheimer’s disease: a newlexicon. Lancet Neurol 9, 1118-1127.
[7] Frank R, Hargreaves R (2003) Clinical biomarkers in drugdiscovery and development. Nat Rev Drug Discov 2, 566-580.
[8] McKhann G, Drachman D, Folstein M, Katzman R, PriceD, Stadlan EM (1984) Clinical diagnosis of Alzheimer’s dis-ease: report of the NINCDS-ADRDA Work Group underthe auspices of Department of Health and Human ServicesTask Force on Alzheimer’s Disease. Neurology 34, 939-944.
[9] Sahakian BJ, Morris RG, Evenden JL, Heald A, Levy R,Philpot M, Robbins TW (1988) A comparative study of visu-ospatial memory and learning in Alzheimer-type dementiaand Parkinson’s disease. Brain 111(Pt 3), 695-718.
[10] Sahakian BJ, Downes JJ, Eagger S, Evenden JL, Levy R,Philpot MP, Roberts AC, Robbins TW (1990) Sparing ofattentional relative to mnemonic function in a subgroup ofpatients with dementia of the Alzheimer type. Neuropsy-chologia 28, 1197-1213.
[11] Swainson R, Hodges JR, Galton CJ, Semple J, Michael A,Dunn BD, Iddon JL, Robbins TW, Sahakian BJ (2001) Earlydetection and differential diagnosis of Alzheimer’s diseaseand depression with neuropsychological tasks. Dement Geri-atr Cogn Disord 12, 265-280.
[12] Sahgal A, Galloway PH, McKeith IG, Lloyd S, Cook JH,Ferrier IN, Edwardson JA (1992) Matching-to-sample deficitsin patients with senile dementias of the Alzheimer and Lewybody types. Arch Neurol 49, 1043-1046.
[13] Sahakian BJ, Owen AM, Morant NJ, Eagger SA, BoddingtonS, Crayton L, Crockford HA, Crooks M, Hill K, Levy R(1993) Further analysis of the cognitive effects of tetrahy-droaminoacridine (THA) in Alzheimer’s disease: assessmentof attentional and mnemonic function using CANTAB. Psy-chopharmacology (Berl) 110, 395-401.
[14] Chamberlain SR, Sahakian BJ (2006) The neuropsychologyof mood disorders. Curr Psychiatry Rep 8, 458-463.
[15] Sheline YI, Gado MH, Kraemer HC (2003) Untreated depres-sion and hippocampal volume loss. Am J Psychiatry 160,1516-1518.
[16] Steffens DC (2008) Separating mood disturbance from mildcognitive impairment in geriatric depression. Int Rev Psychi-atry 20, 374-381.
[17] Petersen RC, Smith GE, Waring SC, Ivnik RJ, Tangalos EG,Kokmen E (1999) Mild cognitive impairment: clinical char-acterization and outcome. Arch Neurol 56, 303-308.
[18] Blackwell AD, Sahakian BJ, Vesey R, Semple JM, RobbinsTW, Hodges JR (2004) Detecting dementia: novel neu-
ropsychological markers of preclinical Alzheimer’s disease.Dement Geriatr Cogn Disord 17, 42-48.
[19] Nelson HE (1982) National Adult Reading Test (NART): TestManual, NFER-Nelson, Windsor.
[20] Yesavage JA, Brink TL, Rose TL, Lum O, Huang V, Adey M,Leirer VO (1982) Development and validation of a geriatricdepression screening scale: a preliminary report. J PsychiatrRes 17, 37-49.
[21] Folstein MF, Folstein SE, McHugh PR (1975) “Mini-mentalstate”. A practical method for grading the cognitive state ofpatients for the clinician. J Psychiatr Res 12, 189-198.
[22] Rosen WG, Mohs RC, Davis KL (1984) A new rating scalefor Alzheimer’s disease. Am J Psychiatry 141, 1356-1364.
[23] Weschler D (1987) Weschler Memory Scale – Revised, Psy-chological Corporation, San Antonio.
[24] Baddeley A, Emslie H, Nimmo-Smith I (1994) Doors andPeople, Thames Valley Test Company, Bury St Edmunds.
[25] McKenna P, Warrington EK (1983) Graded Naming Test,NFER Nelson, Windsor.
[26] Bozeat S, Lambon Ralph MA, Patterson K, Garrard P,Hodges JR (2000) Non-verbal semantic impairment in seman-tic dementia. Neuropsychologia 38, 1207-1215.
[27] Warrington EK (1996) Cambden Memory Tests, PsychologyPress, Hove.
[28] Newcombe F (1969) Missile Wounds of the Brain, OxfordUniversity Press, London.
[29] Hodges JR, Patterson K (1995) Is semantic memory consis-tently impaired early in the course of Alzheimer’s disease?Neuroanatomical and diagnostic implications. Neuropsy-chologia 33, 441-459.
[30] Hodges JR, Erzinclioglu S, Patterson K (2006) Evolution ofcognitive deficits and conversion to dementia in patients withmild cognitive impairment: a very-long-term follow-up study.Dement Geriatr Cogn Disord 21, 380-391.
[31] Sahakian B, Jones G, Levy R, Gray J, Warburton D (1989)The effects of nicotine on attention, information process-ing, and short-term memory in patients with dementia of theAlzheimer type. Br J Psychiatry 154, 797-800.
[32] Downes JJ, Roberts AC, Sahakian BJ, Evenden JL, MorrisRG, Robbins TW (1989) Impaired extra-dimensional shiftperformance in medicated and unmedicated Parkinson’sdisease: evidence for a specific attentional dysfunction. Neu-ropsychologia 27, 1329-1343.
[33] Owen AM, Sahakian BJ, Hodges JR, Summers BA, PolkeyCE, Robbins T (1995) Dopamine-dependent frontostriatalplanning deficits in early Parkinson’s disease. Neuropsychol-ogy 9, 126-140.
[34] Cattell RB (1978) The Scientific Use of Factor Analysis,Plenum, New York.
[35] Fowler KS, Saling MM, Conway EL, Semple JM, Louis WJ(2002) Paired associate performance in the early detection ofDAT. J Int Neuropsychol Soc 8, 58-71.
[36] Jacova C, Hsiung GY, Feldman HH (2006) Dropouts andrefusals in observational studies: lessons for prevention trials.Neurology 67, S17-S20.
[37] Coley N, Gardette V, Toulza O, Gillette-Guyonnet S, Can-tet C, Nourhashemi F, Andrieu S, Grand A, Vellas B (2008)Predictive factors of attrition in a cohort of Alzheimer dis-ease patients. The REAL. FR study. Neuroepidemiology 31,69-79.
[38] Diniz BS, Pinto JA Jr, Gonzaga ML, Guimaraes FM,Gattaz WF, Forlenza OV (2009) To treat or not to treat?A meta-analysis of the use of cholinesterase inhibitors inmild cognitive impairment for delaying progression toAlzheimer’s disease. Eur Arch Psychiatry Clin Neurosci 259,248-256.

Journal of Alzheimer’s Disease 24 (2011) 1–15IOS Press
1
Supplementary Data
Differential Cognitive Deterioration inDementia: A Two Year Longitudinal Study
Samuel R. Chamberlaina,b,∗, Andrew D. Blackwella,b, Pradeep J. Nathana,b,c, Geoff Hammonda,Trevor W. Robbinsa,b, John R. Hodgesd, Albert Michaela, James M. Semplea,Edward T. Bullmorea,b,c,1 and Barbara J. Sahakiana,b,1
aDepartment of Psychiatry, University of Cambridge School of Clinical Medicine, Addenbrooke’s Hospital,Cambridge, UKbBehavioural and Clinical Neuroscience Institute (BCNI), University of Cambridge, Cambridge, UKcGlaxoSmithKline, Clinical Unit Cambridge, Addenbrooke’s Centre for Clinical Investigations,Cambridge, UKdThe Prince of Wales Medical Research Institute, Prince of Wales Hospital, Sydney, Australia
Handling Associate Editor: Paulo Caramelli
Accepted 15 November 2010
BASELINE PREDICTORS OFSUBSEQUENT ADAS-COGDETERIORATION: FURTHER DETAILS
Combined AD-SMI group
A model was identified that accounted for 50% ofthe variance in ADAS-cog deterioration in the AD-SMIgroup [F(3,33) = 10.148, p < 0.001; R square = 0.480,adjusted R square = 0.433].
Two year ADAS-cog decline was predictedby: 23.886 – (1.481 × Baseline PAL stages passed) –(1.265 × Baseline IED stages passed) + (0.425 × Earlychange ADAS-cog score).
1Joint senior authors.∗Correspondence to: Samuel R. Chamberlain, Tel.: +44 1223
767040; Fax: +44 1223 336968; E-mail: [email protected].
The breakdown of individual measures was as fol-lows:
[Variable (beta coefficient, standardized beta coef-ficient, t, p)]
Baseline PAL stages passed [−1.481, −0.360,−2.664, 0.004]
Baseline ED stages passed [−1.265, −3.22,−2.449, 0.020]
Early change ADAS-cog score [0.425, 0.308,2.368, 0.024].
AD group
The best fit stepwise model predicting great-est variance in 24 month ADAS-cog decline(largest R square) accounted for 16% of the vari-ance [F(1,24) = 4.550, p = 0.043; R square = 0.159,adjusted R square = 0.124], and comprised base-line PAL stages passed [beta coefficient = −1.430,
ISSN 1387-2877/11/$27.50 © 2011 – IOS Press and the authors. All rights reserved

2 S.R. Chamberlain et al. / Differential Cognitive Deterioration in Dementia: A Two Year Longitudinal Study
standardized beta coefficient = −0.399, t = −2.133,p = 0.043]. 24-month deterioration was predicted by:15.573 – (1.430 × Baseline PAL stages passed)
SMI group
A model was identified that accounted for 60% ofthe variance in 24-month ADAS-cog deterioration inthe SMI group [F(5,37) = 10.929, p < 0.001; R square =0.596, adjusted R square = 0.542]. 24-month ADAS-cog deterioration was predicted by: 2.630 + (3.221× gender [1 = male, 2 = female]) + (0.182 × PAL6-stage errors early change score) + (0.679 × ADAS-cog early change score) – (0.087 × Baseline spatialrecognition memory) – (75.955 × Early change RVPA′ score).
Again, the breakdown of individual variables wasas follows:
Variable [beta coefficient, standardized beta coef-ficient, t, p].
Sex [3.221, 0.355, 3.330, 0.002] (male = 1,female = 2) (i.e., female gender associated with
greater deterioration).Baseline spatial recognition memory [−0.087,
−0.233, −2.142, 0.039].Early ADAS-cog change [0.679, 0.562, 5.260,
<0.001].
Early RVP A′ change [−75.995, −0.305, −2.835,0.007].
Early PAL 6-stage errors change [0.182, 0.232,2.117, 0.041].
PRINCIPAL COMPONENTS ANALYSIS(PCA)
Supplementary Figure 4 indicates a screen plot ofthe solutions showing eigenvalues for correspondingnumbers of factors. On inspection of this plot, a six fac-tor solution was decided upon and implemented. Thismodel accounted cumulatively for 75.6% of the vari-ance in baseline cognitive variables (SupplementaryTable 3). The rotated component matrix (Supplemen-tary Table 4) showed that the largest factor (factor 1)loaded most heavily on baseline ADAS-cog perfor-mance and the three measures from the PAL test(stages passed, six stage errors, and total errors); fac-tor 2 loaded most heavily on doors recognition andWarrington faces (two tests involving visual recog-nition memory); factor 3 loaded most heavily onsemantic naming ability; factor 4 loaded most heavilyon spatial recognition memory; factor 5 loaded mostheavily on RVP response latency; and finally, factor 6loaded most heavily on stages passed on the IED test.

S.R. Chamberlain et al. / Differential Cognitive Deterioration in Dementia: A Two Year Longitudinal Study 3Su
pple
men
tary
Tabl
e1
Des
crip
tive
stat
istic
ssh
owin
gth
em
ean
and
stan
dard
devi
atio
n(S
D)f
orea
chco
gniti
vem
easu
reof
inte
rest
atea
chtim
epo
int.
Bre
ak-d
own
scor
esfo
rthe
SMIs
ubje
cts
who
did
and
did
notu
ltim
atel
ygo
onto
dem
ento
ver
the
cour
seof
the
stud
yar
eal
sopr
ovid
edfo
rin
form
atio
npu
rpos
es
Task
Alz
heim
er’s
Dis
ease
(Mea
n,SD
)Su
bjec
tive
Mem
ory
Impa
irm
ent(
Mea
n,SD
)
0m
[n=
26]
8m
[24]
16m
[21]
24m
[18]
0m
[43]
8m
[43]
16m
[38]
24m
[37]
Glo
balc
ogni
tive
func
tion
AD
AS-
cog
22.2
3(5
.84)
24.1
3(7
.19)
27.9
(6.7
9)31
.56
(9.0
5)11
.16
(5.9
3)10
.51
(5.3
7)10
.32
(6.3
2)11
.63
(7.6
7)M
MSE
21(2
.98)
19.8
8(3
.76)
18.6
2(3
.83)
15.6
1(4
.16)
27.8
4(2
.43)
27.6
1(2
.73)
26.8
8(2
.87)
26.7
6(3
.75)
Rec
ogni
tion
War
ring
ton
SRM
Tw
ords
17.3
5(2
.8)
16.8
3(3
.31)
16.5
(3.6
1)16
.24
(3.1
1)22
.28
(3.5
7)22
.56
(3.7
4)22
.72
(3.4
3)21
.65
(4.2
)W
arri
ngto
nSR
MT
face
s19
.31
(2.6
8)17
.96
(4.4
8)16
.71
(4.6
5)17
.35
(3.9
5)21
.95
(3.3
7)22
.15
(3.9
3)23
.03
(3.1
2)21
.89
(4.3
9)PR
M58
.17
(10.
17)
58.3
3(1
0.44
)56
.04
(11.
27)
57.6
(7.8
3)80
.04
(13.
87)
80.1
(13.
82)
81.5
8(1
6.11
)83
.55
(14.
53)
SRM
60.9
6(1
3.93
)56
.74
(10.
4)55
.75
(10.
29)
58.8
2(8
.93)
75.4
7(1
2.19
)74
.25
(13.
18)
74.2
1(1
3.83
)73
.55
(11.
38)
Doo
rsre
cogn
ition
9.46
(2.4
5)9.
43(2
.25)
8(2
.62)
7.31
(3.1
8)14
.91
(3.7
8)15
.98
(4.3
3)17
.53
(4.6
1)16
.08
(5.0
5)D
MS
(cor
rect
,12
sde
lay)
45.6
(15.
02)
43.7
5(1
6.89
)40
(14.
87)
38.7
5(2
3.63
)60
.98
(19.
08)
63.1
7(2
0.67
)66
.92
(21.
9)59
.21
(24.
65)
Cue
d/fr
eere
call
Log
ical
mem
ory
(30
min
)1.
96(3
.4)
1.61
(3.2
3)1.
6(4
.08)
1.28
(4.2
8)12
.42
(9.4
2)12
.41
(10.
25)
12.9
2(1
0)12
.13
(10.
09)
PAL
(sta
ges
pass
ed)
4.68
(1.7
5)4.
79(1
.41)
5.05
(1.2
8)3.
72(1
.64)
7.51
(1.3
3)7.
22(1
.33)
7.16
(1.3
5)7.
08(1
.53)
PAL
(6-p
atte
rner
rors
)51
.12
(8.3
5)48
.25
(9.7
2)50
.71
(6.3
5)53
.5(5
.25)
16(1
8.17
)16
.27
(18.
74)
16.9
2(2
0.17
)13
.82
(20.
03)
PAL
(tot
aler
rors
)15
4.83
(32.
52)
154.
71(3
1.34
)15
1.24
(25.
41)
173
(30.
89)
50.3
3(5
1.64
)50
.93
(57.
58)
51.7
9(5
6.44
)54
.5(6
2.15
)
Sem
antic
nam
ing/
fluen
cyG
rade
dna
min
gte
st14
.15
(6.5
7)13
.13
(6.7
4)13
.3(7
.71)
10.8
9(6
.38)
23.1
7(3
.99)
24.1
(3.7
3)23
.95
(4.0
5)23
.97
(4.0
6)Se
man
ticna
min
g57
.35
(4.8
5)56
.61
(6.0
8)53
.9(8
.22)
52.3
1(9
.01)
61.9
8(2
.14)
62.6
8(1
.75)
62.6
1(1
.69)
62.3
9(2
.14)
Cat
egor
yflu
ency
28.4
6(9
.27)
23.5
8(1
2.4)
21.3
3(1
0.69
)19
.25
(7.7
4)48
.63
(13.
05)
46.8
4(1
6.76
)47
.74
(15.
78)
47.9
5(1
6.11
)
Div
ided
atte
ntio
n5-
choi
ceR
TI
(acc
urac
y)23
.48
(2.6
)22
.7(3
.52)
23.5
3(1
.84)
22.5
9(3
.18)
24.6
5(0
.65)
24.5
3(1
.11)
24.2
6(1
.25)
24.1
4(1
.93)
5-ch
oice
RT
I(l
aten
cy,m
sec)
492.
04(1
49.0
6)60
7.63
(308
.61)
571.
12(3
19.4
6)64
3.76
(227
.92)
415.
04(7
7.25
)44
8.72
(249
.17)
431.
24(1
06.2
3)44
9.41
(128
.57)
Sust
aine
dat
tent
ion
RV
P(A
′ )0.
92(0
.09)
0.92
(0.0
6)0.
89(0
.11)
0.9
(0.0
5)0.
98(0
.03)
0.98
(0.0
2)0.
97(0
.03)
0.97
(0.0
4)R
VP
(lat
ency
,mse
c)57
0.38
(174
.05)
580.
59(1
97.1
8)61
7.34
(194
.66)
583.
09(1
91.7
8)48
2.36
(150
.83)
441.
86(6
9.43
)47
0.63
(105
.11)
455.
45(1
20.0
4)
Exe
cutiv
efu
nctio
nL
ette
rflu
ency
26.3
1(1
2.35
)20
.65
(13.
27)
21.2
9(1
4.26
)18
.11
(11.
96)
44.4
7(1
5.95
)43
.53
(16.
12)
43.0
8(1
5.73
)45
.61
(14.
57)
IED
(sta
ges
com
plet
ed)
5 .52
(3.2
3)6.
22(2
.78)
5.6
(3.0
2)4.
81(2
.97)
8.49
(0.8
8)8.
48(1
.88)
8.05
(1.8
4)8.
11(1
.94)
OT
S(a
ttem
pts,
5m
oves
)3.
35(0
.99)
2.88
(1.2
8)3.
13(0
.72)
1.63
(2.3
)1.
98(0
.81)
1.86
(0.6
8)1.
9(0
.82)
1.73
(0.7
1)

4 S.R. Chamberlain et al. / Differential Cognitive Deterioration in Dementia: A Two Year Longitudinal Study
Supp
lem
enta
ryTa
ble
1(C
onti
nued
)
Task
Dep
ress
ion
(Mea
n,SD
)C
ontr
ols
(Mea
n,SD
)
0m
[37]
8m
[31]
16m
[31]
24m
[30]
0m
[39]
8m
[38]
16m
[37]
24m
[33]
Glo
balc
ogni
tive
func
tion
AD
AS-
cog
9.32
(3.9
1)8.
56(3
.85)
8.13
(4.7
)8.
23(4
.38)
6.67
(2.3
7)5.
89(2
.46)
5.75
(2.6
2)4.
94(2
.56)
MM
SE28
.16
(1.6
1)28
.25
(1.7
)27
.88
(2.3
1)27
.29
(4.0
3)29
.23
(1.1
6)29
.08
(1.0
2)29
.25
(0.9
4)29
.33
(0.8
9)
Rec
ogni
tion
War
ring
ton
SRM
Tw
ords
23.0
8(2
.89)
23.5
6(1
.76)
23.6
9(2
.35)
23.6
5(2
.18)
24.2
1(1
.3)
24.6
8(0
.66)
24.6
4(0
.72)
24.0
9(3
.47)
War
ring
ton
SRM
Tfa
ces
22.5
7(3
.08)
24.0
6(1
.56)
23.8
8(2
.59)
24.1
6(1
.55)
23.5
6(1
.52)
23.8
4(1
.37)
24.5
3(0
.77)
24.4
8(0
.87)
PRM
83.1
1(1
0.57
)83
.2(1
3.07
)81
.9(1
3.5)
85.6
2(1
2.58
)86
.86
(9.5
4)89
.14
(8.4
2)88
.96
(9.2
2)91
.54
(7.6
2)SR
M77
.3(9
.47)
79.8
4(9
.88)
78.1
3(1
0.91
)77
.74
(10.
79)
81.2
8(1
0.18
)82
.76
(11.
49)
83.4
7(9
.32)
82.7
3(1
1.86
)D
oors
reco
gniti
on16
. 03
(3.8
)17
.53
(3.7
8)18
.13
(3.4
1)18
.58
(2.9
3)16
.97
(2.9
6)18
.21
(3.0
3)20
.06
(2.6
3)20
.33
(2.6
1)D
MS
(cor
rect
,12
sde
lay)
67.6
5(1
8.6)
64(1
9.76
)66
(17.
34)
71(1
5.39
)71
.79
(18.
62)
73.5
1(1
7.51
)80
.28
(13.
2)81
.21
(16.
35)
Cue
d/fr
eere
call
Log
ical
mem
ory
(30
min
)16
.11
(6.8
9)16
.5(6
.99)
15.4
1(7
.84)
16.7
4(8
.1)
19.8
7(6
.36)
19.4
5(7
.05)
24.5
7(8
.42)
21.3
9(8
.62)
PAL
(sta
ges
pass
ed)
7.7
(0.5
2)7.
83(0
.46)
7 .9
(0.3
)7.
83(0
.46)
8.23
(0.7
8)7.
95(0
.23)
7.94
(0.2
3)7.
88(0
.42)
PAL
(6-p
atte
rner
rors
)9.
89(8
.35)
9.29
(10.
51)
5.97
(6.9
4)7.
1(8
.16)
7.79
(6.8
)5
(5.1
9)5.
86(6
.76)
6.21
(7.2
9)PA
L(t
otal
erro
rs)
35.7
(24.
87)
28.5
3(2
4.16
)21
.77
(15.
24)
27.1
7(2
5.8)
25.8
7(2
3.4)
18.8
9(1
5.73
)18
.22
(19.
22)
20.0
3(2
1.11
)
Sem
antic
nam
ing/
fluen
cyG
rade
dna
min
gte
st22
.3(4
)23
(5.6
7)23
.34
(3.9
)23
.61
(4.3
6)24
.23
(4.1
4)25
.32
(4.4
1)25
.81
(3.4
8)24
.79
(5.6
6)Se
man
ticna
min
g62
.97
(1.1
2)63
.28
(1.2
5)63
.25
(1.4
8)62
.87
(1.8
)62
.69
(2.1
7)63
.32
(1.3
)63
.46
(1.0
1)63
.45
(0.9
)C
ateg
ory
fluen
cy50
.41
(12.
21)
43.0
8(2
0.42
)50
.06
(13.
18)
51.2
9(1
6.7)
61.1
(13.
11)
70.7
4(4
9.61
)67
.67
(12.
13)
65.4
2(1
1.44
)
Div
ided
atte
ntio
n5-
choi
ceR
TI
(acc
urac
y)24
.7(0
.78)
24.3
4(1
.15)
24.6
6(0
.75)
24.5
7(0
.77)
24.7
4(0
.64)
24.6
6(0
.85)
24.6
1(0
.9)
24.7
9(0
.42)
5-ch
oice
RT
I(l
aten
cy,m
sec)
411.
7(1
04.8
1)44
8.12
(121
.33)
445.
51(1
82.5
6)42
9.94
(124
.11)
386.
59(8
4.21
)39
5.49
(100
.98)
361
(52.
87)
384.
48(4
9.94
)
Sust
aine
dat
tent
ion
RV
P1
seq
(A′ )
0.96
(0.0
3)0.
97(0
.02)
0.98
(0.0
2)0.
98(0
.02)
0.99
(0.0
2)0.
99(0
.01)
0.99
(0.0
1)0.
99(0
.02)
RV
P1
seq
(lat
ency
,mse
c)46
1.26
(75.
89)
446.
86(6
8.01
)43
4.34
(85.
69)
438.
03(1
04.5
4)41
6.63
(70.
21)
391.
91(6
4.39
)39
6.67
(72.
92)
404.
67(8
5.5)
Exe
cutiv
efu
nctio
nL
ette
rflu
ency
36.1
9(1
6.03
)36
(12.
03)
38.3
4(1
2.36
)39
.06
(13.
85)
49.8
5(1
3.47
)51
.59
(11.
21)
54.0
6(1
1.64
)53
.85
(10.
92)
IED
(sta
ges
com
plet
ed)
7.54
(2.0
8)8.
47(1
.98)
7.69
(2.0
4)8.
03(1
.56)
8.51
(1.0
7)8.
55(1
.27)
8.58
(1.0
5)8.
76(0
.66)
OT
S(a
ttem
pts,
5m
oves
)2.
07(0
.74)
1.74
(0.6
8)1.
76(0
.57)
1.87
(0.7
6)1.
72(0
.57)
1.65
(0.5
1)1.
61(0
.71)
1.57
(0.7
3)
S.R. Chamberlain et al. / Differential Cognitive Deterioration in Dementia: A Two Year Longitudinal Study 5Su
pple
men
tary
Tabl
e1
(Con
tinu
ed)
Task
SMI
conv
erte
rs(M
ean,
SD)
SMI
non-
conv
erte
rs(M
ean,
SD)
0m
[11]
8m
[11]
16m
[11]
24m
[11]
0m
[32]
8m
[32]
16m
[27]
24m
[26]
Glo
balc
ogni
tive
func
tion
AD
AS-
cog
16.8
2(5
.12)
17.5
(4.1
2)18
.63
(6.2
8)23
.25
(7.3
2)9.
22(4
.89)
8.26
(3.4
3)8.
1(4
.16)
8.53
(3.8
7)M
MSE
25.4
2(2
.02)
24.2
7(3
.13)
23.3
(3.0
2)21
.22
(3.6
7)28
.77
(1.8
7)28
.83
(1.0
5)28
.07
(1.5
3)28
.48
(1.3
5)
Rec
ogni
tion
War
ring
ton
SRM
Tw
ords
19.3
6(3
.75)
20.2
(3.9
4)17
.88
(4.0
2)16
.63
(4.2
1)23
.28
(2.9
4)23
.32
(3.3
9)23
.97
(1.8
)23
.03
(3.0
2)W
arri
ngto
nSR
MT
face
s19
.36
(3.2
6)18
.1(3
.28)
20(4
.24)
17.6
3(3
.34)
22.8
4(2
.95)
23.4
5(3
.19)
23.8
1(2
.26)
23.0
3(3
.94)
PRM
64.7
7(1
1.98
)67
.13
(15.
65)
60.9
4(1
8.63
)62
.5(1
1.14
)85
.29
(10.
15)
83.8
7(1
0.85
)87
.08
(9.9
3)89
.17
(9.1
9)SR
M70
.91
(13.
93)
62.2
2(9
.72)
63.1
3(1
1.32
)67
.5(1
0.35
)77
.03
(11.
35)
77.7
4(1
2.03
)77
.17
(13.
04)
75.1
7(1
1.26
)D
oors
reco
gniti
on12
.82
(3.1
2)11
.1(3
.31)
11.2
5(4
.1)
9(3
.16)
15.6
3(3
.77)
17.5
5(3
.35)
19.2
(3.0
4)17
.97
(3.5
5)D
MS
(cor
rect
12s
dela
y)53
(15.
67)
47(1
4.18
)56
.25
(23.
26)
36.2
5(1
9.23
)63
.55
(19.
59)
68.3
9(1
9.85
)69
.68
(21.
05)
65.3
3(2
2.4)
Cue
d/fr
eere
call
Log
ical
mem
ory
(30
min
)2.
36(4
.3)
0.6
(0.9
7)0.
5(0
.93)
0(0
)15
.88
(8.1
3)16
.23
(8.8
5)16
.13
(8.6
4)15
.37
(8.8
6)PA
L(s
tage
spa
ssed
)5.
82(1
.17)
5.4
(1.3
5)5.
38(1
.6)
4.63
(1.6
)8.
09(0
.78)
7.81
(0.6
)7.
63(0
.76)
7.73
(0.5
2)PA
L(6
-pat
tern
erro
rs)
37.8
2(1
7.27
)44
.3(1
2.85
)47
.25
(12.
13)
44.6
3(1
9.26
)8.
5(1
1.13
)7.
23(8
.52)
8.83
(12.
74)
5.6
(9.5
1)PA
L(t
otal
erro
rs)
118.
91(4
3.65
)13
3.5
(45.
72)
133.
25(3
6.54
)15
8.75
(33.
34)
26.7
5(2
7.47
)24
.29
(28.
07)
30.0
7(3
7.73
)26
.7(2
9.37
)
Sem
antic
nam
ing/
fluen
cyG
rade
dna
min
gte
st19
.2(2
.74)
20(2
.62)
19.3
8(2
.07)
18.3
8(1
.92)
24.4
1(3
.5)
25.4
2(3
.01)
25.1
7(3
.54)
25.4
7(3
.03)
Sem
antic
nam
ing
60.5
5(2
.38)
61.7
8(1
.48)
60.6
3(1
.69)
59.3
8(2
.5)
62.4
7(1
.85)
62.9
4(1
.75)
63.1
3(1
.25)
63.2
(1.0
6)C
ateg
ory
fluen
cy38
.36
(7.9
5)31
.82
(13.
79)
34(1
0.45
)29
.75
(9.5
6)52
.16
(12.
66)
52(1
4.56
)51
.29
(15.
06)
52.8
(13.
9)
Div
ided
atte
ntio
n5-
choi
ceR
TI
(acc
urac
y)24
.27
(0.9
)24
.11
(1.8
3)24
(1.7
7)23
(2.3
3)24
.78
(0.4
9)24
.65
(0.8
)24
.33
(1.0
9)24
.45
(1.7
2)5-
choi
ceR
TI
(lat
ency
,mse
c)47
2.47
(118
.9)
631.
98(4
91.0
6)57
0.39
(141
.13)
620.
12(1
75.7
5)39
5.29
(44.
17)
395.
52(5
8.4)
394.
14(5
3.15
)40
2.31
(53.
93)
Sust
aine
dat
tent
ion
RV
P1-
seq
(A′ )
0.96
(0.0
3)0.
96(0
.03)
0.94
(0.0
4)0.
94(0
.06)
0.98
(0.0
2)0.
99(0
.02)
0.98
(0.0
2)0.
98(0
.02)
RV
P1-
seq
(lat
ency
,mse
c)56
1.27
(176
.01)
483.
55(6
6.31
)56
7.08
(148
.25)
589.
99(1
73.9
2)45
5.23
(133
.63)
429.
75(6
6.49
)44
4.91
(74.
43)
418.
34(6
6.09
)
Exe
cutiv
efu
nctio
nL
ette
rflu
ency
39.1
8(1
4.59
)36
.11
(14.
39)
35.3
8(1
5.87
)31
.13
(13.
37)
46.2
8(1
6.2)
45.8
3(1
6.16
)45
.06
(15.
33)
49.4
7(1
2.43
)IE
D(s
tage
sco
mpl
eted
)8 .
09(1
.04)
8.67
(2.2
9)7.
63(1
.77)
6.13
(2.5
9)8.
63(0
.79)
8.42
(1.7
8)8.
17(1
.88)
8.63
(1.3
5)O
TS
(atte
mpt
s,5
mov
es)
2.28
(0.7
6)2
(0.4
6)3.
15(1
.05)
1.75
(1.3
7)1.
9(0
.81)
1.83
(0.7
3)1.
68(0
.56)
1.73
(0.6
)

6 S.R. Chamberlain et al. / Differential Cognitive Deterioration in Dementia: A Two Year Longitudinal Study
Supplementary Figure 1. Mean performance over time for each study group including subgroups of SMI, for pen/paper measures.

S.R. Chamberlain et al. / Differential Cognitive Deterioration in Dementia: A Two Year Longitudinal Study 7
Supplementary Figure 1. (Continued.)

8 S.R. Chamberlain et al. / Differential Cognitive Deterioration in Dementia: A Two Year Longitudinal Study
Supplementary Figure 1. (Continued.)

S.R. Chamberlain et al. / Differential Cognitive Deterioration in Dementia: A Two Year Longitudinal Study 9
Supplementary Figure 2. Mean performance over time for each study group including subgroups of SMI, for computerized measures.

10 S.R. Chamberlain et al. / Differential Cognitive Deterioration in Dementia: A Two Year Longitudinal Study
Supplementary Figure 2. (Continued.)

S.R. Chamberlain et al. / Differential Cognitive Deterioration in Dementia: A Two Year Longitudinal Study 11
Supplementary Figure 2. (Continued.)

12 S.R. Chamberlain et al. / Differential Cognitive Deterioration in Dementia: A Two Year Longitudinal Study
tniop-emiTslortnoCpeDIMSDA
Time point (months) 8 16 24 8 16 24 8 16 24 8 16 24 erusaeM
Global cognitive function ADAS-cog
ESMMRecognition Warrington SRMT words Warrington SRMT faces
MRPMRS
Doors recognition DMS (correct, 12s delay) Cued/free recall Logical memory (30 min) PAL (stages passed) PAL (6-pattern errors) PAL (total errors) Semantic naming/fluency Graded Naming Test Semantic naming Category fluency Divided attention 5-choice RTI (accuracy) 5-choice RTI (latency, msec) Sustained attention
)’A(PVRRVP (latency, msec) Executive function Letter fluency IED (stages completed) OTS (attempts, 5 moves)
In orange p<0.05, red p<0.01 significant impairment versus own group baseline at time point.
Supplementary Figure 3. Overview of domains that significantly deteriorated over time within specific groups, according to t-tests versus owngroup baseline. In orange p < 0.05, red p < 0.01 significant impairment versus own group baseline at time point.
Supplementary Figure 4. Screen plot detailing results from the factor analysis of baseline cognitive variables in the combined AD-SMI group.

S.R. Chamberlain et al. / Differential Cognitive Deterioration in Dementia: A Two Year Longitudinal Study 13
Supplementary Table 2Descriptive statistics showing the mean and standard deviation (SD) of absolute change in performance over time for each cognitive measureof interest. Changes are defined as performance at the given time point minus performance at study entry (baseline). Break-down scores for the
SMI subjects who did and did not ultimately go on to dement over the course of the study are also provided for information purposes
Task Alzheimer’s Disease (Mean, SD) Subjective Memory Impairment (Mean, SD)
0–8 m [24] 0–16 m [21] 0–24 m [18] 0–8 m [43] 0–16 m [38] 0–24 m [37]
Global cognitive functionADAS-cog 1.63 (6.62) 4.62 (6.39) 8.88 (7.67) −0.44 (3.88) −0.45 (3.85) 0.76 (4.87)MMSE −0.92 (3.35) −2.33 (3.86) −5.17 (4.53) −0.46 (1.48) −1.2 (1.99) −1.32 (2.29)
RecognitionWarrington SRMT words −0.65 (2.44) −0.85 (3.53) −1.24 (2.97) 0.05 (2.89) 0.15 (2.55) −1.08 (2.69)Warrington SRMT faces −1.52 (3.96) −2.52 (4.52) −1.88 (3.06) −0.02 (2.87) 0.9 (2.4) −0.34 (4.33)PRM −0.18 (16.21) −1.87 (11.1) −1.72 (12.33) −0.83 (8.96) 0.11 (11.07) 2.08 (10.69)SRM −2.17 (11.95) −3.25 (12.49) 2.65 (14.8) −2.13 (13.72) −2.24 (11.61) −2.89 (11.78)Doors recognition −0.04 (2.65) −1.35 (2.7) −1.88 (2.5) 0.73 (3.71) 2.18 (3.42) 0.74 (3.76)DMS (correct, 12 s delay) −1.74 (24.8) −4.74 (20.38) −6.67 (25.26) 1.79 (18.05) 5.26 (19.96) −3.51 (22.51)
Cued/free recallLogical memory (30 min) −0.57 (1.93) −0.5 (2.35) −1 (2.54) −0.27 (3.92) −0.41 (3.53) −1.34 (4.34)PAL (stages passed) 0.13 (1.36) 0.45 (1.67) −0.94 (1.71) −0.37 (0.83) −0.45 (1.01) −0.53 (0.86)PAL (6-pattern errors) −2.3 (9.04) 0.6 (9.03) 4.29 (7.44) 1.49 (5.95) 2.74 (8.1) −0.37 (15.22)PAL (total errors) −0.05 (23.55) −3.42 (29.96) 19.75 (27.46) 3.66 (22.03) 5.58 (28.81) 8.29 (25.94)
Semantic naming/fluencyGraded naming test −1.17 (2.19) −1.3 (2.36) −3.33 (2.5) 0.73 (2.26) 0.37 (2.16) 0.39 (1.78)Semantic naming −1 (3.77) −3.65 (5.7) −5.94 (7.07) 0.63 (1.73) 0.55 (1.62) 0.34 (1.91)Category fluency −4.88 (9.75) −7.48 (7.22) −9.63 (6.91) −1.79 (11.88) −2.36 (11.44) −2.34 (9.95)
Divided attention5-choice RTI (accuracy) −0.77 (3.69) −0.17 (2.53) −0.53 (3.3) −0.1 (1.22) −0.37 (1.36) −0.49 (1.84)5-choice RTI (latency, m sec) 93.37 (275.29) 23.41 (164.91) 123.01 (216.9) 34.17 (184.18) 17.43 (80.38) 38.52 (83.25)
Sustained attentionRVP 1-seq (A′) −0.01 (0.04) −0.02 (0.09) −0.04 (0.04) 0 (0.02) −0.01 (0.03) −0.01 (0.03)RVP 1-seq (latency, m sec) 29.75 (132.18) 53.52 (227.06) 51.45 (213.67) −30.19 (120.42) −4.25 (138.68) −19.87 (135.84)
Executive functionLetter fluency −3.85 (5.98) −4.81 (10.07) −9.11 (13.46) −1.74 (9.08) −2.28 (10.95) 0.08 (10.33)IED (stages completed) 1 (2.33) 0.47 (3.44) 0.13 (2.07) −0.08 (1.95) −0.47 (1.97) −0.42 (1.97)OTS (attempts, 5 moves) −0.21 (1.54) −0.25 (0.9) 0.75 (0) −0.06 (0.7) −0.05 (0.77) −0.12 (0.92)
Task Depression (Mean, SD) Controls (Mean, SD)
0–8 m [31] 0–16 m [31] 0–24 m [30] 0–8 m [38] 0–16 m [37] 0–24 m [33]
Global cognitive functionADAS-cog −0.63 (3.27) −0.81 (4.31) −0.7 (4.44) −0.71 (2.6) −1 (2.04) −1.74 (2.53)MMSE 0 (1.61) −0.38 (2.03) −1.03 (3.85) −0.24 (1.42) −0.06 (1.43) −0.15 (1.03)
RecognitionWarrington SRMT words 0.75 (2.18) 0.69 (3.06) 0.65 (2.98) 0.45 (1.33) 0.31 (1.45) −0.24 (3.81)Warrington SRMT faces 1.66 (2.57) 1.28 (3.01) 1.55 (3.04) 0.29 (1.25) 0.89 (1.43) 0.85 (1.15)PRM 0.39 (11.07) −1.18 (14.01) 2.41 (12.06) 2.08 (7.1) 1.91 (9.14) 3.79 (8.29)SRM 2.34 (11.5) 0.47 (13.16) 0.48 (11.28) 1.58 (12.63) 1.53 (11.58) 1.36 (11.06)Doors recognition 0.91 (3.58) 1.69 (4.07) 2.26 (3.96) 1.16 (2.72) 2.81 (2.3) 3.03 (2.69)DMS (correct, 12 s delay) −4.83 (21.32) −0.34 (22.6) 3.93 (18.12) 1.35 (22.01) 7.5 (22.6) 7.58 (23.05)
Cued/free recallLogical memory (30 min) 0.26 (4.48) −1.55 (5.17) 0.13 (6.04) −0.53 (5.71) 3.86 (5.62) 1.36 (6.22)PAL (stages passed) 0.07 (0.45) 0.16 (0.58) 0.1 (0.4) −0.29 (0.77) −0.31 (0.71) −0.39 (0.56)PAL (6-pattern errors) 0.16 (8.89) −3.84 (6.12) −2.4 (7.5) −2.76 (6.33) −2.14 (5.97) −1.27 (6.23)PAL (total errors) −6.17 (13.07) −13.65 (18.21) −7.67 (15.94) −7.16 (13.11) −7.44 (12.37) −4.06 (12.08)
Semantic naming/fluencyGraded naming test 0.69 (3.03) 1 (1.67) 1.32 (2.06) 1.13 (1.77) 1.11 (1.56) 0.27 (5.33)Semantic naming 0.16 (1.02) 0.13 (1.13) −0.23 (1.56) 0.66 (1.77) 0.43 (1.14) 0.61 (1.17)Category fluency −7.32 (18.17) −1.31 (7.34) −0.26 (10.6) 9.64 (49.32) 5.31 (8) 4.48 (10.69)

14 S.R. Chamberlain et al. / Differential Cognitive Deterioration in Dementia: A Two Year Longitudinal Study
Supplementary Table 2(Continued)
Task Depression (Mean, SD) Controls (Mean, SD)
0–8 m [31] 0–16 m [31] 0–24 m [30] 0–8 m [38] 0–16 m [37] 0–24 m [33]
Divided attention5-choice RTI (accuracy) −0.38 (1.31) −0.06 (1.16) −0.23 (1.07) −0.11 (1.15) −0.17 (0.86) 0.09 (0.86)5-choice RTI (latency, m sec) 29.55 (96.03) 47.71 (173.07) 23.28 (125.87) 9.68 (115.39) −27.56 (85.68) −5.3 (84.58)
Sustained attentionRVP 1-seq (A′) 0.01 (0.02) 0.01 (0.03) 0.02 (0.02) 0 (0.02) 0 (0.02) 0 (0.02)RVP 1-seq (latency, m sec) −19.43 (81.6) −21.69 (93.47) −23.82 (91.5) −25.39 (55.01) −18 (57.48) −10.31 (58.32)
Executive functionLetter fluency 0 (9.59) 1.66 (8.17) 1.45 (9.33) −0.28 (10.45) 3.14 (7.26) 3.88 (8.73)IED (stages completed) 1.03 (2.39) 0.31 (2.76) 0.58 (2.39) 0.05 (1.35) 0 (0.68) 0.15 (1.12)OTS (attempts, 5 moves) −0.29 (0.76) −0.23 (0.76) −0.09 (0.85) −0.05 (0.61) −0.11 (0.63) −0.16 (0.61)
Task SMI Converters (Mean, SD) SMI Non-Converters (Mean, SD)
0–8 m [11] 0–16 m [11] 0–24 m [11] 0–8 m [32] 0–16 m [27] 0–24 m [26]
Global cognitive functionADAS-cog 0.2 (3.55) −0.25 (5.28) 4.38 (4.96) −0.39 (3.63) −0.43 (3.38) 0 (4.17)MMSE −1.2 (1.81) −1.89 (3.26) −3.75 (3.24) −0.2 (1.32) −0.97 (1.47) −0.59 (1.4)
RecognitionWarrington SRMT words 0.6 (4.4) −1.25 (3.85) −2.5 (2.62) −0.13 (2.28) 0.52 (2.03) −0.69 (2.62)Warrington SRMT faces −1.6 (3.57) 1.13 (3.4) −1.25 (4.89) 0.48 (2.46) 0.84 (2.15) −0.1 (4.22)PRM 2.78 (10.62) −1.56 (13.9) 0 (12.4) −1.88 (8.32) 0.56 (10.42) 2.64 (10.35)SRM −10.56 (11.02) −8.13 (10.67) −3.75 (11.88) 0.32 (13.6) −0.67 (11.5) −2.67 (11.94)Doors recognition −2 (3.06) −1 (3.7) −3.25 (2.49) 1.61 (3.5) 3.03 (2.85) 1.8 (3.32)DMS (correct, 12 s delay) −5.56 (10.14) 5 (22.04) −15 (16.04) 4 (19.4) 5.33 (19.78) −0.34 (23.22)
Cued/free recallLogical memory (30 min) −0.6 (1.51) −1 (2.2) −1.5 (2.14) −0.16 (4.44) −0.26 (3.81) −1.3 (4.79)PAL (stages passed) −0.4 (1.17) −0.13 (1.36) −0.88 (1.13) −0.35 (0.71) −0.53 (0.9) −0.43 (0.77)PAL (6-pattern errors) −1.43 (9.33) 6 (9.32) 6.25 (9.66) 3.63 (28.99) 0.03 (3.5) 1.8 (7.54)PAL (total errors) 13.4 (28.43) 1.63 (28.15) 27.13 (26.31) 0.52 (19.04) 6.63 (29.37) 3.27 (23.82)
Semantic naming/fluencyGraded naming test 0.78 (3.38) 0.5 (3.21) −0.5 (2.78) 0.71 (1.9) 0.33 (1.86) 0.63 (1.38)Semantic naming 1.67 (2.18) 0.63 (1.77) −0.63 (2.92) 0.32 (1.49) 0.53 (1.61) 0.6 (1.5)Category fluency −6.55 (14.16) −6 (7.29) −10.25 (5.99) −0.16 (10.76) −1.42 (12.21) −0.23 (9.79)
Divided attention5-choice RTI (accuracy) 0 (2) −0.13 (2.03) −1.13 (1.73) −0.13 (0.92) −0.43 (1.17) −0.31 (1.85)5-choice RTI (latency, m sec) 150.12 (367.04) 79.45 (128.62) 129.18 (108.62) 0.51 (54.51) 0.88 (53.9) 13.51 (54.46)
Sustained attentionRVP 1-seq (A′) 0.01 (0.02) −0.02 (0.06) −0.02 (0.07) 0 (0.02) 0 (0.03) 0 (0.01)RVP 1-seq (latency, m sec) −39.55 (72.89) 45.73 (83.44) 68.64 (114.33) −27.47 (131.92) −17.58 (148.27) −44.28 (132.66)
Executive functionLetter fluency −4.11 (8.81) −3.13 (8.79) −7.38 (11.94) −1 (9.18) −2.06 (11.56) 2.07 (9.07)IED (stages completed) 0.56 (2.46) −0.38 (1.51) −1.88 (2.75) −0.26 (1.79) −0.5 (2.1) −0.03 (1.54)OTS (attempts, 5 moves) −0.25 (1.07) 0.7 (1.24) −0.69 (1.86) −0.01 (0.59) −0.18 (0.6) −0.04 (0.73)

S.R. Chamberlain et al. / Differential Cognitive Deterioration in Dementia: A Two Year Longitudinal Study 15
Supplementary Table 3Principal Component results for the AD-SMI analysis, indicating the percentage of variance accounted for by each component
Component Total variance explained
Initial eigenvalues Rotation sums of squared loadings
Total % of variance Cumulative % Total % of variance Cumulative %
1 9.499951 43.18159 43.18159 5.625115 25.5687 25.56872 1.7769 8.076817 51.25841 2.90021 13.18277 38.751483 1.658942 7.540645 58.79906 2.633266 11.96939 50.720874 1.405349 6.38795 65.18701 2.284668 10.38485 61.105725 1.251323 5.687831 70.87484 1.809049 8.222949 69.328676 1.028465 4.674839 75.54968 1.368621 6.221005 75.549687 0.923362 4.1971 79.746788 0.741518 3.370534 83.117319 0.665686 3.025846 86.1431610 0.551772 2.508052 88.6512111 0.483136 2.196072 90.8472812 0.420653 1.91206 92.7593413 0.352995 1.604525 94.3638714 0.283866 1.290298 95.6541615 0.272709 1.239585 96.8937516 0.233034 1.059245 97.9529917 0.146418 0.665537 98.6185318 0.12489 0.567681 99.1862119 0.081977 0.372624 99.5588420 0.050417 0.229169 99.78821 0.036476 0.1658 99.953822 0.010163 0.046195 100
Supplementary Table 4Rotated component matrix indicating loading of baseline cognitive variables onto each factor. A cut-off of ≥0.7 was employed. The rotation
converged in 12 iterations
Baseline values for task Component
1 2 3 4 5 6
Global cognitive functionADAS-cog −0.81211MMSE
RecognitionWarrington SRMT words
Warrington SRMT faces 0.78162PRMSRM 0.821606Doors recognition 0.742534DMS (correct, 12 s delay)
Cued/free recallLogical memory (30 min)PAL (stages passed) 0.892972PAL (6-pattern errors) −0.90655PAL (total errors) −0.90982
Semantic naming/fluencyGraded naming testSemantic naming 0.885451Category fluency
Divided attention5-choice RTI (accuracy)5-choice RTI (latency)
Sustained attentionRVP A′RVP latency −0.82834
Executive functionLetter fluencyIED (stages completed) 0.701032OTS (attempts, 5 moves)