Embed Size (px)
Citation preview

Anatomical, architectural, and biochemical diversity ofthe murine forelimb musclesMargie A. Mathewson,1 Mark A. Chapman,1 Eric R. Hentzen,2,3 Jan Friden4 and Richard L. Lieber1,2,3
1Department of Bioengineering, University of California, San Diego, La Jolla, CA, USA2Department of Orthopedic Surgery, University of California, San Diego, La Jolla, CA, USA3Department of Veterans Affairs Medical Center, San Diego, La Jolla, CA, USA4Department of Hand Surgery, Sahlgrenska University Hospital, Gothenburg, Sweden
Abstract
We characterized the architecture, fiber type, titin isoform distribution, and collagen content of 27 portions of
22 muscles in the murine forelimb. The mouse forelimb was different from the human arm in that it had the
extensor digitorum lateralis muscle and no brachioradialis muscle. Architecturally, the mouse forelimb differed
from humans with regard to load bearing, having a much larger contribution from extensors than flexors. In
mice, the extensor : flexor PCSA ratio is 2.7, whereas in humans it is only 1.4. When the architectural difference
index was calculated, similarities became especially apparent between flexors and extensors of the distal
forelimb, as well as pronators. Discriminant analysis revealed that biochemical measures of collagen, titin, and
myosin heavy chain were all strong between-species discriminators. In terms of composition, when compared
with similar muscles in humans, mice had, on average, faster muscles with higher collagen content and larger
titin isoforms. This report establishes the anatomical and biochemical properties of mouse forelimb muscles.
Given the prevalence of this species in biological studies, these data will be invaluable for studying the
biological basis of mouse muscle structure and function.
Key words: architecture; forelimb; model organism; mouse; muscle.
Introduction
Advances in human medical science often come from infor-
mation gained through the use of animal models. To assess
the strengths and weaknesses of animal data properly and
to understand its significance, it is important to have a firm
understanding of the unique features of an animal model
and how those features relate to humans. For more than a
century, functional morphologists have investigated the
comparative anatomy of a variety of animals (Wood, 1867).
The majority of studies in this field have performed bony
anatomy comparisons across species. Studies on the compar-
ative anatomy of muscle are less common and, recently,
comparative muscles studies have identified notable differ-
ences between humans and other animals in areas such as
the hand (Diogo et al. 2009). Recent studies of muscle in
animals such as the dog or rat, (Sola et al. 1990; Eng et al.
2008) or comparisons of a single muscle across species
(Guintard & Cossu, 2003) have suggested critical differences
between humans and other mammals. Differences in gait
between quadrupedal mammals and bipedal humans (Alex-
ander, 2002; Steudel, 1996) may be related to many of these
differences.
Because, now more than ever, human preclinical studies
rely heavily on data from mouse models, it is useful to have
comparative information regarding the composition and
architecture of mousemuscle. While previous studies charac-
terized a few individual mouse muscles (Hegarty & Hooper,
1971; Burkholder et al. 1994; Chleboun et al. 1997; Goul-
ding et al. 1997) or determined a limited number of proper-
ties of an array of mouse muscles (Carry et al. 1993), a more
complete understanding of architecture, fiber type, and
composition for a wide array of muscles is beneficial. Tools
such as MRI offer noninvasive ways to quantify certain
aspects of small mouse muscles (Heemskerk et al. 2005) but
these methods lack the fundamental data such as sarcomere
length and serial sarcomere number. Thus, using MRI, there
is no way to know if long fascicle lengths represent
stretched sarcomeres from short fibers or if they actually
represent a long string of sarcomeres. Additionally, bio-
chemical composition data are still critical for accurate inter-
pretation of new technologies. To date, no comprehensive
study of the mouse forelimb has been undertaken to
Correspondence
Richard L. Lieber, Department of Orthopaedic Surgery, University of
California San Diego and V.A. Medical Center, 9500 Gilman Drive,
Mail Code 0863, La Jolla, CA 92093-0863, San Diego, USA. T: + 1 858
8221344; F: + 1 858 8223807; E: [email protected]
Accepted for publication 6 August 2012
Article published online 2 September 2012
© Published 2012. This article is a US Government work and is in the public domain in the USA.Journal of Anatomy © 2012 Anatomical Society
J. Anat. (2012) 221, pp443--451 doi: 10.1111/j.1469-7580.2012.01559.x
Journal of Anatomy
characterize its basic architectural and biochemical proper-
ties. Based on differences in size, mode of locomotion (qua-
drupedal vs. bipedal) (Clarke & Still, 1999; Winter, 1989) and
the ability to manipulate using the digits, it is likely that sig-
nificant differences would be present between the species.
Muscles of a quadrupedal forelimb would be expected to be
specialized for weight-bearing, since they would be critical
in stabilization and force production during gait (Elftman,
1944; Macpherson, 1988; Johnson et al. 2008), whereas mus-
cles of a biped might be expected to be adapted for manip-
ulative capabilities (Dietz &Michel, 2009).
The purpose of this study was to compare the architec-
tural and biochemical characteristics of the muscles of the
mouse upper extremity to those of the human in order to
draw conclusions about our ability to apply lessons learned
from mouse models to our understanding of human dis-
ease. Based on the differences in locomotion and use of the
limbs between species, we hypothesized that significant
differences in architecture and biochemistry would be pres-
ent between mouse and human forearms. Therefore, we
characterized 27 portions of the 22 muscles of the mouse
forelimb by measuring their architectural properties and
determining their fiber type composition, collagen content,
and titin isoforms.
Materials and methods
Tissue collection
All procedures were performed with approval of the University of
California Animal Care and Use Committee. Six skeletally and sexu-
ally mature (Kilborn et al. 2002) male C57BL/6 mice (Mus musculus;
Harlan Scientific, Indianapolis, IN, USA) between the ages of 8 and
11 weeks were euthanized by CO2 inhalation followed by cervical
dislocation, and the right and left forelimbs were removed. One
limb from each mouse was pinned to a corkboard at a 90° elbow
angle and fixed in 10% buffered formalin solution for 72 h. The
sample was then placed in phosphate-buffered saline (PBS) for
washing and storage until dissection. The contralateral limb from
each mouse was immediately placed in cold mammalian Ringer’s
solution for further dissection. Muscles from that limb were dis-
sected immediately and snap-frozen in liquid nitrogen (�196 °C).
All fresh tissue dissection was completed within 4 h of euthanasia.
Muscles were then maintained at �80 °C for storage until fiber
analysis.
Architecture
Under a dissection microscope, individual muscles and their tendons
were carefully dissected and placed in PBS for storage. Muscle
identification was performed using a small animal anatomy text
(Popesko et al. 1992) and previously published paper (Carry et al.
1993), along with guidance from two experienced hand surgeons.
Twenty-two distinct muscles were found in the mouse forelimb,
which corresponds to the human arm and forearm. Of these mus-
cles, three had multiple heads, which were each dissected sepa-
rately, yielding a total of 27 individually dissected muscles. These
were: abductor pollicis longus (APL), anconeus (Ancon), biceps
brachii-long head (Bic L), biceps brachii-short head (Bic S), brachialis
(Brach), coracobrachialis (Coraco), dorso-epitrochlearis brachii
(DEB), extensor carpi radialis brevis (ECRB), extensor carpi radialis
longus (ECRL), extensor carpi ulnaris (ECU), extensor digiti quarti
(EDQuart), extensor digiti quinti (EDQuint), extensor digitorum
communis (EDC), extensor digitorum lateralis (EDL), extensor indicis
proprius (EIP), flexor carpi radialis (FCR), flexor carpi ulnaris (FCU),
flexor digitorum profundus-radial head (FDP R), flexor digitorum
profundus-superficial head (FDP S), flexor digitorum profundus-
ulnar head (FDP U), flexor digitorum superficialis (FDS), palmaris
longus (PL), pronator quadratus (PQ), pronator teres (PT), triceps
brachii-lateral head (Tri Lat), triceps brachii-long head (Tri Long),
triceps brachii-medial head (Tri Med).
Using digital calipers under the microscope (accuracy, 0.01 mm),
raw muscle length ðL0mÞ, defined as the origin of the most proximal
fibers to the insertion of the most distal fibers, was measured, and
individual fibers were teased out to determine raw fiber length
ðL0f Þ. Muscles were gently blotted dry for mass measurement. Sur-
face pennation angle was measured from enlarged muscle images
using freely available software (IMAGEJ; U. S. National Institutes of
Health, Bethesda, MD, USA). This computerized tool was chosen
since direct measurement with a standard goniometer was deemed
inaccurate due to the small size of these muscles. Tendon-to-tendon
bundles were dissected from the muscle body and placed in weak
sulfuric acid solution (15% v/v) for 30 min to weaken surrounding
connective tissue and thus facilitate dissection. Small bundles of
10–20 individual fibers were then removed and placed on a glass
slide for laser diffraction sarcomere length measurement. Raw
sarcomere length ðL0sÞ was calculated using the first to first-order
laser diffraction pattern as previously described (Lieber et al. 1984).
Serial sarcomere number (Sn) and normalized fiber length (Lf) were
calculated using the following formulas:
Sn ¼ L0fL0s
ð1Þ
Lf ¼ L0f2:4
L0s
� �ð2Þ
where the value of 2.4 is optimal mouse sarcomere length based
on the muscle length–tension relationship previously demon-
strated (Hegarty & Hooper, 1971; Edman, 2005). This normaliza-
tion method has been validated experimentally in mice (Felder
et al. 2005).
To calculate an accurate physiological cross-sectional area (PCSA),
the following formula was used (Powell et al. 1984):
PCSA ¼ M � cos hq � Lf
ð3Þ
where M is muscle mass (in grams), h represents the average pen-
nation angle of the muscle, and q is the density of muscle
(1.056 g cm�3)(Ward and Lieber, 2005), and (Lf) is the normalized
fiber length calculated above.
Architectural difference index calculation
The architectural difference index (ADI) was calculated (Lieber &
Brown, 1992) to quantify the architectural difference between
matched muscle pairs between species. For the calculations, the
© Published 2012. This article is a US Government work and is in the public domain in the USA.Journal of Anatomy © 2012 Anatomical Society
Murine forelimb muscles, M. A. Mathewson et al.444

architectural parameters that were the best discriminators were
chosen for inclusion: fiber length, PCSA, muscle length, fiber length
to muscle length ratio and muscle mass. The ADI equation previ-
ously developed:
di;j ¼ffiffiffiffiffiffiffiffiffiffiffiffiffiffiffiffiffiffiffiffiffiffiffiffiffiffiffiffiffiffiffiffiffiffiffiffiffiffiffiffiffiffiffiffiffiffiffiXnk¼1
Pi;k � Pj;kPmax;k � Pmin;k
� �2vuut ð4Þ
was used, where Pi,k and Pj,k indicate the kth discriminating
parameter for muscles i and j, respectively, and Pmax,k and Pmin,k
are the maximum and minimum values for that parameter across
the whole dataset. n is the number of total discriminating param-
eters (in this case, n = 5).
Myosin heavy chain and titin molecular weight deter-
mination
Muscle fiber type was estimated using myosin heavy chain composi-
tion as previously described (Talmadge and Roy, 1993). Snap-frozen
muscles (n = 3 for each of 27 muscles) were weighed, crushed, and
placed in sample buffer at a concentration of 125 lg mL�1. Samples
were loaded into SDS-PAGE gels, with 4% acrylamide stacking and
8% acrylamide resolving portions, and run at 4 °C at 10 mA con-
stant current for 1 h followed by 275 V constant voltage for 16–
22 h. The gels were trimmed and stained according to the BioRad
Silver Stain Plus kit protocol (Bio-Rad, Hercules, CA), and bands
were identified and quantified using densitometry (Quantity One;
Bio-Rad).
Titin molecular weight was quantified using SDS-VAGE (Warren
et al. 2003). A protein lysate was prepared as for fiber-type determi-
nation (n = 3 for each of 27 muscles) and loaded into 1% agarose
gels held in place within the gel apparatus with a small 12.8% acryl-
amide plug. Gels were run at 15 mA for 5 h at 4 °C. Gels were
stained according to the BioRad Silver Stain Plus kit protocol, and
bands were identified and quantified using densitometry (Quantity
One; Bio-Rad).
Collagen content measurement
Collagen content was determined using the hydroxyproline assay,
which measures the content of hydroxyproline in a muscle sample
(Stegemann and Stalder, 1967). Briefly, individual mouse muscles
(n = 3 for each of 27 muscles) were placed in glass test tubes,
immersed in six normal hydrochloric acid (HCl), and left to hydrolyze
at 110 °C overnight. After tubes had cooled, methyl red was added
to the tubes and the pH was adjusted using a series of sodium
hydroxide and HCl additions in decreasing concentrations. Chlor-
amine T solution was added to the tubes followed by p-diamino-
benzaldehyde and tubes were incubated at 60 °C for 30 min.
Samples were read at 550 and 558 nm and hydroxyproline concen-
trations were calculated based on the obtained standard curve. The
measured value was converted to collagen concentration using the
number of hydroxyproline residues in each collagen molecule (7.46).
Human data
Human data used for comparative purposes were obtained from
previous studies (Lieber et al. 1990, 1992; Murray et al. 2000; Tirrell
et al. 2012).
Statistical analysis
The statistics software SPSS was used for all statistical analyses. For
flexor and extensor sarcomere length comparison, a two-tailed Stu-
dent’s t-test was performed with P < 0.05 set as the threshold for
significance. One-way analysis of variance (ANOVA) was performed
and post hoc comparisons were made with the Bonferroni multiple
test correction with significance defined as P < 0.05. Discriminant
analysis was performed in SPSS using normalized values for PCSA,
mass, fiber length, and muscle length. None of the biochemical
measures or pennation angle and fiber length to muscle length
ratio was normalized.
Results
Mouse anatomy and architecture
A total of 162 muscles (27 muscles per mouse 9 six mice)
were studied, with 54 muscles from the proximal forelimb
and 108 from the portion distal to the elbow joint. Analysis
of the mouse forelimb musculature showed several funda-
mental differences compared with humans. The mouse has
an extensor digitorum lateralis (Fig. 1A), which is located
next to the extensor digitorum communis and serves a simi-
lar function; an extensor digiti quarti (Fig. 1A), which is
located near the extensor digiti quinti and extends the
forth digit; and a dorsal epitrochlearis brachii (DEB)
A B C
Fig. 1 (A) Extensor aspect of superficial mouse proximal and distal forelimb muscles. (B) Flexor aspect of mouse distal forelimb muscles. (C) Exten-
sor aspect of mouse proximal forelimb muscles with the DEB muscle lifted to reveal the long head of the triceps. Images are all oriented distally
(left) to proximally (right).
© Published 2012. This article is a US Government work and is in the public domain in the USA.Journal of Anatomy © 2012 Anatomical Society
Murine forelimb muscles, M. A. Mathewson et al. 445
(Fig. 1C), which is a thin sheet of muscle that overlies the
long head of the triceps. The DEB can actually be found in
up to 17% of humans, but it is not a commonly recognized
human muscle (Tubbs et al. 2006) and its functional signifi-
cance is not clearly understood. In addition, the mouse is
missing a brachioradialis muscle and has neither first digit
flexors nor extensors (Fig. 1A,B), since the first digit appears
to be a mainly vestigial, non-articulating appendage. The
insertion site of the mouse biceps brachii varies between
animals, with some inserting on the ulna, some on the
radius, and some inserting on both. Of the muscles studied,
the triceps brachii long head (Fig. 1C) was the clear architec-
tural outlier with a mass and a PCSA that were an order of
magnitude larger than any other muscle. Among the other
muscles, all parameters were within the same range
(Table 1).
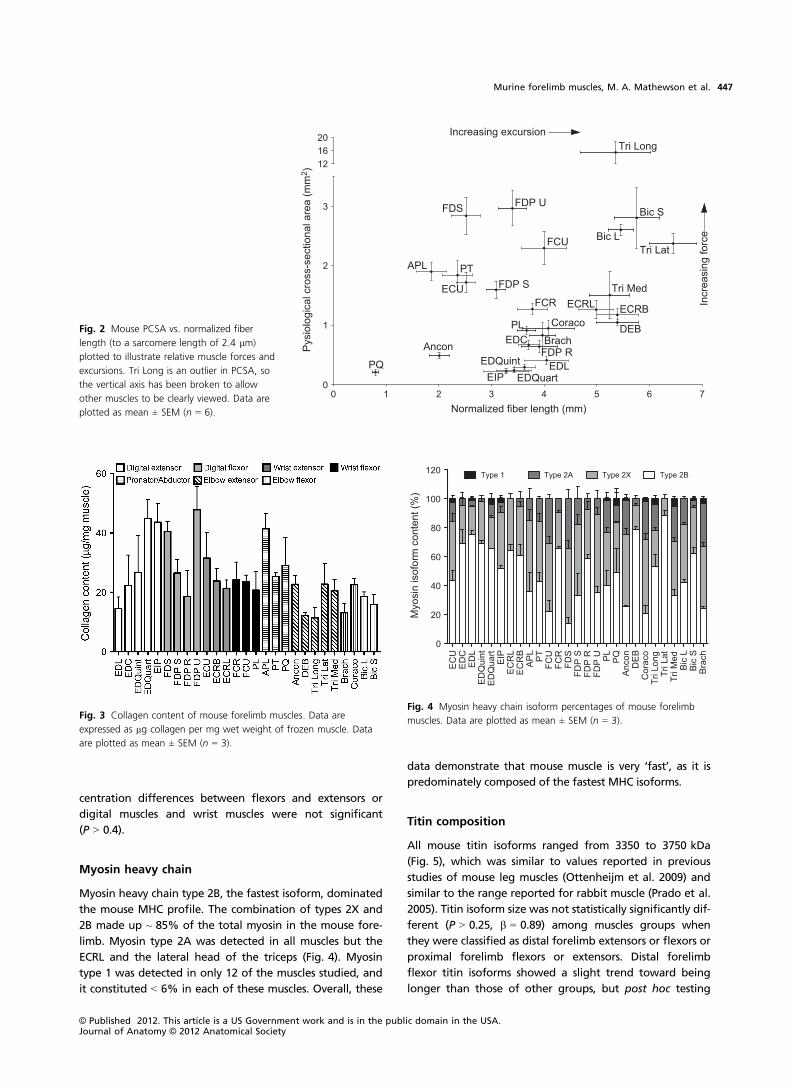
To infer muscle function, it is useful to consider fiber
length and PCSA (Fig. 2) since muscles with long fibers,
which can contract quickly over a longer distance, are spe-
cialized for excursion whereas muscles with a large PCSA,
and therefore many muscle fibers in parallel, are specialized
for force production. Based on these data, muscles such as
the FDS, FDP U and FCU would be expected to produce
large forces with smaller excursions and slower contraction
speeds, whereas the DEB, ECRL and ECRB all have compara-
tively higher excursion potential with their longer fibers
and smaller PCSA. The Tri Long, an outlier on the graph,
has both long fibers and a very large PCSA. In general, flex-
ors of both the proximal and distal forelimb appear
adapted for large force production, and extensors appear
adapted for smaller force production but slightly greater
excursion.
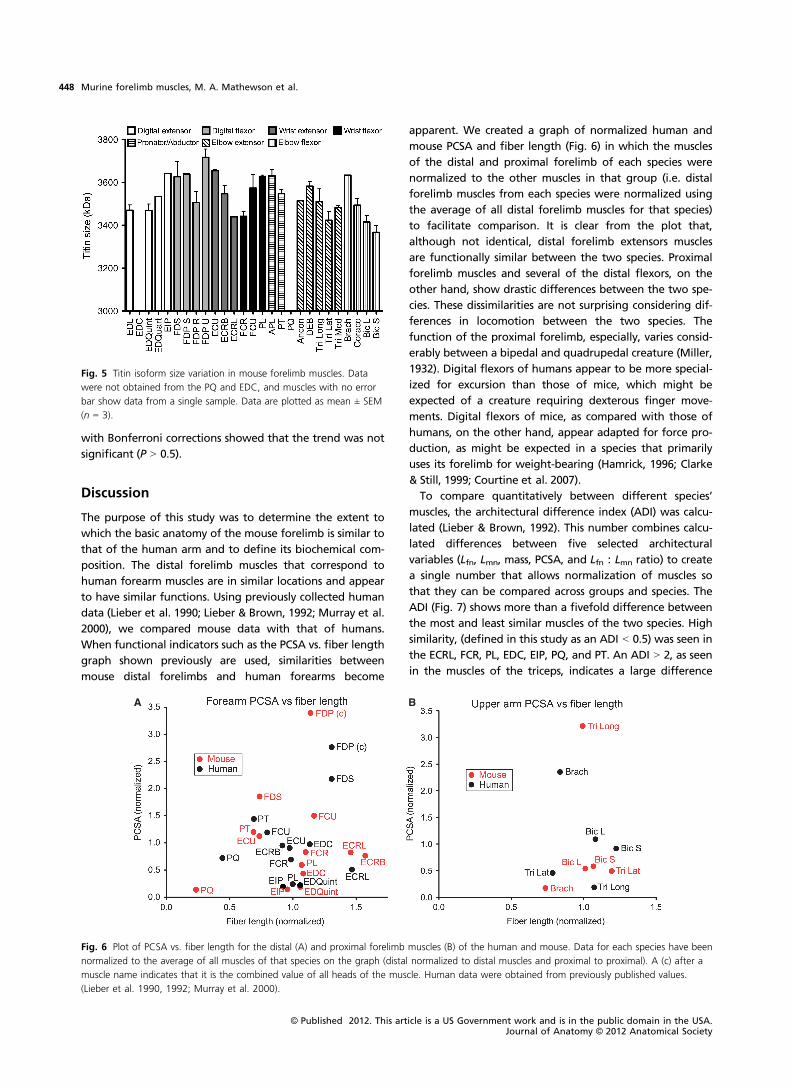
Collagen concentration
Mouse muscle collagen concentrations ranged from
11.4 lg mg�1 in the largest muscle (Tri Long) to
47.8 lg mg�1 in the small ulnar head of the FDP (Fig. 3).
Although there appears to be a trend toward larger mus-
cles having less collagen, the correlation between muscle
mass and collagen content was insignificant (P > 0.1,
b = 0.84). There was a significant difference between colla-
gen concentration of the distal forelimb (corresponding to
the forearm) and the proximal forelimb (P < 0.001) but con-
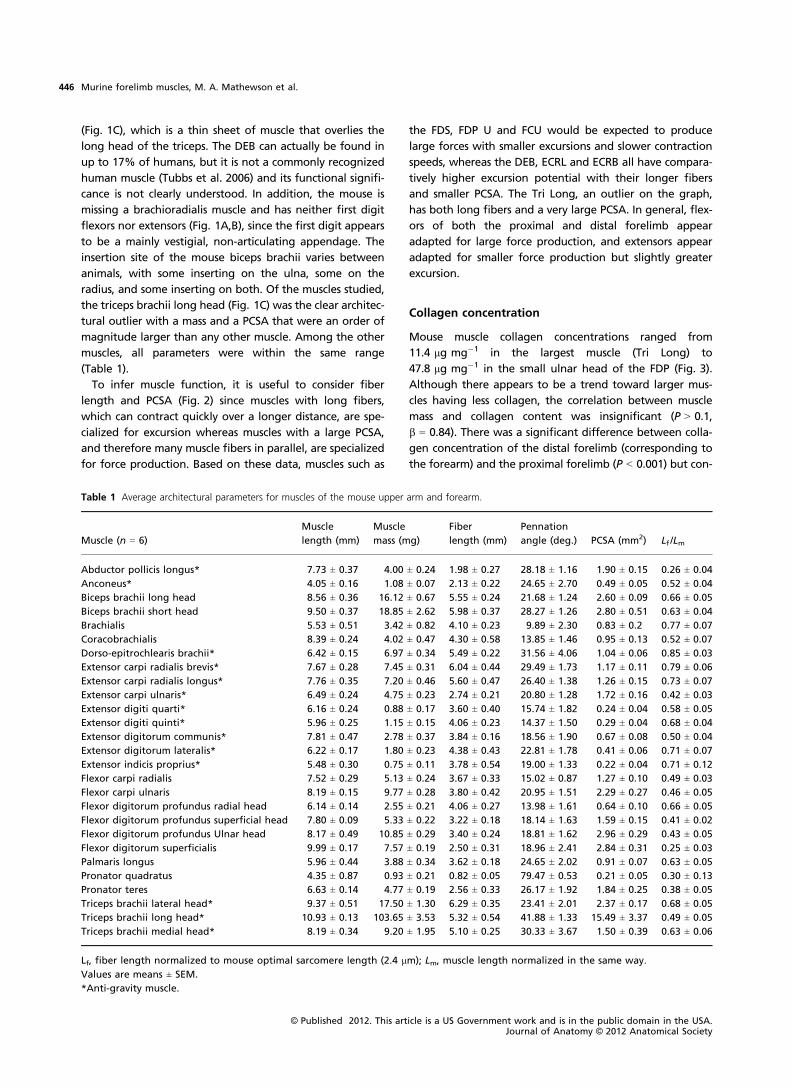
Table 1 Average architectural parameters for muscles of the mouse upper arm and forearm.
Muscle (n = 6)
Muscle
length (mm)
Muscle
mass (mg)
Fiber
length (mm)
Pennation
angle (deg.) PCSA (mm2) Lf /Lm
Abductor pollicis longus* 7.73 ± 0.37 4.00 ± 0.24 1.98 ± 0.27 28.18 ± 1.16 1.90 ± 0.15 0.26 ± 0.04
Anconeus* 4.05 ± 0.16 1.08 ± 0.07 2.13 ± 0.22 24.65 ± 2.70 0.49 ± 0.05 0.52 ± 0.04
Biceps brachii long head 8.56 ± 0.36 16.12 ± 0.67 5.55 ± 0.24 21.68 ± 1.24 2.60 ± 0.09 0.66 ± 0.05
Biceps brachii short head 9.50 ± 0.37 18.85 ± 2.62 5.98 ± 0.37 28.27 ± 1.26 2.80 ± 0.51 0.63 ± 0.04
Brachialis 5.53 ± 0.51 3.42 ± 0.82 4.10 ± 0.23 9.89 ± 2.30 0.83 ± 0.2 0.77 ± 0.07
Coracobrachialis 8.39 ± 0.24 4.02 ± 0.47 4.30 ± 0.58 13.85 ± 1.46 0.95 ± 0.13 0.52 ± 0.07
Dorso-epitrochlearis brachii* 6.42 ± 0.15 6.97 ± 0.34 5.49 ± 0.22 31.56 ± 4.06 1.04 ± 0.06 0.85 ± 0.03
Extensor carpi radialis brevis* 7.67 ± 0.28 7.45 ± 0.31 6.04 ± 0.44 29.49 ± 1.73 1.17 ± 0.11 0.79 ± 0.06
Extensor carpi radialis longus* 7.76 ± 0.35 7.20 ± 0.46 5.60 ± 0.47 26.40 ± 1.38 1.26 ± 0.15 0.73 ± 0.07
Extensor carpi ulnaris* 6.49 ± 0.24 4.75 ± 0.23 2.74 ± 0.21 20.80 ± 1.28 1.72 ± 0.16 0.42 ± 0.03
Extensor digiti quarti* 6.16 ± 0.24 0.88 ± 0.17 3.60 ± 0.40 15.74 ± 1.82 0.24 ± 0.04 0.58 ± 0.05
Extensor digiti quinti* 5.96 ± 0.25 1.15 ± 0.15 4.06 ± 0.23 14.37 ± 1.50 0.29 ± 0.04 0.68 ± 0.04
Extensor digitorum communis* 7.81 ± 0.47 2.78 ± 0.37 3.84 ± 0.16 18.56 ± 1.90 0.67 ± 0.08 0.50 ± 0.04
Extensor digitorum lateralis* 6.22 ± 0.17 1.80 ± 0.23 4.38 ± 0.43 22.81 ± 1.78 0.41 ± 0.06 0.71 ± 0.07
Extensor indicis proprius* 5.48 ± 0.30 0.75 ± 0.11 3.78 ± 0.54 19.00 ± 1.33 0.22 ± 0.04 0.71 ± 0.12
Flexor carpi radialis 7.52 ± 0.29 5.13 ± 0.24 3.67 ± 0.33 15.02 ± 0.87 1.27 ± 0.10 0.49 ± 0.03
Flexor carpi ulnaris 8.19 ± 0.15 9.77 ± 0.28 3.80 ± 0.42 20.95 ± 1.51 2.29 ± 0.27 0.46 ± 0.05
Flexor digitorum profundus radial head 6.14 ± 0.14 2.55 ± 0.21 4.06 ± 0.27 13.98 ± 1.61 0.64 ± 0.10 0.66 ± 0.05
Flexor digitorum profundus superficial head 7.80 ± 0.09 5.33 ± 0.22 3.22 ± 0.18 18.14 ± 1.63 1.59 ± 0.15 0.41 ± 0.02
Flexor digitorum profundus Ulnar head 8.17 ± 0.49 10.85 ± 0.29 3.40 ± 0.24 18.81 ± 1.62 2.96 ± 0.29 0.43 ± 0.05
Flexor digitorum superficialis 9.99 ± 0.17 7.57 ± 0.19 2.50 ± 0.31 18.96 ± 2.41 2.84 ± 0.31 0.25 ± 0.03
Palmaris longus 5.96 ± 0.44 3.88 ± 0.34 3.62 ± 0.18 24.65 ± 2.02 0.91 ± 0.07 0.63 ± 0.05
Pronator quadratus 4.35 ± 0.87 0.93 ± 0.21 0.82 ± 0.05 79.47 ± 0.53 0.21 ± 0.05 0.30 ± 0.13
Pronator teres 6.63 ± 0.14 4.77 ± 0.19 2.56 ± 0.33 26.17 ± 1.92 1.84 ± 0.25 0.38 ± 0.05
Triceps brachii lateral head* 9.37 ± 0.51 17.50 ± 1.30 6.29 ± 0.35 23.41 ± 2.01 2.37 ± 0.17 0.68 ± 0.05
Triceps brachii long head* 10.93 ± 0.13 103.65 ± 3.53 5.32 ± 0.54 41.88 ± 1.33 15.49 ± 3.37 0.49 ± 0.05
Triceps brachii medial head* 8.19 ± 0.34 9.20 ± 1.95 5.10 ± 0.25 30.33 ± 3.67 1.50 ± 0.39 0.63 ± 0.06
Lf, fiber length normalized to mouse optimal sarcomere length (2.4 lm); Lm, muscle length normalized in the same way.
Values are means ± SEM.
*Anti-gravity muscle.
© Published 2012. This article is a US Government work and is in the public domain in the USA.Journal of Anatomy © 2012 Anatomical Society
Murine forelimb muscles, M. A. Mathewson et al.446
centration differences between flexors and extensors or
digital muscles and wrist muscles were not significant
(P > 0.4).
Myosin heavy chain
Myosin heavy chain type 2B, the fastest isoform, dominated
the mouse MHC profile. The combination of types 2X and
2B made up ~ 85% of the total myosin in the mouse fore-
limb. Myosin type 2A was detected in all muscles but the
ECRL and the lateral head of the triceps (Fig. 4). Myosin
type 1 was detected in only 12 of the muscles studied, and
it constituted < 6% in each of these muscles. Overall, these
data demonstrate that mouse muscle is very ‘fast’, as it is
predominately composed of the fastest MHC isoforms.
Titin composition
All mouse titin isoforms ranged from 3350 to 3750 kDa
(Fig. 5), which was similar to values reported in previous
studies of mouse leg muscles (Ottenheijm et al. 2009) and
similar to the range reported for rabbit muscle (Prado et al.
2005). Titin isoform size was not statistically significantly dif-
ferent (P > 0.25, b = 0.89) among muscles groups when
they were classified as distal forelimb extensors or flexors or
proximal forelimb flexors or extensors. Distal forelimb
flexor titin isoforms showed a slight trend toward being
longer than those of other groups, but post hoc testing
0 1 2 3 4 5 6 70
1
2
3
121620
Normalized fiber length (mm)
Pys
iolo
gica
l cro
ss-s
ectio
nal a
rea
(mm
2 )ECU
EDC
EDLEDQuintEDQuartEIP
ECRL ECRB
APL PT
FCU
FCR
FDS
FDP S
FDP R
FDP U
PL
PQ
Ancon
DEBCoraco
Tri Long
Tri Lat
Tri Med
Bic L
Bic S
Brach
Increasing excursion
Incr
easi
ng fo
rce
Fig. 2 Mouse PCSA vs. normalized fiber
length (to a sarcomere length of 2.4 lm)
plotted to illustrate relative muscle forces and
excursions. Tri Long is an outlier in PCSA, so
the vertical axis has been broken to allow
other muscles to be clearly viewed. Data are
plotted as mean ± SEM (n = 6).
Fig. 3 Collagen content of mouse forelimb muscles. Data are
expressed as lg collagen per mg wet weight of frozen muscle. Data
are plotted as mean ± SEM (n = 3).
EC
UE
DC
ED
LE
DQ
uint
ED
Qua
rtE
IPE
CR
LE
CR
BA
PL
PT
FCU
FCR
FDS
FDP
SFD
P R
FDP
U PL
PQ
Anc
onD
EB
Cor
aco
Tri L
ong
Tri L
atTr
i Med
Bic
LB
ic S
Bra
ch
0
20
40
60
80
100
120
Myo
sin
isof
orm
con
tent
(%)
Type 2A Type 2X Type 2BType 1
Fig. 4 Myosin heavy chain isoform percentages of mouse forelimb
muscles. Data are plotted as mean ± SEM (n = 3).
© Published 2012. This article is a US Government work and is in the public domain in the USA.Journal of Anatomy © 2012 Anatomical Society
Murine forelimb muscles, M. A. Mathewson et al. 447
with Bonferroni corrections showed that the trend was not
significant (P > 0.5).
Discussion
The purpose of this study was to determine the extent to
which the basic anatomy of the mouse forelimb is similar to
that of the human arm and to define its biochemical com-
position. The distal forelimb muscles that correspond to
human forearm muscles are in similar locations and appear
to have similar functions. Using previously collected human
data (Lieber et al. 1990; Lieber & Brown, 1992; Murray et al.
2000), we compared mouse data with that of humans.
When functional indicators such as the PCSA vs. fiber length
graph shown previously are used, similarities between
mouse distal forelimbs and human forearms become
apparent. We created a graph of normalized human and
mouse PCSA and fiber length (Fig. 6) in which the muscles
of the distal and proximal forelimb of each species were
normalized to the other muscles in that group (i.e. distal
forelimb muscles from each species were normalized using
the average of all distal forelimb muscles for that species)
to facilitate comparison. It is clear from the plot that,
although not identical, distal forelimb extensors muscles
are functionally similar between the two species. Proximal
forelimb muscles and several of the distal flexors, on the
other hand, show drastic differences between the two spe-
cies. These dissimilarities are not surprising considering dif-
ferences in locomotion between the two species. The
function of the proximal forelimb, especially, varies consid-
erably between a bipedal and quadrupedal creature (Miller,
1932). Digital flexors of humans appear to be more special-
ized for excursion than those of mice, which might be
expected of a creature requiring dexterous finger move-
ments. Digital flexors of mice, as compared with those of
humans, on the other hand, appear adapted for force pro-
duction, as might be expected in a species that primarily
uses its forelimb for weight-bearing (Hamrick, 1996; Clarke
& Still, 1999; Courtine et al. 2007).
To compare quantitatively between different species’
muscles, the architectural difference index (ADI) was calcu-
lated (Lieber & Brown, 1992). This number combines calcu-
lated differences between five selected architectural
variables (Lfn, Lmn, mass, PCSA, and Lfn : Lmn ratio) to create
a single number that allows normalization of muscles so
that they can be compared across groups and species. The
ADI (Fig. 7) shows more than a fivefold difference between
the most and least similar muscles of the two species. High
similarity, (defined in this study as an ADI < 0.5) was seen in
the ECRL, FCR, PL, EDC, EIP, PQ, and PT. An ADI > 2, as seen
in the muscles of the triceps, indicates a large difference
Fig. 5 Titin isoform size variation in mouse forelimb muscles. Data
were not obtained from the PQ and EDC, and muscles with no error
bar show data from a single sample. Data are plotted as mean ± SEM
(n = 3).
A B
Fig. 6 Plot of PCSA vs. fiber length for the distal (A) and proximal forelimb muscles (B) of the human and mouse. Data for each species have been
normalized to the average of all muscles of that species on the graph (distal normalized to distal muscles and proximal to proximal). A (c) after a
muscle name indicates that it is the combined value of all heads of the muscle. Human data were obtained from previously published values.
(Lieber et al. 1990, 1992; Murray et al. 2000).
© Published 2012. This article is a US Government work and is in the public domain in the USA.Journal of Anatomy © 2012 Anatomical Society
Murine forelimb muscles, M. A. Mathewson et al.448

between muscles. All muscles of the distal forelimb besides
the digital flexors had an ADI < 1, suggesting similarity to
humans.
There are distinct muscular differences between the
human and mouse forelimb. Since the mouse first digit is
small and does not appear to be jointed, first digit muscles
found in the human that allow flexion and extension are
unnecessary in the mouse. The only first digit muscle found
in the mouse forelimb was the APL, which appears to con-
tribute to movement of the whole paw. Another important
human muscle, the brachioradialis, is not present in the
mouse. The ECRL and ECRB muscle bellies are shifted anteri-
orly compared with humans, but they still extend the wrist
and attach to the paw in a location corresponding to their
location in the human hand. In the proximal portion of the
forelimb, the long head of the mouse triceps contributes a
much greater percentage of mass than human triceps do.
Because both biceps and triceps contribute to weight-bear-
ing and stabilization in quadrupeds such as mice (Williams
et al. 2008, Fuentes et al. 1998), but only biceps serve an
antigravity function in humans (Monster et al. 1978), it is
not surprising that the mouse triceps was larger and
adapted more for force-production compared with the
human triceps. Since the long head of the triceps crosses
both the elbow and shoulder joint, it contributes even more
significantly to quadrupedal locomotion than the other
heads of the triceps. Many adaptations, such as the lack of
first digit muscles in the mouse, are likely due to this differ-
ence in forelimb specialization: weight-bearing in mice and
manipulation in humans.
At the biochemical level, mouse muscles are dissimilar
from human muscles (Fig. 8). Mouse muscles have a com-
pletely different myosin heavy chain (MHC) distribution,
and therefore a different fiber type distribution, compared
to human muscles (Tirrell et al. 2012) (Fig. 8A). Compared
with human data, mice had about a third as much type IIA
myosin and nearly twice as much type IIX as humans (Tirrell
et al. 2012). Type IIB MHC, which is the major component of
the mouse muscles studied, is not expressed in human
muscles (Smerdu et al. 1994). Because this major component
Fig. 7 Architectural difference index (ADI) of
select human and mouse muscles shows
relative similarity between the same muscle in
mice and humans based on architectural
parameters. Lower ADI indicates greater
similarity.
A B C
Fig. 8 Biochemical comparisons between human and mice muscle groups (D/W F , digital and wrist flexors; D/W E, digital and wrist extensors;
E F, elbow flexors; E E , elbow extensors; P, pronators) show large differences in myosin (A) and collagen (B), but smaller differences in titin
isoform composition (C). Human data from Tirrell et al. (2012).
© Published 2012. This article is a US Government work and is in the public domain in the USA.Journal of Anatomy © 2012 Anatomical Society
Murine forelimb muscles, M. A. Mathewson et al. 449

of mouse myosin is the fastest myosin isoform, and because
type IIX is also fast, mouse muscles would be expected to be
much faster contracting compared with human muscles.
Previous studies suggest that smaller mammals have faster
muscles in general, with mouse muscle Vmax ranging from
6 to 20.6 L s�1 and human Vmax from 0.35 to 3.68 L s�1
(Medler, 2002; Pellegrino et al. 2003). A small, short-limbed
mammal would have to take more rapid strides to maintain
the same speed as a larger mammal with longer limbs
(Heglund & Taylor, 1988), as in the case of a mouse escaping
a predator. Because of this, a fiber type distribution shifted
toward myosin isoforms with higher shortening velocity
makes evolutionary and functional sense. Whereas the
slowest isoform, type I myosin, is almost completely absent
in mouse forelimb muscles, human muscles express high
levels of myosin isoform I (Happak et al. 1988; Tirrell et al.
2012).
The mouse titin isoforms are in the same size range as
published figures for human titin, 3300–3700 kDa (Maruy-
ama, 1997) (Fig. 8C) but mouse values were found to be, on
average, ~ 180 kDa smaller. Titin molecular weights were
more different from those of humans in the proximal por-
tion of the forelimb than in the distal (Tirrell et al. 2012).
The average collagen concentration in the mouse fore-
limb muscles, 25.4 lg mg�1, is double that of human mus-
cles (Fig. 8B) from a similar set of arm muscles recently
measured from cadaveric specimens (Tirrell et al. 2012). It
has been noted previously that smaller mammals store less
elastic energy in their tendons (Biewener et al. 1981; Pollock
& Shadwick, 1994) and it is possible that the increased colla-
gen seen in the mouse muscles serves a compensatory role,
allowing greater muscle tissue elastic energy storage despite
small muscle forces preventing large stores in tendons. In
the mouse muscles tested here, smaller muscles tended to
have higher collagen concentrations. There is a possibility
that this was due to the very small size of the muscle sam-
ples, some of which weighed < 1 mg, and the associated
difficulty of completely removing all tendon. It is also possi-
ble that the surface area to volume ratio of these small mus-
cles was such that the surrounding connective tissue made a
much larger contribution than it would in a large muscle.
Overall, this study shows several significant anatomical
differences between mouse and human forelimb, and
warns against the use of proximal forelimb muscles for
accurate architectural representations of human arm mus-
cles. Some mouse muscles may still provide good represen-
tations of human muscles; for example, pronators, digital
extensors, and select wrist muscles show high overall archi-
tectural similarity to their human counterparts both with
regard to excursion vs. force production and ADI. However,
digital flexors and all muscles of the proximal forelimb
show little similarity to those of humans. Obviously, some
muscles of great interest in human disorders, such as the
brachioradialis, cannot be modeled in mice, since they are
absent. At the biochemical level, mouse muscles show much
less similarity to their human counterparts than they do
architecturally. In view of the many differences between
mouse and human muscles, it is clear that care must be
taken when choosing acceptable mouse muscles for studies
of corresponding human disease.
Acknowledgements
The authors acknowledge the expert advice of Dr. Ki Lee and Tim
Tirrell. Technical assistance was provided by Mary Esparza and Evie
Lin. The authors have no competing interests to disclose.
Funding
This work was supported by the Rehabilitation Research
and Development Service of the Department of Veterans
Affairs, NIH grant HD050837, and National Science Founda-
tion Graduate Research Fellowships to M.M. and M.C.
Author contributions
M.M. and M.C. contributed to acquisition, analysis, and
interpretation of data, drafting and revising the article, and
approving the final version. E.H. and J.F. contributed to
interpretation of data, critically revising article, and approv-
ing the final version. R.L. contributed to conception and
design of the study, analysis and interpretation of data,
drafting and critically revising the article, and approving
the final version.
References
Alexander RM (2002) Stability and manoeuvrability of terrestrial
vertebrates. Integr Comp Biol 42, 158–164.
Biewener A, Alexander RM, Heglund NC (1981) Elastic energy
storage in the hopping of kangaroo rats (Dipodomys spectabi-
lis). J Zool 195, 369383.
Burkholder TJ, Fingado B, Baron S, et al. (1994) Relationship
between muscle fiber types and sizes and muscle architectural
properties in the mouse hindlimb. J Morphol 221, 177–190.
Carry MR, Horan SE, Reed SM, et al. (1993) Structure, innerva-
tion, and age-associated changes of mouse forearm muscles.
Anat Rec 237, 345–357.
Chleboun GS, Patel TJ, Lieber RL (1997) Skeletal muscle architec-
ture and fiber-type distribution with the multiple bellies of
the mouse extensor digitorum longus muscle. Acta Anat
(Basel) 159, 147–154.
Clarke KA, Still J (1999) Gait analysis in the mouse. Physiol
Behav 66, 723–729.
Courtine G, Bunge MB, Fawcett JW, et al. (2007) Can experi-
ments in nonhuman primates expedite the translation of
treatments for spinal cord injury in humans? Nat Med 13,
561–566.
Dietz V, Michel J (2009) Human bipeds use quadrupedal coordi-
nation during locomotion. Ann N Y Acad Sci 1164, 97–103.
Diogo R, Abdala V, Aziz MA, et al. (2009) From fish to modern
humans – comparative anatomy, homologies and evolution of
the pectoral and forelimb musculature. J Anat 214, 694–716.
© Published 2012. This article is a US Government work and is in the public domain in the USA.Journal of Anatomy © 2012 Anatomical Society
Murine forelimb muscles, M. A. Mathewson et al.450

Edman KAP (2005) Contractile properties of mouse single muscle
fibers, a comparison with amphibian muscle fibers. J Exp Biol
208, 1905–1913.
Elftman H (1944) The bipedal walking of the chimpanzee. J
Mammal 25, 67–71.
Eng CM, Smallwood LH, Rainiero MP, et al. (2008) Scaling of
muscle architecture and fiber types in the rat hindlimb. J Exp
Biol 211, 2336–2345.
Felder A, Ward SR, Lieber RL (2005) Sarcomere length measure-
ment permits high resolution normalization of muscle fiber
length in architectural studies. J Exp Biol 208, 3275–3279.
Fuentes I, Cobos AR, Segade LAG (1998) Muscle fibre types and
their distribution in the biceps and triceps brachii of the rat
and rabbit. J Anat 192, 203–210.
Goulding D, Bullard B, Gautel M (1997) A survey of in situ sarco-
mere extension in mouse skeletal muscle. J Muscle Res Cell
Motil 18, 465–472.
Guintard C, Cossu F (2003) Comparative anatomy of M-extensor
carpi radialis in 9 species of domestic mammals and in man.
Rev Med Vet 154, 115–119.
Hamrick MW (1996) Locomotor adaptations reflected in the
wrist joints of early tertiary primates (Adapiformes). Am J Phys
Anthropol 100, 585–604.
Happak W, Burggasser G, Gruber H (1988) Histochemical charac-
teristics of human mimic muscles. J Neurol Sci 83, 25–35.
Heemskerk AM, Strijkers GJ, Vilanova A, et al. (2005) Determi-
nation of mouse skeletal muscle architecture using three-
dimensional diffusion tensor imaging. Magn Reson Med 53,
1333–1340.
Hegarty PVJ, Hooper AC (1971) Sarcomere length and fibre
diameter distributions in four different mouse skeletal mus-
cles. J Anat 110, 249–257.
Heglund NC, Taylor CR (1988) Speed, stride frequency and
energy cost per stride: how do they change with body size
and gait? J Exp Biol 138, 301–318.
Johnson WL, Jindrich DL, Roy RR, et al. (2008) A three-dimen-
sional model of the rat hindlimb: musculoskeletal geometry
and muscle moment arms. J Biomech 41, 610–619.
Kilborn SH, Trudel G, Uhthoff H (2002) Review of growth plate
closure compared with age at sexual maturity and lifespan in
laboratory animals. J Am Assoc Lab Anim Sci 41, 21–26.
Lieber RL, Brown CG (1992) Quantitative method for compari-
son of skeletal muscle architectural properties. J Biomech 25,
557–560.
Lieber RL, Yeh Y, Baskin RJ (1984) Sarcomere length determina-
tion using laser diffraction. Effect of beam and fiber diameter.
Biophys J 45, 1007–1016.
Lieber RL, Fazeli BM, Botte MJ (1990) Architecture of selected
wrist flexor and extensor muscles. J Hand Surg Am 15, 244–
250.
Lieber RL, Jacobson MD, Fazeli BM, et al. (1992) Architecture of
selected muscles of the arm and forearm: anatomy and impli-
cations for tendon transfer. J Hand Surg Am 17, 787–798.
Macpherson JM (1988) Strategies that simplify the control of
quadrupedal stance. II. Electromyographic activity. J Neuro-
physiol 60, 218–231.
Maruyama K (1997) Connectin/titin, giant elastic protein of mus-
cle. FASEB J 11, 341–345.
Medler S (2002) Comparative trends in shortening velocity and
force production in skeletal muscles. Am J Physiol Regul Integr
Comp Physiol 283, R368–R378.
Miller RA (1932) Evolution of the peotoral girdle and fore limb
in the Primates. Am J Phys Anthropol 17, 1–56.
Monster A, Chan H, O’Connor D (1978) Activity patterns of
human skeletal muscles: relation to muscle fiber type composi-
tion. Science 200, 314–317.
Murray WM, Buchanan TS, Delp SL (2000) The isometric func-
tional capacity of muscles that cross the elbow. J Biomech 33,
943–952.
Ottenheijm CAC, Knottnerus AM, Buck D, et al. (2009) Tuning
passive mechanics through differential splicing of titin during
skeletal muscle development. Biophys J 97, 2277–2286.
Pellegrino MA, Canepari M, Rossi R, et al. (2003) Orthologous
myosin isoforms and scaling of shortening velocity with body
size in mouse, rat, rabbit and human muscles. J Physiol 546,
677–689.
Pollock CM, Shadwick RE (1994) Allometry of muscle, tendon,
and elastic energy storage capacity in mammals. Am J Physiol
266, R1022–R1031.
Popesko P, Rajtova V, Horak J (1992) A Color Atlas of Anatomy
of Small Laboratory Animals. Prescott, AZ: Wolfe Publishing
Ltd.
Powell PL, Roy RR, Kanim P, et al. (1984) Predictability of skele-
tal muscle tension from architectural determinations in guinea
pig hindlimbs. J Appl Physiol 57, 1715–1721.
Prado LG, Makarenko I, Andresen C, et al. (2005) Isoform diver-
sity of giant proteins in relation to passive and active contrac-
tile properties of rabbit skeletal muscles. J Gen Physiol 126,
461–480.
Smerdu V, Karsch-Mizrachi I, Campione M, et al. (1994) Type IIx
myosin heavy chain transcripts are expressed in type IIb fibers
of human skeletal muscle. Am J Physiol 267, C1723–C1728.
Sola OM, Haines LC, Kakulas BA, et al. (1990) Comparative anat-
omy and histochemistry of human and canine latissimus-dorsi
muscle. J Heart Transplant 9, 151–159.
Stegemann H, Stalder K (1967) Determination of hydroxypro-
line. Clin Chim Acta 18, 267–273.
Steudel K (1996) Limb morphology, bipedal gait, and the
energetics of hominid locomotion. Am J Phys Anthropol 99,
345–355.
Talmadge RJ, Roy RR (1993) Electrophoretic separation of rat
skeletal muscle myosin heavy-chain isoforms. J Appl Physiol
75, 2337–2340.
Tirrell TF, Cook MS, Carr JA, et al. (2012) Human skeletal muscle
biochemical diversity. J Exp Biol 215, 2551–2559.
Tubbs RS, Salter EG, Oakes WJ (2006) Triceps brachii muscle
demonstrating a fourth head. Clin Anat 19, 657–660.
Ward SR, Lieber RL (2005) Density and hydration of fresh and
fixed human skeletal muscle. J Biomech 38, 2317–2320.
Warren CM, Krzesinski PR, Greaser ML (2003) Vertical agarose
gel electrophoresis and electroblotting of high-molecular-
weight proteins. Electrophoresis 24, 1695–1702.
Williams SB, Wilson AM, Daynes J, et al. (2008) Functional anat-
omy and muscle moment arms of the thoracic limb of an elite
sprinting athlete: the racing greyhound (Canis familiaris). J
Anat 213, 373–382.
Winter DA (1989) Biomechanics of normal and pathological gait
– implications for understanding human locomotor control. J
Mot Behav 21, 337–355.
Wood J (1867) On human muscular variations and their relation
to comparative anatomy. J Anat Physiol 1, 44–59.
© Published 2012. This article is a US Government work and is in the public domain in the USA.Journal of Anatomy © 2012 Anatomical Society
Murine forelimb muscles, M. A. Mathewson et al. 451


![Muscle Physiology - Home Pagemuscle.ucsd.edu/More_HTML/papers/pdf/Lieber_PT_1993.pdf · 2006-08-19 · muscle mechanics. implications for rehabilitation. Phys Then 1993, 73844—856.]](https://img.pdfslide.net/doc/110x75/5f3e1a028466116ebe1bab52/muscle-physiology-home-2006-08-19-muscle-mechanics-implications-for-rehabilitation.jpg)