Embed Size (px)
Citation preview
Contents lists available at ScienceDirect
Journal of Asian Earth Sciences
journal homepage: www.elsevier.com/locate/jseaes
Full length article
Subsurface profiling along Banni Plains and bounding faults, Kachchh,Western India using microtremors method
Dhananjay A. Santa,⁎, Imtiyaz A. Parvezb, Govindan Rangarajanc, Satish J. Patela,Madhuri N. Bhatta, T.A. Sanoop Salama
a Department of Geology, Faculty of Science, The Maharaja Sayajirao University of Baroda, Vadodara 390002, Indiab CSIR Fourth Paradigm Institute (Formerly CSIR Centre for Mathematical Modeling and Computer Simulation (C-MMACS)), NAL Belur Campus, Bengaluru 560 037,Indiac Department of Mathematics, Indian Institute of Science, Bangalore 560 012, India
A R T I C L E I N F O
Keywords:Banni Plains, Kachchh Mainland FaultMicrotremorAmbient noiseFundamental resonant frequencyH/V spectral ratioPositive flower structure
A B S T R A C T
The present article is a maiden attempt to map shallow subsurface rheological interfaces laterally across theBanni Plains and to decode geometry of the antecedent faults associated with the Kachchh Mainland Fault usingthe microtremor method. We conducted microtremor data acquisition for thirty-one sites along N-S transect fromLoriya in Mainland Kachchh to Bhirandiara towards Patcham Island. Results from H/V spectral ratio techniqueshow presence of two distinct rheological interfaces characterised by the resonant frequency (fr) ranges0.23–0.27 Hz and 0.8252–1.5931 Hz respectively. The above frequency ranges are correlated with the depths ofthe Mesozoic-Basement (M-B) interface and the Quaternary-Tertiary (Q-T) interface. Using either the velocity(Vs) of seismic waves at the M-B and Q-T interfaces (calculated as 1830 m/s and 411 m/s respectively) or thestandard non-linear regression relationship derived for the Banni Plains (h = 110.18fr−1.97) we estimate thedepth range for M-B interface to be 1442–1965 m and for Q-T interface to be 44–160 m. The subsurface profileacross the Banni Plains educe cluster of four faults that develop an array of imbricate faults at the forefront of theKachchh Mainland Fault within the Banni Footwall Syncline. The geometry of the faults suggests a ‘positiveflower structure’ indicating step-overs and strain restraining bends displaying push-ups resulting from localizedshortening between converging bends of Kachchh Mainland Fault and the South Wagad Fault. The BanniFootwall Syncline preserves evidence of two episodes of deformations. The initial deformation event led tosubsidence within the Kachchh Mainland Fault Zone bringing Mesozoic sequence juxtaposed to the basementrocks, whereas the later event is dominated by an uplift developing a positive flower structure in the KachchhMainland Fault Zone. Finally, the present study provides a mechanism to investigate faults and fault geometriescorrelating surface structural grains with subsurface structures.
1. Introduction
The Rann of Kachchh forms a vast E-W trending depression devel-oped between the Nagarparkar Fault (NPF) in the north and an arcuateKachchh Mainland Fault (KMF) in the south along the Indo-Pak border,Western India (Fig. 1A; Biswas and Deshpande, 1970; Biswas, 1987,2005). A structural inversion had begun in the Rann of Kachchh duringthe Tertiary period and has continued to till date (Mathew et al., 2006;Karanth and Gadhavi, 2007). The active growth of several E–Wtrending faults controls the basin architecture and strain augmentation(Malik et al., 2008). With reference to the ‘Median High’ (a N-S to NNE-SSW trending subsurface feature across the Kachchh Basin: Biswas,1982, 1987), the western Rann of Kachchh is substantially wide
compared to the eastern counterpart. The eastern Rann of Kachchhexposes several fault-bounded islands viz., Patcham, Khadir, Bela andChorar along its axial-part followed by a narrow complex basin. In re-ference to KMF, Karanth and Gadhavi (2007) referred to the BanniPlains as ‘Banni Footwall Syncline’ or ‘Banni Half Graben’. The BanniFootwall Syncline, the Wagad Block and the Samathiayali Basin are thefew interesting segments within the eastern Rann of Kachchh. Theepicentre of the Bhuj earthquake (26th January 2001; 23.41°N,70.23°E; Mw= 7.7; 2001) was located in the eastern segment of theRann of Kachchh between KMF and the South Wagad Fault (SWF).
Several geophysical studies have been pursued to decode thestructure and stress field in the Kachchh Basin viz., electrical imaging(Sastry et al., 2008); electromagnetic radiation investigations (Mathew
http://dx.doi.org/10.1016/j.jseaes.2017.06.002Received 18 May 2016; Received in revised form 2 June 2017; Accepted 6 June 2017
⁎ Corresponding author.E-mail address: [email protected] (D.A. Sant).
Journal of Asian Earth Sciences 146 (2017) 326–336
Available online 08 June 20171367-9120/ © 2017 Elsevier Ltd. All rights reserved.
MARK
et al., 2006; Mallik et al., 2009); magnetotelluric studies(Naganjaneyulu et al., 2010; Chandrasekhara et al., 2012); heat flowstudies (Vedanti et al., 2011); seismological studies (Chung and Gao,1995; Mandal, 2007; Mandal and Hurton, 2007; Antolik and Dreger,2003); measurement of H/V resonant frequency (Mandal et al., 2005;Chopra and Choudhury, 2011; Kumar et al., 2012; Chopra et al., 2013and Singh et al., 2014). However, mapping of subsurface extension offaults and analogous structures up to shallow depths developed becauseof neotectonic activity using geophysical techniques is also essential(Karanth and Gadhavi, 2007).
In this study, we have investigated subsurface stratified as well asfault-controlled sediment/rock interfaces in the Banni Plains using themicrotremor (ambient noise) as the Surface waves are generated by
persistent ambient noise within the region. The Surface waves gener-ated have strong acoustic impedance along the sediment/rock interfacehaving contrasting density and therefore exhibit a prominent re-sonating frequency corresponding to this interface (Kanai, 1957;Yamanaka et al., 1994; Ibs-von Seht and Wohlenberg, 1999; Delgadoet al., 2000; Parolai et al., 2002; Garcia-Jerez et al., 2006; Zhao et al.,2007; Rošer and Gosar, 2010). The growing popularity of the micro-tremor method is due to its cost effectiveness and a rapid tool for ap-proximation of depths for the subsurface interfaces. Microtremor stu-dies provide an opportunity to infer results as a 2-D cross section whencarried out along a profile and as 3-D when carried out under a gridpattern (Sukumaran et al., 2011). The resolution of the study varieswith the topography of the terrain and purpose. In summary, subsurface
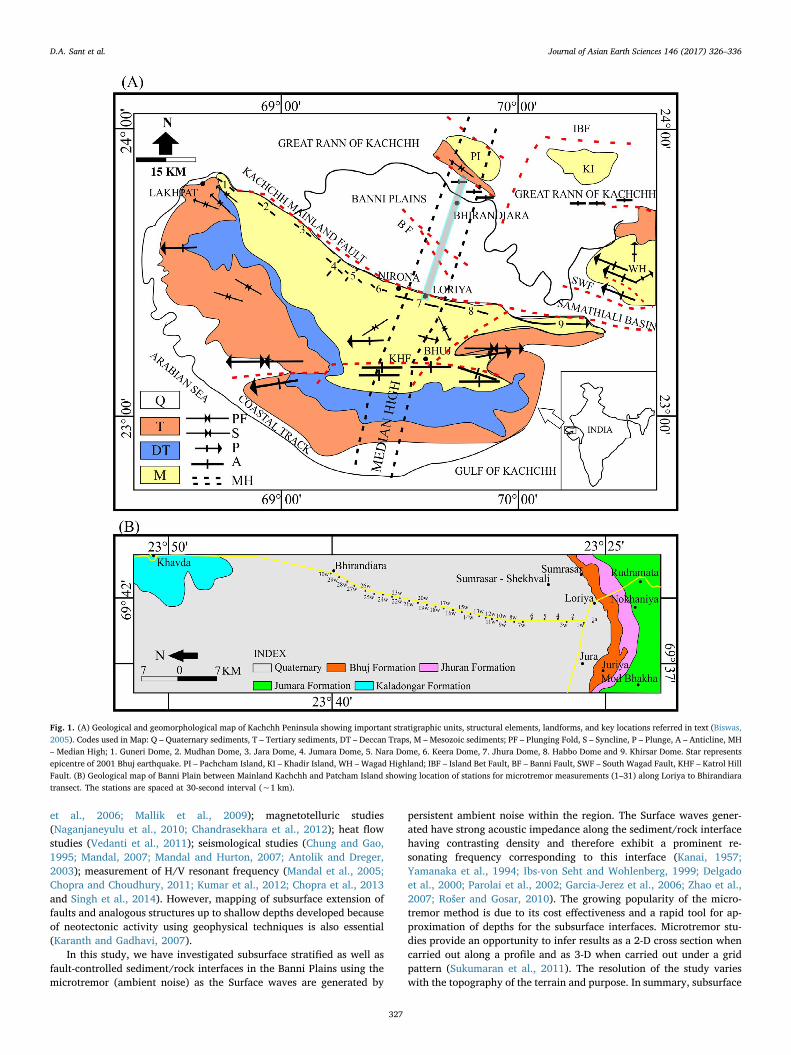
Fig. 1. (A) Geological and geomorphological map of Kachchh Peninsula showing important stratigraphic units, structural elements, landforms, and key locations referred in text (Biswas,2005). Codes used in Map: Q – Quaternary sediments, T – Tertiary sediments, DT – Deccan Traps, M – Mesozoic sediments; PF – Plunging Fold, S – Syncline, P – Plunge, A – Anticline, MH– Median High; 1. Guneri Dome, 2. Mudhan Dome, 3. Jara Dome, 4. Jumara Dome, 5. Nara Dome, 6. Keera Dome, 7. Jhura Dome, 8. Habbo Dome and 9. Khirsar Dome. Star representsepicentre of 2001 Bhuj earthquake. PI – Pachcham Island, KI – Khadir Island, WH –Wagad Highland; IBF – Island Bet Fault, BF – Banni Fault, SWF – South Wagad Fault, KHF – Katrol HillFault. (B) Geological map of Banni Plain between Mainland Kachchh and Patcham Island showing location of stations for microtremor measurements (1–31) along Loriya to Bhirandiaratransect. The stations are spaced at 30-second interval (∼1 km).
D.A. Sant et al. Journal of Asian Earth Sciences 146 (2017) 326–336
327
mapping of rock/sediment interface, faults and plutons are feasibleusing microtremor method (Zhao et al., 2007; Dinesh et al., 2010;Sukumaran et al., 2011; Paudyal et al., 2013; Joshi et al., 2017).
We compared the fundamental resonant frequencies with the pro-minent interfaces in the Deep Banni Core A (DGH Records). The resultof microtremor studies enabled us to (i) determine the Quaternary-Tertiary and the Mesozoic-Basement interfaces (ii) estimate thickness ofthe Quaternary sediment and the Tertiary-Mesozoic sedimentary (iii)report the absence of the Deccan basalts underneath the Banni Plainsand (iv) delineate geometry of the antecedent faults in the BanniFootwall Syncline and their characteristics. Such an interdisciplinary,cost-effective and quick study that reveals the third dimension of faults/fault geometry within the fault zones up to shallow depths widens thescope of studies pertaining to recent deformation/active boundariesand their societal effect.
2. Geology and structure
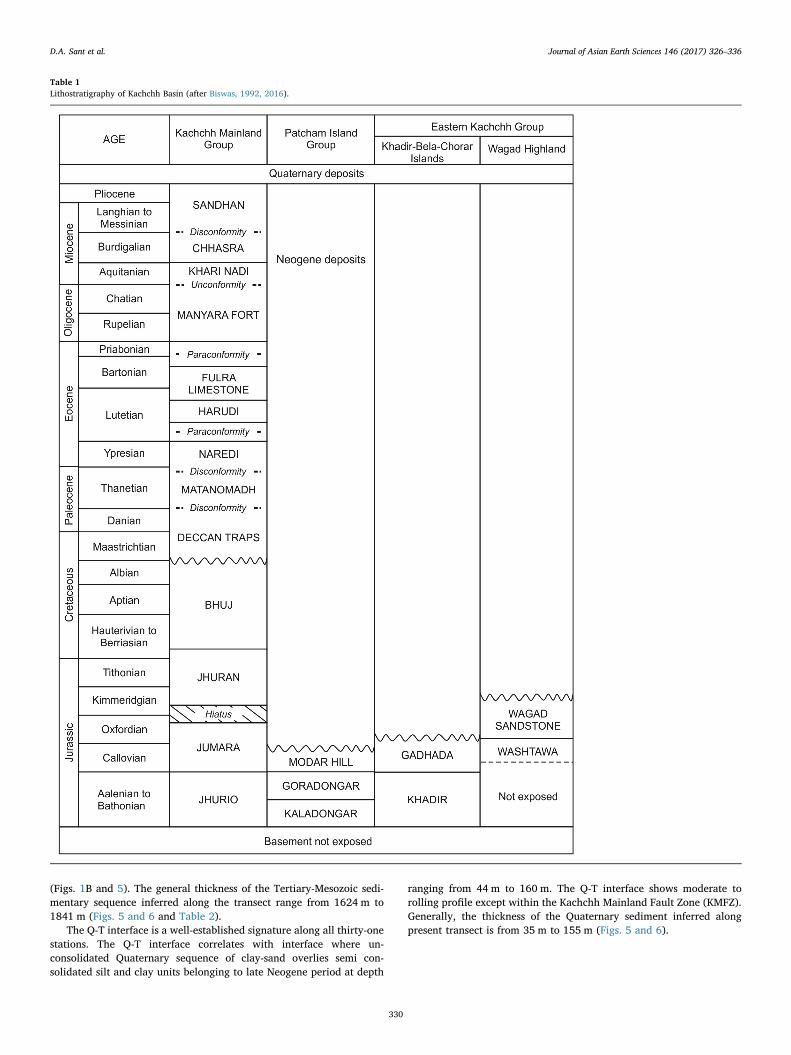
The Kachchh Basin between latitude 22°30′N and 24°30′N andlongitudes 68°E and 72°E preserve diverse rocks including sedimentarysequences belonging to Mesozoic and Cenozoic era. The Mesozoic se-dimentary lie unconformable on the Precambrian basement (Bardanand Datta, 1987; Biswas, 1987). The only exposed Precambrian rocksreported are from Nagarparkar region (Pakistan) northeast of the studyarea (Kazmi and Khan, 1973; Khan et al., 2012) and at Meruda, north ofKhadir island (Biswas and Deshpande, 1968). Late Cretaceous-earlyPaleocene mafic plutons and dykes emplace the Mesozoic sedimentarybelonging to both early and late Deccan Trap phases. Emplacement ofmafic magma during early phase of Deccan Traps resulted in domalstructures along the northern periphery of the Kachchh Mainland HillRange (around Guneri, Mundhan, Jara, Jumara, Nara, Keera, Jhura,Habo and Khirsar: Fig. 1A) resulting in an uplift and restricting theflows of Deccan basalt further south and along the intra-domal de-pressions. The western periphery of the Kachchh Peninsula, peripheryof island belts (Patcham, Khadir, Bela and Chorar Islands) and WagadHighland expose Tertiary sequence whereas its subsurface extension istraced under the Rann of Kachchh (Figs. 1A, B and 2A and Table 1).
The Kachchh Peninsula is bounded by Nagarparkar Fault (NPF);Island Belt Fault (IBF); Allah Bund Fault (ABF); South Wagad Fault(SWF); Kachchh Mainland Fault (KMF) and Katrol Hill Fault (KHF)(from north to south in Fig. 1A; Biswas and Deshpande, 1970; Biswas,1987, 2005). NPF restricts the Precambrian to its north and defines thenorthern extreme of the Rann of Kachchh depression; KMF marks thesouthern limit of the Rann of Kachchh; IBF defines the northern per-iphery of the Island belt; ABF is a possible western extension of IBF orsegment of NPF whereas the Banni Fault lies in between the Patchamisland and the Mainland Kachchh. Further east, cluster of faults char-acterises the Wagad Block where SWF is the most prominent faultbounding southern fringe of the Wagad Block. The Kachchh Mainlandand the Wagad Blocks have dextral strike-slip relationship (Biswas andKhatri, 2002). Both these faults (KMF and SWF) have distinct E–Wtrending and topographic expression (Mathew et al., 2006). The fadingKMF is likely to converge with SWF where KMF step to north, and SWFforms a step-over continuation of the KMF (see Fig. 7 in Biswas andKhatri, 2002 and Fig. 6 in Biswas, 2002). In the Mainland Kachchh, KHFmarks the northern periphery of the Katrol Hill.
Geomorphologically, the Banni Plains aggraded between KMF andIBF. It is roughly flat, saline grassland covering an area about3000 sq. km with a gentle north-westerly gradient. The southern fringes(along KMF) show development of alluvial fans along the mouth ofnortherly flowing streams emerging across the Kachchh Mainland (Kar,1993; Chowksey et al., 2011). Two distinct landforms viz., raisedmudflats (region ≤5 m) and pediments (region ≥12 m) characterisethe Banni Plains. In general the Banni Plains comprises of fluvio-marinesediments (Kar, 2011) (Fig. 1A and B).
Two deep cores namely, the Deep Banni Core A (1764 m deep from
the surface, along the northern fringe of the Banni Plain, southeast ofBirandiyara) and the Deep Nirona Core B (2224 m deep from the sur-face, along the southern fringe of the Banni Plain, West of Loriya vil-lage) describe the subsurface geology of the Banni Plains. The DeepBanni Core A reveals the presence of a granite basement at a depth of1688 m (Fig. 2A) whereas the Deep Nirona Core B encounters the tra-chytic basement at depth of 2200 m. The estimated thickness of stra-tigraphic sequences from two DGH records suggests the Banni Basincomprises Mesozoic sedimentary (Banni Core A: 1310 m; Nirona CoreB: 1278 m), Neogene sedimentary (Banni Core A: 504 m; Nirona Core B:413 m) and Quaternary sediments (Banni Core A: 100 m; Nirona CoreB: 506 m).
Biswas (1999) discussed subsurface extension of the Jumara For-mation (Callovian-Oxfordian) further north of the Mainland Kachchh aswell as extension of the Kaladonger Formation (Aalenian to Bathonian)further south from the Patcham Island into the Banni Plains. The Bannifault in the region is inferred based on juxtaposition of younger JumaraFormation with the older Kaladonger Formation where, the southernside of the Banni Fault has gone done by about 300 m (Fig. 1). Further,the Miocene sediments have uniformly aggraded across the basin. Twoshallow cores viz., north of Dhordo (60 m depth) and northeast of Be-rada (51 m depth) in the Banni Plains elucidate the late Quaternarysequence. These sediment sequences show intercalation of clayey-siltand silty-clay (Maurya et al., 2013). The litho-stratigraphic recordsprocured from the deep and shallow cores suggest that the Banni Basingot initiated during early Miocene that continued in Quaternary.
3. Microtremor studies
Several studies have shown that the ambient noise encapsulatesfundamental resonant frequency of the sediment layers (Ohta et al.,1978; Celebi et al., 1987; Lermo et al., 1988; Field et al., 1990; Houghet al., 1991; Konno and Ohmachi, 1998; Aki and Richards, 2002). Theseresonant frequencies derived from the microtremors show strong cor-relation with the velocity of the Rayleigh waves and the thickness of thesediments (Ibs-von Seht and Wohlenberg, 1999; Parolai et al., 2002). Tocharacterise amplification of the seismic wave for a given site, Nogoshiand Igarashi (1971) proposed a technique to normalize the source effectby taking the spectral ratio of the horizontal (NS + EW component) tothe vertical component (H/V) of the noise spectrum. Nakamura (1989)further popularized the method and its applications. Field and Jacob(1993), Parolai and Galiana-Merino (2006), Bonnefoy-Claudet et al.(2006), Garcia-Jerez et al. (2006), Zhao et al. (2007), Nakamura(2008), Bard (2008), Pilz et al. (2009), Lunedei and Albarello (2010),Sánchez-Sesma et al. (2011) carried out extensive studies to assess in-tegrity of this method with several modifications.
We carried out microtremor measurements for thirty-one sitesspaced at 30-second intervals (∼1 km) along the N-S to NNE-SSWtransect starting from the village Loriya (Mainland Kachchh) to thevillage Bhirandiara (towards Patcham Island) across the Banni Plain(Fig. 1B). The profile coincides with the Median High. We deployed aLennartz seismometer (5 s period) and a City Shark-II data acquisitionsystem to acquire ambient noise of three components viz., NS, EW, andvertical directions. The duration of recording continued for 40 min atthe rate of 100 samples/sec (see Fig. 3 in Sukumaran et al., 2011).GEOPSY software (SESAME European Project, 2004) was used tocomputes the ratio between the Fourier amplitude spectra of the H/Vcomponents of persisting Rayleigh waves from the ambient noise ac-quired from all thirty-one sites (Fig. 1B).
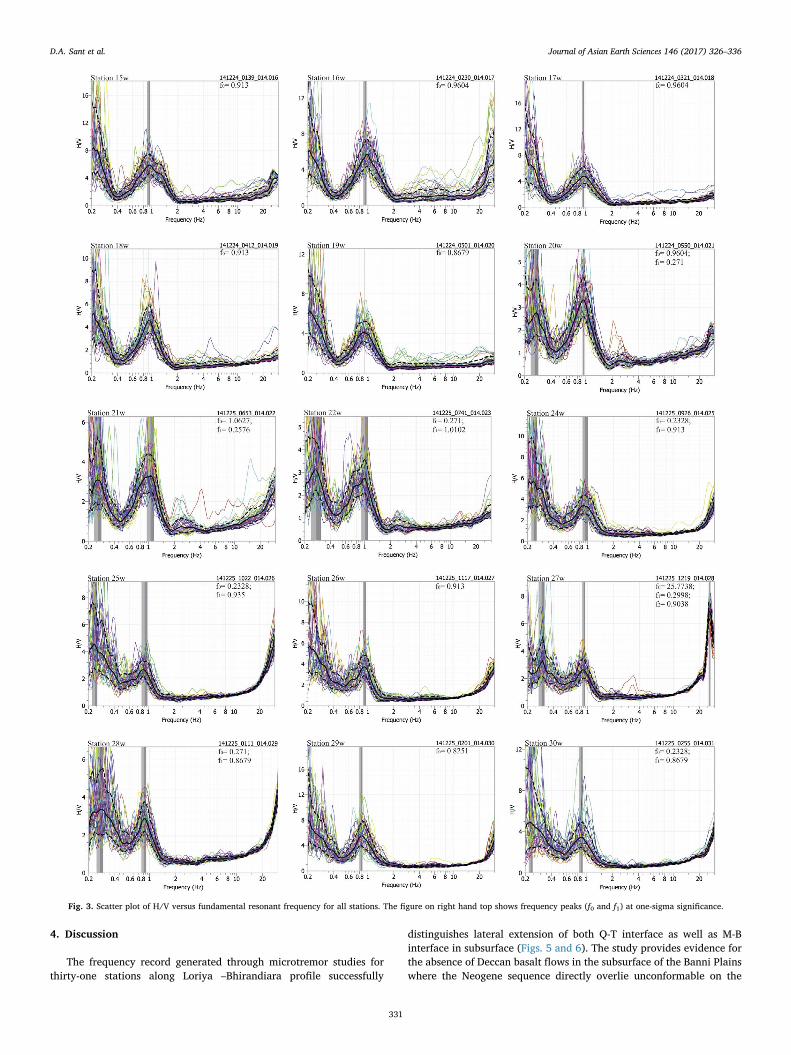
The H/V spectral ratios were plotted between 0.2 Hz and 30 Hzincluding the complete range of resonating frequencies recorded withinthe study area (Fig. 3). Customised Matlab code determined statisticallysignificant spectral peaks (one standard deviation greater than thebaseline activity) for H/V spectral ratios. These peaks then corre-sponded to significant frequencies for each station. The significantfrequencies f0, and f1 were singled out for the individual stations based
D.A. Sant et al. Journal of Asian Earth Sciences 146 (2017) 326–336
328
on amplitudes (Fig. 3, Table 2). Fig. 3 illustrates representative H/Vspectral frequency plots recorded from the study area.
Theoretical estimation of the thickness (h) of the soil or the sedi-ment layer over the bedrock was linked to the fundamental resonantfrequency (fr) of H/V spectral ratio by an allometric function as givenby Ibs-von Seht and Wohlenberg (1999).
=h afrb (1)
where a and b are obtained by performing a nonlinear regression be-tween the thickness and the fundamental resonant frequency.
For a given fundamental resonant frequency, if the velocity ofseismic waves (Vs) for a given interface is known, the depth of the in-terfaces is given by (Parolai et al., 2002)
=h Vsfr4 (2)
On the other hand, if the depth of the interface in known based onavailable core records, the velocity of seismic waves (Vs) can be de-termined using Eq. (2).
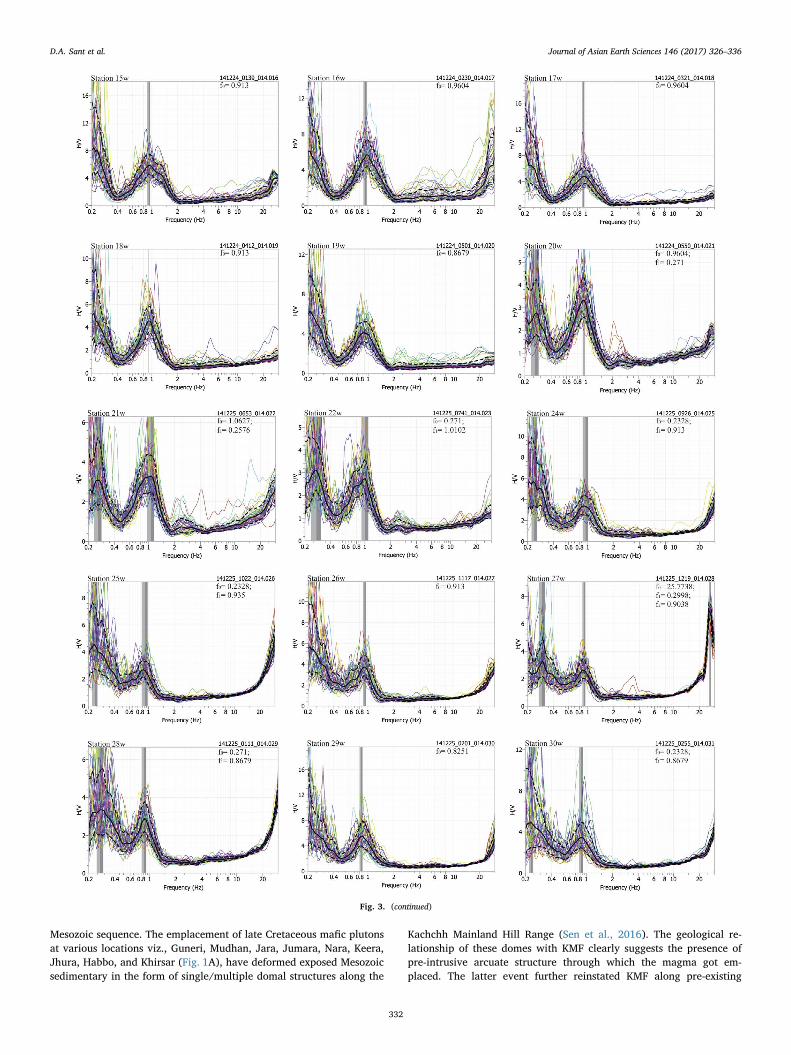
The most prominent frequencies procured from the microtremormeasurements fall in range from 0.8252 Hz to 1.5931 Hz (recordedalong all thirty-one stations). Of the thirty-one stations, 18 stationsrecorded a single peak at a fundamental frequency between 0.8252 Hzand 1.5931 Hz (f0). Thirteen stations showed two prominent peakswhere one of peaks falls in the frequency range (f0, or f1) between0.8252 Hz and 1.5931 Hz. The other peak occurs at a frequency thatvaries with station: 0.23 Hz and 0.29 Hz (8 stations), less prominentfrequency 3.9618 Hz (station, 1w) and within range of 27.1119 Hz and25.7738 Hz (4 stations). In general, the results show the presence of twoprominent ranges of frequencies suggesting a three-layer model for theBanni Plains (Figs. 2 and 3 and Table 2).
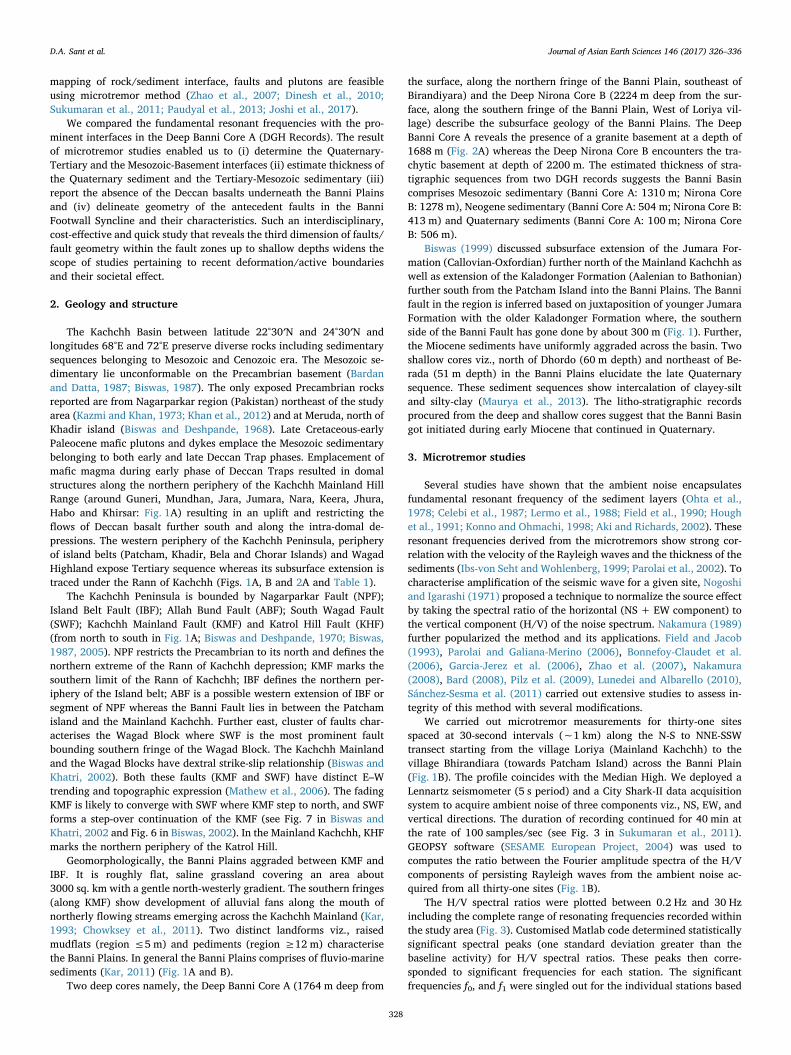
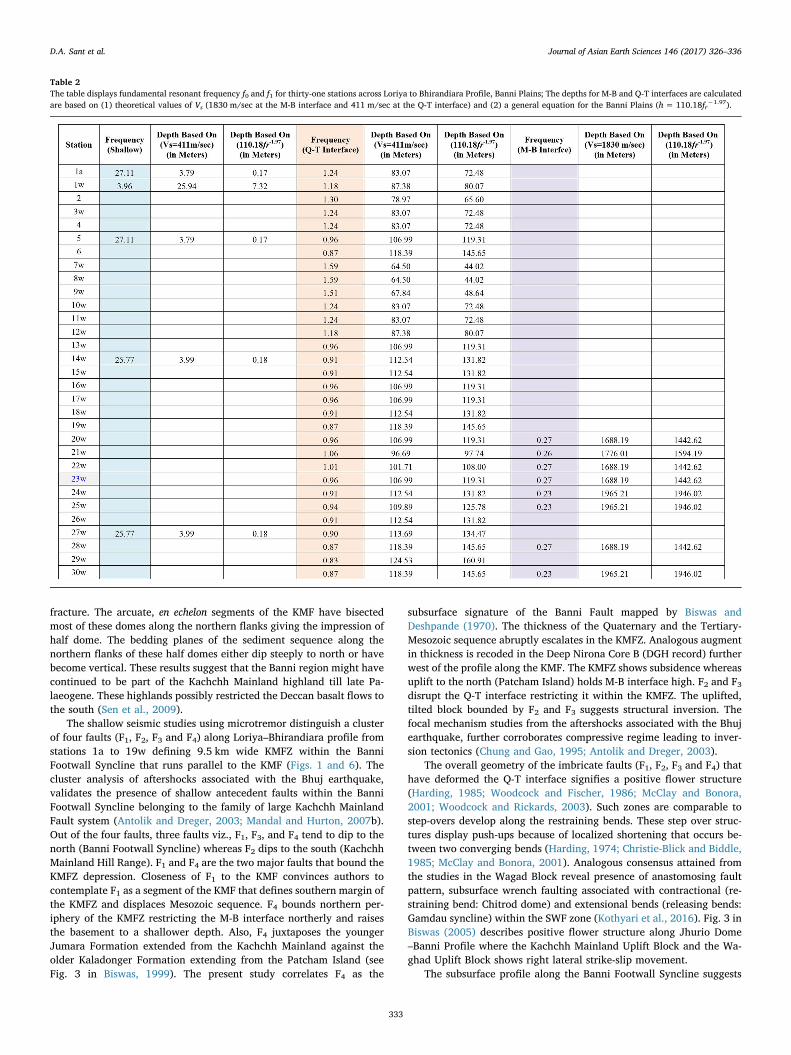
Station 23w (23°37′N and 69°41′12″E) occurs close to Deep BanniCore A (DGH record). Since the depths of the various interfaces areknown for the Deep Banni Core, we used them to correlate the fre-quencies decoded for this station with appropriate interfaces as follows:(i) 0.271 Hz (f0) with the interface between Mesozoic sedimentary(Jurassic sequence) and Basement (Precambrian Granite) at a depth of1688.4 m (referred to as M-B interface) and, (ii) 0.9604 Hz (f1) with theinterface between unconsolidated Quaternary sediment and con-solidated Tertiary sedimentary sequence at a depth of 107.1 m (referredto as Q-T interface) (Fig. 2).
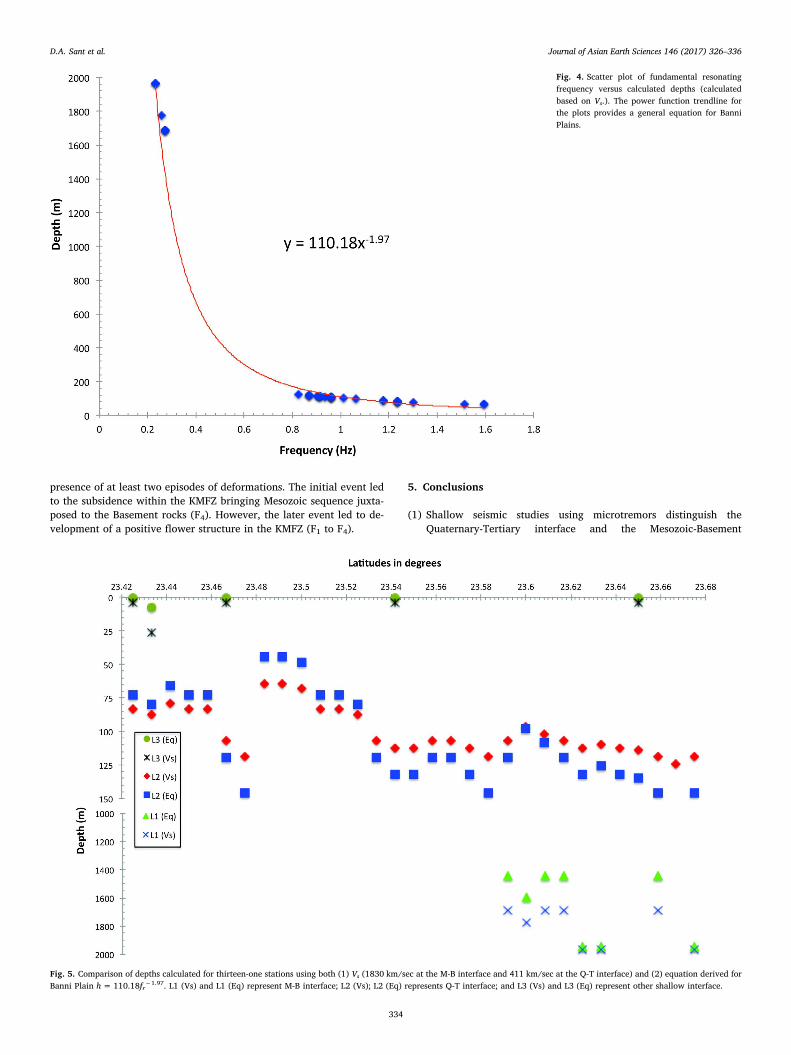
The theoretical values of Vs (1830 m/sec and 411 m/sec) werecalculated for M-B and Q-T interfaces by substituting their depths alongwith their corresponding resonant frequencies in Eq. (2) (Table 2).Assuming that these theoretical values for Vs at the M-B and Q-T in-terfaces are approximately the same for all other stations, we nextcalculated the depths of these two interfaces for these stations by sub-stituting Vs and resonant frequency in Eq. (2). We also arrived at thefollowing alternative general equation to determine depths for anyrheological interfaces, in the Banni Plains using a scatter plot of fre-quency versus theoretical depth (Fig. 4, Table 2).
=
−h f110.18 r1.97 (3)
Thus, we obtained two different methods for calculating the depthsof M-B and Q-T interfaces for different stations. These are compared inTable 2 and Fig. 5.
The signature of the M-B interface is most prominent along eightstations located along the northern extremes of the profile (Fig. 1B;Table 2). The interface marks the contact of Mesozoic sedimentary withthat of Basement rocks at depths between 1442 m and 1965 m. The M-Binterface is rugged and seems to be below the sensitivity limits of theinstruments used in the present survey between stations 1a to 19w
Fig. 2. Comparison of fundamental resonant frequency0.9604 Hz and 0.271 Hz characterising station 23w with Q-T andM-B interface along Deep Banni Core A. The values of frequencyand depth substituted in Eq. (2) provide theoretical velocity Vs atQ-T and M-B interfaces (Table 2).
D.A. Sant et al. Journal of Asian Earth Sciences 146 (2017) 326–336
329
(Figs. 1B and 5). The general thickness of the Tertiary-Mesozoic sedi-mentary sequence inferred along the transect range from 1624 m to1841 m (Figs. 5 and 6 and Table 2).
The Q-T interface is a well-established signature along all thirty-onestations. The Q-T interface correlates with interface where un-consolidated Quaternary sequence of clay-sand overlies semi con-solidated silt and clay units belonging to late Neogene period at depth
ranging from 44 m to 160 m. The Q-T interface shows moderate torolling profile except within the Kachchh Mainland Fault Zone (KMFZ).Generally, the thickness of the Quaternary sediment inferred alongpresent transect is from 35 m to 155 m (Figs. 5 and 6).
Table 1Lithostratigraphy of Kachchh Basin (after Biswas, 1992, 2016).
D.A. Sant et al. Journal of Asian Earth Sciences 146 (2017) 326–336
330
4. Discussion
The frequency record generated through microtremor studies forthirty-one stations along Loriya –Bhirandiara profile successfully
distinguishes lateral extension of both Q-T interface as well as M-Binterface in subsurface (Figs. 5 and 6). The study provides evidence forthe absence of Deccan basalt flows in the subsurface of the Banni Plainswhere the Neogene sequence directly overlie unconformable on the
Fig. 3. Scatter plot of H/V versus fundamental resonant frequency for all stations. The figure on right hand top shows frequency peaks (f0 and f1) at one-sigma significance.
D.A. Sant et al. Journal of Asian Earth Sciences 146 (2017) 326–336
331
Mesozoic sequence. The emplacement of late Cretaceous mafic plutonsat various locations viz., Guneri, Mudhan, Jara, Jumara, Nara, Keera,Jhura, Habbo, and Khirsar (Fig. 1A), have deformed exposed Mesozoicsedimentary in the form of single/multiple domal structures along the
Kachchh Mainland Hill Range (Sen et al., 2016). The geological re-lationship of these domes with KMF clearly suggests the presence ofpre-intrusive arcuate structure through which the magma got em-placed. The latter event further reinstated KMF along pre-existing
Fig. 3. (continued)
D.A. Sant et al. Journal of Asian Earth Sciences 146 (2017) 326–336
332
fracture. The arcuate, en echelon segments of the KMF have bisectedmost of these domes along the northern flanks giving the impression ofhalf dome. The bedding planes of the sediment sequence along thenorthern flanks of these half domes either dip steeply to north or havebecome vertical. These results suggest that the Banni region might havecontinued to be part of the Kachchh Mainland highland till late Pa-laeogene. These highlands possibly restricted the Deccan basalt flows tothe south (Sen et al., 2009).
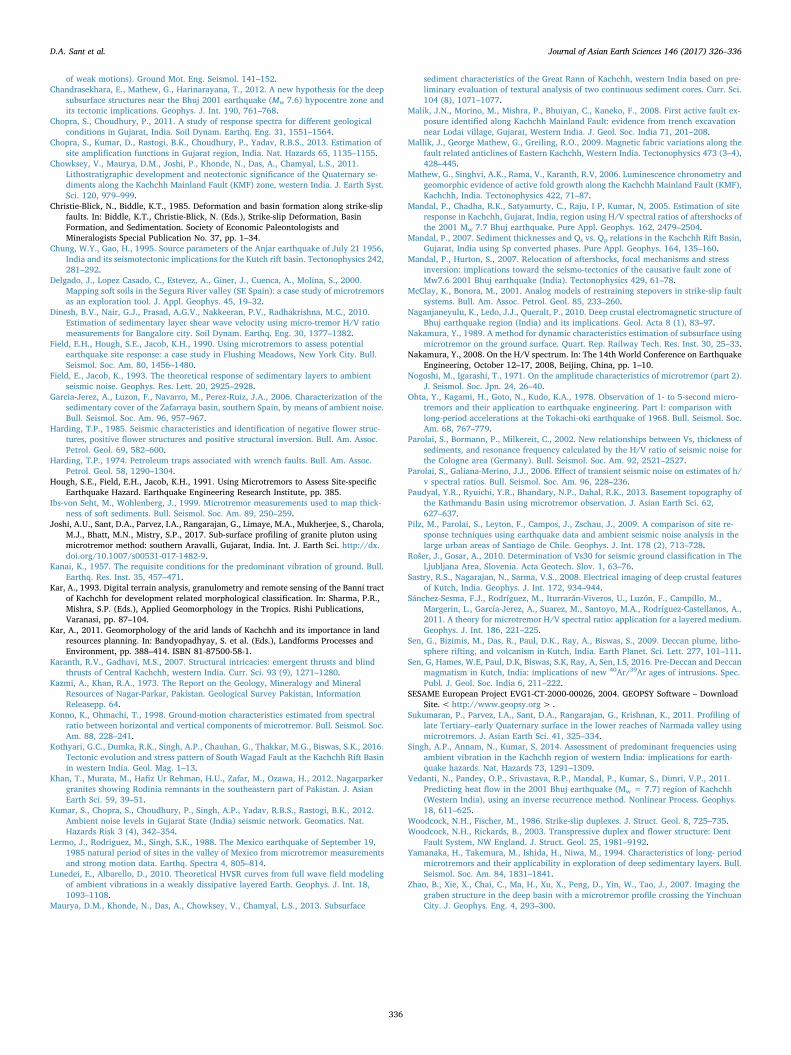
The shallow seismic studies using microtremor distinguish a clusterof four faults (F1, F2, F3 and F4) along Loriya–Bhirandiara profile fromstations 1a to 19w defining 9.5 km wide KMFZ within the BanniFootwall Syncline that runs parallel to the KMF (Figs. 1 and 6). Thecluster analysis of aftershocks associated with the Bhuj earthquake,validates the presence of shallow antecedent faults within the BanniFootwall Syncline belonging to the family of large Kachchh MainlandFault system (Antolik and Dreger, 2003; Mandal and Hurton, 2007b).Out of the four faults, three faults viz., F1, F3, and F4 tend to dip to thenorth (Banni Footwall Syncline) whereas F2 dips to the south (KachchhMainland Hill Range). F1 and F4 are the two major faults that bound theKMFZ depression. Closeness of F1 to the KMF convinces authors tocontemplate F1 as a segment of the KMF that defines southern margin ofthe KMFZ and displaces Mesozoic sequence. F4 bounds northern per-iphery of the KMFZ restricting the M-B interface northerly and raisesthe basement to a shallower depth. Also, F4 juxtaposes the youngerJumara Formation extended from the Kachchh Mainland against theolder Kaladonger Formation extending from the Patcham Island (seeFig. 3 in Biswas, 1999). The present study correlates F4 as the
subsurface signature of the Banni Fault mapped by Biswas andDeshpande (1970). The thickness of the Quaternary and the Tertiary-Mesozoic sequence abruptly escalates in the KMFZ. Analogous augmentin thickness is recoded in the Deep Nirona Core B (DGH record) furtherwest of the profile along the KMF. The KMFZ shows subsidence whereasuplift to the north (Patcham Island) holds M-B interface high. F2 and F3disrupt the Q-T interface restricting it within the KMFZ. The uplifted,tilted block bounded by F2 and F3 suggests structural inversion. Thefocal mechanism studies from the aftershocks associated with the Bhujearthquake, further corroborates compressive regime leading to inver-sion tectonics (Chung and Gao, 1995; Antolik and Dreger, 2003).
The overall geometry of the imbricate faults (F1, F2, F3 and F4) thathave deformed the Q-T interface signifies a positive flower structure(Harding, 1985; Woodcock and Fischer, 1986; McClay and Bonora,2001; Woodcock and Rickards, 2003). Such zones are comparable tostep-overs develop along the restraining bends. These step over struc-tures display push-ups because of localized shortening that occurs be-tween two converging bends (Harding, 1974; Christie-Blick and Biddle,1985; McClay and Bonora, 2001). Analogous consensus attained fromthe studies in the Wagad Block reveal presence of anastomosing faultpattern, subsurface wrench faulting associated with contractional (re-straining bend: Chitrod dome) and extensional bends (releasing bends:Gamdau syncline) within the SWF zone (Kothyari et al., 2016). Fig. 3 inBiswas (2005) describes positive flower structure along Jhurio Dome–Banni Profile where the Kachchh Mainland Uplift Block and the Wa-ghad Uplift Block shows right lateral strike-slip movement.
The subsurface profile along the Banni Footwall Syncline suggests
Table 2The table displays fundamental resonant frequency f0 and f1 for thirty-one stations across Loriya to Bhirandiara Profile, Banni Plains; The depths for M-B and Q-T interfaces are calculatedare based on (1) theoretical values of Vs (1830 m/sec at the M-B interface and 411 m/sec at the Q-T interface) and (2) a general equation for the Banni Plains (h = 110.18fr−1.97).
D.A. Sant et al. Journal of Asian Earth Sciences 146 (2017) 326–336
333
presence of at least two episodes of deformations. The initial event ledto the subsidence within the KMFZ bringing Mesozoic sequence juxta-posed to the Basement rocks (F4). However, the later event led to de-velopment of a positive flower structure in the KMFZ (F1 to F4).
5. Conclusions
(1) Shallow seismic studies using microtremors distinguish theQuaternary-Tertiary interface and the Mesozoic-Basement
Fig. 4. Scatter plot of fundamental resonatingfrequency versus calculated depths (calculatedbased on Vs.). The power function trendline forthe plots provides a general equation for BanniPlains.
Fig. 5. Comparison of depths calculated for thirteen-one stations using both (1) Vs (1830 km/sec at the M-B interface and 411 km/sec at the Q-T interface) and (2) equation derived forBanni Plain h = 110.18fr−1.97. L1 (Vs) and L1 (Eq) represent M-B interface; L2 (Vs); L2 (Eq) represents Q-T interface; and L3 (Vs) and L3 (Eq) represent other shallow interface.
D.A. Sant et al. Journal of Asian Earth Sciences 146 (2017) 326–336
334
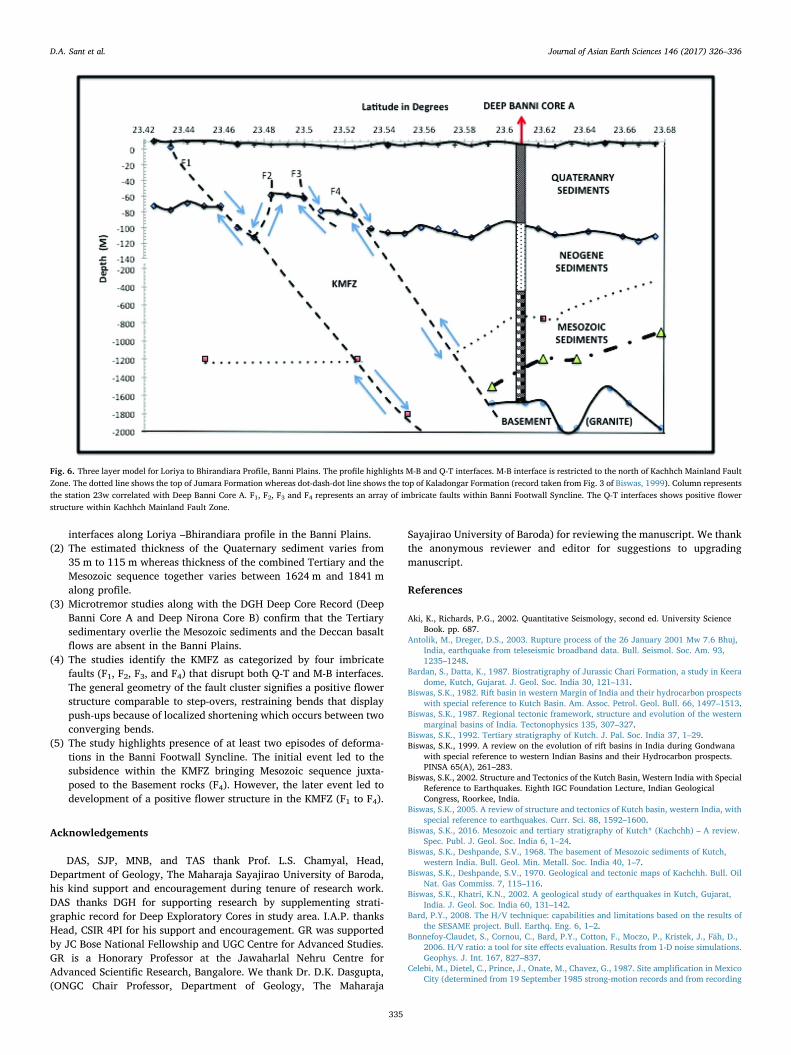
interfaces along Loriya –Bhirandiara profile in the Banni Plains.(2) The estimated thickness of the Quaternary sediment varies from
35 m to 115 m whereas thickness of the combined Tertiary and theMesozoic sequence together varies between 1624 m and 1841 malong profile.
(3) Microtremor studies along with the DGH Deep Core Record (DeepBanni Core A and Deep Nirona Core B) confirm that the Tertiarysedimentary overlie the Mesozoic sediments and the Deccan basaltflows are absent in the Banni Plains.
(4) The studies identify the KMFZ as categorized by four imbricatefaults (F1, F2, F3, and F4) that disrupt both Q-T and M-B interfaces.The general geometry of the fault cluster signifies a positive flowerstructure comparable to step-overs, restraining bends that displaypush-ups because of localized shortening which occurs between twoconverging bends.
(5) The study highlights presence of at least two episodes of deforma-tions in the Banni Footwall Syncline. The initial event led to thesubsidence within the KMFZ bringing Mesozoic sequence juxta-posed to the Basement rocks (F4). However, the later event led todevelopment of a positive flower structure in the KMFZ (F1 to F4).
Acknowledgements
DAS, SJP, MNB, and TAS thank Prof. L.S. Chamyal, Head,Department of Geology, The Maharaja Sayajirao University of Baroda,his kind support and encouragement during tenure of research work.DAS thanks DGH for supporting research by supplementing strati-graphic record for Deep Exploratory Cores in study area. I.A.P. thanksHead, CSIR 4PI for his support and encouragement. GR was supportedby JC Bose National Fellowship and UGC Centre for Advanced Studies.GR is a Honorary Professor at the Jawaharlal Nehru Centre forAdvanced Scientific Research, Bangalore. We thank Dr. D.K. Dasgupta,(ONGC Chair Professor, Department of Geology, The Maharaja
Sayajirao University of Baroda) for reviewing the manuscript. We thankthe anonymous reviewer and editor for suggestions to upgradingmanuscript.
References
Aki, K., Richards, P.G., 2002. Quantitative Seismology, second ed. University ScienceBook. pp. 687.
Antolik, M., Dreger, D.S., 2003. Rupture process of the 26 January 2001 Mw 7.6 Bhuj,India, earthquake from teleseismic broadband data. Bull. Seismol. Soc. Am. 93,1235–1248.
Bardan, S., Datta, K., 1987. Biostratigraphy of Jurassic Chari Formation, a study in Keeradome, Kutch, Gujarat. J. Geol. Soc. India 30, 121–131.
Biswas, S.K., 1982. Rift basin in western Margin of India and their hydrocarbon prospectswith special reference to Kutch Basin. Am. Assoc. Petrol. Geol. Bull. 66, 1497–1513.
Biswas, S.K., 1987. Regional tectonic framework, structure and evolution of the westernmarginal basins of India. Tectonophysics 135, 307–327.
Biswas, S.K., 1992. Tertiary stratigraphy of Kutch. J. Pal. Soc. India 37, 1–29.Biswas, S.K., 1999. A review on the evolution of rift basins in India during Gondwana
with special reference to western Indian Basins and their Hydrocarbon prospects.PINSA 65(A), 261–283.
Biswas, S.K., 2002. Structure and Tectonics of the Kutch Basin, Western India with SpecialReference to Earthquakes. Eighth IGC Foundation Lecture, Indian GeologicalCongress, Roorkee, India.
Biswas, S.K., 2005. A review of structure and tectonics of Kutch basin, western India, withspecial reference to earthquakes. Curr. Sci. 88, 1592–1600.
Biswas, S.K., 2016. Mesozoic and tertiary stratigraphy of Kutch* (Kachchh) – A review.Spec. Publ. J. Geol. Soc. India 6, 1–24.
Biswas, S.K., Deshpande, S.V., 1968. The basement of Mesozoic sediments of Kutch,western India. Bull. Geol. Min. Metall. Soc. India 40, 1–7.
Biswas, S.K., Deshpande, S.V., 1970. Geological and tectonic maps of Kachchh. Bull. OilNat. Gas Commiss. 7, 115–116.
Biswas, S.K., Khatri, K.N., 2002. A geological study of earthquakes in Kutch, Gujarat,India. J. Geol. Soc. India 60, 131–142.
Bard, P.Y., 2008. The H/V technique: capabilities and limitations based on the results ofthe SESAME project. Bull. Earthq. Eng. 6, 1–2.
Bonnefoy-Claudet, S., Cornou, C., Bard, P.Y., Cotton, F., Moczo, P., Kristek, J., Fäh, D.,2006. H/V ratio: a tool for site effects evaluation. Results from 1-D noise simulations.Geophys. J. Int. 167, 827–837.
Celebi, M., Dietel, C., Prince, J., Onate, M., Chavez, G., 1987. Site amplification in MexicoCity (determined from 19 September 1985 strong-motion records and from recording
Fig. 6. Three layer model for Loriya to Bhirandiara Profile, Banni Plains. The profile highlights M-B and Q-T interfaces. M-B interface is restricted to the north of Kachhch Mainland FaultZone. The dotted line shows the top of Jumara Formation whereas dot-dash-dot line shows the top of Kaladongar Formation (record taken from Fig. 3 of Biswas, 1999). Column representsthe station 23w correlated with Deep Banni Core A. F1, F2, F3 and F4 represents an array of imbricate faults within Banni Footwall Syncline. The Q-T interfaces shows positive flowerstructure within Kachhch Mainland Fault Zone.
D.A. Sant et al. Journal of Asian Earth Sciences 146 (2017) 326–336
335
of weak motions). Ground Mot. Eng. Seismol. 141–152.Chandrasekhara, E., Mathew, G., Harinarayana, T., 2012. A new hypothesis for the deep
subsurface structures near the Bhuj 2001 earthquake (Mw 7.6) hypocentre zone andits tectonic implications. Geophys. J. Int. 190, 761–768.
Chopra, S., Choudhury, P., 2011. A study of response spectra for different geologicalconditions in Gujarat, India. Soil Dynam. Earthq. Eng. 31, 1551–1564.
Chopra, S., Kumar, D., Rastogi, B.K., Choudhury, P., Yadav, R.B.S., 2013. Estimation ofsite amplification functions in Gujarat region, India. Nat. Hazards 65, 1135–1155.
Chowksey, V., Maurya, D.M., Joshi, P., Khonde, N., Das, A., Chamyal, L.S., 2011.Lithostratigraphic development and neotectonic significance of the Quaternary se-diments along the Kachchh Mainland Fault (KMF) zone, western India. J. Earth Syst.Sci. 120, 979–999.
Christie-Blick, N., Biddle, K.T., 1985. Deformation and basin formation along strike-slipfaults. In: Biddle, K.T., Christie-Blick, N. (Eds.), Strike-slip Deformation, BasinFormation, and Sedimentation. Society of Economic Paleontologists andMineralogists Special Publication No. 37, pp. 1–34.
Chung, W.Y., Gao, H., 1995. Source parameters of the Anjar earthquake of July 21 1956,India and its seismotectonic implications for the Kutch rift basin. Tectonophysics 242,281–292.
Delgado, J., Lopez Casado, C., Estevez, A., Giner, J., Cuenca, A., Molina, S., 2000.Mapping soft soils in the Segura River valley (SE Spain): a case study of microtremorsas an exploration tool. J. Appl. Geophys. 45, 19–32.
Dinesh, B.V., Nair, G.J., Prasad, A.G.V., Nakkeeran, P.V., Radhakrishna, M.C., 2010.Estimation of sedimentary layer shear wave velocity using micro-tremor H/V ratiomeasurements for Bangalore city. Soil Dynam. Earthq. Eng. 30, 1377–1382.
Field, E.H., Hough, S.E., Jacob, K.H., 1990. Using microtremors to assess potentialearthquake site response: a case study in Flushing Meadows, New York City. Bull.Seismol. Soc. Am. 80, 1456–1480.
Field, E., Jacob, K., 1993. The theoretical response of sedimentary layers to ambientseismic noise. Geophys. Res. Lett. 20, 2925–2928.
Garcia-Jerez, A., Luzon, F., Navarro, M., Perez-Ruiz, J.A., 2006. Characterization of thesedimentary cover of the Zafarraya basin, southern Spain, by means of ambient noise.Bull. Seismol. Soc. Am. 96, 957–967.
Harding, T.P., 1985. Seismic characteristics and identification of negative flower struc-tures, positive flower structures and positive structural inversion. Bull. Am. Assoc.Petrol. Geol. 69, 582–600.
Harding, T.P., 1974. Petroleum traps associated with wrench faults. Bull. Am. Assoc.Petrol. Geol. 58, 1290–1304.
Hough, S.E., Field, E.H., Jacob, K.H., 1991. Using Microtremors to Assess Site-specificEarthquake Hazard. Earthquake Engineering Research Institute, pp. 385.
Ibs-von Seht, M., Wohlenberg, J., 1999. Microtremor measurements used to map thick-ness of soft sediments. Bull. Seismol. Soc. Am. 89, 250–259.
Joshi, A.U., Sant, D.A., Parvez, I.A., Rangarajan, G., Limaye, M.A., Mukherjee, S., Charola,M.J., Bhatt, M.N., Mistry, S.P., 2017. Sub-surface profiling of granite pluton usingmicrotremor method: southern Aravalli, Gujarat, India. Int. J. Earth Sci. http://dx.doi.org/10.1007/s00531-017-1482-9.
Kanai, K., 1957. The requisite conditions for the predominant vibration of ground. Bull.Earthq. Res. Inst. 35, 457–471.
Kar, A., 1993. Digital terrain analysis, granulometry and remote sensing of the Banni tractof Kachchh for development related morphological classification. In: Sharma, P.R.,Mishra, S.P. (Eds.), Applied Geomorphology in the Tropics. Rishi Publications,Varanasi, pp. 87–104.
Kar, A., 2011. Geomorphology of the arid lands of Kachchh and its importance in landresources planning. In: Bandyopadhyay, S. et al. (Eds.), Landforms Processes andEnvironment, pp. 388–414. ISBN 81-87500-58-1.
Karanth, R.V., Gadhavi, M.S., 2007. Structural intricacies: emergent thrusts and blindthrusts of Central Kachchh, western India. Curr. Sci. 93 (9), 1271–1280.
Kazmi, A., Khan, R.A., 1973. The Report on the Geology, Mineralogy and MineralResources of Nagar-Parkar, Pakistan. Geological Survey Pakistan, InformationReleasepp. 64.
Konno, K., Ohmachi, T., 1998. Ground-motion characteristics estimated from spectralratio between horizontal and vertical components of microtremor. Bull. Seismol. Soc.Am. 88, 228–241.
Kothyari, G.C., Dumka, R.K., Singh, A.P., Chauhan, G., Thakkar, M.G., Biswas, S.K., 2016.Tectonic evolution and stress pattern of South Wagad Fault at the Kachchh Rift Basinin western India. Geol. Mag. 1–13.
Khan, T., Murata, M., Hafiz Ur Rehman, H.U., Zafar, M., Ozawa, H., 2012. Nagarparkergranites showing Rodinia remnants in the southeastern part of Pakistan. J. AsianEarth Sci. 59, 39–51.
Kumar, S., Chopra, S., Choudhury, P., Singh, A.P., Yadav, R.B.S., Rastogi, B.K., 2012.Ambient noise levels in Gujarat State (India) seismic network. Geomatics. Nat.Hazards Risk 3 (4), 342–354.
Lermo, J., Rodriguez, M., Singh, S.K., 1988. The Mexico earthquake of September 19,1985 natural period of sites in the valley of Mexico from microtremor measurementsand strong motion data. Earthq. Spectra 4, 805–814.
Lunedei, E., Albarello, D., 2010. Theoretical HVSR curves from full wave field modelingof ambient vibrations in a weakly dissipative layered Earth. Geophys. J. Int. 18,1093–1108.
Maurya, D.M., Khonde, N., Das, A., Chowksey, V., Chamyal, L.S., 2013. Subsurface
sediment characteristics of the Great Rann of Kachchh, western India based on pre-liminary evaluation of textural analysis of two continuous sediment cores. Curr. Sci.104 (8), 1071–1077.
Malik, J.N., Morino, M., Mishra, P., Bhuiyan, C., Kaneko, F., 2008. First active fault ex-posure identified along Kachchh Mainland Fault: evidence from trench excavationnear Lodai village, Gujarat, Western India. J. Geol. Soc. India 71, 201–208.
Mallik, J., George Mathew, G., Greiling, R.O., 2009. Magnetic fabric variations along thefault related anticlines of Eastern Kachchh, Western India. Tectonophysics 473 (3–4),428–445.
Mathew, G., Singhvi, A.K., Rama, V., Karanth, R.V, 2006. Luminescence chronometry andgeomorphic evidence of active fold growth along the Kachchh Mainland Fault (KMF),Kachchh, India. Tectonophysics 422, 71–87.
Mandal, P., Chadha, R.K., Satyamurty, C., Raju, I P, Kumar, N, 2005. Estimation of siteresponse in Kachchh, Gujarat, India, region using H/V spectral ratios of aftershocks ofthe 2001 Mw 7.7 Bhuj earthquake. Pure Appl. Geophys. 162, 2479–2504.
Mandal, P., 2007. Sediment thicknesses and Qs vs. Qp relations in the Kachchh Rift Basin,Gujarat, India using Sp converted phases. Pure Appl. Geophys. 164, 135–160.
Mandal, P., Hurton, S., 2007. Relocation of aftershocks, focal mechanisms and stressinversion: implications toward the seismo-tectonics of the causative fault zone ofMw7.6 2001 Bhuj earthquake (India). Tectonophysics 429, 61–78.
McClay, K., Bonora, M., 2001. Analog models of restraining stepovers in strike-slip faultsystems. Bull. Am. Assoc. Petrol. Geol. 85, 233–260.
Naganjaneyulu, K., Ledo, J.J., Queralt, P., 2010. Deep crustal electromagnetic structure ofBhuj earthquake region (India) and its implications. Geol. Acta 8 (1), 83–97.
Nakamura, Y., 1989. A method for dynamic characteristics estimation of subsurface usingmicrotremor on the ground surface. Quart. Rep. Railway Tech. Res. Inst. 30, 25–33.
Nakamura, Y., 2008. On the H/V spectrum. In: The 14th World Conference on EarthquakeEngineering, October 12–17, 2008, Beijing, China, pp. 1–10.
Nogoshi, M., Igarashi, T., 1971. On the amplitude characteristics of microtremor (part 2).J. Seismol. Soc. Jpn. 24, 26–40.
Ohta, Y., Kagami, H., Goto, N., Kudo, K.A., 1978. Observation of 1- to 5-second micro-tremors and their application to earthquake engineering. Part I: comparison withlong-period accelerations at the Tokachi-oki earthquake of 1968. Bull. Seismol. Soc.Am. 68, 767–779.
Parolai, S., Bormann, P., Milkereit, C., 2002. New relationships between Vs, thickness ofsediments, and resonance frequency calculated by the H/V ratio of seismic noise forthe Cologne area (Germany). Bull. Seismol. Soc. Am. 92, 2521–2527.
Parolai, S., Galiana-Merino, J.J., 2006. Effect of transient seismic noise on estimates of h/v spectral ratios. Bull. Seismol. Soc. Am. 96, 228–236.
Paudyal, Y.R., Ryuichi, Y.R., Bhandary, N.P., Dahal, R.K., 2013. Basement topography ofthe Kathmandu Basin using microtremor observation. J. Asian Earth Sci. 62,627–637.
Pilz, M., Parolai, S., Leyton, F., Campos, J., Zschau, J., 2009. A comparison of site re-sponse techniques using earthquake data and ambient seismic noise analysis in thelarge urban areas of Santiago de Chile. Geophys. J. Int. 178 (2), 713–728.
Rošer, J., Gosar, A., 2010. Determination of Vs30 for seismic ground classification in TheLjubljana Area, Slovenia. Acta Geotech. Slov. 1, 63–76.
Sastry, R.S., Nagarajan, N., Sarma, V.S., 2008. Electrical imaging of deep crustal featuresof Kutch, India. Geophys. J. Int. 172, 934–944.
Sánchez-Sesma, F.J., Rodríguez, M., Iturrarán-Viveros, U., Luzón, F., Campillo, M.,Margerin, L., García-Jerez, A., Suarez, M., Santoyo, M.A., Rodríguez-Castellanos, A.,2011. A theory for microtremor H/V spectral ratio: application for a layered medium.Geophys. J. Int. 186, 221–225.
Sen, G., Bizimis, M., Das, R., Paul, D.K., Ray, A., Biswas, S., 2009. Deccan plume, litho-sphere rifting, and volcanism in Kutch, India. Earth Planet. Sci. Lett. 277, 101–111.
Sen, G, Hames, W.E, Paul, D.K, Biswas, S.K, Ray, A, Sen, I.S, 2016. Pre-Deccan and Deccanmagmatism in Kutch, India: implications of new 40Ar/39Ar ages of intrusions. Spec.Publ. J. Geol. Soc. India 6, 211–222.
SESAME European Project EVG1-CT-2000-00026, 2004. GEOPSY Software – DownloadSite.< http://www.geopsy.org> .
Sukumaran, P., Parvez, I.A., Sant, D.A., Rangarajan, G., Krishnan, K., 2011. Profiling oflate Tertiary–early Quaternary surface in the lower reaches of Narmada valley usingmicrotremors. J. Asian Earth Sci. 41, 325–334.
Singh, A.P., Annam, N., Kumar, S, 2014. Assessment of predominant frequencies usingambient vibration in the Kachchh region of western India: implications for earth-quake hazards. Nat. Hazards 73, 1291–1309.
Vedanti, N., Pandey, O.P., Srivastava, R.P., Mandal, P., Kumar, S., Dimri, V.P., 2011.Predicting heat flow in the 2001 Bhuj earthquake (Mw = 7.7) region of Kachchh(Western India), using an inverse recurrence method. Nonlinear Process. Geophys.18, 611–625.
Woodcock, N.H., Fischer, M., 1986. Strike-slip duplexes. J. Struct. Geol. 8, 725–735.Woodcock, N.H., Rickards, B., 2003. Transpressive duplex and flower structure: Dent
Fault System, NW England. J. Struct. Geol. 25, 1981–9192.Yamanaka, H., Takemura, M., Ishida, H., Niwa, M., 1994. Characteristics of long- period
microtremors and their applicability in exploration of deep sedimentary layers. Bull.Seismol. Soc. Am. 84, 1831–1841.
Zhao, B., Xie, X., Chai, C., Ma, H., Xu, X., Peng, D., Yin, W., Tao, J., 2007. Imaging thegraben structure in the deep basin with a microtremor profile crossing the YinchuanCity. J. Geophys. Eng. 4, 293–300.
D.A. Sant et al. Journal of Asian Earth Sciences 146 (2017) 326–336
336