Embed Size (px)
Citation preview
U.S.–Japan and U.S.–China trade conflict: Export growth, reciprocity, andthe international trading system
Chad P. Bown a,b,1, Rachel McCulloch c,*a Development Economics Research Group, The World Bank, 1818 H Street, NW, MSN MC3-303, Washington, DC 20433, USAb The Brookings Institution, Washington, DC, USAc Department of Economics and International Business School, MS021, Brandeis University, Waltham, MA 02454-9110, USA
1. Introduction
Japan in the 1950s through the 1990s and China since the late 1970s have followed similar – and similarly successful –strategies of promoting economic growth through rapid acquisition of advanced foreign technology and expansion ofmanufactured exports. While other Asian countries have done likewise, in some cases with exports growing as rapidly andfor as long, Japan and China have presented special challenges to the GATT/WTO trading system because their shares ofworld exports have been so large and the associated bilateral trade imbalances with the United States so conspicuous. In bothpolitical and economic terms, these large imbalances seem to contradict the GATT/WTO principle of reciprocity, whichinvolves a balance of market-access concessions across major players in the system.
During their respective periods of rapid export growth, Japan and China each accounted for a major share of total worldexports. As of 2007, China’s share of world merchandise exports had soared to 8.9%, less than Germany’s 9.7% share buttopping the U.S. share of 8.5% as well as Japan’s 5.2%, in each of the latter three cases from a much larger economy (WTO,2008b). Given the sharp drop in global import demand following the 2008 onset of the global financial crisis, China may not
Journal of Asian Economics 20 (2009) 669–687
A R T I C L E I N F O
Article history:
Received 16 June 2009
Received in revised form 29 September 2009
Accepted 29 September 2009
JEL classification:
F13
Keywords:
GATT
WTO
Reciprocity
A B S T R A C T
First Japan and more recently China have pursued export-oriented growth strategies.
While other Asian countries have done likewise, Japan and China are of particular interest
because their economies are so large and the size of the associated bilateral trade
imbalances with the United States so conspicuous. In this paper we focus on U.S. efforts to
restore the reciprocal GATT/WTO market-access bargain in the face of such large
imbalances and the significant spillovers to the international trading system. The paper
highlights similarities and differences in the two cases. We describe U.S. attempts to
reduce the bilateral imbalances through targeted trade policies intended to slow growth of
U.S. imports from these countries or increase growth of U.S. exports to them. We then
examine how these trade policy responses, as well as U.S. efforts to address what were
perceived as underlying causes of the imbalances, influenced the evolution of the
international trading system. Finally, we compare the macroeconomic conditions
associated with the bilateral trade imbalances and their implications for the conclusions
of the two episodes.
� 2009 Elsevier Inc. All rights reserved.
* Corresponding author. Tel.: +1 781 736 2245; fax: +1 781 736 2269.
E-mail addresses: [email protected] (C.P. Bown), [email protected] (R. McCulloch).
URL: http://econ.worldbank.org/staff/cbown, http://www.brandeis.edu/~rmccullo/1 Tel.: +1 202 473 9588.
Contents lists available at ScienceDirect
Journal of Asian Economics
1049-0078/$ – see front matter � 2009 Elsevier Inc. All rights reserved.
doi:10.1016/j.asieco.2009.09.009
surpass Japan’s 1980s peak of around 10%. However, U.S. imports from China in 2008 ($337.8 billion) still exceeded theirlevel in 2007 ($321.5 billion); the 2008 bilateral trade imbalance ($266.3 billion) also exceeded 2007’s record figure,although only by $10 billion.2
Unlike the principles of most favored nation treatment (Article I) and national treatment (Article III), there is no ‘‘Article’’of the GATT 1947 clearly identifying reciprocity as a GATT principle. However, the Articles that govern how countriesrenegotiate concessions – in particular Articles XXVIII and XIX – do contain explicit language about reciprocity, and the GATT/WTO practice of reciprocity has typically resulted in a balance of market-opening concessions across the major players in thesystem.3 But if a large economy such as Japan or China pursues an export-led growth strategy, the resulting increase inexports disturbs the initial ‘‘balance of concessions,’’ i.e., the reciprocal market-access outcome. The major trading partnersthat receive the increased exports may then seek ways to rebalance the bargain.
This paper examines the policy responses of the United States to the rapid growth of imports from Japan and China andthe associated bilateral imbalances. We interpret U.S. trade policy activity vis-a-vis these countries during their respectiveexport growth episodes within the ‘‘reciprocity’’ framework. The basic theory that sustainability of the GATT/WTO bargainrequires large players to maintain a reciprocal balance of market access – i.e., to keep bilateral trade roughly balanced – helpsto explain the bilateral trade policy actions the United States chose to pursue.4
We begin in Section 2 by considering some relevant features of the two episodes, identifying similarities and differences.We then examine how the United States has responded to bilateral imbalances with Japan and China, treating not only the‘‘symptoms’’ (rapid import growth from the relevant partner and slow export growth to that partner) but also the underlyingcauses of the imbalances as perceived by U.S. officials and the U.S. public. In the face of a large bilateral trade deficit, theUnited States has used trade policy to treat the symptoms directly, i.e., to slow the partner’s export expansion into the U.S.market and to speed up U.S. exporters’ expansion into the partner’s market. Section 3 compares U.S. measures intended toslow Japan’s expanding exports to the United States in from1970 through the 1990s and China’s expanding exports since the1990s. Section 4 describes U.S. efforts during the same periods to promote U.S. export expansion into the Japanese andChinese import markets. Sections 3 and 4 also show how U.S. efforts to treat the symptoms may have influenced theevolution of the rules of the international trading system under the GATT and WTO Agreements.
The second half of the paper examines underlying causes of the bilateral trade imbalances as perceived by U.S. officialsand the public, U.S. policy approaches implemented with respect to Japan and China to address some of these causes, and theresulting implications for the rules of the trading system. In Section 5 we examine the bilateral trade imbalances at theindustry level; we focus on U.S. policies based on the premise that such imbalances are due to a competitive advantageunfairly created by foreign (Japanese or Chinese) policies, e.g., industrial policy, explicit and implicit government subsidies,and currency manipulation. In Section 6 we examine the bilateral trade imbalances from a broader macroeconomicperspective. This perspective helps to explain the end of the U.S.–Japanese bilateral imbalance episode in the 1990s, and mayalso speak to the resolution of the U.S.–Chinese bilateral imbalance. Section 7 concludes.
Our purpose in the paper is to describe actions taken by the United States and interpret them in terms of the role played byreciprocity in theories of the GATT/WTO as a self-enforcing agreement. The paper is thus intended to be descriptive andanalytical, not normative. While we characterize certain U.S. policies as ‘‘targeting’’ Japanese or Chinese exports, we do notattempt a systematic evaluation either of the effectiveness of these policies in achieving their objectives or their consistencywith national laws and international agreements. Likewise, we do not attempt a systematic evaluation of the effectiveness ofJapanese and Chinese industrial and macroeconomic policies in promoting economic growth or their conformity withinternational agreements.
2. U.S.–Japan and U.S.–China: Similarities and differences in the two episodes
There are striking parallels and also important differences between the U.S.–Japan frictions that peaked in the mid-1980sand the more recent U.S.–China frictions that began in the late 1990s. The most salient common element is the huge size ofthe bilateral trade imbalances. To many, the imbalances themselves are convincing evidence of unfair trading practices.5 In
2 Morrison (2009), Table 1. These data refer to trade in goods only. Bilateral trade in both directions dropped sharply in early 2009 relative to the
corresponding period in 2008.3 Economic analyses such as Bagwell and Staiger (1999, 2002) treat the GATT/WTO as a self-enforcing agreement and focus on outcomes sustained
through each member’s recognition that any country can seek to amend the initial bargain. From the perspective of sustainability and in light of the
constraints that self-enforcement implies, the rule of reciprocity then feeds back to the conduct of initial negotiations. See discussions in Bown (2002a,b).4 The increased incentive to defect from the initial bargain can result from economic forces that are completely distinct from any political incentive to
raise tariffs, e.g., to assist a preferred domestic industry or to redistribute income. An importing country’s market power increases when it imports more
from a trading partner. Such an increase in market power creates an incentive for the importing country to raise its tariffs and thus improve its own terms of
trade, an economic rationale for increased tariffs that is separate from any political motive. Broda, Limao, & Weinstein (2008) provide recent empirical
evidence that importers’ market power does influence their trade policies; except when constrained by international agreements, the United States has set
higher barriers on imports where it has greater market power.5 Although the link has wide acceptance among U.S. policy makers and the public, economic analysis indicates that bilateral imbalances have no
particular significance in a multi-country world; free trade based on comparative advantage would be expected to produce trade surpluses with some
partners and trade deficits with others. Moreover, as we discuss in Section 6 below, an overall external imbalance cannot exist without a corresponding
imbalance between domestic saving and domestic investment spending.
C.P. Bown, R. McCulloch / Journal of Asian Economics 20 (2009) 669–687670
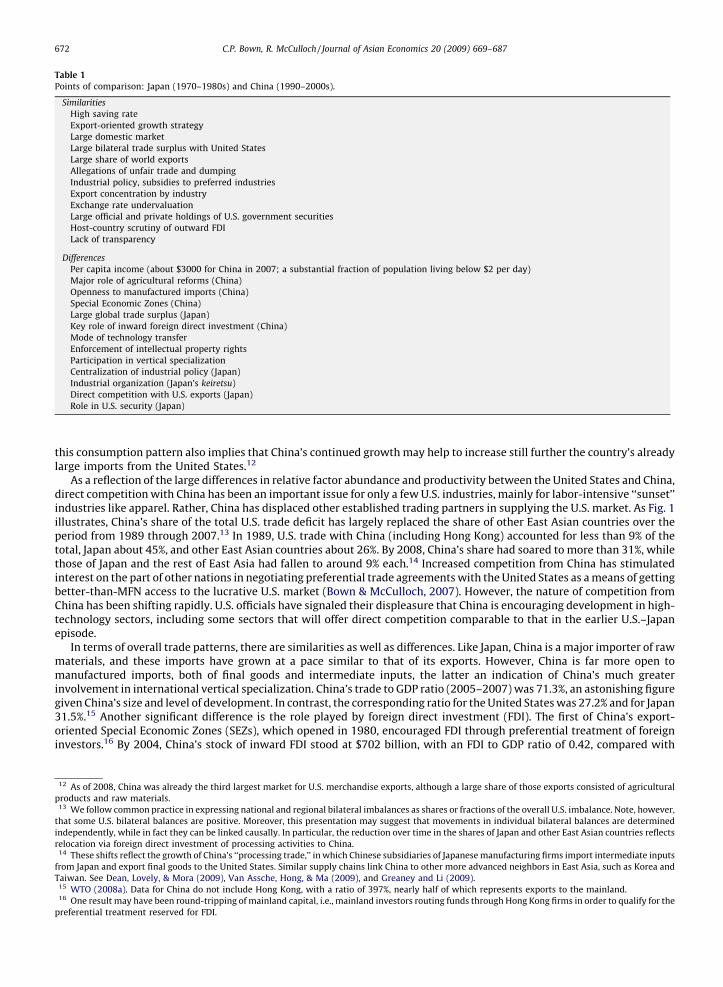
both cases, a large bilateral trade deficit has been linked in the public mind to the steady decline in the share ofmanufacturing in total U.S. employment. Also similar are the allegations that the extraordinary export growth has beensustained by factors such as government subsidies and persistent currency undervaluation, rather than – or at least inaddition to – comparative advantage. Both countries prevented currency appreciation, especially relative to the U.S. dollar,through accumulation of dollar-denominated government securities.6 Both countries also channeled capital to preferredsectors through the banking system, in both cases eventually resulting in an overhang of bad loans that complicated effortsto improve capital-market efficiency.7 Table 1 summarizes many of these comparisons.
One last and very significant common element in the two episodes is the response from the United States as well as otheraffected importing nations: the persistent use of discriminatory strategies to delay adjustment to growth of competingimports from the new sources. These strategies violate the spirit and sometimes also the letter of the GATT/WTO principle ofmost favored nation (MFN) treatment, i.e., nondiscrimination among trading partners. The immediate result has been toprotect established import suppliers as well as domestic producers from the full effects of surging imports from the newsources. The longer term result has been to promote growth of imports from still newer sources. Protection targeted at Japanpromoted export growth first in textiles and later in steel and semiconductors from the ‘‘newly industrializing economies’’(Hong Kong, Singapore, South Korea, and Taiwan); recent U.S. and EU actions in textiles and apparel targeted at China havebenefited Vietnam, India, and Bangladesh, along with U.S. partners in various preferential trade agreements. The UnitedStates also initiated bilateral negotiations with Japan and later China to increase their purchases of U.S. exports. We providemore details on U.S. trade policies toward Japan and China in Sections 3 and 4 below.
In addition, the United States has sought to limit foreign acquisitions of U.S. companies by both nations (as well as others)on ‘‘national security’’ grounds. The Committee on Foreign Investment in the United States (CFIUS) was established in 1975for the purpose of monitoring the effects of inward FDI.8 In 1988, the U.S. Congress gave the President the power to block aforeign takeover based on advice from CFIUS indicating a threat to national security.9 For example, U.S. authorities preventedthe acquisition of Fairchild Semiconductor by Japan’s Fujitsu in 1987 and of Unocal, an oil producer, by the Chinese NationalOffshore Oil Corporation (CNOOC) in 2005. In contrast, greenfield investments, notably foreign-owned auto assembly plants,have been assiduously courted.10
Along with these striking similarities, there are also fundamental differences between the two cases. Most important,Japan was already an established industrial nation in the 1980s. By the mid-1980s, Japan’s per capita income was above thatof most European nations; enrollment rates for secondary and higher education were likewise comparable to those of therichest nations (World Development Report 1986). In contrast, China is still poor, at least in terms of per capita income (around$3000 in 2007), despite a prolonged period of stellar growth performance.11 Thus, it is not surprising that earlier tradefrictions between Japan and the United States focused mainly on direct competition, i.e., Japan’s increasing share of the U.S.market and its displacement of U.S. exports in third-country markets. Moreover, as a wealthy country, Japan consumed manyof the same types of goods and services produced by the United States but imported too few of those from the United States—at least in the view of U.S. producers and policy makers.
Given China’s much lower per capita income, only a small fraction of Chinese consumers can yet afford the products thatrepresent U.S. comparative advantage, i.e., those supplied by intellectual-property-intensive industries (e.g., films, music,software, pharmaceuticals), when sold at prices that reflect full enforcement of U.S. intellectual property rights. Moreover,Chinese consumers’ desire to acquire such goods at affordable prices feeds the demand for pirated and copycat goodsproduced locally, thereby adding to U.S. complaints regarding China’s lax enforcement of intellectual property rights. But
6 Corden (1981) advances an analysis of exchange-rate protection of the entire tradables sector through currency undervaluation. Unlike the use of trade
policies to favor exports or restrict competing imports selectively, undervaluation does not create distortions within the tradables sector as a whole. Recent
empirical research shows that currency undervaluation is associated with export surges and higher GDP growth, especially for developing countries
(Freund & Pierola, 2008; Rodrik, 2008). Rodrik suggests that an undervalued exchange rate may offset an informational market failure that would otherwise
prevent firms in developing countries from identifying potential export products or markets. However, Staiger and Sykes (2008) use a theoretical analysis to
show that the effects of exchange-rate undervaluation are complex and depend on a variety of underlying conditions; in some cases, exchange-rate
intervention would have no real effects. Given the complex relationship between exchange-rate practices and trade volumes, Staiger and Sykes are doubtful
that China’s exchange-rate policies constitute a violation of its WTO commitments, i.e., by acting as an across-the-board export subsidy.7 According to Saxonhouse (1983), Japan’s industrial policy in the 1970s should be viewed as a means to overcome distortions resulting from the
country’s poorly functioning capital market. China uses industrial policy tools including taxation, indicative lending, and input pricing to provide firms with
incentives intended to achieve desired modifications in the composition of economic activity (Bergsten, Freeman, Lardy, & Mitchell, 2008; USITC, 2007,
Chapter 2). China categorizes its industries as ‘‘encouraged,’’ ‘‘restricted,’’ or ‘‘to be eliminated,’’ with these classifications subject to frequent revision, and
structures incentives accordingly. Although an ongoing goal of Chinese industrial policy is to facilitate movement from a planned to a market economy,
firms owned entirely or in part by government units continue to play a major role in the economy.8 Following World War II, U.S. participation in FDI was almost entirely as a home base for outward investments. Inward FDI began to take off in the 1970s,
and by the mid-1980s the United States had become the world’s largest host to inward FDI. CFIUS, an interagency committee chaired by the Treasury
Secretary, was intended to address public and official concern regarding foreign control over U.S. economic activity.9 Congress passed the Exon-Florio amendment (§721 of the Defense Production Act) during a period of growing concern about foreign acquisitions of U.S.
assets.10 The 1981 U.S. VERs limiting auto imports from Japan encouraged Japanese companies to move their factories to the United States. Between 1984 and
1987, seven Japanese companies built U.S. assembly plants. These were financed in large part by the abnormally high profits resulting from the VERs. By
increasing supply to the U.S. market, the Japanese investments reduced profits of both Japanese and U.S. auto makers (De Melo & Tarr, 1991).11 Per capita income and other national averages mask large differences between the coastal areas and the interior provinces in the north and west of the
country.
C.P. Bown, R. McCulloch / Journal of Asian Economics 20 (2009) 669–687 671
this consumption pattern also implies that China’s continued growth may help to increase still further the country’s alreadylarge imports from the United States.12
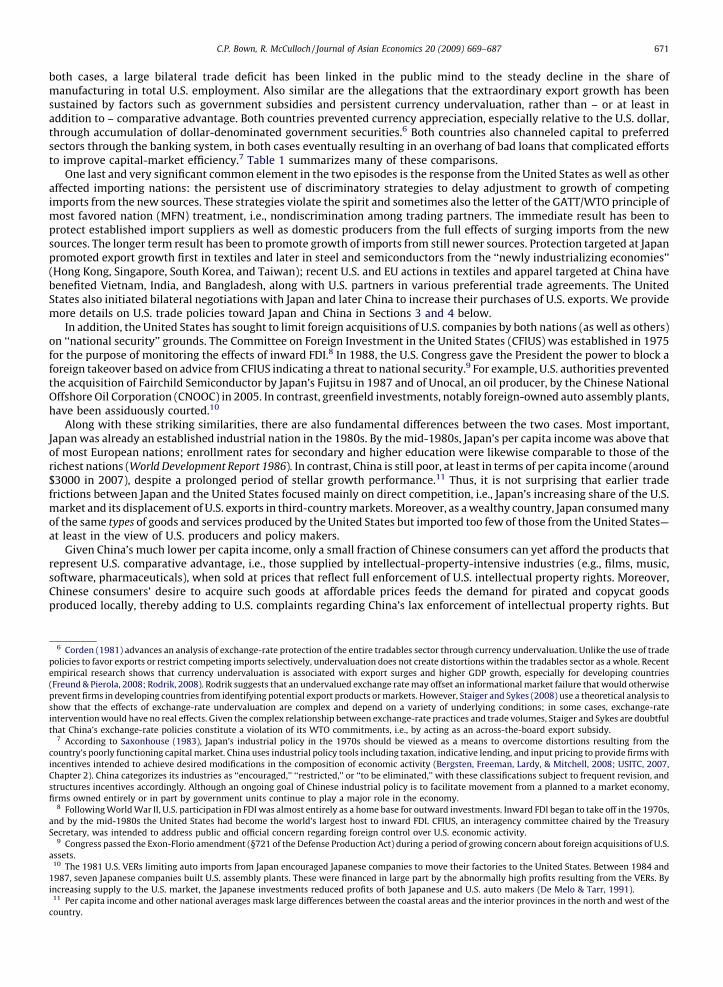
As a reflection of the large differences in relative factor abundance and productivity between the United States and China,direct competition with China has been an important issue for only a few U.S. industries, mainly for labor-intensive ‘‘sunset’’industries like apparel. Rather, China has displaced other established trading partners in supplying the U.S. market. As Fig. 1illustrates, China’s share of the total U.S. trade deficit has largely replaced the share of other East Asian countries over theperiod from 1989 through 2007.13 In 1989, U.S. trade with China (including Hong Kong) accounted for less than 9% of thetotal, Japan about 45%, and other East Asian countries about 26%. By 2008, China’s share had soared to more than 31%, whilethose of Japan and the rest of East Asia had fallen to around 9% each.14 Increased competition from China has stimulatedinterest on the part of other nations in negotiating preferential trade agreements with the United States as a means of gettingbetter-than-MFN access to the lucrative U.S. market (Bown & McCulloch, 2007). However, the nature of competition fromChina has been shifting rapidly. U.S. officials have signaled their displeasure that China is encouraging development in high-technology sectors, including some sectors that will offer direct competition comparable to that in the earlier U.S.–Japanepisode.
In terms of overall trade patterns, there are similarities as well as differences. Like Japan, China is a major importer of rawmaterials, and these imports have grown at a pace similar to that of its exports. However, China is far more open tomanufactured imports, both of final goods and intermediate inputs, the latter an indication of China’s much greaterinvolvement in international vertical specialization. China’s trade to GDP ratio (2005–2007) was 71.3%, an astonishing figuregiven China’s size and level of development. In contrast, the corresponding ratio for the United States was 27.2% and for Japan31.5%.15 Another significant difference is the role played by foreign direct investment (FDI). The first of China’s export-oriented Special Economic Zones (SEZs), which opened in 1980, encouraged FDI through preferential treatment of foreigninvestors.16 By 2004, China’s stock of inward FDI stood at $702 billion, with an FDI to GDP ratio of 0.42, compared with
Table 1
Points of comparison: Japan (1970–1980s) and China (1990–2000s).
Similarities
High saving rate
Export-oriented growth strategy
Large domestic market
Large bilateral trade surplus with United States
Large share of world exports
Allegations of unfair trade and dumping
Industrial policy, subsidies to preferred industries
Export concentration by industry
Exchange rate undervaluation
Large official and private holdings of U.S. government securities
Host-country scrutiny of outward FDI
Lack of transparency
Differences
Per capita income (about $3000 for China in 2007; a substantial fraction of population living below $2 per day)
Major role of agricultural reforms (China)
Openness to manufactured imports (China)
Special Economic Zones (China)
Large global trade surplus (Japan)
Key role of inward foreign direct investment (China)
Mode of technology transfer
Enforcement of intellectual property rights
Participation in vertical specialization
Centralization of industrial policy (Japan)
Industrial organization (Japan’s keiretsu)
Direct competition with U.S. exports (Japan)
Role in U.S. security (Japan)
12 As of 2008, China was already the third largest market for U.S. merchandise exports, although a large share of those exports consisted of agricultural
products and raw materials.13 We follow common practice in expressing national and regional bilateral imbalances as shares or fractions of the overall U.S. imbalance. Note, however,
that some U.S. bilateral balances are positive. Moreover, this presentation may suggest that movements in individual bilateral balances are determined
independently, while in fact they can be linked causally. In particular, the reduction over time in the shares of Japan and other East Asian countries reflects
relocation via foreign direct investment of processing activities to China.14 These shifts reflect the growth of China’s ‘‘processing trade,’’ in which Chinese subsidiaries of Japanese manufacturing firms import intermediate inputs
from Japan and export final goods to the United States. Similar supply chains link China to other more advanced neighbors in East Asia, such as Korea and
Taiwan. See Dean, Lovely, & Mora (2009), Van Assche, Hong, & Ma (2009), and Greaney and Li (2009).15 WTO (2008a). Data for China do not include Hong Kong, with a ratio of 397%, nearly half of which represents exports to the mainland.16 One result may have been round-tripping of mainland capital, i.e., mainland investors routing funds through Hong Kong firms in order to qualify for the
preferential treatment reserved for FDI.
C.P. Bown, R. McCulloch / Journal of Asian Economics 20 (2009) 669–687672
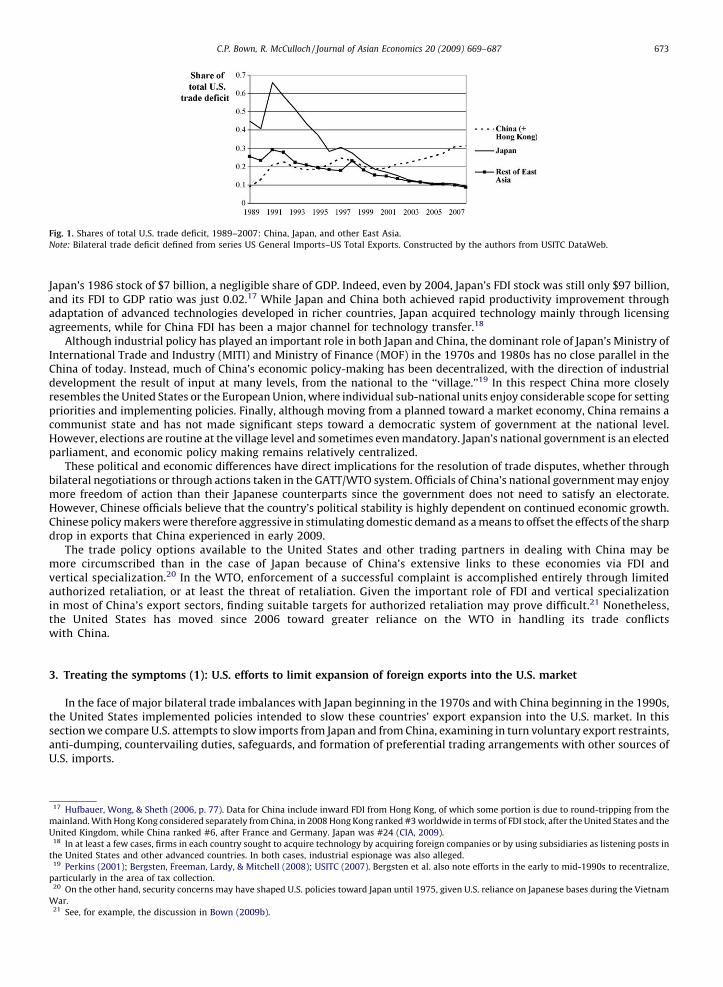
Japan’s 1986 stock of $7 billion, a negligible share of GDP. Indeed, even by 2004, Japan’s FDI stock was still only $97 billion,and its FDI to GDP ratio was just 0.02.17 While Japan and China both achieved rapid productivity improvement throughadaptation of advanced technologies developed in richer countries, Japan acquired technology mainly through licensingagreements, while for China FDI has been a major channel for technology transfer.18
Although industrial policy has played an important role in both Japan and China, the dominant role of Japan’s Ministry ofInternational Trade and Industry (MITI) and Ministry of Finance (MOF) in the 1970s and 1980s has no close parallel in theChina of today. Instead, much of China’s economic policy-making has been decentralized, with the direction of industrialdevelopment the result of input at many levels, from the national to the ‘‘village.’’19 In this respect China more closelyresembles the United States or the European Union, where individual sub-national units enjoy considerable scope for settingpriorities and implementing policies. Finally, although moving from a planned toward a market economy, China remains acommunist state and has not made significant steps toward a democratic system of government at the national level.However, elections are routine at the village level and sometimes even mandatory. Japan’s national government is an electedparliament, and economic policy making remains relatively centralized.
These political and economic differences have direct implications for the resolution of trade disputes, whether throughbilateral negotiations or through actions taken in the GATT/WTO system. Officials of China’s national government may enjoymore freedom of action than their Japanese counterparts since the government does not need to satisfy an electorate.However, Chinese officials believe that the country’s political stability is highly dependent on continued economic growth.Chinese policy makers were therefore aggressive in stimulating domestic demand as a means to offset the effects of the sharpdrop in exports that China experienced in early 2009.
The trade policy options available to the United States and other trading partners in dealing with China may bemore circumscribed than in the case of Japan because of China’s extensive links to these economies via FDI andvertical specialization.20 In the WTO, enforcement of a successful complaint is accomplished entirely through limitedauthorized retaliation, or at least the threat of retaliation. Given the important role of FDI and vertical specializationin most of China’s export sectors, finding suitable targets for authorized retaliation may prove difficult.21 Nonetheless,the United States has moved since 2006 toward greater reliance on the WTO in handling its trade conflictswith China.
3. Treating the symptoms (1): U.S. efforts to limit expansion of foreign exports into the U.S. market
In the face of major bilateral trade imbalances with Japan beginning in the 1970s and with China beginning in the 1990s,the United States implemented policies intended to slow these countries’ export expansion into the U.S. market. In thissection we compare U.S. attempts to slow imports from Japan and from China, examining in turn voluntary export restraints,anti-dumping, countervailing duties, safeguards, and formation of preferential trading arrangements with other sources ofU.S. imports.
Fig. 1. Shares of total U.S. trade deficit, 1989–2007: China, Japan, and other East Asia.
Note: Bilateral trade deficit defined from series US General Imports–US Total Exports. Constructed by the authors from USITC DataWeb.
17 Hufbauer, Wong, & Sheth (2006, p. 77). Data for China include inward FDI from Hong Kong, of which some portion is due to round-tripping from the
mainland. With Hong Kong considered separately from China, in 2008 Hong Kong ranked #3 worldwide in terms of FDI stock, after the United States and the
United Kingdom, while China ranked #6, after France and Germany. Japan was #24 (CIA, 2009).18 In at least a few cases, firms in each country sought to acquire technology by acquiring foreign companies or by using subsidiaries as listening posts in
the United States and other advanced countries. In both cases, industrial espionage was also alleged.19 Perkins (2001); Bergsten, Freeman, Lardy, & Mitchell (2008); USITC (2007). Bergsten et al. also note efforts in the early to mid-1990s to recentralize,
particularly in the area of tax collection.20 On the other hand, security concerns may have shaped U.S. policies toward Japan until 1975, given U.S. reliance on Japanese bases during the Vietnam
War.21 See, for example, the discussion in Bown (2009b).
C.P. Bown, R. McCulloch / Journal of Asian Economics 20 (2009) 669–687 673
3.1. Voluntary export restraints (VERs)
3.1.1. Japan: VER proliferation across industries, 1960–1990s
Japan was admitted to the GATT in 1955 with strong support from the United States. Fourteen other GATT contractingparties, fearing import competition based on low Japanese wages, initially limited their liberalization commitments byinvoking Article XXXV. However, problems soon arose in the U.S.–Japan relationship over Japanese textile exports.By 1957, the first orderly marketing agreements (OMAs) between the United States and Japan had been signed.22
These agreements represented a U.S. decision to forego GATT-sanctioned remedies in favor of a non-MFN, bilateralapproach to handling trade frictions and set a pattern replicated for additional products and importing and exportingcountries in subsequent decades in the form of negotiated ‘‘voluntary’’ export restraints. The market incentives createdby the initial discriminatory form of protection eventually produced the worldwide Multi-Fibre Arrangement (MFA) in1974. The MFA placed bilateral quantitative limits on textile and apparel trade between most pairs of importing andexporting countries until it was phased out as part of the package negotiated in the Uruguay Round of GATT negotiationsconcluded in 1994.
In part due to the ‘‘success’’ of agreements on textiles (which promoted growth of exports from other, not yet restricted,countries in Asia and elsewhere) and as Japan made a full recovery from the effects of World War II, Japan’s exports and U.S.–Japan trade frictions shifted toward a succession of more sophisticated products. For many products, rapid export growthresulted first in a U.S. safeguard (Section 201) petition requesting relief from surging imports for an injured domesticindustry and then a negotiated VER. Table 2 gives examples of U.S. safeguard investigations resulting in such OMAs duringthe 1970s and 1980s in Japanese export products such as footwear, steel, television receivers, and even autos.
As Table 2 indicates, the safeguard law was not the only import-restricting policy that allowed U.S. industries to seek newtrade barriers and that ultimately resulted in bilaterally negotiated VERs limiting Japanese exports to the United States.23
U.S. anti-dumping policy, which we discuss in more detail in Section 3.2 below, also resulted in a number of Japanese VERs.The most important of these was the semiconductor VER, negotiated after a pair of anti-dumping petitions filed in 1985.24 A1993 petition under the U.S. anti-dumping law also resulted in a VER over photo paper between the U.S. firm Kodak and theJapanese firm Fuji; this dispute was a precursor to a high-profile WTO dispute between Kodak and Fuji. A 1996 anti-dumpingpetition over sodium azide resulted in a negotiated VER with three Japanese chemical-producing firms.
3.1.2. China: VERs in textiles and apparel, 2005–2008
The terms of China’s 2001 accession to the WTO granted WTO members a number of China-specific transitional safeguardmechanisms designed to cope with an anticipated increase in exports from China, and especially textile and apparel exportsfollowing the scheduled end of the MFA. For the 2001–2008 period, a U.S. safeguard program covering only U.S. imports oftextile and apparel products from China was administered by the Office of Textiles and Apparel (OTEXA) in the U.S.Department of Commerce.
Facing a surge in imports of textile and apparel products from China following the expiration of the MFA at the end of2004, the United States negotiated a voluntary export restraint with China for the 2005–2008 period. 25 Although the rules ofthe WTO preclude use of VERs, as we describe in more detail below, this policy tool nonetheless returned, as before in thecontext of one major player seeking to slow the export expansion of another major trading partner.26
22 The United States had already negotiated similar restrictions on Japanese textile exports prior to World War II.23 During this period, the United States also negotiated VERs with Japan and other exporters outside the legal frameworks of the safeguard and anti-
dumping laws. For example, in 1986 the United States negotiated a VER with Japan and other countries over machine tools under section 232 of the Trade
Expansion Act of 1962. Section 232 authorizes the President to implement new import restrictions on grounds of national security (Hufbauer & Elliott, 1994,
p. 91). Voluntary restraints on flat-rolled steel products had been negotiated in 1985 (Hufbauer & Elliott, 1994, 103).24 In July 1985, Micron filed an anti-dumping petition over 64K DRAMS that led to the imposition of duties on imports from Japanese firms Hitachi,
Mitsubishi, NEC, and Oki Electric. The duty order on 64K DRAMS remained in place until 1993. In October 1985, U.S. firms Advanced Micro Devices, Intel, and
National Semiconductor filed a separate petition over EPROMS, and in December 1985 the U.S. government self-initiated a petition over 256K and above
DRAMS. The petitions led to negotiated VERs (‘‘Suspension Agreements’’ in the language of U.S. anti-dumping) by which Japanese firms Fujitsu, Hitachi, NEC,
and Tokyo Shibaura (Toshiba) agreed to limit exports to the U.S. market. The 256K DRAM suspension agreement was revoked in 1991, but the EPROM
agreement was not formally revoked until 1997. Additional detailed data on each of these anti-dumping cases has been compiled in Bown (2009a).25 On the economic effects of the end of the MFA, see Brambilla, Khandelwal, & Schott (in press) and Barrows and Harrigan (2009).26 Under the self-enforcing WTO system, the United States and China were free to choose this option as long as no country filed a complaint. The WTO’s
Trade Policy Review of China (WTO 2006, pp. 60–61) describes the VER settlements between the U.S. and China (as well as a similar arrangement between
the EC and China): ‘‘On 10 June 2005, China and the European Communities signed a Memorandum of Understanding (MOU), placing export restraints on
ten categories of Chinese textiles and clothing exports to the EC until 31 December 2007. The growth rates of these exports would be limited to between 8%
and 12.5% per year. As a quid pro quo, the EC agreed to end its ongoing safeguard investigation on these products and to refrain from adopting measures as
permitted under Article 242 of China’s WTO Working Party Report, in categories not covered by the MOU. . .Under the Interim Measures, MOFCOM compiles
a "Catalogue of Textiles Products Subject to Interim Export Administration’’, including exports of textiles and clothing subject to restrictions imposed by
countries or regions unilaterally, and textile exports subject to temporary quantitative control under bilateral agreements. For each product listed in the
Catalogue, the quota is partly assigned through a bidding system, and partly allocated based on the exporter’s share in China’s total export value for the
previous year in the respective categories.. . .A similar agreement was signed with the United States on 8 November 2005. The restraints on certain
categories of textiles and clothing exports from China are effective from 1 January 2006 to 31 December 2008; exports of these products are expected to
increase by 8–10% in 2006, by 13% in 2007, and 17% in 2008.’’
C.P. Bown, R. McCulloch / Journal of Asian Economics 20 (2009) 669–687674
3.2. U.S. anti-dumping against Japan and China
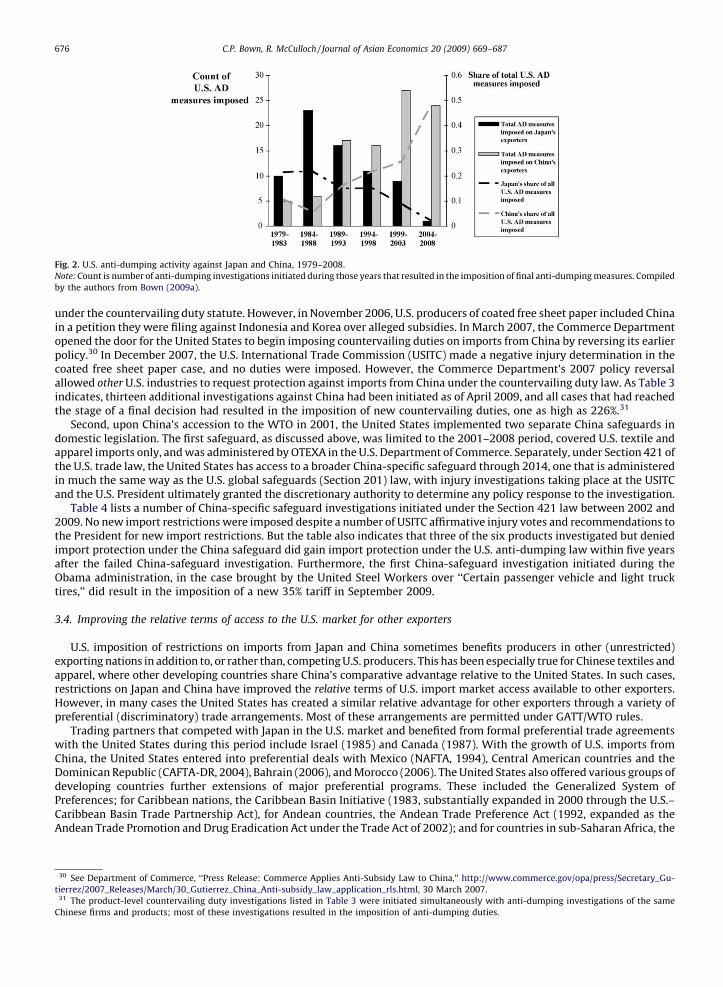
Anti-dumping (AD) is a second policy tool the United States has used to slow the expansion of Japanese and Chineseexports into the U.S. market. Japan and China together faced a major share of all U.S. anti-dumping activity over the 1979–2008 period; 25% of all U.S. anti-dumping investigations targeted either Japanese or Chinese producers, and 33% of all U.S.anti-dumping measures imposed targeted either Japanese or Chinese exports.27
However, as Fig. 2 indicates, U.S. use of anti-dumping over 1979–2008 is really made up of two distinct episodes: the rise(1979–1988) and fall (1989–2008) of anti-dumping use to manage the growth of Japan’s exports to the United States, andincreased use of anti-dumping (since 1989) to manage the growth of China’s exports to the United States. In Fig. 2, the barsindicate the number of U.S. anti-dumping measures imposed during various sub-periods between 1979 and 2008; the linesindicate the respective shares of Japan and China in total U.S. AD measures imposed in each of the sub-periods. U.S. targetingof Japan with anti-dumping reached its peak in the 1984–1988 period, when the United States imposed more than 20 newimport restrictions on Japanese exporting firms; measures restricting imports from Japan alone accounted for more than 20%of all new AD measures the United States imposed during that period.
After 1988, U.S. use of AD against Japan slowly declined, whether measured by the number of new measures imposed onJapanese exporters or by Japan’s share in total U.S. use of anti-dumping. At the same time, U.S. use of anti-dumping shifteddramatically toward imposition of new restrictions on imports from China. During the second half of the period (1999–2008), the United States imposed more than 50 new anti-dumping import restrictions on Chinese exporters, and theserestrictions were roughly a third of all anti-dumping measures the United States imposed during this period.
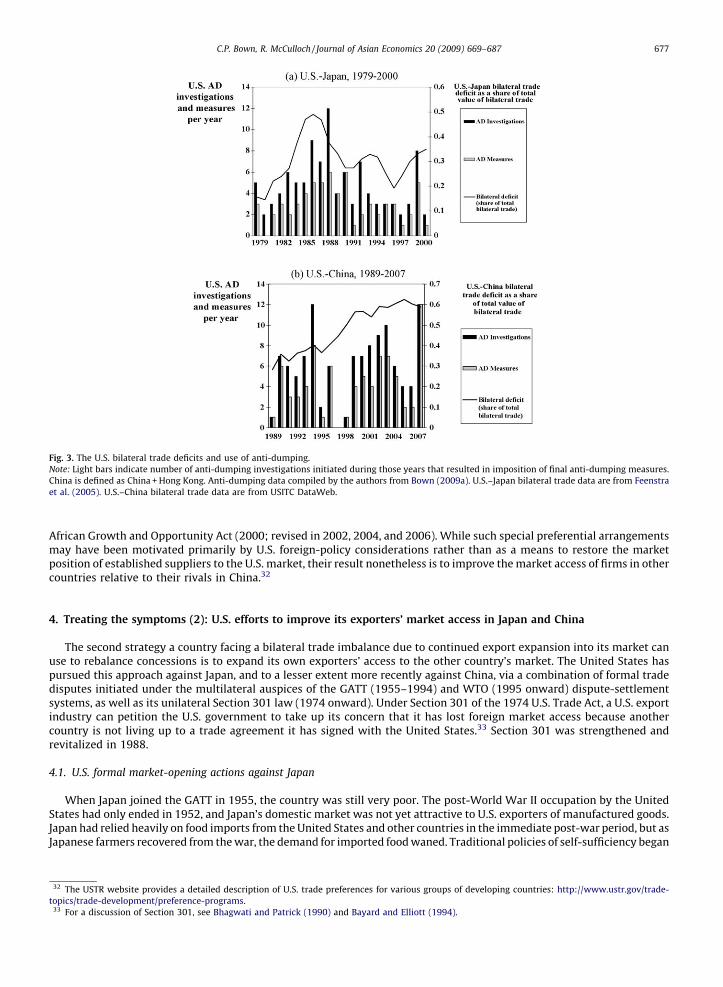
Fig. 3 illustrates the time pattern of U.S. anti-dumping investigations and measures imposed against Japan (panel a, 1979–2000) and against China (panel b, 1989–2007) as compared with the growth of the U.S. bilateral trade deficit (normalized as ashare of the total value of bilateral trade) with each country. The data show a strong positive correlation over time betweenthe size of the bilateral trade deficit and the frequency with which the partner has become a target of U.S. anti-dumping tolimit the trading partner’s export expansion into the U.S. market. However, while U.S. anti-dumping activity against Japanbegan to decline as the yen rose in value relative to the U.S. dollar in 1985, anti-dumping activity against China continuedunabated even after the yuan began to appreciate relative to the dollar in 2005.
3.3. Countervailing duties and country-specific safeguards
In the context of the differential response in U.S. treatment of Japan and China, two additional policies of contingentprotection are countervailing duties and country-specific safeguards.
First, under the U.S. countervailing duty or ‘‘anti-subsidy’’ law, officials can target imports believed to have been unfairlysubsidized by foreign governments; such imports are then subject to an import tax equal in size to the foreign subsidy.Interestingly, the United States never used its countervailing duty law to address imports from Japan over the entire 1979–2008 period.28
From 1979 until 2006, the United States also never used its countervailing duty law to impose new import restrictions onChina.29 A 1984 policy decision of the U.S. Department of Commerce explicitly exempted China cases from consideration
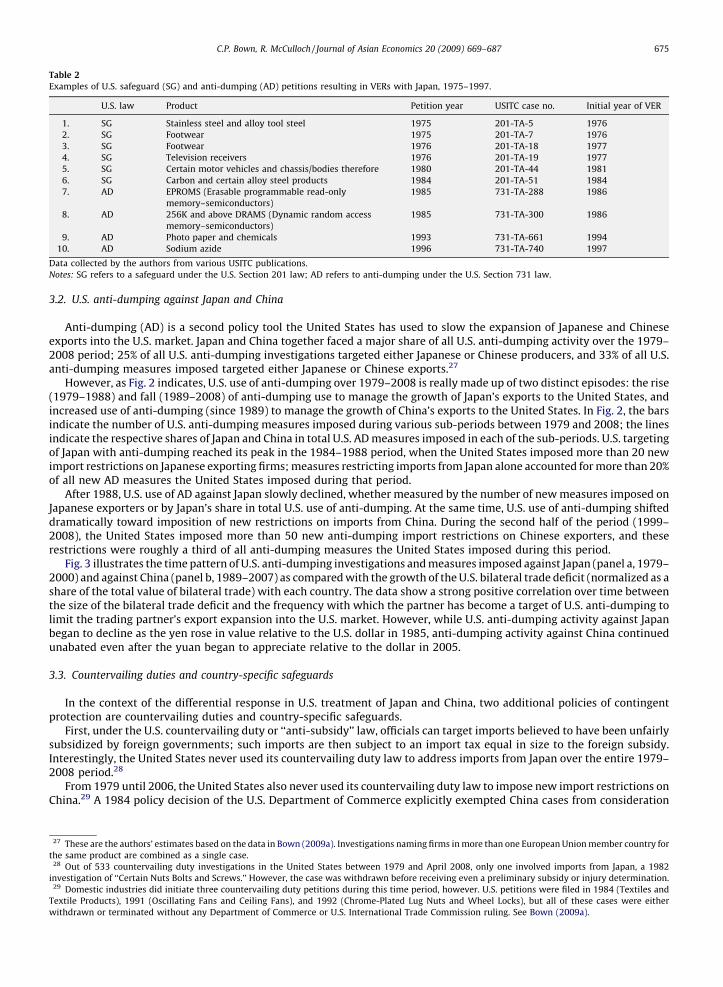
Table 2
Examples of U.S. safeguard (SG) and anti-dumping (AD) petitions resulting in VERs with Japan, 1975–1997.
U.S. law Product Petition year USITC case no. Initial year of VER
1. SG Stainless steel and alloy tool steel 1975 201-TA-5 1976
2. SG Footwear 1975 201-TA-7 1976
3. SG Footwear 1976 201-TA-18 1977
4. SG Television receivers 1976 201-TA-19 1977
5. SG Certain motor vehicles and chassis/bodies therefore 1980 201-TA-44 1981
6. SG Carbon and certain alloy steel products 1984 201-TA-51 1984
7. AD EPROMS (Erasable programmable read-only
memory–semiconductors)
1985 731-TA-288 1986
8. AD 256K and above DRAMS (Dynamic random access
memory–semiconductors)
1985 731-TA-300 1986
9. AD Photo paper and chemicals 1993 731-TA-661 1994
10. AD Sodium azide 1996 731-TA-740 1997
Data collected by the authors from various USITC publications.
Notes: SG refers to a safeguard under the U.S. Section 201 law; AD refers to anti-dumping under the U.S. Section 731 law.
27 These are the authors’ estimates based on the data in Bown (2009a). Investigations naming firms in more than one European Union member country for
the same product are combined as a single case.28 Out of 533 countervailing duty investigations in the United States between 1979 and April 2008, only one involved imports from Japan, a 1982
investigation of ‘‘Certain Nuts Bolts and Screws.’’ However, the case was withdrawn before receiving even a preliminary subsidy or injury determination.29 Domestic industries did initiate three countervailing duty petitions during this time period, however. U.S. petitions were filed in 1984 (Textiles and
Textile Products), 1991 (Oscillating Fans and Ceiling Fans), and 1992 (Chrome-Plated Lug Nuts and Wheel Locks), but all of these cases were either
withdrawn or terminated without any Department of Commerce or U.S. International Trade Commission ruling. See Bown (2009a).
C.P. Bown, R. McCulloch / Journal of Asian Economics 20 (2009) 669–687 675
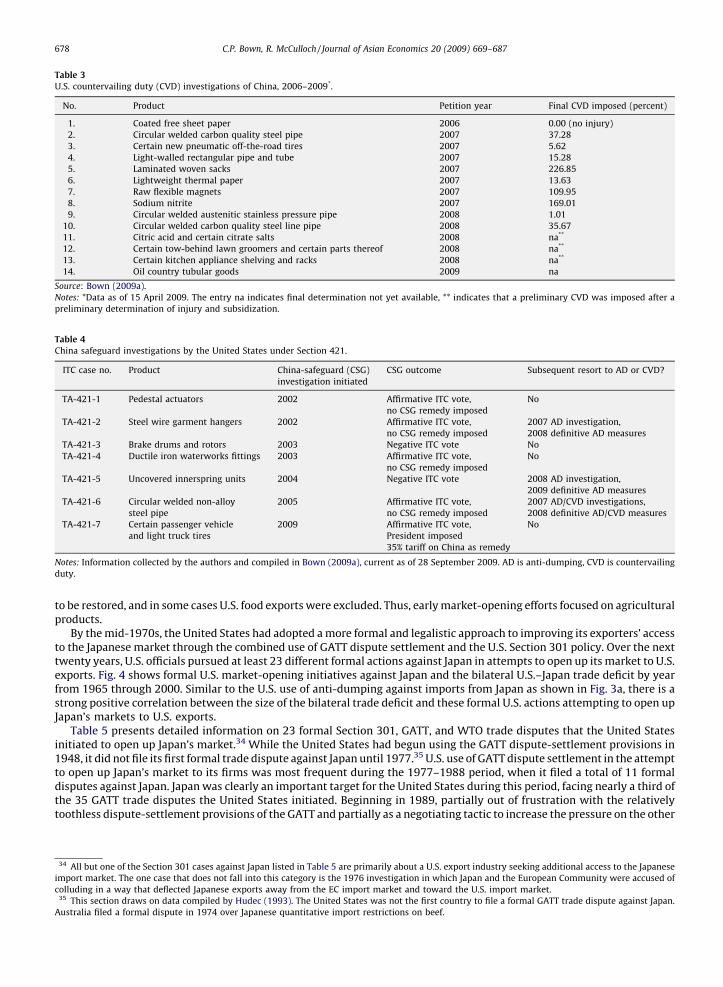
under the countervailing duty statute. However, in November 2006, U.S. producers of coated free sheet paper included Chinain a petition they were filing against Indonesia and Korea over alleged subsidies. In March 2007, the Commerce Departmentopened the door for the United States to begin imposing countervailing duties on imports from China by reversing its earlierpolicy.30 In December 2007, the U.S. International Trade Commission (USITC) made a negative injury determination in thecoated free sheet paper case, and no duties were imposed. However, the Commerce Department’s 2007 policy reversalallowed other U.S. industries to request protection against imports from China under the countervailing duty law. As Table 3indicates, thirteen additional investigations against China had been initiated as of April 2009, and all cases that had reachedthe stage of a final decision had resulted in the imposition of new countervailing duties, one as high as 226%.31
Second, upon China’s accession to the WTO in 2001, the United States implemented two separate China safeguards indomestic legislation. The first safeguard, as discussed above, was limited to the 2001–2008 period, covered U.S. textile andapparel imports only, and was administered by OTEXA in the U.S. Department of Commerce. Separately, under Section 421 ofthe U.S. trade law, the United States has access to a broader China-specific safeguard through 2014, one that is administeredin much the same way as the U.S. global safeguards (Section 201) law, with injury investigations taking place at the USITCand the U.S. President ultimately granted the discretionary authority to determine any policy response to the investigation.
Table 4 lists a number of China-specific safeguard investigations initiated under the Section 421 law between 2002 and2009. No new import restrictions were imposed despite a number of USITC affirmative injury votes and recommendations tothe President for new import restrictions. But the table also indicates that three of the six products investigated but deniedimport protection under the China safeguard did gain import protection under the U.S. anti-dumping law within five yearsafter the failed China-safeguard investigation. Furthermore, the first China-safeguard investigation initiated during theObama administration, in the case brought by the United Steel Workers over ‘‘Certain passenger vehicle and light trucktires,’’ did result in the imposition of a new 35% tariff in September 2009.
3.4. Improving the relative terms of access to the U.S. market for other exporters
U.S. imposition of restrictions on imports from Japan and China sometimes benefits producers in other (unrestricted)exporting nations in addition to, or rather than, competing U.S. producers. This has been especially true for Chinese textiles andapparel, where other developing countries share China’s comparative advantage relative to the United States. In such cases,restrictions on Japan and China have improved the relative terms of U.S. import market access available to other exporters.However, in many cases the United States has created a similar relative advantage for other exporters through a variety ofpreferential (discriminatory) trade arrangements. Most of these arrangements are permitted under GATT/WTO rules.
Trading partners that competed with Japan in the U.S. market and benefited from formal preferential trade agreementswith the United States during this period include Israel (1985) and Canada (1987). With the growth of U.S. imports fromChina, the United States entered into preferential deals with Mexico (NAFTA, 1994), Central American countries and theDominican Republic (CAFTA-DR, 2004), Bahrain (2006), and Morocco (2006). The United States also offered various groups ofdeveloping countries further extensions of major preferential programs. These included the Generalized System ofPreferences; for Caribbean nations, the Caribbean Basin Initiative (1983, substantially expanded in 2000 through the U.S.–Caribbean Basin Trade Partnership Act), for Andean countries, the Andean Trade Preference Act (1992, expanded as theAndean Trade Promotion and Drug Eradication Act under the Trade Act of 2002); and for countries in sub-Saharan Africa, the
Fig. 2. U.S. anti-dumping activity against Japan and China, 1979–2008.
Note: Count is number of anti-dumping investigations initiated during those years that resulted in the imposition of final anti-dumping measures. Compiled
by the authors from Bown (2009a).
30 See Department of Commerce, ‘‘Press Release: Commerce Applies Anti-Subsidy Law to China,’’ http://www.commerce.gov/opa/press/Secretary_Gu-
tierrez/2007_Releases/March/30_Gutierrez_China_Anti-subsidy_law_application_rls.html, 30 March 2007.31 The product-level countervailing duty investigations listed in Table 3 were initiated simultaneously with anti-dumping investigations of the same
Chinese firms and products; most of these investigations resulted in the imposition of anti-dumping duties.
C.P. Bown, R. McCulloch / Journal of Asian Economics 20 (2009) 669–687676
African Growth and Opportunity Act (2000; revised in 2002, 2004, and 2006). While such special preferential arrangementsmay have been motivated primarily by U.S. foreign-policy considerations rather than as a means to restore the marketposition of established suppliers to the U.S. market, their result nonetheless is to improve the market access of firms in othercountries relative to their rivals in China.32
4. Treating the symptoms (2): U.S. efforts to improve its exporters’ market access in Japan and China
The second strategy a country facing a bilateral trade imbalance due to continued export expansion into its market canuse to rebalance concessions is to expand its own exporters’ access to the other country’s market. The United States haspursued this approach against Japan, and to a lesser extent more recently against China, via a combination of formal tradedisputes initiated under the multilateral auspices of the GATT (1955–1994) and WTO (1995 onward) dispute-settlementsystems, as well as its unilateral Section 301 law (1974 onward). Under Section 301 of the 1974 U.S. Trade Act, a U.S. exportindustry can petition the U.S. government to take up its concern that it has lost foreign market access because anothercountry is not living up to a trade agreement it has signed with the United States.33 Section 301 was strengthened andrevitalized in 1988.
4.1. U.S. formal market-opening actions against Japan
When Japan joined the GATT in 1955, the country was still very poor. The post-World War II occupation by the UnitedStates had only ended in 1952, and Japan’s domestic market was not yet attractive to U.S. exporters of manufactured goods.Japan had relied heavily on food imports from the United States and other countries in the immediate post-war period, but asJapanese farmers recovered from the war, the demand for imported food waned. Traditional policies of self-sufficiency began
Fig. 3. The U.S. bilateral trade deficits and use of anti-dumping.
Note: Light bars indicate number of anti-dumping investigations initiated during those years that resulted in imposition of final anti-dumping measures.
China is defined as China + Hong Kong. Anti-dumping data compiled by the authors from Bown (2009a). U.S.–Japan bilateral trade data are from Feenstra
et al. (2005). U.S.–China bilateral trade data are from USITC DataWeb.
32 The USTR website provides a detailed description of U.S. trade preferences for various groups of developing countries: http://www.ustr.gov/trade-
topics/trade-development/preference-programs.33 For a discussion of Section 301, see Bhagwati and Patrick (1990) and Bayard and Elliott (1994).
C.P. Bown, R. McCulloch / Journal of Asian Economics 20 (2009) 669–687 677
to be restored, and in some cases U.S. food exports were excluded. Thus, early market-opening efforts focused on agriculturalproducts.
By the mid-1970s, the United States had adopted a more formal and legalistic approach to improving its exporters’ accessto the Japanese market through the combined use of GATT dispute settlement and the U.S. Section 301 policy. Over the nexttwenty years, U.S. officials pursued at least 23 different formal actions against Japan in attempts to open up its market to U.S.exports. Fig. 4 shows formal U.S. market-opening initiatives against Japan and the bilateral U.S.–Japan trade deficit by yearfrom 1965 through 2000. Similar to the U.S. use of anti-dumping against imports from Japan as shown in Fig. 3a, there is astrong positive correlation between the size of the bilateral trade deficit and these formal U.S. actions attempting to open upJapan’s markets to U.S. exports.
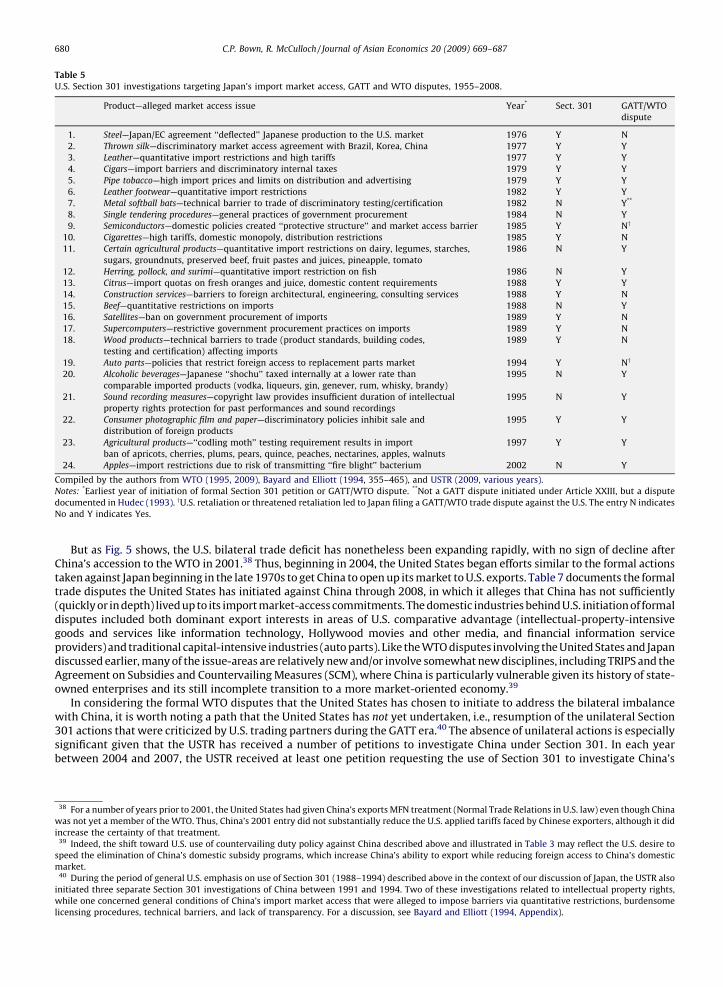
Table 5 presents detailed information on 23 formal Section 301, GATT, and WTO trade disputes that the United Statesinitiated to open up Japan’s market.34 While the United States had begun using the GATT dispute-settlement provisions in1948, it did not file its first formal trade dispute against Japan until 1977.35 U.S. use of GATT dispute settlement in the attemptto open up Japan’s market to its firms was most frequent during the 1977–1988 period, when it filed a total of 11 formaldisputes against Japan. Japan was clearly an important target for the United States during this period, facing nearly a third ofthe 35 GATT trade disputes the United States initiated. Beginning in 1989, partially out of frustration with the relativelytoothless dispute-settlement provisions of the GATT and partially as a negotiating tactic to increase the pressure on the other
Table 3
U.S. countervailing duty (CVD) investigations of China, 2006–2009*.
No. Product Petition year Final CVD imposed (percent)
1. Coated free sheet paper 2006 0.00 (no injury)
2. Circular welded carbon quality steel pipe 2007 37.28
3. Certain new pneumatic off-the-road tires 2007 5.62
4. Light-walled rectangular pipe and tube 2007 15.28
5. Laminated woven sacks 2007 226.85
6. Lightweight thermal paper 2007 13.63
7. Raw flexible magnets 2007 109.95
8. Sodium nitrite 2007 169.01
9. Circular welded austenitic stainless pressure pipe 2008 1.01
10. Circular welded carbon quality steel line pipe 2008 35.67
11. Citric acid and certain citrate salts 2008 na**
12. Certain tow-behind lawn groomers and certain parts thereof 2008 na**
13. Certain kitchen appliance shelving and racks 2008 na**
14. Oil country tubular goods 2009 na
Source: Bown (2009a).
Notes: *Data as of 15 April 2009. The entry na indicates final determination not yet available, ** indicates that a preliminary CVD was imposed after a
preliminary determination of injury and subsidization.
Table 4
China safeguard investigations by the United States under Section 421.
ITC case no. Product China-safeguard (CSG)
investigation initiated
CSG outcome Subsequent resort to AD or CVD?
TA-421-1 Pedestal actuators 2002 Affirmative ITC vote,
no CSG remedy imposed
No
TA-421-2 Steel wire garment hangers 2002 Affirmative ITC vote,
no CSG remedy imposed
2007 AD investigation,
2008 definitive AD measures
TA-421-3 Brake drums and rotors 2003 Negative ITC vote No
TA-421-4 Ductile iron waterworks fittings 2003 Affirmative ITC vote,
no CSG remedy imposed
No
TA-421-5 Uncovered innerspring units 2004 Negative ITC vote 2008 AD investigation,
2009 definitive AD measures
TA-421-6 Circular welded non-alloy
steel pipe
2005 Affirmative ITC vote,
no CSG remedy imposed
2007 AD/CVD investigations,
2008 definitive AD/CVD measures
TA-421-7 Certain passenger vehicle
and light truck tires
2009 Affirmative ITC vote,
President imposed
35% tariff on China as remedy
No
Notes: Information collected by the authors and compiled in Bown (2009a), current as of 28 September 2009. AD is anti-dumping, CVD is countervailing
duty.
34 All but one of the Section 301 cases against Japan listed in Table 5 are primarily about a U.S. export industry seeking additional access to the Japanese
import market. The one case that does not fall into this category is the 1976 investigation in which Japan and the European Community were accused of
colluding in a way that deflected Japanese exports away from the EC import market and toward the U.S. import market.35 This section draws on data compiled by Hudec (1993). The United States was not the first country to file a formal GATT trade dispute against Japan.
Australia filed a formal dispute in 1974 over Japanese quantitative import restrictions on beef.
C.P. Bown, R. McCulloch / Journal of Asian Economics 20 (2009) 669–687678
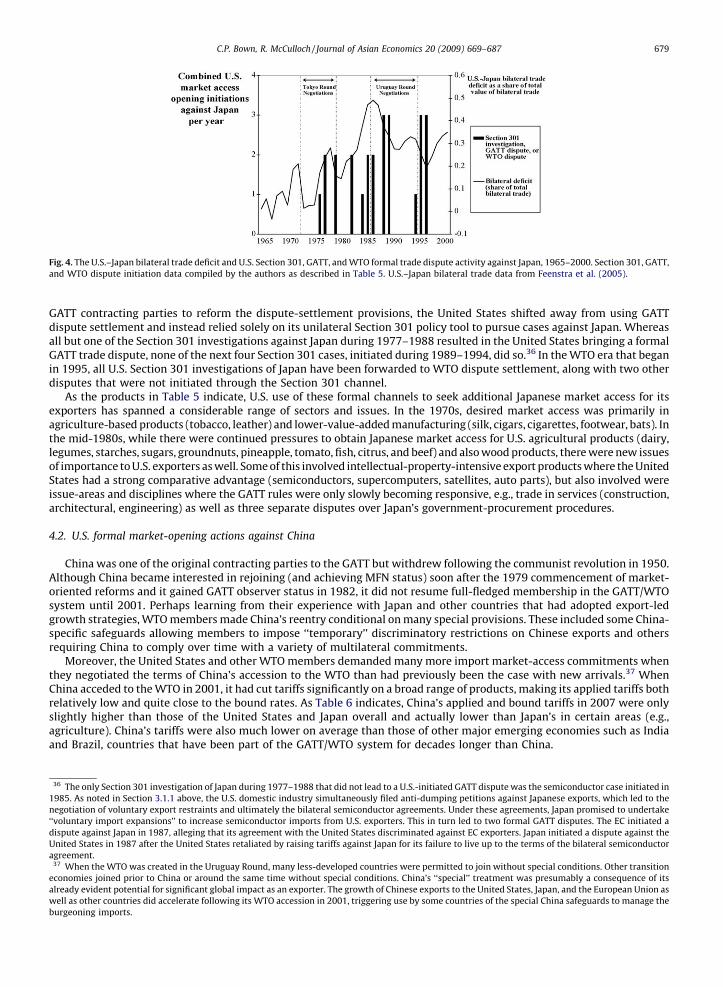
GATT contracting parties to reform the dispute-settlement provisions, the United States shifted away from using GATTdispute settlement and instead relied solely on its unilateral Section 301 policy tool to pursue cases against Japan. Whereasall but one of the Section 301 investigations against Japan during 1977–1988 resulted in the United States bringing a formalGATT trade dispute, none of the next four Section 301 cases, initiated during 1989–1994, did so.36 In the WTO era that beganin 1995, all U.S. Section 301 investigations of Japan have been forwarded to WTO dispute settlement, along with two otherdisputes that were not initiated through the Section 301 channel.
As the products in Table 5 indicate, U.S. use of these formal channels to seek additional Japanese market access for itsexporters has spanned a considerable range of sectors and issues. In the 1970s, desired market access was primarily inagriculture-based products (tobacco, leather) and lower-value-added manufacturing (silk, cigars, cigarettes, footwear, bats). Inthe mid-1980s, while there were continued pressures to obtain Japanese market access for U.S. agricultural products (dairy,legumes, starches, sugars, groundnuts, pineapple, tomato, fish, citrus, and beef) and also wood products, there were new issuesof importance to U.S. exporters as well. Some of this involved intellectual-property-intensive export products where the UnitedStates had a strong comparative advantage (semiconductors, supercomputers, satellites, auto parts), but also involved wereissue-areas and disciplines where the GATT rules were only slowly becoming responsive, e.g., trade in services (construction,architectural, engineering) as well as three separate disputes over Japan’s government-procurement procedures.
4.2. U.S. formal market-opening actions against China
China was one of the original contracting parties to the GATT but withdrew following the communist revolution in 1950.Although China became interested in rejoining (and achieving MFN status) soon after the 1979 commencement of market-oriented reforms and it gained GATT observer status in 1982, it did not resume full-fledged membership in the GATT/WTOsystem until 2001. Perhaps learning from their experience with Japan and other countries that had adopted export-ledgrowth strategies, WTO members made China’s reentry conditional on many special provisions. These included some China-specific safeguards allowing members to impose ‘‘temporary’’ discriminatory restrictions on Chinese exports and othersrequiring China to comply over time with a variety of multilateral commitments.
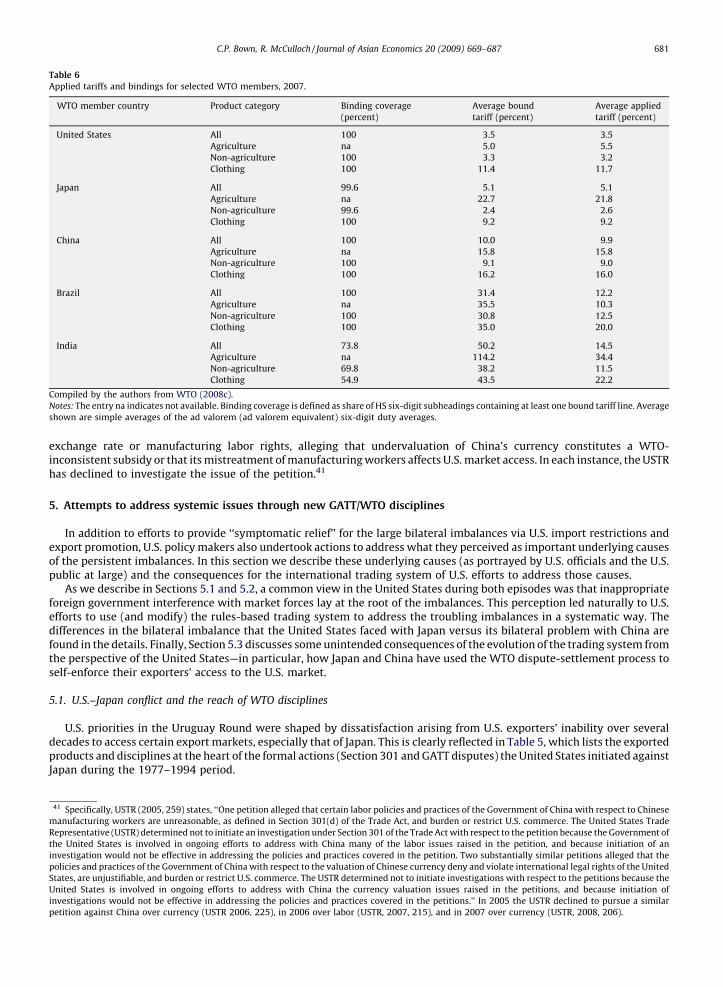
Moreover, the United States and other WTO members demanded many more import market-access commitments whenthey negotiated the terms of China’s accession to the WTO than had previously been the case with new arrivals.37 WhenChina acceded to the WTO in 2001, it had cut tariffs significantly on a broad range of products, making its applied tariffs bothrelatively low and quite close to the bound rates. As Table 6 indicates, China’s applied and bound tariffs in 2007 were onlyslightly higher than those of the United States and Japan overall and actually lower than Japan’s in certain areas (e.g.,agriculture). China’s tariffs were also much lower on average than those of other major emerging economies such as Indiaand Brazil, countries that have been part of the GATT/WTO system for decades longer than China.
Fig. 4. The U.S.–Japan bilateral trade deficit and U.S. Section 301, GATT, and WTO formal trade dispute activity against Japan, 1965–2000. Section 301, GATT,
and WTO dispute initiation data compiled by the authors as described in Table 5. U.S.–Japan bilateral trade data from Feenstra et al. (2005).
36 The only Section 301 investigation of Japan during 1977–1988 that did not lead to a U.S.-initiated GATT dispute was the semiconductor case initiated in
1985. As noted in Section 3.1.1 above, the U.S. domestic industry simultaneously filed anti-dumping petitions against Japanese exports, which led to the
negotiation of voluntary export restraints and ultimately the bilateral semiconductor agreements. Under these agreements, Japan promised to undertake
‘‘voluntary import expansions’’ to increase semiconductor imports from U.S. exporters. This in turn led to two formal GATT disputes. The EC initiated a
dispute against Japan in 1987, alleging that its agreement with the United States discriminated against EC exporters. Japan initiated a dispute against the
United States in 1987 after the United States retaliated by raising tariffs against Japan for its failure to live up to the terms of the bilateral semiconductor
agreement.37 When the WTO was created in the Uruguay Round, many less-developed countries were permitted to join without special conditions. Other transition
economies joined prior to China or around the same time without special conditions. China’s ‘‘special’’ treatment was presumably a consequence of its
already evident potential for significant global impact as an exporter. The growth of Chinese exports to the United States, Japan, and the European Union as
well as other countries did accelerate following its WTO accession in 2001, triggering use by some countries of the special China safeguards to manage the
burgeoning imports.
C.P. Bown, R. McCulloch / Journal of Asian Economics 20 (2009) 669–687 679
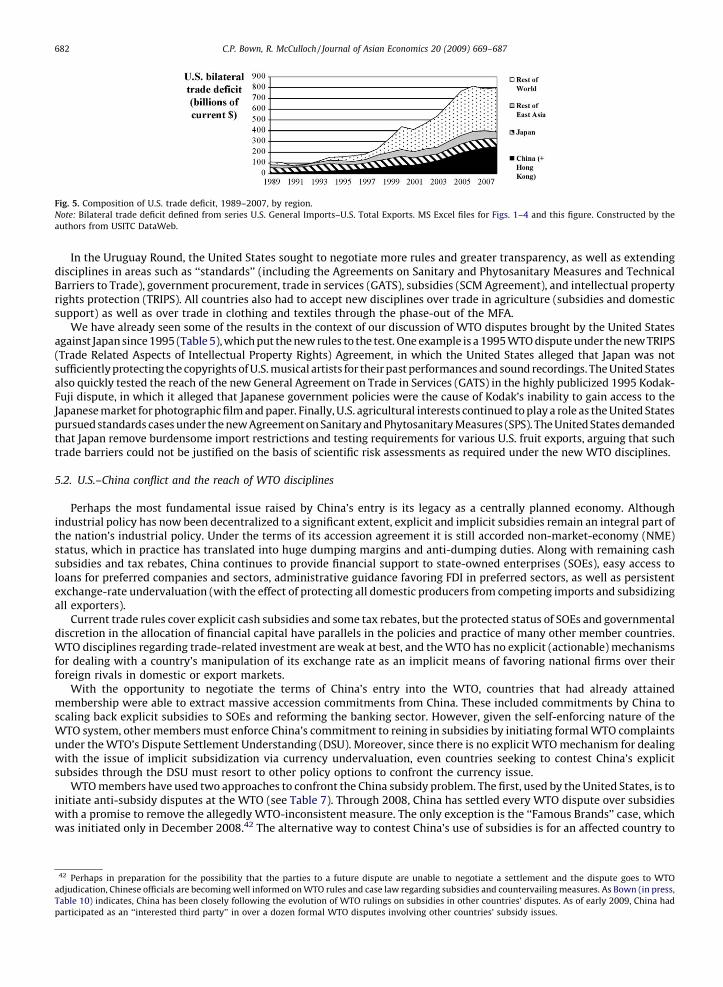
But as Fig. 5 shows, the U.S. bilateral trade deficit has nonetheless been expanding rapidly, with no sign of decline afterChina’s accession to the WTO in 2001.38 Thus, beginning in 2004, the United States began efforts similar to the formal actionstaken against Japan beginning in the late 1970s to get China to open up its market to U.S. exports. Table 7 documents the formaltrade disputes the United States has initiated against China through 2008, in which it alleges that China has not sufficiently(quickly or in depth) lived up to its import market-access commitments. The domestic industries behind U.S. initiation of formaldisputes included both dominant export interests in areas of U.S. comparative advantage (intellectual-property-intensivegoods and services like information technology, Hollywood movies and other media, and financial information serviceproviders) and traditional capital-intensive industries (auto parts). Like the WTO disputes involving the United States and Japandiscussed earlier, many of the issue-areas are relatively new and/or involve somewhat new disciplines, including TRIPS and theAgreement on Subsidies and Countervailing Measures (SCM), where China is particularly vulnerable given its history of state-owned enterprises and its still incomplete transition to a more market-oriented economy.39
In considering the formal WTO disputes that the United States has chosen to initiate to address the bilateral imbalancewith China, it is worth noting a path that the United States has not yet undertaken, i.e., resumption of the unilateral Section301 actions that were criticized by U.S. trading partners during the GATT era.40 The absence of unilateral actions is especiallysignificant given that the USTR has received a number of petitions to investigate China under Section 301. In each yearbetween 2004 and 2007, the USTR received at least one petition requesting the use of Section 301 to investigate China’s
Table 5
U.S. Section 301 investigations targeting Japan’s import market access, GATT and WTO disputes, 1955–2008.
Product—alleged market access issue Year* Sect. 301 GATT/WTO
dispute
1. Steel—Japan/EC agreement ‘‘deflected’’ Japanese production to the U.S. market 1976 Y N
2. Thrown silk—discriminatory market access agreement with Brazil, Korea, China 1977 Y Y
3. Leather—quantitative import restrictions and high tariffs 1977 Y Y
4. Cigars—import barriers and discriminatory internal taxes 1979 Y Y
5. Pipe tobacco—high import prices and limits on distribution and advertising 1979 Y Y
6. Leather footwear—quantitative import restrictions 1982 Y Y
7. Metal softball bats—technical barrier to trade of discriminatory testing/certification 1982 N Y**
8. Single tendering procedures—general practices of government procurement 1984 N Y
9. Semiconductors—domestic policies created ‘‘protective structure’’ and market access barrier 1985 Y Ny
10. Cigarettes—high tariffs, domestic monopoly, distribution restrictions 1985 Y N
11. Certain agricultural products—quantitative import restrictions on dairy, legumes, starches,
sugars, groundnuts, preserved beef, fruit pastes and juices, pineapple, tomato
1986 N Y
12. Herring, pollock, and surimi—quantitative import restriction on fish 1986 N Y
13. Citrus—import quotas on fresh oranges and juice, domestic content requirements 1988 Y Y
14. Construction services—barriers to foreign architectural, engineering, consulting services 1988 Y N
15. Beef—quantitative restrictions on imports 1988 N Y
16. Satellites—ban on government procurement of imports 1989 Y N
17. Supercomputers—restrictive government procurement practices on imports 1989 Y N
18. Wood products—technical barriers to trade (product standards, building codes,
testing and certification) affecting imports
1989 Y N
19. Auto parts—policies that restrict foreign access to replacement parts market 1994 Y Ny
20. Alcoholic beverages—Japanese ‘‘shochu’’ taxed internally at a lower rate than
comparable imported products (vodka, liqueurs, gin, genever, rum, whisky, brandy)
1995 N Y
21. Sound recording measures—copyright law provides insufficient duration of intellectual
property rights protection for past performances and sound recordings
1995 N Y
22. Consumer photographic film and paper—discriminatory policies inhibit sale and
distribution of foreign products
1995 Y Y
23. Agricultural products—‘‘codling moth’’ testing requirement results in import
ban of apricots, cherries, plums, pears, quince, peaches, nectarines, apples, walnuts
1997 Y Y
24. Apples—import restrictions due to risk of transmitting ‘‘fire blight’’ bacterium 2002 N Y
Compiled by the authors from WTO (1995, 2009), Bayard and Elliott (1994, 355–465), and USTR (2009, various years).
Notes: *Earliest year of initiation of formal Section 301 petition or GATT/WTO dispute. **Not a GATT dispute initiated under Article XXIII, but a dispute
documented in Hudec (1993). yU.S. retaliation or threatened retaliation led to Japan filing a GATT/WTO trade dispute against the U.S. The entry N indicates
No and Y indicates Yes.
38 For a number of years prior to 2001, the United States had given China’s exports MFN treatment (Normal Trade Relations in U.S. law) even though China
was not yet a member of the WTO. Thus, China’s 2001 entry did not substantially reduce the U.S. applied tariffs faced by Chinese exporters, although it did
increase the certainty of that treatment.39 Indeed, the shift toward U.S. use of countervailing duty policy against China described above and illustrated in Table 3 may reflect the U.S. desire to
speed the elimination of China’s domestic subsidy programs, which increase China’s ability to export while reducing foreign access to China’s domestic
market.40 During the period of general U.S. emphasis on use of Section 301 (1988–1994) described above in the context of our discussion of Japan, the USTR also
initiated three separate Section 301 investigations of China between 1991 and 1994. Two of these investigations related to intellectual property rights,
while one concerned general conditions of China’s import market access that were alleged to impose barriers via quantitative restrictions, burdensome
licensing procedures, technical barriers, and lack of transparency. For a discussion, see Bayard and Elliott (1994, Appendix).
C.P. Bown, R. McCulloch / Journal of Asian Economics 20 (2009) 669–687680
exchange rate or manufacturing labor rights, alleging that undervaluation of China’s currency constitutes a WTO-inconsistent subsidy or that its mistreatment of manufacturing workers affects U.S. market access. In each instance, the USTRhas declined to investigate the issue of the petition.41
5. Attempts to address systemic issues through new GATT/WTO disciplines
In addition to efforts to provide ‘‘symptomatic relief’’ for the large bilateral imbalances via U.S. import restrictions andexport promotion, U.S. policy makers also undertook actions to address what they perceived as important underlying causesof the persistent imbalances. In this section we describe these underlying causes (as portrayed by U.S. officials and the U.S.public at large) and the consequences for the international trading system of U.S. efforts to address those causes.
As we describe in Sections 5.1 and 5.2, a common view in the United States during both episodes was that inappropriateforeign government interference with market forces lay at the root of the imbalances. This perception led naturally to U.S.efforts to use (and modify) the rules-based trading system to address the troubling imbalances in a systematic way. Thedifferences in the bilateral imbalance that the United States faced with Japan versus its bilateral problem with China arefound in the details. Finally, Section 5.3 discusses some unintended consequences of the evolution of the trading system fromthe perspective of the United States—in particular, how Japan and China have used the WTO dispute-settlement process toself-enforce their exporters’ access to the U.S. market.
5.1. U.S.–Japan conflict and the reach of WTO disciplines
U.S. priorities in the Uruguay Round were shaped by dissatisfaction arising from U.S. exporters’ inability over severaldecades to access certain export markets, especially that of Japan. This is clearly reflected in Table 5, which lists the exportedproducts and disciplines at the heart of the formal actions (Section 301 and GATT disputes) the United States initiated againstJapan during the 1977–1994 period.
Table 6
Applied tariffs and bindings for selected WTO members, 2007.
WTO member country Product category Binding coverage
(percent)
Average bound
tariff (percent)
Average applied
tariff (percent)
United States All 100 3.5 3.5
Agriculture na 5.0 5.5
Non-agriculture 100 3.3 3.2
Clothing 100 11.4 11.7
Japan All 99.6 5.1 5.1
Agriculture na 22.7 21.8
Non-agriculture 99.6 2.4 2.6
Clothing 100 9.2 9.2
China All 100 10.0 9.9
Agriculture na 15.8 15.8
Non-agriculture 100 9.1 9.0
Clothing 100 16.2 16.0
Brazil All 100 31.4 12.2
Agriculture na 35.5 10.3
Non-agriculture 100 30.8 12.5
Clothing 100 35.0 20.0
India All 73.8 50.2 14.5
Agriculture na 114.2 34.4
Non-agriculture 69.8 38.2 11.5
Clothing 54.9 43.5 22.2
Compiled by the authors from WTO (2008c).
Notes: The entry na indicates not available. Binding coverage is defined as share of HS six-digit subheadings containing at least one bound tariff line. Average
shown are simple averages of the ad valorem (ad valorem equivalent) six-digit duty averages.
41 Specifically, USTR (2005, 259) states, ‘‘One petition alleged that certain labor policies and practices of the Government of China with respect to Chinese
manufacturing workers are unreasonable, as defined in Section 301(d) of the Trade Act, and burden or restrict U.S. commerce. The United States Trade
Representative (USTR) determined not to initiate an investigation under Section 301 of the Trade Act with respect to the petition because the Government of
the United States is involved in ongoing efforts to address with China many of the labor issues raised in the petition, and because initiation of an
investigation would not be effective in addressing the policies and practices covered in the petition. Two substantially similar petitions alleged that the
policies and practices of the Government of China with respect to the valuation of Chinese currency deny and violate international legal rights of the United
States, are unjustifiable, and burden or restrict U.S. commerce. The USTR determined not to initiate investigations with respect to the petitions because the
United States is involved in ongoing efforts to address with China the currency valuation issues raised in the petitions, and because initiation of
investigations would not be effective in addressing the policies and practices covered in the petitions.’’ In 2005 the USTR declined to pursue a similar
petition against China over currency (USTR 2006, 225), in 2006 over labor (USTR, 2007, 215), and in 2007 over currency (USTR, 2008, 206).
C.P. Bown, R. McCulloch / Journal of Asian Economics 20 (2009) 669–687 681
In the Uruguay Round, the United States sought to negotiate more rules and greater transparency, as well as extendingdisciplines in areas such as ‘‘standards’’ (including the Agreements on Sanitary and Phytosanitary Measures and TechnicalBarriers to Trade), government procurement, trade in services (GATS), subsidies (SCM Agreement), and intellectual propertyrights protection (TRIPS). All countries also had to accept new disciplines over trade in agriculture (subsidies and domesticsupport) as well as over trade in clothing and textiles through the phase-out of the MFA.
We have already seen some of the results in the context of our discussion of WTO disputes brought by the United Statesagainst Japan since 1995 (Table 5), which put the new rules to the test. One example is a 1995 WTO dispute under the new TRIPS(Trade Related Aspects of Intellectual Property Rights) Agreement, in which the United States alleged that Japan was notsufficiently protecting the copyrights of U.S. musical artists for their past performances and sound recordings. The United Statesalso quickly tested the reach of the new General Agreement on Trade in Services (GATS) in the highly publicized 1995 Kodak-Fuji dispute, in which it alleged that Japanese government policies were the cause of Kodak’s inability to gain access to theJapanese market for photographic film and paper. Finally, U.S. agricultural interests continued to play a role as the United Statespursued standards cases under the new Agreement on Sanitary and Phytosanitary Measures (SPS). The United States demandedthat Japan remove burdensome import restrictions and testing requirements for various U.S. fruit exports, arguing that suchtrade barriers could not be justified on the basis of scientific risk assessments as required under the new WTO disciplines.
5.2. U.S.–China conflict and the reach of WTO disciplines
Perhaps the most fundamental issue raised by China’s entry is its legacy as a centrally planned economy. Althoughindustrial policy has now been decentralized to a significant extent, explicit and implicit subsidies remain an integral part ofthe nation’s industrial policy. Under the terms of its accession agreement it is still accorded non-market-economy (NME)status, which in practice has translated into huge dumping margins and anti-dumping duties. Along with remaining cashsubsidies and tax rebates, China continues to provide financial support to state-owned enterprises (SOEs), easy access toloans for preferred companies and sectors, administrative guidance favoring FDI in preferred sectors, as well as persistentexchange-rate undervaluation (with the effect of protecting all domestic producers from competing imports and subsidizingall exporters).
Current trade rules cover explicit cash subsidies and some tax rebates, but the protected status of SOEs and governmentaldiscretion in the allocation of financial capital have parallels in the policies and practice of many other member countries.WTO disciplines regarding trade-related investment are weak at best, and the WTO has no explicit (actionable) mechanismsfor dealing with a country’s manipulation of its exchange rate as an implicit means of favoring national firms over theirforeign rivals in domestic or export markets.
With the opportunity to negotiate the terms of China’s entry into the WTO, countries that had already attainedmembership were able to extract massive accession commitments from China. These included commitments by China toscaling back explicit subsidies to SOEs and reforming the banking sector. However, given the self-enforcing nature of theWTO system, other members must enforce China’s commitment to reining in subsidies by initiating formal WTO complaintsunder the WTO’s Dispute Settlement Understanding (DSU). Moreover, since there is no explicit WTO mechanism for dealingwith the issue of implicit subsidization via currency undervaluation, even countries seeking to contest China’s explicitsubsides through the DSU must resort to other policy options to confront the currency issue.
WTO members have used two approaches to confront the China subsidy problem. The first, used by the United States, is toinitiate anti-subsidy disputes at the WTO (see Table 7). Through 2008, China has settled every WTO dispute over subsidieswith a promise to remove the allegedly WTO-inconsistent measure. The only exception is the ‘‘Famous Brands’’ case, whichwas initiated only in December 2008.42 The alternative way to contest China’s use of subsidies is for an affected country to
Fig. 5. Composition of U.S. trade deficit, 1989–2007, by region.
Note: Bilateral trade deficit defined from series U.S. General Imports–U.S. Total Exports. MS Excel files for Figs. 1–4 and this figure. Constructed by the
authors from USITC DataWeb.
42 Perhaps in preparation for the possibility that the parties to a future dispute are unable to negotiate a settlement and the dispute goes to WTO
adjudication, Chinese officials are becoming well informed on WTO rules and case law regarding subsidies and countervailing measures. As Bown (in press,
Table 10) indicates, China has been closely following the evolution of WTO rulings on subsidies in other countries’ disputes. As of early 2009, China had
participated as an ‘‘interested third party’’ in over a dozen formal WTO disputes involving other countries’ subsidy issues.
C.P. Bown, R. McCulloch / Journal of Asian Economics 20 (2009) 669–687682
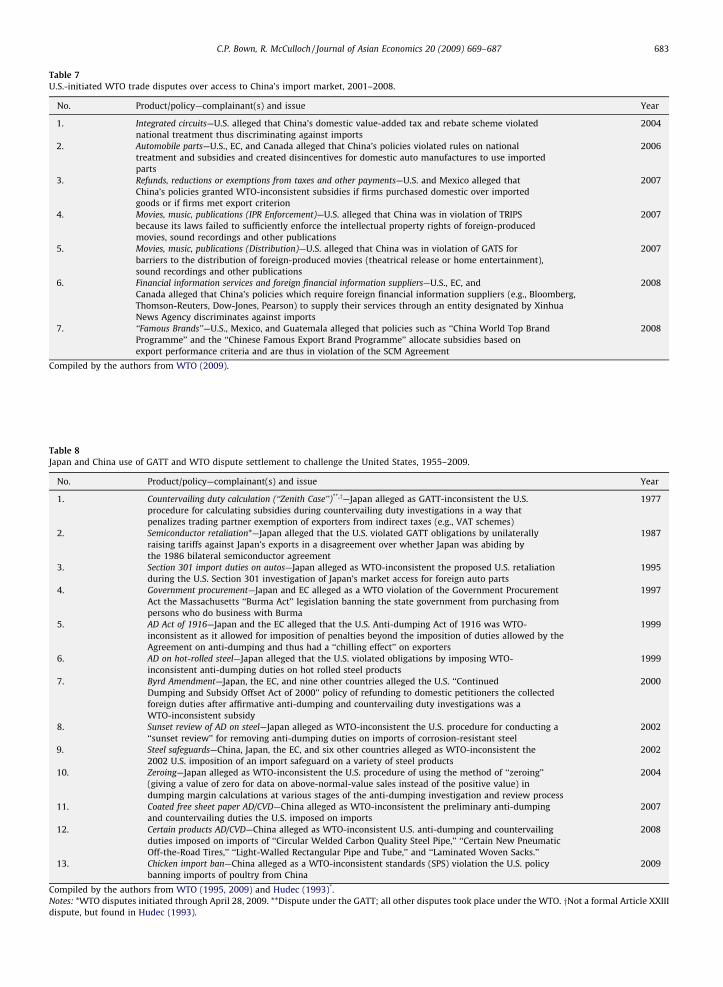
Table 8
Japan and China use of GATT and WTO dispute settlement to challenge the United States, 1955–2009.
No. Product/policy—complainant(s) and issue Year
1. Countervailing duty calculation (‘‘Zenith Case’’)**,y—Japan alleged as GATT-inconsistent the U.S.
procedure for calculating subsidies during countervailing duty investigations in a way that
penalizes trading partner exemption of exporters from indirect taxes (e.g., VAT schemes)
1977
2. Semiconductor retaliation*—Japan alleged that the U.S. violated GATT obligations by unilaterally
raising tariffs against Japan’s exports in a disagreement over whether Japan was abiding by
the 1986 bilateral semiconductor agreement
1987
3. Section 301 import duties on autos—Japan alleged as WTO-inconsistent the proposed U.S. retaliation
during the U.S. Section 301 investigation of Japan’s market access for foreign auto parts
1995
4. Government procurement—Japan and EC alleged as a WTO violation of the Government Procurement
Act the Massachusetts ‘‘Burma Act’’ legislation banning the state government from purchasing from
persons who do business with Burma
1997
5. AD Act of 1916—Japan and the EC alleged that the U.S. Anti-dumping Act of 1916 was WTO-
inconsistent as it allowed for imposition of penalties beyond the imposition of duties allowed by the
Agreement on anti-dumping and thus had a ‘‘chilling effect’’ on exporters
1999
6. AD on hot-rolled steel—Japan alleged that the U.S. violated obligations by imposing WTO-
inconsistent anti-dumping duties on hot rolled steel products
1999
7. Byrd Amendment—Japan, the EC, and nine other countries alleged the U.S. ‘‘Continued
Dumping and Subsidy Offset Act of 2000’’ policy of refunding to domestic petitioners the collected
foreign duties after affirmative anti-dumping and countervailing duty investigations was a
WTO-inconsistent subsidy
2000
8. Sunset review of AD on steel—Japan alleged as WTO-inconsistent the U.S. procedure for conducting a
‘‘sunset review’’ for removing anti-dumping duties on imports of corrosion-resistant steel
2002
9. Steel safeguards—China, Japan, the EC, and six other countries alleged as WTO-inconsistent the
2002 U.S. imposition of an import safeguard on a variety of steel products
2002
10. Zeroing—Japan alleged as WTO-inconsistent the U.S. procedure of using the method of ‘‘zeroing’’
(giving a value of zero for data on above-normal-value sales instead of the positive value) in
dumping margin calculations at various stages of the anti-dumping investigation and review process
2004
11. Coated free sheet paper AD/CVD—China alleged as WTO-inconsistent the preliminary anti-dumping
and countervailing duties the U.S. imposed on imports
2007
12. Certain products AD/CVD—China alleged as WTO-inconsistent U.S. anti-dumping and countervailing
duties imposed on imports of ‘‘Circular Welded Carbon Quality Steel Pipe,’’ ‘‘Certain New Pneumatic
Off-the-Road Tires,’’ ‘‘Light-Walled Rectangular Pipe and Tube,’’ and ‘‘Laminated Woven Sacks.’’
2008
13. Chicken import ban—China alleged as a WTO-inconsistent standards (SPS) violation the U.S. policy
banning imports of poultry from China
2009
Compiled by the authors from WTO (1995, 2009) and Hudec (1993)*.
Notes: *WTO disputes initiated through April 28, 2009. **Dispute under the GATT; all other disputes took place under the WTO. yNot a formal Article XXIII
dispute, but found in Hudec (1993).
Table 7
U.S.-initiated WTO trade disputes over access to China’s import market, 2001–2008.
No. Product/policy—complainant(s) and issue Year
1. Integrated circuits—U.S. alleged that China’s domestic value-added tax and rebate scheme violated
national treatment thus discriminating against imports
2004
2. Automobile parts—U.S., EC, and Canada alleged that China’s policies violated rules on national
treatment and subsidies and created disincentives for domestic auto manufactures to use imported
parts
2006
3. Refunds, reductions or exemptions from taxes and other payments—U.S. and Mexico alleged that
China’s policies granted WTO-inconsistent subsidies if firms purchased domestic over imported
goods or if firms met export criterion
2007
4. Movies, music, publications (IPR Enforcement)—U.S. alleged that China was in violation of TRIPS
because its laws failed to sufficiently enforce the intellectual property rights of foreign-produced
movies, sound recordings and other publications
2007
5. Movies, music, publications (Distribution)—U.S. alleged that China was in violation of GATS for
barriers to the distribution of foreign-produced movies (theatrical release or home entertainment),
sound recordings and other publications
2007
6. Financial information services and foreign financial information suppliers—U.S., EC, and
Canada alleged that China’s policies which require foreign financial information suppliers (e.g., Bloomberg,
Thomson-Reuters, Dow-Jones, Pearson) to supply their services through an entity designated by Xinhua
News Agency discriminates against imports
2008
7. ‘‘Famous Brands’’—U.S., Mexico, and Guatemala alleged that policies such as ‘‘China World Top Brand
Programme’’ and the ‘‘Chinese Famous Export Brand Programme’’ allocate subsidies based on
export performance criteria and are thus in violation of the SCM Agreement
2008
Compiled by the authors from WTO (2009).
C.P. Bown, R. McCulloch / Journal of Asian Economics 20 (2009) 669–687 683
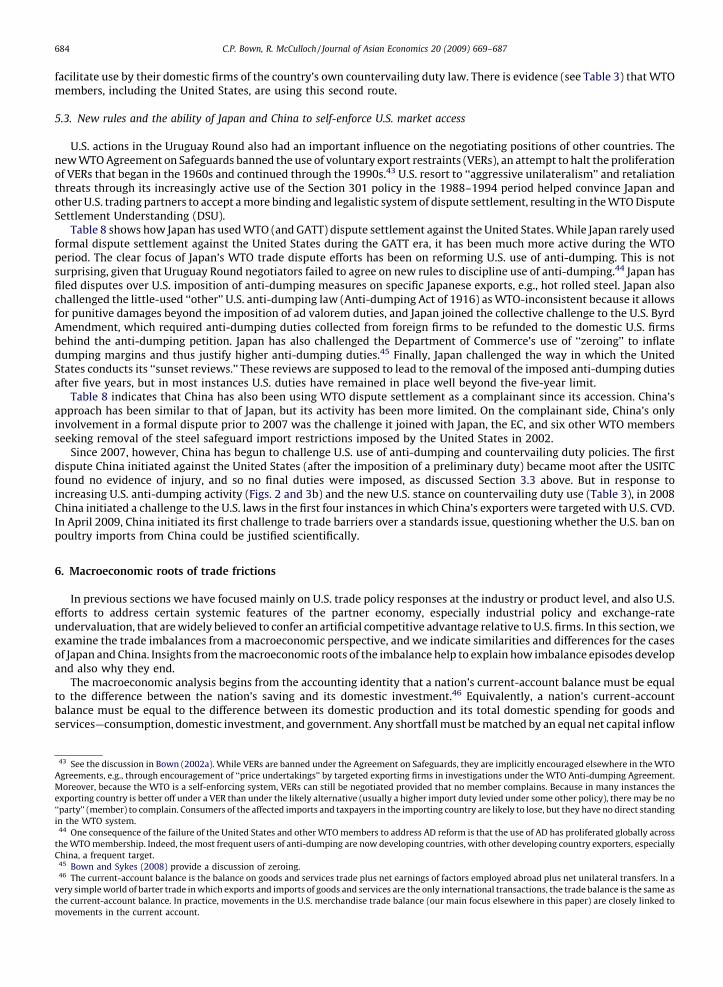
facilitate use by their domestic firms of the country’s own countervailing duty law. There is evidence (see Table 3) that WTOmembers, including the United States, are using this second route.
5.3. New rules and the ability of Japan and China to self-enforce U.S. market access
U.S. actions in the Uruguay Round also had an important influence on the negotiating positions of other countries. Thenew WTO Agreement on Safeguards banned the use of voluntary export restraints (VERs), an attempt to halt the proliferationof VERs that began in the 1960s and continued through the 1990s.43 U.S. resort to ‘‘aggressive unilateralism’’ and retaliationthreats through its increasingly active use of the Section 301 policy in the 1988–1994 period helped convince Japan andother U.S. trading partners to accept a more binding and legalistic system of dispute settlement, resulting in the WTO DisputeSettlement Understanding (DSU).
Table 8 shows how Japan has used WTO (and GATT) dispute settlement against the United States. While Japan rarely usedformal dispute settlement against the United States during the GATT era, it has been much more active during the WTOperiod. The clear focus of Japan’s WTO trade dispute efforts has been on reforming U.S. use of anti-dumping. This is notsurprising, given that Uruguay Round negotiators failed to agree on new rules to discipline use of anti-dumping.44 Japan hasfiled disputes over U.S. imposition of anti-dumping measures on specific Japanese exports, e.g., hot rolled steel. Japan alsochallenged the little-used ‘‘other’’ U.S. anti-dumping law (Anti-dumping Act of 1916) as WTO-inconsistent because it allowsfor punitive damages beyond the imposition of ad valorem duties, and Japan joined the collective challenge to the U.S. ByrdAmendment, which required anti-dumping duties collected from foreign firms to be refunded to the domestic U.S. firmsbehind the anti-dumping petition. Japan has also challenged the Department of Commerce’s use of ‘‘zeroing’’ to inflatedumping margins and thus justify higher anti-dumping duties.45 Finally, Japan challenged the way in which the UnitedStates conducts its ‘‘sunset reviews.’’ These reviews are supposed to lead to the removal of the imposed anti-dumping dutiesafter five years, but in most instances U.S. duties have remained in place well beyond the five-year limit.
Table 8 indicates that China has also been using WTO dispute settlement as a complainant since its accession. China’sapproach has been similar to that of Japan, but its activity has been more limited. On the complainant side, China’s onlyinvolvement in a formal dispute prior to 2007 was the challenge it joined with Japan, the EC, and six other WTO membersseeking removal of the steel safeguard import restrictions imposed by the United States in 2002.
Since 2007, however, China has begun to challenge U.S. use of anti-dumping and countervailing duty policies. The firstdispute China initiated against the United States (after the imposition of a preliminary duty) became moot after the USITCfound no evidence of injury, and so no final duties were imposed, as discussed Section 3.3 above. But in response toincreasing U.S. anti-dumping activity (Figs. 2 and 3b) and the new U.S. stance on countervailing duty use (Table 3), in 2008China initiated a challenge to the U.S. laws in the first four instances in which China’s exporters were targeted with U.S. CVD.In April 2009, China initiated its first challenge to trade barriers over a standards issue, questioning whether the U.S. ban onpoultry imports from China could be justified scientifically.
6. Macroeconomic roots of trade frictions
In previous sections we have focused mainly on U.S. trade policy responses at the industry or product level, and also U.S.efforts to address certain systemic features of the partner economy, especially industrial policy and exchange-rateundervaluation, that are widely believed to confer an artificial competitive advantage relative to U.S. firms. In this section, weexamine the trade imbalances from a macroeconomic perspective, and we indicate similarities and differences for the casesof Japan and China. Insights from the macroeconomic roots of the imbalance help to explain how imbalance episodes developand also why they end.
The macroeconomic analysis begins from the accounting identity that a nation’s current-account balance must be equalto the difference between the nation’s saving and its domestic investment.46 Equivalently, a nation’s current-accountbalance must be equal to the difference between its domestic production and its total domestic spending for goods andservices—consumption, domestic investment, and government. Any shortfall must be matched by an equal net capital inflow
43 See the discussion in Bown (2002a). While VERs are banned under the Agreement on Safeguards, they are implicitly encouraged elsewhere in the WTO
Agreements, e.g., through encouragement of ‘‘price undertakings’’ by targeted exporting firms in investigations under the WTO Anti-dumping Agreement.
Moreover, because the WTO is a self-enforcing system, VERs can still be negotiated provided that no member complains. Because in many instances the
exporting country is better off under a VER than under the likely alternative (usually a higher import duty levied under some other policy), there may be no
‘‘party’’ (member) to complain. Consumers of the affected imports and taxpayers in the importing country are likely to lose, but they have no direct standing
in the WTO system.44 One consequence of the failure of the United States and other WTO members to address AD reform is that the use of AD has proliferated globally across
the WTO membership. Indeed, the most frequent users of anti-dumping are now developing countries, with other developing country exporters, especially
China, a frequent target.45 Bown and Sykes (2008) provide a discussion of zeroing.46 The current-account balance is the balance on goods and services trade plus net earnings of factors employed abroad plus net unilateral transfers. In a
very simple world of barter trade in which exports and imports of goods and services are the only international transactions, the trade balance is the same as
the current-account balance. In practice, movements in the U.S. merchandise trade balance (our main focus elsewhere in this paper) are closely linked to
movements in the current account.
C.P. Bown, R. McCulloch / Journal of Asian Economics 20 (2009) 669–687684
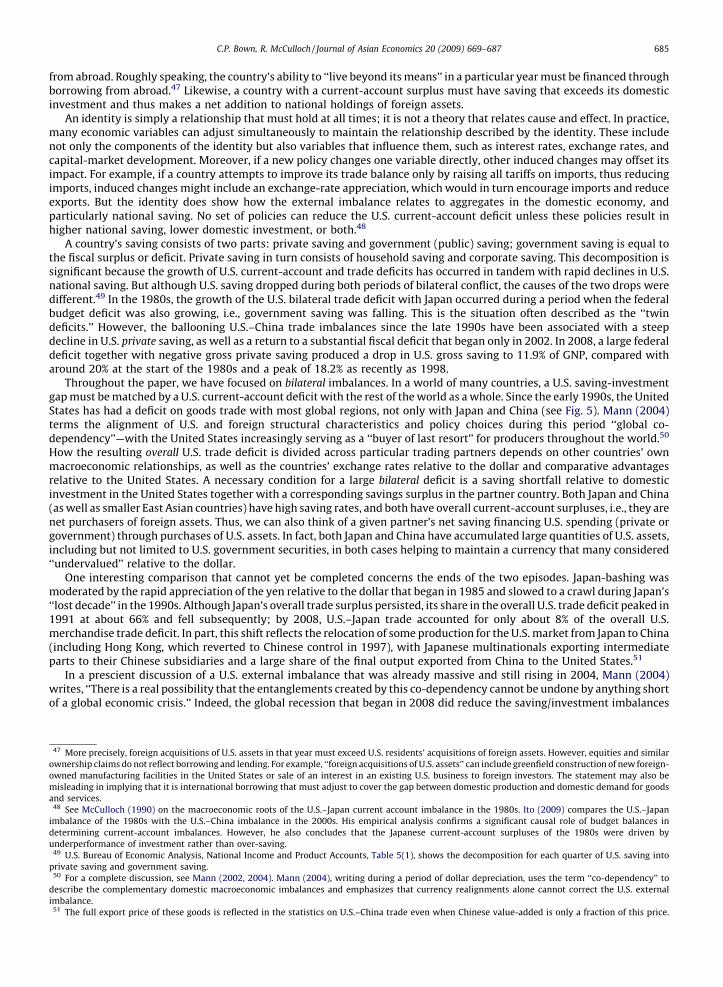
from abroad. Roughly speaking, the country’s ability to ‘‘live beyond its means’’ in a particular year must be financed throughborrowing from abroad.47 Likewise, a country with a current-account surplus must have saving that exceeds its domesticinvestment and thus makes a net addition to national holdings of foreign assets.
An identity is simply a relationship that must hold at all times; it is not a theory that relates cause and effect. In practice,many economic variables can adjust simultaneously to maintain the relationship described by the identity. These includenot only the components of the identity but also variables that influence them, such as interest rates, exchange rates, andcapital-market development. Moreover, if a new policy changes one variable directly, other induced changes may offset itsimpact. For example, if a country attempts to improve its trade balance only by raising all tariffs on imports, thus reducingimports, induced changes might include an exchange-rate appreciation, which would in turn encourage imports and reduceexports. But the identity does show how the external imbalance relates to aggregates in the domestic economy, andparticularly national saving. No set of policies can reduce the U.S. current-account deficit unless these policies result inhigher national saving, lower domestic investment, or both.48
A country’s saving consists of two parts: private saving and government (public) saving; government saving is equal tothe fiscal surplus or deficit. Private saving in turn consists of household saving and corporate saving. This decomposition issignificant because the growth of U.S. current-account and trade deficits has occurred in tandem with rapid declines in U.S.national saving. But although U.S. saving dropped during both periods of bilateral conflict, the causes of the two drops weredifferent.49 In the 1980s, the growth of the U.S. bilateral trade deficit with Japan occurred during a period when the federalbudget deficit was also growing, i.e., government saving was falling. This is the situation often described as the ‘‘twindeficits.’’ However, the ballooning U.S.–China trade imbalances since the late 1990s have been associated with a steepdecline in U.S. private saving, as well as a return to a substantial fiscal deficit that began only in 2002. In 2008, a large federaldeficit together with negative gross private saving produced a drop in U.S. gross saving to 11.9% of GNP, compared witharound 20% at the start of the 1980s and a peak of 18.2% as recently as 1998.
Throughout the paper, we have focused on bilateral imbalances. In a world of many countries, a U.S. saving-investmentgap must be matched by a U.S. current-account deficit with the rest of the world as a whole. Since the early 1990s, the UnitedStates has had a deficit on goods trade with most global regions, not only with Japan and China (see Fig. 5). Mann (2004)terms the alignment of U.S. and foreign structural characteristics and policy choices during this period ‘‘global co-dependency’’—with the United States increasingly serving as a ‘‘buyer of last resort’’ for producers throughout the world.50
How the resulting overall U.S. trade deficit is divided across particular trading partners depends on other countries’ ownmacroeconomic relationships, as well as the countries’ exchange rates relative to the dollar and comparative advantagesrelative to the United States. A necessary condition for a large bilateral deficit is a saving shortfall relative to domesticinvestment in the United States together with a corresponding savings surplus in the partner country. Both Japan and China(as well as smaller East Asian countries) have high saving rates, and both have overall current-account surpluses, i.e., they arenet purchasers of foreign assets. Thus, we can also think of a given partner’s net saving financing U.S. spending (private orgovernment) through purchases of U.S. assets. In fact, both Japan and China have accumulated large quantities of U.S. assets,including but not limited to U.S. government securities, in both cases helping to maintain a currency that many considered‘‘undervalued’’ relative to the dollar.
One interesting comparison that cannot yet be completed concerns the ends of the two episodes. Japan-bashing wasmoderated by the rapid appreciation of the yen relative to the dollar that began in 1985 and slowed to a crawl during Japan’s‘‘lost decade’’ in the 1990s. Although Japan’s overall trade surplus persisted, its share in the overall U.S. trade deficit peaked in1991 at about 66% and fell subsequently; by 2008, U.S.–Japan trade accounted for only about 8% of the overall U.S.merchandise trade deficit. In part, this shift reflects the relocation of some production for the U.S. market from Japan to China(including Hong Kong, which reverted to Chinese control in 1997), with Japanese multinationals exporting intermediateparts to their Chinese subsidiaries and a large share of the final output exported from China to the United States.51
In a prescient discussion of a U.S. external imbalance that was already massive and still rising in 2004, Mann (2004)writes, ‘‘There is a real possibility that the entanglements created by this co-dependency cannot be undone by anything shortof a global economic crisis.’’ Indeed, the global recession that began in 2008 did reduce the saving/investment imbalances
47 More precisely, foreign acquisitions of U.S. assets in that year must exceed U.S. residents’ acquisitions of foreign assets. However, equities and similar
ownership claims do not reflect borrowing and lending. For example, ‘‘foreign acquisitions of U.S. assets’’ can include greenfield construction of new foreign-
owned manufacturing facilities in the United States or sale of an interest in an existing U.S. business to foreign investors. The statement may also be
misleading in implying that it is international borrowing that must adjust to cover the gap between domestic production and domestic demand for goods
and services.48 See McCulloch (1990) on the macroeconomic roots of the U.S.–Japan current account imbalance in the 1980s. Ito (2009) compares the U.S.–Japan
imbalance of the 1980s with the U.S.–China imbalance in the 2000s. His empirical analysis confirms a significant causal role of budget balances in
determining current-account imbalances. However, he also concludes that the Japanese current-account surpluses of the 1980s were driven by
underperformance of investment rather than over-saving.49 U.S. Bureau of Economic Analysis, National Income and Product Accounts, Table 5(1), shows the decomposition for each quarter of U.S. saving into
private saving and government saving.50 For a complete discussion, see Mann (2002, 2004). Mann (2004), writing during a period of dollar depreciation, uses the term ‘‘co-dependency’’ to
describe the complementary domestic macroeconomic imbalances and emphasizes that currency realignments alone cannot correct the U.S. external
imbalance.51 The full export price of these goods is reflected in the statistics on U.S.–China trade even when Chinese value-added is only a fraction of this price.
C.P. Bown, R. McCulloch / Journal of Asian Economics 20 (2009) 669–687 685
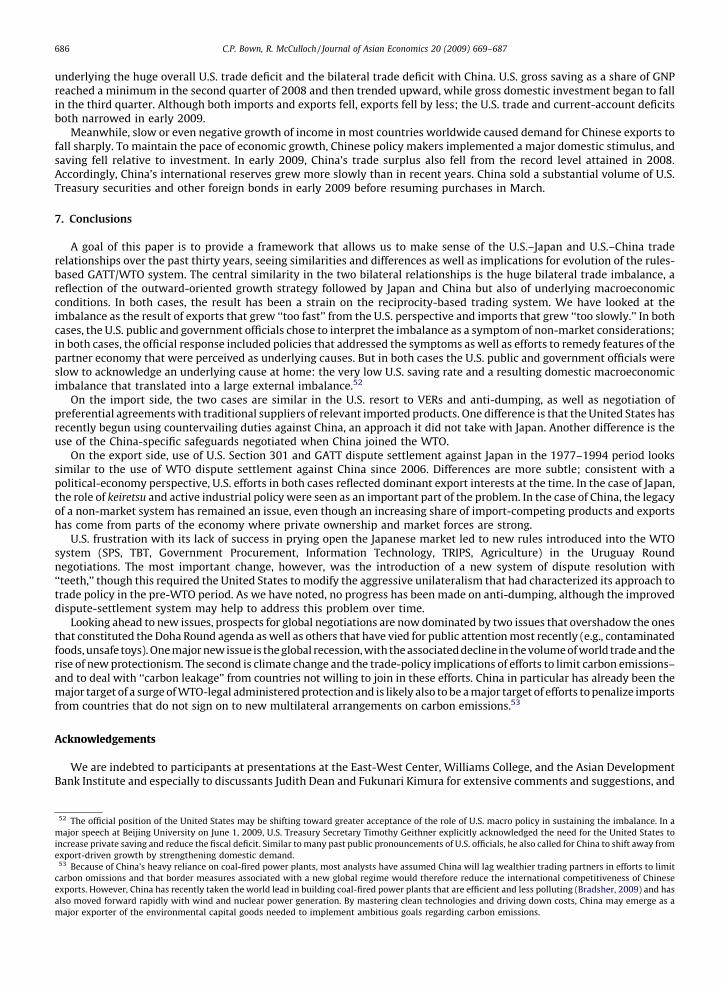
underlying the huge overall U.S. trade deficit and the bilateral trade deficit with China. U.S. gross saving as a share of GNPreached a minimum in the second quarter of 2008 and then trended upward, while gross domestic investment began to fallin the third quarter. Although both imports and exports fell, exports fell by less; the U.S. trade and current-account deficitsboth narrowed in early 2009.
Meanwhile, slow or even negative growth of income in most countries worldwide caused demand for Chinese exports tofall sharply. To maintain the pace of economic growth, Chinese policy makers implemented a major domestic stimulus, andsaving fell relative to investment. In early 2009, China’s trade surplus also fell from the record level attained in 2008.Accordingly, China’s international reserves grew more slowly than in recent years. China sold a substantial volume of U.S.Treasury securities and other foreign bonds in early 2009 before resuming purchases in March.
7. Conclusions
A goal of this paper is to provide a framework that allows us to make sense of the U.S.–Japan and U.S.–China traderelationships over the past thirty years, seeing similarities and differences as well as implications for evolution of the rules-based GATT/WTO system. The central similarity in the two bilateral relationships is the huge bilateral trade imbalance, areflection of the outward-oriented growth strategy followed by Japan and China but also of underlying macroeconomicconditions. In both cases, the result has been a strain on the reciprocity-based trading system. We have looked at theimbalance as the result of exports that grew ‘‘too fast’’ from the U.S. perspective and imports that grew ‘‘too slowly.’’ In bothcases, the U.S. public and government officials chose to interpret the imbalance as a symptom of non-market considerations;in both cases, the official response included policies that addressed the symptoms as well as efforts to remedy features of thepartner economy that were perceived as underlying causes. But in both cases the U.S. public and government officials wereslow to acknowledge an underlying cause at home: the very low U.S. saving rate and a resulting domestic macroeconomicimbalance that translated into a large external imbalance.52
On the import side, the two cases are similar in the U.S. resort to VERs and anti-dumping, as well as negotiation ofpreferential agreements with traditional suppliers of relevant imported products. One difference is that the United States hasrecently begun using countervailing duties against China, an approach it did not take with Japan. Another difference is theuse of the China-specific safeguards negotiated when China joined the WTO.
On the export side, use of U.S. Section 301 and GATT dispute settlement against Japan in the 1977–1994 period lookssimilar to the use of WTO dispute settlement against China since 2006. Differences are more subtle; consistent with apolitical-economy perspective, U.S. efforts in both cases reflected dominant export interests at the time. In the case of Japan,the role of keiretsu and active industrial policy were seen as an important part of the problem. In the case of China, the legacyof a non-market system has remained an issue, even though an increasing share of import-competing products and exportshas come from parts of the economy where private ownership and market forces are strong.
U.S. frustration with its lack of success in prying open the Japanese market led to new rules introduced into the WTOsystem (SPS, TBT, Government Procurement, Information Technology, TRIPS, Agriculture) in the Uruguay Roundnegotiations. The most important change, however, was the introduction of a new system of dispute resolution with‘‘teeth,’’ though this required the United States to modify the aggressive unilateralism that had characterized its approach totrade policy in the pre-WTO period. As we have noted, no progress has been made on anti-dumping, although the improveddispute-settlement system may help to address this problem over time.
Looking ahead to new issues, prospects for global negotiations are now dominated by two issues that overshadow the onesthat constituted the Doha Round agenda as well as others that have vied for public attention most recently (e.g., contaminatedfoods, unsafe toys). One major new issue is the global recession, with the associated decline in the volume of world trade and therise of new protectionism. The second is climate change and the trade-policy implications of efforts to limit carbon emissions–and to deal with ‘‘carbon leakage’’ from countries not willing to join in these efforts. China in particular has already been themajor target of a surge of WTO-legal administered protection and is likely also to be a major target of efforts to penalize importsfrom countries that do not sign on to new multilateral arrangements on carbon emissions.53
Acknowledgements
We are indebted to participants at presentations at the East-West Center, Williams College, and the Asian DevelopmentBank Institute and especially to discussants Judith Dean and Fukunari Kimura for extensive comments and suggestions, and
52 The official position of the United States may be shifting toward greater acceptance of the role of U.S. macro policy in sustaining the imbalance. In a
major speech at Beijing University on June 1, 2009, U.S. Treasury Secretary Timothy Geithner explicitly acknowledged the need for the United States to
increase private saving and reduce the fiscal deficit. Similar to many past public pronouncements of U.S. officials, he also called for China to shift away from
export-driven growth by strengthening domestic demand.53 Because of China’s heavy reliance on coal-fired power plants, most analysts have assumed China will lag wealthier trading partners in efforts to limit
carbon omissions and that border measures associated with a new global regime would therefore reduce the international competitiveness of Chinese
exports. However, China has recently taken the world lead in building coal-fired power plants that are efficient and less polluting (Bradsher, 2009) and has
also moved forward rapidly with wind and nuclear power generation. By mastering clean technologies and driving down costs, China may emerge as a
major exporter of the environmental capital goods needed to implement ambitious goals regarding carbon emissions.
C.P. Bown, R. McCulloch / Journal of Asian Economics 20 (2009) 669–687686
also to Christina Davis, Tom Prusa, and James Durling for helpful discussions. Any opinions expressed in this paper are theauthors’ and should not be attributed to the World Bank. All remaining errors are our own.
References
Bagwell, Kyle, & Staiger, Robert W.. (1999). An economic theory of GATT. American Economic Review, 89(1), 215–248.Bagwell, Kyle, & Staiger, Robert W.. (2002). The economics of the world trading system. Cambridge, MA: MIT Press.Barrows, Geoffrey, & Harrigan, James. (2009). Testing the theory of trade policy: Evidence from the abrupt end of the Multifibre Arrangement. Review of Economics
and Statistics, 91(2), 282–294.Bayard, Thomas O. , & Elliott, Kimberly Ann. (1994). Reciprocity and retaliation in U.S. trade policy. Washington: Institute for International Economics.Bergsten, C. Fred, Freeman, Charles, Lardy, Nicholas R. , & Mitchell, Derek J.. (2008). China’s rise: Challenges and opportunities. Washington: Peter G Peterson
Institute for International Economics and Center for Strategic and International Studies.Bhagwati, Jagdish & Patrick, Hugh T. (1990). Aggressive unilateralism: America’s 301 trade policy and the world trading system. Ann Arbor: University of Michigan
Press.Bown, Chad P. (in press). China’s WTO entry: Antidumping, safeguards, and dispute settlement. In Robert C. Feenstra & Shang-Jin Wei (Eds.), China’s growing role in
world trade. Chicago, Illinois: University of Chicago Press.Bown, Chad P. (2009a). Global antidumping database (Current Version 5.0). Brandeis University working paper, July. Available on line at http://www.brandeis.edu/�cbown/global_ad/.
Bown, Chad P.. (2009b). U. S.–China trade conflicts and the future of the WTO. Fletcher Forum of World Affairs, 33(1), 27–48.Bown, Chad P.. (2002a). Why are safeguards under the WTO so unpopular? World Trade Review, 1(1), 47–62.Bown, Chad P.. (2002b). The economics of trade disputes, the GATT’s Article XXIII and the WTO’s Dispute Settlement Understanding. Economics and Politics, 14(3),
283–323.Bown, Chad P. , & McCulloch, Rachel. (2007). U.S. trade policy toward China: Discrimination and its implications. In Sumner La Croix & Challenges to the global
trading system: Adjustment to globalization in the Asia Pacific Region. London and New York: Routledge.Bown, Chad P. , & Sykes, Alan O.. (2008). The zeroing issue: A critical analysis of Softwood V. World Trade Review, 7(1), 121–142.Bradsher, Keith (2009). China outpaces U.S. in cleaner coal-fired plants. The New York Times, May 10.Brambilla, Irene, Khandelwal, Amit, & Schott, Peter K. (in press). China’s experience under the Multifiber Arrangement (MFA) and the Agreement on Textiles and
Clothing (ATC). In Robert C. Feenstra & Shang-Jin Wei (Eds.). China’s growing role in world trade. Chicago, Illinois: University of Chicago Press.Broda, Christian, Limao, Nuno, & Weinstein, David E.. (2008). Optimal tariffs and market power: The evidence. American Economic Review, 98(5), 2032–2065.Corden, W. M. (1981). Exchange rate protection. In The international monetary system under flexible exchange rates: Global, regional and national. Essays in honor of
Robert Triffin. Cambridge, MA: Ballinger. [Reprinted in W.M. Corden (1985), Essays in international economics. Oxford: Blackwell].Dean, Judith M. , Lovely, Mary E. , & Mora, Jesse. (2009). Decomposing China-Japan-U. S. Trade: Vertical specialization, ownership, and organizational form. Journal
of Asian Economics, 20(6), 596–610.De Melo, Jaime, & Tarr, David. (1991). VERs under imperfect competition and foreign direct investment: A case study of the U.S.–Japan auto VER. World Bank Country
Economics Department, WPS 667, May.Feenstra, Robert C., Lipsey, Robert E., Deng, Haiyan, Ma, Alyson C., & Mo, Henry (2005). World trade flows: 1962–2000. NBER Working Paper 11040, January.
Cambridge, Massachusetts: National Bureau of Economic Research.Freund, Caroline, & Pierola, Martha Denisse (2008). Export surges: The power of a competitive currency. World Bank Development Research Group, WPS 4750,
October. Washington: World Bank.Greaney, Theresa M. , & Li, Yao. (2009). Assessing foreign direct investment relationships between China, Japan and the United States. Journal of Asian Economics,
20(6), 611–625.Hudec, Robert E.. (1993). Enforcing international trade law: The evolution of the modern GATT legal system. Salem, New Hampshire: Butterworth Legal Publishers.Hufbauer, Gary Clyde, & Elliott, Kimberly Ann. (1994). Measuring the costs of protection in the United States. Washington: Institute for International Economics.Hufbauer, Gary Clyde, Wong, Yee, & Sheth, Ketki. (2006). US–China trade disputes: Rising tide, rising stakes. Washington: Institute for International Economics.Ito, Hi ro (2009). U.S. current account debate with Japan then, with China now. Journal of Asian Economics, 20(3), 294–313.Mann, Catherine L.. (2002). Perspectives on the U.S. current account deficit and sustainability. Journal of Economic Perspectives, 16(3), 131–152.Mann, Catherine L.. (July 2004). Managing exchange rates: Achievement of global re-balancing or evidence of global co-dependency? Business Economics, 20–29.McCulloch, Rachel (1990). Macroeconomic policy, trade, and the dollar: Remarkable events of the 1980s. In Stefan Gerlach & Peter A. Petri (Eds.), The economics of
the dollar cycle. Cambridge, MA: MIT Press.Morrison, Wayne M. (2009). China-U.S. trade issues. CRS Report for Congress, updated March 4.Perkins, Dw ig ht (2001). Industrial and financial policy in China and Vietnam: A new model or a replay of the East Asian experience? In Joseph Stiglitz & Shahid
Yusuf (Eds.), Rethinking the East Asia miracle. Washington: World Bank and Oxford University Press.Rodrik, Dani (2008). The real exchange rate and economic growth. Harvard Kennedy School manuscript, October.Saxonhouse, Ga ry (1983). What is all this about ‘industrial targeting’ in Japan? The World Economy, 6(3), 253–274.Staiger, Robert W., & Sykes, Alan O. (2008). ‘Currency manipulation’ and world trade. Stanford University working paper, August.United States Central Intelligence Agency (CIA) (2009). The world factbook [available at https://www.cia.gov, last accessed 3 June 2009].United States International Trade Commission (USITC). (2007). Description of Selected Government Practices and Policies Affecting Decision Making in the Economy.
China: USITC Publication 3978, December.United States Trade Representative (USTR), Office of the (2009). Monitoring and enforcement: Section 301 table of cases’’ [available at http://www.ustr.gov/
assets/Trade_Agreements/Monitoring_Enforcement/asset_upload_file985_6885.pdf, last accessed 15 April 2009].United States Trade Representative (USTR), Office of the (various years). Trade Enforcement Activities. In USTR trade policy agenda and annual report [available at
http://www.ustr.gov, last accessed 15 April 2009].Van Assche, Ari, Hong, Chang, & Ma, Alyson. (2009). Global production networks and China’s processing trade. Journal of Asian Economics, 20(6), 640–654.World Trade Organization (WTO) (2009). Dispute Settlement: The dispute: Chronological list of disputes cases [available at http://www.wto.org, last accessed 15
April 2009].World Trade Organization (WTO) (2008a). Trade Profiles 2008 [available at http://www.wto.org, last accessed 3 June 2009].World Trade Organization (WTO) (2008b). International Trade Statistics 2008 [available at http://www.wto.org, last accessed 3 June 2009].World Trade Organization (WTO) (2008c). World Tariff Profiles 2008 [available at http://www.wto.org, last accessed 14 June 2009].World Trade Organization (WTO). (1995). Analytical index: Guide to GATT law and practice, Vols. 1 and 2. Geneva: WTO.
C.P. Bown, R. McCulloch / Journal of Asian Economics 20 (2009) 669–687 687