Embed Size (px)
Citation preview

Journal of Business & Economics Research – October 2011 Volume 9, Number 10
© 2011 The Clute Institute 87
Relaxing Financing Constraint
In The Microfinance Industry:
Is Commercialization The Answer? Josephat Mboya Kiweu, Strathmore University, Nairobi-Kenya
ABSTRACT
A critical question facing Microfinance Institutions (MFIs) is whether they can attract commercial
capital as a solution to their financing problem and as a way of relaxing strained development
aid. While donations have made enormous contributions to microfinance development and poverty
reduction among the poor to date, an attempt to scale-up funding from this traditional source has
been an uphill task. It is argued that vast resources of commercial capital can become available to
microfinance if critical success strategies of access to commercial funding are developed. This
paper offers research evidence that identifies significant predictors for successful
Commercialization of microfinance based on firm-level data from African MFIs for three financial
years between 1998 and 2003. The research develops and tests a commercial rating rule
(predictive model) for determining success in tapping commercial capital. The results indicate the
emergence of new finance sources, widened financing options for MFIs and the capacity to relax
growth constraints in the industry. However, the findings also suggest the need for MFIs to satisfy
the interests and requirements of prospective commercial investors to overcome new challenges.
Keywords: Development Finance and Assistance; Commercial Capital; Financial Markets; Donor Funding;
Commercialization; Critical Success Factors
INTRODUCTION
or a long time now, the main source of financing for the microfinance1 sector has been dominated by
development aid (non-commercial sources of capital). Understandably, financial markets or private
capital has played a minimal role in this poverty-focused industry which continues to thrive on
finance sources whose allocation is based on development aims as opposed to profit maximization. However, if the
sector is to relax the current financing constraint on growth and meet its goal of serving a large portion of the
world‟s poor with much needed financial services, it must develop access to commercial capital as an alternative
financing strategy. This paper presents research evidence and insight into how microfinance institutions (MFIs)2 can
achieve successful Commercialization by integrating their financing strategies to the larger financial system3
(Meehan, J., 2004; De Sousa-Shields, M. et al., 2004; Ivatury, G. and Abrams, J., 2004; Ivatury, G. and Reille, X.,
2004; and ADB, 2000).
MFIs‟ concerns on ability to succeed in attracting commercial finance, the lack of management capacity
and exposure in dealing with commercial markets are investigated (USAID, 2005). This study underscores the
importance of Commercialization (defined as the funding of a MFI's expansion operations and lending portfolio
with commercial finance) and the relevance of its contribution to the furtherance of the aims and objectives of the
microfinance initiative.
1 Microfinance is defined as the provision of a broad range of financial services, such as deposits, micro-loans, payment services,
money transfers, and insurance to poor and low-income households and their micro-enterprises. (ADB, 2000). 2 Microfinance institutions or MFIs are defined as institutions whose major business is the provision of microfinance services. 3 Microfinance can contribute to the development of the overall financial system through integration of financial markets.
F

Journal of Business & Economics Research – October 2011 Volume 9, Number 10
88 © 2011 The Clute Institute
RELEVANT LITERATURE AND MICROFINANCE FUNDING ENVIRONMENT
The definitions of the word „commercialization‟ include the following terms: managing on a business basis,
expansion of profit-driven or commercially-oriented microfinance; and financing microfinance operations for the
poor from commercial sources (Christen and Drake, 2001; Poyo and Young, 1999; Charitonenko, S. et al., 2004;
Halpern and Kelly, 2002; Dunford, C., 2000; Christen, R., 2000; ADB, 2000; and Kiweu, J.M. and Biekpe, N.,
2005). The term also refers to the evolution of MFIs from donor-driven to market-driven microfinance. This paper
adopts a comprehensive view of microfinance commercialization (defined as the funding of a MFI's expansion
operations and lending portfolio with commercial finance) and considers use of commercial sources as part of the
definition.
Relevant Literature
The literature on microfinance is abundant, but the majority of the studies tend to be descriptive with little
evidence and tentative research findings due to inadequate data. Early studies in the microfinance sector were faced
with the problem of data unavailability for rigorous empirical analysis. Subsequently, a few studies have begun to
offer in-depth analysis of specific topics and dimensions (Meehan, J., 2004). Notwithstanding, these studies have
contributed to a better understanding of the general issues and emerging trends in microfinance development. The
studies and survey cases related to the idea of commercializing microfinance4 are focused on conceptual industry
trends rather than empirical perspectives.
Maria Otero (1997) acknowledges that commercialization is inevitably necessary for microfinance to
prevail beyond our lifetime (Halpern and Kelly, 2002). McKee, K. (2001) also states, “financial growth with
commercial debt has become more common in mature microfinance markets”. Certainly the changing landscape in
financing microfinance is tending towards the domain of the commercial markets and away from the donor-world
(Rhyne, E. (1998); Christen, R. and Drake, D., 2001; CGAP, 2002; USAID, 2005; Halpern and Kelly, 2002; and
IFC, 2001).
A recent survey by CGAP of 144 MFIs from around the world found that over 90% still feel donor funding
is the most appropriate form of financing (De Sousa-Shields, M. and Frankiewicz, C., 2004). A number of studies
have emphasized the challenge MFIs are likely to face in accessing commercial funds (Halpern and Kelly, 2002;
ADB, 2000; USAID, 2005; and Meehan, J., 2004). This is expected because approaches to raise funds from the
commercial markets are not well developed. However, the change from traditional methods of funding (such as
donations) is essential, and therefore the transformation process is inevitable to escape from the donor trap.
Pioneers and promoters of microfinance development agree that commercialization is the most appropriate
financing strategy for the microfinance sector (Mcgillivrary, G., 2002; Halpern and Kelly, 2002). This paper
addresses the central question of how MFIs can access commercial capital and become part of the larger financial
system, and it examines the strategy of commercialization, in general, and, in particular, seeks to contribute to the
debate by availing evidence based on the experience of African MFIs, as well as the extent of integration of MFI
financing to the financial markets. It develops the pathway through which a MFI can become part of the financial
landscape and investigates the factors that underpin success in commercializing microfinance institutions.
Traditional View
The appropriate method of financing microfinance has been a fundamental issue of concern over the last
five years. Proponents of poverty-focused microfinance (Charitonenko, S., 2003) believe that microfinance, as a
social product, should not be offered on a for-profit basis. The basis of this argument is that pioneer institutions in
the sector were non-profit making, mostly microfinance NGOs that were favoured by non-commercial capital. This
created the unique precedence where funding continued to come from “donor sources”, hence the name donor
4 This paper considers commercial microfinance to be the provision of microfinance services based on a for-profit agenda and
sustainable principles. It also includes embracing commercial attitudes and beliefs as well as market-based practices for efficient
delivery of financial services to a customer base that is essentially poor.

Journal of Business & Economics Research – October 2011 Volume 9, Number 10
© 2011 The Clute Institute 89
industry. As a result, allocation of capital is based on development aims as opposed to profit maximization (De
Sousa-Shields, M. and Frankiewicz, C., 2004).
The main concern of the adoption of the cmmercialization process is called mission drift5 by international
microfinance professionals because the industry is mostly driven by a social mission (Christen, R., 2000; Rhyne, E.,
1999; and Dunford, C., 2000). According to this school of thought, MFIs require loan capital that is not charged on a
commercial basis and embracing commercial practices would hurt their core clients. While the traditional view of
microfinance funding has evolved over time, the transition from traditional funding sources to commercial capital
has been a struggle for many MFIs because of the donor influence.
Commercial View
Proponents of commercialization argue that there is a direct relationship between the growth of an
organization and the need for external financing. All things being equal, the higher the rate of asset growth, the
greater the need for external financing will be (Upneja and Dalbor, 2001, and Vasilious and Karkaziz, 2002).
Funding growth with commercial debt has become more common in mature microfinance markets such as
Indonesia, Latin America, Bosnia, Uganda, Morocco, Ghana and Sri Lanka (McKee, K., 2001, and Charitonenko, S.
et al., 2004). Meehan, J. (2004) observes that the industry is quickly transforming, but its funding approach is still
sandwiched between donations and a transition to commercial sources.
From the commercial point of view, the practice of commercial microfinance observes the principle of
offering financial services to the poor on a sustainable basis and believes that financing should therefore not be tied
to donations only. Recent studies (Meehan, J., 2004; Charitonenko, S. et al., 2004, and De Souza, M. et al., 2004)
show an increasing interest by the commercial markets in financing microfinance. Both are motivated by the huge
funding gap of $300 billion and exploration for other sources by MFIs. Sustainable development for microfinance
now depends upon capacity of MFIs to access additional capital.
DATA AND METHODOLOGY
For this study, cross-country data of 103 African MFIs were sampled from the MIX MARKET ™ web-
based microfinance information database. MIX MARKET ™ (Microfinance Information eXchange) is a global
database with data on 435 MFIs, 68 investors and 112 partners at the time (2004) of this study.
Data Collection and Sample Description
The sampling frame consists of the total population of African MFIs contributing data to the MIX between
1998 and the end of calendar year 2003. This constituted 188 African firms. According to Ozkan (2001), Peyer;
U.C. and Shivdasani, A., 2001; Hendricks, K.B. and Singhal, V.R., 2001) and Laitinen (2002), the sampling
criterion for the inclusion of a firm in the model was defined as those MFIs with financial data for three consecutive
years between 1998 and 2003. This definition resulted in a final sample of 103 MFIs and 309 observations after
eliminating firms with missing observations or those with non-continuous data series. This represented 55% of the
total population of all 188 Africa firms drawn from 21 countries.
Measuring Success in Commercialization: Conceptualization of the Dependent Variables
The measure of success in commercialization was one of the challenges of this study. Two measures of the
likelihood of success in Commercialization were investigated at two levels and constructed as:
Level I Success of Measure: Leverage Multiplier Added
Success in level I was measured by a single cardinal measure for gauging the probability of success in
tapping the commercial markets. This measure was defined as the equity multiplier (EM), which is the basic ratio of
5 The conflict on commercialization and its impact on depth of outreach relates to the trade-off between commercialization (concern for
profit maximization) and the provision of financial services to the poor and the poorest. Relating to commercialization studies in Asian
countries, Charitonenko, S. et al. (2004) proves that experience to date indicates that there have been no negative effects of
commercialization serving the poor because of the continued existence of a demand/supply gap.

Journal of Business & Economics Research – October 2011 Volume 9, Number 10
90 © 2011 The Clute Institute
total assets to equity (sometimes called capital). It represents the amount of assets supported by each shilling of
equity/capital. Using the traditional balance sheet equation, total assets are financed by either equity or liabilities
(L).
)()()( EEQUITYLSLIABILITIEAASSETS (1)
Equity multiplier is therefore expressed as total assets (A) divided by total equity (E).
EAEM / (2)
This ratio is the inverse of the capital ratio used by banks to evaluate financial distress and capital adequacy
(Panday, 1981; Whitaker, 1999; Demirguc-Kunt, A. and Maksimovic, V., 1998; Pille and Parade, 2002; Motwal,
2002, and Ozkan, A., 2001). An increase in EM indicates a higher level of commercial financing (L) or debt
financing. When this ratio is 2:1, it represents 50% financing by interest-paying liabilities (debt). The ratio,
therefore, indicates the degree of financial leverage. If a MFI has no debt (that is if L tends to zero), the EM is equal
to one [1] and it increases as more debt is taken into the balance sheet. This increase in financial leverage over time
was defined as LMA (leverage multiplier added) and is formulated as:
LMAtRatingEMtRatingEM )()1( (3)
The equity multiplier rating is by itself a measure of how successful a MFI was in attracting commercial
financing. LMA is maximized if the EM rating increases from one period to the next. Success in commercialization
was measured by the demonstrated increase of LMA (t+1) compared to that of the previous period. Thus, the
relative change in EM rating for two consecutive years over a three-year time interval (between 1998 and 2003) was
used to classify sample MFIs into successful and less successful in commercialization (Hendricks, K. and Singhal,
2001, and Jain, B.A., 2001). The increase in relative LMA in years 1 and 2 was used rather than over the three-year
interval in order to provide a control measure for chance events. Thus success, as defined in this way, captures a
working commercial financing strategy rather that erratic movements that result from business cycles (St. John, C.H.
et al., 2000, and Laitinen, E.K., 2002).
Those MFIs that demonstrated an increase in LMA rating in both periods 1 and 2 were classified in the
model as successful and coded 1, while those that showed a decline in relative LMA were classified as less
successful and coded 0. This measure of success used for the binary classification of the sample resulted in 55
successful and 48 less successful MFIs.
Level II Measure of Success: Commercialization Index
The second success measure of commercialization is a composite index called commercialization index or
C-index. This is a ranked measure of success estimated as a factor of several integrated financial performance
measures (Neely, A. et al., 2000). The performance measures seek to convey relevant dimensions of sustainable
success in commercial microfinance from the viewpoint of a potential investor. The index aggregates nine
performance indices and 15 measurement criteria - m 1-15 weighted on a scale of -12 to 12 and centered at zero. The
following indices were used to form the data for index construction:
1. Access to commercial funding; (equity multiplier rating [EMR]- m1) , P i 1
2. Sustainable growth rate (SGR); (return on equity [ROE]- m2-), (total asset growth % [TAG] –m3), (return
on assets [ROA]- m4) , P i 2
3. Service quality; (number of borrowers [NB] – m5), P i 3
4. Quality of portfolio (control for rapid growth); (portfolio at risk [PAR]-m6), P i4
5. Earning potential and long-term viability of the MFI; (net interest position [NIP]- m7), (return on equity
[ROE]- m2), (inflation [i]- m8), (commercial lending rate [lR]- m9), P i 5,
6. Country level of economic growth; [GDP-r]- m10,(growth –retrenchment [G-R]-m11), P i6
7. Cash flow adequacy; (Internal cash ratio [ICR]-m12), (operating self-sufficiency [OSS]-m13) and, P i7
Journal of Business & Economics Research – October 2011 Volume 9, Number 10
© 2011 The Clute Institute 91
8. Financial distress and mortality risk; (capital ratio [CR]-m14, P i 8
9. Financial reporting transparency/standard; (information opacity/disclosure level [OL]-m15) P i 9
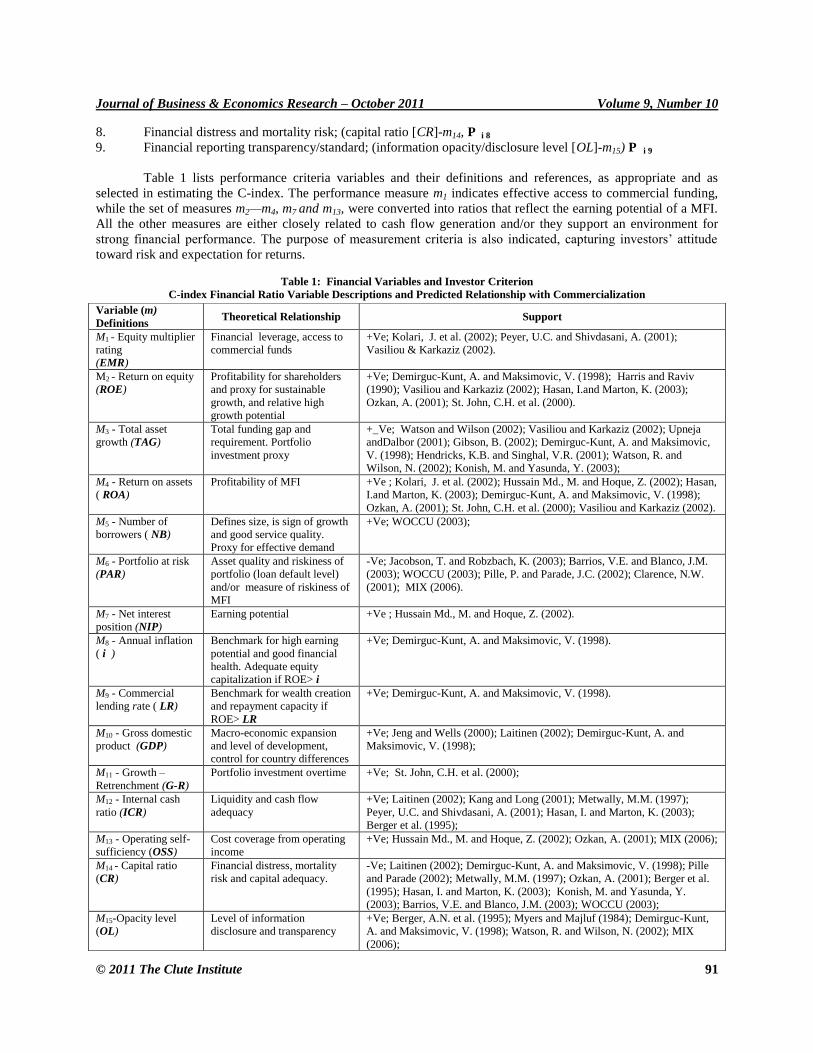
Table 1 lists performance criteria variables and their definitions and references, as appropriate and as
selected in estimating the C-index. The performance measure m1 indicates effective access to commercial funding,
while the set of measures m2—m4, m7 and m13, were converted into ratios that reflect the earning potential of a MFI.
All the other measures are either closely related to cash flow generation and/or they support an environment for
strong financial performance. The purpose of measurement criteria is also indicated, capturing investors‟ attitude
toward risk and expectation for returns.
Table 1: Financial Variables and Investor Criterion
C-index Financial Ratio Variable Descriptions and Predicted Relationship with Commercialization
Variable (m)
Definitions Theoretical Relationship Support
M1 - Equity multiplier
rating
(EMR)
Financial leverage, access to
commercial funds
+Ve; Kolari, J. et al. (2002); Peyer, U.C. and Shivdasani, A. (2001);
Vasiliou & Karkaziz (2002).
M2 - Return on equity
(ROE)
Profitability for shareholders
and proxy for sustainable
growth, and relative high
growth potential
+Ve; Demirguc-Kunt, A. and Maksimovic, V. (1998); Harris and Raviv
(1990); Vasiliou and Karkaziz (2002); Hasan, I.and Marton, K. (2003);
Ozkan, A. (2001); St. John, C.H. et al. (2000).
M3 - Total asset
growth (TAG)
Total funding gap and
requirement. Portfolio
investment proxy
+_Ve; Watson and Wilson (2002); Vasiliou and Karkaziz (2002); Upneja
andDalbor (2001); Gibson, B. (2002); Demirguc-Kunt, A. and Maksimovic,
V. (1998); Hendricks, K.B. and Singhal, V.R. (2001); Watson, R. and
Wilson, N. (2002); Konish, M. and Yasunda, Y. (2003);
M4 - Return on assets
( ROA)
Profitability of MFI
+Ve ; Kolari, J. et al. (2002); Hussain Md., M. and Hoque, Z. (2002); Hasan,
I.and Marton, K. (2003); Demirguc-Kunt, A. and Maksimovic, V. (1998);
Ozkan, A. (2001); St. John, C.H. et al. (2000); Vasiliou and Karkaziz (2002).
M5 - Number of
borrowers ( NB)
Defines size, is sign of growth
and good service quality.
Proxy for effective demand
+Ve; WOCCU (2003);
M6 - Portfolio at risk
(PAR)
Asset quality and riskiness of
portfolio (loan default level)
and/or measure of riskiness of
MFI
-Ve; Jacobson, T. and Robzbach, K. (2003); Barrios, V.E. and Blanco, J.M.
(2003); WOCCU (2003); Pille, P. and Parade, J.C. (2002); Clarence, N.W.
(2001); MIX (2006).
M7 - Net interest
position (NIP)
Earning potential
+Ve ; Hussain Md., M. and Hoque, Z. (2002).
M8 - Annual inflation
( i )
Benchmark for high earning
potential and good financial
health. Adequate equity
capitalization if ROE> i
+Ve; Demirguc-Kunt, A. and Maksimovic, V. (1998).
M9 - Commercial
lending rate ( LR)
Benchmark for wealth creation
and repayment capacity if
ROE> LR
+Ve; Demirguc-Kunt, A. and Maksimovic, V. (1998).
M10 - Gross domestic
product (GDP)
Macro-economic expansion
and level of development,
control for country differences
+Ve; Jeng and Wells (2000); Laitinen (2002); Demirguc-Kunt, A. and
Maksimovic, V. (1998);
M11 - Growth –
Retrenchment (G-R)
Portfolio investment overtime
+Ve; St. John, C.H. et al. (2000);
M12 - Internal cash
ratio (ICR)
Liquidity and cash flow
adequacy
+Ve; Laitinen (2002); Kang and Long (2001); Metwally, M.M. (1997);
Peyer, U.C. and Shivdasani, A. (2001); Hasan, I. and Marton, K. (2003);
Berger et al. (1995);
M13 - Operating self-
sufficiency (OSS)
Cost coverage from operating
income
+Ve; Hussain Md., M. and Hoque, Z. (2002); Ozkan, A. (2001); MIX (2006);
M14 - Capital ratio
(CR)
Financial distress, mortality
risk and capital adequacy.
-Ve; Laitinen (2002); Demirguc-Kunt, A. and Maksimovic, V. (1998); Pille
and Parade (2002); Metwally, M.M. (1997); Ozkan, A. (2001); Berger et al.
(1995); Hasan, I. and Marton, K. (2003); Konish, M. and Yasunda, Y.
(2003); Barrios, V.E. and Blanco, J.M. (2003); WOCCU (2003);
M15-Opacity level
(OL)
Level of information
disclosure and transparency
+Ve; Berger, A.N. et al. (1995); Myers and Majluf (1984); Demirguc-Kunt,
A. and Maksimovic, V. (1998); Watson, R. and Wilson, N. (2002); MIX
(2006);
Journal of Business & Economics Research – October 2011 Volume 9, Number 10
92 © 2011 The Clute Institute
C-index Construction
The index was modeled using a three-year time series data (2001–2003). It uses the later two years‟ (2002 –
2003) data for development of the measure of future success and one year‟s (2001) financial information for
predicting the success in Commercialization over two years (Laitinen, 2002; Pille, P. and Paradi, J.C., 2002; and
Kolari, J. et al., 2002). Index values are determined by a scoring process of the 15 criteria measures -m 1-15 (financial
ratio variables) grouped in the nine indices. The C-index consists of both a weight and a commercial financing rating
(CFR) component for each of the nine performance indices (Hendricks, K.B. and Singhal, V.R., 2001, and Laitinen,
2002). The following formula demonstrates how index values are obtained through the CFR scores of each MFI:
CIij (Index 2002-2003) = SUM{CFR Scores [ P i 1, P i 2,, P i 3, P i4, P i 5, P i6, P i7, P i 8, P i 9 ] m j }
The measures of the index indicate the ease with which a MFI can tap capital from the wider financial
market system. The index, therefore, defines the degree of commercial orientation and informs management of the
likelihood of success, should the MFI decide to seek commercial funding.
The CIij index scores are scaled from 0 – 25, with a maximum possible score of 25 whilst the least is 0.
Higher CFR scores indicate the likelihood of successful commercialization. The median score (M) under this scale
is 13 CFR scores, which is the critical value for the binary classification.
Classification of sample MFIs into successful and less successful in commercialization was based on the
index values (or CFR scores), with the cut-off being the median score of 13 CFRs. The binary classification
indicates those classified as “successful” and coded as 1, while those scoring less than 13 CFRs were classified as
“less successful” and coded as 0. This measure of success used for the binary classification of the sample resulted in
45 successful and 58 less successful MFIs.
Independent Variable Description
The set of explanatory variables (x1, . . . , xn) used were selected based on a literature review. This research
intends to provide an exploratory analysis of investor attraction factors for the unique industry of microfinance. In-
depth analysis of the 33 variables was carried to determine significant drivers of commercial funding. Table 2
provides a description of the independent variables used in this study.
The list of predictor variables can generally be categorized into firm level financial parameters and non-
financial performance indicators (St. John, C.H., 2000). The set consists of three types of independent variables: 1)
financial sustainability factors and the all-familiar traditional banking indicators of sound banking practice and
safety in lending, 2) microfinance industry critical performance indicators and benchmarks, and 3) macro-economic
factors included to mitigate the differences between countries and control for both observable and unobservable time
effects (Laitinen, 2002, and Demirguc-Kunt, A. and Maksimovic, V., 1998).
Research Methods: Model Estimation
In this study, an examination of the relative importance of the 33 variables in explaining success in
commercialization of African MFIs is undertaken. The focus is to develop significant predictors for successful
commercialization. The main hypothesis for all the tests is: Success factors differ for MFIs that are less successful in
commercialization than those that are not. In order to obtain robust results for the predictive ability of the
explanatory variables and sub-models, their performance was tested with different estimation methods.
Initial tests use random forests technique (RF) to identify significant predictors of success. Besides being
computationally effective, the method is proven not to overfit and is less sensitive to system complaints (noisy data)
compared to convectional logistic regression and discriminant analysis methods (Laviriere, B. and Van den Poel, D.,
2004).

Journal of Business & Economics Research – October 2011 Volume 9, Number 10
© 2011 The Clute Institute 93
Table 2: Independent Variables Description and Formulae
Predictor Variables Used in this Study (Notes, Notation Used in Analysis)
X1 Number of years since started operations (Maturity, AGE)
X2 MFI supervision by the national central bank (Regulation, d_REGUL)
X3 Registration form (Legal structure, d_LFORM: fi, ngo, coop, bank)
X4 Portfolio Investment overtime or divesture (Growth-retrenchment, d_GRPOST)
X5 Profit margin (Sustainability level, PROFIT)
X6 Efficiency in operations (operating efficiency, OEXPR)
X7 Earning potential of performing assets, cost saving ability (Earning Asset Ratio, EAR)
X8 Number of borrowers (Active clients – Size, BORROWERS)
X9 Portfolio size (Dollar amount, SIZEGPF)
X10 Information disclosure and level of opacity (information asymmetry, d_INFOTPR)
X11 Asset quality and default risk (Portfolio at risk, PAR)
X12 Asset structure (Net loans to total assets, ASETSTRUC)
X13 Level of indebtedness, risk profile of MFI (Debt equity ratio, GEARING)
X14 Poverty outreach (Average loan size in dollars, LONSIZE)
X15 Poverty lending focus, depth of outreach (Average loan size per GNI, DEPTHRCH)
X16 Level of richness of country of operation (GNI per capita, GNI)
X17 Economic stage of the country of operation (GDP growth %, GDP)
X18 Pricing efficiency, economic cost of capital (Annual inflation rate, INFLA)
X19 Cost of funds/capital (market lending rates and/or 90-day treasury bills rates, LEDGRTE)
X20 Size of equity, Investor safety (Equity to total asset %, EQBASE)
X21 Level of savings on financing costs, increased earning potential (EAR*interest rates, COSTSAV)
X22 Access to donations or quasi-equity (main source of funding, d_DONOR )
X23 Number of personnel, total staff level (Size, PERSONEL)
X24 Asset base (Total assets, size, TASSETS)
X25 Capacity to generate cash flow from performing assets (Retained earnings/G portfolio, EARNSUFF)
X26 Operating self-sufficiency, (Operating/operating/expenses, OSS)
X27 Return on assets (Net income/total assets, ROA)
X28 Return of equity (Net income/equity, ROE)
X29 High earning potential, maintaining equity base( ROE>= inflation, d_FINHEALTH)
X30 Maximising shareholder value, capacity to repay costly debt (ROE>=lending rates, d_RPMTCAP)
X31 Fast growing MFI (TAG>=ROE, d_FASTGRO)
X32 High growth prospects, enabling environment (TAG>=inflation, d_HGOP)
X33 Relative access to commercial funds (d_LMR/CFR)
The prefix “d_” reflects that the variable was operationalised as a dummy number or character.
Random Forests Technique
In this study, the random forests (RF) technique was used to predict MFIs‟ success in commercialization
and to identify significant predictors. In the conceptualization of the dependent variable, random forest was used as a
binary classification tool. RFs, as part of decision trees6 (DT), have become very popular because of their ease of
use and interpretability (Lariviere, B. and Van den Poel, D., 2004), as well as their ability to deal with covariates
measured at different measurement levels (including nominal variables).
The random forests method7 uses single classification trees where many trees are grown to form a forest,
and each tree predictor in the forest depends on the value of some random vector (Breiman, L., 2003). After a large
number of trees are generated, the trees vote for the most popular class; hence, this method is called “random
forests”. According to Breiman, L. (2003), a random forest is a classifier consisting of a collection of tree-structured
classifiers {h (x,0k ), k=1,…} where the {0k} are independent, identically distributed random vectors and each tree
casts a unit vote for the most popular class at input X.
6 A Decision Tree Forest is an ensemble (collection) of decision trees whose predictions are combined to make the overall
prediction for the forest. 7 The theoretical underpinnings of the random forests program are laid out in the paper "Random Forests" by Leo Breiman and
Adele Cutler. It's available on “Random Forest reference manual”, http://ucsu.colorado.edu/_breitenm/. Also found in
http://oz.berkeley.edu/users/breiman/Using random forests V3.1.pdf.

Journal of Business & Economics Research – October 2011 Volume 9, Number 10
94 © 2011 The Clute Institute
In this study, the random forests are selected as proposed by Breiman (2001) who uses the strategy of a
random selection of a subset of m predictors to grow each tree, where each tree is grown on a bootstrap sample of
the training set. Each tree then gives a classification which, as it were, constitutes the tree‟s vote for that class. These
votes are combined to make the overall prediction for the forest. The forest chooses the classification having the
most votes (over all the trees in the forest). By this process, the model estimates the variables that are important in
the classification.
THE EMPIRICAL RESULTS: FINDINGS
This section presents the findings of relative importance of each of the explanatory variables with respect to
successful commercialization.
Relative Important Indices for the Explanatory Variables
RF classifies the importance of the variables in terms of the ones that have the greatest impact on the
dependent variable of investigation. Thus, the most important one (the one used the most for the splits of the
classification trees) is scored as 100 and the rest are scored relative to the most important one. The seven most
important variables are graphed in Figures 1 and 28. The variable ROA came out as most important, with a score of
1.0000. By using a cut-off value of 0.005 (derived from the training data), it was able to classify 78% of the 0's
correctly and 70% of the 1's correctly. The listing of important indices, with regard to each explanatory variable of
the study, indicate that the next seven variables, in order of importance, are: profit, depth of reach, GDP growth rate,
loan size, gross portfolio, personnel, and age.
A number of interesting, but not surprising, findings emerge from the list of effective predictors of success.
The five most important variables are indicative of the importance of good financial returns (ROA and ROE) wanted
by investors, but also reflects concern on the cost of funds. It is observed that the model was able to highlight
information opacity as a key predictor of success in commercialization. This is a very important finding, given the
scarcity of information provision for making investment decisions in Africa. The listing also underscores the
importance of the risk profile, quality of asset (PAR) and ability to absorb new capital (level of indebtedness) for
MFIs that would be successful in accessing commercial funding.
While the random forest analyses provide a clear understanding of the explanatory variables that have a
strong impact on the two dependent variables of this study, the direction of their impact is still unknown. Therefore,
further analyses were undertaken on the entire sample by the step-wise analysis of the logistic models to assist in
exploring the direction of the most important predictors.
Figure 1: Top 7 Variables
8 This results are based on a random split of the data into 2 parts; a training set (60%) and a test set (40%). The model was built
on the training set and then tested on the test set.

Journal of Business & Economics Research – October 2011 Volume 9, Number 10
© 2011 The Clute Institute 95
Figure 2: Most Important Variable, ROA
Factor Analytic Logit Model Results
To avoid both the problem of multi-collinearlity among explanatory variables and the possibility of too
many variables in the analysis, a factor analysis was performed on all the variables, similar to that suggested by Jain,
B.A. (2001) and Liu and Lee (1997). The general purpose of factor analytic procedure was to summarize the
information in the original predictors with minimum loss and also to gain a strategic fit in the model as some
variables could mask others. The other objective was to reduce the set of variables and use critical success factor
scores9 in estimating a maximum likelihood logit model with successful commercialization as a dependent variable.
The basic assumption is that each variable can be expressed as a linear combination of hidden factors that
affect the variable and possibly other variables (Jain, B.A., 2001). Only 22 variables are subjected to a principal
component analysis by the SAS FACTOR procedure to extract the most likely explanatory factors. It was not
sensible to execute a factor analysis over nominal variables10
, so these were excluded together with the variable on
age. A study of these factors helped to gain insight into the critical success factors affecting successful
commercialization. Based on eigen-values greater than 1 criterion, a five-factor solution was selected, which
accounted for 63% and 59% of the variance for C-index and LMA rating, respectively. Factor 1 accounted for 22%
for LMA and 18% for C-index. Only factor loadings greater than 0.50 are used to interpret the factors.
The first factor for both dependent variables can be named the profitability model because it is loaded with
commercial viability performance indicators. For the LMA, six variables are loaded onto this factor. It underscores
the importance of financial sustainability and cash flow generation in attracting commercial capital. The most
important three critical success factors are earning sufficiency in terms of cash flow adequacy, ROA and operating
efficiency. This factor suggests that more profitable MFIs are likely to attract commercial capital and be successful
in commercialization, all things being equal.
9 To create an entirely new set of variables for subsequent analysis, composite factor scores are computed to represent each of the
factors. The factor scores are then used as the raw data to represent the independent variables in logit analyses. 10 These were yes or no and also binary variables for: Age, Regul, Lform, GRpost, Donor, FinHealth, RpmtCap, FastGro, HGOp,
InfoTPR

Journal of Business & Economics Research – October 2011 Volume 9, Number 10
96 © 2011 The Clute Institute
The second factor is size and it represents the growth and outreach model. Four factors are selected for the
LMA variable while five factors are loaded for the C-index. Important indicators of size include total assets, gross
portfolio amount, number of borrowers and number of personnel. This suggests that larger MFIs, measured by their
asset base, are likely to be successful in commercialization. The third factor can be called the cost saving model.
Five factors are loaded, which includes earning asset ratio, ability to obtain cheap finance and save on cost of funds,
maintaining high portfolio quality and effective asset structure. The fourth factor - macro environment model -
captures macro-economic variables, and the most important variables include the level of inflation, economic
development, and cost of money in the country. Variables that load to the fifth factor include the loan size and depth
of reach which are associated with social mission or poverty lending in microfinance. It is very clear from the
LMA11
factor loading that larger loan sizes are associated with commercialization. This finding suggests that
commercializing MFIs are associated with mission drift. That is, MFIs that are likely to be successful do not lend to
the poor in their society.
To measure the effectiveness of these five factors as predictors of success in commercialization, a factor
analytic logit model was estimated using factor scores as independent variables. The factor scores were used for all
cases where these five variables were combined with the nominal set for the prediction. The results for the null
hypothesis (LMA, CI =0) are reported in Table 3.
Table 3: Factor Analytic Logit Models (stepwise analysis, 3 allowed) for Total Sample
Explanatory Variable Coefficient Estimates: C-index p- Values: C-index
Intercept 1.7150 0.0332
FACTOR 1 -0.9727 0.0228
FastGro (No) 1.8014 0.0194
RpmtCap („0) 0.8149 0.0038
-2 log likelihood, constant only = 141.143
-2 log likelihood, full model = 101.972
Goodness of fit test, Pearson p value = 0.5758
Goodness of fit test, Deviance p value = 0.3988
Coefficient of concordance 82.2%
Contingency coefficient, original versus logistic fit classification, c = 0.824
F- to-enter significant level = 5%
LMA: (stepwise analysis, 8 allowed respectively)
Intercept 0.0278 0.9337
FACTOR 2 0.9068 0.0163
FACTOR 5 0.7193 0.0145
Finhealth („0) 0.5336 0.1011
GRpost (G) 0.5068 0.0470
Lform (bank) 1.0977 0.0484
Lform (Coop) 0.7304 0.0938
Lform (FI) -0.3834 0.0077
Regul (No) 0.7569 0.0147
-2 log likelihood, constant only = 142.312
-2 log likelihood, full model = 118.088
Goodness of fit test, Pearson p value = 0.2006
Goodness of fit test, Deviance p value = 0.0471
Coefficient of concordance 76.1%
Contingency coefficient, original verses logistic fit classification, c = 0.762
F- to-enter significant level = 0.2
For the C-index, the final logistic model fitted does not include either of the size, macro-economic, or asset
quality variables. The software allowed for testing the overall fit of the model; i.e., how well all the predictors of the
constructs, taken simultaneously, satisfy the criterion validity requirement. To evaluate this overall goodness-of-fit,
several measures were considered. The Pearson Goodness-of-fit test and the Deviance test both show that the fitted
11 The LMA factor analysis seems to be better than the C-index in grouping relevant variables. It also explains more variance.

Journal of Business & Economics Research – October 2011 Volume 9, Number 10
© 2011 The Clute Institute 97
model seems to be fitting well with p-values 0.5758 and 0.3988 for the null hypothesis. The value for the -2 LL
measure indicates the model is good. The performance of the model is also satisfactory given a high coefficient of
concordance of 82.2%. The percentages of predicted probabilities and observed responses mean that 82.2% of
observations are classified as originally identified, while 17.4% are discordant with 0.4% ties. This is indicative of a
high predictive accuracy of the factor analytic model with C-index as the binary variable.
The most significant variables in the logistic model are repayment capacity for commercial loans (Rpmt
cap), existence of growth opportunities (FastGro), and underlying critical success factors in FACTOR 1. Five
profitability indicators are selected in FACTOR 1, with the most influential being earning sufficiency of the
portfolio or liquidity (EarnSuff), operating efficiency and return on assets (ROA). The negative coefficient for
FACTOR 1 (profitability model) means that a MFI has a high probability of failure to succeed in commercialization
(low CI-value) if its ability to earn profit on earning assets is low. As expected, low or no growth opportunity in the
country of operation diminishes chances of success in commercialization. This result is interesting as it confirms
other research findings that fast-growing firms need external finance (Upneja and Dalbor, 2001). The findings also
emphasize that commercial funds are costly and that a MFI must have the ability to raise sufficient return to repay
costly debt as well as maximize shareholder value.
The LMA measure of simple increase of leverage singles out the legal form of an institution as important in
attracting investors. It emerges that being an NGO-MFI is positively associated with access to capital, unlike
institutions that are banks, financial institutions or cooperatives. As can rightly be predicted, being under the
supervision of the national central bank (regulated) is important in accessing commercial capital. Regulated
institutions are seen by investors as more safe than unregulated ones. FACTOR 5 (social mission model) is
significant with a positive coefficient. It settles the long-term debate as to whether commercialization causes mission
drift in microfinance. It is clear that commercializing MFIs will have larger loan sizes and low depth of reach which
is not consistent with serving the poor. Finally, the results support the conjecture that larger MFIs are successful in
attracting commercial investors. The size of the organization says something about absorption capacity given small
loan sizes in the microfinance industry. Investors, therefore, will be looking at larger and profitable MFIs for their
investment portfolios.
Having identified the success factors for accessing commercial funding brings the question, “Are MFIs in
Africa able to meet the conditions set by the indicators of success?” The next section explores the major issue of
whether commercialization is taking root in Africa, and or profiles the degree of commercial access across firms,
countries and regions in the continent. The trend in the region and what institutions are relying on for their growth
needs is also reported.
Studying the Evolution of Commercial Funding Patterns across Countries in Africa
The country likelihood of future success with commercial microfinance is investigated in order to
maximize the modelling of reality. The results of the examination of which sources of finance are likely to play a
major role in relaxing the financing constraint on growth MFIs in Africa are also shown. Focus was put on efforts
made by African MFIs in tapping the financial markets in comparison to waiting on donations. The examination of
the 21-country sample looked at dynamics of commercial microfinance, following estimation procedure suggested
by Demirguc-Kunt, A. and Maksimovic, V. (1998). Thus, for each MFI, the predicted rating binary variable was
obtained for either the C-index or LMA rating. As necessary, dummy variables were formed for each MFI, based on
the parameter under investigation that takes on the value of 1 and 0. For each country, the proportion of MFIs that
have access to commercial funding over the sample period was found. Performance results on degree of success
with commercialization per country are shown in Table 4 for the estimated leverage ratios of sample countries.

Journal of Business & Economics Research – October 2011 Volume 9, Number 10
98 © 2011 The Clute Institute
Table 4: Proportion of Portfolio Supported by Donations (quasi-equity financing) over Sample Period (’98-’03)
Country Yr 3 Yr 2 Yr 1 Leverage ratio
All Africa 52% 52% 57% 48%
Benin 43% 57% 43% 57%
Cameroon 25% 13% 38% 75%
Congo DRC 0% 0% 25% 100%
Egypt 40% 40% 80% 60%
Ethiopia 64% 73% 64% 36%
Ghana 100% 100% 50% 0%
Cote d‟Ivoire 0% 0% 0% 100%
Kenya 57% 71% 71% 43%
Madagascar 22% 33% 33% 78%
Mali 67% 33% 33% 33%
Morocco 100% 100% 100% 0%
Mozambique 0% 0% 100% 100%
Nigeria 75% 100% 75% 25%
Rwanda 100% 100% 100% 0%
Senegal 67% 67% 67% 33%
South Africa 50% 50% 50% 50%
Tanzania 80% 100% 100% 20%
Togo 40% 20% 20% 60%
Tunisia 100% 100% 100% 0%
Uganda 53% 40% 60% 47%
Zimbabwe 100% 67% 67% 0%
In terms of the relative proportions of the different types of financing, Table 4 indicates an almost equal
proportion between IBF (interest bearing funds-all forms of debt plus savings deposits) and N-IBF (donations plus
share capital and retained earnings) for MFIs in Africa. By and large, quasi equity (donations) play an important
financing role. This notwithstanding, a transition is taking place. There is a greater use of IBFs over time. Columns
II to IV provide an estimate of the trend over three years and defines commercialization efforts per sample country.
For example, three years ago, 57% of the portfolio in sample Africa MFIs was financed by donations, internal
resources, and share capital. This has continued to decrease over time and now stands at 52%. This reflects a
gradual replacement of donations and equity capital with commercial capital. Different countries across Africa have
differing choices of finance type and/or practice. Some have a reverse trend while others are moving away from
donations.
While it is true that most MFIs tend to rely on donations, the importance of this source of finance seems to
be declining. Clear examples of increased attraction of interest-bearing debt (commercial capital) include Egypt,
Kenya, Madagascar, and Tanzania. From a country perspective, this is where the strategy of commercialization in
Africa is taking root. The results are also consistent with what is happening in those counties; for example, the first
microfinance bank in Africa was started in Kenya in 1999! Subsequently, in 2005, the first MFI to issue a bond was
in Kenya. Countries with high levels of non-interest bearing finance sources include Ethiopia, Morocco, Nigeria and
Senegal. It is to be noted that in Africa, Ethiopia was the first country to enact a microfinance regulatory bill in
1996. As expected, equity financing plays a key role.
Column V of Table 4 indicates the estimated proportion (All Africa - 48%) of portfolio financed by
commercial funds over the sample period. Not surprisingly, sample MFIs generally obtain as much funding from
donors as from commercial sources. The results are reflective of two things: 1) that some MFIs have been more
successful in commercialization or 2) some countries have better enabling environment for commercialization to
thrive more than others across the continent.. This development in Africa, per these results, is comparable with the
larger trend of the industry as obtained in studies of funding patterns in Latin America (Jansson, 2003). Jansson
(2003), in a study of 97 MFIs in 14 countries, reported that regulated institutions tend to rely less and less on
subsidized funds and more on savings deposits. He notes that financial leverage generally increases after
transformation, and if funding is accessible in the country, the leverage of institutions will increase rapidly. The
results show that the speed of increase in financial leverage per country depends much on the dynamism of the

Journal of Business & Economics Research – October 2011 Volume 9, Number 10
© 2011 The Clute Institute 99
market12
and level of development of the finance sector. Judging from the estimated leverage ratio and observed
trend, it is indicative that the next important finance source for microfinance in Africa is commercial funds. This
source of finance is therefore likely to play a major role in relaxing the financing constraint on growth of MFIs in
Africa.
Where are the Next Portfolio Investments in Microfinance Likely to be Found?
In this section, the likelihood of success with commercialization based on the measures of success are
explored: leverage multiplier added and C-index rating. Table 5 carries a summary of the degree to which MFIs in a
country are likely to succeed in Commercialization and also the current access levels to private capital. Higher
percentages indicate higher proportion of MFIs likely to succeed in the country or status of commercial capital
access, while low values show higher dependency on donations.
Table 5: Commercial Access Status and Likelihood of Success Ranking
Country Commercial Funding Access Status Country Success Likelihood
Nigeria 1.00 Tunisia 100%
Senegal 1.00 Morocco 100%
South Africa 0.75 Uganda 73%
Benin 0.71 Kenya 71%
Madagascar 0.67 Senegal 67%
Zimbabwe 0.67 Benin 57%
Ethiopia 0.64 Ethiopia 55%
Kenya 0.57 Nigeria 50%
All Africa 0.53 Congo DRC 50%
Congo DRC 0.50 All Africa 44%
Ghana 0.50 Tanzania 40%
Morocco 0.50 Mali 33%
Uganda 0.47 South Africa 25%
Tanzania 0.40 Cameroon 25%
Togo 0.40 Togo 20%
Mali 0.33 Madagascar 11%
Cameroon 0.25 Zimbabwe 0%
Egypt - Rwanda 0%
Cote d‟Ivoire - Mozambique 0%
Mozambique -
Cote d‟Ivoire 0%
Rwanda - Ghana 0%
Tunisia - Egypt 0%
Column II of Table 5 presents an index measure of proportion of MFIs accessing commercial funding
across countries in Africa and access increases with higher index values. This ranking of country attraction of
commercial capital reflects the status and/or probability of firms likely to succeed in commercial microfinance. The
critical value was set at 50% where the assumption was made that ranking of commercial success predicts an
MFI/country as successful when a percentage higher than 50% is obtained. Thus, less than half (40%) of the MFIs in
Tanzania have access to the capital markets and therefore adopted a commercialization strategy for funding their
portfolio. The results show that the sample just passes the 50% mark (Africa overall - 53%) to suggest that most
MFIs in the continent, as estimated, can attract and are tapping commercial capital. This status ranking confirms that
Africa, as a continent, has just started the transition to private capital and is indeed breaking away from donations or
traditional approaches of financing microfinance (Cheritonenko, S. et al., 2004).
12 In some countries such as Cote d‟Ivoire, Rwanda, DRC Congo and Mozambique the results reflect more on the low
development of the finance sector. In some cases, the stated percentages may reflect a dysfunctional economy or industry while
in other countries it shows government subsidies or market distortion. This is the case of Tunisia, Morocco, and Zimbabwe.

Journal of Business & Economics Research – October 2011 Volume 9, Number 10
100 © 2011 The Clute Institute
Meehan, J. (2004) highlights four large pioneering capital access deals involving MFIs and the capital
markets. The author notes that investors are beginning to see microfinance for the poor as an investment opportunity
even though entry is slow. This is particularly so because leading MFIs that would have shown the way are still
courting with donors. Notwithstanding, it is clear from the above results that the desire to tap the capital markets and
capacity to link with commercial investors is a realizable vision13
.
Column II of Table 5 reveals that only MFIs in 10 countries are not able to access commercial funding.
Among the 10, five are noteworthy - Egypt and Tunisia show low proportions for reasons that in these countries
microfinance thrives on government subsidies or donations. For Rwanda, Cote d‟Ivoire, and Mozambique, the effect
of war has resulted in a weak industry and therefore less interest by investors or absence of a well functioning
banking/financial sector. On the other hand, 60 to 100% of MFIs in seven countries have good access to commercial
capital to expand their loan portfolios. Results show that more than half of the countries in our sample will struggle
(44% likelihood degrees of success) to be successful in commercialization.
Table 6 results reveal regions where successful commercialization is taking place. As per the findings, the
LMA rating result in Column III is reflective of what is, than what is likely, to happen. That is "a temperature
gauge" giving the status of commercial access to funding. It shows that two regions - West and Southern Africa - are
experiencing greater access to commercial capital. Column IV, on the other hand, provides a prediction of which
countries will achieve success in attracting commercial investors in the coming years. It is interesting to note that, in
contrast to the LMA, the C-index is a good predictor in that it is able to distinctively show the shift of future use of
commercial debt to northern countries and the eastern region of Africa. Attraction and future access to commercial
funding differ across countries in the sample. Broadly, the findings conform to current commercialization trends in
the microfinance industry (Meehan, J., 2004; Jasson, T., 2003; USAID, 2005; and Cheritonenko, S. et al., 2004)
where most countries and MFIs have embraced commercialization as an alternative source of finance.
Inspection of column IV shows that all but 12 countries will most likely succeed in commercialization.
Among the 12 countries likely to experience difficulties in accessing commercial capital, those in Southern Africa
have particularly low proportions where our estimates show that only 0-25% of MFIs are likely to be successful in
commercialization. On the other end of the spectrum are countries, such as Morocco, Tunisia, Uganda, Kenya, and
Senegal, where higher proportions observed indicates a high degree of success (60 – 100%). Overall, the results
suggest that less than half of the countries are likely to be successful with commercialization in the future.
By comparing across column III and IV, it is possible to obtain an indication of relative importance of
commercial capital in relaxing financing constraint for MFIs in Africa. Thus, for example in the case of Ghana, 50%
of MFIs have access to commercial capital over the sample period. But in the coming years, the model predicts that
none of these MFIs will gain access to commercial debt. This suggests that for Ghana, the way to go is not
commercialization because of the criteria for accessing private capital. In the case of Kenya, 57% of MFIs have
access and a higher proportion (71%) will most likely succeed in obtaining commercial capital. For such a country,
the results suggest that commercialization will play a major role in meeting the funding gap.
Whereas commercialization seems to play a vital role currently in relaxing financing constraint in Africa,
the results suggest that this may not be the case in the future for most MFIs in sample countries. However, country
success will be dependent on market development. This contention is consistent with observations made by McKee,
K. (2001) and Charitonenko, S. et al. (2004) who noted that financing growth with commercial debt is more
common in mature microfinance markets.
13 Meehan, J. (2004) predicts that in the next 5 to 10 years MFIs would be financing themselves exclusively with commercial
sources of finance.

Journal of Business & Economics Research – October 2011 Volume 9, Number 10
© 2011 The Clute Institute 101
Table 6: Africa Regional Commercial Funding Access and Orientation Ranking
Country Region
Name
CFA
Index
Degree (% ) of
Commercial Orientation
Egypt 0.00 0
Morocco
North &
Sahelian
0.50 100
Mali 0.33 33
Tunisia 0.00 100
Region 4 0.21 58 %
Uganda 0.47 73
Ethiopia
Eastern &
Central
0.64 55
Kenya 0.57 71
Tanzania 0.40 40
DR Congo 0.50 50
Rwanda 0.00 0
Region 6 0.43 48 %
Benin 0.71 57
Cameroon 0.25 25
Togo 0.40 20
Nigeria
West
1.00 50
Senegal 1.00 67
Ghana 0.50 0
Cote d‟Ivoire 0.00 0
Region 7 0.55 31 %
Madagascar 0.67 11
South Africa
Southern
0.75 25
Zimbabwe 0.67 0
Mozambique 0.00 0
Region 4 0.52 9 %
Africa Survey 21 countries 0.53 44%
CONCLUSION
One major challenge for the theory of microfinance development is to explain the diversity of institutional
performances in poverty alleviation across countries. There are still countries where people are very poor and where
microfinance has not helped them, while others are making good progress and are moving away from poverty
through microfinance interventions. In this study, the concern was “Why do some MFIs access funding, while others
do not? What are the requirements for success in connecting to the financial markets for funding?” In an attempt to
answer this question, the influence of 33 variables was analyzed to determine significant predictors of success with
commercialization. The results are indicative of the importance of good financial returns and administrative
efficiency (ROA, cash flow adequacy and operating expense ratio), transparent reporting and information disclosure
(information opacity), and concerns for cost of funds (lending rates), as well as inflation levels in the country. Large
MFIs with big loan sizes are particularly attractive. The listing also underscores the importance of the risk profile;
quality of asset (PAR), and ability to absorb new capital (level of indebtedness) for MFIs that would be successful in
accessing commercial funding.
Other key factors identified for enabling access to commercial funding include regulatory status, as well as
whether an institution is registered as a NGO. As expected, existence of growth opportunities was highlighted as an
important factor. Incidentally, the results show that it is irrelevant whether the main funding base is donations or not.
This means a MFI can have multiple sources of funding, including donors, and still be attractive to investors.
The results shed light on the central issue and debate regarding whether MFIs in Africa can survive without
donor funding (financial dependence). According to this study, more than half of sample MFIs are enjoying access
to commercial finance while obtaining donations. However, the C-index predicts that Africa, as a continent, is
entering a transitional phase and moving away from donations, but struggling to be successful in commercialization.
MFIs in North African countries are more likely to be successful, followed by East and then West Africa. Each of

Journal of Business & Economics Research – October 2011 Volume 9, Number 10
102 © 2011 The Clute Institute
these groups of countries presents an opportunity for investors and indicates a likely destination for commercial
funds.
Research findings support previous studies that have looked at the funding evolution of microfinance
institutions. The results have important implications for investors, as well as for MFIs seeking capital. Regulated
MFIs pursuing commercialization schemes in Africa need to show good financial performance metrics, a sizeable
amount of assets (big balance sheet), and quality loan-book. Growth prospects and an enabling environment will
also be more beneficial to commercial investors. Small, slow-growing and unprofitable MFIs that offers small loan
sizes do not appear to access significant amounts of capital from commercial sources. Such institutions are probably
better off seeking donor development funds.
This paper has developed the pathway through which a MFI can become part of the financial landscape,
and it identified the factors that underpin success in commercializing microfinance institutions. It is suggested that
this model can be useful within organizations to establish the baseline measures for future success in
commercialization. It can also be helpful for investors to simply take MFI‟s temperature, relative to the level of
access to commercial funding and possession of key performance requirements in microfinance. Among
organizations, it can provide a useful industry profile and relative ranking in terms of adoption of the strategy of
commercialization.
ACKNOWLEDGEMENT
This paper is based on the final part of the author‟s PhD dissertation at the University of Stellenbosch Business
School. He would like to thank his promoter, Professor Nicholas Biekpe, for his valuable motivation, comments and
corrections on earlier versions. Any other errors are the author‟s.
AUTHOR INFORMATION
Josephat Mboya Kiweu has an MBA (finance) and a B Com (Accounting option) from the University of Nairobi -
Kenya and a PhD (Finance) from the University of Stellenbosch Business School in South Africa. Joséphat has an
extensive career spanning over 18 years as a financial management professional. His main areas of research are:
banking, microfinance and finance in general, financial markets/sector development, corporate governance, and
microenterprise development. He teaches and supervises PhD students, Masters and undergraduates besides in
involvement in consulting work. Joséphat‟s professional qualifications include (ACCA), Fellow of (IFC), and
Fellow of (AFP). For correspondence, e-mail the author at [email protected]. or Tel. +254 721 725931.
REFERENCES
1. ADB (2000), “Finance for the Poor: Microfinance Development Strategy”. Manila: Asian Development
Bank, 2000.
2. Barrios, V.E. and Blanco, J.M. (2003), The effectiveness of bank capital adequacy regulation: A theoretical
and empirical approach, Journal of Banking & Finance, 2003
3. Beck, T. and Demirguc-Kunt, A., Levine R. (2004), “Finance, Inequality and poverty: cross Country
Evidence”. WPS3338.
4. Beck, T. and M. Fuchs (2004) “Structural issues in the Kenyan financial system: Improving competition
and Access”. World Bank policy research paper, 3363, July 2004.
5. Berger, A. N. Kashyap, A. K. and Scalise, J. M. (1995), The role of capital in financial institutions, Journal
of Banking & Finance, 19 (1995), 393-430.
6. Breiman, L. (2001), Random forests. Machine Learning Journal, 45(1):5.32, 2001.
7. Breiman, L. (2001), “Random forests”, Statistics department, University of California, Berkeley, CA
94720, 2001. Working papers.
8. Breiman, L. (2003), “Manual on setting up, using, and understanding random forests v3.1”,
http://oz.berkeley.edu/users/breiman/Using random forests V3.1.pdf.
9. Charitonenko, S., Campion, A. and Fernando, N.A. (2004), “Commercialization of Microfinance;
Perspectives from South and South-Eastern Asia”. Asian Development Bank, Manila, Philippines, 2004.

Journal of Business & Economics Research – October 2011 Volume 9, Number 10
© 2011 The Clute Institute 103
10. CGAP (2002), “Financial sustainability in Microfinance”. Donor briefs No.1, April 2002.
11. CGAP (2002), “Helping to Improve Donor Effectiveness in Microfinance, Microfinance Donor Projects:
12 Questions about Sound Practice”, Donor Briefs N0.1, Consultative Group to Assist the Poorest,
Washington DC.
12. Christen, R. (2000), “Commercialization and Mission Drift: The transformation of Microfinance in Latin
America. Occasional Paper No. 5, Consultative Group to Assist the Poorest, Washington DC.
13. Christen, R. and Drake, D. (2001), “Commercialization of Microfinance. Working Paper, Microenterprise
Best practices (MBP”), Development Alternatives, Inc., USAID project, Bethesda. MD.
14. Clarence, N.W. (2001), A study on using Artificial Neural networks to develop an early warning predictor
credit unions financial distress with comparison to the probit model. Managerial Finance, Vol. 27, No. 4
(2001).
15. Demirgunc-Kunt, A. and Maksimovic, N. (1998), “Law, Finance and Firm growth”. The Journal of
Finance, Vol. LIII, No. 6 Dec. 1998
16. De Sousa-Shields, M., Frankiewicz, C., Miamidian, E., Jos Van der Steeren, King, B. and edited by
Campion, A. (2004), “Financing microfinance institutions: the context for transitions to private capital”.
U.S. Agency for International Development, December 2004.
17. Dunford, C. (2000), In search of „sound practices‟ for microfinance, Journal of microfinance, Volume 2
Number 1, spring 2000,
18. Halpern, S.S. and Hattel, K. (2002), “Challenges to microfinance Commercialization,” Summary of
„Challenge to microfinance Commercialization”, Conference convened by The World Bank, June 4-6,
2001, MicroFinance Network & ACCION International, Washington DC, 2002.
19. Hassan, I. and Marton, K. (2003), Development and efficiency of the banking sector in a transitional
economy: Hungarian experience, Journal of Banking & Finance, xxx (2003) xxx–xxx
20. Hendricks, K.B. and Singhal, V.R., (2001), Firms characteristics, total quality management, and financial
performance, Journal of Operations Management, 19(2001) 269-285.
21. Hussain, Md. M. and Hoque ,Z (2002), Understanding non-financial performance measurement practices in
Japanese banks A new institutional sociology perspective, Accounting, Auditing & Accountability Journal,
Vol. 15 No. 2, 2002, pp. 162-183.
22. IFC (2001), Major IFC Changes and Trends FY95 – FY00. International Finance Corporation Report (see
also www.ifc.org), Washington DC.
23. Ivatury,G. and Abrams, J. (2004: “The Market for Microfinance Foreign Investment: Opportunities and
Challenges”, KfW Financial Sector Development Symposium, Berlin 11th . 12th November 2004.
24. Jacobson, T. and Roszbach, K. (2003), Bank lending policy, credit scoring and value-at-risk, Journal of
banking and Finance, 27.
25. Jain, B.A. (2001), Prediction of performance of venture capitalist-backed organizations, Journal of
Business Research, 52 (2001) 223-233.
26. Jansson, T. 2003. “Financing microfinance: Exploring the Financing side of microfinance Institutions”.
Sustainable Development Department Technical paper series. Inter-American Development Bank,
Washington D.C. March 2003.
27. Jeng, C.A. and Wells, P.C. (2000), The determinants of venture capital financing; evidence across
countries, Journal of corporate finance, 6 (2000) 241-289.
28. Kolari J. Caputo, M. and Wagner, D. (2002), Predicting large US commercial bank failures, Journal of
Economics and Business ,54, 361–387.
29. Konish, M. and Yasuda, Y. (2003), Factors affecting bank risk taking; evidence from Japan, Journal of
Banking and Finance, 2003.
30. Kiweu, J.M. and Biekpe, N. (2009), Leveraging donor funds: The switch to commercial sources of funds,
Managerial finance journal, Forthcoming.
31. Laittinen, E.K. (2002), Financial Rating of European Technology Companies: An international comparison,
Journal of Business Finance & Accounting, 29 (7) & (8), Sept/Oct.2002
32. Lariviere, B. and Van den P. (2004), “Predicting Customer retention and profitability by using Random
Forests and Regression Forests Techniques”. Faculteit Economie EN BEDRIJFKUNDE, Working paper,
December 2004.
33. Liu, D-Y. and Lee, S-P. (1997), An analysis of risk classification for residential mortgage loans, Journal of
property finance, Vol. 8, No 3, 1997 (207-225).

Journal of Business & Economics Research – October 2011 Volume 9, Number 10
104 © 2011 The Clute Institute
34. Meehan, J. (2004), “Tapping the financial markets for microfinance: Grameen Foundation USA‟s
promotion of this trend‟‟, GF USA, Working paper series.
35. Metwally, M.M. (1997), Differences between the financial characteristics of interest-free banks and
conventional banks, European Business Review Volume 97 · Number 2, pp. 92–98 © MCB University
Press ISSN 0955-534X.
36. MIX (2006), “Benchmarking Africa microfinance 2005”, Microfinance information exchange, Inc. 1901
Pennsylvania USA, Washington DC, -2006.
37. Myers, S.C. and Majluf, N.C. (1984), Corporate finance and investment decisions when firms have
information that investors do not have, Journal of Financial economics, 13, 187-221
38. McKee, K. (2001), “Microenterprise Development in a Changing World; Services and Policy Reforms for
the Informal sector”, USAID Presentation.
39. Otero, M. (1997), “Accessing Commercial Capital for Microfinance: The ACCION Experience”, CGAP
Newsletter No.3, Consultative Group to Assist the Poorest, Washington DC.
40. Ozkan, A. (2001), Determinants of capital structure and adjustments to long run target: evidence from UK
company panel data, Journal of business finance and accounting, 28 (1), Jan/Mar, 2001
41. Peyer, U.C. and Shivdasani, A. (2001), Leverage and internal capital markets: evidence from leveraged
recapitalizations, Journal of Financial Economics, 59 (2001) 477}515.
42. Pille, P. and Paradi, J.C. (2002), Financial performance analysis of Ontario (Canada) credit Unions: An
application of DEA in the regulatory environment, European Journal of Operations Research, 39 (2002)
339-350.
43. Poyo, J. and Young, R. (2001), “Commercialization of microfinance; A framework for Latin America‟‟,
MBP, December, 1999.
44. Rhyne, E. (1998), The Yin and Yang of microfinance: Reaching the poor and Sustainability, The
microbanking Bulletin, Calmeadow, pp. 6-8
45. St. John CH. (2000), Modelling the relationship between corporate strategy and wealth creation using
neural networks, Computers and operations Research, 27, (2000), 1077-1092.
46. Upneja, A. and Dalbor, M.C., (2001), An examination of capital structure in the restaurant industry,
International Journal of Contemporary Hospitality Management, 13/2 (2001) 54-59. MCB Universal press.
47. USAID (2005), “MFI financing strategies: Transition to private capital”, MicroNote # 9, Prepared by
Marc de Souza and Brad King, USAID – October, 2005.
48. Vasiliou, D. and Karkazis, J. (2002), The sustainable growth model in banking; An application to the
National Bank of Greece, Managerial Finance, 2002.
49. Watson, R. and Wilson, N. (2002), Small and medium size enterprise finance: A note on some of the
empirical implications of pecking order, Journal of Business finance & Accounting, 29 (3) & (4),
April/May 2002, 0306-686x.
50. WOCCU (2003), “Regulatory standards”, World Council of Credit Unions, copy right- 2003,
www.woccu.org