Embed Size (px)
Citation preview

Journal of Economic Cooperation and Development, 33, 2 (2012), 53-74
Training and Innovation among Knowledge-Based Companies in
Malaysia
Izyani Zulkifli*
Using data from an online survey, this paper attempts to (1) examine the
innovative efforts undertaken by knowledge-based companies in
Malaysia and (2) to investigate whether or not training has any impact
on those innovative efforts. It was found that innovation was evident
among the vast majority of the knowledge-based companies, namely, in
the “development of a major new product”, an “upgrade of an existing
product”, “patents or copyrights for a product” and the “introduction of
a new technology that improved production process”. A simple crosstab
analysis suggests that when a training policy is in place, it not only
positively influences innovation but innovation seems to be more
important to the growth of the companies. Additionally, the regression
result shows that training has a significant and positive impact on the
company’s propensity to innovate.
1. Introduction
Firms train their workforce for various reasons. One, in particular, is to
accommodate the operational running of the business. As most firms
operate in a competitive environment where stiff rivalry exists among
similar businesses and each firm is knowledgeable about the activities of
their rivals; firms traditionally compete via ‘price competition’, that is,
by matching and beating the prices of their competitors. To succeed in
price competition, firms strive to become the lowest cost producer.1 For
that reason, training is often carried out to improve the skills of workers
* Assistant Professor Department of Economics, Kulliyyah of Economics and Management
Sciences,International Islamic University Malaysia (IIUM),
1 This is the standard neoclassical view, which assumes that competition prevents any individual
firm from raising the price of its output to more than what covers the costs of its inputs.

54 Training and Innovation among Knowledge-Based Companies in Malaysia
because according to the human capital theory (Becker, 1962) this will
increase the productivity level of the workers and, in turn, bring
competitiveness to the firm.
However, as global economies progress to one that is more knowledge-
based, this form of competition becomes no longer effective. With
technology constantly evolving and opportunities to invest in R&D are
made more available; firms find themselves another option to be the
least-cost producer, that is, via innovation. By bringing new ideas into
product design as well as production process, firms can not only reduce
their costs but can ultimately improve the quality of their products or
services they render. Training plays an important role here as well. As
opposed to the previous situation where training is merely carried out to
improve skills and productivity of workers, training now offers a boost
to the workers’ confidence and encourages them to become more
innovative.
In Malaysia, empirical studies on training and innovation are very
limited. The lack of such studies on knowledge-based companies is even
more profound given that information on training for individual
companies is neither available nor accessible to the public. To fill this
lacuna in literature, the present study conducts an online survey on
knowledge-based companies in MSC Malaysia to examine (1) the
innovative efforts undertaken by these companies and (2) whether or not
training has any impact on those innovative efforts.
The organization of this paper is as follows. Section 2 provides an
overview of, mainly empirical, literature related to the link between
training and innovation. Section 3 gives the rationale for focusing on
MSC Malaysia, followed by a description of the data in Section 4.
Sections 5 and 6 describe the model and variables used in the study. The
empirical results are discussed in Section 7 and Section 8 concludes the
paper.
2. Brief Review of Literature
Decades before his time, Joseph Schumpeter (1947) envisioned that
when technology and know-how control the conduct of businesses, price
competition “is not the kind of competition which counts, but the
competition for the new commodity, the new technology, the new
55 Journal of Economic Cooperation and Development
source of supply, the new type of organization (the largest-scale unit of
control for instance) i.e. competition that commands a decisive cost or
quality advantage and which strikes not at the margins of the profits and
the outputs of the existing firms, but at their foundations and at their
very lives” (p.84). True enough, nowadays technology is continuously
evolving and with various opportunities available to invest in R&D,
firms find themselves the need to incorporate innovation into their
operational strategy in order to remain competitive.
Innovation basically refers to something that adds value to a firm
(Bhaskaran, 2006). It differs from invention because unlike the latter,
innovation transforms an invention into a commercially useable
technique or product (Laplagne and Bensted, 1999). Schumpeter is one
of the first economists to define and draw attention to the importance of
innovation. He distinguishes between “radical” and “incremental”
innovations in which the former brings big changes in the world
whereas the latter fills in the process of change continuously.
Schumpeter also identified fives types of innovation (see OECD, 1997:
p.16), namely, (1) introduction of a new good; (2) the introduction of a
new method of production; (3) the opening of a new market; (4) the
conquest of a new source of supply of raw materials and (4) the carrying
out of a new organization.
The first two types of innovation above form the basis of the Oslo
Manual’s (OECD, 1997) classification of innovation as they are
relatively easier to understand and measure. These classifications are
“technological product innovation”, which involves either a new or
improved product whose characteristics differ significantly from
previous products, and “technological process innovation”, which is the
adoption of new or significantly improved production methods,
including methods of product delivery (p.32).2 Given the broad scope of
innovative activities, the measurement of innovation is likely to be
difficult. Rogers (1998) distinguished the measures of innovation
according to its inputs and outputs. Among the common input measures
of innovation are R&D expenditures, intellectual property statistics and
patents and licenses; whereas output measures of innovation are
commonly in the form of firm performance, introduction of new or
2 ‘Products’ refers to both goods and services

56 Training and Innovation among Knowledge-Based Companies in Malaysia
improved products or processes and percentage of sales from new or
improved products or processes.
One branch of literature has found it worthwhile to investigate why
firms innovate in the first place. According to Schumpeter, the main
reason is that firms seek rents. With innovation, firms are able to bring
new technologies into the economy so when an innovative process
occurs, the firm gets a cost advantage over its competitors. This allows
the innovator (or the firm) to gain a higher mark-up at the prevailing
market price, or depending on the elasticity of demand, to use a
combination of lower price and higher mark-up than its competitors to
gain market share and seek further rents. In the case of product
innovation, the firm gets a monopoly position due to either a patent or to
the delay before competitors can imitate its product. This monopoly
position allows the firm to set a higher price than would be possible in a
competitive market, thereby gaining a rent.
Firms may also innovate to defend their competitive positioning as well
as to seek competitive advantage. As shown in a model by Aghion et al.
(2006), technologically advanced entry creates a competitive
environment that forces incumbent firms to be innovative. In this
situation, each potential entrant comes with leading-edge technology. If
the incumbent is less technologically advanced, the entrant will replace
the incumbent. Likewise, if the incumbent is also employing a leading
edge technology, it can use its reputation advantage and block entry.
Given the importance of innovation to firms, it is clear why employers
would want to impart innovativeness as part of their work culture. An
effective way to do so is by training the workers. Previously when firms
engage in price competition and focus only on being the least-cost
producer, training was undertaken to improve workers’ performance by
coaching them to reduce wastes, work more efficiently and produce
goods more abundantly. But all those feats were carried out by using
existing technology. When firms realize that technology need not be
stagnant, training may be used to coach the workers on how to (1) find
cheaper ways to make existing products, (2) make new products using
existing technology, or (3) make new products using new technology.
Thus, training not only generates innovation, but together with
investments in R&D, it develops the firm’s “absorptive capacity”, a
concept developed by Cohen and Levinthal (1989, 1990), which refers

57 Journal of Economic Cooperation and Development
to the firm’s ability to identify, assimilate and exploit knowledge from
the environment. These are among the qualities needed for firms to
remain competitive in the new age, a view that is supported by Ballot,
Fakhfakh and Taymaz (2001) who found that training and its interaction
with R&D are significant inputs in firms’ productivity growth.
In short, there is an intricate link between innovation and training in
today’s economies (Booth and Snower, 1996). Firms that do not engage
in training will fail to develop their workers’ skills. As a result, these
firms will risk the inability to take advantage of innovations or fail to
promote innovation in the first place by not investing enough in their
workers who are able to carry out R&D. In both instances, the lack of
skills and training acts as a constraint for the firms to progress with their
innovations (Mohnen and Röller, 2001). As workers participate in
training and improve their skills, they will be able to undertake more
complex tasks or to complete tasks better or faster. They may also have
more confidence to share new ideas regarding the firm’s products with
their superiors. In some cases, innovation and training reinforce one
another with the training of workers enhancing the profitability of
innovative and more sophisticated technology.
3. Background of MSC Malaysia
MSC Malaysia is a national initiative spearheaded by the Malaysian
government to develop and nurture the nation’s ICT industry as well as
to provide a test-bed for the global ICT industry (MDeC, 2008).3
Conceptualized in 1996, MSC Malaysia was designed to help transform
the nation into a knowledge-based economy driven by a knowledge
society.4 To facilitate future development and promotion of MSC
Malaysia, the Multimedia Development Corporation (MDeC) was
established to shape specific laws and policies for MSC Malaysia as
well as to work closely with companies that want to set up their
operations there (MDeC, 2007).
3 The concept of MSC Malaysia is similar to the Free Trade Zones (FTZ) concept developed in
the late 1960s, which was to assist MNCs in exporting their products. The only difference is that
MSC Malaysia is concentrated on knowledge-based and ICT-related products. 4 This is the nation’s Vision 2020 i.e. a long-term national agenda that was introduced by former
Prime Minister, Tun Dr Mahathir Mohamed in 1991, which aspires for Malaysia to become a
fully developed nation by the year 2020.

58 Training and Innovation among Knowledge-Based Companies in Malaysia
This study focuses on knowledge-based companies that attain the MSC
Malaysia Status, henceforth, MSC-status companies.5 There are several
reasons for this. Firstly, these are local and foreign firms that rely
heavily on multimedia and high-end technology to produce or enhance
their products and for process development (MDeC, 2007), all of which
are crucial in the process of innovation. Secondly, to qualify for the
status, companies must meet several eligibility criteria, among which is
to employ a substantial number of ‘knowledge workers’. In the
Malaysian context, knowledge workers are individuals who hold either a
degree in any field from an institute of higher learning, OR a diploma in
multimedia/ICT or specialized ICT certification plus at least two years’
of relevant experience in multimedia/ICT or in a field that is a heavy
user of ICT, OR a professional, executive, management and technical,
work categories in IT-enabled services (MDeC, 2007). Knowledge
workers are essential to the development of innovations as they are the
manpower that drives the firms’ operational strategies.
Thirdly, companies with MSC-status enjoy numerous benefits in the
form of world class services and infrastructure, advanced
communications infostructure, cyberlaws as well as financial and non-
financial incentives. These privileges are backed by the Bill of
Guarantees (see Table 1), which is part of the Malaysian Government’s
commitment to provide an environment that is conducive to the
development of MSC Malaysia.
Given the nature of these companies along with the initiatives provided
by MSC Malaysia, it is only expected that the MSC-status companies be
innovative. Hence, this study also aims to affirm this situation as no
other studies, to the best of the author’s knowledge, have attempted to
do so in the past.
5 This status is awarded to private limited companies, incubators and institutes of higher learning
(IHLs), each with different application criteria and guidelines. For the purpose of this study, only
companies are of interest.

59 Journal of Economic Cooperation and Development
Table 1. Bill of Guarantees for MSC-status companies
Provide a world-class physical and information structure
Allow unrestricted employment of local and foreign knowledge
workers
Ensure freedom of ownership by exempting companies with
MSC Malaysia status from local ownership requirements
Give the freedom to source capital globally for MSC Malaysia
infrastructure and the right to borrow funds globally
Provide competitive financial incentives, including no income
tax for up to 10 years or an investment tax allowance, and no
duties on import of multimedia equipment.
Become a regional leader in intellectual property protection and
cyberlaws.
Ensure no Internet censorship.
Provide globally competitive telecommunications
Tender key MSC Malaysia infrastructure contracts to leading
companies willing to use the MSC Malaysia as their regional
hub.
Provide an effective one-stop agency - the Multimedia
Development (MDeC)
Source: Multimedia Development Corporation (MDeC), 2008
4. Data
Data used in this study are drawn from an online survey of MSC-status
companies.6 The decision to use an online mode was based primarily on
the characteristics of the sample. Since the MSC-status companies are
accustomed to regular ICT usage, an online survey is considered
appropriate and makes it more convenient for the Managers to respond
despite their hectic and irregular work schedules.7 Moreover, given the
need to acquire as many responses as possible to yield a fairly
6 The survey was conducted as part of the researcher’s PhD programme with some funds
acquired from the University of Nottingham and IIUM. Surveys on both the companies and
KWs were conducted online and face-to-face, but for the purpose of this paper, only the
company survey was utilised. 7 According to Schaefer and Dillman (1998), a faster response rate is obtained with e-mail. In
their study, respondents took on average of 9.16 days to return the questionnaires by e-mail
versus an average of 14.39 days by postal mail.

60 Training and Innovation among Knowledge-Based Companies in Malaysia
acceptable estimate, an online survey was deemed more practical
especially when there are time and financial constraints involved.
The working population consists of 1560 companies and are identified
from the directory at the MSC Malaysia website.8 Of this, 308 MSC-
status companies were targeted for the survey and selection was made
using a stratified random sampling to ensure representation from both
local and foreign ownerships as well as the six sub-sectors or
technological clusters in MSC Malaysia. The sample size was calculated
based on a formula for small population size in Rea and Parker (1997),
of which a 95 per cent confidence level and an acceptable margin of
error of 5 per cent were used.9
Prior to contacting the companies, support letters from the University
and the Ministry of Science, Technology and Innovation (MOSTI) were
obtained as proof of research authenticity, should they be required. The
Human Resource or Training Managers of the targeted MSC-status
companies were then informed of the researcher’s intentions and those
who agreed to peruse the questionnaire were emailed a ‘survey pack’,
which includes a cover letter stating the purpose of the survey, support
letters, a document version of the Survey Questionnaire for MSC-status
Companies (SQ1) and a link to the Web-based version of the survey.
Companies that declined participation were replaced by other companies
from the same strata. Eventually, as increasing number of MSC-status
companies that were not in the original sample list were contacted; the
sample survey became a census. But due to non-response, the use of the
census still does not guarantee that information was collected about all
members of the population (Rodeghier, 1996), thus, the data constitute
only a sample of the population and generalizations still had to be made
back to the full population.
8 During the fieldwork period (late-2008), 1878 MSC-status companies were officially registered
but not all of these companies were contactable, as they may have discontinued business due to
poor performance. As advised by MDeC, only ‘active MSC-status companies’ were included in
the sampling frame. Also, the survey excludes Institutes of Higher Learning, Incubators and
companies located outside of the Klang Valley due to time and financial constraints. 9 The response rate for online surveys that use telephone calls to contact potential respondents is
as low as 36.3 per cent (Dillman et al., 1998). Thus, in prudence, 848 companies were contacted
for this study. This technique of ‘over sampling’ is commonly used in an attempt to attain the
required sample size for a particular confidence level (Sheehan and Hoy, 1999).

61 Journal of Economic Cooperation and Development
A total of 100 MSC-status companies responded to the survey, giving a
response rate of 32.5 per cent (100 respondents out of 308 recommended
sample size). This is consistent with most past studies and is acceptable
for the purpose of analysis. Table 2 reports the breakdown of the
respondents.
Table 2. The breakdown of the MSC-status companies by ownership
and sub-sector
Sub-sector1
Local
companies
Foreign
companies2
Total
companies
Creative multimedia 12 5 17
Software development 38 12 50
Support services 5 1 6
Hardware design 4 3 7
Internet-based business 9 1 10
Shared services &
outsourcing (SSO)
3 7 10
Total 71 29 100
Note: 1Since 2010, these sub-sectors have been renamed to Creative Multimedia, IHLs
& Incubators, InfoTech and Shared Services Outsourcing; 2
There are three entities of
MSC-status companies but for the purpose of analysis, joint ventures and foreign-
owned companies are pooled together as ‘foreign companies’. Source: Survey Questionnaire for the MSC-status Companies (SQ1)
5. Model Specification
A Probit model is used to estimate the factors that influence whether or
not an MSC-status company undertakes innovative efforts. Following
Greene (2000), assume there is a latent variable, ,that describes a
firm’s propensity to innovate
where is a vector of explanatory variables with the associated vector
and is the error term, which is assumed to be normally distributed.
What is observed, however, is a binary variable defined as
{

62 Training and Innovation among Knowledge-Based Companies in Malaysia
It follows that indicates that the firm is innovative and
indicates otherwise. The conditional expectation of the binary variable
given is, by definition, a probability:
( | ) ( | ) ( )
where
represents the standard normal cumulative density function.
gives the marginal effect along the horizontal axis due to the increment
in . To translate this effect, the following calculation is needed
( | )
(
)
In the last term,
is the derivative of the CDF, which is the probability
density function (PDF). Since this regression function is non-linear in
nature, the Maximum Likelihood (ML) solution technique is employed
in place of the usual OLS.
The ML estimation for the Probit model is given by
( | ) ( ) ( | ) (
)
Two important issues should be addressed beforehand. One is the
potential endogeneity between training and innovativeness. Some may
argue that the decisions on major innovations should come prior to the
decisions to train workers so that they will be able to utilize an
innovated technology. But according to Chowhan (2005), the inclusion
of training does not present an endogeneity problem if the decision on
whether or not to provide training is made ex-ante. This is when firms
make training decisions, particularly training expenditures into their
operations, based on past budgets while adjusting for inflation and
growth. Allocating expenditures to training based on past budgets
reflects historical legitimacy, emphasis on current organizational and
presumed performance (Cyert and March, 1963).
The second issue, which is unobserved heterogeneity, can be dealt with
in a number of ways. If panel data with repeated observations on the
binary outcome of interest are available then unobserved heterogeneity
is usually dealt with by either conditioning on the unobserved
heterogeneity through random effects or by transforming the data to

63 Journal of Economic Cooperation and Development
eliminate individual-specific fixed effects (see Halaby, 2004). These
methods reduce the potential parameter bias from unobserved
heterogeneity. Unfortunately, in studies that rely on cross-sectional data,
such as the present one, it is often difficult to deal effectively with
potential bias from unobserved heterogeneity because there is only little
information in the data that allows the researcher to identify and correct
from the unobserved heterogeneity.
6. Variables Description
Data on innovation, training and other firm-level characteristics relevant
to this study are generated from the Survey Questionnaire for the MSC-
status Companies (SQ1). Innovativeness of a company is measured by
its progress in undertaking a number of initiatives or ‘innovative efforts’
as defined in question A10 of the survey questionnaire. A list of ten
initiatives was constructed based on two of Schumpeter’s classification
of innovation, namely, the introduction of a new product or a qualitative
change in an existing product (product innovation) and process
innovation new to an industry (process innovation). The companies were
asked whether they had undertaken any of these innovative efforts since
joining MSC Malaysia: “developed a major new product”, “upgraded an
existing product, “obtained patents or copyrights for products”,
“introduced new technology that improved production process”,
“certified to ISO 9000”, “agreed on a new JV with a foreign or local
partner”, “obtained a new licensing agreement”, “outsourced a major
production activity that was previously in-house”, “brought in-house a
major production activity that was previously outsourced” or “opened a
new plant or branch”.10
The respondents are allowed to choose more
than one form of innovative activity and upon answering ‘yes’, they are
further asked to rank the importance of those initiatives on their
companies’ growth based on a five-point Likert scale (not important to
extremely important).
10 Although ISO 9000 is essentially a TQM measure, there exists a significant relationship
between TQM practices and innovation performance, as highlighted by Prajogo and Sohal
(2001) in their literature review. In another study (Prajogo and Sohal, 2006), TQM has been
analyzed as a mediating factor between company strategy and innovation.

64 Training and Innovation among Knowledge-Based Companies in Malaysia
For the Probit regression analysis, innovation is a binary variable that
takes the value 1 if a company had undertaken the first four innovative
efforts and 0 otherwise (INNOVATION). These items are used to define
innovation because they are primarily undertaken by most MSC-status
companies and are also perceived to be important for their companies’
growth.
In the survey, training is measured in a number of ways, namely, by the
amount of training expenditure spent, the number of knowledge workers
trained, the average duration of days and hours of training, whether or
not the company provides training in the last year and the existence of a
formal training policy, or scheme, within the company. But for the
purpose of this study i.e. to analyze whether or not training supports
company innovations in MSC Malaysia, only the last measure is used
(TRAINING), where it takes the value 1 if a company has a training
policy, including those on ad hoc basis and 0 otherwise.
This measure is chosen for three reasons. Firstly, it follows the same
time line as the innovation measure, that is, since the inception of the
business in MSC Malaysia (assuming that the company had established
a training policy right from the start). Secondly, companies with a
training policy regularly train their workers (Hansson, 2005; Smith and
Hayton, 1999) or are, at least, consistent in providing training to their
workers. Although the existence of a training policy does not necessarily
lead to an actual provision of training, there is a positive correlation
between the two variables (0.251, p<0.05) for the current sample.
Furthermore, a cross tabulation of the variables also show that almost 90
per cent of companies that have a training policy actually provide
training in the last year. For the current sample, 72 per cent of the MSC-
status companies have a training policy. Thirdly, while the other training
measures may seem more ideal, but due to the lack or inaccuracy of data
obtained from the respondents, as well as to ensure sufficient response
to enable regression analysis, this measure is deemed the most fit.
Other variables used to control firm-level characteristics are described
as follows. According to Schumpeter (1947), innovations are more
likely to be initiated by large rather than small firms, so the size of the
company (SIZE) as measured by total workforce at the end of December
2007 is included in the model. MSC-status companies may also be
characterized by whether or not there exists any foreign ownership

65 Journal of Economic Cooperation and Development
(FOWNERSHIP) and by how long they have operated in MSC Malaysia
(DURMSC). Innovation is also related to the level of technology usage
as well as competition faced by the firm. To represent these factors, two
binary variables are used with value 1 assigned to the company if it uses
own technology (OWNTECH) and faces medium to high level of
competition in the local and overseas market (COMPETITION), 0
otherwise. Following the literature, a workforce with high absorptive
capacity too is an important source of innovation. In this analysis, such
variable is measured by the workers’ level of adaptability
(ADAPTABLE) and higher education (GRADUATE). The former is
measured by how fast new recruits are able to perform their jobs as well
as more experienced workers already in the company whereas the latter
refers to the share of knowledge workers with a degree or higher
qualification.
7. Results
Descriptive Statistics
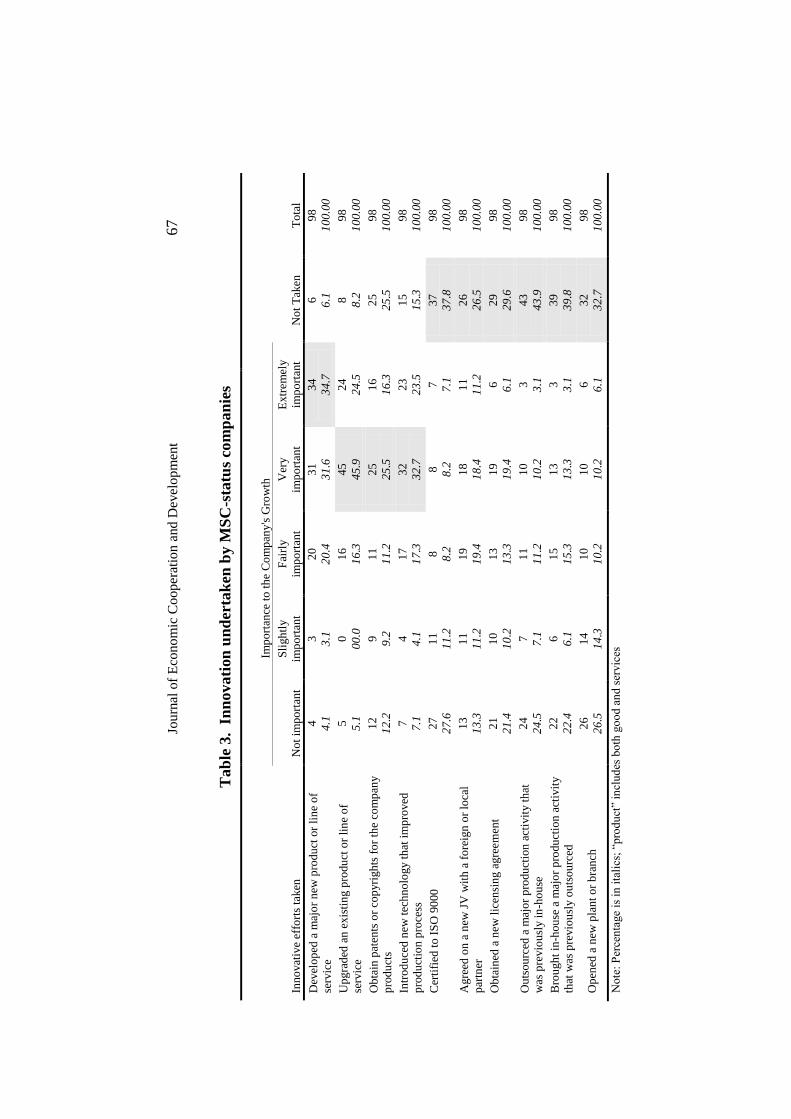
Table 3 presents the incidence of innovation among MSC-status
companies since joining MSC Malaysia. The percentage of companies
that undertake each initiative ranges from 56 per cent to 94 per cent,
indicating that most MSC-status companies are innovative. The majority
of respondents perceived the first four innovative efforts to have either a
“very important” or “extremely important” impact on their companies’
growth. These efforts include the “development of a major new
product”, “upgrade of an existing product”, “patents or copyrights for a
product” and “introduction of a new technology that improved
production process”. The remaining six initiatives are not that popular
among the respondents and those who did viewed those efforts as “not
important” or just “fairly important” on their company growth.
Regarding the link between training and the companies’ innovative
efforts, a simple computation of the relative frequency suggests that
when a training policy is in place, it not only positively influences
innovation but innovation seems to be more important to the growth of
the MSC-status company. From Table 4, it can be seen that for the first
four innovative efforts that greatly affect the companies’ growth, all but
one instance are undertaken more when the company has a training
policy. An interesting pattern is also found for the least popular

66 Training and Innovation among Knowledge-Based Companies in Malaysia
innovative efforts, where their absence seem to occur more among
companies that have no training policies. For instance, 37 per cent of
companies with a training policy did not certify to ISO 9000 compared
to 42 per cent of their counterparts with no training policy.
Journ
al o
f E
conom
ic C
ooper
atio
n a
nd D
evel
opm
ent
67
Tab
le 3
. I
nn
ovati
on
un
der
tak
en b
y M
SC
-sta
tus
com
pan
ies
No
te:
Per
cen
tage
is i
n i
tali
cs;
“pro
du
ct”
incl
ud
es b
oth
go
od a
nd s
ervic
es
Inno
vat
ive
effo
rts
taken
Imp
ort
ance
to
th
e C
om
pan
y's
Gro
wth
No
t im
po
rtan
t
Sli
gh
tly
imp
ort
ant
Fai
rly
imp
ort
ant
Ver
y
imp
ort
ant
Extr
em
ely
imp
ort
ant
No
t T
aken
T
ota
l
Dev
elo
ped
a m
ajo
r n
ew p
rod
uct
or
lin
e o
f
serv
ice
4
4.1
3
3.1
20
20
.4
31
31
.6
34
34
.7
6
6.1
98
10
0.0
0
Up
gra
ded
an
exis
tin
g p
rodu
ct o
r li
ne
of
serv
ice
5
5.1
0
00
.0
16
16
.3
45
45
.9
24
24
.5
8
8.2
98
10
0.0
0
Ob
tain
pat
ents
or
cop
yri
gh
ts f
or
the
com
pan
y
pro
du
cts
12
12
.2
9
9.2
11
11
.2
25
25
.5
16
16
.3
25
25
.5
98
10
0.0
0
Intr
od
uce
d n
ew t
ech
no
logy t
hat
im
pro
ved
pro
du
ctio
n p
roce
ss
7
7.1
4
4.1
17
17
.3
32
32
.7
23
23
.5
15
15
.3
98
10
0.0
0
Cer
tifi
ed t
o I
SO
90
00
27
27
.6
11
11
.2
8
8.2
8
8.2
7
7.1
37
37
.8
98
10
0.0
0
Agre
ed o
n a
new
JV
wit
h a
fo
reig
n o
r lo
cal
par
tner
13
13
.3
11
11
.2
19
19
.4
18
18
.4
11
11
.2
26
26
.5
98
10
0.0
0
Ob
tain
ed a
new
lic
ensi
ng a
gre
emen
t
21
21
.4
10
10
.2
13
13
.3
19
19
.4
6
6.1
29
29
.6
98
10
0.0
0
Ou
tso
urc
ed a
maj
or
pro
du
ctio
n a
ctiv
ity t
hat
was
pre
vio
usl
y i
n-h
ou
se
24
24
.5
7
7.1
11
11
.2
10
10
.2
3
3.1
43
43
.9
98
10
0.0
0
Bro
ugh
t in
-hou
se a
maj
or
pro
du
ctio
n a
ctiv
ity
that
was
pre
vio
usl
y o
uts
ou
rced
22
22
.4
6
6.1
15
15
.3
13
13
.3
3
3.1
39
39
.8
98
10
0.0
0
Op
ened
a n
ew p
lan
t o
r b
ran
ch
26
26
.5
14
14
.3
10
10
.2
10
10
.2
6
6.1
32
32
.7
98
10
0.0
0

66 Training and Innovation among Knowledge-Based Companies in Malaysia
Table 4. Cross tabulation on training and innovative efforts
Note: Percentage in parentheses
Regression Results
Two specifications of the hierarchical Probit model are adopted; the first
controls for the firm characteristics while the second model includes the
training variable. Both models are estimated using robust standard
errors. The pseudo R2likelihood ratio and Hosmer-Lemeshow test
statistics support a sound fit of the model. The results of the Probit
regressions are presented in Table 5.
Without training, the propensity to innovate is higher among smaller
MSC-status companies (p<0.1), those facing medium to high level of
competition in the market (p<0.01) and those with an adaptable
workforce (p<0.1). The inclusion of the training variable improves the
fit of the model slightly. As expected, training has a significant and
positive impact on the company’s propensity to innovate, but this effect
is only significant at the 10 per cent level. With training added to the
model, two other factors became significant in influencing the
Training policy in place
Total (N=98) Yes (N=71) No (N= 27)
Developed a
major new
product
Not important 3 (4.2) 1 (3.7) 4 (4.1)
Slightly important 2 (2.8) 1 (3.7) 3 (3.1)
Fairly important 15 (21.1) 5 (18.5) 20 (20.4)
Very important 20 (28.2) 11 (40.7) 31 (31.6)
Extremely important 28 (39.4) 6 (22.2) 34 (34.7)
Not taken 3 (4.2) 3 (11.1) 6 (6.1)
Upgraded an
existing product
Not important 2 (2.8) 3 (11.1) 5 (5.1)
Fairly important 10 (14.1) 6 (22.2) 16 (16.3)
Very important 34 (47.9) 11 (40.7) 45 (45.9)
Extremely important 20 (28.2) 4 (14.8) 24 (24.5)
Not taken 5 (7.0) 3 (11.1) 8 (8.2)
Obtain patents
or copyrights
for a product
Not important 9 (12.7) 3 (11.1) 12 (12.2)
Slightly important 8 (11.3) 1 (3.7) 9 (9.2)
Fairly important 6 (8.5) 5 (18.5) 11 (11.2)
Very important 19 (26.8) 6 (22.2) 25 (25.5)
Extremely important 14 (19.7) 2 (7.4) 16 (16.3)
Not taken 15 (21.1) 10 (37.0) 25 (25.5)
Introduced new
technology that
improved
production
process
Not important 4 (5.6) 3 (11.1) 7 (7.1)
Slightly important 2 (2.8) 2 (7.4) 4 (4.1)
Fairly important 8 (11.3) 9 (33.3) 17 (17.3)
Very important 27 (38.0) 5 (18.5) 32 (32.7)
Extremely important 20 (28.2) 3 (11.1) 23 (23.5)
Not taken 10 (14.1) 5 (18.5) 15 (15.3)

69 Journal of Economic Cooperation and Development
company’s propensity to innovate, namely, the existence of foreign
ownership and the share of graduates in the workforce (both at p<0.1).
While all the variables follow the expected signs, interestingly, the
effect of company size does not seem to adhere to theory in that smaller
MSC-status companies are more likely to be innovative than bigger
companies.11
It is plausible that this is due to the overwhelming share of
SMEs in the sample (83 per cent). A cross tabulation between
innovation and company size also reveal that smaller companies involve
in more innovative efforts compared to larger firms. Additionally, it
might seem strange that foreign companies tend to innovate less than
their local counterparts in MSC Malaysia. While there is no clear
explanation of this matter, it may be assumed that given the competitive
nature and high technological content of the knowledge-based industry,
firm ownership may not bear that much difference in the companies’
desire to perform well. In fact, local MSC-status companies may
inevitably work harder than their peers to prove their worth in attracting
investors.
The potential problem of endogeneity bias is recognized in the model.
This issue arises when a firm trains its workers because of an innovation
that requires new skills of the firm’s workforce (reverse causality). To
reduce this problem, the training variable is measured by the existence
of a training policy, which was assumed to have existed since the
inception of the company in MSC Malaysia. Related to this problem is
sample selection bias, which refers to where the dependant variable is
observed only for a restricted, non-random sample. In this case, one
observes a firm’s innovative propensity only if the firm provides
training for its workers
11Similar result is found when company size is measured by total revenue (turnover). This
finding, however, is in line with Schumpeter’s (1934) earlier hypothesis that small firms are best
at innovating.

70 Training and Innovation among Knowledge-Based Companies in Malaysia
Table 5. Estimation coefficients and marginal effects
8. Conclusion
This study utilized data from an online survey to, firstly, examine the
innovative efforts undertaken by knowledge-based companies in
Malaysia and, secondly, to investigate whether or not training has any
impact on those innovative efforts. From the survey, it was found that
innovation was evident among the vast majority of the knowledge-based
companies, particularly in the “development of a major new product”,
an “upgrade of an existing product”, “patents or copyrights for a
product” and the “introduction of a new technology that improved
production process”. A simple crosstab analysis suggests that when a
training policy is in place, it not only positively influences innovation to
take place within the company but innovation seems to be more
important to the growth of the companies. In addition, the result of the
regression analysis shows that training has a significant and positive
impact on the company’s propensity to innovate.
Independent Variables
Model 1 Model 2
B Exp(B) B Exp(B)
CONSTANT -1.001*
(0.607)
0.368 -1.501**
(0.651)
0.223
SIZE -0.003*
(0.002)
0.997 -0.003**
(0.002)
0.997
FOWNERSHIP -0.449
(0.299)
0.638 -0.546*
(0.301)
0.579
DURMSC 0.061
(0.047)
1.063 0.054
(0.046)
1.055
COMPETITION 0.831***
(0.315)
2.296 0.819***
(0.314)
2.268
OWNTECH 0.514
(0.315)
1.672 0.499
(0.314)
1.647
ADAPTABLE 0.503*
(0.298)
1.654 0.558*
(0.308)
1.747
GRADUATE 0.784
(0.595)
2.190 1.05*
(0.602)
2.858
TRAINING 0.558*
(0.305)
1.747
N 96 96
H-L statistica 10.357 7.332
Prob (H-L stat) 0.241 0.501
LR statistic 13.595 16.501
Prob (LR stat) 0.059 0.036
McFadden R2 0.116 0.140

71 Journal of Economic Cooperation and Development
References
Aghion, P., Blundell, R., Griffith, R., Howitt, P. and Prantl, S. (2006),
“The effects of entry on incumbent innovation and productivity”.NBER
Working Paper Series, No. 12027, Cambridge, Mass
Ballot, G., Fakhfakh, F. and Taymaz, E. (2001), “Firms’ human capital,
R&D and performance: a study on French and Swedish Firms”.
Labour Economics, 8, 443-462
Barrett, A. and O’Connell, P.J. (2001), “Does training generally work?
The returns to in-company training”. Industrial and Labour Relations
Review, 54(3), 647-662
Bartel, A.P. (1989), “Formal employee training and their impacts on
labour productivity: Evidence from a Human Resources Survey”. NBER
Working Paper Series, No. 3026, Cambridge, Mass
——— (1994), “Productivity gains from the implementation of
employee training programs”. Industrial Relations, 33(3), 411-425
——— (1995), “Training, wage growth and job performance: Evidence
from a company database”. Journal of Labour Economics, 13(3), 401-
425
Black, S.E. and Lynch, L.M. (1996), “Human capital investments and
productivity”. American Economic Review, Papers and Proceedings of
the Hundredth and Eighth Annual Meeting of the American Economic
Association San Francisco, CA, January 5-7, 1996, 86(2), 263-267
Becker, G.S. (1962), “Investment in human capital: a theoretical
analysis”. The Journal of Political Economy, 70(5), 9-49
——— (1993), Human Capital, A Theoretical and Empirical Analysis
with Special Reference to Education, NBER, The University of Chicago
Press, Chicago
Bhaskaran, S. (2006), “Incremental innovation and business
performance: Small and medium-size food enterprises in a concentrated

72 Training and Innovation among Knowledge-Based Companies in Malaysia
industry environment”. Journal of Small Business Management, 44(1),
64-80
Bishop, J.H. (1994), “The impact of previous training on productivity
and wages”. In L. Lynch (Ed), Training and the Private Sector –
International Comparisons, Chicago: University of Chicago Press
Booth, A. and Snower, D. (Eds). (1996), Acquiring skills. Market
failures, their symptoms and policy responses. Centre for Economic
Policy Research, Great Britain: Cambridge University Press
Chowhan, J. (2005), “Who trains? High-tech industries or high-tech
workplaces?”. Statistics Canada, Ottawa, No. 11-622-MIF No. 006
Cohen, W. E. and Levinthal, D.A. (1989), “Innovation and learning: The
two faces of R&D”. The Economic Journal, 99(397), 569-596
——— (1990), “Absorptive capacity: a new perspective on learning and
innovation”. Administrative Science Quarterly, 35(1), 128-152
Cyert, R.M. and March, J.G. (1963), A Behavioural Theory of the Firm.
New Jersey: Prentice-Hall, Inc
Dillman, D.A., Tortura, R.D., Conradt, J., Bowker, D. (1998),
“Influence of plain vs. fancy design on response rates for web surveys”.
Paper presented at the Joint Statistical Meetings, Dallas, Texas.
Retrieved September 7, 2008 from
http://www.sesrc.wsu.edu/dillman/papers/asa98ppr.pdf
Greene, W.H. (2008), Econometric analysis (6th
ed.) Upper Saddle
River, New Jersey: Prentice Hall
Hansson, B. (2007), “Company-based determinants of training and the
impact on company performance: results from an international HRM
survey”. Personnel Review, 36(2), 311-331
Hosmer, D.W. and Lemeshow, S. (2000), Applied logistic regression
(2nd
ed.) New York: John Wiley & Sons, Inc

73 Journal of Economic Cooperation and Development
Laplagne, P. and Bensted, L. (1999), “The role of training and
innovation in workplace performance”. Staff Research Paper,
Productivity Commission, Australia
Mohnen, P. and Röller, L.H. (2005), “Complementarities in Innovation
Policy”, European Economic Review, 49, 1431-1450
Multimedia Development Corporation, MDeC (various years), The MSC
Malaysia Impact Survey. Last accessed December 26, 2009 from
http://www.mscmalaysia.my/article/12073048430273/Progress+Reports
+&+Surveys
_________ (various years), MSC Malaysia website. Available at
http://www.mscmalaysia.my/
Organisation for Economic Co-operation and Development, OECD
(1997), Oslo Manual.The measurement of scientific and technological
activities.Proposed guidelines for collecting and interpreting
technological innovation data. OECD. Paris
Prajogo, D.I. and Sohal, A.S. (2001), “TQM and innovation: a literature
review and research framework”, Technovation, Vol. 21, pp. 539-558.
Prajogo, D.I and Sohal, A.S. (2006), “The relationship between
organization strategy, total quality
management (TQM), and organization performance––the mediating role
of TQM”, European Journal of
Operational Research, Vol. 168, pp. 35–50.
Rea, L.M. and Parker, R.A. (1997), Designing and conducting survey
research: A comprehensive guide. Jossey-Bass, San Francisco (CA)
Rodeghier, M. (1996), Survey with confidence: A practical guide to
survey research using SPSS, SPSS Inc, Chicago, IL
Schumpeter, J.A. (1947), Capitalism, socialism and democracy. New
York: Harper Colophon Books
Sheehan, K. B. and Hoy, M. B. (1999), “Using e-mail to survey internet
users in the united states: ethodology and assessment”. Journal of

74 Training and Innovation among Knowledge-Based Companies in Malaysia
Computer Mediated Communication, 4(3). Retrieved March 8, 2009,
from http://jcmc.indiana.edu/vol4/issue3/sheehan.html
Smith, A. and Hayton, G. (1999), “What drives enterprise training?
Evidence from Australia”.The International Journal of Human Resource
Management, 10(2), 251-272