Embed Size (px)
Citation preview

Journal of Economic Cooperation and Development, 30, 4 (2009), 51-86
Sanitary Standards in the EU:
The Impact on Malaysian Fishing Industry
Rokiah Alavi
1
Malaysian seafood exports to the EU faced blanket ban in 2008. The
European Union is known to have the most stringent regulations with
regard to food safety and standards. This has caused significant impact
on the fisheries industry in Malaysia because the EU is the principal
export market for the Malaysian seafood products and the fisheries
sector is the second most important foreign exchange earner of the
country. This industry employs about 10,000 workforce who are directly
involved in the industry in addition to 50,000 others who are indirectly
employed in the sector. As of January 2009, Malaysia lost about RM1.5
billion as a result of this ban. The objective of this paper is to evaluate
the implications of the EU‟s restriction on Malaysian seafood industry.
The findings show that the impact is significant especially in terms of
border rejection rates, cost of compliance and upgrading the facilities,
lost of employment and adjustment costs. Technical and financial
assistance from the government are crucial for the industry in coping
with the moving targets of safety requirements imposed by the EU.
Other incentives such as tax exemption, soft-loan facilities, subsidised
rate for electricity and energy, support in the form of trade promotion
and enhancing trade with other Muslim countries especially the Gulf
States are deemed important to assist the industry.
1. Introduction
In 2008, Malaysian seafood products were banned from entering the EU
market. It was due to the failure of Malaysian seafood producers in
maintaining quality and sanitary standards of their products such as the
1 Rokiah Alavi is an Associate Professor at the Department of Economics at the
International Islamic University Malaysia. This paper was extracted from the report
submitted to South East Asian Council on Food Security and Fair Trade (SEACON).
Research funding from SEACON is gratefully acknowledged. I would like to thank
Noraini Zakaria and Mohd. Asmy for assisting in this research.

52 Sanitary Standards in the EU: The Impact on Malaysian Fishing Industry
usage of contaminated ice, unhygienic condition of the ice factories and
dirty landing jetties2. This is not surprising because the EU has been at
the forefront in setting stringent food safety standards and regulations.
Experiences of the developing countries suggest that sanitary and
phytosanitary (SPS) and technical barriers to trade (TBT) are two
measures that have significant impact on fisheries trade. SPS measures
concern food safety to protect human, animal and plant health which
involve inspection, assessment and certification requirements. TBT
focuses on product standards and technical regulation which include
provisions on quality, standards, source of origin and now a number of
developed countries have introduced additional requirements on
traceability and labelling schemes (ICTSD, 2006). Under the WTO, the
SPS and TBT Agreements call for transparency in the measures applied
and these agreements support equalisation of international standards
and harmonisation of the procedures, assessment process and approval
system.
These requirements have been evolving continuously in response to
emerging problems and hazards, advances in scientific knowledge,
consumer awareness and concerns and political pressures (Henson et al.,
2004). As a consequence, developing countries often find it difficult to
meet these moving targets of safety requirements imposed by the
industrial economies (ICTSD, 2006). Export consignments from
developing country have been facing rising number of rejections at the
EU borders for failure to meet quality standards despite their efforts to
conform to the required standards. The EU‟s high sanitary and
phytosanitary standards have had significant impact in terms of lost of
export earnings, bankruptcies and unemployment. The recent ban on
Malaysian seafood products for example has cost the industry more than
RM1.5 billion to date and about 10,000 people who are directly involved
in this industry would be affected in one way or another.
The Malaysian seafood industry is the second largest food export
industry in Malaysia with a total export value over RM2.5 billion
2 NST (2008), Fish Product Ban by EU Results in RM600 million Loss by Malaysia”,
taken from
http://www.nst.com.my/Current_News/NST/Saturday/NewsBreak/20080830174049/A
rticle/index_html (1/9/2008)

Journal of Economic Cooperation and Development 53
annually. The European market is the main export market for Malaysian
seafood and it constitutes about one third of the total Malaysia‟s fish
export. The recent ban on the Malaysian seafood exports to the EU has
prompted the interest to undertake this study to examine the impact of
the EU‟s sanitary standards on fisheries industry in Malaysia. The
discussion is arranged as follows. Section 2 examines the trend in
fisheries sector in Malaysia. The trend and development in the EU‟s
seafood trade and Malaysia‟s trade with the EU are analysed in sections
3 and 4. Section 5 evaluates trade barriers in fisheries trade and the
focus of the discussion here is on the sanitary standards imposed by the
EU. Analysis on the impact of these measures on Malaysian fish
industry is deliberated in Section 6. Section 7 draws policy conclusions.
2.0 Malaysia’s Fish Production and Trade
2.1 Production
Fish industry in Malaysia is relatively insignificant in terms of its
contribution to GDP (1.7 percent of GDP in 2004) and foreign exchange
earnings (0.5 percent of total exports). Fish production in Malaysia
largely comes from marine capture sources, accounting for 87 per cent
in 2004 (Department of Fisheries Malaysia, 2004). The rest of
production is contributed by inland fisheries and aquaculture. Since
2000 the government has been seriously encouraging the aquaculture
production and its result in terms of the sector‟s contribution to total fish
output is apparent as shown in Table 1. The share of aquaculture in total
fisheries production rose from 13 per cent to 19 per cent between 2000
and 2001, and the share remained at this level since then.
The sector‟s contribution to rural employment is notable. In 2004, there
were about 89,453 fishermen working on licensed fishing vessels and
21,507 fish culturist involved in various aquaculture systems
(Department of Fisheries Malaysia, 2004). Sabah has the highest total
number of the fishermen working on licensed vessels with a total of
20,845 fishermen accounting for 23.3 percent of total fishermen in
Malaysia. This is followed by Sarawak (13,206 of fishermen and
accounts for 14.8% of total fishermen in the country), Terengganu
(8,654 fishermen; 9.7%) and Perak (8,136 fishermen; 9.1%). Majority of

54 Sanitary Standards in the EU: The Impact on Malaysian Fishing Industry
the fishermen in Malaysia are Malays (50%), followed by immigrant
workers (31%), Chinese (17%) and Indian (less than 1%)3.
Table 1: Malaysia: Fish Production from Marine Landings and
Aquaculture, 2000-2004 Year Marine Landing Aquaculture Total
Value (RM mn.) % of Total Value (RM mn.) % of Total Value
(RM mill)
2000 4,399.20 87 665.3 13 5,064.60
2001 4,166.10 81 958 19 5,124.10
2002 4,206.80 83 843.5 17 5,050.30
2003 4,013.60 81 931.1 19 4,944.70
2004 4,241.50 82 903.4 18 5,144.80
Source: Base on data taken from Mohd. Fariduddin (2006)
Fish processing industry is not large and there are only about 150
enterprises involved in this activity. Most of the fish processing firms
are family owned and small or medium-sized. The sector is largely
export-oriented and consists of processing of prawns, canning of fish,
and the production of surimi4 products
5. The frozen fish and seafood
industry is the largest of the fish processing industry segment in
Malaysia6. In 2000, about 13 major enterprises were involved in the
production of frozen fish and seafood products. The canned fish and
seafood industry is the second largest while the surimi production is the
third important fisheries processing sub-sector in Malaysia. There are
only about 7 firms respectively in these two sub-sectors. The canning of
fish and seafood products include canned tuna, canned mackerel and
canned sardines, canned prawns or shrimps, canned crustaceans and
canned molluscs. Some of the surimi producers are contract
manufacturers for European and Japanese seafood companies.7
3 http://www.fao.org/fishery/countrysector/FI-CP_MY/en
4 Processed fish used in the preparation of imitation seafood, especially imitation
shellfish. 5MIDA (2007), “The Food Processing Industry in Malaysia”, taken from
http://www.mida.gov.my/beta/view.php?cat=5&scat=9&pg=1703 6 GAIN Report (2002), “The Malaysian Seafood Market 2002”, obtained from
http://www.fas.usda.gov/gainfiles/200201/135683143.pdf. 7 GAIN Report (2002), “The Malaysian Seafood Market 2002”, obtained from
http://www.fas.usda.gov/gainfiles/200201/135683143.pdf.
Journal of Economic Cooperation and Development 55
This sector receives quite substantial amount of subsidy and other types
of support from the government. Under the New Economic Policy
(1970-1990), the government provided various subsidy schemes for the
fishermen which include improving existing vessels, purchasing of
fishing nets and ice boxes, and in some cases even providing fishing
boats to fishermen who do not own them (Hashim, 1998). In addition,
the government also developed infrastructure facilities for the fishing
communities, assists in the marketing of fish through cooperative
scheme and provide marine research and training services to improve
productivity of local fishermen. Furthermore, Malaysia fishermen also
receives diesel subsidy, where in year 2007 about 80,000 fishermen in
the country were entitled to a subsidy-scheme where they pay just RM1
per litre for diesel instead of the market price of RM2.208. Mehmet
(1986) however suggests that these fisheries subsidies and support
schemes have been a failure as result of inadequate and ineffective
supervision. The World Bank (1991) seconded this view but added that
the schemes have substantially helped poor fishermen in terms of
productivity improvement and pushing their income level higher. The
report noted that without the subsidy scheme, the poor farmers could
have never afforded modern boats and equipments. The benefit is seen
in terms of reduced poverty level among the fishermen. Hashim (1998)
reported that the poverty level in the fisheries sector fell from 45.3
percent in 1980 to 24.5% in 1987 as result of these schemes.
2.2 Fish Trade
Malaysia is a net importer of fisheries product in terms of volume and a
net exporter in terms of value. In 2004, fish product is the only sub-
sector which recorded surplus balance in the food trade (see Table 2).
This is contributed by exports of high-value fish (such as tuna) and high-
quality shrimp species which offset high import expenditure on fish.
8 http://thestaronline.com/news/story.asp?file=/2007/11/27/nation/19585429&sec=nation

56 Sanitary Standards in the EU: The Impact on Malaysian Fishing Industry
Table 2: Malaysia’s Food Trade in 2004
Commodity
Exports (RM
million)
Imports (RM
million)
Trade Balance
(RM million)
Livestocks 1005.2 2696.3 -1691
Fish products 2073 1935 138
Agricultural 4337.5 7778.4 -3441
Others 2513.8 4144.8 -1631
Totals 9930 16554.5 -6625
Source: Mohd Fariduddin Othman (2006)
Imported fish largely originates from Thailand (accounting for 59 per
cent of total fish import in 2003). The rest of the imports are sourced
from Indonesia (14%), China (5%) and India (5%). The top export
destinations of fish and fisheries products in value terms are Singapore
(14%), Japan (12%), Hong Kong (8.6%), Thailand (6%), China (5.6%)
and the EU countries such as United Kingdom, Spain, Belgium, Italy
and other countries (see Table 3).
Table 3: Malaysia: Top Ten Importers of Fisheries Commodities in 2003
Country Export Value (RM) Percentage of total
fish export value (%)
Singapore 226,974,092 13.5
Japan 199,787,364 11.9
Italy 144,994,431 8.6
Hong Kong 112,743,586 6.7
United Kingdom 102,810,454 6.1
Thailand 101,458,057 6.0
Belgium 99,003,185 5.9
Spain 96,379,146 5.7
China 93,473,074 5.6
France 89,171,347 5.3
Total Export to Top Ten Countries 1,266,794,736 75.3
Total Export of Fisheries Commodities
1,682,044,328 100
Source: Based on data taken from Department of Fisheries Malaysia (2004)
The bulk of fish exports are in the processed form (processed prawns,
canning of fish, and the production of surimi products). Frozen shrimps
lead the list with a share of 40 per cent of total fish exports (see Table 4).

Journal of Economic Cooperation and Development 57
Table 4: Malaysia: Top Ten Commodities Exported in Terms of Value (2003)
Type of Commodities Export
Value (RM)
Percentage
of Export
Value (%)
Shrimps and Prawns, Fit for Human Consumption,
Frozen 670,883,299 39.9
Cuttlefish and Squid, Frozen 157,584,339 9.4
Shrimps and Prawns Other than In Airtight
Containers, Prepared or Preserved 87,820,916 5.2
Shrimps and Prawns, O/T in Shell, Fresh or Chilled 76,441,765 4.5
Other Ornamental Fish, other than Fry, Alive 71,632,621 4.3
Other Live Fish, other than Trout, Eels or Carp 67,678,871 4.0
Flours, Meals & Pellets, of Fish Meal, Unfit for
Human Consumption 58,269,523 3.5
Other Fish, Whole or in Pieces, but not Minced,
Other than in Airtight Containers 55,099,811 3.3
Other Prepared or Preserved Fish, in Airtight
Containers 41,047,083 2.4
Other Fish, excluding Livers and Roes, Fresh, or
Chilled 38,978,504 2.3
Total Top Ten Commodities 1,325,436,73
2 78.8
Total Export of Fish Product 1,682,044,32
8 100.0
Source: Department of Statistics Malaysia (2004)
Other major exports are frozen cuttlefish and squid (9%) and prepared or
preserved shrimps and prawns (5.2%). Live fish, shrimps and
ornamental fish account less than 15 per cent of the total exports in
2003.
2. The EU Fisheries Trade
The EU is key market and exporter of fish product in the world, where
it accounted for 44 per cent and 37 per cent of total world import and
export of fish respectively in 2005. The EU has trade deficit in fish and
fishery product. In 2005, EU imports of fish, crustaceans and molluscs
totalled US$35.9 billion while exports totalled US$28.8 billion, a trade
deficit of US$7.1 billion.

58 Sanitary Standards in the EU: The Impact on Malaysian Fishing Industry
Major EU fisheries exporters are Netherlands, Spain, UK, France and
Germany, and these five countries account 63 percent of total EU fish
exports (see Table 5). In 2005, about 82 percent of EU‟s exports were
traded between its members9.
Table 5: Major Fish and Fish Products Exporters in the EU, 2005
Country Exports in US$000 % of Total EU Exports of Fish
Netherlands 2820 17
Spain 2579 16
UK 1872 11
France 1583 10
Germany 1501 9
Total EU Fish Export 16429 63
Source: FAO, 2005
High share of fish products are traded between the EU members. In
2005, import from EU (25) accounts 43.2 percent of total EU fisheries
import, while the remaining supplies were sourced from other
European countries (14.7%), Africa (10.3%), South America (9%),
East and Southeast Asia (5.2%) and China (2.9%). Norway is the main
supplier of fish and fishery products to the EU (see Table 6). Other
major suppliers are Iceland, China, United States, Morocco, Thailand,
Ecuador, Argentina and India. These ten countries account for more
than half of all imports into the EU fish and fishery products (European
Commission, 2007).
The EU‟s dependence on imported non-processed fishery products to
cater its processing industry has increased over the years as a result of
declining fishery stocks in its waters and the reduced annual TACs
(USDA, 2007). Spain accounts for 22 percent of total EU imports and
other major importing countries are UK, Denmark, Germany and Italy.
The largest category of fish products imported into the EU is shrimps,
followed by cod, trout and salmon and tuna (Nolting, 2006). In 2005,
the EU25 imported shrimps worth €2.5 billion and shrimp accounted
for about 18 per cent of total import of fishery products10
.
9 Calculated based on data obtained from FAO (2005), Yearbooks of Fishery Statistics
10 http://ec.europa.eu/trade/issues/sectoral/agri_fish/fish/pq_en.htm

Journal of Economic Cooperation and Development 59
Table 6: Major Exporters of Fisheries Products to the European Union, 2005
Country Fish Trade (EUR
Million)
Share in Extra EU 25 imports of
fish and fishery products(%)
Norway 2386 17
Iceland 1082
China 871 8
USA 687 6
Morocco 667 5
Chile 479 5
Thailand 429 3
Ecuador 410 3
Argentina 403 3
India 372 3
Sub- Total 7786 55
Source: European Commision (2007)
Spain is the major importer of shrimps in the EU, accounting for 25
per cent of total EU import of shrimps in 2004. This is followed by
United Kingdom (17 per cent), France (13 per cent), Italy (7 per cent)
and Germany (4 per cent). In 2005, the major suppliers of shrimps to
the EU market (in terms of volume) are Greenland (15%), Ecuador and
India (8%), followed by Brazil and Canada (7%)11
. Shrimps can be
categorized into two types, coldwater shrimp and warm-water shrimp.
Generally, consumers in North Europe prefer coldwater shrimp while
the tropical warm-water shrimp are preferred by the Southern
Europeans (Nolting, 2006). However, since the supplies of cold-water
shrimp have reduced in the recent years, the warm-water shrimp is
becoming increasingly popular in the Europe.
4. Malaysia’s Fisheries Exports to the EU
The EU is the most important market for Malaysia‟s fish export. In
2007, the EU imported RM 630 million worth of fish and fish products
from Malaysia and it constitutes abut one third of the total Malaysia‟s
fish export. Italy is the largest buyer followed by France, UK Belgium,
Netherlands, Spain and Germany (see Figure 1).
11
http://ec.europa.eu/trade/issues/sectoral/agri_fish/fish/pq_en.htm

60 Sanitary Standards in the EU: The Impact on Malaysian Fishing Industry
$0
$50
$100
$150
$200
$250
$300
Italy
Fran
ce UK
Belgi
um
Net
herla
nds
Spain
Ger
man
y
US
$ M
illio
n
Figure 1: Malaysia’s Export of Fish, Crustacean and Molluscs to the
EU by Major Importing Countries, 2000-2006
Source: Comtrade Online Database
Note: Data are for Fish, Crustacean and Molluscs, SITC Code 03
Table 7: Seafood Export from Malaysia to European Union,
2004-2007 (in Ringgit)
SITC
CODE Product Classification 2004 2005 2006 2007
34 Fish, Fresh, Chilled
and Frozen 33,718,750 40,097,037 63,419,461 81,299,904
35 Fish, Dried, Salted, in
Brine, Smoked 2,214,771 2,395,188 4,130,155 5,070,573
36 Crustacean, Molluscs
etc 447,286,736 433,464,037 436,539,057 439,503,522
37 Fish, Crustaceans,
Molluscs, nec 97,623,323 106,860,861 113,345,668 104,201,000
03
Total – Fish,
Crustaceans and
Molluscs
580,843,580 475,956,262 617,434,341 630,074,999
% of Total Exports to
EU 0.6% 0.5% 0.6% 0.7%
Source: Matrade, Online Database

Journal of Economic Cooperation and Development 61
Shrimps accounted 70 per cent of total Malaysia‟s exports of fish to the
EU in 2007 and Malaysia is the 8th
largest exporter of shrimps to the EU
in 2004 with a share of 4.6 percent of the total EU imports of shrimps.
Table 7 and Figure 2 show the importance of shrimp exports to the EU
in comparison to other seafood product categories.
Figure 2: Malaysia’s Seafood Export to the EU by Product
Category, 2007
Source: Matrade, Online Database
Note: For the SITC Code, please refer to Table 8. SITC 36 is for Crustacean, Mollusc
etc.
Shrimps exported to the EU are mostly sourced from aquaculture farms
and the species preferred by the Europeans are giant tiger prawn and
white leg shrimp12
. Italy and France are two key importers of shrimps
from Malaysia. Other key buyers are Spain, Belgium, UK and the
Netherlands (see Figure 3).
12
Information obtained from discussion with an official at the Department of Fisheries
Malaysia.

62 Sanitary Standards in the EU: The Impact on Malaysian Fishing Industry
Figure 3: Major Importers of Malaysia’s Shrimp in the EU,
2000-2006 (US$)
Source: Comtrade Database Online
In Italy, Malaysia is the top three suppliers of shrimp 2005. However,
Malaysia is not the key supplier in other important shrimps market in
Europe, namely France, Spain, Belgium, UK, Netherlands and
Germany.
5. The EU Sanitary Standards on Seafood
Fish and fish products intended for human consumption and sold in the
EU market have to comply with the EU legislation related to food and
feed safety13
. The latest legislation is the EU General Food Law
(178/2002) which was introduced in 2005. The objective of this law is to
harmonise framework for food safety assurance from farm to consumer
(“farm to folk”) across the 25 EU members (Bostock et al., 2004 and see
Table 8). This new regulation provides a single and transparent food
hygiene systems and regulations which repeals and integrates 17
13
http://ec.europa.eu/fisheries/legislation/other/food_hygiene_en.htm

Journal of Economic Cooperation and Development 63
previous rules for specific sectors and types of product into a new “Food
Hygiene Package” (Ababouch et al., 2005).
Table 8: New European Union Hygiene Package of Regulations and
Directives Package Regulation/Directive Covering
Hygiene 1
European Parliament and
Council Regulation (CE)
852/2004 on the hygiene of
foodstuffs
General requirements primary
production, technical requirements,
HACCP, registrations/approval of
food businesses, national guides to
good practice
Hygiene 2
European Parliament and
Council Regulation (CE)
853/2004 laying down specific
hygiene rules
Specific hygiene rules for food of
animal origin (approval of
establishments, health and
identification marking, imports,
food chain information)
Hygiene 3
European Parliament and
Council Regulation (CE)
854/2004 laying down specific
rules for the organisation of
official controls on products of
animal origin intended for
human consumption
Detailed rules for the organisation of
official controls on products of
animal origin (methods to verify
compliance with Hygiene 1 & 2 and
animal by-products regulation
1774/2002
Hygiene 4
Council Regulation (CE)
882/04 laying down health
rules governing the production,
processing and importation of
products of animal origin
Veterinary certification, compliance
with EU rules
Hygiene 5
European Parliament and
Council Directive 2004/41/EC
repealing 17 existing Directives
Ababouch et al. 2005, Table 3
These regulations cover all food products from farm to retail and the
main features of the Hygiene Package that are relevant for exporters are
as follows (Ponte et al., 2005)14
:
1. Private enterprises need comply with the safety regulations and
the HACCP system at the all level of supply chain, from
14
Appendix 1, p.10
64 Sanitary Standards in the EU: The Impact on Malaysian Fishing Industry
catching the fish, handling, processing and packaging fish and
fish products;
2. Countries exporting their products to the EU must practice health
and sanitary regulations that are at least equivalent to the ones
required by the EU;
3. Exporting countries are required to appoint competent authorities
to implement the HACCP system and issue certification.
There are a few essential measures needed to regulate and manage
quality and safety of food products (Huss et al, 2004) which include:
1. Good Hygienic Practices (GHP) and Good Manufacturing
Practice (GMP)
2. Hazard Analysis Critical Control Point (HACCP)
3. ISO Standards
4. Other standards related to quality control and management such
as Total Quality Management (TQM) and Quality Control (TC)
The European Union requires imports from third countries to comply
with the general principles of HACCP. The GMP, GHP and other
relevant Codes of Practice are prerequisite for the implementation of the
HACCP system15
. GMP is a general policy related to practices,
procedures and processes that is essential to produce food products that
are safe and of uniform quality while GHP is part of GMP concerning
measures needed to ensure hygiene and safety (Blackburn, 2003).
5.1 Hazard Analysis Critical Control Point (HACCP)
The HACCP was first introduced as a measure to regulate and monitor
food processing industry in the United States in 1973. The system is
now being endorsed and implemented worldwide by Codex
Alimentarius16
, the European Union and by several countries including
Canada, Australia, New Zealand and Japan (Cato et al., 1998). The
European Union formally legislated HACCP system in 1991, and this
assessment and quality control system is to be applied by all European
15
http://www.sirim-
qas.com.my/index.php?option=com_content&task=view&id=22&Itemid=204 16
The Codex Alimentarius Commission was established in 1963 under the FAO and
the World Health Organisation (WHO). The objective is to develop food standards,
guidelines and related texts to protect the health of consumers, to ensure fair trade
practices and to promote coordination of food standards at international level.

Journal of Economic Cooperation and Development 65
Union member countries and in those countries that wish to export to the
European Union (Cato et al., 1998).
HACCP is a scientific and systematic approach that identifies, assesses
and controls hazard to ensure the hygiene and safety of food in whole
supply chain (Huss et al., 2004). This includes the whole process of
preparation, processing, manufacturing, packaging, storage,
transportation and distribution of food products, i.e. from the farm to the
consumer17
. The HACCP system is implemented based on seven
principles (ICTSD, 2006; and Cato et al., 1998):
1. Conduct a hazard18
analysis
2. Determine the critical control points
3. Establish critical limits
4. Establish a system to monitor the critical control point
5. Establish the corrective action to be taken when monitoring
indicates that a particular critical point is not under control
6. Establish a procedure for verification to confirm that the HACCP
system is working effectively; and
7. Establish documentation concerning all procedures and records
appropriate to these principles and their applications.
The EU institutes two-tier system in enforcing the HACCP system and
in ensuring that the third country complies with the general principles of
the HACCP system prior to arrival of the products at the EU border.
First, a country must obtain approval to export to the EU or in other
words a country must be licensed to export their fisheries products into
17
http://www.sirim-
qas.com.my/index.php?option=com_content&task=view&id=22&Itemid=204 18 Food hazard is defined as “a biological, chemical, or physical agent that is
reasonably likely to cause human illness or injury in the absence of its control”
(USFDA, 2007). Biological hazards include pathogenic bacteria, biogenic amines,
viruses, parasites and aquatic biotoxins (Huss et al, 1998). Chemical hazards refer to
the presence of heavy metals, pesticides, veterinary medicines, sterilizing chemicals
and food additives (NZFSA, 2007). Some marine fish contain high level of
methylmercury, polychlorinated biophenyls (PCBs), dioxins and other environmental
contaminants while aquacultured fish is contaminated because of the usage of
chemicals to sterilize pond soils in between intervals (Venugopal, 2006). In general,
aquacultured fisheries have high exposure to chemical and biological hazards than
marine fisheries (Venugopal, 2006). Physical hazards are “foreign objects that may
cause illness or injury” such as glass, metal, and shell fragments (NZFSA, 2007).
66 Sanitary Standards in the EU: The Impact on Malaysian Fishing Industry
the EU market. Approved exporting countries are classified into two
categories, i.e. List 1 and List 2. Countries that are considered to have
achieved equivalent or harmonised regulations and systems on food
safety standard as in the EU are placed in List 1 and these countries are
allowed to export to the EU countries without having to go through
further border inspection. In 2004, there were 97 countries listed under
this category and Malaysia has been placed in this list. However, as a
general rule 1-5 per cent of the consignments will be randomly taken as
sample and subjected to sensory, chemical (histamine, mercury, total
volatile bases TVB-N, etc.) or biological (total flora, indicator
organisms, parasites etc.)19
tests. In the case where the analysis detects
any contamination risks, the member state is required to notify all other
EU member states of this border case. Notification is done through the
Rapid Alert System of the European Union20
. Exporting countries will
also be notified and subsequently the consignment will be sent back to
the country of origin. Countries that are listed in the List 2 are those who
are in the process of gaining approval from the EU authority. Their
exports are deemed safe but shipments from these countries are subject
to 100 percent border checks.
Secondly, individual exporting companies have to obtain certification
from the Competent Authority (CA) that is appointed by the EU in the
country of origin. Approved companies are given certification number
and their particulars are posted and made known to relevant parties
through the EU website and other documents (Ababouch et al., 2005). In
Malaysia, fisheries supply chain is regulated by three agencies, i.e. the
Food Safety and Quality Division (FSQD) within the Ministry of Health,
the Department of Fisheries and the Fisheries Development Authority
(LKIM). The Ministry of Health Malaysia has been appointed by the EU
as the Competent Authority (CA) for fishery products in 1996 under the
Commission Decision 96/608/EC.
19
Ababouch et al., 2005 20
Notifications are posted on weekly basis (since 2003) and accessible through
internet. There are two types of notification. Information notification is done when risk
is identified in the consignment but member states do not have to take immediate
action because the product has not reached the market. Alert notification is sent to
members when risk is detected and the product is already in the market. Alerts are
triggered by the Member state that detects the problem and immediate action is taken
to withdraw or recall the product.

Journal of Economic Cooperation and Development 67
The HACCP certification obtained from the CA however does not
guarantee the consignments would go through the EU border control
smoothly; in fact there are cases where products were returned back to
the importer after reaching the supermarket shelves. As mentioned
earlier, export consignments could be rejected under the Rapid Alert
System if the samples taken for hazard analysis detect any health risks.
5.2 Traceability Requirement
Requirement for traceability has become a hotly debated issue at the
multilateral negotiations after the outbreak of „mad cow disease‟ and
other food related diseases. Consumers demand to know the food they
are consuming is safe and that there is no risk of contamination or
disease. Traceability can be defined as the ability to follow the
movement of food through the stages of production, processing and
distribution (ICTSD, 2006). It involves process of documenting all the
stages of production and distribution which requires reporting of the
ingredients used in fish feed, the use of medications and antibiotics in
aquaculture farm, methods of harvesting, environmental monitoring,
handling of the product and distribution channels. There are two types of
traceability systems; internal traceability and external traceability
(Lupin, 2006). Internal traceability refers to the traceability at the
production site that includes traceability of raw materials, intermediate
and final products. External traceability on the other hand is a system
that allows the traceability of a product through the successive stages of
the distribution chain (boat/fish farm to consumer). Table 9 illustrates
purposes, objectives and attributes of traceability system.
In addition, it is a mandatory requirement in the EU and US to declare
country of origin and method of production at each stage of processing
and marketing through labelling, packaging or accompanying
documentation (ICTSD, 2006).

68 Sanitary Standards in the EU: The Impact on Malaysian Fishing Industry
Table 9: Traceability, Purposes, Objectives, Attributes to Trace
and Examples (Regulations and Standards)
Purpose Objective Attributes Example
Safety
Consumer
protection
(through recall
and withdrawal)
Specified in food
& fish safety
regulations
EU regulation
USA regulation
Security
Prevention of
criminal actions
(through
verifiable
identification
and deterrence)
Specified in
security
regulations
USA Prevention of Bio-
terrorism, regulation
Verification of
selected
attributes on
package and/or
food
Brand & product
protection
Regulatory
Quality
Consumer
assurance
(through recall
and withdrawal)
Specific
attributes
included in
regulations
EC labelling, mandatory
consumer information.
Non-regulatory
quality &
Marketing
Creation and
maintenance of
credence
attributes
Specific
attributes
included in
public standards
Public Quality seals (e.g.
Label Rouge, France)
Organic fish, Eco-
labelling
Food chain
trade &
logistics
management
Food chain
uniformity &
improved
logistics
Specific
attributes
required to food
and services
suppliers by
contract
Own traceability systems
(e.g. Wal-Mart)
Plant
Management
Productivity
improvement
and costs
reduction
Internal logistics
and link to
specific
attributes
From simple to complex
IT systems.
Source: Lupin (2006)
6.0 The Impact of Sanitary Standards on Seafood Exports
6.1 Rejection of Consignments at the EU Border
Seafood products that do not meet the EU sanitary standards will be
either rejected outright or quarantined at the EU port of entry. The
Journal of Economic Cooperation and Development 69
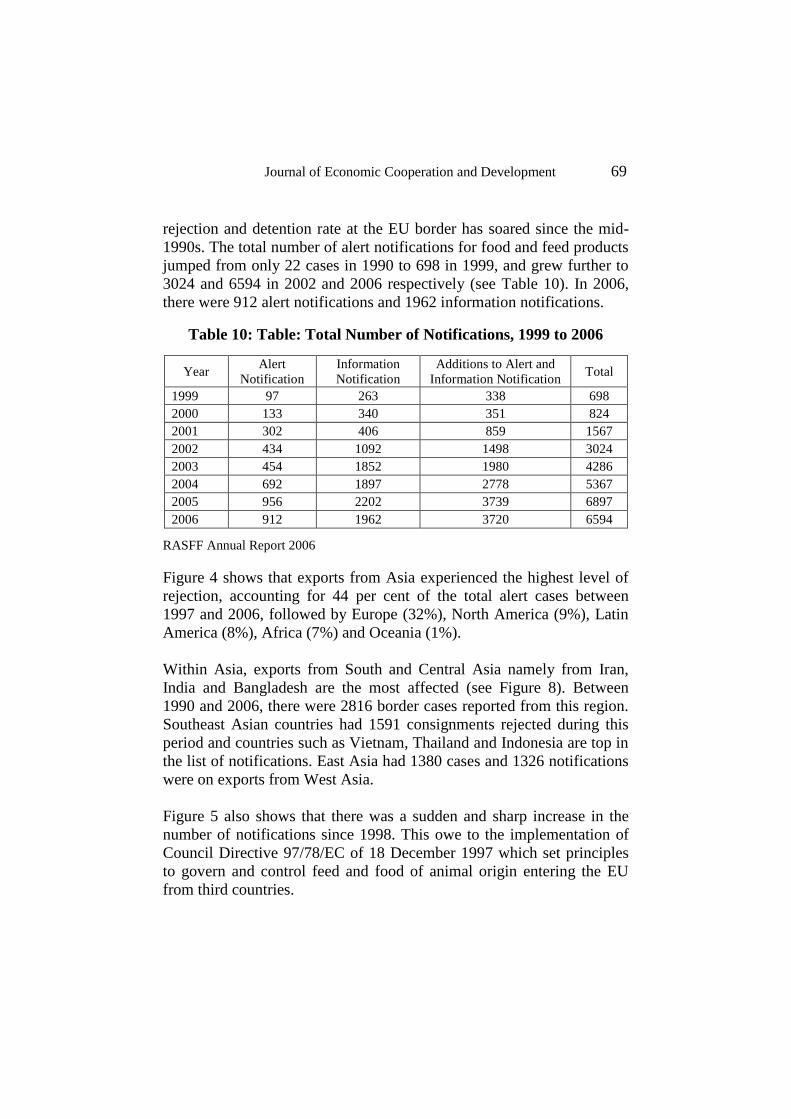
rejection and detention rate at the EU border has soared since the mid-
1990s. The total number of alert notifications for food and feed products
jumped from only 22 cases in 1990 to 698 in 1999, and grew further to
3024 and 6594 in 2002 and 2006 respectively (see Table 10). In 2006,
there were 912 alert notifications and 1962 information notifications.
Table 10: Table: Total Number of Notifications, 1999 to 2006
Year Alert
Notification
Information
Notification
Additions to Alert and
Information Notification Total
1999 97 263 338 698
2000 133 340 351 824
2001 302 406 859 1567
2002 434 1092 1498 3024
2003 454 1852 1980 4286
2004 692 1897 2778 5367
2005 956 2202 3739 6897
2006 912 1962 3720 6594
RASFF Annual Report 2006
Figure 4 shows that exports from Asia experienced the highest level of
rejection, accounting for 44 per cent of the total alert cases between
1997 and 2006, followed by Europe (32%), North America (9%), Latin
America (8%), Africa (7%) and Oceania (1%).
Within Asia, exports from South and Central Asia namely from Iran,
India and Bangladesh are the most affected (see Figure 8). Between
1990 and 2006, there were 2816 border cases reported from this region.
Southeast Asian countries had 1591 consignments rejected during this
period and countries such as Vietnam, Thailand and Indonesia are top in
the list of notifications. East Asia had 1380 cases and 1326 notifications
were on exports from West Asia.
Figure 5 also shows that there was a sudden and sharp increase in the
number of notifications since 1998. This owe to the implementation of
Council Directive 97/78/EC of 18 December 1997 which set principles
to govern and control feed and food of animal origin entering the EU
from third countries.

70 Sanitary Standards in the EU: The Impact on Malaysian Fishing Industry
Figure 4: Alert Notifications by Regions, 1997-2006
Source: Based on data extracted from RASFF Annual Report 2006
Figure 5: Notifications for Exports from Asia, 1990-2006
Source: RASFF Annual Reports

Journal of Economic Cooperation and Development 71
Seafood and meat related products had the highest border detention
incidence in the EU. Between 2002 and 2006, fish and fish products
accounted for more than 20 per cent of the total alert notification cases,
while notifications on meat and meat products comprise of 12-23 per
cent of the total notifications (see Figure 6). Other products with
significant number of notifications were cereal and bakery products,
fruits and vegetables, nut and nut products and herbs and spices.
Figure 6: EU Alert notifications by product category (% of total),
2002-2006
Source: RASFF Annual Report 2006
In 2006, there were 522 alert and information notifications for seafood
alone and this account for 44 percent of the total number of
notifications. Out of this 175 were alert notifications (20 per cent of total
alert notifications on food and feed products) and 1962 information
notifications. Within this category, fish and fish products had the highest
number of alert notifications accounting for 63 per cent of total alert
notifications for fish, crustaceans and molluscs category. In 2005 and
2004 it accounted for 73 per cent and 67 per cent respectively.

72 Sanitary Standards in the EU: The Impact on Malaysian Fishing Industry
Crustaceans and products also had high number of detentions at the EU
border (see Table 11).
Table 11: Alert and Information Notifications for Fish, Crustaceans
and Molluscs, 2004-2006
2006 2005 2004
Product
Category Total Alert Information Total Alert Information Total Alert Information
Fish,
Crustaceans
and
Molluscs
522 175 347 559 196 363 541 168 373
Molluscs
and product
thereof
86 32 54 79 10 69 83 19 64
Crustaceans
and product
thereof
145 32 113 168 43 125 161 36 125
Fish and
product
thereof
291 111 180 312 143 169 297 113 184
Total (Alert
and
Information
Notification
for Food
and Feed)
2874 912 1962 3758 956 2202 2588 691 1897
Source:RASFF Annual Report 2006
Italy notified the highest number of cases in 2006 (574 notifications),
followed by Germany (425), France (355), Spain (223), the Netherlands
(164) and Great Britain (112).
The dominant causes of border detention in the EU in 2006 were
pathogenic micro-organisms (16% of alert notifications), food additives
(8%), heavy metals (8%) and mycotoxins (8%). Most cases were
detected in Italy (45 notifications), Denmark (39), Sweden (37), Great
Britain and Finland (25 cases).
Major causes for detention at the border were related to heavy metals,
residues of veterinary medicinal products and food additives. In 2006,
heavy metals were found largely in fish and fish related products (84
cases) while residues of veterinary drugs and food additives were found
Journal of Economic Cooperation and Development 73
mainly in crustaceans and crustacean products (54 and 52 cases
respectively). Mercury and cadmium content were the greatest risks in
the heavy metal contamination cases, accounting for 70 per cent of
border cases in 1999 and 2000 (Ababouch et al., 2005). In 2006, the
notifications for mercury were 71 (57% of heavy metal category
notifications), compared to 46 in 2005 and 45 in 2004 (RASFF, 2006).
Swordfish had the highest number of notifications (36) followed by
shark (17 notifications) and tuna (7 notifications). Indonesia received the
highest number of alert cases in relation to mercury content (18 cases in
2006).
Cases involving residues of veterinary medicinal products, especially
chloramphenicol and nitrofuran, have increased over the years due to
rigorous testing regimes especially on shrimp imports from Southeast
Asian countries (Ababouch et al. 2005). Between 2000 and 2001, these
two chemicals accounted for over 65 per cent the border cases
(Ababouch et al, 2005). Between 2005 and 2006, the number of
notifications for chloramphenicol has increased from 2 to 5. Countries
that have given rise to border cases are Vietnam (2 cases for shrimps and
another 2 cases related to fish) and Myanmar (1 case related to tilapia)21
.
Border detentions caused by nitrofuran metabolites increased from 36 in
2005 and 57 in 2006 and most of them were found in shrimps (RASFF,
2006). Most of the cases are found in exports from Bangladesh (27) and
India (20), while the remaining rejected consignments are from Vietnam
(3), China (1), Indonesia (1), Thailand (1) and Venezuela (1).
Pathogenic micro-organisms contamination is the second largest risks
and they are largely found in molluscs and fish related products (see
Table 12). Ababouch et al (2005) reported that the micro-organisms
risks are mostly related to vibrio spp. and Salmonella which accounted
for about 66 percent of micro-organism related border detention between
1999 and 2002. So far only cooked crustaceans and molluscs and live
bivalve molluscs have harmonized microbial criteria in the EU. For
other category of fish and fish products, each individual member state
has their own criteria for the common indicator and specific bacteria and
in addition there is lack of scientifically based risk assessment
(Ababouch et al. 2005). All these had caused difficulties and confusion
21
Taken from RASFF Annual Report 2006.

74 Sanitary Standards in the EU: The Impact on Malaysian Fishing Industry
to exporters who export to different countries in the EU. However, the
EU has responded to this concern and there are efforts to harmonize the
microbial standards for seafood products (Ababouch et al., 2005).
Table 12: Notifications by hazard and product category
2006 2005
HAZARD
CATEGORY Molluscs
Crusta
ceans Fish Total Molluscs
Crusta
ceans Fish Total
Heavy metals 24 17 84 125 20 20 51 91
Residues of
veterinary medicinal
products
0 54 26 80 0 42 62 104
Food additives 1 52 26 79 0 66 2 68
Industrial
contaminants
(other)
0 2 39 41 0 0 5 5
Pathogenic
microorganisms(pot
entially)
22 7 11 40 44 22 59 125
Composition 0 0 29 29 0 1 61 62
Biocontaminants
(other) 0 0 29 29 0 0 22 22
Biotoxins (other) 25 1 0 26 9 5 14
Organoleptic
aspects 1 5 13 19 1 1 0 2
Parasitic infestation 0 0 17 17 0 0 20 20
Not determined /
other 7 3 5 15 0 0 1 1
Microbiological
contamination 6 0 4 10 22 5 19 46
Bad or insufficient
controls 2 4 4 10 1 6 7
Packaging defective
/incorrect 0 0 6 6 0 0 4 4
Foreign bodies 0 0 3 3 1 1 2
Labelling
absent/incomplete/i
ncorrect
0 0 3 3 0 0 0
Pesticide residues 0 0 2 2 0 0 0 0
Radiation 0 0 0 0 0 1 1 2
Source: RASFF Annual Reports
As for excessive additives content in food products, the major risk is
related to high level of sulphites. Notifications on this have remained
high at 80 cases in 2006 and 101 cases in 2005, mainly involving

Journal of Economic Cooperation and Development 75
crustaceans (45 in 2006 and 63 in 2005)22
. Table 12 shows that total
number of notifications in 2006 relating to food additives for
crustaceans was 52, fish (26) and molluscs (1).
6.1.1 Rejection Seafood Exports from Malaysia
Malaysia has been subjected to relatively high rates of alert notifications
particularly for its fish and crustaceans exports (see Table 13). The
highest number of rejections happened in 2003 and 2004, with 27 and 17
cases respectively. Most of the rejected consignments were crustaceans.
In 2000 all the seven out of the eight cases are for shrimps and tiger
prawns (one rejection for frozen cuttlefish). Similarly, 13 out 17 cases in
2004 involve shrimps and prawns. Interestingly, there appears to be a
change in the trend in 2005 and 2006, where smaller number of seafood
consignments has been rejected and there were no consignments
containing prawns or shrimp rejected (2 cases for processed fish and 1
case frozen crabmeat). Meanwhile in 2007, only one out of 10 cases was
related to prawns, and all the remaining cases are for dried fish
(including anchovy, mackerel and catfish)
Table 13: Notifications on Malaysian Fisheries Exports to the EU,
2002-2006
Year 2007 2006 2005 2004 2003 2002 2001 2000
Number of Alert
Cases 11 12 8 23 34 14 16 8
Notifications on Fish,
Crustaceans and
Molluscs
10 3 2 17 27 11 16 8
Source: RASFF Annual Reports and Ministry of Health Malaysia
Major reasons for rejection are related to pathogenic bacteria which is
harmful to human health such as salmonella and vibrio spp.. However,
the rate of rejection due to hygiene reasons has declined over the years
with the improved processing facilities and stricter control on hygiene
standards. Recent rejections (after 2005) have been mainly due to
antibiotic residues and high level of heavy metal content. Another
interesting trend observed is that prior to 2005, most border cases are
22
RASFF Annual Report 2006

76 Sanitary Standards in the EU: The Impact on Malaysian Fishing Industry
reported by Italy while in the recent years rejection largely comes from
the UK.
It has to be noted here that Malaysia‟s border rejection is much lower
than its competitors in the region such as Thailand, Indonesia, Vietnam
and China. In 2002 for example the EU decided to examine 100%
shrimp products imported from China, Thailand, Vietnam, Indonesia
and other countries (Bostock et al., 2004), but Malaysia was spared from
this problem.
6.2 Costs of Compliance and Rejections
Stringent food safety standards and regulations imposed by the EU and
other industrial countries have serious implications on developing
countries, particularly in terms of costs of compliance (Bostock et. al.,
2004; Ababouch et al. 2005). Ahmed (2006) highlighted that these costs
include production and processing costs in terms of upgrading
infrastructure and buildings, monitoring, purchasing new equipment,
and training and employing qualified staff. The compliance costs are
highly prohibitive for poor fishers and small-scale processing firms in
the developing countries.
To obtain a HACCP certificate for example, an individual fish
processing firm must have certified processing plant and operations that
have met various sanitation requirements and practices. These include
safety of water, condition and cleanliness of food contact surfaces,
prevention of cross-contamination, maintenance of hand-washing, hand
sanitizing and toilet facilities, protection from adulterants, labeling,
storage and use of toxic chemicals, employee health conditions and
exclusion of pests (Stone, n.d). Humpal and Guenette (2000) reported
that monitoring seafood HACCP would costs between $1000 and $5000
annually. An average plant is estimated to spend US$34,000 to
US$72,000 per year to maintain a HACCP plant (Dey et al.,2002). In
Nicaragua and Bangladesh, the costs of upgrading fishery processing
facilities to comply with the EU standards were as high as US$560,000
with annual maintenance costs of US$290,000 and US$18 million with
annual maintentance costs of US$2.4 million respectively (Ahmed,
2006). Cato and Santos (1998) reported that Bangladesh spent 9.4 per
cent and 1.26 percent of its fish and fish products export revenue to

Journal of Economic Cooperation and Development 77
install HACCP plant and to maintain the HACCP plant each year
respectively.
Personnel training programmes are usually necessary to ensure HACCP
compliance and this can easily cost $100 to $300 per employee. In fact
in some countries, experts were imported to train the employees.
Medical inspection of workers handling food has to be done periodically
and all information must be documented. The inspection encompasses
clinical inspection, bacteriological examination of faeces with regard to
Salmonella bacteria, daily control of the personal to avoid purulent
wounds, persons with diarrhoea and other problems to come in contact
with food (Ourfood Database). Henson, Saqib and Rajasenan (2004) in
their study on the impact of sanitary measures on exports from India
reported that the costs of establishing facilities for inspection is
estimated to be US$6,444 per annum per plant in 2001-2.
The HACCP certification is costly. Table 14 shows that the cost of
obtaining new HACCP certificate in Malaysia is RM4,505 per
consignment for large-scale industry and RM3,235 per consignment for
small and medium enterprises (SMEs).
Table 14: Cost of HACCP Certificate in Malaysia in Ringgit Malaysia
(RM), 2008
Subject Large Scale Industry
Small and Medium Scale Industry
New Application* 4505 3235
Renewal of Licence 600 600
Source: Ministry of Health Malaysia.
Note: * Payment for auditing for 1 day. Additional payment of RM550 is charged for
additional days. All costs for air ticket, accommodation, mileage, and other costs are to
be borne by the applicant company.
Large Scale Industry – more than 150 employees and turnover more than RM25
million per year
SME – Less than 150 employees and turnover less than RM25 million per year
Cost of implementing HACCP varies according to countries and firms.
Evidences suggest a higher unit cost of compliance for small scale
producers (ICTSD, 2006; Ahmed, 2006). Dey et al. (2002) made
78 Sanitary Standards in the EU: The Impact on Malaysian Fishing Industry
comparison of the installation of HACCP plants in Malaysia, Thailand,
India and Bangladesh and found that the cost is the highest in Malaysia
and lowest in Bangladesh (see Table 15).
Table 15: Cost of Implementing HACCP in Selected Asian Countries
Type of Costs Thailand India Bangladesh Malaysia
Cost of a plant
(US$‟000 per
year)
47.62 – 71.43 41.237 34.88
Total investment
of a plant
(US$‟000)
380.95-404.80 309.28 277.16 3000.00
Cost of fish
processing (US$
per kg per year)
0.010-0.014 0.21-0.28 0.033-0.090
Total investment
(US$ million) 1.07 14.9 315.00
Source: Dey et. Al (2002), Table 6
The compliance costs are particularly high in developing countries
because of the requirement of having to source the machines,
technologies and some chemicals from the developed countries. Stone
(n.d) reported that only a specific type of imported salt is allowed to be
used in processing fried fish products in Fiji.
Time consuming process of obtaining approvals from the European
Commission before export consignments are allowed to enter the market
also have disruptive impact on trade23
. Some argue that measures
imposed by the EU are exaggerated and unnecessary to protect human
health, environment and sustainable fisheries. In addition, all by-
products that contain seafood are also subject to regulations on hygiene
standard. MATRADE reported that instant noodles from Malaysia
which contain seafood extracts or even flavourings are not allowed to
enter the EU market without relevant certifications from the CA in the
country of origin. Similarly, seafood product containing non-seafood
extracts are required to conform to the non-seafood sanitary standards.
23
Malaysia External Trade Development Corporation, taken from
http://www.matrade.gov.my

Journal of Economic Cooperation and Development 79
For instance, shrimp crackers containing 4 percent eggs have to be
accompanied by a health certificate for eggs (MATRADE website). In
addition, the exporters are also required to conform to various
packaging, marking, labelling, rules of origin and environmental
equirements to gain entry into the EU market.
7. Conclusions
High sanitary standards set by the EU countries on seafood products
from third country have created countless problems to exporters from
developing countries. The main problem is related to compliance to the
standards and obtaining certifications. Small-scale enterprises are the
most affected. Training, capacity building programmes and outreach
activities undertaken by the government and the European Commission
to inform and create awareness on various standards, regulations and
procedures to ensure compliance have been very beneficial for the
seafood producers. However, the real problem is that the whole process
of upgrading the facilities, financial consequences, opportunity costs
related to time and efforts and finally facing the uncertainty at the EU
border are too much to bear for most of the small and medium scale
producers, fishermen and exporters in the developing countries.
Dependency on the developed countries market presents serious
challenges in terms of market access and compliance with their
continuously evolving and progressing technology and standards. It is
therefore pertinent that Malaysia and all other Muslim countries
exporters find alternative market within their own region. Promotion and
enhancement of intra-trade among Muslim countries is a way forward in
coping with myriad of trade restrictions imposed by the developed
countries. The rich Gulf market need to be tapped fully as they have
very high purchasing power and their market has not been fully explored
yet. More aggressive and effective marketing is necessary in the Gulf
States to switch their preferences towards fisheries products originating
from Malaysia. However, it is important to realise that the sanitary
standards in these countries are equally high as that of the European
Union. It is crucial therefore that the government continue to assist the
small and medium scale enterprises develop their competitiveness to
enter and compete in the international market. Incentives such as soft-
loan (or zero interest loan) for upgrading the facilities, subsidised

80 Sanitary Standards in the EU: The Impact on Malaysian Fishing Industry
electricity, tax exemption and training in the relevant areas related to the
fisheries industries are necessary for the industry‟s development, though
this may be inconsistent with the WTO rulings. Developing countries
need policy space to grow and develop, and this definitely include
subsidy schemes for poor fishermen.
Journal of Economic Cooperation and Development 81
References
Ahmed M. (2006). Market Access and Trade Liberalization in Fisheries.
ICTSD Natural Resources, International Trade and Sustainable
Development Series Issue Paper no.4, International Centre for Trade and
Sustainable Development, Geneva, Switzerland. Retrieved October 20,
2006 http://www.globefish.org/files/Ahmed_2006_370.pdf.
Ababouch L., G. Gandini and J. Ryder. (2005). Causes of Detentions
and Rejections in International Fish Trade. Food and Agriculture
Organisation of the United Ntaions. Retrieved from
http://www.fao.org/docrep/008/y5924e/y5924e00.htm
Blackburn C.D.W (2003), “Microbiological Analysis and Food Safety
Managements: GMP and HACCP Systems”, in McMeekin T.A. (ed.),
Detecting pathogens in Food, Woodhead Publishing Limited,
Cambridge:UK
Bostock, T., Greenhalgh, P., & Kleih, U. (2004). Policy Research –
Implications of Liberalization of Fish Trade for Developing Countries:
Synthesis Report. Retrieved June 20, 2006.
http://www.globefish.org/files/Fish%20Trade%20Liberalisation_167.pdf.
Cato J.C. and C.A. Lima dos Santos (1998) , Seafood Safety -
Economics of Hazard Analysis and Critical Control Point (HACCP)
programmes, FAO Fisheries Technical Paper 381, Food and Agriculture
Organization of the United Nations, Rome
Deere, Carolyn L. (1999). Eco-labelling and Sustainable Fisheries.
Taken from http://www.iucn.org/THEMES/MARINE/pdf/ecoen.pdf.
Delgado C.L., N. Wada, M.W. Rosegrant, S. Meijer and M. Ahmed.
(2003). Fish to 2020: Supply and Demand in Changing Global Markets.
Washington D.C.: International Food Policy Research Institute.
Retrieved from http://www.ifpri.cgiar.org/pubs/books/fish2020/oc44.pdf
Department of Fisheries Malaysia. (2004). Annual Fisheries Statistics
Import Export 2003, Volume 2. Retrieved from
http://www.dof.gov.my/v2/index.htm.

82 Sanitary Standards in the EU: The Impact on Malaysian Fishing Industry
Dey M.M., Ahmed M., Jahan K.M. amd Rab M.A. (2002). Paper
presented at IIFET 2002 Conference, August 19-22, Wellington, New
Zealand. Retrieved from
http://library.enaca.org/AquaMarkets/presentations/OtherPapers/Liberali
zation%20Vs%20Barriers.pdf
European Commission. (2007).Trade Issues: Trade in Agricultural
Goods and Fisheries Products. Retrieved from
ttp://ec.europa.eu/trade/issues/sectoral/agri_fish/fish/tp_en.htm
FAO. (2005). Yearbooks of Fishery Statistics. Retrieved from
www.fao.org/fi/statist/summtab/default.asp.
FAO. (2007). Food Outlook Global Market Analysis: Fish and Fishery
Products. Retrieved from http://www.thefishsite.com
Gardiner P.R. and K.K. Viswanathan (2004). Ecolabeling and Fisheries
Management. World Fish Center: Penang, Malaysia
Globefish. (2003). Commodity Update: Shrimp. Food and Agriculture
Organization of the United Nations. Fisheries Industries Division.
Retrieved July 27, 2007. http://www.globefish.org/?id=923.
Hashim S.M. (1998), Income Inequality and Poverty in Malaysia,
Rowman & Littlefield Publishers Inc.: Maryland, USA
Henson S., Saqib M, and Rajasenan D. (2004). Impact of Sanitary
Measures on Exports of Fishery Products from India: The case of
Kerala, Agriculture and Rural Development, Discussion paper 17, The
World Bank: Washington D.C. Retrieved from
http://siteresources.worldbank.org/INTARD/Resources/India_Fish_final
ICTSD (2006), Fisheries, International Trade and Sustainable
Development: Policy Discussion Paper, ICTSD Natural Resources,
International Trade and Sustainable Development Series, International
Centre for Trade and Development, Geneva, Switzerland. Retrieved
from http://www.trade-
environment.org/output/ictsd/resource/Fish_policypaper.pdf
Journal of Economic Cooperation and Development 83
Henson S., Saqib M, and Rajasenan D. (2004). Impact of Sanitary
Measures on Exports of Fishery Products from India: The case of
Kerala, Agriculture and Rural Development, Discussion paper 17, The
World Bank: Washington D.C. Retrieved from
http://siteresources.worldbank.org/INTARD/Resources/India_Fish_final.pdf
Hoekman B., A. Matoo and P. English. (2002). Development, Trade and
the WTO: A Handbook. World Bank. Washington D.C
Humpal D. and P. Guenette (2000). Processed Food Safety in
Developing Economies. Retrieved from
http://www.ifama.org/tamu/iama/conferences/2000congress/Forum%20-
%20Final%20PAPERS/Area%20IV/Guenette_Paul.PDF
Huss H.H., L. Ababouch and L. Gram (2004). Assessment and
Management of Seafood Safety and Quality. Food and Agriculture
Organization. United Nations. Rome
Josupeit, H. (2004). Shrimp Market Access, Tariffs and Regulations.
World Shrimp Market 26-27 October 2004, Madrid, Spain. Retrieved
from www.globefish.org/index.php?id=3629.
Lem, A. (2006). WTO and Fiheries: An Update. IIFET 2006
Porthmouth Proceedings. Retrieved from
http://www.globefish.org/files/185_373.pdf
Lupin, H. (2006). Traceability. Retrieved from
http://www.globefish.org/ files/Traceability_359.doc
Kamat M. and M. Kamat (2007). Implications of the WTO on Indian
Marine Industry, Issues and Policy Perspectives. MRPA Paper
No.6151, December,
Mahfuz Ahmed. (2006). Market Access and Trade Liberalization in
Fisheries. ICTSD
Natural Resources, International Trade and Sustainable Development
Series Issue Paper
no.4, International Centre for Trade and Sustainable Development,
Geneva, Switzerland.

84 Sanitary Standards in the EU: The Impact on Malaysian Fishing Industry
Retrieved from http://www.globefish.org/files/Ahmed_2006_370.pdf.
Melchior A. (2005). Fishy Story about Tariffs in World Seafood Trade.
Paper written for Food and Agriculture Organization of the United
Nations (FAO). Retrived from
http://www.globefish.org/files/Tariffs%20in%20World%20Seafood%20
Trade%2029Nov_286.pdf
Mehmet O. (1986), Development in Malaysia: Poverty, Wealth and
Trusteeship, London: Croom Helm
Mohd. Fariduddin Othman. (2006). Recent Report on Coastal/Marine
Aquaculture Status in Malaysia. Department of Fisheries Malaysia,
Malaysia. Retrieved from
http://library.enaca.org/NACA-
Publications/MaricultureWorkshop/abstract_malaysia.pdf.
Nolting M. (2006). Study of the European Shrimp Market. Retrieved
from
http://www.aquakulturtechnik.de/pdf/Auszuege_Study%20on%20Europ
ean%20shrimp%20market.pdf
Ponte S., Nielson J.R. and Campling L. (2005). Trade and
Competitiveness in African Fish and Exports: Impacts on WTO and EU
Negotiations and Regulations. Tralac Trade Brief, No. 5, September.
Retrieved from http://www.tralac.org/pdf/20050913_TB5%20Fish.pdf
RASFF (2006), The Rapid Alert System for Food and Feed Annual
Report 2006. Retrieved from
http://ec.europa.eu/food/food/rapidalert/report2006_en.pdf
Roheim C. (2004). Trade Liberalisation in Fish Products: Impacts on
Sustainability of International Markets and Fish Resources, World
Bank, Washington DC: USA
Rommel T.(2004). Malaysian Frozen Foods Processors Association,
Statement by Head of The European Commission Delegation in
Malaysia. Retrieved July 25, 2007
www.delmys.cec.eu.int/.../Speech%20Annual%20Dinner%20Frozen%2
0Food%20Association%20Pinang%20oct%2004.doc.

Journal of Economic Cooperation and Development 85
Stone R.M. (n.d.). Industry’s Experience of Implementing a HACCP-
Based Food Quality / Food Safety Programme. Retrieved from
http://www.agricta.org/events2003/seafood/stone.pdf
UNCTAD (2005). Expert Meeting on Methodologies, Classifications,
Quantification and Development Impacts of Non-Tariff Barriers. 5-7
September. Geneva. Obtained from http://www.unctad.org.
USDA (2007), “EU-27 Fishery Products Annual Report – EU Policy
and Statistics 2007”, taken from
http://www.fas.usda.gov/gainfiles/200701/146280014.pdf
USFDA (2007), Guide to Minimize Microbial Food Safety Hazards of
Fresh-Cut Fruits and Vegetables”, retrieved from
http://www.cfsan.fda.gov/~dms/prodgui3.html
Valdimarson G. (2003). International Fish Trade. FAO Fisheries
Industries Division, Rome. Retrieved from
http://www.globefish.org/files/IFT_215.pdf
Venugopal V. (2006), Seafood Processing: Adding Value Through
Quick Freezing, Retortable Packaging and Cook-Chilliong, Taylor and
Francis: UK
World Bank (1991), Growth, Poverty Alleviation and Improved Income
Distribution in Malaysia: Focus on Government Policy Intervention,
Mimeo, World Bank: Washington D.C.
Globefish. (2003). Commodity Update: Shrimp. Food and Agriculture
Organization of the United Nations. Fisheries Industries Division.
Retrieved July 27, 2007. http://www.globefish.org/?id=923.
WorldFish Centre (2002). Strategies and Options for Increasing and
Sustaining Fisheries and Aquaculture Production to Benefit Poor
Households in Asia. WorldFish Centre, Penang, Malaysia. Retrieved
from
http://www.worldfishcenter.org/demandsupply/inception_reportaug02/ir
_aug02_exsummary.htm