Embed Size (px)
Citation preview
Journal of Economic IntegrationVol. 34, No. 2, June 2019, 214-235
https://doi.org/10.11130/jei.2019.34.2.214
ⓒ 2019-Center for Economic Integration, Sejong Institution, Sejong University, All Rights Reserved. pISSN: 1225-651X eISSN: 1976-5525
Fiscal Convergence in Africa:
What Role for Regional Economic Communities?
Sampawende J.-A. TAPSOBA1, Daouda SEMBENE1,
Vigninou GAMMADIGBE2+, Ismaël ISSIFOU3
1International Monetary Fund (IMF)2University of Lome
3University of Orleans
Abstract The literature on Optimal Currency Areas (OCA) has identified several channels for the ex post
justification of the synchronicity criterion of common monetary areas. These include trade, cross-border
investments, mobility of factors, mobility of goods and services, and fiscal convergence of member countries.
We focus on the later for the African continent. We analyze the role of African regional economic communities
(RECs) in the convergence of fiscal policies from 1990 to 2015. Our estimates show that African RECs
significantly reduce fiscal divergence between countries. Furthermore, we find that common monetary areas
are more effective in fostering fiscal convergence. This result is in line with the argument of self-validation
of monetary arrangements in Africa, despite low levels of cycle synchronization and trade intensity.
Keywords: Fiscal convergence, Common monetary areas, Africa
JEL Classifications: E62, F15, O55
Received 31 August 2018, Revised 8 April 2019, Accepted 8 May 2019
+Corresponding Author: Vigninou GAMMADIGBEResearch Associate, University of Lome, BP. 1515, Lome, Togo, Tel: +228 22 25 50 70, E-mail: [email protected]
Co-Author: Sampawende J.-A. TAPSOBAInternational Monetary Fund (IMF), 700 19th Street, N.W., Washington, D.C. 20431, E-mail: [email protected]
Co-Author: Daouda SEMBENEInternational Monetary Fund (IMF), 700 19th Street, N.W., Washington, D.C. 20431
Co-Author: Ismaël ISSIFOUResearch Associate, University of Orleans (France), E-mail: [email protected]
I. Introduction
The OCA theory states that the key requirement for suitable monetary zones is the symmetry
of shocks. Such symmetry of economic shocks offsets the costs induced by delegating monetary
policy to a regional central bank, unilaterally pegging a local currency to a foreign one, or
adopting a foreign currency as legal tender. Under such conditions, monetary policy is no longer
targeted to country-specific objectives.
The level of business cycle synchronicity is relatively low in existing or contemplated African
monetary zones (Tapsoba 2009, Simons and Jean Louis 2018). However, this finding is not
Fiscal Convergence in Africa: What Role for Regional Economic Communities? 215
necessarily permanent because synchronization may be endogenous to the integration process.
It is possible that creating a monetary zone arrangement fosters the synchronization of economic
shocks among countries. This is the argument defended by Frankel and Rose (1997, 1998)
for the European countries. They suggested that the traditional OCA paradigm does not provide
a full picture of the (a)symmetry of shocks within a monetary zone since some parameters,
such as the level of trade integration and business cycle synchronicity, are not irrevocably
fixed and may be endogenous to the integration process itself. On the one hand, business cycle
synchronicity creates appropriate conditions for monetary zones which, in turn, increase trade
within the zone. On the other hand, the degree of trade integration may increase the synchronicity
of business cycles. In these matters, the literature focuses mainly on the role of trade, specialization,
and financial integration (Baxter and Kouparitsas 2005, Rose and Engel 2002, Imbs 2004, Issiaka
and Gnimassoun 2013).
In a seminal article, Darvas et al. (2005) show that for Organization for Economic Cooperation
and Development (OECD) countries, similarity of fiscal stances could lead to synchronization
of economic shocks and promotes a framework consistent with the OCA theory. The authors
explain that idiosyncratic shocks may be the result of irresponsible fiscal policies, i.e., high
and persistent fiscal deficits. Fiscal divergence due to the existence of excessive and persistent
fiscal deficits in some countries relative to others may also explain the macroeconomic volatility
observed among OECD countries.
Macroeconomic convergence programs are often used to bring domestic policies closer and
reinforce the monetary integration process. This is a characteristic of existing or future monetary
zones. Before an economic or a monetary zone can exist, a set of criteria is usually established,
and observance of these criteria is sometimes a requirement for joining the monetary zone. Usually,
the creation of a monetary zone or union is predicated on compliance with monetary and fiscal
convergence programs, which at first glance have no direct connection to the theory of OCAs
(Darvas et al. (2005))1). Such programs are intended to align domestic policies with respect
to fiscal deficits, public debt, inflation, interest rates, and exchange rates. The criterion regarding
fiscal deficits is probably the most basic condition in various macroeconomic convergence
programs, which has the objective of bringing fiscal stances close to a specified norm (usually
defined as a maximum permitted deficit as a percent of Gross Domestic Product (GDP)). Darvas
et al. (2005) provide the case of the Maastricht Treaty as an example. Because of its quantitative
criteria with respect to public deficits and public debt levels, the Treaty defined eligibility
conditions for countries wanting to join the eurozone. Darvas et al. (2005) give the example
of Italy that to comply with the Maastricht criteria, lowered its fiscal deficit significantly, from
more than 10 percent of GDP in 1992 to less than 2 percent in 1999. This shows the great
1) The adoption of such programs follows the logic of the Treaty of Maastricht (1992) and the European Union Stability and Growth Pact (1997).
216 Journal of Economic Integration Vol. 34, No. 2
extent to which joining an economic or monetary integration provides incentives for countries
to work toward fiscal convergence.
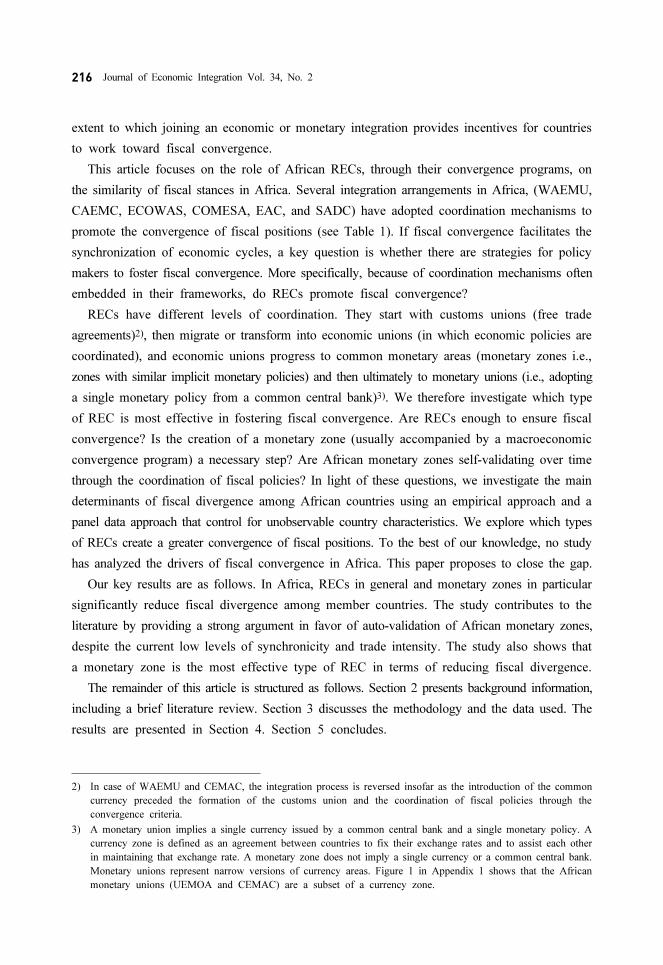
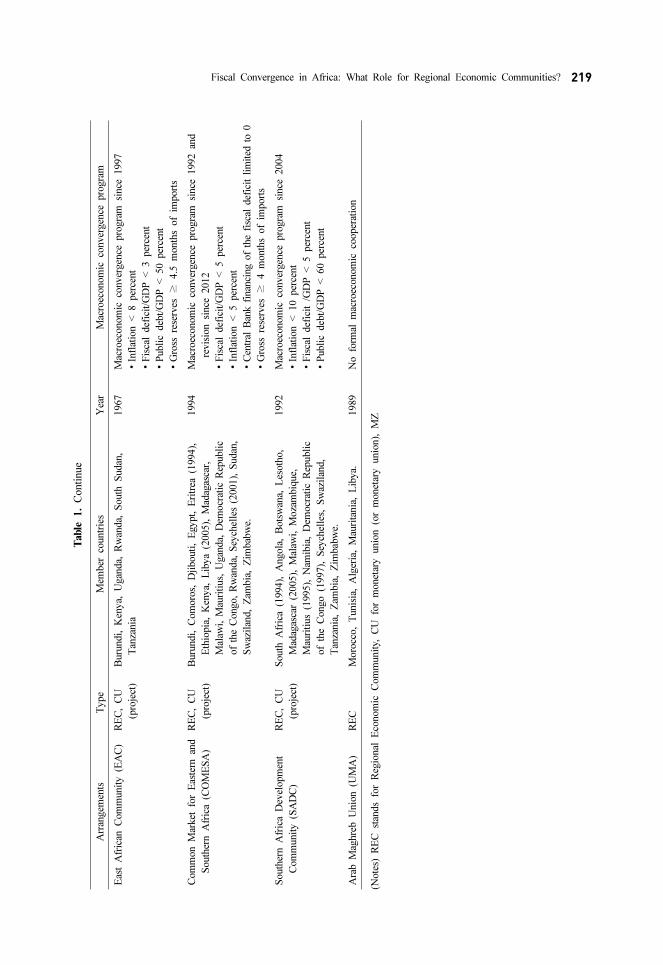
This article focuses on the role of African RECs, through their convergence programs, on
the similarity of fiscal stances in Africa. Several integration arrangements in Africa, (WAEMU,
CAEMC, ECOWAS, COMESA, EAC, and SADC) have adopted coordination mechanisms to
promote the convergence of fiscal positions (see Table 1). If fiscal convergence facilitates the
synchronization of economic cycles, a key question is whether there are strategies for policy
makers to foster fiscal convergence. More specifically, because of coordination mechanisms often
embedded in their frameworks, do RECs promote fiscal convergence?
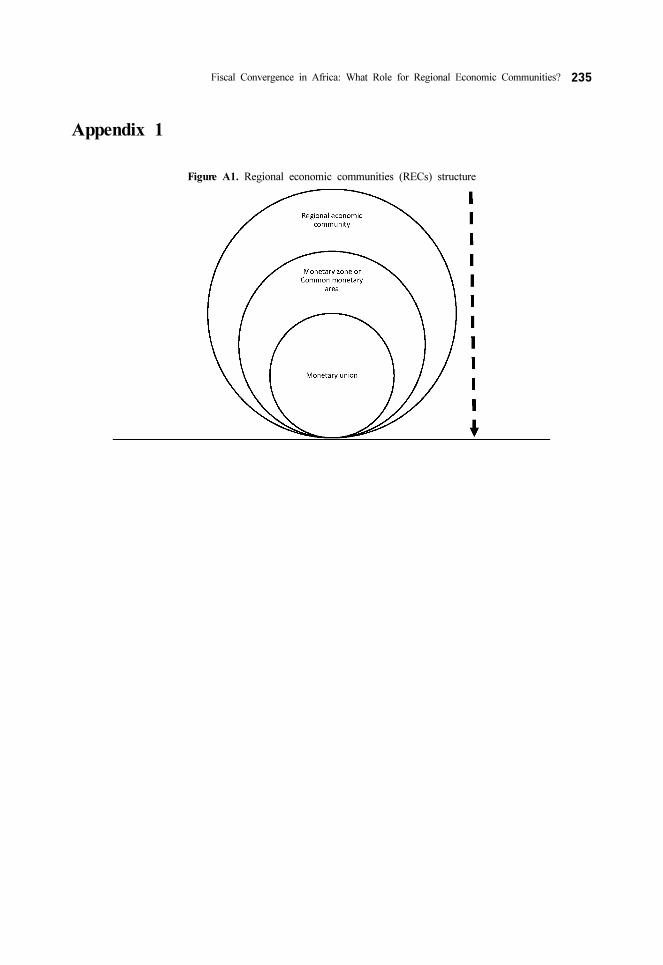
RECs have different levels of coordination. They start with customs unions (free trade
agreements)2), then migrate or transform into economic unions (in which economic policies are
coordinated), and economic unions progress to common monetary areas (monetary zones i.e.,
zones with similar implicit monetary policies) and then ultimately to monetary unions (i.e., adopting
a single monetary policy from a common central bank)3). We therefore investigate which type
of REC is most effective in fostering fiscal convergence. Are RECs enough to ensure fiscal
convergence? Is the creation of a monetary zone (usually accompanied by a macroeconomic
convergence program) a necessary step? Are African monetary zones self-validating over time
through the coordination of fiscal policies? In light of these questions, we investigate the main
determinants of fiscal divergence among African countries using an empirical approach and a
panel data approach that control for unobservable country characteristics. We explore which types
of RECs create a greater convergence of fiscal positions. To the best of our knowledge, no study
has analyzed the drivers of fiscal convergence in Africa. This paper proposes to close the gap.
Our key results are as follows. In Africa, RECs in general and monetary zones in particular
significantly reduce fiscal divergence among member countries. The study contributes to the
literature by providing a strong argument in favor of auto-validation of African monetary zones,
despite the current low levels of synchronicity and trade intensity. The study also shows that
a monetary zone is the most effective type of REC in terms of reducing fiscal divergence.
The remainder of this article is structured as follows. Section 2 presents background information,
including a brief literature review. Section 3 discusses the methodology and the data used. The
results are presented in Section 4. Section 5 concludes.
2) In case of WAEMU and CEMAC, the integration process is reversed insofar as the introduction of the common currency preceded the formation of the customs union and the coordination of fiscal policies through the convergence criteria.
3) A monetary union implies a single currency issued by a common central bank and a single monetary policy. A currency zone is defined as an agreement between countries to fix their exchange rates and to assist each other in maintaining that exchange rate. A monetary zone does not imply a single currency or a common central bank. Monetary unions represent narrow versions of currency areas. Figure 1 in Appendix 1 shows that the African monetary unions (UEMOA and CEMAC) are a subset of a currency zone.

Fiscal Convergence in Africa: What Role for Regional Economic Communities? 217
II. Background
A. Overview of African RECs
Creating a monetary union is the overarching objective for most RECs in Africa. Since
the early days of independence for many countries in Africa, several RECs have emerged to
help promote regional economic integration. Regional integration is seen by African policy
makers as a means of raising the low level of intra-regional trade and integrating the economies
of African countries into the global economy. Fiscal convergence is a necessary condition for
the success of a monetary union, which constitutes the highest degree of integration. Regional
integration is also a lever for accelerating structural transformation in African countries through
economies of scale, improved competitiveness, more effective resource mobilization and the
promotion of regional value chains. Thus, in the long term, regional integration promotes
economic growth and reduces inequalities. As shown in Table 1, the landscape of economic
and monetary integration in Africa is highly diversified.
There are two monetary zones on the continent: the CFA Franc Zone and the Common
Monetary Area (Rand Zone). The CFA Franc Zone is a monetary area that includes fourteen
countries. All are former French colonies that, after achieving independence, signed monetary
cooperation agreements with France. These agreements have two main features: they guarantee
the convertibility of the CFA Franc, which was pegged to the French franc before the euro
was launched in 1999, and then to the euro since then. In return for the CFA Franc, members
had to deposit at least 65 percent, renegotiated to 50 percent, on September 5 2005, of their
external reserves into special accounts held by the French treasury. This zone includes two
monetary unions: the West African Economic and Monetary Union (WAEMU) and the Central
African Economic and Monetary Community (CEMAC).
The Common Monetary Area (CMA) is a currency agreement in which the South African
Rand links South Africa, Namibia, Lesotho, and Swaziland. In the CMA, each country has
the right to issue its own national currency, and that currency is legal tender only in that country.
However, the South African Rand is also legal tender throughout the CMA. De facto, all member
countries follow South Africa’s monetary policy. It is worth noting that this area does not
have a common central bank and lacks a framework for macroeconomic policy coordination.
As a result, the rand zone does not qualify as a monetary union.
In the recent decades, several regional monetary integration projects have been initiated within
existing RECs: the ECOWAS (Economic Community of West African States), the COMESA
(Common Market of Eastern and Southern Africa), the SADC (South African Development
218 Journal of Economic Integration Vol. 34, No. 2
Arr
angem
ents
Type
Mem
ber
co
untr
ies
Yea
r M
acro
econom
ic co
nver
gen
ce pro
gra
m
CF
A F
ranc
Zone
MZ
Ben
in,
Burk
ina
Fas
o,
Cam
eroon,
Cen
tral
A
fric
an
Rep
ubli
c, C
had
, C
om
oro
s, C
ongo,
Gab
on,
Cote
d’I
voir
e, E
quat
ori
al G
uin
ea,
Guin
ea-B
issa
u (
1997),
Mal
i, N
iger
, S
eneg
al,
and T
ogo.
1948
No
Wes
t A
fric
an E
conom
ic
Monet
ary U
nio
n (W
AE
MU
)
RE
C,
CU
Ben
in,
Burk
ina
Fas
o,
Cote
d’I
voir
e, G
uin
ea-B
issa
u
(1997),
M
ali,
N
iger
, S
eneg
al,
Togo
1962
Mac
roec
onom
ic co
nver
gen
ce pro
gra
m si
nce
1994 an
d
form
ally
si
nce
1999
∙B
asic
fi
scal
bal
ance
/GD
P ≥
0
∙In
flat
ion ≤
3 per
cent
∙P
ubli
c deb
t/G
DP
≤
70 per
cent
∙N
o ac
cum
ula
tion of
dom
esti
c an
d fo
reig
n ar
rear
s
Cen
tral
A
fric
an E
conom
ic an
d
Monet
ary C
om
munit
y
(CE
MA
C)
RE
C,
CU
,C
amer
oon,
Congo,
Gab
on,
Cen
tral
Afr
ican
Rep
ubli
c,
Chad
, E
quat
ori
al G
uin
ea
1964
Mac
roec
onom
ic co
nver
gen
ce pro
gra
m si
nce
1994 an
d
form
ally
si
nce
2002
∙In
flat
ion ≤
3 per
cent
∙B
asic
fi
scal
bal
ance
/GD
P ≥
0 per
cent
∙P
ubli
c deb
t/ G
DP
≤
70 per
cent
∙N
o ac
cum
ula
tion of
dom
esti
c an
d fo
reig
n ar
rear
s
Ran
d zo
ne
/ C
om
mon M
onet
ary
Are
a (C
MA
)
RE
C,
MZ
South
A
fric
a, L
esoth
o,
Nam
ibia
(1
990),
S
waz
ilan
d.
1974
No
Eco
nom
ic C
om
munit
y of
Wes
t
Afr
ican
S
tate
s (E
CO
WA
S)
RE
C,
CU
(pro
ject
)
Ben
in,
Burk
ina
Fas
o,
Cab
o V
erde,
C
ote
d’I
voir
e,
Gam
bia
, G
han
a, G
uin
ea,
Guin
ea-B
issa
u,
Lib
eria
,
Mal
i, N
iger
, N
iger
ia,
Sen
egal
, S
ierr
a L
eone,
Togo.
1975
Mac
roec
onom
ic co
nver
gen
ce pro
gra
m si
nce
1999 an
d
revis
ion si
nce
2012
∙F
isca
l def
icit
rat
io,
incl
udin
g g
rants
(co
mm
itm
ents
bas
is)
to nom
inal
G
DP
≤
3 per
cent
∙A
ver
age
Infl
atio
n ≤
5 per
cent
∙C
entr
al B
ank f
inan
cing o
f th
e fi
scal
def
icit
≤ 10 p
erce
nt
of
the
pre
vio
us
yea
r’s
fisc
al re
ven
ue
∙G
ross
re
serv
es ≥
6 m
onth
s of
import
s
Wes
t A
fric
an M
onet
ary Z
one
(WA
MZ
)
CU
(p
roje
ct)
Ghan
a, G
uin
ea,
Gam
bia
, N
iger
ia,
Sie
rra
Leo
ne.
2000
Mac
roec
onom
ic co
nver
gen
ce pro
gra
m si
nce
1999
∙In
flat
ion ≤
5 per
cent
∙F
isca
l def
icit
/GD
P ≤
4 per
cent
bef
ore
2002
∙C
entr
al B
ank f
inan
cing o
f th
e fi
scal
def
icit
≤ 10 p
erce
nt
afte
r 2002
∙G
ross
re
serv
es ≥
6 m
onth
s of
import
s af
ter
2003
Table
1.
mai
n re
gio
nal
ec
onom
ic co
mm
unit
ies
(RE
Cs)
in
A
fric
a
Fiscal Convergence in Africa: What Role for Regional Economic Communities? 219
Arr
angem
ents
Type
Mem
ber
co
untr
ies
Yea
r M
acro
econom
ic co
nver
gen
ce pro
gra
m
Eas
t A
fric
an C
om
munit
y (E
AC
)R
EC
, C
U
(pro
ject
)
Buru
ndi,
K
enya,
U
gan
da,
R
wan
da,
S
outh
S
udan
,
Tan
zania
1967
Mac
roec
onom
ic co
nver
gen
ce pro
gra
m si
nce
1997
∙In
flat
ion <
8 per
cent
∙F
isca
l def
icit
/GD
P <
3 per
cent
∙P
ubli
c deb
t/G
DP
<
50 per
cent
∙G
ross
re
serv
es ≥
4.5
m
onth
s of
import
s
Com
mon M
arket
fo
r E
aste
rn an
d
South
ern A
fric
a (C
OM
ES
A)
RE
C,
CU
(pro
ject
)
Buru
ndi,
C
om
oro
s, D
jibouti
, E
gypt,
E
ritr
ea (1
994),
Eth
iopia
, K
enya,
L
ibya
(2005),
M
adag
asca
r,
Mal
awi,
Mau
riti
us,
Ugan
da,
Dem
ocr
atic
Rep
ubli
c
of
the
Congo,
Rw
anda,
Sey
chel
les
(2001),
Sudan
,
Sw
azil
and,
Zam
bia
, Z
imbab
we.
1994
M
acro
econom
ic co
nver
gen
ce pro
gra
m si
nce
1992 an
d
revis
ion si
nce
2012
∙F
isca
l def
icit
/GD
P <
5 per
cent
∙In
flat
ion <
5 per
cent
∙C
entr
al B
ank f
inan
cing o
f th
e fi
scal
def
icit
lim
ited
to 0
∙G
ross
re
serv
es ≥
4 m
onth
s of
import
s
South
ern A
fric
a D
evel
opm
ent
Com
munit
y (S
AD
C)
RE
C,
CU
(pro
ject
)
South
A
fric
a (1
994),
A
ngola
, B
ots
wan
a, L
esoth
o,
Mad
agas
car
(2005),
M
alaw
i, M
oza
mbiq
ue,
Mau
riti
us
(1995),
N
amib
ia,
Dem
ocr
atic
R
epubli
c
of
the
Congo (1
997),
S
eych
elle
s, S
waz
ilan
d,
Tan
zania
, Z
ambia
, Z
imbab
we.
1992
Mac
roec
onom
ic co
nver
gen
ce pro
gra
m si
nce
2004
∙In
flat
ion <
10 per
cent
∙F
isca
l def
icit
/G
DP
<
5 per
cent
∙P
ubli
c deb
t/G
DP
<
60 per
cent
Ara
b M
aghre
b U
nio
n (U
MA
)R
EC
Moro
cco,
Tunis
ia,
Alg
eria
, M
auri
tania
, L
ibya.
1989
No fo
rmal
m
acro
econom
ic co
oper
atio
n
Table
1.
Conti
nue
(Note
s) R
EC
st
ands
for
Reg
ional
E
conom
ic C
om
munit
y, C
U fo
r m
onet
ary unio
n (o
r m
onet
ary unio
n),
M
Z
220 Journal of Economic Integration Vol. 34, No. 2
Community), and the EAC (East African Community).4) With the goal of monetary integration
at some point in the future, the ECOWAS, the COMESA, the SADC, and the EAC have adopted
convergence criteria inspired by the Maastricht Treaty and the Stability and Growth Pact of
the Eurozone.
B. Macroeconomic convergence programs in Africa
There are two main arguments that support the adoption of fiscal convergence programs
in monetary zones. First, imposing limits on fiscal deficits and debt ratios prevents volatile
and unstable public finances in one country from negatively affecting other members of the
monetary zone. This could be accomplished by putting pressures on the common central bank
to monetize public spending (Buti and Guidice 2002, Beetsma 2001, and Dixit 2001). For
instance, when a member country is faced with an adverse economic shock, it could run
excessive deficits to stabilize its economy and neutralize the impacts of the shock on production.
However, other member countries would be affected by the externalities of the growing deficit
(spillover effect) in that country through production losses due to the increase in the common
interest rate unless they also increase their public spending in response to this shock. Second,
implementing fiscal policy rules in a monetary area is expected to strengthen fiscal policy
discipline and the credibility of monetary policy (Creel et al. 2001). The need to coordinate
economic policies among member countries is also an argument in favor of adopting fiscal
rules in a monetary zone. Such rules are intended to ease the job of the common central bank
by preventing conflicts of objectives, such as higher public deficits and lower policy interest
rates (Besancenot et al. 2003).5)
There is no consensus in the literature about the positive impact of fiscal convergence
programs after countries have entered a monetary zone. In the case of the European Monetary
union for instance, many critics consider the Stability and Growth Pact (SGP)—which is
supposed to ensure better fiscal performances of the member states–to be unsustainable because
of the strategic debt accumulation of some member states (McKay (1999), Ferguson and
Kotlikoff (2000)). The loss of monetary sovereignty could encourage countries to use fiscal
policy to dampen any asymmetrical shocks they face. Under these conditions, the monetary
zone could actually promote fiscal divergence, notwithstanding the pre-established rules and
enforcement mechanisms. Kocenda et al. (2008) for example, examine the fiscal convergence
of ten recent European Union (EU) members using the Maastricht fiscal convergence criteria.
They relied on beta and sigma-convergence tests of the new members compared to the Maastricht
4) The Arab Maghreb Union (UMA) between North African countries (Algeria, Libya, Mauritania, Morocco, and Tunisia) comprises only the African RECs with no formal macroeconomic cooperation and monetary union project.
5) Several authors have theorized this argument: (Barrell and Sefton 1997, Beetsma and Bovenberg 1998, Hughes-Hallet and Ma 1996, Jensen and Jensen 1995, or van der Ploeg 1995, and Leith and Wren-Lewis 2000).
Fiscal Convergence in Africa: What Role for Regional Economic Communities? 221
benchmarks, as well as to the EU-15 figures. The results show a lack of fiscal convergence
in the EU in general, suggesting that monetary unions do not necessarily promote fiscal
convergence among its member countries. However, Busemeyer (2004) shows that the process
of European monetary integration and the Stability and Growth Pact have had a positive impact
on budgetary performance. Bertarelli et al. (2014) evaluate the impact of the Euro on the process
of fiscal convergence. Their results show public deficits converged rapidly during the 1990s,
replaced by a divergence trend in the following decade. Moreover, their findings give some
support to the idea that the common currency encouraged convergence of total expenditures
and revenues. When limited to government spending, this conclusion is confirmed by Ferreiro,
Garcia-Del-Valle, and Gomez (2009, 2013).
Most studies of macroeconomic convergence programs in African countries focused on the
CFA Zones: the WAEMU and the CEMAC. Empirical studies show that the program led to
a relative convergence of the fiscal stances of the countries in the two unions. To analyze
the WAEMU, Bamba (2004) used the Kalman filter methodology for the period from 1980
to 2001. He concluded there was an overall convergence of tax revenues, but the analysis
of fiscal surpluses/deficits shows alternatively phases of divergence and convergence. Tanimoune
and Plane (2005) used the sigma-convergence approach, focusing on the period from 1994 to
2002. They found that after the 1994 CFA devaluation and the adoption of a formal macroeconomic
convergence program, the fiscal performance of this monetary union improved. The results
showed that the primary fiscal balances and debt ratios have converged significantly. Sarr and
Ndiaye (2011) found there was a sigma-convergence in fiscal balances over the period 1980~
2005. With respect to primary balances and overall fiscal balances, the authors showed that
the convergence process began before the implementation of the WAEMU macroeconomic
convergence program and was connected to structural adjustment programs in member states,
with IMF and World Bank support in the 1980s (the programs aimed for better fiscal discipline).
Cabrillac and Rocher (2013) show that, between 1994 and 2011, fiscal stances and debt levels
moved closer together. For CEMAC, N’Kodia (2011) found that there was significant convergence
among the main variables from 1989 to 2009. These dynamics can be explained by several factors:
CFA Franc institutional mechanisms, the effects of the structural adjustment programs, and the
devaluation of the CFA Franc. As for the WAEMU, Cabrillac, and Rocher (2013) showed that
implementing macroeconomic convergence programs in the CEMAC helped debt levels to
converge but fiscal deficits followed a dispersion trend.
There are few studies of other RECs. Only Carmignani (2005) focused on the COMESA
region between 1980 and 2002. He found a succession of convergence and divergence phases
of key macroeconomic variables. Regarding fiscal indicators, regional dispersion of fiscal deficits
was substantial. Deficit levels remain generally high compared to established criteria despite
progress observed in the 1990s. In the following section, we discuss our empirical analysis.
222 Journal of Economic Integration Vol. 34, No. 2
III. Empirical Analysis
A. Estimation methodology
In this section, we describe the methodology and data used in the study. The methodology
follows a bilateral approach. We form a large dyadic panel dataset (panel of country pairs
over time). The panel data allows us to control for country specific and time-specific factors.
We assume two countries and that are members of a regional economic community or
monetary zone. We estimate the impact of RECs on the divergence of fiscal stances using
the following model:
(1)
is a measure of fiscal divergence between countries and at time . Formally, the
divergence is computed as the absolute difference between the levels of this variable in the
two countries
. Two countries become “fully fiscally divergent” if the absolute
value previous difference increases and “fully converge fiscally” when the absolute value of
the difference is zero. It is worth noting that fiscal convergence is observed between two
countries when, over a long period, their budget surpluses or deficits relative to their respective
GDPs remain similar. Fiscal divergence due to a short-term asymmetric shock experienced by
one country does not put an end to fiscal convergence with another country. is a dummy
variable taking the value of 1 if both countries in the pair belong to the same regional economic
community (REC) and 0 otherwise.
is a vector of control variables drawn from the literature on fiscal reaction functions.
We include three types of control variables: economic and institutional.
• The first economic control variable is a measure of fiscal divergence between the two
countries’ debt ratios in terms of percent of GDP (). An increase in a country’s
debt ratio often leads to an improvement in its the budget deficit because of the pressure
for adjustment it creates. Tujula and Wolswijk (2004) found that, from 1970 to 2002,
OECD countries that experienced rapid increases in debt ratios made greater efforts to
reduce their fiscal deficits. Crespo-Cuaresma et al. (2011) obtained a similar result for
countries in the eurozone by showing that countries with disparate debt to GDP ratios
tended to have divergent fiscal positions. When debt levels as a percent of GDP are similar
between countries, they might face similar adjustment pressures and incentives to run
similar fiscal deficits. More divergent debt levels may lead to divergent fiscal policies.
The expected sign for this variable is positive.
• We include divergence of growth rates () and divergence of inflation rates
Fiscal Convergence in Africa: What Role for Regional Economic Communities? 223
() between countries. Based on tax smoothing models developed by Barro (1979)
and Lucas and Stokey (1983), the similarity of growth rates between countries may explain
the convergence of fiscal deficits. These models suggest that negative shocks on production
or temporary positive shocks on spending may be fully reflected in deficits. More divergent
growth levels may lead to divergent fiscal policies. The expected signs of both variables
are positive.
Following the twin deficits theory suggested by Checherita-Westphal et al. (2017), we also
consider the divergence of current account balances () as a potential determinant of the
divergence of fiscal balances between pairs of countries. We expect a positive coefficient
associated with the current account balance divergence according to the twin-deficit hypothesis.
, , , and are computed using the same strategy as for the
dependent variable .
For institutional variables, the literature highlights the role of political stability, the level
of democracy, rule of law, and fiscal rules6). These institutional variables were transformed into
divergence indicators using the approach described above: the role of political stability in
divergence (), the impact of the level of democracy on divergence (), the role
of rule of law scores in divergence, fo, and a dummy variable taking one
the value of 1 when the countries in the pair adopt a fiscal rule and 0 otherwise. We also
control for participation in IMF programs using a binary variable that takes the value
of 1 if both countries in the pair have IMF programs and 0 otherwise. We expect the institutional
variables to have positive coefficients. Negative coefficients are expected for the variables
representing fiscal rule adoption and participation in IMF programs.
Admittedly, estimating Equation (1) is challenging because of potential endogeneity. The first
challenge is the reverse causality between fiscal divergence and participation in an REC. Indeed,
budgetary divergence may justify integration so that the less virtuous countries will become
more like the more virtuous ones. A country with a high budget deficit may join an REC
composed of countries with controlled budget balances in order to benefit from multilateral
surveillance. It is also plausible that countries that form RECs and currency areas are the ones
that are most likely to converge in budgetary terms. Countries that are more likely to join the
same REC or currency zone. Finally, another issue of endogeneity may result from the effect
of fiscal divergences on control variables such as debt and inflation.
To address this endogeneity issue, the literature recommends making use of external instruments
that would be related to participation in an REC without affecting the similarity of participating
6) See Alesina and Perotti (1995), Woo (2003), Roubini and Sachs (1989), Corsetti and Roubini (1991) and De Haan et al. Crespo-Cuaresma et al. (2011) for a detailed review of the institutional determinants of budget deficits.
224 Journal of Economic Integration Vol. 34, No. 2
countries’ fiscal stances. However, an appropriate instrument representing participation in an
REC is hard to find, and is further complicated by the fact that the REC variable is a dummy
variable. Moreover, there is little evidence in the literature of political economics that countries
join RECs or monetary zones to reduce their levels of fiscal divergence (Tsangarides et al.
(2006) and Masson and Pattillo 2004). Based on these arguments, we choose to treat RECs
and monetary zones as exogenous variables with respect to fiscal divergence. Equation (1) is
estimated using the panel LSDV method including country fixed effects and temporal effects.
In addition, controlling for countries and year fixed effects should limit the potential endogeneity
problem by controlling for (i) unobserved time-invariant factors that affect both fiscal divergence
and REC and (ii) time-varying factors that affect fiscal divergence commonly across pairs of
countries. Time fixed effects () are introduced in the empirical model as dummy variables
for each year, while and stand for country fixed effects. The hypothesis of country fixed
effects that do not vary in time can also be used to check the unobservable variables that are
specific to each country. Another technique often used in the literature is the generalized method
of moments (GMM) method, which is particularly suitable for dynamic panels. We use this
methodology to check the robustness of our estimates. The term represents the common
error. All estimates are corrected for autocorrelation and heteroskedasticity.
B. Dataset
The primary data source for this paper is the World Economic Outlook. From this database,
we extract fiscal indicators (public spending and primary fiscal balance, public debt), GDP
deflator to capture the inflation rate, current account balance as a percent of GDP, and GDP.
Data for the remaining variables are obtained from various sources. Institutional variables are
drawn from the World Governance Indicators. Fiscal rules adoption variables and participation
in an IMF program are from the IMF Fiscal Rules Dataset. We compute two different fiscal
divergence indicators: FD1, based on primary spending, and FD2, based on primary fiscal
balance. Following Reinhart, Kaminsky and Végh (2004) and for the remainder of the analysis,
we focus mostly on the expenditure-based indicator to capture the true stance of fiscal policies
in African countries.7) The fiscal divergence indicator was calculated using public spending
7) Reinhart, Kaminsky, and Végh (2004), among others, have questioned the accuracy of fiscal balance indicators
in assessing fiscal policies, mainly on two grounds. First, fiscal balances (generally determined as a percentage
of GDP) reflect policy outcomes and are only affected endogenously by the actions of policymakers. For this
reason, the direction of co-movements between these fiscal indicators and economic cycles might be ambiguous.
Second, expressing fiscal variables as proportions of output could yield misleading results because a cyclical fiscal
stance may be dominated by the cyclical behavior of output. Reinhart, Kaminsky, and Végh (2004) advocate
an approach that involves judging fiscal cyclicality by assessing the direction of co-movements between fiscal
policy instruments, such as tax rates and government spending. For many developing countries, including African
countries, the lack of comprehensive and systematic data on tax rates implies that government spending is probably
the most reliable indicator for judging fiscal policy (Mpatswe, Tapsoba, and York 2011).
Fiscal Convergence in Africa: What Role for Regional Economic Communities? 225
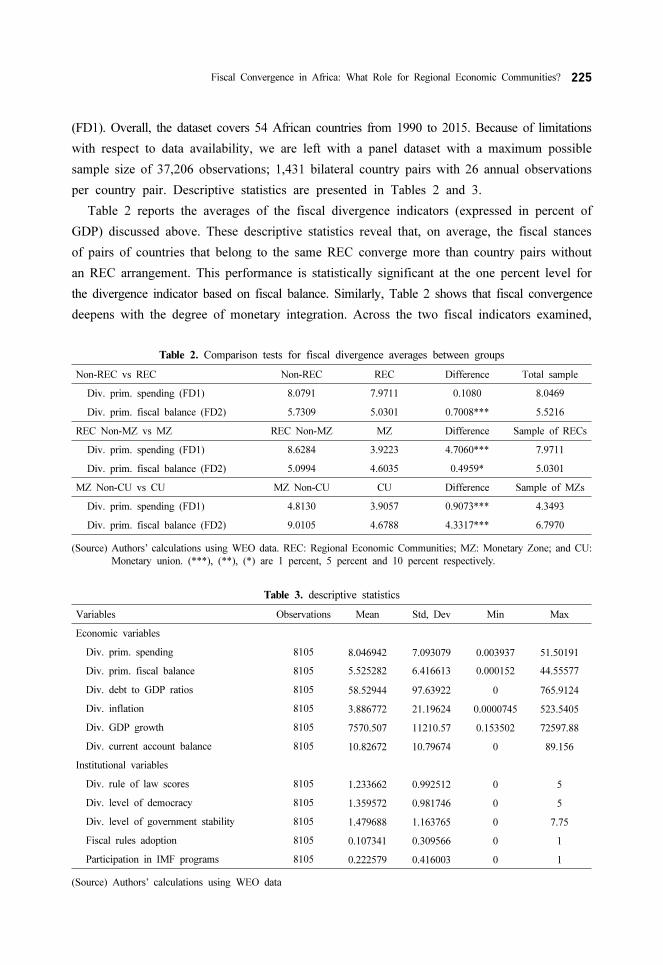
(FD1). Overall, the dataset covers 54 African countries from 1990 to 2015. Because of limitations
with respect to data availability, we are left with a panel dataset with a maximum possible
sample size of 37,206 observations; 1,431 bilateral country pairs with 26 annual observations
per country pair. Descriptive statistics are presented in Tables 2 and 3.
Table 2 reports the averages of the fiscal divergence indicators (expressed in percent of
GDP) discussed above. These descriptive statistics reveal that, on average, the fiscal stances
of pairs of countries that belong to the same REC converge more than country pairs without
an REC arrangement. This performance is statistically significant at the one percent level for
the divergence indicator based on fiscal balance. Similarly, Table 2 shows that fiscal convergence
deepens with the degree of monetary integration. Across the two fiscal indicators examined,
Table 2. Comparison tests for fiscal divergence averages between groups
Non-REC vs REC Non-REC REC Difference Total sample
Div. prim. spending (FD1) 8.0791 7.9711 0.1080 8.0469
Div. prim. fiscal balance (FD2) 5.7309 5.0301 0.7008*** 5.5216
REC Non-MZ vs MZ REC Non-MZ MZ Difference Sample of RECs
Div. prim. spending (FD1) 8.6284 3.9223 4.7060*** 7.9711
Div. prim. fiscal balance (FD2) 5.0994 4.6035 0.4959* 5.0301
MZ Non-CU vs CU MZ Non-CU CU Difference Sample of MZs
Div. prim. spending (FD1) 4.8130 3.9057 0.9073*** 4.3493
Div. prim. fiscal balance (FD2) 9.0105 4.6788 4.3317*** 6.7970
(Source) Authors’ calculations using WEO data. REC: Regional Economic Communities; MZ: Monetary Zone; and CU: Monetary union. (***), (**), (*) are 1 percent, 5 percent and 10 percent respectively.
Table 3. descriptive statistics
Variables Observations Mean Std, Dev Min Max
Economic variables
Div. prim. spending 8105 8.046942 7.093079 0.003937 51.50191
Div. prim. fiscal balance 8105 5.525282 6.416613 0.000152 44.55577
Div. debt to GDP ratios 8105 58.52944 97.63922 0 765.9124
Div. inflation 8105 3.886772 21.19624 0.0000745 523.5405
Div. GDP growth 8105 7570.507 11210.57 0.153502 72597.88
Div. current account balance 8105 10.82672 10.79674 0 89.156
Institutional variables
Div. rule of law scores 8105 1.233662 0.992512 0 5
Div. level of democracy 8105 1.359572 0.981746 0 5
Div. level of government stability 8105 1.479688 1.163765 0 7.75
Fiscal rules adoption 8105 0.107341 0.309566 0 1
Participation in IMF programs 8105 0.222579 0.416003 0 1
(Source) Authors’ calculations using WEO data
226 Journal of Economic Integration Vol. 34, No. 2
monetary zones have lower fiscal divergence compared to RECs, as do monetary unions relative
to monetary zones. These differences are all statistically significant, at least at the 10 percent
level. The next section discusses the key results.
IV. Results
A. Baseline
In this section, we discuss key results based on estimations of Equation (1) using the divergence
between public expenditures expressed as a percent of GDP. Results are reported in Table 4,
columns [1], and [2].
The first column reports baseline results without the variable for REC. This helps to highlight
the classical determinants of fiscal convergence. The R-squared is 0.49, implying that the variables
selected explain about half of the variance of the fiscal divergence indicator. As expected, there
is strong evidence that countries divergent in terms of debt to GDP ratios, inflation rates, and
growth rates are also fiscally divergent. The associated coefficients are positive (0.005, 0.039,
and 0.00005) and are statistically significant at the one percent level. A one standard deviation
decrease in the divergence of public debt to GDP ratios, inflation rates, and growth rates
respectively would reduce the divergence of fiscal stances by 0.071, 0.118, and 0.082 respectively.
Surprisingly, divergence of current account balances reduces divergence of fiscal stances. The
associated coefficient is negative (−0.023) and is statistically significant at the one percent level.
A one standard deviation decrease in the divergence of current account balances would increase
the divergence of fiscal stances by 0.035. The negative coefficient (−0.023) of this variable
and its significance at the one percent level seems to invalidate the hypothesis of twin deficits.
Regarding the institutional variables, our estimates show that political stability plays a significant
role in the similarity of fiscal policies. Divergence in political stability translates into divergent
fiscal stances. The estimated coefficient is positive (0.281) and statistically significant at the
one percent level. A one standard deviation increase in the divergence of political stability scores
would increase the divergence of fiscal stances by 0.046. When countries simultaneously adopt
fiscal rules, fiscal stances tend to become similar. The associated coefficient is negative (−0.351)
and statistically significant at the 10 percent level. The presence of fiscal rules in African countries
reduces the divergence of fiscal stances by 0.351. The implementation of an IMF program during
the same period seems to accelerate fiscal convergence in African countries; however, the
coefficient associated with the dummy is negative (−0.267) but is not significant at the
conventional levels.
In the second column, we introduce the variable REC. As expected, we found that being
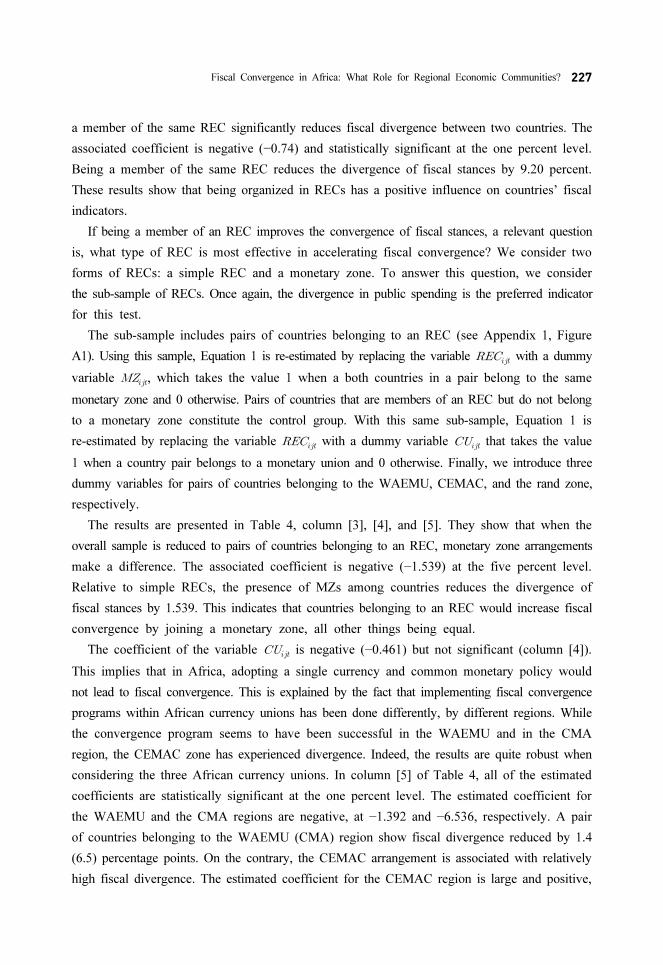
Fiscal Convergence in Africa: What Role for Regional Economic Communities? 227
a member of the same REC significantly reduces fiscal divergence between two countries. The
associated coefficient is negative (−0.74) and statistically significant at the one percent level.
Being a member of the same REC reduces the divergence of fiscal stances by 9.20 percent.
These results show that being organized in RECs has a positive influence on countries’ fiscal
indicators.
If being a member of an REC improves the convergence of fiscal stances, a relevant question
is, what type of REC is most effective in accelerating fiscal convergence? We consider two
forms of RECs: a simple REC and a monetary zone. To answer this question, we consider
the sub-sample of RECs. Once again, the divergence in public spending is the preferred indicator
for this test.
The sub-sample includes pairs of countries belonging to an REC (see Appendix 1, Figure
A1). Using this sample, Equation 1 is re-estimated by replacing the variable with a dummy
variable , which takes the value 1 when a both countries in a pair belong to the same
monetary zone and 0 otherwise. Pairs of countries that are members of an REC but do not belong
to a monetary zone constitute the control group. With this same sub-sample, Equation 1 is
re-estimated by replacing the variable with a dummy variable that takes the value
1 when a country pair belongs to a monetary union and 0 otherwise. Finally, we introduce three
dummy variables for pairs of countries belonging to the WAEMU, CEMAC, and the rand zone,
respectively.
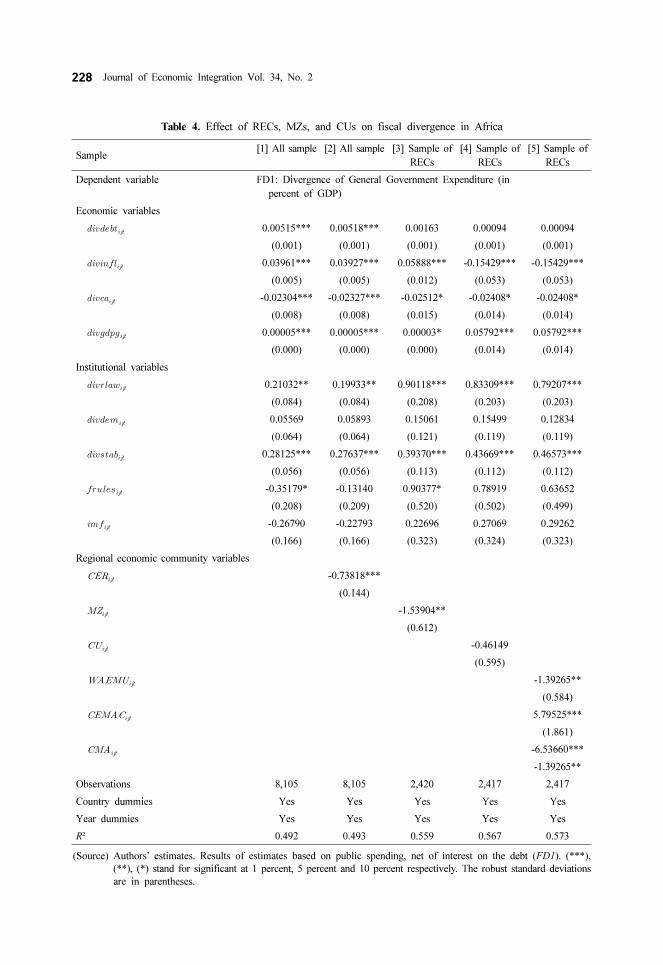
The results are presented in Table 4, column [3], [4], and [5]. They show that when the
overall sample is reduced to pairs of countries belonging to an REC, monetary zone arrangements
make a difference. The associated coefficient is negative (−1.539) at the five percent level.
Relative to simple RECs, the presence of MZs among countries reduces the divergence of
fiscal stances by 1.539. This indicates that countries belonging to an REC would increase fiscal
convergence by joining a monetary zone, all other things being equal.
The coefficient of the variable is negative (−0.461) but not significant (column [4]).
This implies that in Africa, adopting a single currency and common monetary policy would
not lead to fiscal convergence. This is explained by the fact that implementing fiscal convergence
programs within African currency unions has been done differently, by different regions. While
the convergence program seems to have been successful in the WAEMU and in the CMA
region, the CEMAC zone has experienced divergence. Indeed, the results are quite robust when
considering the three African currency unions. In column [5] of Table 4, all of the estimated
coefficients are statistically significant at the one percent level. The estimated coefficient for
the WAEMU and the CMA regions are negative, at −1.392 and −6.536, respectively. A pair
of countries belonging to the WAEMU (CMA) region show fiscal divergence reduced by 1.4
(6.5) percentage points. On the contrary, the CEMAC arrangement is associated with relatively
high fiscal divergence. The estimated coefficient for the CEMAC region is large and positive,
228 Journal of Economic Integration Vol. 34, No. 2
Sample[1] All sample [2] All sample [3] Sample of
RECs[4] Sample of
RECs[5] Sample of
RECs
Dependent variable FD1: Divergence of General Government Expenditure (in percent of GDP)
Economic variables
0.00515*** 0.00518*** 0.00163 0.00094 0.00094
(0.001) (0.001) (0.001) (0.001) (0.001)
0.03961*** 0.03927*** 0.05888*** -0.15429*** -0.15429***
(0.005) (0.005) (0.012) (0.053) (0.053)
-0.02304*** -0.02327*** -0.02512* -0.02408* -0.02408*
(0.008) (0.008) (0.015) (0.014) (0.014)
0.00005*** 0.00005*** 0.00003* 0.05792*** 0.05792***
(0.000) (0.000) (0.000) (0.014) (0.014)
Institutional variables
0.21032** 0.19933** 0.90118*** 0.83309*** 0.79207***
(0.084) (0.084) (0.208) (0.203) (0.203)
0.05569 0.05893 0.15061 0.15499 0.12834
(0.064) (0.064) (0.121) (0.119) (0.119)
0.28125*** 0.27637*** 0.39370*** 0.43669*** 0.46573***
(0.056) (0.056) (0.113) (0.112) (0.112)
-0.35179* -0.13140 0.90377* 0.78919 0.63652
(0.208) (0.209) (0.520) (0.502) (0.499)
-0.26790 -0.22793 0.22696 0.27069 0.29262
(0.166) (0.166) (0.323) (0.324) (0.323)
Regional economic community variables
-0.73818***
(0.144)
-1.53904**
(0.612)
-0.46149
(0.595)
-1.39265**
(0.584)
5.79525***
(1.861)
-6.53660***
-1.39265**
Observations 8,105 8,105 2,420 2,417 2,417
Country dummies Yes Yes Yes Yes Yes
Year dummies Yes Yes Yes Yes Yes
R² 0.492 0.493 0.559 0.567 0.573
(Source) Authors’ estimates. Results of estimates based on public spending, net of interest on the debt (FD1). (***), (**), (*) stand for significant at 1 percent, 5 percent and 10 percent respectively. The robust standard deviations are in parentheses.
Table 4. Effect of RECs, MZs, and CUs on fiscal divergence in Africa
Fiscal Convergence in Africa: What Role for Regional Economic Communities? 229
at 5.795. This feature of the CEMAC arrangement is mainly due to the fact that the convergence
criteria for this zone do not take into account oil production in five of the six member countries
(Iossifov et al. 2009). The divergence in oil revenue trends between these countries (Cabrillac
and Rocher 2013) would explain the specific case of the CEMAC zone.
Monetary zones proved to be the most effective form of integration in fostering fiscal
convergence between countries. There are several reasons for the effectiveness of monetary
zones with respect to fiscal convergence compared to RECs. The first is related to the intrinsic
nature of monetary zones, wherein member countries relinquish de facto their monetary
sovereignty by agreeing to an exchange rate regime. This loss of monetary sovereignty implies
that each country loses the instrument for monetizing its public deficits, which lays the initial
groundwork for the process of fiscal convergence. The second reason is related to establishing
convergence criteria in monetary zones as part of efforts to coordinate economic policies at
the regional level, to prevent conflicting objectives between conducting a common monetary
policy and pursuing active domestic fiscal policies. To be effective, monetary policy in a
monetary zone requires more rigorous management of public finances than in other RECs.
More than just decorative, the adoption of convergence criteria in a monetary zone is the second
phase in achieving convergence of the fiscal balances of member countries.
In sum, consistent with the argument of the endogeneity of OCA criteria, the results above
show that the existence of RECs helps fiscal stances to converge. This is explained by the
macroeconomic convergence programs that are often embedded in the policy coordination
mechanisms of RECs. Convergence strengthens even further when monetary zones are in place.
These results call for further discussions, in line with the theory of endogeneity, regarding
OCA criteria and monetary integration projects on the African continent.
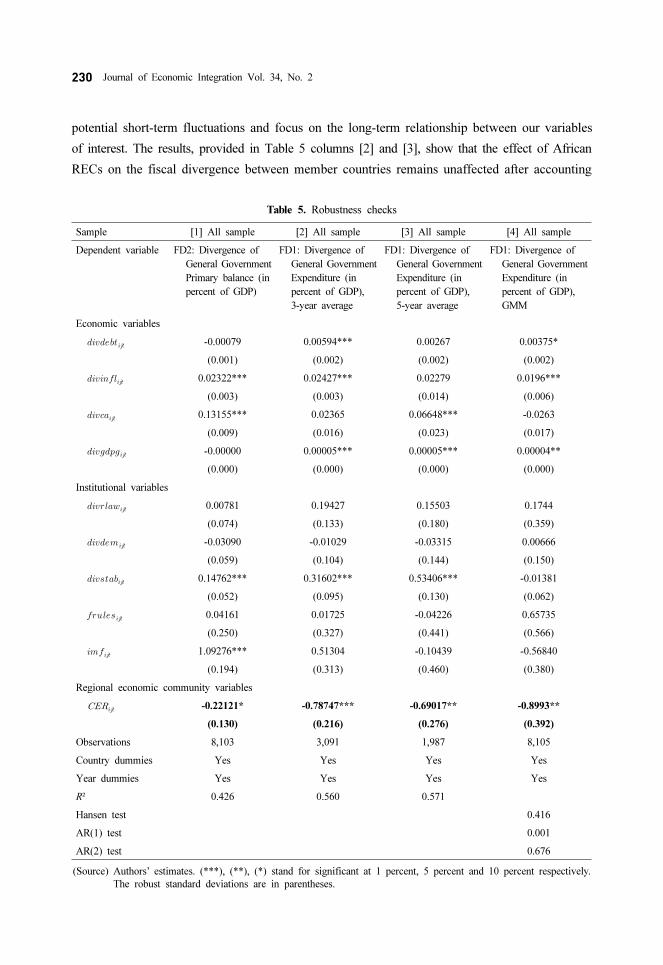
B. Robustness checks
We investigate the robustness of our baseline findings by using an alternative measure of
fiscal stance, changing the timeframe for computing fiscal divergence, and applying the GMM
methodology to account for potential endogeneity biases.
Alternative measure of fiscal stance. We explore the robustness of our findings using an
alternative measure of fiscal stance: the primary fiscal balance (). This fiscal indicator
includes the effects of fiscal and non-fiscal revenues. Equation (1) is re-estimated and reported
in Table 5 columns [1]. Including revenue in the measurement of the divergence of fiscal stances
does not alter the baseline results. Membership in the same REC reduces fiscal divergence
between countries at the 10 percent significance level.
Timeframe for computing fiscal divergence. We re-estimate Equation (1) using 3 and 5-year
averages for fiscal divergence indicators. With this transformation, we expect to smooth out
230 Journal of Economic Integration Vol. 34, No. 2
Sample [1] All sample [2] All sample [3] All sample [4] All sample
Dependent variable FD2: Divergence of General Government Primary balance (in percent of GDP)
FD1: Divergence of General Government Expenditure (in percent of GDP), 3-year average
FD1: Divergence of General Government Expenditure (in percent of GDP), 5-year average
FD1: Divergence of General Government Expenditure (in percent of GDP), GMM
Economic variables
-0.00079 0.00594*** 0.00267 0.00375*
(0.001) (0.002) (0.002) (0.002)
0.02322*** 0.02427*** 0.02279 0.0196***
(0.003) (0.003) (0.014) (0.006)
0.13155*** 0.02365 0.06648*** -0.0263
(0.009) (0.016) (0.023) (0.017)
-0.00000 0.00005*** 0.00005*** 0.00004**
(0.000) (0.000) (0.000) (0.000)
Institutional variables
0.00781 0.19427 0.15503 0.1744
(0.074) (0.133) (0.180) (0.359)
-0.03090 -0.01029 -0.03315 0.00666
(0.059) (0.104) (0.144) (0.150)
0.14762*** 0.31602*** 0.53406*** -0.01381
(0.052) (0.095) (0.130) (0.062)
0.04161 0.01725 -0.04226 0.65735
(0.250) (0.327) (0.441) (0.566)
1.09276*** 0.51304 -0.10439 -0.56840
(0.194) (0.313) (0.460) (0.380)
Regional economic community variables
-0.22121* -0.78747*** -0.69017** -0.8993**
(0.130) (0.216) (0.276) (0.392)
Observations 8,103 3,091 1,987 8,105
Country dummies Yes Yes Yes Yes
Year dummies Yes Yes Yes Yes
R² 0.426 0.560 0.571
Hansen test 0.416
AR(1) test 0.001
AR(2) test 0.676
(Source) Authors’ estimates. (***), (**), (*) stand for significant at 1 percent, 5 percent and 10 percent respectively. The robust standard deviations are in parentheses.
Table 5. Robustness checks
potential short-term fluctuations and focus on the long-term relationship between our variables
of interest. The results, provided in Table 5 columns [2] and [3], show that the effect of African
RECs on the fiscal divergence between member countries remains unaffected after accounting
Fiscal Convergence in Africa: What Role for Regional Economic Communities? 231
for short-term fluctuations.
GMM methodology. We investigate whether our findings are robust when tentatively correcting
for potential endogeneity. To this end, we re-estimate Equation (1) with the GMM methodology.
The GMM methodology allows one to address potential endogeneity biases arising between
explanatory variables and fiscal indicators and does not require the use of external instruments.
More specifically, we assume that divergence of public debt to GDP ratios, inflation rates, growth
rates, current account balances, adoption of fiscal rules and participation in IMF programs are
endogenous. These variables are instrumented using all of their lags and difference in lags.
We use the xtabond2 command with the collapse option to avoid over-instrumentation. To analyze
the relevance of this instrumentation method, we also report in Table 5 (column [4]) the Hansen
tests for over-identification (whose null hypothesis relates to the validity of the instruments)
and autocorrelation (whose null hypothesis suggests that error terms should not be auto-correlated
to the second order). They are satisfactory. The main results suggest that our baseline findings
showing the beneficial effects of RECs in helping fiscal stances to converge are robust after
accounting for potential endogeneity biases.
V. Concluding Remarks
This paper studied the role of African economic and monetary integration on fiscal convergence
of between countries. Using a broad sample of African countries and a broad range of estimates,
the results show that the existence of RECs decreases fiscal divergence of member countries
significantly. Monetary zones proved to be the most effective form of integration in fostering
fiscal convergence between countries. The traditional theory of OCAs has postulated that various
criteria be observed before a monetary zone is formed. These criteria include strong trade intensity
and high synchronization of the economic cycles of member countries. The endogeneity thesis
of OCA criteria, initiated by Frankel and Rose (1997), showed that a monetary zone generates
structural changes that mitigate the results of the standard theory of monetary zones to a great
extent. Countries with strong trade ties have more correlated business cycles (Frankel and Rose
(1998)). In addition to the channel of trade integration, the work by Darvas et al. (2005) points
out a second channel of endogeneity for the cycle synchronization criterion. The authors showed
a significantly negative relationship between fiscal divergence and cycle synchronization.
Countries with relatively similar fiscal deficits tend to be in the same phases of economic cycles.
Several papers, including Tapsoba (2009), illustrated the phenomenon of endogeneity for African
countries, in the manner of Frankel and Rose (2009), i.e., through trade: countries that trade
more have more synchronous business cycles. In this paper, we show that monetary zones in
Africa create the conditions for them to be sustained by fostering convergence of fiscal stances.
232 Journal of Economic Integration Vol. 34, No. 2
This paper is the first step in exploring the OCA endogeneity argument through the fiscal channel.
Future studies could focus on the relationship between fiscal convergence and business cycle
synchronicity.
References
Alesina, A., and R. Perotti. (1995). “Fiscal expansions and fiscal adjustments in OECD countries.”
Economic Policy 21, 207-248.
Bamba, N. (2004). Analyse du Processus de Convergence dans la Zone UEMOA. WIDER Research Paper
No. 2004/18, 43P.
Barrell, R., and J. Sefton. (1997). Fiscal Policy and the Maastricht Solvency Criteria. Manchester School.
Barro, R. (1979). “On the determination of the public debt.” Journal of Political Economy 87, 940-971.
Baxter, M., and M. A. Kouparitsas. (2005). “Determinants of business cycle comovement: a robust
analysis.” Journal of Monetary Economics 52, no. 1, 113-157.
Beetsma, R., and A. Bovenberg. (1999). “Does currency union lead to excessive debt accumulation?”
Journal of Public Economics 74, 299-325.
Bertarelli, S., R. Censolo, and C. Colombo. (2014). “Fiscal convergence in the European Union before
the crisis.” Contemporary Economic Policy 32, 784-801.
Bernaldo de Quiros, L. (1999). “The European Currency Union: A political time bomb.” Cato Journal
19, no. 1, 143-160.
Besancenot, D., R. Vrancéanu, and K. Huynh. (2003). “Dette publique, du risque d’insoutenabilité au
risque d’illiquidité.” Revue économique 54, no. 4, 773-784.
Blinder, A. (2000). “Central bank credibility: Why do we care? How do we build it?.” American Economic
Review 90, no. 5, 1421-1431.
Busemeyer, M. R. “Chasing Maastricht: The impact of the emu on the fiscal performance of member
states.” European Integration Online Papers (EIoP) 8, no. 8 (2004)
Buti, M., and G. Giudice. (2002). “Maastricht’s fiscal rules at ten: An assessment.” Journal of Common
Market Studies 40, 823-848.
Cabrillac, B., and R. Rocher. (2013). “Les perspectives des unions monétaires Africaines.” Revue d’économie
financière 110, no. 2, 99-125.
Carmignani, F. (2005). “The road to regional integration in Africa: Macroeconomic convergence and
performance in COMESA.” Journal of African Economies 15, no. 2, 212-250.
Cavalier, B. Politique budgétaire et coordination des politiques de financement. Edition Panthéon Assas,
LGDJ-Difuseur, 1999.
Checherita-Westphal, C., and V. Zdarek. Fiscal reaction function and fiscal fatigue: evidence for the
euro area. European Central Bank working paper series. No. 2036, 2017.
Corsetti, G., and N. Roubini. Tax Smoothing Discretion versus Balanced Budget Rules in the Presence
of Politically Motivated Fiscal Deficits: The Design of Optimal Fiscal Rules for Europe after 1992.
Fiscal Convergence in Africa: What Role for Regional Economic Communities? 233
CEPR Discussion Paper. No. 682, 1992.
Coulibaly, I., and B. Gnimassoun. (2013). “Optimality of a monetary union: New evidence from exchange
rate misalignments in West Africa.” Economic modeling 32, 463-482.
Creel, J., and H. Sterdyniak. (2001). “La théorie budgétaire du niveau des prix: Un bilan critique.” Revue
d’économie politique 111, no. 6, 909-939.
Creel, J., T. Latreille, and J. Le Cacheux. (2002). “Le Pacte de stabilité et les politiques budgétaires
dans l’Union européenne.” Revue de l’OFCE 2002/5 No. 83 bis, 245-297.
Crespo-Cuaresma, J., and O. Fernandez-Amador. (2010). Business cycle convergence in EMU: A first look
at the second moment. Working Paper in Economics and Statistics. No. 22, University of Innsbruck.
Darvas, Z., A. K. Rose, and G. Szapary. (2005). Fiscal Divergence and Business Cycle Synchronization:
Irresponsibility Is Idiosyncratic. NBER Working Papers, 11580, National Bureau of Economic Research.
De Haan, J., J.-E. Sturm, and G. Beerkhuis. (1999). “The weak government thesis: Some new evidence.”
Public Choice 101, 163-176.
Ferguson, N., and L. J. Kotlikoff. (2000). “The degeneration of EMU.” Foreign Affairs, 79/2, 110-121.
Ferreiro, J., M. T. Garcia-Del-Valle, and C. Gomez. (2009). “Is the composition of public spending
converging in EMU countries?” Journal of Post Keynesian Economics 31, 459-484.
Ferreiro, J., M. T. Garcia-Del-Valle, and C. Gomez. (2013). “An analysis of the convergence of the
composition of public spending in European Union countries.” American Journal of Economics and
sociology 72, no. 4, 799-825.
Frankel, J. A., and A. K. Rose. (1997). “Is EMU more justifiable ex post than ex ante?” European Economic
Review 41, no. 3-5, 753-760.
Frankel, J. A., and A. K. Rose. (1998). “The endogeneity of the optimum currency area criteria.” Economic
Journal 108, no. 449, 1009-1025.
Freitag, M., and P. Sciarini. (2001). “The political economy of fiscal deficits in the European Union.”
European Union Politics 2, no. 2, 163-189.
Guillaumont, J. S., Sampawende J. -A. Tapsoba. (2011). “Procyclicité de la politique budgétaire et
surveillance multilatérale dans l’UEMOA.” African Development Review 23, no. 2, 172-189.
Haldane, A. G., and S. G. Hall. (1991). “Sterling’s relationship with the dollar and the deutschmark:
1986-1989.” Economic Journal 101, no. 406, 436-443.
Hénin, P.-Y. (1997). “Soutenabilité des déficits et ajustements budgétaires.” Revue Économique 48, no.
3, 371-395.
Hughes, H. A. J., and Y. MA. (1996). “Changing partners: The importance of coordinating fiscal and
monetary policies within a currency union.” The Manchester School 64, no. 2.
Imbs, J. (2004). “Trade, finance, specialization, and synchronization.” Review of Economics and Statistics
86, no. 3 723-734.
Iossifov P., N. Kinoshita, M. Takebe, R. York, and Z. Zhan. (2009). Improving Surveillance across the
CEMAC Region. IMF Working Paper WP/09/260.
Jensen, S.E.H., and L. G. Jensen. (1995). “Debt, deficits and transition to EMU: A small country analysis.”
European Journal of Political Economy 11, no. 1, 3-25.
Leith, C., and S. Wren-Lewis. (2000). “Interactions between monetary and fiscal policies.” Economic
234 Journal of Economic Integration Vol. 34, No. 2
Journal 110, no. 462, 93-108.
Lucas, R., and N. Stokey. (1983). “Optimal fiscal and monetary policy in an economy without capital.”
Journal of Monetary Economics 12, no. 1, 55-93.
Kocenda, E., A. M. Kutan, and T. M. Yigit. (2008). “Fiscal convergence in the European Union.” North
American Journal of Economics and Finance 19, 319-330.
Masson, P. R., and C. A. Pattillo. (2004). The Monetary Geography of Africa, Washington, DC: Brookings
Institution Press.
McKay, D. (1999). “The political sustainability of European Currency Union.” British Journal of Political
Science 29, no. 3, 463-485.
Mpatswe, G. K., Sampawende J.-A. Tapsoba, and C. Y. Robert. (2011). The Cyclicality of Fiscal Policies
in the CEMAC Region. IMF Working Paper. WP/11/205.
N’Kodia, C. (2011). “Les pactes de convergence en zone franc: quels critères et quels objectifs en zone
CEMAC?.” Revue française d’économie 26, no. 2, 115-148.
Plane, P., and N. A. Tanimoune. (2005). “Performance et convergence des politiques économiques en
Zone Franc.” Revue française d’économie 20, no. 1, 235-268.
Sarr, F., and C. T. Ndiaye. (2011). “Asymétrie et convergence des politiques et chocs budgétaire en zone
UMEAO.” Revue économique et monétaire de la BCEAO, no. 6.
Simons, D., and R. Jean Louis. (2018). “Monetary union in West Africa and business cycles synchronicity:
new evidence.” The World Economy 41, no. 10, 2828-2848.
Reinhart, C., G. Kaminsky, and C. Végh. (2004). “When it rains it pours: Procyclical capital flows and
macroeconomic policies.” NBER Macroeconomic Annual 19, 11-59.
Rose, A., and C. Engel. (2002). “Currency unions and international integration.” Journal of Money, Credit,
and Banking 34, no. 4, 1067-1089.
Rotte, R. (1998). “International commitment and domestic politics: A note on the maastricht case.”
European Journal of International Relations 4, no. 1, 131-142.
Roubini, N., and J. Sachs. (1989). “Government spending and fiscal deficits in the industrialized countries.”
Economic Policy 8, 99-132.
Tapsoba Sampawende, J.-A. (2009). “Trade intensity and business cycle synchronicity in Africa.” Journal
of African Economies 18, no. 2, 287-318.
Tsangarides, C-G., P. Ewenczyk, and M. Hulej. (2006). Stylized Facts on Bilateral Trade and Currency
Unions: Implications for Africa. IMF Working Paper, WP/06/31.
Tujula, M., and G. Wolswijk. (2004). What determines fiscal balances? An empirical investigation in
determinants of changes in OECD budget balances. European Central Bank working paper series.
No 422/ December 2004.
Van der Ploeg, F. (1995). “Solvency of counter-cyclical policy rules.” Journal of Public Economics 57,
no. 1, 45-65.
Woo, J. (2003). “Economic, political and institutional determinants of public deficits.” Journal of Public
Economics 87, 387-426.
Fiscal Convergence in Africa: What Role for Regional Economic Communities? 235
Appendix 1
Figure A1. Regional economic communities (RECs) structure

![Definition of Modernism and Critical Approach. Modernism – noun […] a deliberate philosophical and practical estrangement or divergence from the past](https://img.pdfslide.net/doc/110x75/56649e265503460f94b161b7/definition-of-modernism-and-critical-approach-modernism-noun-a-deliberate.jpg)