Embed Size (px)
Citation preview
Volume 5, Number 1 ISSN 1533-3604
JOURNAL OF ECONOMICS ANDECONOMIC EDUCATION RESEARCH
An official Journal of theAcademy of Economics and Economic Education
and the Allied Academies
Editor: Larry R. DaleArkansas State University
Academy Informationis published on the Allied Academies web page
www.alliedacademies.org
Whitney Press, Inc.
Printed by Whitney Press, Inc.PO Box 1064, Cullowhee, NC 28723
www.whitneypress.com
The Academy of Economics and Economic Education is an affiliateof the Allied Academies, a non-profit corporation chartered underthe laws of North Carolina in the United States. The Academy isan association of scholars and educators whose purpose is toadvance the knowledge, understanding, and teaching of economicsthroughout the world.
Authors provide the Academy with a publication permissionagreement. Neither the Academy of Economics and EconomicEducation or the Allied Academies is responsible for the content ofthe individual manuscripts. Any omissions or errors are the soleresponsibility of the individual authors. The Editorial Board isresponsible for the selection of manuscripts for publication fromamong those submitted for consideration. The Editor accepts finalmanuscripts in digital form and the Publishers make adjustmentssolely for the purposes of pagination and organization.
The Journal of Economics and Economic Education Research ispublished by the Allied Academies, Inc., PO Box 2689, 145 TravisRoad, Cullowhee, NC 28723, USA, (828) 293-9151, FAX (828)293-9407. Those interested in subscribing to the Journal,advertising in the Journal, or otherwise communicating with theJournal, should contact [email protected].
Those individuals wishing to submit manuscripts to the Journalshould look on the web page at www.alliedacademies.org to findthe submission guidelines. Guidelines for publication are also onthe web.
Copyright 2004 by the Allied Academies, Inc., Cullowhee, NC, USA
iii
Journal of Economics and Economic Education Research, Volume 5, Number 1, 2004
EDITORIAL REVIEW BOARD
President, Academy of Economics and Economic EducationEditor, Journal of Economics and Economic Education Research
Larry R. Dale, DirectorCenter for Economic Education
Arkansas State UniversityJonesboro, AR
EDITORIAL BOARD MEMBERS
Dr. Kavous ArdalanSchool of ManagementMarist College
Dr. Peter Bell, DirectorNew York State Council on Economic EducationState College of New York
Dr. John Brock, DirectorCenter for Economic EducationUniversity of Colorado, Colorado Springs
Dr. Barry Brown, DirectorDepartment of Economics and FinanceMurray State University
Dr. Nancy Burnett- KnechtelUniversity of Wisconsin, Oshkosh
Dr. Fred Carr, DirectorCenter for Economic EducationUniversity of Akron
Dr. Jim Charkins, Executive DirectorCalifornia Council on Economic EducationCalifornia State University
Dr. Marsha Clayton, DirectorCenter for Economic EducationUniversity of Arkansas
Dr. Jerry CrawfordEconomics/Decision Sciences DepartmentArkansas State University
Dr. Lori Dickes, DirectorCenter for Economic Education Carnell Learning Center
Dr. Jan Duggar, DeanCollege of Business Arkansas State University
Dr. Barry Duman, ChairmanDepartment of EconomicsWest Texas A&M University

iv
Journal of Economics and Economic Education Research, Volume 5, Number 1, 2004
Dr. Michael Gordon, DirectorCenter for Economic EducationState University of New York, Canton
Dr. Gail Hawks, DirectorCenter for Economic EducationMiami-Dade Community College
Dr. Tracy HoferUniversity of Wisconsin- Stevens Point
Dr. Jerry Johnson, PresidentS. D. Council on Economic EducationUniversity of South Dakota
Dr. Cobert J. LamkinSouthern Arkansas UniversityBusiness Agri-Business Building
Dr. Nancy A. Lang, DirectorCenter for Economic EducationNorthern Kentucky University
Dr. Rita Litrell, Associate DirectorBessie B. Moore Center for Economic EducationUniversity of Arkansas
Dr. Anne MacyWest Texas A&M University
Dr. Barbara Moore, Assistant DirectorCenter for Economic EducationUniversity of Central Florida
Dr. Inder P. NijhawanCenter for Economic EducationFayetteville State University
Dr. Robert L. PenningtonCenter for Economic EducationUniversity of Central Florida
Dr. Robert Reinke, Executive DirectorS. D. Council on Economic Education University of South Dakota
Dr. Gary L. Stone, DirectorCenter for Economic EducationWinthrop University
Dr. Celya Taylor, DirectorMH Russell Center for Economic EducationHenderson State University
v
Journal of Economics and Economic Education Research, Volume 5, Number 1, 2004
JOURNAL OF ECONOMICS ANDECONOMIC EDUCATION RESEARCH
CONTENTS
EDITORIAL REVIEW BOARD . . . . . . . . . . . . . . . . . . . . . . . . . . . . . . . . . . . . iii
LETTER FROM THE EDITOR . . . . . . . . . . . . . . . . . . . . . . . . . . . . . . . . . . . . vii
ECONOMICS EDUCATION ARTICLES . . . . . . . . . . . . . . . . . . . . . . . . . . . . . 1
DEVELOPING STUDENT WRITERS INECONOMICS:A PROCESS WRITING APPROACH . . . . . . . . . . . . . . . . . . . . . . . . . . 3Craig M. Sasse, Rockhurst UniversityLaura E. Fitzpatrick, Rockhurst University
TEACHING MONEY, PRICES, INCOME,AND THE QUANTITY THEORY OFMONEY . . . . . . . . . . . . . . . . . . . . . . . . . . . . . . . . . . . . . . . . . . . . . . . . 17Han X. Vo, Winthrop University
ECONOMICS IN THE INTEGRATEDBUSINESS CURRICULUM: IN or OUT? . . . . . . . . . . . . . . . . . . . . . . 35Ismail H. Genc, University of IdahoSelahattin Bekmez, Mugla University Jon R. Miller, University of Idaho
vi
Journal of Economics and Economic Education Research, Volume 5, Number 1, 2004
HIGH SCHOOL ECONOMIC EDUCATIONIN EASTERN EUROPE:FINDINGS FROM FIVE NATIONS . . . . . . . . . . . . . . . . . . . . . . . . . . 49Phillip Saunders, Indiana UniversityKen Rebeck, St. Cloud State UniversityKent T. Saunders, Anderson University
ECONOMICS ARTICLES . . . . . . . . . . . . . . . . . . . . . . . . . . . . . . . . . . . . . . . . 65
WHAT ECONOMISTS DO:TRENDS IN ECONOMIC RESEARCH . . . . . . . . . . . . . . . . . . . . . . . 67Joseph G. Eisenhauer, Canisius College
INFORMATION TRANSFERS FROMDIVERSE CORPORATE EVENTS:METHODOLOGICAL ISSUESAND FINDINGS . . . . . . . . . . . . . . . . . . . . . . . . . . . . . . . . . . . . . . . . . 83Sanjay Rajagopal, Montreat College
WAGES AND VOLUNTARY LABORTURNOVER: COMPARING IT WORKERSWITH OTHER PROFESSIONALS . . . . . . . . . . . . . . . . . . . . . . . . . . . 99James Morgan, Northern Arizona UniversityWendy Campione, Northern Arizona UniversityMax Jerrell, Northern Arizona University

vii
Journal of Economics and Economic Education Research, Volume 5, Number 1, 2004
LETTER FROM THE EDITOR
We are extremely pleased to present this issue of the Journal of Economicsand Economic Education Research, an official publication of the Allied Academies’Academy of Economics and Economic Education Research, dedicated to the study,research and dissemination of information pertinent to the improvement ofmethodologies and effective teaching in the discipline of economics with a specialemphasis on the process of economic education. The editorial board is composedprimarily of directors of councils and centers for economic education affiliated withthe National Council on Economic Education. This journal attempts to bridge thegap between the theoretical discipline of economics and the applied excellencerelative to the teaching arts.
The Editorial Board considers two types of manuscripts for publication.First is empirical research related to the discipline of economics. The other isresearch oriented toward effective teaching methods and technologies in economicsdesigned for grades kindergarten through twelve. These manuscripts are blindreviewed by the Editorial Board members with only the top programs in eachcategory selected for publication, with an acceptance rate of less than 25%.
We are inviting papers for future editions of the Journal for Economics andEconomic Education Research and encourage you to submit your manuscriptsaccording to the guidelines found on the Allied Academies webpage atwww.alliedacademies.org.
Dr. Larry R. DaleDirector Center for Economic Education
P. O. Box 2890State University, AR 72467
e-mail; [email protected][870]-972-3416

viii
Journal of Economics and Economic Education Research, Volume 5, Number 1, 2004
1
Journal of Economics and Economic Education Research, Volume 5, Number 1, 2004
ECONOMICS EDUCATION ARTICLES

2
Journal of Economics and Economic Education Research, Volume 5, Number 1, 2004
3
Journal of Economics and Economic Education Research, Volume 5, Number 1, 2004
DEVELOPING STUDENT WRITERS INECONOMICS:
A PROCESS WRITING APPROACH
Craig M. Sasse, Rockhurst UniversityLaura E. Fitzpatrick, Rockhurst University
ABSTRACT
An intervention developed by the authors that allows inclusion of processwriting with peer review was adopted in introductory economics courses. Thewriting protocol, which took class time to implement, resulted in similar testperformance by students without creating excessive demands upon the instructor'stime. The process writing intervention, used for essay exams, promotes writing tolearn by forcing students to reflect on course content through the peer reviewprocess incorporated into the technique. The intervention also addresses writingdevelopment by forcing students to critique key writing elements in other students'essays and by encouraging students to revise their written drafts in order toimprove.
The structure, style and mechanics of the first draft. The intervention wasexpected to produce several outcomes. First, the writing process assignments wouldnot detract from content learning. Secondly, students would perceive the activity tobe beneficial in terms of their content learning and writing skill. Finally, studentswould show improvement in their writing and critical thinking skills. Outcomeswere assessed with student surveys, analysis of test scores before and after theintervention, and analysis of student papers.
INTRODUCTION
The ability to write and speak well has become a primary concern ofemployers (Ashbaugh, 1994; Buckley et al., 1989; Porter & McKibbon, 1988). Infact, research conducted in work settings has suggested that content courses (e.g.,economics, math, etc.) should emphasize the importance of writing skills (Anderson,1985). Such concerns have renewed efforts by colleges to implement writing across
4
Journal of Economics and Economic Education Research, Volume 5, Number 1, 2004
the curriculum where writing development is not just the responsibility of theEnglish department, but of other disciplines as well. In short, non-English coursesoften attempt to develop writing skills of students and/or use writing as a mediumfor learning about a discipline such as economics.
While many advocate an across the curriculum approach to help studentsdevelop writing skills, merely assigning writing assignments is insufficient to meetthis goal (Ferrara, 1983; Hansen, 1993). Such development requires students torevise their work and to receive feedback on their writing (Hansen 1993; Cohen &Spencer, 1993). This places a demand on the teacher not only in time taken awayfrom other classroom activities but also being able to comment competently onstudent papers.
Writing is not solely a subject about itself but a tool of learning (Emig,1994; Hansen, 1993). Thus, writing assignments within the disciplines serve theadded purpose of helping students think in the context of the discipline. Byreasoning through content issues and problems in the process of writing, the studentis able to learn and reinforce the content or discipline-based knowledge gained.Furthermore, in many professional disciplines, students must learn accepted writingstyles, formats, and conventions consistent with the skills and knowledge of theprofession.
These two issues-the need to develop written communication skills and theuse of writing as a tool for learning-provide a rationale for incorporating writtenassignments into other disciplines not only for the learning of specific material, butalso in developing an important student skill. We developed a process writingprotocol that attempts to develop written communication skills through a structuredrevision process. This article describes the process writing protocol, adapted foressay responses, as implemented in an introductory macroeconomics course. Inaddition, we will share our assessment of the process writing protocol.
PROCESS WRITING APPROACH
Research has identified several key processes of good writing. First, expertwriters are able to plan their writing better than novice writers (Berkenkotter, 1982).This has led Berkenkotter (1982) and others (e.g., Haynes, 1978) to suggest thatstudents be given opportunities to engage in explicit pre-writing activities. Thetypical essay exam context, however, calls for the student to write a one-draft onlyresponse in a time-limit situation. A process writing approach allows time forstudents to think about the subject and to make revisions to their initial thoughts.
5
Journal of Economics and Economic Education Research, Volume 5, Number 1, 2004
A second important process of good writing is that it is done recursively. That is,the writer must usually go back and forth between putting thoughts together(composing) and re-reading and re-writing those thoughts (revising). Cohen andSpencer (1993) identify revision as a critical process because it gives the writer achance to organize and style the message so it is readable for the audience. In short,good writing requires a complex coordination between planning, drafting, andrevising thoughts and ideas.
In addition to giving student writers more time to compose, reflect, andrevise their thoughts, process writing allows for collaboration. Haynes (1978)suggests that an important prewriting activity is peer collaboration. One advantageof collaboration Haynes (1978) asserts is that it provides better opportunities forstudent-directed revision. Using a process writing approach-where students aregiven adequate time to plan, draft, and revise and edit their work-also allows theinstructor to focus more on the structure and style of the essay, rather than just thegrammar or copy-editing.
Copy-editing errors, very common in most student writing, is a final step inthe writing process. While teachers often over emphasize copy-editing issues intheir feedback (as opposed to the more substantive structure and style issues), awriting process framework must address grammar and punctuation (see Haswell,1983). Often errors are the result of inadequate proofing and students must developthe attitude of simply taking the time to edit their work. What Haswell (1983) foundwas that if students were simply cued as to where surface errors might be (by puttingcheck marks in the margin of the line where the error occurs) they could correctmany of their own mistakes. Not only does the check system, called minimalmarking, help students learn the mechanics, but it also helps focus instructorfeedback on the more substantive aspects of the written work.
Although a process writing approach can be used with a variety of formsand in any discipline, the specific protocol described herein was used for essayquestions associated with the course exams in a macroeconomics course. The nextsection describes the writing assignment protocol fully.
THE PROCESS WRITING PROTOCOL FOR ESSAY EXAMS
The new process writing protocol changed the previous procedure callingfor the student to write a one-draft only response in a time-limit situation to onewhere students planned, drafted, and revised and edited their essays over a two-weekperiod (four classes). The course also employed permanent groups, which were
6
Journal of Economics and Economic Education Research, Volume 5, Number 1, 2004
used to support the protocol. These permanent groups also took part in other groupactivities not related to the essays.
Session One. Two weeks before the assigned exam date, the instructordistributes a list of four or five essay questions to each writing group; groupmembers decide who will prepare which essay response. Before session two, eachstudent drafts a one page or less (typed) answer to his or her assigned question. Thisessay as well as copies for each member of the group and the instructor is broughtto the next class session (session two). Class time required: five minutes.
Session Two. Students bring enough copies of their essay responses todistribute to each of the other group members and to the instructor. The instructordoes not evaluate the essays, but does track whether students have completed thisstep. The instructor can choose to deduct points from the total exam score if it is notcompleted.
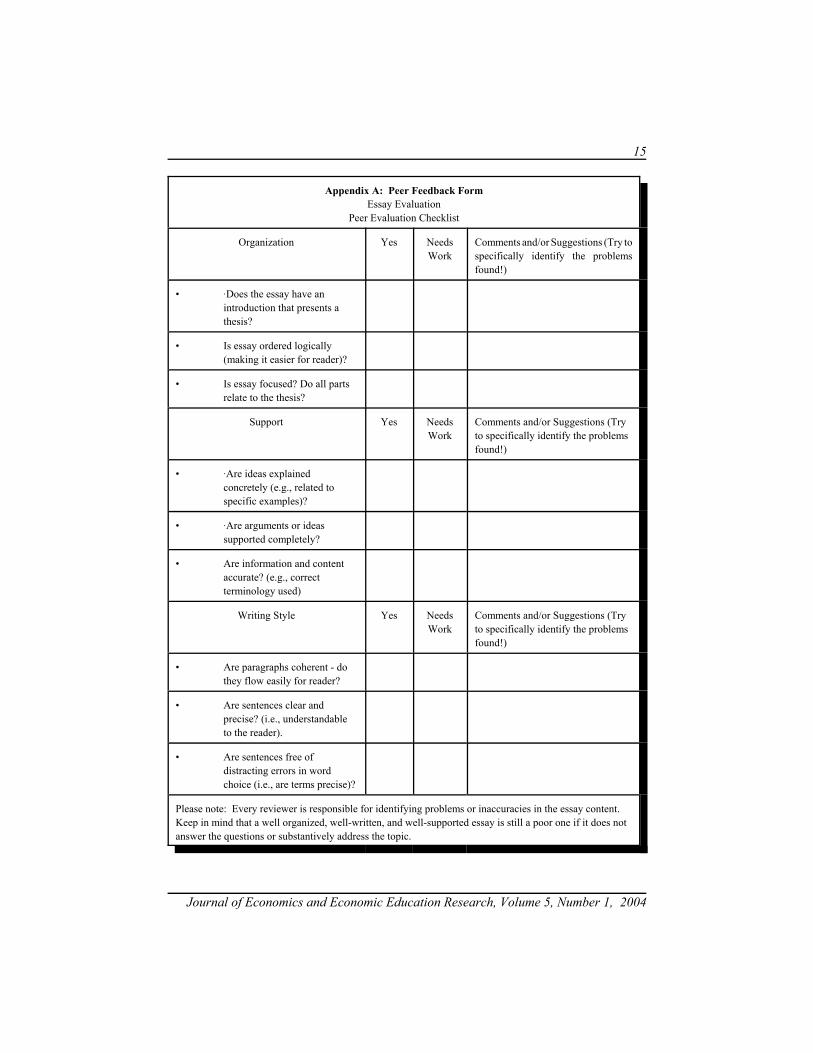
Outside of class and before the next session, students in the group areresponsible for reading and preparing a critique of each team member's essay usingthe peer evaluation form provided by the instructor. (See Appendix A for the peerevaluation checklist.) This critique is structured around four principles: 1) the essayresponse includes all of the economic content required to answer the question; 2) theresponse is well organized and readable; 3) the assertions made by the author aresupported; and 4) the writing style is acceptable. If time permits, the instructor asan option can spend time (15-25 minutes) demonstrating the writing principlesstudents will be critiquing. For example, the instructor might model a comment fora paper that has problems with organization. In any case, the instructor will likelyfind that she will need to intervene at some point in the semester to help studentsmake better comments. Class time required: three to five minutes; more time if somekind of support intervention used.
Session Three. Approximately one-half hour of this class period is set asidefor the groups to discuss the essays they have critiqued. (Students generally spendfive to seven minutes per essay.) Groups may approach this task in several ways,but we suggest students collectively reexamine one essay at a time to suggest areasfor improvement using the evaluation form as a guide. As the evaluation formfocuses student critique on addressing structure, support, and style problems in theessays, these areas and not copy-editing become the focus of these discussions. Thisis also the time for students to reassess the content of each essay because thismaterial mirrors that found on the objective part of the exam. During this time, theinstructor floats among the groups answering questions regarding the writingcomponents of their essay and, perhaps, providing input on the group's process. The
7
Journal of Economics and Economic Education Research, Volume 5, Number 1, 2004
instructor should not, however, take the critiquing task away from the students. Theauthors of the essays consider the critiques presented by their fellow group membersto make final revisions of their essays so that a final draft can be turned in forsession four. In short, this is an intervention that should lead to reflection in termsof content and the way it is presented in writing. Classtime required: thirty minutes.
Session Four. The students bring the final drafts of their essays to class andturn them in to the instructor with the peer evaluation forms from their groupmembers. Evaluation forms are turned in so that the instructor can monitor whethereach student is constructively critiquing fellow students' papers. Students areinstructed that merely indicating on the peer review form that everything isacceptable does not qualify as constructive criticism. If a student has approachedthe assignment in this way, seeing each student's critiques allows the instructor tointervene.
The students then sit for the objective portion of the exam. During this timethe essays are "quick corrected" by the instructor and other aides. That is,checkmarks are made on the margin next to the lines in which surface orcopy-editing errors (i.e. spelling, punctuation, word choice, and grammar) occur(adapted from Haswell 1983). After completing the multiple-choice portion of theexam, students have one last chance to edit their paper using the checkmarks as aguide. These last corrections are completed during the exam period and turned inimmediately afterward. When these essays are graded, points are partially awardedon content and partially awarded on writing quality. Class time required: thirtyminutes concurrent with the objective part of the exam.
RESULTS OF THE ESSAY PROTOCOL
The assessment of the essay protocol focused on two points of interest. Firstwe were interested in what impact, if any, the protocol had on student performanceand student learning for the economic concepts taught in the course. Specifically,did student scores change when the new testing protocol was used and did studentsperceive that the essay assignment-presumably requiring much more time out ofclass for composition and revision-was a burden on their ability to study for theother parts of the exam? The second point of interest was a faculty developmentissue of determining the developmental needs of students in terms of their thinkingand writing well within the economics discipline. That is, we needed to learn wherestudents needed help in their thinking and their writing.
8
Journal of Economics and Economic Education Research, Volume 5, Number 1, 2004
Although no experimental designs were attempted, several actions weretaken to help us address these issues. First, scores from the objective portions of theexams were compiled from previous semesters (when essays were simply composedin-class during the exam) and compared to those using the process writing protocol.Secondly, an end-of-the semester survey was administered to find out how studentsperceived the process writing protocol in terms of its impact on their thinking andwriting as well as how it impacted their study. Finally, student essays were analyzedto determine any patterns of student errors in mechanics. The analysis looked atchanges over the course of the semester and at the specific grammatical andpunctuation errors being made in the papers.
From our data, it appears that the protocol assignment had no negativeimpact on overall student learning of the economics content. In comparing studentperformance on the objective portion of the exams (multiple-choice questions) wefound virtually no difference between scores before the protocol and after. Themultiple choice questions, varying in difficulty from definitional/identificationquestions to complex application questions, were similar to ones used in theinstructor's previous macroeconomics courses (pre-intervention), thus serving as abasis for comparison. In comparison of pre-intervention sections (N=138) andpost-intervention sections (N=139), percentage of correct answers was nearlyidentical for all four course exams.
In an end-of-the-course survey, students reported their perceptions of howthe process writing protocol affected their learning of concepts and the impact onwriting skills. A majority of students reported that the protocol helped them studyfor exams (77%); likewise, a majority reported that the protocol helped theirlearning of the content (88%). Only 14 students (11%) reported the protocol tooktime away from their study preparation for the tests.
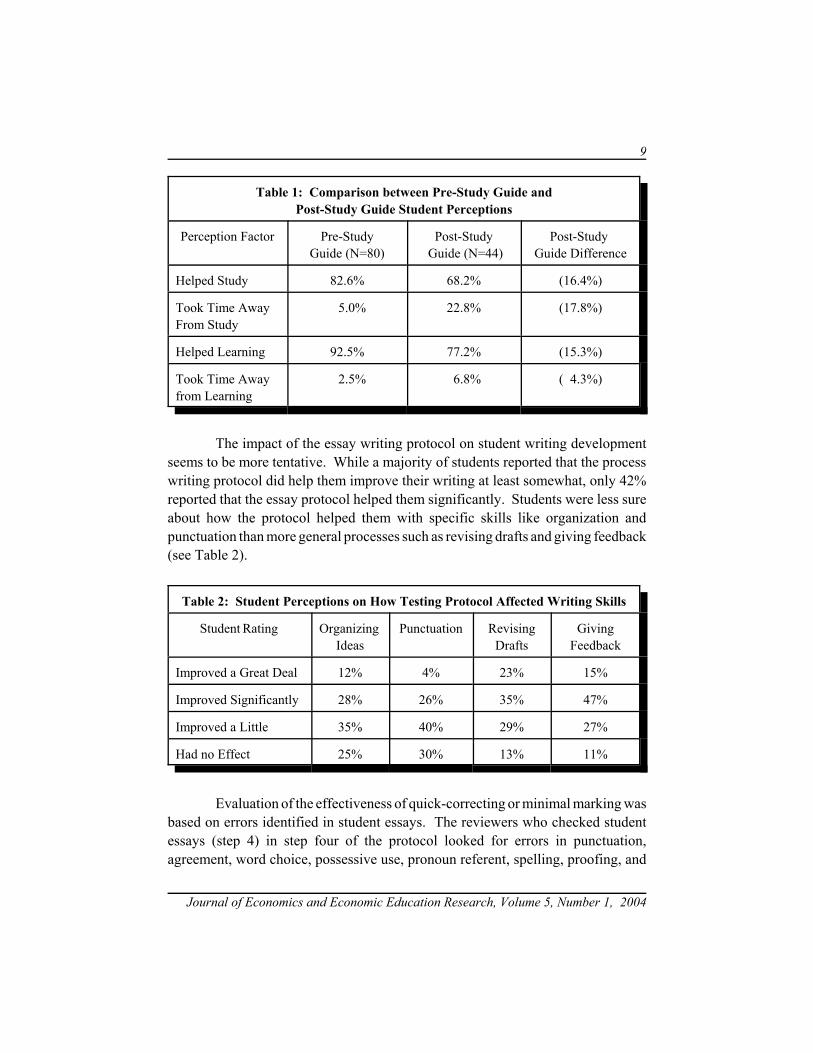
After the new protocol had been used for two semesters, a peer review guide(see Appendix A for copy) was added for the subsequent third semester to improvestudent feedback. Further analysis comparing pre-guide vs. post-guide shows thepost intervention group having a slightly lower regard for the protocol's affect onstudent preparation. That is, when the peer review guide was introduced into theprotocol, slightly more students reported that the process took time away fromlearning. Table 1 compares the pre and post peer review guide perceptions.
9
Journal of Economics and Economic Education Research, Volume 5, Number 1, 2004
Table 1: Comparison between Pre-Study Guide andPost-Study Guide Student Perceptions
Perception Factor Pre-StudyGuide (N=80)
Post-Study Guide (N=44)
Post-Study Guide Difference
Helped Study 82.6% 68.2% (16.4%)
Took Time Away From Study
5.0% 22.8% (17.8%)
Helped Learning 92.5% 77.2% (15.3%)
Took Time Away from Learning
2.5% 6.8% ( 4.3%)
The impact of the essay writing protocol on student writing developmentseems to be more tentative. While a majority of students reported that the processwriting protocol did help them improve their writing at least somewhat, only 42%reported that the essay protocol helped them significantly. Students were less sureabout how the protocol helped them with specific skills like organization andpunctuation than more general processes such as revising drafts and giving feedback(see Table 2).
Table 2: Student Perceptions on How Testing Protocol Affected Writing Skills
Student Rating Organizing Ideas
Punctuation RevisingDrafts
GivingFeedback
Improved a Great Deal 12% 4% 23% 15%
Improved Significantly 28% 26% 35% 47%
Improved a Little 35% 40% 29% 27%
Had no Effect 25% 30% 13% 11%
Evaluation of the effectiveness of quick-correcting or minimal marking wasbased on errors identified in student essays. The reviewers who checked studentessays (step 4) in step four of the protocol looked for errors in punctuation,agreement, word choice, possessive use, pronoun referent, spelling, proofing, and
10
Journal of Economics and Economic Education Research, Volume 5, Number 1, 2004
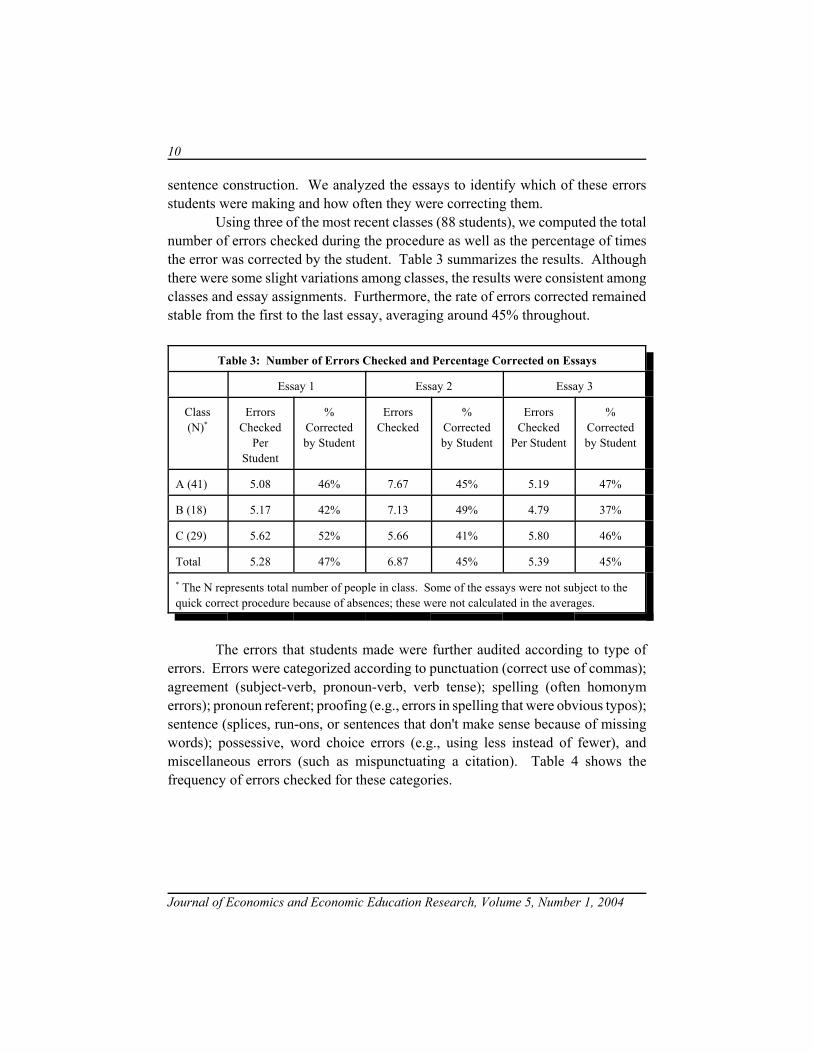
sentence construction. We analyzed the essays to identify which of these errorsstudents were making and how often they were correcting them.
Using three of the most recent classes (88 students), we computed the totalnumber of errors checked during the procedure as well as the percentage of timesthe error was corrected by the student. Table 3 summarizes the results. Althoughthere were some slight variations among classes, the results were consistent amongclasses and essay assignments. Furthermore, the rate of errors corrected remainedstable from the first to the last essay, averaging around 45% throughout.
Table 3: Number of Errors Checked and Percentage Corrected on Essays
Essay 1 Essay 2 Essay 3
Class(N)*
ErrorsChecked
PerStudent
%Correctedby Student
ErrorsChecked
%Correctedby Student
ErrorsChecked
Per Student
%Correctedby Student
A (41) 5.08 46% 7.67 45% 5.19 47%
B (18) 5.17 42% 7.13 49% 4.79 37%
C (29) 5.62 52% 5.66 41% 5.80 46%
Total 5.28 47% 6.87 45% 5.39 45%
* The N represents total number of people in class. Some of the essays were not subject to thequick correct procedure because of absences; these were not calculated in the averages.
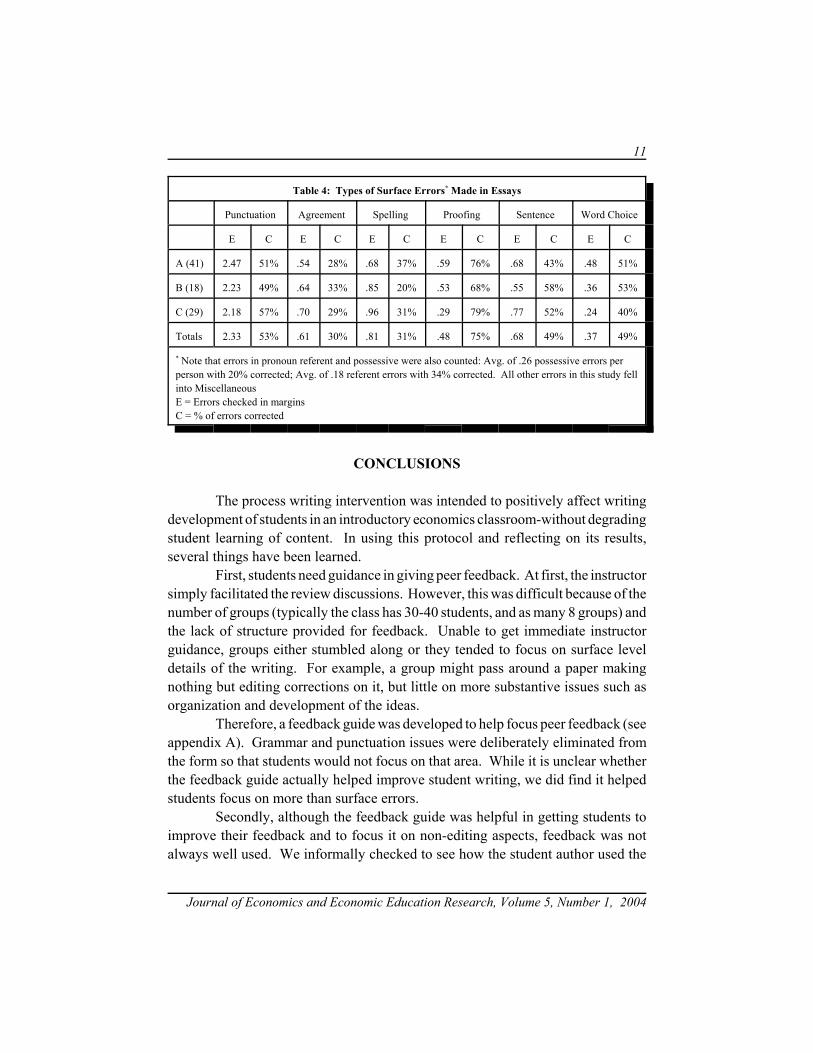
The errors that students made were further audited according to type oferrors. Errors were categorized according to punctuation (correct use of commas);agreement (subject-verb, pronoun-verb, verb tense); spelling (often homonymerrors); pronoun referent; proofing (e.g., errors in spelling that were obvious typos);sentence (splices, run-ons, or sentences that don't make sense because of missingwords); possessive, word choice errors (e.g., using less instead of fewer), andmiscellaneous errors (such as mispunctuating a citation). Table 4 shows thefrequency of errors checked for these categories.
11
Journal of Economics and Economic Education Research, Volume 5, Number 1, 2004
Table 4: Types of Surface Errors* Made in Essays
Punctuation Agreement Spelling Proofing Sentence Word Choice
E C E C E C E C E C E C
A (41) 2.47 51% .54 28% .68 37% .59 76% .68 43% .48 51%
B (18) 2.23 49% .64 33% .85 20% .53 68% .55 58% .36 53%
C (29) 2.18 57% .70 29% .96 31% .29 79% .77 52% .24 40%
Totals 2.33 53% .61 30% .81 31% .48 75% .68 49% .37 49%
* Note that errors in pronoun referent and possessive were also counted: Avg. of .26 possessive errors perperson with 20% corrected; Avg. of .18 referent errors with 34% corrected. All other errors in this study fellinto MiscellaneousE = Errors checked in marginsC = % of errors corrected
CONCLUSIONS
The process writing intervention was intended to positively affect writingdevelopment of students in an introductory economics classroom-without degradingstudent learning of content. In using this protocol and reflecting on its results,several things have been learned.
First, students need guidance in giving peer feedback. At first, the instructorsimply facilitated the review discussions. However, this was difficult because of thenumber of groups (typically the class has 30-40 students, and as many 8 groups) andthe lack of structure provided for feedback. Unable to get immediate instructorguidance, groups either stumbled along or they tended to focus on surface leveldetails of the writing. For example, a group might pass around a paper makingnothing but editing corrections on it, but little on more substantive issues such asorganization and development of the ideas.
Therefore, a feedback guide was developed to help focus peer feedback (seeappendix A). Grammar and punctuation issues were deliberately eliminated fromthe form so that students would not focus on that area. While it is unclear whetherthe feedback guide actually helped improve student writing, we did find it helpedstudents focus on more than surface errors.
Secondly, although the feedback guide was helpful in getting students toimprove their feedback and to focus it on non-editing aspects, feedback was notalways well used. We informally checked to see how the student author used the
12
Journal of Economics and Economic Education Research, Volume 5, Number 1, 2004
comments, finding that not all students used the feedback they received, even if itwas valid. That is, students did not necessarily revise their essays even if givenhelpful feedback. Fortunately, however, some did revise and improve their essay.This is certainly an area worthy of further study; especially, in helping to determinehow students can be further encouraged and enabled to actually revise their essaydrafts.
Third, use of the process writing protocol requires more from the instructor.Before using the process writing protocol, essays were graded mostly on coverageof the salient content points. While the old system was easier to apply, it wasinadequate for the process writing essays. At first, we simply added a writingcomponent; that is, the content was evaluated separately from a writing evaluation.Still, this was a bit simplistic and more holistic evaluation methods have been tried.We are in the process of developing a set of standard responses related to structuraland style issues to help streamline the grading and commenting activity. In anycase, there will continue to be an effort to integrate the evaluation as a formativeinput to student writing development.
Finally, while students did correct surface errors, they did not automaticallycorrect them when given the check mark. Haswell (1983) reported 61% of checkederrors were corrected in his classes; in this sample it was less than 50%. Someerrors like agreement, spelling, and punctuation errors were more resistant tocorrection; proofing was the most correctable error. Furthermore, students wouldmake similar type mistakes in the subsequent essays. Therefore, it became apparent,that a short workshop was needed when the first essays were handed back. In theten-minute workshop, the common, uncorrected errors are shared, using examplesfrom the student writing. This is a good time, for example, to point out how tocorrectly reference acronyms such as GNP, punctuating introductory clauses, orcorrecting the noun-pronoun pair of "country" and "their" (to "country and its").
Even with this intervention, students still made almost as many surfacemistakes in terms of number of checks in the last essay as they did in the first (onaverage). Two reasons may account for this. First, students seemed to use morecompound sentences and sentences using subordinating clauses in the later essays.Haswell (1988) found in an empirical study he conducted on surface errors ofcollege students that while student errors (in areas such as spelling, punctuation,agreement, etc.) tended to increase as college students moved from freshman tojuniors, student writing became more sophisticated causing more opportunities forthose errors. In fact, a majority of the surface errors were ones of punctuation,which may have been caused by the more sophisticated writing forms used. A
13
Journal of Economics and Economic Education Research, Volume 5, Number 1, 2004
second, though less likely, reason may relate to the types of essay questions as thelater ones may have called for more sophisticated synthesis (no attempt was madeto do that in writing the questions).
While we continue to develop our own ability to implement the processwriting protocol, including evaluation of the writing component, the assignmentseems to be effective in getting students to respond to essay questions in a moreorganized and competent way. As expected, we found the process essays to besuperior in quality to the time limit essays assigned in the past. Importantly, theengagement in the process seems to support both writing development andconceptual understanding. However, the process writing protocol does take someadditional classtime, requires that the instructor effectively facilitate peer evaluation,and requires the instructor to give formative feedback and attention to issues ofwriting, not just content.
REFERENCES
Anderson, P.V. (1985). What survey research tells us about writing at work. In L. Odell &D. Goswami (Eds.), Writing in Nonacademic Settings. New York: The GuilfordPress.
Ashbaugh, D.L. (1994). Improving writing skills while increasing understanding ofmanagement course content. Journal of Management Education, 18, 369-374.
Berkenkotter, C. (1982). Writing and problem solving. In T. Fulwiler & A. Young (Eds.),Language Connections (pp. 33-44). Urbana, IL: National Council of Teachers ofEnglish.
Buckley, M.R., E.B. Peach & W. Weitzel (1989). Are collegiate business programsadequately preparing students for the business world? Journal of Education forBusiness, 65, 101-105.
Cohen, A.J. & J. Spencer (1993). Using writing across the curriculum in economics: Istaking the plunge worth it? Journal of Economic Education, 24, 219-230.
Emig, J. (1994). Writing as a mode of learning. In C. Bazerman & D.R. Russell (Eds.),Landmark Essays on Writing Across the Curriculum (pp. 89-96). Anaheim, CA:Hermagoras Press.
14
Journal of Economics and Economic Education Research, Volume 5, Number 1, 2004
Ferrara, C.F. (1983). Upgrading the quality of a company's business writing skills.Management Review, 72 (December), 20-24.
Hansen, W.L. (1993). Teaching a writing intensive course in economics. Journal ofEconomic Education, 24, 213-218.
Haswell, R.H. (1983). Minimal marking. College English, 45(6), 600-04.
Haswell, R.H. (1988). Error and change in college student writing. WrittenCommunication, 5(4), 479-499.
Haynes, E.F. (1978). Using research in preparing to teach writing. English Journal, 67(1),82-88.
Porter, L.W. & L.E. McKibbon (1988). Management education and development: drift orthrust into the 21st century? St. Louis: McGraw-Hill.
15
Journal of Economics and Economic Education Research, Volume 5, Number 1, 2004
Appendix A: Peer Feedback FormEssay Evaluation
Peer Evaluation Checklist
Organization Yes NeedsWork
Comments and/or Suggestions (Try tospecifically identify the problemsfound!)
• ADoes the essay have anintroduction that presents athesis?
• Is essay ordered logically(making it easier for reader)?
• Is essay focused? Do all partsrelate to the thesis?
Support Yes NeedsWork
Comments and/or Suggestions (Tryto specifically identify the problemsfound!)
• AAre ideas explainedconcretely (e.g., related tospecific examples)?
• AAre arguments or ideassupported completely?
• Are information and contentaccurate? (e.g., correctterminology used)
Writing Style Yes NeedsWork
Comments and/or Suggestions (Tryto specifically identify the problemsfound!)
• Are paragraphs coherent - dothey flow easily for reader?
• Are sentences clear andprecise? (i.e., understandableto the reader).
• Are sentences free ofdistracting errors in wordchoice (i.e., are terms precise)?
Please note: Every reviewer is responsible for identifying problems or inaccuracies in the essay content. Keep in mind that a well organized, well-written, and well-supported essay is still a poor one if it does notanswer the questions or substantively address the topic.

16
Journal of Economics and Economic Education Research, Volume 5, Number 1, 2004
17
Journal of Economics and Economic Education Research, Volume 5, Number 1, 2004
TEACHING MONEY, PRICES, INCOME,AND THE QUANTITY THEORY OF
MONEY
Han X. Vo, Winthrop University
ABSTRACT
One problem often encountered in teaching macroeconomics,particularly at the principles level, is the abstract nature of the subjectmatter. In teaching the quantity theory of money, many students havedifficulty with understanding the theory itself and the terms in that equation.In fact, for the students to comprehend the quantity of money, they first needto have a good grasp of such elusive concepts as the quantity of money, thevelocity of money, as well as the distinction between nominal income andreal income.
This paper describes a classroom simulation technique designed toteach the quantity theory of money and related concepts. The focus of thesimulation is to use a concrete classroom situation to help the students relateto more abstract concepts and phenomena. The author has used thissimulation to teach macro principles with good results. This paper has twoparts: the first part deals with a discussion of simulation method and thesecond part, with the historical development and policy ramifications of thequantity theory.
The paper begins with an identification of the major problems thatmay be encountered in teaching the quantity theory to undergraduatestudents. It then proceeds to describe the simulation exercise in details.Basically, the exercise involves dividing the class into a producer side anda consumer side. The class receives a fixed amount of money and a fixedquantity of good. The students also receive clarifications of the meaning ofeach of the terms in the equation of exchange, MV = 3PQ. After allowinga short period of "free" exchange of good for money between the two sides,
18
Journal of Economics and Economic Education Research, Volume 5, Number 1, 2004
the students were asked to compute the value of nominal income. Toreinforce their understand of the equation of exchange, the simulation goesthrough a second and third round after changes in the money supply M andthe quantity of goods or real income Q.
Upon completion of the simulation exercise, the instructor goesthrough the meaning of the quantity theory and policy implications. Thissecond phase of the learning is designed to help the student see thefunctional linkages between money, prices, nominal income, and real income.The students seemed to enjoy a fresh change of venue and gain a betterunderstanding of equation of exchange, a clearer idea about the quantitytheory as a theory about money, price, and income.
INTRODUCTION
In undergraduate macroeconomic classes, at the principles levelespecially, teaching the quantity theory of money can sometimes be achallenging experience. From the students' perspective, the difficultiesfrequently arise from the first-time encounter with such elusive concepts asthe supply of money, money's velocity, and the link between the quantity ofmoney and the price level and nominal income. The challenge with teachingthe quantity theory can also comes from student failure to grasp suchmeasures as nominal GDP and real GDP. Even from the faculty'sperspective, the modern quantity theory of money is not without controversy.In a nutshell, the controversy concerns the identity-vs.-equation issue, orabout the role of money in stabilization policy, or the effectiveness ofmonetary policy. In other words, the controversy has revolved around issuesregarding the nature and direction of causality between the major terms of theequation, namely, money, prices, and output. Interestingly enough, thiscontroversy among economists also finds a parallel expression in theclassroom, when the teacher may have a hard time explaining to his studentsthe nexus of money-velocity-price-income relationships. This paper exploresa complementary teaching technique aimed at addressing the pedagogicalchallenge stated above.
19
Journal of Economics and Economic Education Research, Volume 5, Number 1, 2004
If the controversy among economists is concerned with Athetechnical difficulty of sorting out the direction of causation running betweenmoney and prices," (Laidler 1991) to many undergraduate students,especially those taking principles of economics, the difficulty inunderstanding causality is further compounded by the abstract nature ofentities such as the stock of money, velocity, and the general price level.This paper addresses the "abstract" and "causality" issues by tackling the"abstract" problem first. My experience with the classroom techniquedescribed below suggests that, once the students gained a firmerunderstanding of such abstract terms as the stock of money and the velocityof money, then it is easier to get into a more substantive discussion of sucha matter as relationships or transmission mechanism of monetary policy.
In short, it is essential that the students overcome their fear of whatthey perceive as too abstract macroeconomic words or concepts. Forexample, once students gain a firmer comprehension of such vocabulary asvelocity and quantity of money, they would be more willing to accept the"quantity theory of money"as an identity, and from this acceptance, we canthen show them the "quantity theory" as a theory. Thus, before one canexpect them to understand the "quantity theory" as a theory, it is helpful toconvince them how a complex economy can be reduced to a simple identityVM = PQ. In my experience, I have found the exercise described belowhelpful in explaining the meaning of the said identity. Briefly, the strategyconsists of allowing the students to participate in the Aworking" of aneconomy-an economy created for them right in the classroom. In otherwords, the simulation is meant to help the students grasp the fundamental ofthe circular flow of income and output. Once that objective is accomplished,the next step is to explain the linkages as different theories or schoolspropose. In short, the simulation exercise is built on the premise that, inteaching the quantity theory of money, the place to start is to help thestudents master the equation of exchange. Consequently, the exercise isprimarily aimed at achieving the latter objective. This paper has two parts.The first part presents the simulation exercise; the second part deals withmore substantive issues surrounding the quantity theory.
20
Journal of Economics and Economic Education Research, Volume 5, Number 1, 2004
CLASSROOM SIMULATION
The Money Supply Constant
To begin the simulation, I explain to my class the purpose andstrategy of the exercise. Briefly, I said, the idea is to turn the class into asimple economy. By allowing the economy to function, that is by letting theeconomy engage in an exchange process, one can gain a better understandingof how the quantity theory of money, or more precisely, the equation ofexchange can describe the concepts and functional relationship between thestock of money, velocity, and nominal GDP. In that simulated economy, Iask my students to play the role of producers and consumers and I providethe class with given amount of cash to facilitate the exchange. After theintroduction, I split my class into two equal halves. Naturally, this worksnicely if the class is of an even size, but if it is not, one has to ask one studentto abstain and to serve as your assistant/facilitator. For example, if my classhas 30 students, I would have two groups of 15 students per group. Onegroup, named group P, comprises of producers only, while the other group,called group C, is made up of consumers only. I then give one-dollar bill toeach of the 15 students in group C. Obviously, for this economy, the "moneysupply" or the "quantity of money" is 15 dollars. Similarly, to each of the 15students in the group P, I give a token commodity, say, a new pencil. Theidea is that the output produced by this economy, as embodied in group P'sinitial possession, is 15 pencils. In other words, this is the real GDP of thesimulated economy.
Now my newly created economy begins to engage in exchange-albeitunder some arbitrary rules meant to facilitate the exercise (Mind you Idefinitely have no intention of creating a "command" economy!). Onecardinal rule is budget exhaustion. That is, after the bell announcing theopening of the market, the consumer side, i.e., group C, must spend all of itsincome on the good sold by the producer side, i.e., group P. The second ruleis that the market clearing price for the pencil is one dollar each (sometimes,this rule needs not be stated explicitly). The third rule makes this economy
21
Journal of Economics and Economic Education Research, Volume 5, Number 1, 2004
a debt-free one meaning that borrowing is forbidden, so that the moneysupply will stay constant during the first phase of the experiment.
Once the economy completes its first round of exchange, group C,which represents the demand side of the market, should now have all of thegood and no money, and conversely, group P (supply side) should now haveall of the money and no good. I then ask the class to figure out nationaloutput of this economy in monetary terms, based on the Fisherian expression3 (p x Q). The students have no problem finding the answer: nominal GDP= $1x15 = $15. My next question to them is about nominal GDP, using thevelocity approach. I give them the formula, nominal GDP = M x V, and thedefinition of velocity as the turnover rate of M, i.e., the number of times themoney supply M is exchanged. Again, the student's answer comes readily:nominal GDP = $15 x 1 = $15. Eureka! MV = pQ (This formulation of thequantity theory, and its variations, MV = PT, MV = Py, is due to IrvingFisher (1911), one of the first and most ardent defender of that theory in thetwentieth century). Upon inquiry, I have learned that the first round of simulation has enabledmy students to visualize in concrete terms how one measures V, M, nominalGDP, and real GDP. To reinforce their comprehension, I ask my classroomeconomy to engage in a second round of exchange identical to the first.However, this time, for variety's sake, I use pens instead of pencils (the classstill keeps the previous quantity of pencils) and I give one pen to each of themembers in group C, the side that has pencils at this point. (To avoidinterruption, there is a reversal of role, so that the side that has pencils, i.e.,group C, now becomes the supply side). Thus, in this second phase of theexercise, one side has 15 pencils and 15 pens and the other side has $15.Again, the market equilibrium price of each pen is also supposed to be onedollar, and the side that holds money will now buys pens from the other side.The same ground rules apply (budget-exhaustion, no debt, and so on). Whenthe second round of transaction is completed, I ask my class to figure out thelatest nominal GDP figure, using the familiar expression 3 (p x Q). Thecorrect answer comes from my class as readily as the first time, namely,nominal GDP = ($1x15 pencils) + ($1x15 pens) = $30. To test theirmastering of the velocity concept, I also ask them to calculate the nominal
22
Journal of Economics and Economic Education Research, Volume 5, Number 1, 2004
GDP using the velocity approach. Once again, the students have nodifficulty meeting the challenge: MV = $15 x 2 = $30. The supply ofmoney has changed hand twice. Thus, to my class, it appears that theequation of exchange as an identity, MV = pQ, has been established beyonda doubt.
Changing The Money Supply
I take a further step to help the student relate to the link of thequantity of money to prices. This time, I start the simulation over again bytaking back all the goods and money from this economy. I then give eachstudent in one group two dollars, and each student in the other group onepencil. I ask those who have the money to spend all their money on the goodoffered for sale by the other group, i.e., per budget-exhaustion assumption.With that restriction, the "equilibrium market" price jumps to two dollars foreach unit of the good, namely pencils. Every class member realizes that thiseconomy has experience one hundred percent inflation. Why? The moneysupply M is doubled, of course. However, what happens to nominal income?The answer is apparent: nominal GDP = 3(p x Q) = $2 x 15 = $30. Usingthe alternative approach, MV = $30 x 1 = $30. In short, by comparison withthe result of the first round of simulation where GDP = $15, the conclusionhere is that doubling the money supply doubles the price, hence highernominal income, leaving real income Q constant. This situation is known asthe neutrality of money: it is simply a veil. A change in the money supplychanges the price level, while leaving the real macro variables untouched!We have taken the first step to try to understand the quantity theory. Furtherelaboration and explanation are needed, and some historical grounding wouldbe an appropriate place to start.
A HISTORICAL BACKGROUND
From a historical perspective, some crude forms of the quantitytheory can be traced back to the times of antiquity in China and Rome. Intheir writings, disciples of Confucius (551-479 BC) such as Ma-twan-lin and
23
Journal of Economics and Economic Education Research, Volume 5, Number 1, 2004
Chia Yi, and of Socrates (470-399 BC) such as Xenophon had discussed theabout the importance of value of money, its relation to prices, in a broadcontext of demand and supply of money and goods (Hegeland 1969). Oneof their concerns was the attempt to understand what determines the value ofmoney and how to keep that value stable. Some authors (e.g., Marget 1942;Hechscher 1935; Kemmerer 1907) believe that the Roman lawyer JuliusPaulus to be the first expositor of the quantity theory. However, there wereauthors who maintained that Davanzati is first economic writer who dealtwith the specific issue raised by the quantity theory in its modern form(Hegeland 1969). Davanzati was once the head of the Mint House of Naplesand was the author of a book published in 1588 that contains what isconsidered as the original statement of the quantity theory by linking thequantity of money to the value of the quantity of goods. Other classicalcontributors to the quantity theory include such writers as John Locke, DavidHume, Richard Cantillon, David Ricardo, and John Wheatley. To thesewriters and early theorists, the common elements essential to the quantitytheory are 1) constant proportionality between the quantity of money andprice, 2) money-to-price causality, 3) neutrality of money, (4) independenceof demand and supply of money, and 5) real causes and monetary causes ofchanges in absolute and relative price (Humphrey 1997; Patinkin 1995).Modern versions of the quantity theory are often associated with KnutWicksell (1898, 1906) and Irving Fisher (1911). While Fisher was the firstto express the quantity theory in its contemporary form, emphasizing theequiproportionality of money and prices, Wicksell focused on thereal-balance effects and argued that short-run price fluctuations generateefforts by wealth-owners to take appropriate measures to stabilize their realbalances. In other words, Wicksell maintains that both supply and demandof money play a role in determining the price level (Humphrey 1997, pp.76-77)
Many economists think that Fisher, the Yale economist, is the authorresponsible for formulating the definitive version of the quantity theory.Fisher started out with the equation of exchange, which "...relates to all thepurchases made by money in a certain community during a certain time."(Fisher 1922, p. 16). Therefore, "the equation of exchange is simply the sum
24
Journal of Economics and Economic Education Research, Volume 5, Number 1, 2004
of the equations involved in all individual exchanges in a year." (Fisher 1922,p. 16). Hence, in Fisher's own words, MV = 3pQ. Alternatively, if P is theweighted average of all the p's and T is the sum of all the Q's, then accordingFisher, the above equation of exchange can be reformulated as MV = PT.This is same as the expression we use for our simulation purpose as seenabove. Fisher left little doubt that the place to start the quantity theory is theequation of exchange, which he saw essentially as an identity. Hesummarized his exposé in three concise propositions, which he calledtheorems, in this way (Fisher, 1922, p. 26):
(1) If V and the Q's remain invariable while M varies in any ratio, themoney side of the equation will vary in the same ratio and therefore its equal,the goods side, must vary in that same ratio also; consequently, either the p'swill all vary in that ratio, or else some p's will vary more than in that ratioand others enough less to compensate and maintain the same average.
(2) If M and the Q's remain invariable while V varies in any ratio, themoney side of the equation will vary in the same ratio, and therefore itsequal, the goods side, must vary in that ratio also; consequently, the p's willall vary in the same ratio or else some will vary more and others enough lessto compensate.
(3) If M and V remain variable, the money side and the goods sidewill remain invariable; consequently, if the Q's all vary in a given ratio,either the p's must all vary in the inverse ratio or else some of them will varymore and others enough less to compensate.
Succinctly, other terms being equal,
1) M 896 P 89, 2) V 896 P 89, and 3) Q 896 P 89
According to Fisher, proposition (1) above "constitutes the quantitytheory of money." In his words, "...the level of prices varies directly with thequantity of money in circulation provided the velocity of circulation of thatmoney and the volume of trade...are not changed." (Fisher 1922, p. 14). Oneis not likely able to find a more forceful statement of the equation ofexchange in the literature. Briefly, the quantity theory of money is theproposition that, with velocity constant, changes in the money supply are
25
Journal of Economics and Economic Education Research, Volume 5, Number 1, 2004
reflected in a proportionate increase in nominal income. Finally, Fisherargued that the definition of money must be broadened to include demanddeposits. He pointed out that even though the original formulation of theequation of exchange is correct, it is an error to leave consumer bank depositsout of the equation. So, if M' is the "total deposits subject to transfer bycheck and V' is the "average velocity of circulation," then a completeequation of exchange must read as MV + M'V' = 3pQ.= PT
According to Hegeland (1969), Kemmerer (1907) was among the firstwriters to use a variation of the equation exchange for statistical work.Kemmerer's formulation was MR = NEP or P = MR/NE, where M refers tothe quantity of money in circulation, R the number of time M is turned overin a period, N the quantity of the goods exchanged, E the number of times Nis exchanged and P the average price of the goods. In that formulation, MRcan be interpreted as the money supply and NE the good supply. Then,changes in the price can be attributed to changes in N, E, R and not justchanges in M.
Milton Friedman is most closely associated with the "monetarist"school of thought. Although Friedman did not pretend to give an exactexpression to the quantity theory, which he argues is a theory about demandfor money rather a theory of output or price, he made a serious attempt tosynthesize a rather loose oral tradition at the University of Chicago regardingmonetary theory (The Chicago "school", as it is sometimes referred to, isassociated with Henry Simmons, Lloyd Mints, Frank Knight, Jacob Viner,and, of course, Milton Friedman himself). To expose his ideas, however,Friedman relied on the classic equation of exchange but reformulated tomake his point. Friedman started out with a demand for money equation, inwhich demand for money M is a function of the price level P, interest onbond rb, interest on equity re, the rate of change in prices, the ratio ofnon-human to human wealth w, money income Y, and a variable standing fortastes and preferences. Assuming the demand for money function ishomogeneous of degree one, he then derived the equation in "the usualquantity theory form" as follows:
Y = v(rb, re , e, 1/PAdP/dt, w, Y/P, u) . M
26
Journal of Economics and Economic Education Research, Volume 5, Number 1, 2004
Thus, according to Friedman, demand for money is a function of real incomeand the cost of holding money. As discussed below, the above equationserves as a theoretical underpinning for the monetarist policy prescription onmonetary policy.
SUBSTANTIVE ISSUES AND CONTENDING PERSPECTIVES
In the form of the equation of exchange, the quantity theory tells avery simple story. The monetary value of goods and services produced (pQor Py) must be identically equal to the amount of money spent on them (MV)(Fisher also called the latter, "expenditure," 1991, p 24). This is evident fromthe results of the simulation. However, as a theory, the functionalrelationship between the terms is what makes the equation of exchange atheory. Consequently, theoretical and policy implications of the quantitytheory need to be explored. The rest of this paper addresses two issues; onerelates to the meaning of money and the other, the role of money on stabilityand growth.
What is Money?
As seen earlier, Fisher is one the earliest modern economist to definemoney to include demand deposits and checks. His emphasis is thus on themedium-of-exchange function of money. Friedman's definition of money distinguishes between two approaches. Thetransaction approach stresses the medium-of-exchange function and thecash-balances approach focuses on the store-of-value function (Friedman1971). According to the monetarist approach, money is considered as anexogenous variable over which the government has considerable control.This is the transaction approach to money. By changing credit availabilitythrough its tools of monetary policy, the government can effectively changethe money supply. Changes in credit availability have a direct impact oneconomic activity through investment and consumption expenditures. Butaccording to monetarists, such power is destabilizing, because it is powerful.Inability to diagnose correctly the source of macro instability and failure to
27
Journal of Economics and Economic Education Research, Volume 5, Number 1, 2004
act at the proper time has tended to make discretionary monetary policycounterproductive.
Does Money Matter?
As mentioned earlier, the quantity theory of money posits that pricesand the supply of money vary positively and proportionately, i.e.,equiproportionality. What this means is that equiproportionaliy is present inboth the equation of exchange as an identity and the equation of exchange asa quantity theory. Fisher based that conclusion on his macro studies in whichhe found that in the long run, changes in M does not affect V or T (or Q). Heconsiders V stable (in the long run) and independent of the other variables inthe equation. However, in transition, that is at certain time before theequation of exchange has a chance to re-establish itself, changes in M mayaffect V and T (Fisher 1911, pp. 158-60). Put differently, Fisher's "transitionperiods" are the times when the economy adjusts to prices changes inducedby changes in money supply. Thus, while Fisher admits the possibility thatthe monetary variables can affect the real variable, he argued that temporarilythe link between money and prices may be weak, but in the end,equiproportionaliy will reassert itself. Fisher was unequivocal about theneutrality of money:
...(except during transition periods) the volume of trade, like the velocity of circulationof money, is independent of the quantity of money. An inflation of the currency cannotincrease the product of farms and factories, nor the speed of freight trains or ship. Thestreams of business depend on natural resources and technical conditions, not on thequantity of money. (Italics mine).
How then do changes in money supply affect the real variables duringthe "transition period"? Again, Fisher's position is that the initial changes inprices provokes a chain reaction in the money and good markets, affectingvelocity, interest rate, profits, and business activities. Fisher describes thecumulative process in a transitional sequence as follows. When monetarydisturbance occurs, prices ("The price level is normally the one absolutely
28
Journal of Economics and Economic Education Research, Volume 5, Number 1, 2004
passive element in the equation of exchange," Fisher 1911, p. 172) rise,which increases velocity, which leads to increase in profits, loans, andeconomic activities, i.e., the Q's. (Fisher 1911, p. 63).
In short, given his preoccupation with the purchasing power of money(the title of his classic 1911 book), as a forerunner of the contemporarymonetarist school, Fisher's quantity theory can be thought of as a theory ofprices, or be more precise, theory of long-run price behavior. The policyprescription that flows from the works of Fisher and other early monetaristsis that the key to macro stability lies in keeping prices stable through controlof the money supply.
A major difference between the early monetarists and thecontemporary or later monetarists is the way changes in money supply affectprices and output. While the former sees the effect level of money supply onoutput through changes in the prices, velocity, interest rate, and profit, thelatter describes the transmission mechanism in terms of the theory of demandfor money. The monetarist theory of demand for money, as reflected inFriedman's work (Friedman 1971), posits that for wealth-holders, how muchmoney they want to hold depends on their income, wealth, interest rates, rateof returns on financial assets, and rate of change in the prices of goods.Changes in the supply of money cause changes in prices, hence inwealth-holders' real balances, which in turn prompts them to adjustment theirportfolio. To the extent that wealth-holders take action to realign theirexpenditures to reflect changes in their real balances, this adjustmentendeavor affects real variables such as investment and consumption, whichaffects economic activities. In short, one may say that monetary changesaffect production and output in the short run through real-balance adjustmenteffects. Friedman provides his statement of the quantity theory as follows:
...the empirical generalization that changes in the desired real balances (in the demandfor money) tends to proceed slowly and gradually or to be the result of events set intrain by prior changes in supply, whereas, in contrast, substantial changes in the supplyof nominal balances can and frequently do occur independently of any changes indemand. The conclusion is that substantial changes in prices or nominal income areinvariably the result of changes in the nominal supply of money (Friedman 1968).
29
Journal of Economics and Economic Education Research, Volume 5, Number 1, 2004
Thus, the monetarist view about the quantity theory is that money doesmatter and that the quantity of money M influences economic activities andthrough which, real macro variables such as consumption, investment, andreal and nominal income. In addition, like the early monetarist writers,Friedman posits that velocity is more stable than Keynes's investmentmultiplier. The later monetarists point to the high correlation between themoney supply and nominal GDP as a proof that velocity is stable. Friedman's monetary research led him to conclude that money is a betterpredictor of income than investment. The research of Friedman andSchwartz and other monetarists shows that recessions have tended to followstrong deceleration in the money supply. Contrary to the Keynesian viewthat the spending of money is more important for economic stability andgrowth, the monetarist view keeping the supply of money honest, i.e., in linewith changes in productivity, is the key to stabilization policy. ThusFriedman's policy prescription is to keep the growth of money supply stableand predictable.
On the other hand, Friedman warned against any tendency to equatehis demand for money equation with a theory of income determination. Infact, he was quite explicit about that:
Suppose the supply of money in nominal units is regarded as fixed ormore generally autonomously determined. Equation (13) [given above] thendefines the condition under which this nominal stock of money will be theamount demanded. Even under these conditions, equation (13) alone is notsufficient to determine money income. In order to have a complete model forthe determination of money income, it would be necessary to specify thedeterminants of the structure of interest rates, of real income, and the path ofadjustment in the price level. (Friedman, 1956, p. 15).
The Keynesian Perspective
Kahn (1984) describes the formation of Keynes as an economist as"a struggle to escape from the stranglehold of the Quantity Theory [ofMoney.]". Keynes was initially attracted to the classical quantity theorybecause he saw it as providing a reasonable framework to tackle the problem
30
Journal of Economics and Economic Education Research, Volume 5, Number 1, 2004
of short run economic instability. This situation clearly shows the influenceof Knut Wicksell on Keynes'economic thought. Keynes himself was workingon compiling price statistics to deal with the problem of inflation. In hisearly writing, Keynes went along with the Wicksellian thinking that the pricelevel varies proportionately with the supply of money. For a long time,Keynes believes that monetary policy is an effective stabilization tool(Skidelsky 1995).
However, with the publication of his General Theory, Keynes nolonger believes that in the equation of exchange, the level of output Q is anindependent variable as the early monetarists had assumed. With thatdeparture, Keynes and his followers argue that the quantity of money has aweak relation to output. Monetary is a largely ineffective stabilization policybecause increases in the money supply are absorbed into cash balances,causing velocity to fall. So any variation in the money supply is offset bychanges in velocity in the opposite direction, so as to leave aggregate demandunchanged. That being the case, the link between M and nominal incomeadvocated by the monetarist would cease to exist. To Keynes, the strengthof monetary policy is diluted by the existence of the liquidity trap and thefact that investment can be interest-inelastic. Keynes saw the link betweenthe supply of money on the price level and real output to be a complex one.For example, in one of his class lectures, he argued that "ceteris paribus, thechain of causation is: increase in the volume of money -fall in the rate ofinterest-increase in the volume of investment -increase in the volume of output-through diminishing returns in the shortperiod and a rise in the wage units, a rise in prices." (Rymes 1989). (italicsin the original).
Central to Keynes' theory on monetary policy is the importance ofmoney as a store of value and his liquidity preference theory associated withthat function of money. This is sharp contrast with the Wicksellian conceptof money that stresses its medium-of-exchange function. The implication ofKeynesian monetary analysis is clear: fiscal policy based on taxes andspending is the more effective tool to address instability problem regardingoutput and employment. In other words, the Keynesians believe that the
31
Journal of Economics and Economic Education Research, Volume 5, Number 1, 2004
supply of money is less important than the spending of money because thelatter affects aggregate demand and output directly.
CONCLUDING REMARKS
The outcome of this simulation exercise has been that the studentsseemed to enjoy a fresh change of venue and gain a better understanding ofequation of exchange, a clearer idea about the quantity theory as a theoryabout money, price, and income. Although simplistic in its construct, thesimulation seemed capable of making more accessible to many studentssome of the main ingredients of macroeconomics and the linkages betweenthem. In addition, the students gain a deeper perspective of the variouscontending viewpoints and policy prescriptions. Needless to say, one cancome up with variants of the design described here. As is often the case, anypedagogical device aimed at bringing the "real" world into the classroom isalways a welcome learning experience for the students and faculty involved.Our experiment affirms this.
As an effective teaching tool thanks to its simplicity, or perhapsbecause of it, this exercise faces a number of limitations. In the first instance,the model underlying the simulation is one of comparative statics. Thischaracteristic is clear as the instructor moves his "simulated economy" fromone phase to the next. For example, as that economy doubles its output from15 units (goods) to 30 units, the quantity of money being held constant (at$15), nominal income also doubles. Similarly, with a constant quantity ofgoods, when the quantity of money doubles, the price also doubles. Thedynamic process of change in income, real and nominal, and changes in theprice level cannot be demonstrated by the exercise. The students witness thechange as an outcome and not as a process, so that what they actually see arelike snapshots. Here, one hopes that the students use their imagination tovisualize the successive phases of economic changes as the economy movesfrom one phase to the next. They have to fill in the frames between differentscenes of a film script, so to speak.
32
Journal of Economics and Economic Education Research, Volume 5, Number 1, 2004
REFERENCES
Fisher, I. (1911). The Purchasing Power of Money: Its Determination and Relation toCredit, Interest, and Crises. New and revised edition, 1922. New York: McMillan,1922. Reprinted by Augustus M. Kelley, 1963, 1971 (1922 edition).Friedman,Milton (Ed.) (1956). Studies in the Quantity Theory of Money. Chicago:University of Chicago Press
Fisher, I. (1968). Money: Quantity Theory. International Encyclopedia of the SocialSciences, 434.
Fisher, I. 1971). A Theoretical Framework for Monetary Analysis. NBER Occasional Paper112. New York: Columbia University Press.
Heckscher, E. F., (1935). Mercantilism. Two vols., transl. by M. Shapiro, London. Vol. II,225
Hegeland, H. (1969). The Quantity Theory of Money. New York: Augustus Kelly, 83.
Humphrey, T. M. (1997). Fisher and Wicksell on the Quantity Theory. EconomicQuarterly, Federal Reserve Bank of Richmond, 83(4), 72-73.
Kemmerer, E. (1907). Money and Prices, New York, 2.
Kemmerer, E. W (1907). Money and Credit Instruments in Their Relation to General Price.New York, 13.
Kahn, R. F. (1984). The Making of the Keynesian Revolution. London: 50-51.
Laidler, D. (1991). The Quantity Theory is Always and Everywhere Controversial-Why?The Economic Record, 67(199), 289.
Marget, A. W. (1942). The Theory of Prices, 2 vols. New York, vol. I, 9.
Patinkin, Don (1995). Concluding Comments on the Quantity Theory. In Mark Blaug (Ed.),The Quantity Theory of Money from Locke to Keynes and Friedman. Aldershot,England: Edward Elgar, 72-73.
Rymes, T. K. (1989). Keynes's Lectures, 1932-35 : Notes of a Representative Student. AnnArbor: University of Michigan, 156.
33
Journal of Economics and Economic Education Research, Volume 5, Number 1, 2004
Skidelsky, R. (1995). J. M. Keynes and the Quantity Theory of Money. In The QuantityTheory of Money - From Locke to Keynes and Friedman, Hants, England: EdwardElgar Publishing Company.
Wicksell, K. (1989). Interest and Prices. Translated by R. F. Kahn. London: Macmillan,1936, reprinted, New York: Augustus M. Kelley, 1978.
Wicksell, K. (1906). Lectures on political Economy. Vol. 2, "Money." Translated by E.Classen. Lionel Robbins (Ed.), London: Routledge and Kegan Paul, 1935,reprinted New York: Augustus M. Kelley, 1978.

34
Journal of Economics and Economic Education Research, Volume 5, Number 1, 2004
35
Journal of Economics and Economic Education Research, Volume 5, Number 1, 2004
ECONOMICS IN THE INTEGRATEDBUSINESS CURRICULUM: IN or OUT?
Ismail H. Genc, University of IdahoSelahattin Bekmez, Mugla University
Jon R. Miller, University of Idaho
ABSTRACT
We analyze the unique experiment of teaching junior level economics tobusiness students at the University of Idaho within the framework of the IntegratedBusiness Curriculum (IBC). Economics was originally directly embedded in the IBCprogram, but later became an independent course to be taught in conjunction withthe IBC. We look at the costs and benefits of teaching economics within and outsideof IBC. We use concepts and criteria borrowed from software engineering, todevelop what we call The Three C's of Curriculum Development, Cohesion,Coupling and Cost.
JEL Classification: (Primary) A22, (Secondary) I21
INTRODUCTION
The idea of integrating a common body of business courses has gained wideacceptance within the academic and professional business communities. In recentyears, the American Assembly of Collegiate Schools of Business (AACSB) has beenactively promoting such integration, noting that without integration the traditionalbusiness education could become out of touch with the reality of the business world(Smith, 1995).
The general literature on various innovative teaching methods has growndramatically as a response to demands for change and is far too large to list all here.(However, interested readers may also refer to Stover et al. (1997), Dangerfield andBailey (1996), and Cluskey et al. (2001) on issues related to integratedundergraduate education.) We focus here on studies, which concentrate on devisingmethods in business schools to improve the managerial skills of the graduates(among others, see Pharr and Morris (1997), Byrne (1993), and Lataif (1992)). The

36
Journal of Economics and Economic Education Research, Volume 5, Number 1, 2004
arguments about the improvement usually focus on adapting a system that has"cross-functional" integration or interdisciplinary and team-based approaches tobusiness problems (Miller, 2000).
A common point in this literature is that business students should learnmanagement skills in a team-based environment, not in the traditional textbook way.Many companies are dissatisfied with the education and research coming out oftraditional business programs, and thus have turned more to in-house training(Leonard, 1992). Also, as Mintzberg (1992) points out, the graduates of businessschools are parachuted into mid-level companies with authority over people whohave vast knowledge in on-the-ground business and customer relations, thus creatinga two-tier system. A boss has formal education, but not enough experience on oneside, and an employee knows the customers, market conditions, and businessenvironment, but has less formal education.
This in no way means that everybody has dropped the so-called traditionalteaching models. As a matter of fact Jacobs (1991), Pharr et. al. (1998), Cotton(1982), St. Clair and Hough (1992) and Mason (1996) warn those who rush tointegrative programs about problems created by the newly invented methods suchas teacher knowledge, assessment, commitment from the faculty members and theirinstitutions.
A few undergraduate business programs listened to the demands of thebusiness world and attempted to develop new integrative programs. However, thescope and content of an integrative program varies from school to school, or evenfrom year to year within the same school. No undergraduate program, however, ismore integrated than that of the University of Idaho College of Business andEconomics (UI CBE).
Furthermore, many business programs embarked on a curriculumdevelopment process to survive in the competitive educational market, andespecially to improve employment prospects for their graduates. The College ofBusiness and Economics at the University of Idaho is an example of an institutionthat has adopted the policy to review the curriculum constantly. Its IntegratedBusiness Curriculum (IBC) is the result of these efforts.
One specific challenge for program designers is to incorporate the relevantdisciplines of economics and accounting into the program. In this study, we considerthe position of economics vis-à-vis the IBC at the UICBE. In the first format of theIBC, economics was a direct part of the program, spread throughout it. In the latterformat, it is a separate course with close cooperation with the IBC.
37
Journal of Economics and Economic Education Research, Volume 5, Number 1, 2004
Miller (2000) analyzes the costs and benefits of fully integrating economicsinto IBC as in the earlier format. Nevertheless, the later innovation in the structureof the program, which can be attributed partly to the academic aspirations but alsoto economic constraints, as well, necessitates a fresh look at the pluses and minusesof economics education within the integrated business curriculum framework.
In other words, in this analysis, we try to compare the cost and benefit oftwo alternative methods of economic education within the integrated businesseducation framework. The first option is the full merger of the economics materialwithin the integrated business curriculum, not necessarily as a distinctivelyidentified module but rather as support material to all business issues beingdiscussed in the modules. The second option is to take economics out of theintegrated business curriculum and make it into a semi-independent course under adifferent title, but in close cooperation with the integrated business curriculumprogram.
We will try to evaluate the costs and benefits of the two arrangements withthe help of criteria borrowed from software engineering and economics.
ECONOMICS IN THE UNIVERSITY OF IDAHO IBC
Faculty in the IBC team-teach six cross functional, interdisciplinaryjunior-level business modules made up of the content previously found in thestand-alone courses, marketing, finance, production and operations management,information systems, human resource management, quantitative methods, andinternational business. The whole program is developed on an hour-by-hour basisfor the entire year by the faculty team during the summer. It normally is spread overtwo consecutive semesters
Economics now has a special status in the program. Originally economicswas fully integrated into IBC like the standard business disciplines. But in the mostrecent format, economics is taken out of the main body of IBC, delegating itscontent to a separate course to be taught in coordination with it. Accounting, too, hasbeen recently incorporated into the system in a manner similar to that of economics.
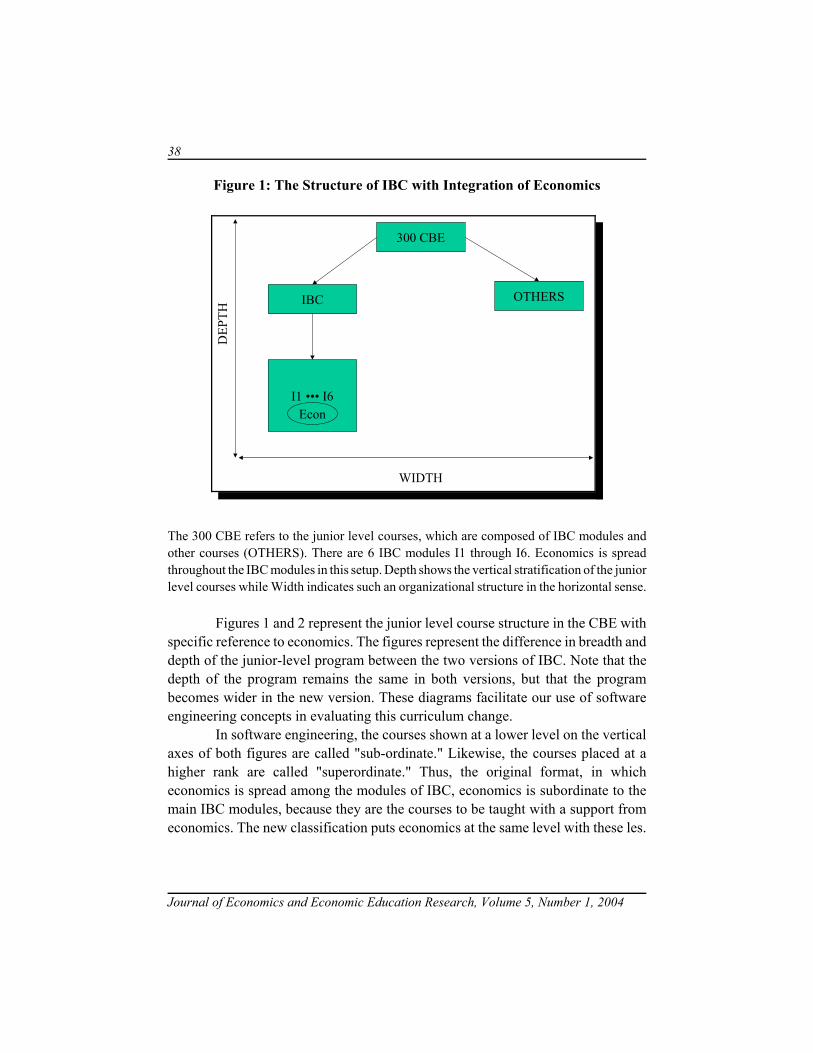
38
Journal of Economics and Economic Education Research, Volume 5, Number 1, 2004
Figure 1: The Structure of IBC with Integration of Economics
300 CBE
IBC OTHERS
I1 ••• I6
WIDTH
DEP
TH
Econ
The 300 CBE refers to the junior level courses, which are composed of IBC modules andother courses (OTHERS). There are 6 IBC modules I1 through I6. Economics is spreadthroughout the IBC modules in this setup. Depth shows the vertical stratification of the juniorlevel courses while Width indicates such an organizational structure in the horizontal sense.
Figures 1 and 2 represent the junior level course structure in the CBE withspecific reference to economics. The figures represent the difference in breadth anddepth of the junior-level program between the two versions of IBC. Note that thedepth of the program remains the same in both versions, but that the programbecomes wider in the new version. These diagrams facilitate our use of softwareengineering concepts in evaluating this curriculum change.
In software engineering, the courses shown at a lower level on the verticalaxes of both figures are called "sub-ordinate." Likewise, the courses placed at ahigher rank are called "superordinate." Thus, the original format, in whicheconomics is spread among the modules of IBC, economics is subordinate to themain IBC modules, because they are the courses to be taught with a support fromeconomics. The new classification puts economics at the same level with these les.
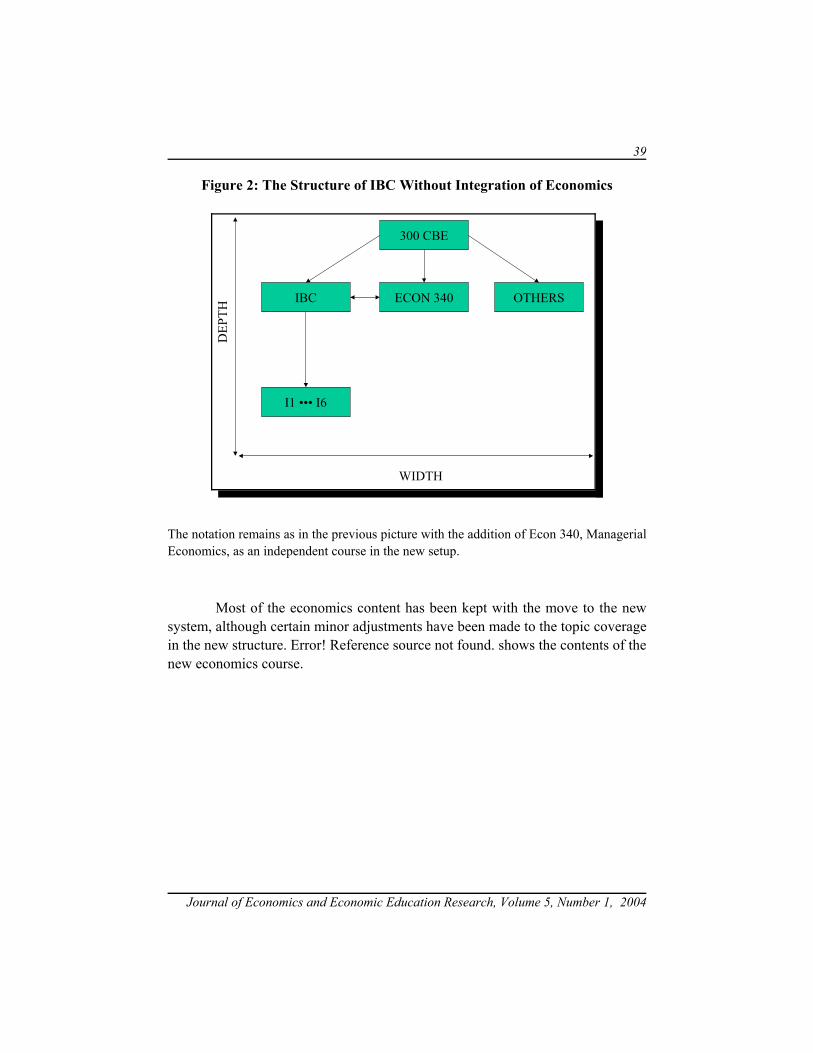
39
Journal of Economics and Economic Education Research, Volume 5, Number 1, 2004
Figure 2: The Structure of IBC Without Integration of Economics
300 CBE
IBC ECON 340 OTHERS
I1 ••• I6
WIDTH
DEP
TH
The notation remains as in the previous picture with the addition of Econ 340, ManagerialEconomics, as an independent course in the new setup.
Most of the economics content has been kept with the move to the newsystem, although certain minor adjustments have been made to the topic coveragein the new structure. Error! Reference source not found. shows the contents of thenew economics course.
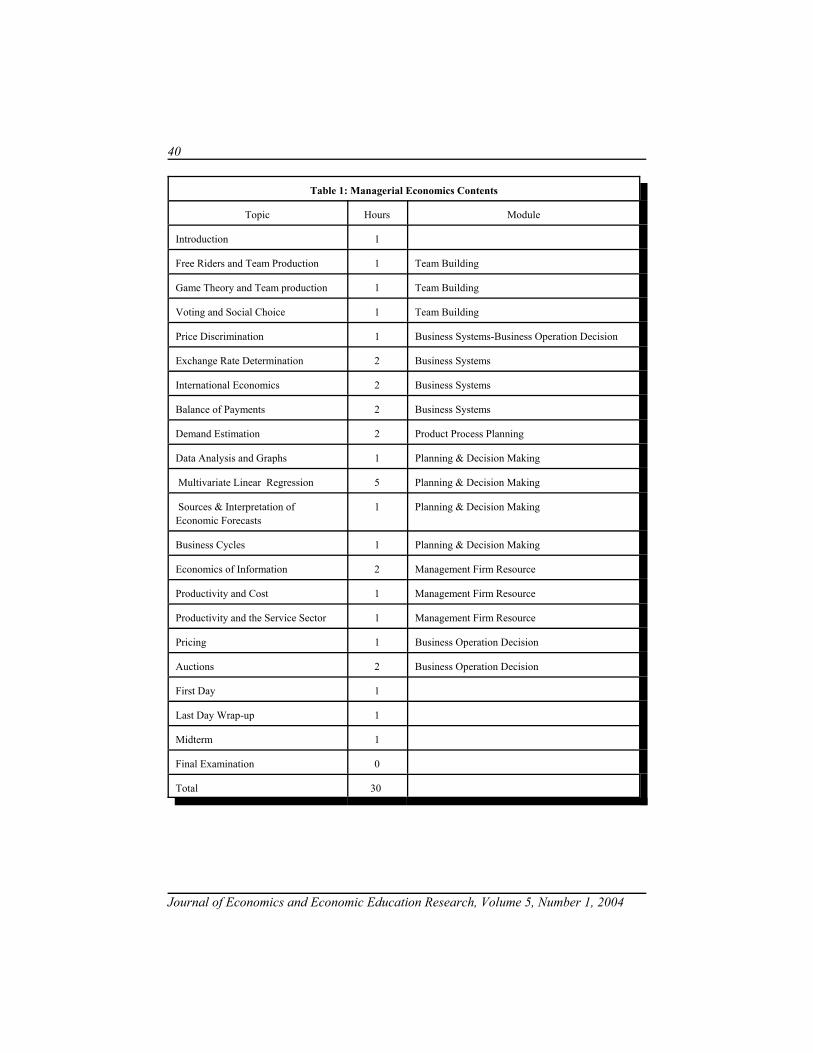
40
Journal of Economics and Economic Education Research, Volume 5, Number 1, 2004
Table 1: Managerial Economics Contents
Topic Hours Module
Introduction 1
Free Riders and Team Production 1 Team Building
Game Theory and Team production 1 Team Building
Voting and Social Choice 1 Team Building
Price Discrimination 1 Business Systems-Business Operation Decision
Exchange Rate Determination 2 Business Systems
International Economics 2 Business Systems
Balance of Payments 2 Business Systems
Demand Estimation 2 Product Process Planning
Data Analysis and Graphs 1 Planning & Decision Making
Multivariate Linear Regression 5 Planning & Decision Making
Sources & Interpretation ofEconomic Forecasts
1 Planning & Decision Making
Business Cycles 1 Planning & Decision Making
Economics of Information 2 Management Firm Resource
Productivity and Cost 1 Management Firm Resource
Productivity and the Service Sector 1 Management Firm Resource
Pricing 1 Business Operation Decision
Auctions 2 Business Operation Decision
First Day 1
Last Day Wrap-up 1
Midterm 1
Final Examination 0
Total 30
41
Journal of Economics and Economic Education Research, Volume 5, Number 1, 2004
THE THREE Cs OF CURRICULUM EVALUATION
The biggest hurdle in analysis of curriculum change is surely the yardstickwith which the cost-benefit analysis is carried out. Though we recognize thenear-impossibility of creating a universally acceptable quantitative criterion, weemploy a qualitative analysis, based on concepts borrowed from softwareengineering. These concepts suggest the characteristics of "good" software, and webelieve they can apply to innovations in the education field as well. Morespecifically, we will make use of the software engineering concepts cohesion andcoupling. By adding a third concept, namely cost, we have what we call the ThreeCs of Curriculum Evaluation. To our knowledge, this is a novel method ofinterdisciplinary program evaluation.
In software engineering, Stevens et al (1974) were the first to introduce thenotion of cohesion, an ordinal scale of seven levels that describes the degree towhich the actions performed by a module contribute to a unified function. That is,"cohesion is a measure of one-ness of a module" (Rinker, 2002). Cohesion showsthe functional strength of a module.
According to Stevens et al. (1974) and Yourdan and Constantine (1979) theidea of coupling was introduced about the same time as cohesion. Coupling is "ameasure of interconnection among modules" (Rinker, 2002). In computer sciencejargon high cohesion and low coupling are desirable characteristics of goodsoftware. Nevertheless, empirical research has shown that most of the time the twoconcepts are inversely correlated for any software program. These concepts,cohesion and coupling, have found their places in standard computer sciencetextbooks. (See for example, Friedman and Friedman (2000).) Cost, on the otherhand, is the economic opportunity cost as explained further below.
In applying these criteria to the question at hand, we try to analyze "qualityimprovements" obtained as a result of a policy change, Q, from one mode ofeconomics instruction to another. Q is assumed to be directly proportional to thevariables, cohesion, coupling, and cost, to yield a relationship that can be expressedas
1. Q=f(Cohesion, Coupling, Cost)
where f stands for any functional form. The exact specification of f turns out to beimmaterial here. The question, we have to analyze is the partial impact of the righthand side variables on the dependent variable.
42
Journal of Economics and Economic Education Research, Volume 5, Number 1, 2004
Slightly drifting away from software engineering methods of evaluation, weconcentrate on the cost and benefit of policy changes on the subjects affected fromthese changes. Thus, in the rest of the paper, we define the 3C concepts within theframework of economics, and carry out a cost-benefit analysis for several categoriesof individuals such as students, economics faculty, the UI CBE faculty, etc., who aredirectly or indirectly affected by the reorganization. The categories are based on thelist identified by Miller (2000).
EVALUATION OF THE ECONOMICS/IBC CURRICULUM CHANGE
As in software engineering, we define cohesion as a measure of "one-ness"of the contents of the IBC program. In other words, if all the courses which are partof IBC serve one purpose only then is IBC highly cohesive. Any divergence fromthat phenomeonon contributes to dilution in the cohesiveness. The more cohesivea structure is, the more specialized it is in its job. Because economics is not a corebusiness topic, and IBC is mainly a regrouping of the several business disciplinesas mentioned above, taking economics out makes IBC more cohesive in this sense.
Coupling measures how each part within IBC connects to other parts.Although IBC becomes more cohesive with the exclusion of economics, it is a factthat all current modules of IBC need economics support in one way or another.Economics perhaps is the most common denominator of all modules. By takingeconomics out, it is more difficult to see the theoretical connection among topicsconsidered within IBC. Thus, there is less coupling within IBC after the departureof economics. In fairness to software engineering, let us acknowledge that we areinterpreting coupling in a totally different way here, which in a sense contradicts themeasure of "good" software. We see more coupling to be better as opposed to worseas is the interpretation in software engineering.
Cost is probably the most economically familiar concept of the Cs. Weconsider cost to be the opportunity cost of not having economics as part of IBC.
Our strategy is to look at the two scenarios, one with economics in IBC andother outside it, and consider the cohesion and coupling involved. We then relatethis to the consideration of cost for the parties involved. This allows us to rewriteequation 1 for cost. Assume that for a given level of quality, Q0, the cost functioncan be expressed as
2. C=g(Cohesion, Coupling, Q0)
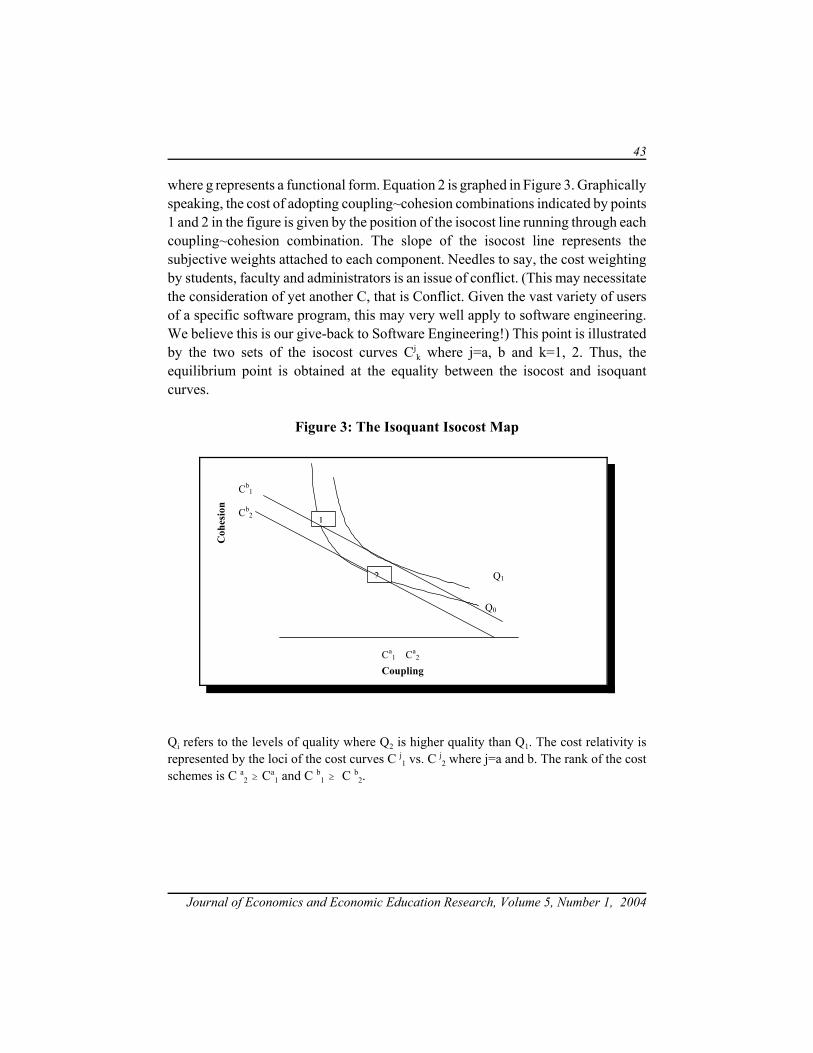
43
Journal of Economics and Economic Education Research, Volume 5, Number 1, 2004
where g represents a functional form. Equation 2 is graphed in Figure 3. Graphicallyspeaking, the cost of adopting coupling~cohesion combinations indicated by points1 and 2 in the figure is given by the position of the isocost line running through eachcoupling~cohesion combination. The slope of the isocost line represents thesubjective weights attached to each component. Needles to say, the cost weightingby students, faculty and administrators is an issue of conflict. (This may necessitatethe consideration of yet another C, that is Conflict. Given the vast variety of usersof a specific software program, this may very well apply to software engineering.We believe this is our give-back to Software Engineering!) This point is illustratedby the two sets of the isocost curves Cj
k where j=a, b and k=1, 2. Thus, theequilibrium point is obtained at the equality between the isocost and isoquantcurves.
Figure 3: The Isoquant Isocost Map
2
1
Q0
Q1
Coupling
Coh
esio
n
Ca1 Ca
2
Cb1
Cb2
Qi refers to the levels of quality where Q2 is higher quality than Q1. The cost relativity isrepresented by the loci of the cost curves C j
1 vs. C j2 where j=a and b. The rank of the costschemes is C a
2 $ Ca1 and C b
1 $ C b2.
44
Journal of Economics and Economic Education Research, Volume 5, Number 1, 2004
We will next analyze the costs and benefits of the two alternative modes ofteaching economics within the construction of IBC with the tools explained above.
ANALYSIS OF COSTS-BENEFITS OF ECONOMICSIN OR OUT OF IBC
Students
With economics out of IBC, the increased cohesiveness makes it easier forstudents to follow the material, because it is more closely connected. However, therelatively weaker coupling obtained in IBC following the departure of economicsmakes it more difficult for students to see the background of the discussions, and thelinks among business topics which are more often than not explainable with the helpof the economic theory. The universal applicability of marginal analysis is just oneexample
Miller (2000) suggests that, the direct inclusion of economics into the IBCprogram was not questioned by students, who saw the economics in action. Studentinterest in economics topics within IBC was further apparent from the content ofstudent presentations. The new format of IBC obviously makes that opportunitymore difficult. In that sense, this is a disservice to students' learning experience.Even though most of the economics topics of the IBC program are carried over tothe newly created IBC economics course, Managerial Economics, the new courseis a one semester course, and the presentation of topics sometimes precedes, whilesometimes comes quite later than the related IBC material.
From a students view point the opportunity cost of not having economicswithin IBC, but rather in the form of a separate course, means an additional class toregister for, take exams in, etc. The testing in the separate course is unsurprisinglymore detailed than the testing of economics concepts within the IBC program itself.Furthermore, even though it does not increase the upper level economics credit hourrequirements, withdrawal of economics from IBC led to a 17 credit hour newlydesigned IBC plus a two credit hour managerial economics course in lieu of theprevious 18 credit hour IBC program in total credit hours. The faculty made thischoice, however, it increased required courses for the students.
45
Journal of Economics and Economic Education Research, Volume 5, Number 1, 2004
IBC Economics Faculty
The economics faculty teaching the newly created IBC course, ManagerialEconomics, has the grand task of designing a more cohesive course out of the topicswhich were originally chosen to conveniently accommodate IBC needs. Topicsranging from microeconomics to macroeconomics, to international economics, tosocial choice theory, are difficult to justify teaching one after another unless a goodconnector is found. From experience in experimental versions of this course, we findthat students most of the time seem to be wondering "why this topic now" unless agood explanation is provided. However, once the new course is developed and goodconnectors between topics are established, it seems to work more smoothly. Wewould advise that faculty make frequent references to IBC modules in justifying thecontent of such a course material. Nevertheless, as related IBC topics to bepresented, it is still quite difficult to present a cohesive framework, especially inconnection with the IBC material to which Managerial Economics is supposed to bea support.
Topics chosen from a wide scope of economics presented independently ofIBC has low coupling. That is another challenge, which is in close proximity of thecohesion problem as identified above.
The biggest gain an IBC economics faculty gets from teaching outside ofIBC can be stated in terms of the opportunity cost. The teaching load is much lessin the newer format since economics faculty members are no longer involved withtime-consuming student mentoring activities of IBC along with class attendance andfaculty team meetings. The economics faculty members also gain full control of thetests and teaching style even though, the contents are not exclusively determined byhim or her.
Non-IBC Economics Faculty and Economics Program
Of the 3Cs, cost seems to be the only relevant point of discussion for thenon-IBC economics faculty. Miller (2000) states that although the involvement ofeconomics faculty in IBC brought an extra burden on the economics faculty, whichnecessitated hiring temporary instructors to solve the teacher problem, it brought abetter visibility of the economics field to the colleagues in the college.
46
Journal of Economics and Economic Education Research, Volume 5, Number 1, 2004
College of Business and Economics Administration
Here, too, considering the cost side is the most relevant issue. The creationof managerial economics has extended the width of the junior level course offerings,as mentioned above while discussing Figure 1. This necessarily brings a heaviercoordination task onto the shoulders of the college administrators, which isincreased cost. Nevertheless, the original format would have required hiring moreeconomics faulty to cover other economics classes since IBC has grown so muchthat assigning one economics faculty to each section was prohibitive in terms ofcost.
CONCLUDING COMMENTS
In this paper, we analyzed the unique experiment of teaching junior leveleconomics to business students at the University of Idaho within the framework ofIntegrated Business Curriculum (IBC). Economics was originally directly embeddedin the IBC program, but later became an independent course to be taught inconjunction with the IBC. We looked at the costs and benefits of teachingeconomics within and outside of IBC. Such a policy change definitely affectedseveral constituencies such as students, faculty and administrators. We developedwhat we call the Three C's of Curriculum Evaluation, that is, "Cohesion, Couplingand Cost," to analyze the impact of taking economics out of IBC on the affectedparties. We benefited greatly from software engineering in computer science indeveloping the criteria. It is clear that these criteria can be applied to othereducational policy consideration, as well. We hope such an analysis can help otherschools better evaluate their curriculum change decisions.
REFERENCES
Byrne, J, (1993). Harvard Business School: An American Institution in Need of Reform,Business Week, July 19, 58-65.
Cotton, K. (1982). Effects of Interdisciplinary Team Teaching: Research Synthesis.Portland, OR: Northwest Regional Education Lab.
Cluskey, B., C. Ehlen & R. Rivers. (2001). A Four Step Process for IntegratingCollaborative Learning into Business Classroom, Journal of Business Disciplines,11, 81-101.
47
Journal of Economics and Economic Education Research, Volume 5, Number 1, 2004
Dangerfield, B. & Bailey, J. (1996) Faculty Development and an Integrated Business CoreCurriculum, Paper Presented at the 38th Annual Mountain Plains ManagementConference, Ogden Utah.
Geiger, J. J. & B. J. Dangerfield. (1996). An Analysis of Integrated Curriculum Models inUS Colleges of Business, Proceedings of the Decision Sciences Institute AnnualMeeting, November.
Jacobs, H. H. (1991). Planning for Curriculum Integration, Educational Leadership, 49,27-28.
Letaif, L. E. (1992). Debater in MBA: Is the Traditional Model Doomed?, HarvardBusiness Review, November December, 70, 128-140.
Leonard, E. W. (1992) Debater in MBA: Is the Traditional Model Doomed?, HarvardBusiness Review, November December, 70, 128-140.
Mason, T. C. (1996). Integrated Curricula: Potential and Problems, Journal of TeacherEducation, Sept/Oct. 47(4), 263-270.
Mintberg, H. (1987). Training Managers, Not MBAs, Paper Presented at the MacroOrganizational behavioral Society, Northwestern University, September.
Miller, J. (2000). Economics in the Integrated Business Curriculum, Journal of Educationfor Business, 76 (2),113-118.
Pharr, S. & L. Morris. (1997). The Fourth-Generation Marketing Curriculum: MeetingAACSB's Guidelines, Journal of Marketing Education, Fall,19( 3), 31-43.
Pharr. W. S., S. J. Morris, D. Stover, C. R. Byers & G. R. Reyes. (1998). The Execution andEvaluation of an Integrated Business Common Core Curriculum, The Journal ofGeneral Education, 47( 2), 166-182.
Rinker, R. (2002). Problem Solving and Algorithm, Unpublished Course Notes, ComputerScience Department, University of Idaho, Moscow, Idaho.
Smith, K. R. (1995) Individually and Collectively, Schools Need to Start Journey TowardTransformation. Address of President Smith to the AACSB 1995 Annual Meeting.
Stevens, W. P., G. J. Myers & L. L. Constantine (1974) "Structured Design, IBM SystemsJournal, 13(2),115-139.
48
Journal of Economics and Economic Education Research, Volume 5, Number 1, 2004
St. Clair, B.& D. L. Hough. (1992) Interdisciplinary Teaching: A Review of the Literature.(ERIC Document Reproduction Service No: 373 056) December.
Stover, D., S. J. Morris, S. Pharr, M. G. Reyes & C. R. Byers. (1997). Breaking Down theSilos: Attaining an Integrated Business Common Core, American Business Review,15(2), 1-11.
Yourdan E. & L. L. Constantine. (1979) Structured Design. Prentice Hall.
49
Journal of Economics and Economic Education Research, Volume 5, Number 1, 2004
HIGH SCHOOL ECONOMIC EDUCATIONIN EASTERN EUROPE:
FINDINGS FROM FIVE NATIONS
Phillip Saunders, Indiana UniversityKen Rebeck, St. Cloud State UniversityKent T. Saunders, Anderson University
ABSTRACT
This paper reports a snapshot of the current state of high school economiceducation in five Eastern European nations. The findings of this paper indicate thatthe 20-item TEL that was developed and translated for use in this project is areliable instrument for use in high school classrooms in five different countries. Thefindings of this paper also indicate that the National Council on EconomicEducation's in-service teacher training workshops and its efforts to have workshopparticipants develop effective teaching materials and techniques are beginning tohave a positive influence on student test performance in the countries where theyhave been used most extensively.
INTRODUCTION
The study reported in this paper was initiated during a weeklong"Developing Skills in Evaluation Workshop" held at Indiana University in July2000. The workshop was organized by the National Council on Economic Education(NCEE), and funded by the U.S. Department of Education in cooperation with theU.S. Information Agency. The workshop staff and five International EconomicsEducation Research Fellows worked with 15 participants from eight EasternEuropean countries to improve their knowledge of techniques for assessment andresearch in economics education and to develop joint research projects.1
The workshop staff and the Research Fellows compiled a 20-item versionof the third edition of the Test of Economic Literacy (TEL III, see Walstad &
50
Journal of Economics and Economic Education Research, Volume 5, Number 1, 2004
Rebeck, 2001) for translation and field-testing in Eastern Europe. Participants in the2000 workshop as well as international participants in two similar workshops heldat Indiana University in 1998 and 1999 agreed to serve as coordinators in helpingwith the translation and administration of the 20-item TEL in their countries, and tosend test results to Indiana University for coding into the data base used in thisstudy. In addition to the test, a brief teacher questionnaire and a set of studentbackground questions were also translated and administered as part of the 20-itemTEL project.
This paper will describe the structure of the 20-item TEL and an overviewof the sample of schools from which test results were obtained. This will befollowed by a description of the types of high school economics courses offered inthe participating countries and the participating teachers' background and trainingin economics. Student test performance across grade levels, by gender, and by itemand content category in the participating nations will then be presented andcompared with the performance of students participating in the U.S. norming of theTEL III.
STRUCTURE OF THE 20-ITEM TEL
The 20-item TEL is similar in structure to the 40-item TEL III in terms ofcontent coverage, cognitive levels, and overall test reliability. The first fivequestions on the 20-item TEL involve fundamental economics concepts andexamine the topics of scarcity, opportunity cost, specialization and productivity,incentives, and exchange. Questions 6-12 deal with microeconomics and examinethe topics of competition, supply and demand (3 questions), monopoly, and marketfailures. Questions 13-16 deal with macroeconomics and examine the topics ofGross Domestic Product, potential output, aggregate demand, and inflation.Questions 17-20 deal with international economics and development and examinethe topics of specialization and exchange, comparative advantage, exchange rates,and measuring a nation's standard of living.
With regard to the cognitive level of questions, two of the questions on the20-item TEL (10%) are classified as "knowledge", five (25%) as "comprehension",and 13 (65%) as "application". These percentages compare with 15%, 30%, and55% on TEL III Form A and 17.5%, 27.5% and 55% on TEL III Form B.
The 20-item TEL reliability coefficient of 0.81 obtained in this study isrelatively high for such a short test. It compares with reliability coefficients of 0.89for forms A and B of the 40-item TEL III.
51
Journal of Economics and Economic Education Research, Volume 5, Number 1, 2004
All questions on the 20-item TEL have the four options arranged in auniform short-to-long format, with each option being the correct choice an equalnumber of times. This format, which differs slightly from that in the TEL III, helpsinsure that choice of the correct option is based on economic knowledge and not onmultiple choice test-taking "tips" such as the longest option is the correct choice adisproportionate number of times or that the correct option is most often hidden inone of the middle positions rather than placed in the first or last choice.
TYPES OF ECONOMICS COURSES TAUGHTIN THE PARTICIPATING COUNTRIES
Sixty different teachers administered the 20-item TEL in their courses.Table 1 presents the distribution of teachers by nation and by course grade level.Economics courses were taught at both the eleventh and twelfth grade levels inAlbania. Four Albanian teachers taught at the eleventh grade level and 10 Albanianteachers taught at the twelfth grade level. Nine teachers taught economics coursesonly at the eleventh grade level in Croatia. Economics courses were taught at boththe eleventh and twelfth grade levels in Latvia. Three Latvian teachers taught at boththe eleventh and the twelfth grade level. One additional Latvian teacher taught at theeleventh grade level. Two additional Latvian teachers taught at the twelfth gradelevel. Sixteen Lithuanian teachers taught economics courses only at the twelfthgrade level. Fifteen Romanian teachers taught economics courses only at theeleventh grade level.
In Albania a one-year course in "Applied Economics" is taught in either theeleventh grade in curricula emphasizing natural sciences or in the twelfth grade incurricula emphasizing social sciences. A Junior Achievement textbook translatedand adapted by Albanians is the main material used in this course. Additionally,responses from teachers participating in the study who had attended the NCEEteacher-training workshop indicated frequent use of NCEE materials. Test resultswere obtained from 14 eleventh and twelfth grade teachers in 11 schools in sevendifferent cities. Six of the teachers were from three schools in Tirana, and eightteachers were from eight schools in six cities outside the nation's capital. Threeteachers sent in results from two classes, and one teacher sent in results from threeclasses.
The economics education curriculum in Croatia is currently undergoingchanges. At present, the topics taught in secondary "schools of economics" includebookkeeping and accounting, business communications, marketing, financial
52
Journal of Economics and Economic Education Research, Volume 5, Number 1, 2004
transactions, statistics, and commercial law in addition to what would be considered"economics" topics in the U.S. In addition, other secondary schools cover topics in"politics and economics". Included in this study are student test results from teacherswhose questionnaires indicated they were teaching eleventh grade courses in whatwould be called "economics" courses in this country. Test results were obtainedfrom nine eleventh grade economics teachers in six schools in four different cities.Four of the teachers were from three schools in Zagreb, and five teachers were fromthree schools in three cities outside the nation's capital.
In Latvia, a 105-hour "Fundamentals of Business Economy" course foreleventh or twelfth grade students became mandatory beginning in the 1999-2000school year. Translated Junior Achievement and NCEE materials, along with textsand curriculum guides produced by Latvian economists are used to teach the course.NCEE programs have been very successful in training Latvian economists todevelop their own materials. Test results were received from six eleventh andtwelfth grade teachers in six schools in five different cities. Two of the teachers werefrom different schools in Riga, and four teachers were from four schools in fourcities outside the nation's capital. Three teachers sent in test results for both eleventhand twelfth grade classes.
A yearlong, twelfth-grade economics course is taught in Lithuania. All ofthe participating teachers in Lithuania are graduates of NCEE workshops. Theinstructors use Junior Achievement and NCEE materials to teach the course. Testresults were received from 16 twelfth grade teachers from 16 different schools in 13different cities, all outside the nation's capital of Vilnius.
In Romania, the average school year is 36 weeks long, and high schooleconomics is usually taught in a yearlong eleventh grade course. In regular(grammar) high schools, students learn economics two hours a week. In"economics" high schools students start learning economics at the tenth grade forone hour a week, and continue learning economics at the eleventh grade for twohours a week. With regard to the materials used in these courses, currently fivealternative textbooks have been approved for use in high school classes. Among theco-authors there are five graduates of NCEE programs. Student test results werereceived from 15 eleventh grade teachers in 14 schools in 12 different cities. Onlyone teacher was from a school in Bucharest, all of the others were in schools in citiesoutside the nation's capital.
In summary, despite some differences within and between countries, thehigh school economics courses in this study are sufficiently comparable to thosetaught in the U.S. to make some preliminary comparisons of student performance
53
Journal of Economics and Economic Education Research, Volume 5, Number 1, 2004
on the questions on the 20-item TEL meaningful. The translated teacherquestionnaires used in our project asked participating teachers to examine the20-item TEL, and instructed: "If any of the questions on this test deal with a conceptNOT covered in the course you teach, please indicate the question number(s) in thespace below." Twelve of the Albanian teachers indicated that question number 15dealing with aggregate demand was not covered in their courses, and one Latvianteacher indicated that questions 17-20 dealing with international economics anddevelopment were not covered. Other than these responses, there were no a prioriindications that questions on the 20-item TEL were not appropriate for assessingstudent performance in the high school economics courses tested in this project.
Table 1: Total Teachers by Nation and Grade Level
Albania Croatia Latvia* Lithuania Romania
Total Teachers 14 9 6 16 15
Teachers in Grade 11 4 9 4 0 15
Teachers in Grade 12 10 0 5 16 0
* 3 teachers in Latvia taught at both the eleventh and twelfth grade levels
TEACHER BACKGROUND.
Tables 2, 3, and 4 present the teaching experience and economicsbackground of the sample of teachers participating in this study. Table 2 shows thatthe average number of years of general teaching experience of these high schoolteachers is about 17 years, with the lowest average (11.94 years) found for the 9Croatian teachers and the highest average (21.13) found for the 15 Romanianteachers. The average number of years teaching economics ranged from 7.37 inLithuania to 18.93 in Romania, with an overall mean of 10.65 years.
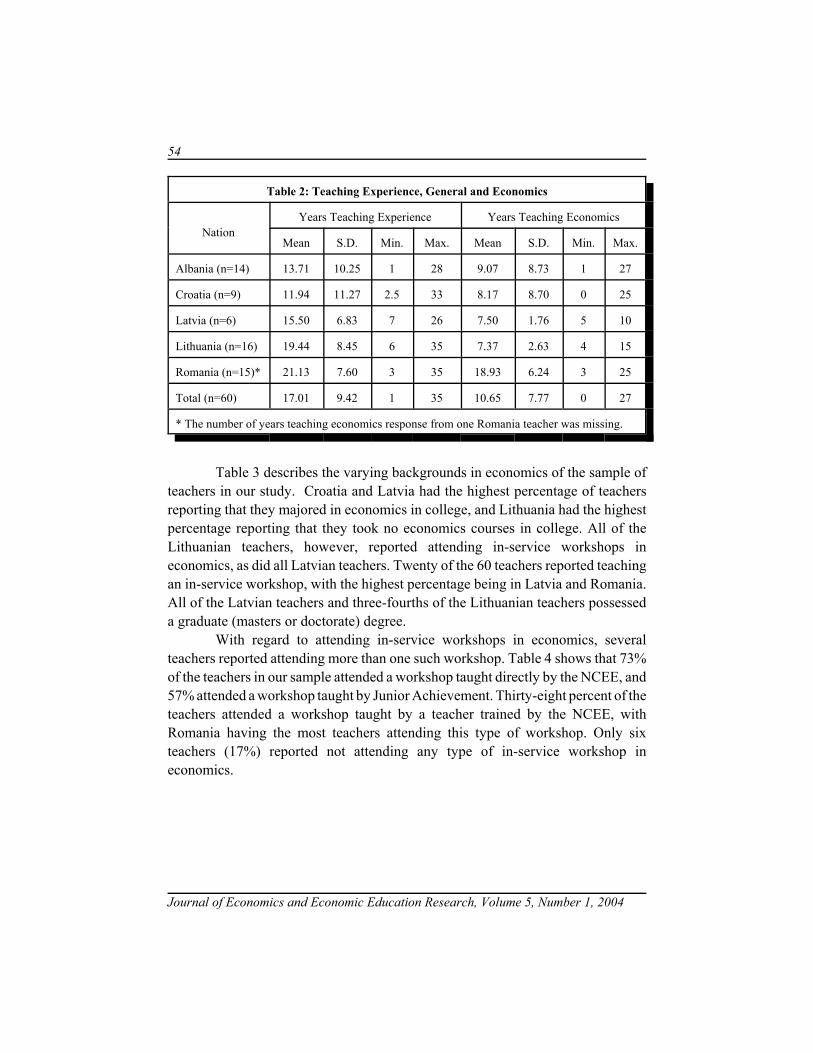
54
Journal of Economics and Economic Education Research, Volume 5, Number 1, 2004
Table 2: Teaching Experience, General and Economics
Nation
Years Teaching Experience Years Teaching Economics
Mean S.D. Min. Max. Mean S.D. Min. Max.
Albania (n=14) 13.71 10.25 1 28 9.07 8.73 1 27
Croatia (n=9) 11.94 11.27 2.5 33 8.17 8.70 0 25
Latvia (n=6) 15.50 6.83 7 26 7.50 1.76 5 10
Lithuania (n=16) 19.44 8.45 6 35 7.37 2.63 4 15
Romania (n=15)* 21.13 7.60 3 35 18.93 6.24 3 25
Total (n=60) 17.01 9.42 1 35 10.65 7.77 0 27
* The number of years teaching economics response from one Romania teacher was missing.
Table 3 describes the varying backgrounds in economics of the sample ofteachers in our study. Croatia and Latvia had the highest percentage of teachersreporting that they majored in economics in college, and Lithuania had the highestpercentage reporting that they took no economics courses in college. All of theLithuanian teachers, however, reported attending in-service workshops ineconomics, as did all Latvian teachers. Twenty of the 60 teachers reported teachingan in-service workshop, with the highest percentage being in Latvia and Romania.All of the Latvian teachers and three-fourths of the Lithuanian teachers possesseda graduate (masters or doctorate) degree.
With regard to attending in-service workshops in economics, severalteachers reported attending more than one such workshop. Table 4 shows that 73%of the teachers in our sample attended a workshop taught directly by the NCEE, and57% attended a workshop taught by Junior Achievement. Thirty-eight percent of theteachers attended a workshop taught by a teacher trained by the NCEE, withRomania having the most teachers attending this type of workshop. Only sixteachers (17%) reported not attending any type of in-service workshop ineconomics.
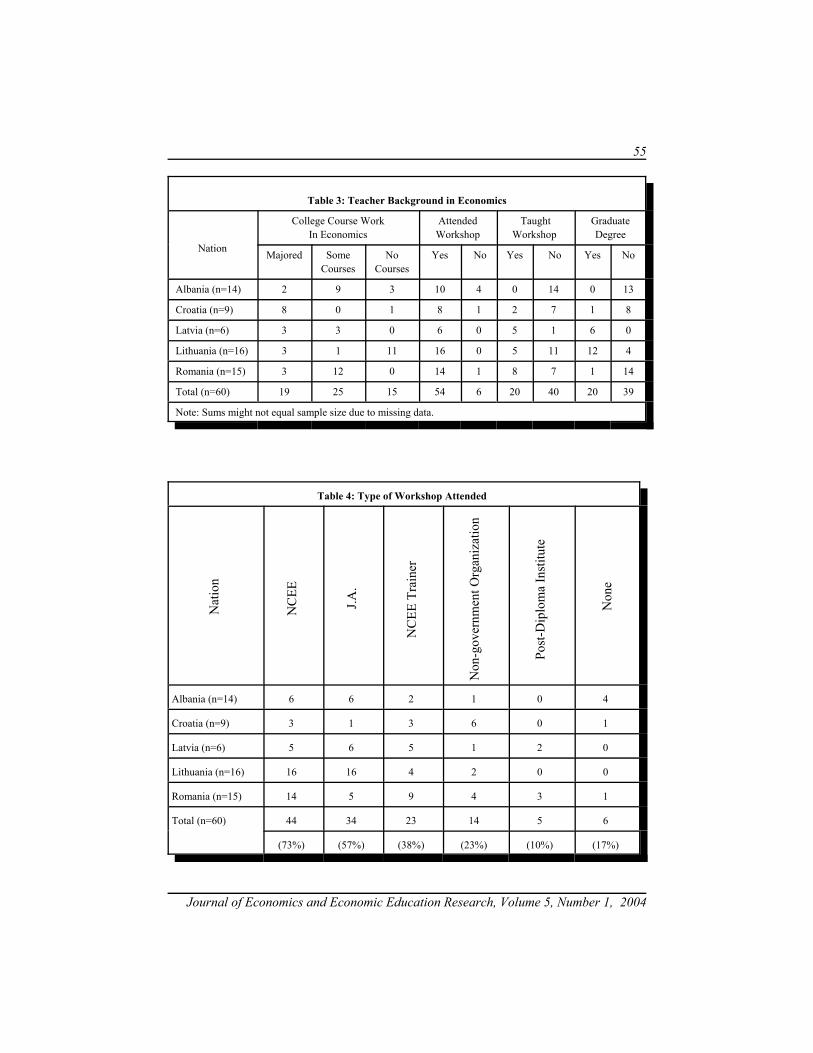
55
Journal of Economics and Economic Education Research, Volume 5, Number 1, 2004
Table 3: Teacher Background in Economics
Nation
College Course WorkIn Economics
AttendedWorkshop
TaughtWorkshop
GraduateDegree
Majored SomeCourses
NoCourses
Yes No Yes No Yes No
Albania (n=14) 2 9 3 10 4 0 14 0 13
Croatia (n=9) 8 0 1 8 1 2 7 1 8
Latvia (n=6) 3 3 0 6 0 5 1 6 0
Lithuania (n=16) 3 1 11 16 0 5 11 12 4
Romania (n=15) 3 12 0 14 1 8 7 1 14
Total (n=60) 19 25 15 54 6 20 40 20 39
Note: Sums might not equal sample size due to missing data.
Table 4: Type of Workshop Attended
Nat
ion
NC
EE
J.A.
NC
EE T
rain
er
Non
-gov
ernm
ent O
rgan
izat
ion
Post
-Dip
lom
a In
stitu
te
Non
e
Albania (n=14) 6 6 2 1 0 4
Croatia (n=9) 3 1 3 6 0 1
Latvia (n=6) 5 6 5 1 2 0
Lithuania (n=16) 16 16 4 2 0 0
Romania (n=15) 14 5 9 4 3 1
Total (n=60) 44 34 23 14 5 6
(73%) (57%) (38%) (23%) (10%) (17%)
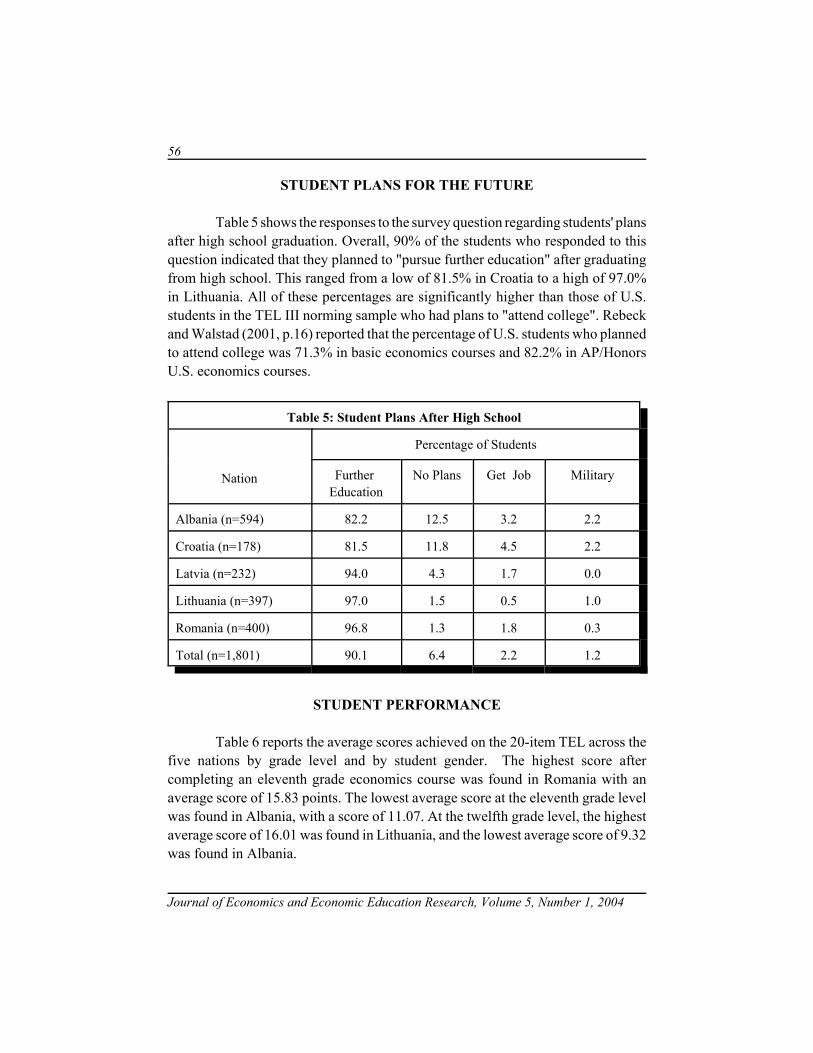
56
Journal of Economics and Economic Education Research, Volume 5, Number 1, 2004
STUDENT PLANS FOR THE FUTURE
Table 5 shows the responses to the survey question regarding students' plansafter high school graduation. Overall, 90% of the students who responded to thisquestion indicated that they planned to "pursue further education" after graduatingfrom high school. This ranged from a low of 81.5% in Croatia to a high of 97.0%in Lithuania. All of these percentages are significantly higher than those of U.S.students in the TEL III norming sample who had plans to "attend college". Rebeckand Walstad (2001, p.16) reported that the percentage of U.S. students who plannedto attend college was 71.3% in basic economics courses and 82.2% in AP/HonorsU.S. economics courses.
Table 5: Student Plans After High School
Nation
Percentage of Students
Further Education
No Plans Get Job Military
Albania (n=594) 82.2 12.5 3.2 2.2
Croatia (n=178) 81.5 11.8 4.5 2.2
Latvia (n=232) 94.0 4.3 1.7 0.0
Lithuania (n=397) 97.0 1.5 0.5 1.0
Romania (n=400) 96.8 1.3 1.8 0.3
Total (n=1,801) 90.1 6.4 2.2 1.2
STUDENT PERFORMANCE
Table 6 reports the average scores achieved on the 20-item TEL across thefive nations by grade level and by student gender. The highest score aftercompleting an eleventh grade economics course was found in Romania with anaverage score of 15.83 points. The lowest average score at the eleventh grade levelwas found in Albania, with a score of 11.07. At the twelfth grade level, the highestaverage score of 16.01 was found in Lithuania, and the lowest average score of 9.32was found in Albania.
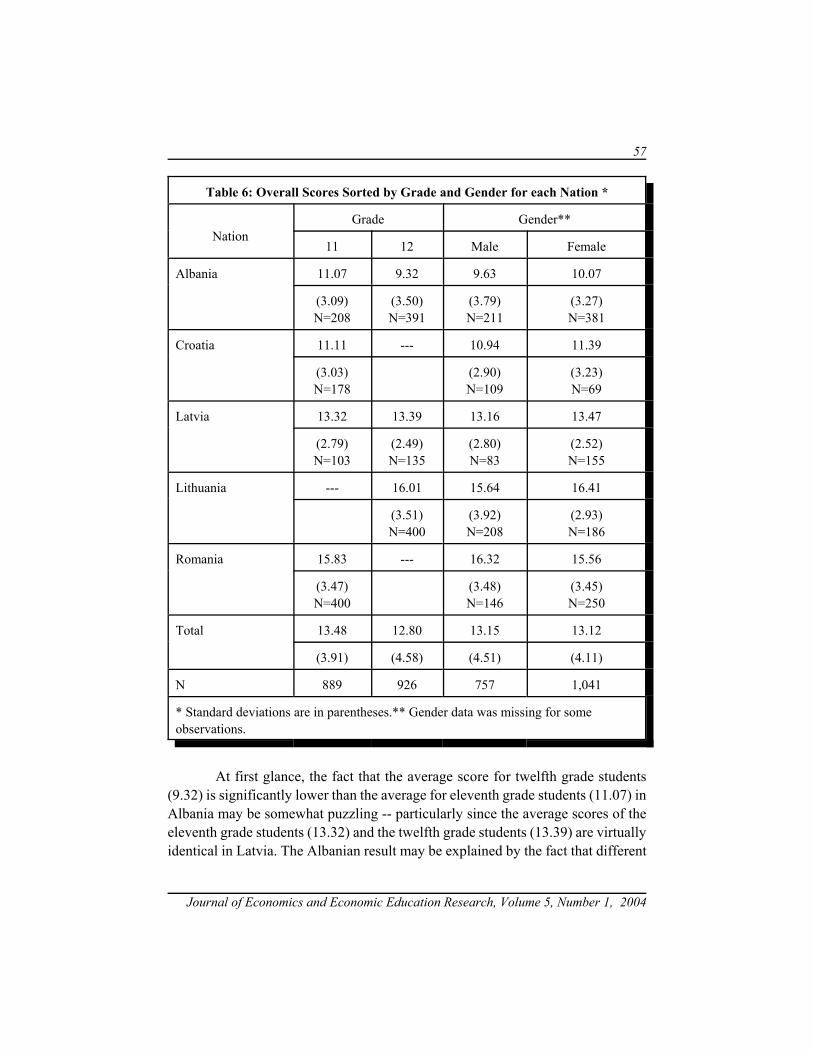
57
Journal of Economics and Economic Education Research, Volume 5, Number 1, 2004
Table 6: Overall Scores Sorted by Grade and Gender for each Nation *
Nation
Grade Gender**
11 12 Male Female
Albania 11.07 9.32 9.63 10.07
(3.09)N=208
(3.50)N=391
(3.79)N=211
(3.27)N=381
Croatia 11.11 --- 10.94 11.39
(3.03)N=178
(2.90)N=109
(3.23)N=69
Latvia 13.32 13.39 13.16 13.47
(2.79)N=103
(2.49)N=135
(2.80)N=83
(2.52)N=155
Lithuania --- 16.01 15.64 16.41
(3.51)N=400
(3.92)N=208
(2.93)N=186
Romania 15.83 --- 16.32 15.56
(3.47)N=400
(3.48)N=146
(3.45)N=250
Total 13.48 12.80 13.15 13.12
(3.91) (4.58) (4.51) (4.11)
N 889 926 757 1,041
* Standard deviations are in parentheses.** Gender data was missing for someobservations.
At first glance, the fact that the average score for twelfth grade students(9.32) is significantly lower than the average for eleventh grade students (11.07) inAlbania may be somewhat puzzling -- particularly since the average scores of theeleventh grade students (13.32) and the twelfth grade students (13.39) are virtuallyidentical in Latvia. The Albanian result may be explained by the fact that different
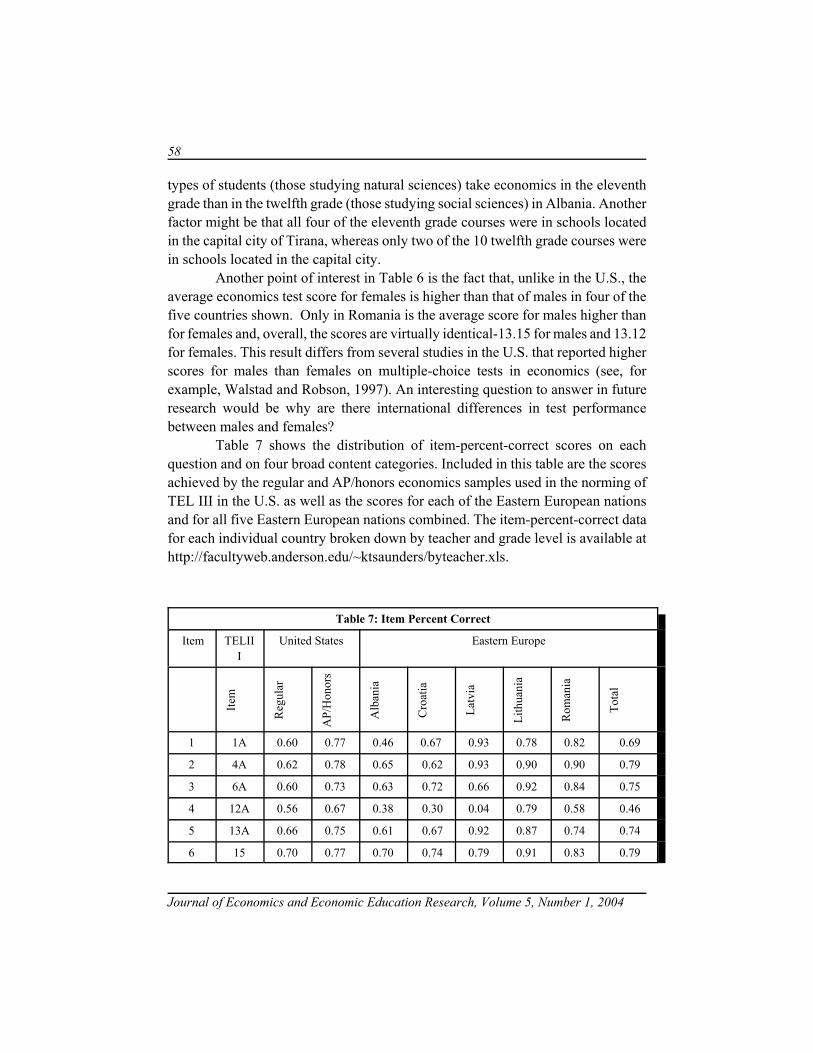
58
Journal of Economics and Economic Education Research, Volume 5, Number 1, 2004
types of students (those studying natural sciences) take economics in the eleventhgrade than in the twelfth grade (those studying social sciences) in Albania. Anotherfactor might be that all four of the eleventh grade courses were in schools locatedin the capital city of Tirana, whereas only two of the 10 twelfth grade courses werein schools located in the capital city.
Another point of interest in Table 6 is the fact that, unlike in the U.S., theaverage economics test score for females is higher than that of males in four of thefive countries shown. Only in Romania is the average score for males higher thanfor females and, overall, the scores are virtually identical-13.15 for males and 13.12for females. This result differs from several studies in the U.S. that reported higherscores for males than females on multiple-choice tests in economics (see, forexample, Walstad and Robson, 1997). An interesting question to answer in futureresearch would be why are there international differences in test performancebetween males and females?
Table 7 shows the distribution of item-percent-correct scores on eachquestion and on four broad content categories. Included in this table are the scoresachieved by the regular and AP/honors economics samples used in the norming ofTEL III in the U.S. as well as the scores for each of the Eastern European nationsand for all five Eastern European nations combined. The item-percent-correct datafor each individual country broken down by teacher and grade level is available athttp://facultyweb.anderson.edu/~ktsaunders/byteacher.xls.
Table 7: Item Percent Correct
Item TELIII
United States Eastern Europe
Item
Reg
ular
AP/
Hon
ors
Alb
ania
Cro
atia
Latv
ia
Lith
uani
a
Rom
ania
Tota
l
1 1A 0.60 0.77 0.46 0.67 0.93 0.78 0.82 0.69
2 4A 0.62 0.78 0.65 0.62 0.93 0.90 0.90 0.79
3 6A 0.60 0.73 0.63 0.72 0.66 0.92 0.84 0.75
4 12A 0.56 0.67 0.38 0.30 0.04 0.79 0.58 0.46
5 13A 0.66 0.75 0.61 0.67 0.92 0.87 0.74 0.74
6 15 0.70 0.77 0.70 0.74 0.79 0.91 0.83 0.79
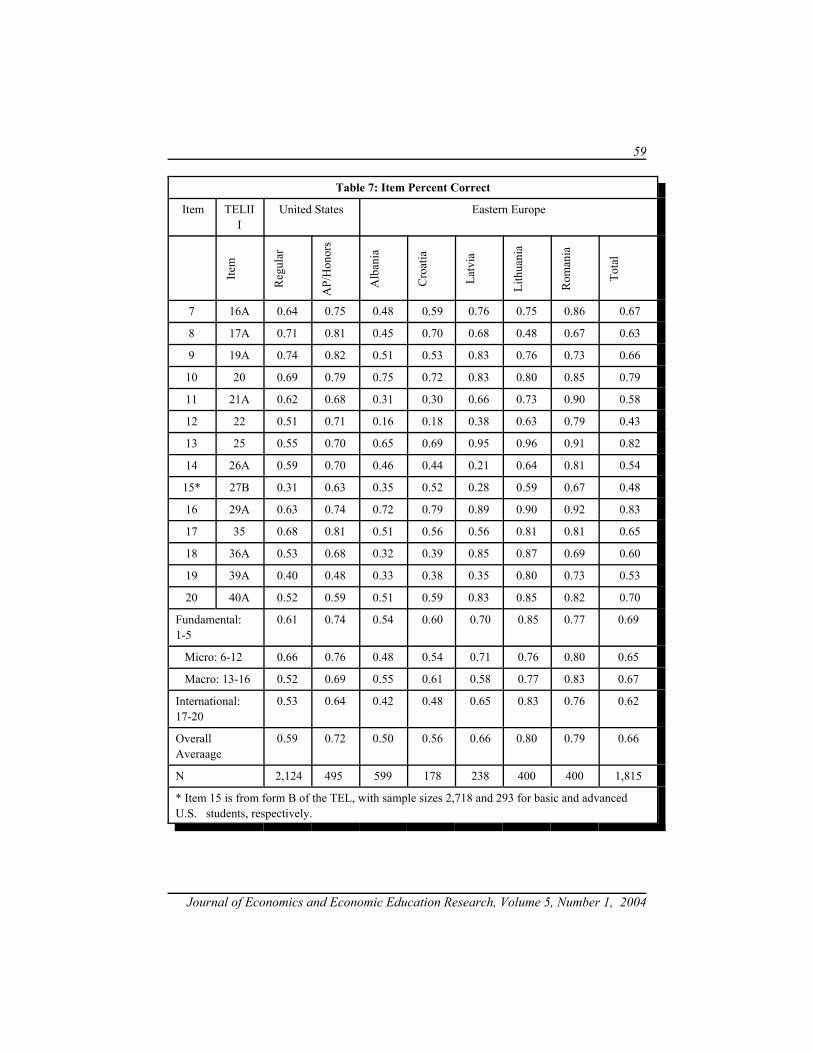
59
Table 7: Item Percent Correct
Item TELIII
United States Eastern Europe
Item
Reg
ular
AP/
Hon
ors
Alb
ania
Cro
atia
Latv
ia
Lith
uani
a
Rom
ania
Tota
l
Journal of Economics and Economic Education Research, Volume 5, Number 1, 2004
7 16A 0.64 0.75 0.48 0.59 0.76 0.75 0.86 0.67
8 17A 0.71 0.81 0.45 0.70 0.68 0.48 0.67 0.63
9 19A 0.74 0.82 0.51 0.53 0.83 0.76 0.73 0.66
10 20 0.69 0.79 0.75 0.72 0.83 0.80 0.85 0.79
11 21A 0.62 0.68 0.31 0.30 0.66 0.73 0.90 0.58
12 22 0.51 0.71 0.16 0.18 0.38 0.63 0.79 0.43
13 25 0.55 0.70 0.65 0.69 0.95 0.96 0.91 0.82
14 26A 0.59 0.70 0.46 0.44 0.21 0.64 0.81 0.54
15* 27B 0.31 0.63 0.35 0.52 0.28 0.59 0.67 0.48
16 29A 0.63 0.74 0.72 0.79 0.89 0.90 0.92 0.83
17 35 0.68 0.81 0.51 0.56 0.56 0.81 0.81 0.65
18 36A 0.53 0.68 0.32 0.39 0.85 0.87 0.69 0.60
19 39A 0.40 0.48 0.33 0.38 0.35 0.80 0.73 0.53
20 40A 0.52 0.59 0.51 0.59 0.83 0.85 0.82 0.70
Fundamental:1-5
0.61 0.74 0.54 0.60 0.70 0.85 0.77 0.69
Micro: 6-12 0.66 0.76 0.48 0.54 0.71 0.76 0.80 0.65
Macro: 13-16 0.52 0.69 0.55 0.61 0.58 0.77 0.83 0.67
International:17-20
0.53 0.64 0.42 0.48 0.65 0.83 0.76 0.62
OverallAveraage
0.59 0.72 0.50 0.56 0.66 0.80 0.79 0.66
N 2,124 495 599 178 238 400 400 1,815
* Item 15 is from form B of the TEL, with sample sizes 2,718 and 293 for basic and advancedU.S. students, respectively.
60
Journal of Economics and Economic Education Research, Volume 5, Number 1, 2004
The overall average percent correct for Latvia (66%), Lithuania (80%), andRomania (79%) exceed the overall average for regular economics students in theU.S. (59%), and the averages for Lithuania and Romania also exceed the average forAP/Honors students in the U.S. (72%). This superior performance might be due tothe higher percentage of students who plan to pursue further education in theLithuanian and Romanian courses, the high percentage of teachers who haveattended NCEE workshops in these two countries, or the greater length of theEastern European courses compared to the U.S. courses, which are typically onlyone semester long. Whatever the reason, the data in Table 7 indicate that a lot ofeconomics is being learned by the students tested in this study.
Totaled across all five nations, the overall average of 66% on all 20questions for the Eastern European students completing either an eleventh grade ora twelfth grade economics course is 7% higher than the average for U.S. studentscompleting a regular economics course and 6% lower than the average for U.S.students completing an AP/Honors course. The higher percentage correct for theEastern European students compared to U.S. students in regular economics courseswas greatest on the four macro questions (15%) and the four international questions(9%). It is interesting to note that both regular and AP/Honors students in the U.S.performed better on the micro questions relative to the macro questions; whereas,this is not the case in four of the five Eastern European countries (Albania, Croatia,Lithuania, and Romania). An interesting question for future research might try andanswer why there are international differences in relative test performance onmicroeconomic questions compared to macroeconomic questions?
The data in Table 7 also indicate that in some cases the overall mean percentcorrect score for all 20 items may have been influenced by unusual performance onsome individual questions. Question 4 dealing with the incentive effects of a declinein real interest rates, for example, was answered correctly by only 4% of the 238Latvian students, and none of the students in one Romanian course got this questionright. The Albanian teachers' concern with lack of coverage on aggregate demandin their curriculum was noted above. The data in Table 7 indicate that 35% of theirstudents got question 15 right. This question, however, proved to be even moredifficult for U.S. students (31%) and Latvian students (28%). Latvian students alsohad difficulty with question 14 dealing with an economy's potential output (21%).Question 12 dealing with the most efficient approach to controlling pollution provedto be particularly difficult for students in Albania (16%) and Croatia (18%) as didquestion 11 dealing with the cause of high wages in a market economy (31% inAlbania and 30% in Croatia).
61
Journal of Economics and Economic Education Research, Volume 5, Number 1, 2004
Questions on which the performance of students in all five EasternEuropean countries equaled or exceeded that of U.S. students in regular economicscourses were number 2 (opportunity cost), 3 (specialization), 6 (competition), 10(equilibrium adjustment),13 (GDP), and 16 (inflation).
In addition to having the largest percentage of students who plan to pursuefurther education after high school, the three countries showing the highest 20-itemTEL scores in Table 7 are the three with the largest percentage of teachers who haveattended NCEE workshops, and whose coordinators reported the most activity indeveloping new materials for economics courses in their countries. this isencouraging evidence of the effectiveness of these programs
FACTORS INFLUENCING STUDENT PERFORMANCE
We do not have a way to adequately deal with the fact that the five countriesin our study have different curricula and use different materials in their courses. Nordo we assume that the courses and students tested are a completely random sample.Nevertheless, for purposes of exploratory investigation of the factors influencingstudent performance we have run an OLS regression with all of our data.
To control for the currently unknown national differences in curriculum andmaterials that may have influenced student scores, dummy variables were specifiedfor Croatia, Latvia, Lithuania, and Romania with an omitted variable for Albaniasuppressed in the intercept. Then we included student and teacher variables thatmight be expected to influence student test performance. Missing data in some casesreduced the number of students included in our regression to 1,716. The variabledescriptions, mean values, and regression results are reported in Table 8.
After controlling for other factors, the lack of a significant difference inscores between males and females found in Table 6 remained. As noted, this resultdiffers from the common finding in the U.S. that males outperform females onmultiple-choice tests in economics, and may be worth further exploration. Otherthan student gender, significant differences were found for other characteristics:students planning to further their education after high school scored 1.74 pointshigher than those without such plans, and the higher scores achieved by eleventhgrade students found in Table 6 remained significant after controlling for otherfactors. The estimated coefficients were significantly different from zero at the 1%level.
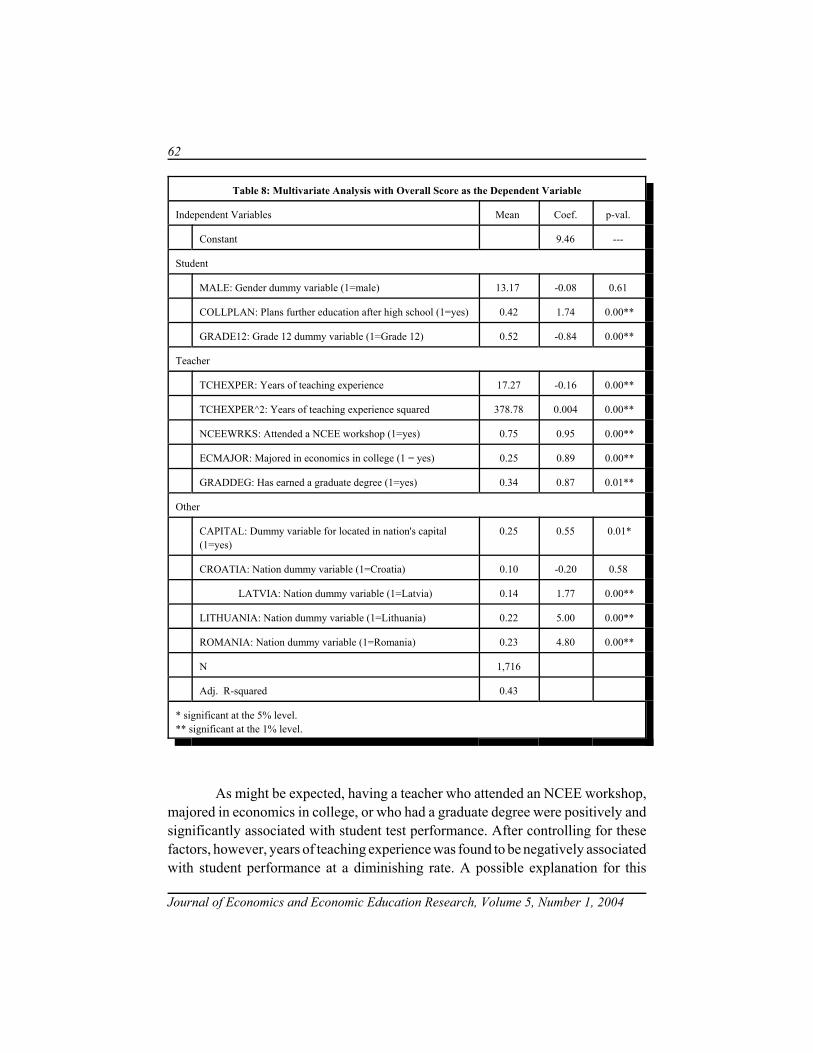
62
Journal of Economics and Economic Education Research, Volume 5, Number 1, 2004
Table 8: Multivariate Analysis with Overall Score as the Dependent Variable
Independent Variables Mean Coef. p-val.
Constant 9.46 ---
Student
MALE: Gender dummy variable (1=male) 13.17 -0.08 0.61
COLLPLAN: Plans further education after high school (1=yes) 0.42 1.74 0.00**
GRADE12: Grade 12 dummy variable (1=Grade 12) 0.52 -0.84 0.00**
Teacher
TCHEXPER: Years of teaching experience 17.27 -0.16 0.00**
TCHEXPER^2: Years of teaching experience squared 378.78 0.004 0.00**
NCEEWRKS: Attended a NCEE workshop (1=yes) 0.75 0.95 0.00**
ECMAJOR: Majored in economics in college (1 = yes) 0.25 0.89 0.00**
GRADDEG: Has earned a graduate degree (1=yes) 0.34 0.87 0.01**
Other
CAPITAL: Dummy variable for located in nation's capital(1=yes)
0.25 0.55 0.01*
CROATIA: Nation dummy variable (1=Croatia) 0.10 -0.20 0.58
LATVIA: Nation dummy variable (1=Latvia) 0.14 1.77 0.00**
LITHUANIA: Nation dummy variable (1=Lithuania) 0.22 5.00 0.00**
ROMANIA: Nation dummy variable (1=Romania) 0.23 4.80 0.00**
N 1,716
Adj. R-squared 0.43
* significant at the 5% level.** significant at the 1% level.
As might be expected, having a teacher who attended an NCEE workshop,majored in economics in college, or who had a graduate degree were positively andsignificantly associated with student test performance. After controlling for thesefactors, however, years of teaching experience was found to be negatively associatedwith student performance at a diminishing rate. A possible explanation for this
63
Journal of Economics and Economic Education Research, Volume 5, Number 1, 2004
finding is that, rather than teaching experience being harmful, younger teachers inthis sample are more likely to have studied the western economic concepts found onthe 20-item TEL.
After controlling for student and teacher factors that varied across thenational samples, significant differences in student test scores remained. Studentsin Latvia, Lithuania and Romania scored higher, on average, than did students inCroatia and Albania (the omitted country). Students attending schools in theirnation's capital city outperformed students attending schools outside their nation'scapital by about one-half point.
CONCLUSION
The findings of this paper indicate that the 20-item TEL that was developedand translated for use in this project is a reliable instrument for use in high schoolclassrooms in five different countries. The findings of this paper also indicate thatthe NCEE's in-service teacher training workshops and its efforts to have workshopparticipants develop effective teaching materials and techniques are beginning tohave a positive influence on student test performance in the countries where theyhave been used most extensively.
There are several interesting areas for future research. Why are thereinternational differences in relative test performance on microeconomic questionscompared to macroeconomic questions? Why are there international differences intest performance between males and females? Is it possible to employ moresophisticated analytical techniques to identify factors that affect student performancein a multivariate setting?
ENDNOTES
1 Ilia Kristo (Albania), Efka Heder (Croatia), Veronika Bikse (Latvia),Danute Poskiene (Lithuania), Maria and Paul Lacatus (Romania) wereinstrumental in arranging for the translation and gathering the data in thefive Eastern European countries participating in this study.
64
Journal of Economics and Economic Education Research, Volume 5, Number 1, 2004
REFERENCES
Walstad, W. B. & Rebeck, K. (2001). The Test of Economic Literacy (3rd ed.): Examiner'sManual. New York: National Council on Economic Education.
Walstad, W. B. & Robson, D. (1997). Differential Item Functioning and Male-FemaleDifferences on Multiple-Choice Tests in Economics. Journal of EconomicEducation, 28(2), 155-71.
65
Journal of Economics and Economic Education Research, Volume 5, Number 1, 2004
ECONOMICS ARTICLES

66
Journal of Economics and Economic Education Research, Volume 5, Number 1, 2004
67
Journal of Economics and Economic Education Research, Volume 5, Number 1, 2004
WHAT ECONOMISTS DO:TRENDS IN ECONOMIC RESEARCH
Joseph G. Eisenhauer, Canisius College
ABSTRACT
This paper integrates and extends the literature on research trends ineconomics. Differences in the research interests of graduate students and seniorscholars are examined, as are dynamic changes in research agendas over time.Significant and persistent differences in the topical distributions of books anddissertations in economics are found; but even so, regression results suggest thatgraduate students are influenced by the distribution of current research across fieldsas well as employment opportunities when selecting thesis topics. Economistsappear to be influenced by external events in selecting research subjects, and exhibita life-cycle pattern in which they move from narrower specialties to broader, morehistorical subjects over time.
INTRODUCTION
Like the scholarship in every academic profession, economic researchdefines the boundaries of the discipline. In Jacob Viner's famous phrase,"Economics is what economists do" (as quoted by Robbins (1981), Hansen (1991),and Heck and Zaleski (1991)). Of course, as Lionel Robbins (1981, p. 1) pointedout, Viner's quip "only shifts the question one stage further: What is it that they do?What is the object of their investigations?" This, clearly, is a positive question,inviting empirical examination. It is rather surprising, therefore, that historians ofthought have paid so little attention to the subject matter of economic research,while other aspects of the professional literature have been widely investigated.Kenneth Button (1981, p. 36) observed more than two decades ago, "A major newinterest has grown amongst academic economists in recent years, the study of theprofessional literature in economics." While this has included numerous citationrankings of individuals, departments, and journals, scarcely any of the work hasinvestigated the topical content of the literature. Indeed, given the general
68
Journal of Economics and Economic Education Research, Volume 5, Number 1, 2004
consensus that economics is, as Robbins (1935, p.16) put it, the study of theallocation of "scarce means which have alternative uses", it is ironic that economistsshould largely neglect to study the allocation of their own research effort amongalternative fields of specialization. This point is made forcefully in Henry Villard's(1966) discussion of Bronfenbrenner's (1966) study. Villard also notes (p. 555) that"what we teach is directly related to what we research", which reinforces the notionthat 'what economists do' is well captured by an examination of economic research.The value of such work is suggested by Heck and Zaleski (1991, p. 27), who notethat "Knowledge of research emphasis and topical trends in the literature serves arange of researcher needs, from providing a sense of where future research is likelyheaded to simply satisfying a general curiosity."
Due to its brevity, the existing literature can be summarized succinctly.Stigler (1965) documented changes in the distribution of articles across fields in fiveleading journals for six decades up to 1953. Bronfenbrenner (1966) undertook abroader examination of articles through 1963 and a more careful study of doctoraldissertations by field from 1960 through 1965. Coats (1971) then replicated thesestudies using a group of five premier journals similar to Stigler's set. (Stigler(1965), Coats (1971) and Laband and Wells (1998) all examined the AmericanEconomic Review, the Quarterly Journal of Economics, and the Journal of PoliticalEconomy. Stigler also included the Review of Economics and Statistics andEconometrica, whereas Coats included Economic Journal and Economica.) Twodecades later, Heck and Zaleski (1991) documented trends in journal articles byfield from 1969 to 1989, just prior to the reclassification system adopted by theAmerican Economic Association (AEA) in 1991. Diamond and Haurin (1995)considered changes in the relative importance of fields from 1927 to 1988 byexamining self-reported classifications of AEA members rather than publicationlistings. They then estimated the relationship between self-reported classificationsand the availability of jobs by field to determine whether demand affects fieldchoice. Most recently, Laband and Wells (1998) studied topical coverage in 3 majorjournals through 1995.
The present paper integrates and extends this literature in several ways.First, Bronfenbrenner's comparison between the research interests of neophyte andexperienced scholars is replicated and updated using a more consistentmethodology. Recent data on job openings and book and dissertation distributionsare then used to replicate and extend the Diamond-Haurin analysis of field choice,using both supply and demand factors. Next, an intertemporal comparison ofresearch distributions serves to update earlier observations regarding long run trends
69
Journal of Economics and Economic Education Research, Volume 5, Number 1, 2004
in economic research. Finally, I investigate differences in the research agendas andpublication forums of junior and senior scholars to draw some tentative life-cycleconclusions.
NEOPHYTE AND EXPERT SCHOLARSHIP: 1960-1970
The first comparison of interest is between the research undertaken byneophyte economists (i.e., the doctoral dissertations of graduate students) and thatof experienced scholars. Martin Bronfenbrenner offered such a comparison in the1960s using journal articles, but the classification systems for dissertations andarticles differed (15 categories for dissertations versus 23 for articles), as didBronfenbrenner's methodology. As Bronfenbrenner (1966, p. 544) explained,"Rather than counting articles, I have economized time by 'measuring' them incolumn-centimeters, at the cost of overstressing the longer-winded titles," whereasfor dissertations he "merely counted titles" (p. 546). His review of the evidence ledhim to the tentative conclusion (p. 546) that "The dissertation topics appeargenerally less theoretical, more commonly 'applied' or 'descriptive,' than thepublished essays."
That evaluation is now reconsidered by comparing the distribution ofAmerican doctoral dissertations across specializations from 1960 through 1965 withthe distribution of English-language economics books published during the 1954-70period. Books were chosen rather than journal articles for several reasons. First, bytheir very nature, books and dissertations are more comparable (in terms of lengthand depth) than articles. Second, the classification systems in use at the time fordissertations and books were essentially equivalent to each other, but were unlikethe system for articles; moreover, articles are often classified in multiple categories,unlike books and dissertations. Finally, the contrast between neophytes and maturescholars may be most clearly drawn by comparing dissertations with books, whichtend to be authored and edited by experienced researchers; although they sometimesauthor articles, graduate students rarely publish books while completing theirdissertations. Indeed, as Hartley, et al. (2001) show, books are rarely written withinthe first few years after graduation. (A well-known exception is Robert Heilbroner,whose book, The Worldly Philosophers, predates his dissertation.) At the sametime, however, the distinction between books and journals is not as severe as it mayseem; refereed annual publications for example, have traditionally been classifiedas books rather than as journals, and this practice continues to the present. Despitetheir similarities to journals, refereed annuals such as Research in the History of
70
Journal of Economics and Economic Education Research, Volume 5, Number 1, 2004
Economic Thought and Methodology and Research in Political Economy areclassified as books. (See Table 5 below for a formal comparison of book andjournal distributions by field.)
The distribution of books was calculated from the Cumulative Bibliographyof Economics Books, volume 1, 1954-62 and Economics Selections, An InternationalBibliography, Cumulative Bibliography Series I and II, 1963-1970. These indicesprovide a fairly comprehensive data set; as the publishers (Gordon & Breach, 1974)note in the preface to the latter, "Coverage… encompasses all publications in theeconomics area amounting to 60 pages or more. Publications are ordered as noticeof their appearance is circulated in the Library of Congress proof-sheets or indexcards. Consequently, virtually all publications in the English language are covered."Combining the 1954-62 and 1963-70 periods results in a single 1954-70 periodcentered around the comparison period for dissertations. The 1960-65 distributionof dissertations is a weighted average of the percentages reported byBronfenbrenner; the aggregate number of economics dissertations for each yearwere obtained from the Association of Research Libraries (1967). To make thedissertation and book classifications strictly comparable, dissertations in generaleconomics and economic theory were combined into a single category.
The distributions are presented in Table 1. In contrast to Bronfenbrenner'sfinding, Table 1 suggests that dissertations were not substantially less theoreticalthan contemporaneously published books. Indeed, the difference betweenproportions in the general economics, theory, thought, and methodology categoryis not statistically significant at a five percent level. Similarly, only smalldifferences of approximately one and one-half percentage points or less areobservable in business cycles, public finance, and labor economics. In contrast, themajor differences are that established economists devoted more than twice as muchattention to economic history and growth, statistical methods, and economic systemsas graduate students, paid less than half as much attention to money and banking,business finance, and business administration, and roughly half as much attentionto agriculture as their students. Thus, the differences in topical coverage appear tobe more notable than differences in the level of empiricism. To determine whetherthese differences in topical coverage have persisted into more recent years, thecomparison is now replicated for the 1991-1995 period.
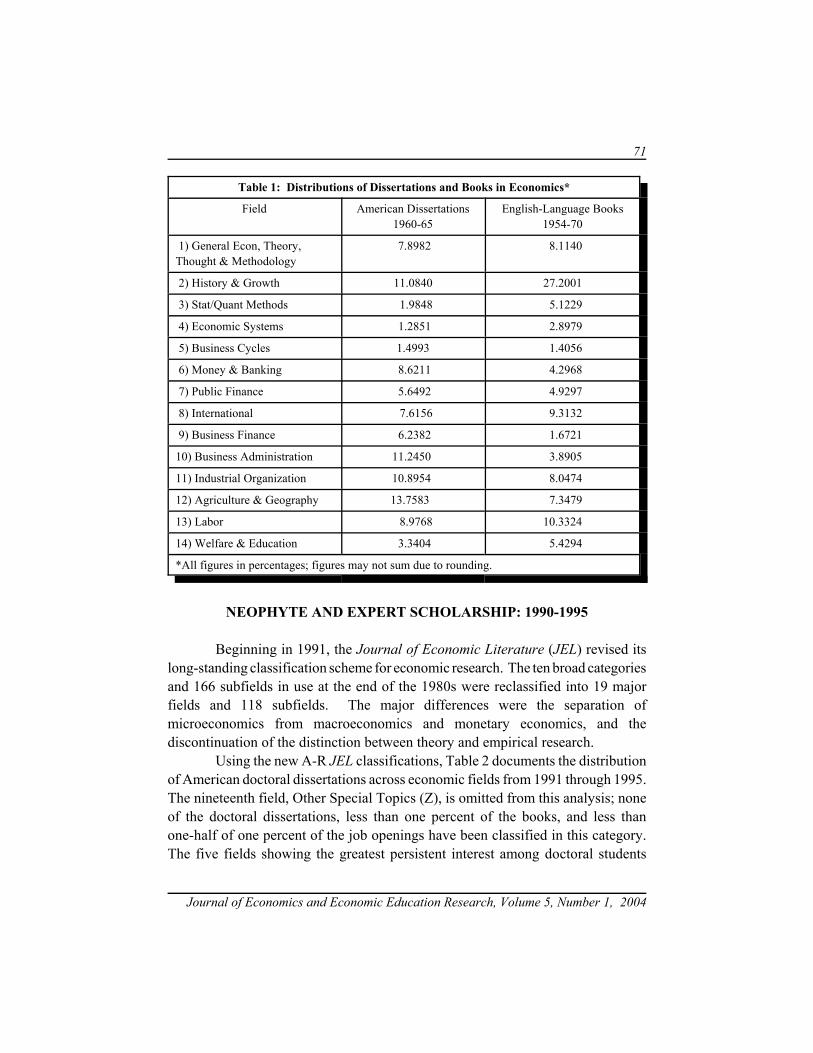
71
Journal of Economics and Economic Education Research, Volume 5, Number 1, 2004
Table 1: Distributions of Dissertations and Books in Economics*
Field American Dissertations1960-65
English-Language Books1954-70
1) General Econ, Theory,Thought & Methodology
7.8982 8.1140
2) History & Growth 11.0840 27.2001
3) Stat/Quant Methods 1.9848 5.1229
4) Economic Systems 1.2851 2.8979
5) Business Cycles 1.4993 1.4056
6) Money & Banking 8.6211 4.2968
7) Public Finance 5.6492 4.9297
8) International 7.6156 9.3132
9) Business Finance 6.2382 1.6721
10) Business Administration 11.2450 3.8905
11) Industrial Organization 10.8954 8.0474
12) Agriculture & Geography 13.7583 7.3479
13) Labor 8.9768 10.3324
14) Welfare & Education 3.3404 5.4294
*All figures in percentages; figures may not sum due to rounding.
NEOPHYTE AND EXPERT SCHOLARSHIP: 1990-1995
Beginning in 1991, the Journal of Economic Literature (JEL) revised itslong-standing classification scheme for economic research. The ten broad categoriesand 166 subfields in use at the end of the 1980s were reclassified into 19 majorfields and 118 subfields. The major differences were the separation ofmicroeconomics from macroeconomics and monetary economics, and thediscontinuation of the distinction between theory and empirical research.
Using the new A-R JEL classifications, Table 2 documents the distributionof American doctoral dissertations across economic fields from 1991 through 1995.The nineteenth field, Other Special Topics (Z), is omitted from this analysis; noneof the doctoral dissertations, less than one percent of the books, and less thanone-half of one percent of the job openings have been classified in this category.The five fields showing the greatest persistent interest among doctoral students
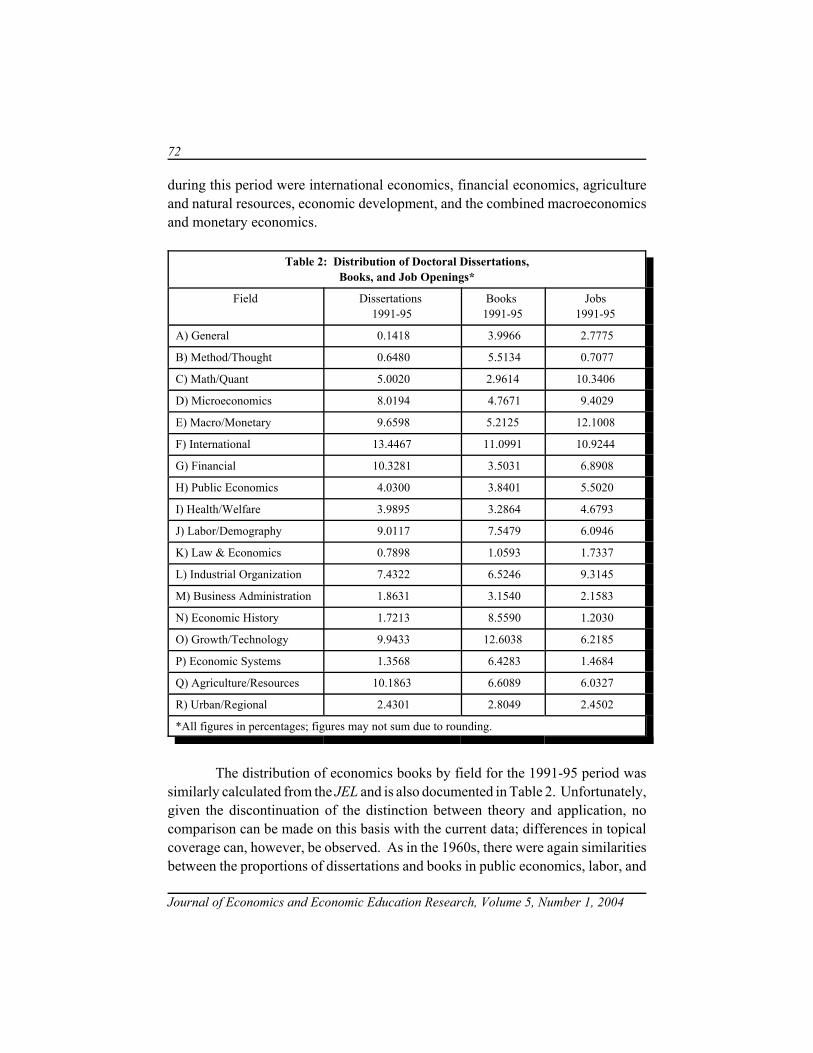
72
Journal of Economics and Economic Education Research, Volume 5, Number 1, 2004
during this period were international economics, financial economics, agricultureand natural resources, economic development, and the combined macroeconomicsand monetary economics.
Table 2: Distribution of Doctoral Dissertations,Books, and Job Openings*
Field Dissertations 1991-95
Books 1991-95
Jobs1991-95
A) General 0.1418 3.9966 2.7775
B) Method/Thought 0.6480 5.5134 0.7077
C) Math/Quant 5.0020 2.9614 10.3406
D) Microeconomics 8.0194 4.7671 9.4029
E) Macro/Monetary 9.6598 5.2125 12.1008
F) International 13.4467 11.0991 10.9244
G) Financial 10.3281 3.5031 6.8908
H) Public Economics 4.0300 3.8401 5.5020
I) Health/Welfare 3.9895 3.2864 4.6793
J) Labor/Demography 9.0117 7.5479 6.0946
K) Law & Economics 0.7898 1.0593 1.7337
L) Industrial Organization 7.4322 6.5246 9.3145
M) Business Administration 1.8631 3.1540 2.1583
N) Economic History 1.7213 8.5590 1.2030
O) Growth/Technology 9.9433 12.6038 6.2185
P) Economic Systems 1.3568 6.4283 1.4684
Q) Agriculture/Resources 10.1863 6.6089 6.0327
R) Urban/Regional 2.4301 2.8049 2.4502
*All figures in percentages; figures may not sum due to rounding.
The distribution of economics books by field for the 1991-95 period wassimilarly calculated from the JEL and is also documented in Table 2. Unfortunately,given the discontinuation of the distinction between theory and application, nocomparison can be made on this basis with the current data; differences in topicalcoverage can, however, be observed. As in the 1960s, there were again similaritiesbetween the proportions of dissertations and books in public economics, labor, and
73
Journal of Economics and Economic Education Research, Volume 5, Number 1, 2004
health, education and welfare, along with urban and regional economics. But incontrast to the dissertations, only small percentages of recent books addressedagriculture and natural resources, macroeconomics and monetary economics, andfinancial economics. On the other hand, authors and editors of books again paid fargreater attention to economic history, methodology and history of thought, andeconomic systems. A Chi-square test reveals a statistically significant differencebetween the distributions of books and dissertations at the one percent level.
In short, the analysis reveals a basic consistency from the 1960s to the early1990s in the contrast between neophyte and established scholars. In each period,experienced economists paid relatively greater attention to economic history andeconomic systems, roughly equal attention to public finance, welfare, and labor, andless attention to agriculture, money and banking, and finance than graduate students.The greatest inconsistency between the periods was the attention paid to quantitativemethods. In the early 1960s, while this field was still in its infancy, it was naturallythe province of experienced scholars; by the early 1990s, graduate students showedgreater interest than faculty in this specialization.
SUPPLY AND DEMAND IN FIELD CHOICE
The contrast between the dissertation and book distributions at any point intime, of course, reflects the fact that dissertations and books are not drawn from thesame population of authors. Certainly, part of this difference may be due to the needof graduate students to choose fields in which employment is likely to be available.Nonetheless, we might anticipate some correlation between the two distributions ifPh.D. students are influenced in their choice of field either by the interests of theirfaculty or by the availability of current information and professional research. Theeffect of direct faculty influence appears to be limited, however; Hansen's (1991, p.1079) study found that in choosing thesis subjects "the influence of faculty advisorsproved to be surprisingly weak. Relatively few of the respondents credited theirfaculty advisors with the inspiration for their thesis topics."
The potential effect of currently available knowledge is consistent with thenotion that field choice is affected by supply factors. As Diamond and Haurin(1995, p. 104) explain, "A subfield becomes important because the development oftools of analysis or data has reached the point where the time is ripe for advance inthe subfield." In their statistical analysis of self-reported classifications of neweconomists between 1974 and 1988 however, only demand, represented by jobopenings for economists, was included as an explanatory variable, and the tests
74
Journal of Economics and Economic Education Research, Volume 5, Number 1, 2004
revealed relatively little explanatory power (8 to 20 percent). Thus, while findingthat field choice is significantly affected by employment opportunities, the authorsinvited replication along the following lines. "In the future, we hope that therobustness of the results reported here will be tested in various ways. ...[One] testof the robustness of our results would be to see if similar trends were reflected in thesubfield distribution of dissertations listed annually by the American EconomicAssociation.... In the future, we also hope to continue to seek good measures of thesupply and demand for particular subfields" (Diamond & Haurin, 1995, p. 120).Thus, as a means of replicating and extending the Diamond-Haurin study, I measurefield choice using doctoral dissertations from 1991 through 1995 as the dependentvariable and use the annual distributions of books to measure the supply of recentinformation in the field. Following Diamond and Haurin, I use recent data on jobopenings by field (as collected each May in the American Economic Review) tomeasure demand; those data are summarized in the last column of Table 2. Whilethe data set is newer, the sample size is approximately two-thirds as large as theDiamond-Haurin sample: the 18 categories observed over the five year period1991-1995 provide 90 observations of each variable. The ordinary least-squares regression yields
)59.6(%523.0
)16.12(%795.0
)16.3(0177.0% BOOKJOBONDISSERTATI ++
−−=
R2 = .730, adjusted R2 = .724, DW = 1.96
where Student's t statistics are given in parentheses. Each of the independentvariables is significant at the one percent level, indicating that both supply anddemand factors affect field choice. Supply appears to weigh somewhat less heavily;every percentage point increase in books published in a field increases thedissertations written in that field by half a percentage point, while a percentage pointincrease in employment opportunities raises the proportion of dissertations in thefield by some eight-tenths of a percentage point. The latter effect is approximatelytwice the magnitude of that reported by Diamond and Haurin, and the expandedmodel explains substantially more of the variation in field choice. On the whole, theresults are consistent with the Diamond-Haurin findings, and the estimates appearquite robust; additional replications using lag structures and aggregated distributionsyielded surprisingly similar results. (There might, for example, be some delaybetween the availability of published literature and the completion of the
75
Journal of Economics and Economic Education Research, Volume 5, Number 1, 2004
dissertation; such reformulations of the model made no substantial difference in thetest results.) Thus, while dissertations and books are not drawn from the samepopulations of authors, there does appear to be a correlation between the supply ofcurrent research in a specialization and the proportion of doctoral candidateschoosing that field for dissertation work.
CHANGES IN RESEARCH AGENDAS SINCE 1960
Stigler (1965), Bronfenbrenner (1966), Coats (1971), and Laband and Wells(1998) all found it useful to inspect the distribution of economic literature for shortand long run trends among fields of interest. This section expands that work byexamining recent intertemporal changes in dissertation and book distributions.
To make the intertemporal comparisons, it is necessary to reclassify researchfrom the earlier and later periods without causing severe damage to the integrity ofthe original classifications. Fortunately, the 14-category classification scheme usedin the early 1960s and the current 18-category JEL system have more in commonwith each other than either has with the 10-category system which prevailed in theinterim. Indeed, the most questionable category for reclassification is perhaps thenew Law and Economics, which only amounts to one percent of all current research.For present purposes, this topic is included with health, education and welfare, assuggested by both the JEL and the University of Pittsburgh's Economic Books. (InMarch of 1991, both Economic Books and the JEL published cross-reference guidesindicating that the new Law and Economics category most nearly fit with the earlierwelfare category.)
Table 3 presents the reclassified distributions of doctoral dissertations for1960-65 and 1991-95. The numbers in parentheses below each field refer to thefield codes in Table 1, and the letters refer to the field codes from Table 2.Surprisingly, there is remarkable stability in most of the fields over these threedecades. Predictably, the most significant increases have been in statistical andquantitative methods, international economics, and finance, while the most notabledeclines have been in business administration and industrial organization. AlthoughStigler (1965) cautioned against attributing changes in research interests to changesin the economic environment, the injunction is probably less applicable to graduatestudents than established scholars. Indeed, the increasing globalization of theeconomy and the revolutionary financial innovations of the past few decades,combined with increasingly sophisticated computer facilities are almost certainlycorrelated with the increasing interest of doctoral students in these three areas. It is
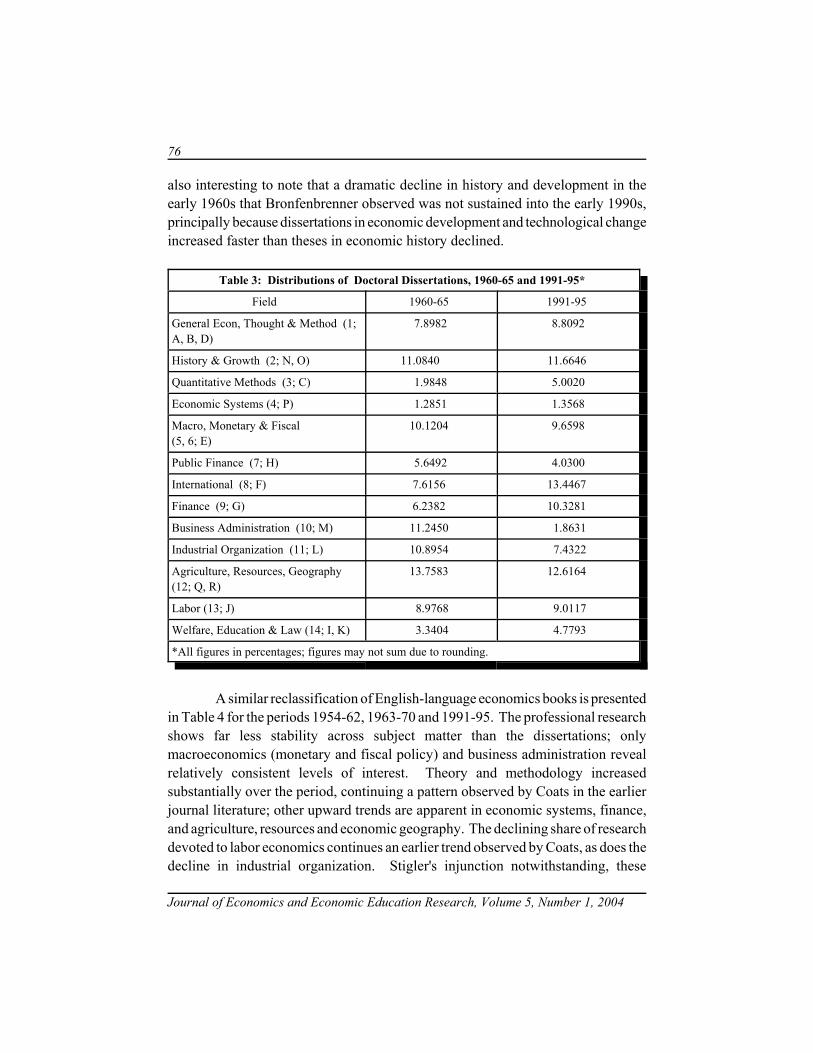
76
Journal of Economics and Economic Education Research, Volume 5, Number 1, 2004
also interesting to note that a dramatic decline in history and development in theearly 1960s that Bronfenbrenner observed was not sustained into the early 1990s,principally because dissertations in economic development and technological changeincreased faster than theses in economic history declined.
Table 3: Distributions of Doctoral Dissertations, 1960-65 and 1991-95*
Field 1960-65 1991-95
General Econ, Thought & Method (1; A, B, D)
7.8982 8.8092
History & Growth (2; N, O) 11.0840 11.6646
Quantitative Methods (3; C) 1.9848 5.0020
Economic Systems (4; P) 1.2851 1.3568
Macro, Monetary & Fiscal(5, 6; E)
10.1204 9.6598
Public Finance (7; H) 5.6492 4.0300
International (8; F) 7.6156 13.4467
Finance (9; G) 6.2382 10.3281
Business Administration (10; M) 11.2450 1.8631
Industrial Organization (11; L) 10.8954 7.4322
Agriculture, Resources, Geography(12; Q, R)
13.7583 12.6164
Labor (13; J) 8.9768 9.0117
Welfare, Education & Law (14; I, K) 3.3404 4.7793
*All figures in percentages; figures may not sum due to rounding.
A similar reclassification of English-language economics books is presentedin Table 4 for the periods 1954-62, 1963-70 and 1991-95. The professional researchshows far less stability across subject matter than the dissertations; onlymacroeconomics (monetary and fiscal policy) and business administration revealrelatively consistent levels of interest. Theory and methodology increasedsubstantially over the period, continuing a pattern observed by Coats in the earlierjournal literature; other upward trends are apparent in economic systems, finance,and agriculture, resources and economic geography. The declining share of researchdevoted to labor economics continues an earlier trend observed by Coats, as does thedecline in industrial organization. Stigler's injunction notwithstanding, these
77
Journal of Economics and Economic Education Research, Volume 5, Number 1, 2004
findings appear to reinforce the conclusion Heck and Zaleski (1991, p. 32) drewfrom their inspection of journal articles: "economists' research interests have tendedto shift as society's economic problems change." The declining interest in laboreconomics, for example, is clearly contemporaneous with the decreasingunionization of the workforce both in North America and Europe. But the declinein statistical and quantitative methods is a rather surprising reversal of the earliertrend documented by Stigler, Bronfenbrenner, and Coats; similarly, the decrease inthe proportion of research devoted to history and development reverses an earliertrend noted by Coats. Finally, the table indicates cycles of interest, of the typedescribed by Bronfenbrenner as "parabolic trends" in the areas of public finance,international economics, and welfare. Despite this pattern, however, the relativeimportance of welfare as a subject of professional interest has remained about equalto that of public finance and somewhat greater than either business finance orbusiness administration, providing evidence in favor of Bronfenbrenner's (1966, p.549) hypothesis "that some economic aspects of the poverty problem will provesubstantially more than fads."
The intertemporal changes in the field distribution of scholarly workdescribed above could have been caused by successive cohorts of new economistsentering the profession with different research interests, or alternatively, by shiftsin the research interests of established economists, or, of course, a combination ofboth. (Differential productivity changes across fields represent another possibleexplanation, but there is no a priori reason to believe that productivity differed inthis manner.) Diamond and Haurin (1995) documented intertemporal changes in thedistribution of young economists, whom they define as those having receiveddoctorates within the previous dozen years or so; using those data, it is possible toevaluate the two potential explanations of research changes. (Diamond and Haurindrew a distinction between the majority of young economists and an elite minority;the data used here refer to the former.) In particular, the shares of research devotedto general economics (including thought and methodology) and economic systemsincreased despite declining proportions of young economists entering these areas.In the late 1950s and early 1960s, approximately 19 percent of new economistsclassified themselves in these fields, but over time the proportion fell toapproximately 11 percent. Thus, the increased output can be attributed tomovements of more senior economists into these fields. At the other extreme, thefalling research shares in quantitative methods (including econometrics), industrialorganization, labor economics, and monetary and fiscal policy (including public
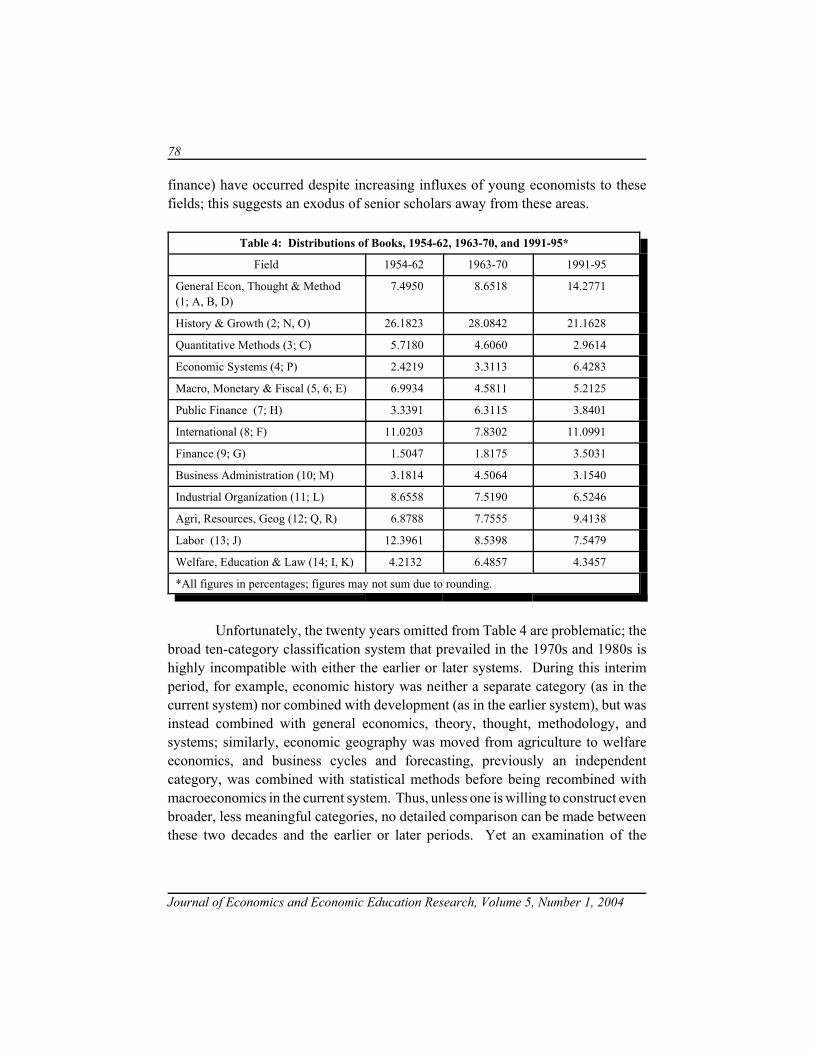
78
Journal of Economics and Economic Education Research, Volume 5, Number 1, 2004
finance) have occurred despite increasing influxes of young economists to thesefields; this suggests an exodus of senior scholars away from these areas.
Table 4: Distributions of Books, 1954-62, 1963-70, and 1991-95*
Field 1954-62 1963-70 1991-95
General Econ, Thought & Method(1; A, B, D)
7.4950 8.6518 14.2771
History & Growth (2; N, O) 26.1823 28.0842 21.1628
Quantitative Methods (3; C) 5.7180 4.6060 2.9614
Economic Systems (4; P) 2.4219 3.3113 6.4283
Macro, Monetary & Fiscal (5, 6; E) 6.9934 4.5811 5.2125
Public Finance (7; H) 3.3391 6.3115 3.8401
International (8; F) 11.0203 7.8302 11.0991
Finance (9; G) 1.5047 1.8175 3.5031
Business Administration (10; M) 3.1814 4.5064 3.1540
Industrial Organization (11; L) 8.6558 7.5190 6.5246
Agri, Resources, Geog (12; Q, R) 6.8788 7.7555 9.4138
Labor (13; J) 12.3961 8.5398 7.5479
Welfare, Education & Law (14; I, K) 4.2132 6.4857 4.3457
*All figures in percentages; figures may not sum due to rounding.
Unfortunately, the twenty years omitted from Table 4 are problematic; thebroad ten-category classification system that prevailed in the 1970s and 1980s ishighly incompatible with either the earlier or later systems. During this interimperiod, for example, economic history was neither a separate category (as in thecurrent system) nor combined with development (as in the earlier system), but wasinstead combined with general economics, theory, thought, methodology, andsystems; similarly, economic geography was moved from agriculture to welfareeconomics, and business cycles and forecasting, previously an independentcategory, was combined with statistical methods before being recombined withmacroeconomics in the current system. Thus, unless one is willing to construct evenbroader, less meaningful categories, no detailed comparison can be made betweenthese two decades and the earlier or later periods. Yet an examination of the
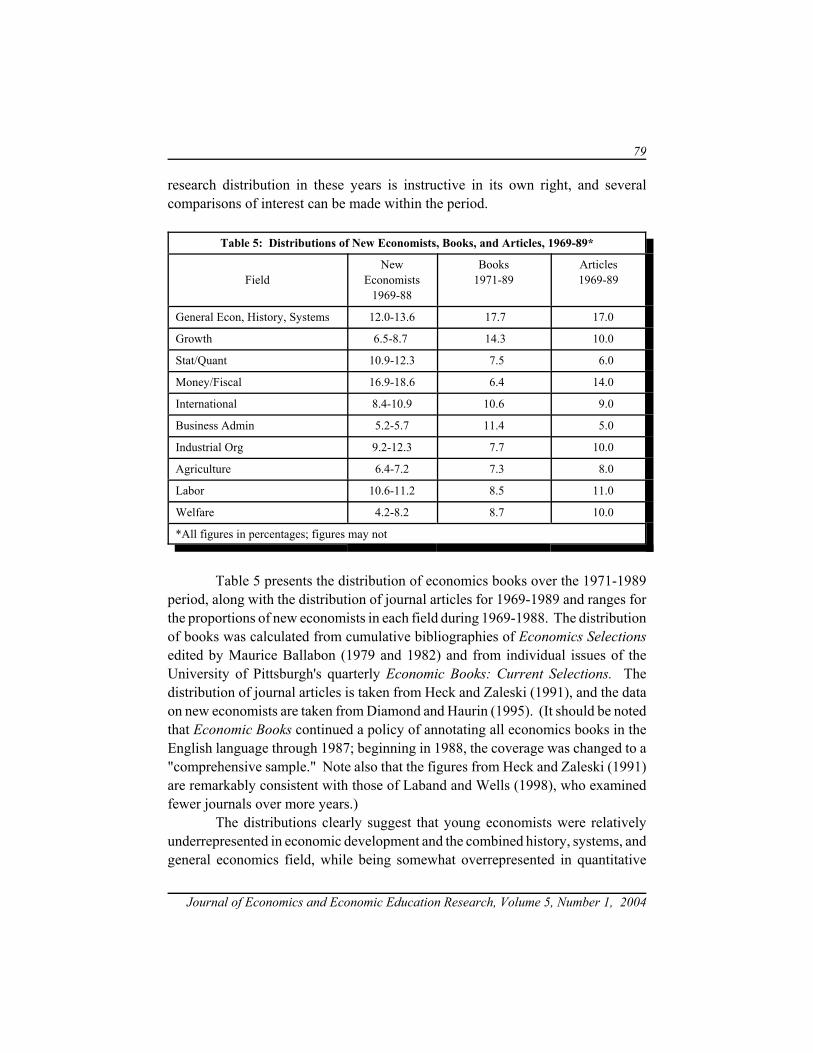
79
Journal of Economics and Economic Education Research, Volume 5, Number 1, 2004
research distribution in these years is instructive in its own right, and severalcomparisons of interest can be made within the period.
Table 5: Distributions of New Economists, Books, and Articles, 1969-89*
FieldNew
Economists1969-88
Books1971-89
Articles1969-89
General Econ, History, Systems 12.0-13.6 17.7 17.0
Growth 6.5-8.7 14.3 10.0
Stat/Quant 10.9-12.3 7.5 6.0
Money/Fiscal 16.9-18.6 6.4 14.0
International 8.4-10.9 10.6 9.0
Business Admin 5.2-5.7 11.4 5.0
Industrial Org 9.2-12.3 7.7 10.0
Agriculture 6.4-7.2 7.3 8.0
Labor 10.6-11.2 8.5 11.0
Welfare 4.2-8.2 8.7 10.0
*All figures in percentages; figures may not
Table 5 presents the distribution of economics books over the 1971-1989period, along with the distribution of journal articles for 1969-1989 and ranges forthe proportions of new economists in each field during 1969-1988. The distributionof books was calculated from cumulative bibliographies of Economics Selectionsedited by Maurice Ballabon (1979 and 1982) and from individual issues of theUniversity of Pittsburgh's quarterly Economic Books: Current Selections. Thedistribution of journal articles is taken from Heck and Zaleski (1991), and the dataon new economists are taken from Diamond and Haurin (1995). (It should be notedthat Economic Books continued a policy of annotating all economics books in theEnglish language through 1987; beginning in 1988, the coverage was changed to a"comprehensive sample." Note also that the figures from Heck and Zaleski (1991)are remarkably consistent with those of Laband and Wells (1998), who examinedfewer journals over more years.)
The distributions clearly suggest that young economists were relativelyunderrepresented in economic development and the combined history, systems, andgeneral economics field, while being somewhat overrepresented in quantitative
80
Journal of Economics and Economic Education Research, Volume 5, Number 1, 2004
methods and monetary and fiscal policy. As might be expected, these differencesbetween younger and more experienced economists are largely consistent with thoseobtained above in the comparisons between graduate students and establishedeconomists in general, particularly for the most recent years. Moreover, despite ageneral similarity between the distributions of books and articles, there were notabledifferences in the areas of economic growth, monetary and fiscal policy, andbusiness administration. It is especially evident in these fields that the distributionof young economists is more closely related to the distribution of articles thanbooks, which suggests that younger professionals are more likely to utilize journalsas a forum for their research.
CONCLUSION
Because this study draws inferences regarding static differences betweenpopulations of researchers as well as dynamic changes in research agendas overtime, a brief summary may be useful. The data reveal notable differences in thesubject matter selected by graduate students and established economists, and mostof these differences appear to have persisted for at least thirty years. Compared withtheir faculty, graduate students appear less interested in economic systems, historyand development, and more interested in financial and monetary economics; inrecent years, they have also shown greater interest in quantitative methods.Nonetheless, graduate students do appear to take the available supply of economicresearch as well as the availability of employment opportunities into account whenselecting dissertation topics. A similar pattern of differences appears in the researchinterests of junior and senior economists; in recent years at least, youngereconomists have been less interested in general economics, economic systems,history, and development, and more attracted to quantitative methods and monetaryeconomics than their senior colleagues. Younger economists also appear to havehad a greater propensity to publish their research in professional journals thanbooks.
Over the past three decades, the research interests of successive cohorts ofgraduate students in economics have remained fairly stable, with the changes thatdid occur corresponding broadly with changes in the economic environment. Overthe past four decades, senior economists have increasingly left labor, industrialorganization, and quantitative methods to their younger colleagues, and paidincreasing attention to economic systems and general economics, including thehistory of economic thought and methodology.
81
Journal of Economics and Economic Education Research, Volume 5, Number 1, 2004
Roughly speaking, the results suggest that the research interests ofeconomists, especially those of graduate students, do respond to changes in theexternal environment. Moreover, there appears to be a life cycle pattern in whicheconomists tend to move toward broader, more historical, and more fundamentalquestions as they advance in their careers. The evidence also appears to suggest thatthe differences between junior and senior economists have widened in recent years,as successive cohorts of young economists have increasingly avoided the subjectswhich have been increasingly favored by senior researchers.
REFERENCES
Association of Research Libraries (1967). American Doctoral Dissertations 1965-1966.Ann Arbor: University Microforms.
Ballabon, M. B. (Ed.) (1979). Economics Selections: An International Bibliography,Cumulative Bibliography vol. III, 1971-1977. New York: Gordon & Breach.
Ballabon, M. B. (Ed.) (1982). Economics Selections: An International Bibliography,Cumulative Bibliography vol. IV, 1978-1981. New York: Gordon & Breach.
Bronfenbrenner, M. (1966). Trends, cycles, and fads in economic writing. AmericanEconomic Review, 56, 538-552.
Button, K. J. (1981). The economic analysis of economic literature: A survey. AmericanEconomist, 25, 36-43.
Coats, A. W. (1971). The role of scholarly journals in the history of economics: An essay.Journal of Economic Literature, 9, 29-44.
Diamond, A. M., Jr. & D. R. Haurin (1995). Changing patterns of subfield specializationamong cohorts of economists from 1927-1988. Research in the History ofEconomic Thought and Methodology, 13, 103-123.
Gordon & Breach Science Publishers (1974). Economics Selections, An InternationalBibliography: Cumulative Bibliography Series I and II, 1963-1970. New York:Gordon & Breach.
Hartley, J. E., J. W. Monks & M. D. Robinson (2001). Economists' publishing patterns.American Economist, 45, 80-85.
82
Journal of Economics and Economic Education Research, Volume 5, Number 1, 2004
Hansen, W. L. (1991). The education and training of economics doctorates: Major findingsof the American Economics Association's Committee on Graduate Education inEconomics. Journal of Economic Literature, 29, 1054-1087.
Heck, J. L. & P. A. Zaleski (1991). Trends in economic-journal literature: 1969-89.Atlantic Economic Journal, 19, 27-32.
Hinshaw, C. E. (1991-1994). Report of the Director, Job Openings for Economists.American Economic Review, Papers and Proceedings, volumes 81-85.
Laband, D. N. & J. M. Wells. (1998). The scholarly journal literature of economics: Ahistorical profile of the AER, JPE, and QJE. American Economist, 42, 47-58.
Pencavel, J. (Ed.) (1991-1995). Journal of Economic Literature, volumes 29-33.
Robbins, L. (1935). The Nature and Significance of Economic Science (Second edition).London: Macmillan.
Robbins, L. (1981). Economics and political economy. American Economic Review, 71,1-10.
Stigler, G. J. (1965). Essays in the History of Economics. Chicago: University of ChicagoPress.
University of Pittsburgh Department of Economics (1965). Cumulative Bibliography ofEconomics Books, vol. 1, 1954-62. New York: Gordon & Breach.
University of Pittsburgh Department of Economics and University Libraries (1982-1989).Economic Books: Current Selections, volumes 9-16.
Villard, H. J. (1966). Discussion. American Economic Review, 56, 553-556.
83
Journal of Economics and Economic Education Research, Volume 5, Number 1, 2004
INFORMATION TRANSFERS FROMDIVERSE CORPORATE EVENTS:
METHODOLOGICAL ISSUESAND FINDINGS
Sanjay Rajagopal, Montreat College
ABSTRACT
This paper presents results from research pertaining to the industry-widetransfer of information from a diverse set of corporate events. Early studies in thisarea date back to the late 1970s and early 1980s, but the literature indicates thatinterest in this area of research became more widespread in the 1990s, and thesubject remains a fruitful area of study even today. This paper organizes into sixcategories the results of the bulk of the intra-industry studies in finance. Moreimportantly, though, it discusses several methodological issues involved inconducting such research. Finally, it highlights areas of conflicting evidence thatare therefore potential candidates for further research.
INTRODUCTION
Following the development of the Capital Asset Pricing Model (CAPM) inthe 1960s and 1970s, applied research in finance trained much attention through the1980s on the use of "event study methodology" to assess the information content ofvarious corporate events, such as stock splits and equity offerings. For the mostpart, this research focused on documenting the equity valuation implications for thefirm directly affected by the event of interest. A few studies in this decade,however, sought to widen the scope of enquiry into the information content offirm-specific events by attempting to measure the effects of such events on the stockprices of rival firms. Beginning in the early 1990s, interest in this "intra-industry"perspective gained momentum, and, the sustained stream of research seen since thenindicates that interest has not yet ebbed; the study of industry-wide informationtransfers remains a fruitful area of research.
84
Journal of Economics and Economic Education Research, Volume 5, Number 1, 2004
The current paper has three objectives: First, it seeks to present the resultspertaining to the diverse events that have been studied from the intra-industryperspective with the view of impressing upon the reader the fact that many eventshave valuation effects that are more far-reaching than traditionally understood.Second, the survey seeks to stimulate new ideas for further empirical work in thearea of information transfer. Finally, for the benefit of such research, it highlightsnumerous methodological issues involved in conducting intra-industry studies.
A BASIS FOR EXPECTING INTRA-INDUSTRY EFFECTS
As noted above, since the early 1990s, researchers have devotedconsiderable attention to the measurement of a possible "ripple effect" stemmingfrom firm-related events that manifests itself in contemporaneous abnormal changesin stock prices of other firms within the same industry. In general, a developmentat an individual firm could have implications for its competitors in the same resourceand product markets because the event may (1) reflect changes in the profitabilityof the industry as a whole, or (2) suggest competitive shifts within the industry.
Thus, research dealing with intra-industry effects is grounded in the ideathat firms within an industry are likely to compete in the same resource and productmarkets. As such, their values will be affected similarly by a set of common factors,or differentially by a set of firm-specific factors. That is, if an event at one firm (the"originating" firm) is perceived by the market to have been occasioned by anindustry-wide factor (such as a decline in market demand), the valuation effects ofthat event would be in the same direction for the originating and rival firms. On thehand, the firms being placed in a competitive setting, if the market ascribes the eventto a firm-specific factor (such as a management problem or law suit), the valuationeffect of the event would be of an opposite sign for the originating firm and itscompetitors (see, for example, Szewczyk (1992)). As will be seen below, a diverseset of events appears to possess industry-wide implications.
EARNINGS RELEASES AND FORECASTS
The early studies in the area of intra-industry information transfers focusedon earnings announcements and forecasts, and even precede the steady stream ofstudies beginning in the 1990s. For instance, Firth's (1976) investigation of theindustry-wide impact of earnings announcements in the United Kingdom between1973 and 1974 constitutes one of the earliest inquiries into the existence of
85
Journal of Economics and Economic Education Research, Volume 5, Number 1, 2004
intra-industry information transfers. The study, which included announcementsfrom four industry groupings (Breweries, Food Retailers, Shipping, and Banks),found that during the ten trading days prior to the announcement, the sample ofsecurities behaved in a manner predicted by the market model, with residuals beingrandomly distributed around zero and having no cumulative impact. On theannouncement day, however, similar-type firms experienced an average excess of2.1% or -3.7% in their share prices depending on whether the announcement bore"positive" or "negative" news. The residuals for 94% to 98% of the sample firmsshowed the same sign on that day. In particular, the residuals of competing firmsranged from 50% to 80% of announcing company residuals, and were in the samedirection as those of the announcing firms. Firth concluded that the stock marketused firm-level annual earnings results to reassess share prices of rival companies,and that virtually the entire price adjustment occurred on the announcement day.
Foster (1982), whose sample included announcements in the Wall StreetJournal between 1963 and 1978, similarly found strong evidence of an informationtransfer between the firm releasing earnings information and other firms in itsindustry. Employing three alternative definitions of an industry, namely the 4-digitStandard Industrial Classification (SIC), the Homogeneous Line of Business, andthe Dominant Firm industry definitions, the author found that the magnitude ofimpact was stronger for companies having a larger proportion of their revenues inthe same line of business as the announcing firm; roughly, these firms are among theless diversified entities within an SIC code. For a sample of Australian firms,Clinch and Sinclair (1987) found results similar to Foster over the period January1977 to December 1981; earnings releases had a homogeneous impact on theannouncing and rival firms. Further, the magnitude of stock price effects diminishedfor successive earnings announcements within the same industry.
In his attempt to examine the determinants of the industry-wide effects ofearnings reports, Bannister (1994) incorporated the correlation between the earningssignals of announcing and rival firms, the information content of the announcer'ssignal (measured by the announcement period abnormal return), and the level ofuncertainty for the rival firms prior to the earnings announcement (measured by thesize of the firm and the standard deviation of the rival's distribution of informationsignals). While the strongest association between these factors and the abnormalreturns to rival firms was observed for fourth quarter announcements thatrepresented bad news for the competitors, the market reacted to bad news wheneverit occurred. Good news, on the other hand, elicited a stock price response only in
86
Journal of Economics and Economic Education Research, Volume 5, Number 1, 2004
the fourth quarter, presumably because accounting numbers in this quarter werefully audited.
In contrast to the studies mentioned above, Baginski (1987) examined theintra-industry information transfers associated with earnings forecasts made bymanagement. The final sample consisted of 57 forecasts announced in the WallStreet Journal between 1978 and 1983. A grouping of similar firms was achievedthrough a cluster analysis of firms within the same 4-digit SIC code. The clusteringwas performed on the basis of the estimates from a firm's single-index market modeland financial leverage. The results indicated that rival firms experienced positive(negative) abnormal returns when the forecasts for the announcing firm indicatedpositive (negative) changes in earnings. These findings are consistent with theexistence of intra-industry information transfers from management's earningsforecasts.
The existing literature on the announcement effects of earnings releases andforecasts clearly suggests that investors use the information contained in thesereports to evaluate the shares of other firms in the same industry. Typically, thestock prices of the announcing firms and their rivals are observed to change in thesame direction.
CORPORATE BANKRUPTCY ANNOUNCEMENTS
Much attention has traditionally been paid to the possibility of a contagioneffect from bankruptcies within the banking industry. Recently, however, someresearchers have demonstrated the occurrence of this phenomenon among industrialand other non-banking firms as well. Lang and Stulz (1992) studied theindustry-wide stock price effects from bankruptcy announcements by industrialfirms between January 1970 and December 1989. In order to increase theprobability of detecting an industry-wide effect, the study restricted its attention tobankruptcies of large firms. Consistent with the majority of intra-industry studies,the authors defined industry rivals as those with the same primary 4-digit SIC codein COMPUSTAT (a database compile by S&P which contains comprehensiveaccounting and some market data for the firm level). Also, the event date wasidentified as the day on which the report of a Chapter 11 filing appeared in the WallStreet Journal.
The 59 bankrupt firms in the sample experienced significantly negativeabnormal returns over the four days prior to the announcement date, and a loss of18.93% in shareholder wealth on the filing day. These bankruptcies initiated a
87
Journal of Economics and Economic Education Research, Volume 5, Number 1, 2004
dominant contagion effect for the corresponding industries; the portfolios ofindustry rivals experienced significantly negative abnormal returns over the 11 dayssurrounding the event date. Thus, it appears that the average bankruptcy was causedby industry-wide shocks rather than by a firm succumbing to competition.However, a closer analysis of the abnormal returns to rivals indicated aheterogeneous effect across industries, and a study of the relationship between theabnormal returns and industry characteristics revealed that the contagion effect wasparticular strong in highly levered industries. In industries characterized by a highdegree of concentration and low leverage, on the other hand, a competitive effectprevailed, with rival firms profiting from the distress of the bankrupt firm.
In a similar study of industry-wide effects, Cheng and McDonald (1996)examined bankruptcy announcement effects in the airline and railroad industries,which possess vastly different market structures. The sample included 7 airline and5 railroad bankruptcy announcements over the period 1962 and 1991 that appearedin the Wall Street Journal. Employing the event study methodology, the authorsfound that the surviving airlines experienced an average abnormal return of 1.89%on the day preceding the announcement, but the surviving railroads suffered asignificantly negative average abnormal return (of -0.89%) on Day 0. Thedifference in the timing of market reaction for the two industries may arise from thefact that the railroad bankruptcies pertain to the early part of the sample period,when the electronic news media was not in wide use.
The authors ascribed the positive abnormal returns for rival airlines to theexistence of barriers to entry (into city-pair markets) and hence market power. Insuch an industry, the bankruptcy of a firm would increase the market power of thesurviving firms, whose stock prices will consequently be bid up by investors. Thenegative abnormal returns to surviving railroads, on the other hand, can be explainedby an immobility of assets, which makes it difficult for one railroad to service theregions covered by a failing industry member. Furthermore, the successfuloperation of the business requires cooperation among two or more railroads. Thus,the railroad industry is characterized by interdependencies, which imply disruptionsin operation for surviving companies when a member firm goes bankrupt.
The studies by Lang and Stulz (1992) and Cheng and McDonald (1996)suggest that industry characteristics can play a significant role in determining thenature of the valuation effects events have on rival firms. Asness and Smirlock(1991), who examined the effects of a Real Estate Investment Trust (REIT)bankruptcy, emphasized the importance of discriminating across firm characteristicswhen investigating intra-industry information transfers. An REIT must, at its
88
Journal of Economics and Economic Education Research, Volume 5, Number 1, 2004
inception, define the type of assets to be purchased and the maximum leverage tobe assumed. By thus lending themselves to differentiation by portfolio composition(i.e., as Equity, Financial, and Residual REITs), these institutions allow aninvestigation of how firms within the industry might differ in their reaction to agiven announcement.
The authors studied the impact of the Residential Resources MortgageInvestment Corporation (RES RES ) bankruptcy announcement on a sample of 35REITs: 18 Equity, 8 Financial, and 9 Residual investment trusts. RES RESbelonged to the last category of trusts. An analysis of the 121 day periodsurrounding the event revealed that the bankruptcy announcement decreased thevalue and increased the perceived riskiness of REITs; there was a negative stockprice effect on the announcement day, and a positive change in systematic riskfollowing the event. In particular, the study showed that these effects were limitedto Residual REITs; when studied separately, the Equity and Financial trusts showedno abnormal returns during the event window, nor did they experience anystatistically significant change in systematic risk.
Among the Residual REITs, the authors found that the magnitude of theabnormal return varied cross-sectionally by leverage, indicating that the marketdiscriminates among industry members in assessing intra-industry effects ofinformation arrival. The main conclusion offered by this study was that treatingrival firms as a homogeneous sample in the examination of information transfers canprovide misleading results.
From a methodological viewpoint, it would be useful here to mention themost recent study on the intra-industry effects of bankruptcy announcements.Haensly et al. (2001) replicate the stratification methodology adopted by the Langand Stulz (1992) study mentioned earlier, but use a sample from a single legalregime. They find that the effects of bankruptcy announcements on competitors areambiguous, and results are very sensitive to the debt screen employed in sampleselection. A study of the ripple effects of bankruptcies appears, therefore, to be apotential subject for further research.
CAPITAL STRUCTURE ADJUSTMENTS
Change in capital structure is another area in which the results of differentintra-industry studies disagree. Michael Hertzel (1991) first investigated the stockprice effects on rival firms due to stock repurchase tender offers made within theindustry. Citing theoretical models that demonstrate strategic changes in a firm's
89
Journal of Economics and Economic Education Research, Volume 5, Number 1, 2004
capital structure can have implications for industry counterparts, he argued thatinformation about the repurchasing firm could cause the market to reassess earningsprospects for rival firms. However, for a sample of 134 offer announcements overthe period 1970 to 1984, the author found no significant valuation effects fornon-announcing firms, which indicates that the information content of repurchaseannouncements pertains mainly to the firm making the offer. These results parallelthose found by Slovin et al. (1992), who compared the intra-industry effects ofseasoned equity issues made by banks and industrials. While no industry-widevaluation effects could be observed for common stock issues by industrial firms, asignificantly negative impact on rivals was seen within the banking industry. Theauthors ascribed these findings to the information structure of bank operations,which in their view limits the dissemination of information necessary for theassessment of individual bank value and riskiness.
In contrast to these studies, Szewczyk (1992) reported significantly negativeabnormal returns for the rivals of industrial firms announcing equity and debt issues.The sample included announcements between 1970 and 1983 for which a date couldbe identified in the Wall Street Journal Index. In all, 128 common stock, 54convertible debt, and 302 straight debt offerings were employed in the study.Significantly negative abnormal returns were observed for both announcing rivalfirms in the case of equity and convertible debt offerings. For the issue of straightdebt, however, a significant (negative) effect was seen only for the industry rivals.These findings indicate that the market draws inferences about industry prospectsfrom announcements of equity and debt offerings.
Unlike Hertzel (1991) and Slovin et al. (1992), Akhigbe and Madura (1999)focused exclusively on the ripple effects of bank stock repurchases, since on accountof capital requirements and other regulatory constraints, events at banks are likelyto constitute a special case. And in contrast to the two earlier studies, these authorsdid find that repurchases of stock by banks have a significantly positive effect onboth the repurchasing banks and their industry rivals.
Erwin and Miller (1998), on the other hand, find that while theannouncement of open market repurchases has a positive effect on the announcingfirm, it has a negative effect on rival firms. Thus, these authors discover a net"competitive" rather than a net "contagion" effect from stock repurchaseannouncements. Further, they find that this competitive effect is stronger in thoseindustries where competition is less and in which the degree of similarity betweenthe announcing firm and its rivals is lower.
90
Journal of Economics and Economic Education Research, Volume 5, Number 1, 2004
DIVIDEND CHANGES, INITIATIONS AND OMISSIONS
Firth (1996) studied the existence of ripple effects from dividendadjustments. He hypothesized that dividend changes by one firm could possessvaluation implications for other firms in the same industry since management mayrevise dividends to signal changes in future earnings and cash flows from: (1)anticipated industry-wide changes, or (2) perceived shifts in competition or marketshare within the industry. Thus, performance and operating strategy linkages amongfirms may cause investors to apply information releases of one company to itscompetitors.
The study included a total of 543 dividend increases and 106 dividend cutsbetween 1980 and 1991, and measured the impact of these changes on "rival firms"defined as those sharing the 4-digit SIC code of the dividend change firm. Theauthor employed standard event study methodology to assess the market reaction todividend changes; abnormal returns were calculated as the difference between actualand expected returns, with the latter being generated by estimating the market modelusing daily returns on the CRSP equally-weighted market index. Firth found thatnon-announcers on average were re-valued in the same direction as the announcingfirm, though by a smaller magnitude. Thus, dividend increases (decreases) by onefirm constituted good news (bad news) for that firm as well as for the other membersin its industry. This observation is consistent with dividend revisions being basedon perceived changes in industry-wide factors rather then anticipated alterations inmarket share. In addition, Firth tested whether the dividend "surprise" (theabnormal return of the announcing firm) was related to any changes in earningsforecasts of non-reporting firms. He found the unexpected revisions in analysts'earnings forecasts of non-reporting firms to be directly related to the abnormal stockreturns of the dividend change announcer. Overall, these results led Firth toconclude that dividend changes by one firm carried informational value for otherfirms in the same industry.
Laux et al. (1998) studied the intra-industry effects of large dividendrevisions, and found a heterogeneous effect on rivals; rivals that are unlikely to bethreatened by competitive realignments experience a revaluation in the samedirection as the announcing firm, while those likely to be affected by suchrealignment do not experience statistically significant stock price effects. Finally,Howe and Shen (1998) showed that dividend initiations are purely form-specificevents, while Caton et al.(2003) documented the possibility of ripple effects fromdividend omissions.
91
Journal of Economics and Economic Education Research, Volume 5, Number 1, 2004
CORPORATE TAKEOVERS, MERGERS AND RESTRUCTURING
In an effort to test the hypothesis that horizontal mergers have collusive,anticompetitive effects, Eckbo (1983) measured the stock price effects of mergerproposal announcements for merging firms and their horizontal rivals. Thecollusion hypothesis suggests that a horizontal merger should have a positivevaluation effect on the rival firms, since the costs of monitoring any existingcollusive agreement will decline with a reduction in the number of independentproducers in the industry. Further, rivals outside the collusive agreement shouldalso earn positive abnormal returns since they can free-ride on higher product prices.The sample included a total of 259 merger proposals over the period 1963 to 1978.Horizontal rivals were identified on the basis of the 4-digit SIC code, and abnormalreturns around the Wall Street Journal announcement date were calculated using themarket model. Even though for a large subset of events rivals experienced positivestock price effects, the behavior of abnormal returns over the merger proposal andsubsequent antitrust complaint announcements did not support the collusionhypothesis. Instead, the overall results were consistent with the argument that rivalsenjoy positive abnormal returns at the merger proposal announcement because ofthe potential increase in productive efficiency; the author suggests, for instance, thatthe announcement can reveal information which allows rivals to imitate thetechnological innovation prompting the acquisition.
Mitchell and Mulherin (1996) obtained similar results in their test of theproposition that industry fundamentals contribute to takeover and restructuringactivity. For the period 1982 to 1989, the authors found distinct patterns in the rateand clustering of these activities across 51 industries. A link between industryshocks and takeover activity implies that the announcement of a takeover at one firmshould elicit a positive stock price response from other members of the industry.For 607 announcements of takeover or restructuring activity, significantly positiveabnormal returns were observed for rival firms in the event month. As in the caseof Eckbo (1983), the authors did not interpret these spillover effects as evidence ofanticipated market power. Since industry fundamentals appeared to drive thetakeover and restructuring activity, the more benign explanation for the positiveabnormal returns could be offered, that investors anticipated ongoing industry-widerestructuring activity.
A significantly positive valuation effect on rival firms was also observed forthe 128 going-private transactions between 1980 and 1988 studied by Slovin et al.(1991). In contrast to the case of mergers and takeovers, however, this impact on
92
Journal of Economics and Economic Education Research, Volume 5, Number 1, 2004
rivals could not be attributed to operating synergy or market power becausegoing-private transactions do not involve a consolidation of firms. Instead, theauthors suggested that buyout bids revealed information about future cash flows inthe industry.
In another study, Slovin et al. (1995) compared the information content ofthree mechanisms of restructuring: (1) equity carve-outs, which are public offeringsof subsidiary equity; (2) spin-offs, which distribute subsidiary equity to the ownersof the parent firm through pro rata stock dividends; and (3) asset sell-offs, whichare sales of subsidiaries to third parties. The objective of this study was to identifythe sources of gain to the parent firm conducting such restructuring activity byfocusing on the contemporaneous valuation effects on industry rivals. These rivalswere defined as firms belonging to the same 4-digit SIC code as the announcingfirm. For a sample period 1980 through 1991, the authors found that equitycarve-outs were associated with significantly negative abnormal returns to otherindustry members. This observation is consistent with two views: that the equitycarve-out signals over-valued industry assets, or that it reflects an improvedcompetitive position for the restructured parent. An analysis of equity betas forrivals revealed no shifts round the event dates, suggesting that the observed stockprice effects were not an outcome of changes in industry systematic risk.
In contrast to equity carve-outs, spin-off announcements elicited a positivestock price response from industry rivals, indicating that these events constitute afavorable signal about industry value. In particular, managers of the parentcompany believe the unit to be undervalued, and are therefore unwilling to issueequity in the subsidiary as a method of restructuring. This action thereforeconstitutes favorable information for rivals if the unit has industry-commonelements. Asset sell-offs, the third method of restructuring, did not have anyintra-industry valuation effects.
More recently, Akhigbe and Madura (1999; 2001) have examined theindustry-wide effects of bank acquisition announcements and insurance companymergers. In the first study, they found that bank acquisition announcements caused,on average, a significantly positive revaluation in the equity of rival firms, thoughthe impact was conditioned by firm-specific characteristics. In the second study,they once again found a positive effect of insurance company mergerannouncements, on both the announcing firm and on industry rivals, lendingcredence to the idea that mergers act as signals to the market in the face ofinformation asymmetry.
93
Journal of Economics and Economic Education Research, Volume 5, Number 1, 2004
The final section below provides a brief account of miscellaneous studieswhich further support the view that a variety of developments at one firm can haveimportant implications for other industry members. These studies consider suchevents as strikes, bond rating changes, stock splits, layoffs, and announcements ofR&D expenditures.
OTHER EVIDENCE OF INTRA-INDUSTRY EFFECTS
The work by Kramer and Vasconcellos (1996) belongs to the class ofstudies that examines the linkages between non-financial resource markets andstockholder wealth. The authors extended the inquiry into the economic effects ofstrike activity by measuring the industry-wide stock price impact of strikes. Thestudy included manufacturing firms operating in highly concentrated industrieswhich experienced a strike by 1,000 or more workers between January 1982 andJuly 1990. The authors limited their definition of industry rivals to a maximum ofthe top four competitors. The final sample consisted of 21 strikes across 9industries, and 41 non-struck competitors. Standard event study methodologyindicated that the struck firm suffered a statistically insignificant decline in marketvalue over the 30 trading days prior to the strike, but experienced a post-strikeincrease in value in the post-strike period. These results suggest that concessionsmade by labor exceeded the quid pro quo costs (such as profit sharing and layoffprotection).
The gains to non-struck competitors in the pre-strike period were also notstatistically significant. However, over the month following the strike, like thestruck firms, these rivals experienced positive abnormal returns, suggesting thatinvestors expected the competitors to secure similar concessions from labor. Duringthe strike period, the struck firms suffered a decline in market value of 1.9%, butthese losses were not captured as gains by rivals; the latter earned abnormal returnsnot statistically different from zero. The authors attributed this absence of spilloverduring the strike period to the struck firm's ability to stockpile inventory, shiftproduction to other facilities, and subcontract production.
Zantout and Tsetsekos (1994) investigated the nature of informationconveyed by the announcement of increases in R&D expenditures. Such anannouncement could indicate to investors that the announcing firm will possess astrategic advantage over the competition from being the first to innovate.Alternatively, market participants may anticipate that rivals will benefit fromtechnology spillovers. The authors conducted an event study to test these
94
Journal of Economics and Economic Education Research, Volume 5, Number 1, 2004
hypotheses. Rivals were defined as those operating in the same 4-digit SIC codeand which were of the same size (in terms of sale) as the announcing firm. For 114announcements made by 71 firms between June 1979 and December 1990, theauthors found that the announcing firms experienced positive abnormal returnswhile their rivals suffered negative abnormal returns at the announcement of theplanned increase in expenditures. These findings support the hypothesis that firstmovers enjoy an innovation-induced competitive advantage.
In their study of stock split announcements, Tawatnuntachai and D'Mello(2002) found that the event had a generally positive valuation effect on rival firms,and that this effect is associated with changes in earnings levels (but not changes inearnings volatility) for the rival firms. With regard to corporate downsizing, Sunand Tang (1998) found a negative effect of such announcements on both originatingand rival firms. Finally, Akhigbe et al. (1997) found that bond rating downgradeswere associated with negative stock price effects for both the re-rated firm and asubset of industry counterparts that were more closely related to the re-rated firm.Thus, the activity of rating agencies such as Moody's and S&P appear to haveimplications not only for the firm for which they supply the reclassified rating, butalso for other firms in the same industry.
CONCLUSION
A review of the finance literature indicates a sustained interest amongacademicians in the possibility of industry-wide effects from a diverse set ofcorporate events. Traditionally considered to be firm-specific, such events as capitalstructure changes, dividend adjustments, stock splits, and rating reclassificationsnow are known to have the potential to convey industry-wide information to capitalmarkets. The existing research on intra-industry information effects sheds light onnumerous economic and regulatory issues. For instance, the emerging evidence onthe far-reaching effects of re-rating activity should be of considerable value to thecurrent debate on the regulation of credit rating agencies and the legally sanctionedbarriers to entry in the rating industry.
The evidence provided in this paper also suggests that there is someambiguity with regard to the spillover effects of some events; for instance, existingstudies do not agree on the industry-wide implications of bankruptcyannouncements and capital structure adjustments. The potential for research stillexists in these and additional areas. Arguably, one of the more challenging areas ofstudy in the intra-industry information arena is the identification of "rational" and
95
Journal of Economics and Economic Education Research, Volume 5, Number 1, 2004
"irrational" contagion; that is, in the instances where rivals are found to be affectedin the same direction as the originating firm, there is an evident need to be able toascertain whether or not the market was justified in generalizing the informationprovided by the event from the firm to the industry as a whole.
REFERENCES
Akhigbe, A., J. Madura, & A. M. White (1997). Intra-Industry Effects of Bond RatingAdjustments. The Journal of Financial Research, 20, 545-561.
Akhigbe, A. & J. Madura (1999). Intra-Industry Signals Embedded in Bank AcquisitionAnnouncements. Journal of Banking and Finance, 23, 1637-1654.
Akhigbe, A. & J. Madura (1999). Intraindustry Effects of Bank Stock Repurchases. Journalof Financial Services Research, 15, 23-36.
Akhigbe, A. & J. Madura (2001). Intra-Industry Signals Resulting from Insurance CompanyMergers. Journal of Risk and Insurance, 68, 489-505.
Asness, C., & M. Smirlock (1991). A Note on REIT Bankruptcy and IntraindustryInformation Transfers: An Empirical Analysis. Journal of Banking and Finance,15, 1171-1182.
Baginski, S. P. (1987). Intraindustry Information Transfers Associated with ManagementForecasts of Earnings. Journal of Accounting Research, 25, 196-216.
Bannister, J. W. (1994). Earnings Signals and Inter-Firm Information Transfers. Journal ofBusiness Finance and Accounting, 21, 1127-1149.
Caton, G. L., J. Goh, & N. Kohers (2003). Dividend Omissions and Intra-IndustryInformation Transfers. The Journal of Financial Research, 26, 51-64.
Cheng, L. T. W., & J. E. McDonald (1996). Industry Structure and Ripple Effects ofBankruptcy Announcements. Financial Review, 31, 783-807.
Clinch, G. J., & N. A. Sinclair (1987). Intra-Industry Information Releases: A RecursiveSystems Approach. Journal of Accounting and Economics, 9, 89-106.
Eckbo, E. B. (1983). Horizontal Mergers, Collusion, and Stockholder Wealth. Journal ofFinancial Economics, 11, 241-273.
96
Journal of Economics and Economic Education Research, Volume 5, Number 1, 2004
Erwin, G. R., & J. M. Miller (1998). The Intra-Industry Effects of Open Market ShareRepurchases: Contagion or Competitive? The Journal of Financial Research, 21,389-406.
Firth, M. (1976). The Impact of Earnings Announcements on the Share Price Behavior ofSimilar Type Firms. Economic Journal, 86, 296-306.
Firth, M. (1996). Dividend Changes, Abnormal Returns, and Intra-Industry Firm Valuations.Journal of Financial and Quantitative Analysis, 31, 189-211.
Foster, G. (1981). Intra-Industry Information Transfers Associated with Earnings Releases.Journal of Accounting and Economics, 3, 201-232.
Haensly, P. J., J. Theis, & Z. Swanson (2001). Reassessment of Contagion and CompetitiveIntra-Industry Effects of Bankruptcy Announcements. Quarterly Journal ofBusiness and Economics, 40, 45-63.
Hertzel, M. G. (1991). The Effects of Stock Repurchases on Rival Firms. Journal ofFinance, 46, 707-716.
Howe, J. S., & Y. Shen (1998). Information Associated with Dividend Initiations:Firm-Specific or Industry-Wide? Financial Management, 27, 17-26.
Kramer, J. K., & G. M. Vasconcellos (1996). The Economic Effect of Strikes on theShareholders of Nonstruck Competitors. Industrial and Labor Relations Review, 49,213-222.
Lang, L. H., & R. M. Stulz (1992). Contagion and Competitive Intra-Industry Effects ofBankruptcy Announcements: An Empirical Analysis. Journal of FinancialEconomics, 32, 45-60.
Laux, P., L. T. Starks, & P. S. Yoon (1998). The Relative Importance of Competitive andContagion in Intra-Industry Information Transfers: An Investigation of DividendAnnouncements. Financial Management, 27, 5-16.
Mitchell, M. L., & J. H. Mulherin (1996). The Impact of Industry Shocks on Takeover andRestructuring Activity. Journal of Financial Economics, 41, 193-229.
Slovin, M. B., M. E. Sushka, & Y. M. Bendeck (1991). The Intra-Industry Effects ofGoing-Private Transactions. Journal of Finance, 46, 1537-1550.
97
Journal of Economics and Economic Education Research, Volume 5, Number 1, 2004
Slovin, M. B., M. E. Sushka, & J. A. Polonchek (1992). Informational Externalities ofSeasoned Equity Issues: Differences Between Banks and Industrial Firms. Journalof Financial Economics, 32, 87-101.
Slovin, M. B., M. E. Sushka, & S. R. Ferraro (1995). A Comparison of the InformationConveyed by Equity Carve-Outs, Spin-Offs, and Asset Sell-Offs. Journal ofFinancial Economics, 37, 89-104.
Sun, H., & A. P. Tang (1998). The Intra-Industry Information Effect of DownsizingAnnouncements. American Business Review, 16, 68-76.
Szewczyk, S. H. (1992). The Intra-Industry Transfer of Information Inferred fromAnnouncements of Corporate Security Offerings. Journal of Finance, 47, 1935-45.
Tawatnunchai, O., & R. D'Mello (2002). Intra-Industry Reactions to Stock-SplitAnnouncements. The Journal of Financial Research, 25, 39-57.
Zantout, Z. Z., & G. P. Tsetsekos (1994). The Wealth Effects of Announcements of R&DExpenditure Increases. Journal of Financial Research, 17, 205-216.

98
Journal of Economics and Economic Education Research, Volume 5, Number 1, 2004
99
Journal of Economics and Economic Education Research, Volume 5, Number 1, 2004
WAGES AND VOLUNTARY LABORTURNOVER: COMPARING IT WORKERS
WITH OTHER PROFESSIONALS
James Morgan, Northern Arizona UniversityWendy Campione, Northern Arizona University
Max Jerrell, Northern Arizona University
ABSTRACT
There is a body of literature suggesting that a new labor contract betweenemployer and employee is emerging which places less value on loyalty and longterm employment relationships. Some have argued that the use of computingtechnology contributes to this by making skills more common and transferableacross organizations, thereby encouraging organizations to hire away the skilledworkers of their competitors. Concern about voluntary job change specificallyamong IT professionals was heightened during the IT boom of the late 1990s.
This study examines monthly employment, wage, and job change data from1998 through the beginning of 2001. IT professionals were compared to othertechnical and managerial workers. In addition, IT workers employed in thecomputer services industry (the sector which includes software companies and ITconsulting firms) were examined as a distinct subgroup of IT workers. ITprofessionals who changed jobs were found to have gained a small wage premium,while other professional workers did not benefit from job change. In addition,voluntary job change rates were found to be high for IT professionals in thecomputer services industry, while IT professionals in other industries were no morelikely to change jobs than other professional workers.
INTRODUCTION
During the late 1990's, U.S. IT employers expressed substantial concernover what they perceived to be a substantial shortage of skilled IT workers withrapidly escalating wage rates and high rates of voluntary job change among IT
100
Journal of Economics and Economic Education Research, Volume 5, Number 1, 2004
workers with critical skills. Not surprisingly, many IT workers and groupsrepresenting them expressed a very different view of the nature and magnitude ofthis problem. They argued that employers were using the perceived shortage of ITworkers to justify visa exemptions to bring in foreign workers at wages thatundercut those required to hire and retain experienced U.S. workers. They cited thelack of evidence of rapid wage increases or unusually rapid employment growthacross the IT profession, arguing that rapid employment growth was occurring onlyat the highest skill levels (Bernstein & Hamm, 1998).
The performance of the IT labor market during this period of market stressis important since it is likely that similar pressures will occur in future periods ofstrong economic growth. Perhaps more importantly, IT wage and turnover behaviorduring this period are of interest for what they can tell us about the nature of theemployment relationship in the IT profession and perhaps for what they can tell usabout changes in the employment relationship across all professional occupations.The academic literature provides a number of potential explanations of andprescriptions for dealing with the high job turnover rates of IT workers. Theoriesrange from those that focus on unique aspects of the IT worker and IT jobs to thosethat suggest that the changing IT job market simply reflects changes, and perhapsrepresents the vanguard of changes, that are impacting employment relationshipsacross all industries and occupations. In addition, the economic theory of humancapital suggests the nature of a worker's skill set (as determined by such things asformal education and formal and informal on-the-job training) is a key factordetermining the likelihood of job turnover.
In this study, we will examine alternative theories postulated to explain ITjob turnover and determine the extent to which these theories are competing orreinforcing in terms of expected labor market behavior of IT workers. Then, usingdata from the US Current Population Survey (CPS), we will evaluate the degree towhich the alternative theories are supported by US labor market data.
HUMAN CAPITAL THEORY ANDTRADITIONAL ECONOMIC THEORY
In a broad sense, wage structures and labor turnover can be explained by thetheory of human capital as developed by Becker (1962). According to human capitaltheory, investments in skill acquisition come at a cost since time that could havebeen used in production is sacrificed to acquire the skills. A return on this
101
Journal of Economics and Economic Education Research, Volume 5, Number 1, 2004
investment is generated in succeeding periods since the acquired skills enhance theproductivity of the worker. Individuals can increase their productivity not onlythrough their investments in formal education, but also by learning work skills whilethey are actually on the job through formal training programs or informal instructionby supervisors or coworkers (Mincer, 1962).
Becker (1962) divides on-the-job training into general training and specifictraining. General training increases a worker's prospective productivity in a largenumber of firms. For example, training in the use a word processing package orconflict resolution skills would be expected to have equal value to a broad set offirms. Competition for the services of a worker with these general skills forces thecurrent employer to pay the full value of the skills to the workers or lose her/him toa competing employer. Therefore, the employer presumably cannot afford to pay forsuch training. The employee reaps all of the returns to general training and must, ina competitive labor market, bear all of the costs of such training. If the skillsdeveloped are general, the model of on-the-job training is not fundamentallydifferent than that for a worker deciding whether to bear the costs of formaleducation in anticipation of higher future earnings after completing their formaleducation.
Specific training increases the worker's productivity only at the firm thatprovides the training. For example, one may learn the operating procedures andbusiness rules of a particular firm or learn how use or maintain specializedinformation systems developed by the firm. The enhanced productivity from thistype of knowledge is only achieved if the worker remains with her current firm. Forall other firms, her productivity (and therefore her value) has not increased. Oncespecific training has occurred, the employee has incentive to remain with the firmas long as they receive at least some of the benefits of their improved productivityand the employer will gain from retaining the employee as long as they pay no morethan the full value of the employee's improved productivity. Since the worker is nowmore valuable to their current firm than to competing firms, the worker is less likelyto seek a job with another firm and the employer is more likely to make efforts toretain the worker. Specific training requires that the employee and employer tostrike a mutually beneficial bargain to share costs and returns of training, whichenhances job security for the employee and reduces voluntary turnover for theemployer.
When applying human capital theory to information systems (IS)professionals and other high tech workers, it is important to note that specific skillsas defined by Becker are far different than specialized skills. Highly specialized
102
Journal of Economics and Economic Education Research, Volume 5, Number 1, 2004
skills in mechanical engineering, JavaScript programming, or even in theimplementation of a specific ERP software package are likely to be of value to asubstantial number of firms constituting a competitive labor market. Thus, suchskills are general in Becker's terminology. To avoid confusion, we will henceforthuse the term "generally-valued" for Becker's general skills and firm-specific for hisspecific skills.
TRANSFORMATION OF WORK AND"THE NEW LABOR CONTRACT"
Increased global competition and rapid changes in technology of the 1980'sand 1990's set the stage for dramatic changes in the nature of work and the structureof organizations. To accommodate these changes, many researchers believe that anew employment relationship between employers and employees has emerged andthat IT is in the forefront of this emergence. Sommers (1995) remarks: "Employeesare now loyal first to their individual careers, second to their peers, and third to theircompany".
Under the old labor contract, the expectation was that good work and loyaltyon the part of employees would be appreciated and rewarded with good pay and jobsecurity by the employer. However, Chilton and Orlando (1996) argue That thissystem has "created high cost labor systems with insufficient incentives forproducing high quality goods." Rapidly changing needs of business for employeeswith specialized skills shifts employees' focus away from job security toemployment security. Hall and Moss (1998) suggest a new "Protean CareerContract" is emerging in which -"The career is managed by the person, not theorganization". Development is self-directed, continuous, and often found in workchallenges. The organization is expected to provide challenging assignments,developmental relationships, information, and training opportunities.
A recent content analysis of articles specifically examining the NewEmployment Relationship in the human relations literature (Roehling, et. al., 2000)identified the requirement for employers "to provide training, education, and skilldevelopment opportunities" and for the employee to "assume responsibility fordeveloping and maintaining skills" as the most common characteristics of this newrelationship. Thus firms are demanding, and in need of, cutting-edge skills andemployees need maintenance of employability through continual trainingopportunities.
103
Journal of Economics and Economic Education Research, Volume 5, Number 1, 2004
In applying these concepts to IT worker retention, Cappelli (2000) states:"a market-driven retention strategy begins with the assumption that long-term,across-the-board employee loyalty is neither possible nor desirable." Echoing theseideas, Stokes (2000) suggests that neither the employee nor employer desires acareer length commitment, so that reward and incentive structures should be builtaround the desired length, such as, keeping workers through the completion of aproject.
The studies cited above suggest that loyalty, job security, and theexpectation of long-term employment with the same firm are less important underthe new labor contract. Employers are not expected to offer continued employmentacross a career and employees are not expected to forego short-term wage gainsfrom alternative offers in exchange for a long-term commitment to the firm. At thesame time, the new contract requires employers to provide employees access to newskills and requires employees to remain employable by taking the initiative tomaintain current skills.
Has computer technology played a special role in the emergence of the Newlabor contract? Zuboff (1992) argues that computer technology, in addition toautomating certain functions, serves to "informate" business enterprises. That is,computer systems make it easier to acquire information about an organization. Theyformalize and expose data about company operation and policies and procedures.This changes the nature of relationships within an organization, and also makes iteasier for those outside the firm to gain an understanding of its systems. If this is thecase, computerization is in effect increasing the proportion of generally-valued skillsas compared to firm-specific skills.
McConnell (1996) contends that the impact of computers is pervasive acrossoccupation and industry lines - "moving many organizations from a pyramid shapestructure to a flatter structure." Quinn, Anderson, and Fenkelstein (1996) argue theability to leverage information and intellect is leading to new organizationalstructures which are centered on intellectual skill sets. They argue that "leveragingintellect" by hiring the best people, stimulating them to internalize the informationknowledge, skills, and attitudes needed for success, creating systematicorganizational structures to capture, focus, and leverage intellect, and demandingand rewarding performance is the key to success. Workers in such a firm will staybecause the intellect-nurturing climate helps them increase their value, so they areless likely to be lured away by offers from other firms.
If changes in IT are an important factor in the emergence of neworganizational relationships, we would expect the IT labor market to be on the
104
Journal of Economics and Economic Education Research, Volume 5, Number 1, 2004
leading edge of this change. The reduction of loyalty under the new labor contractand the increased proportion of generally-valued skills in computer-based systemssuggest that IT workers would have higher turnover rates than other professions.
TRAINING, AND THE NEW LABOR CONTRACT
Empirical studies of training suggest that differences in schooling, work,and occupational choice decisions can be explained by unobserved variations in skilllevel with more able individuals investing more in both formal education andon-the-job training settings because their expected return for skill acquisition isgreater (Keane & Wolpin, 1997) and the likelihood of receiving training increaseswith the education level of the worker (Neal, 1997; Royalty, 1996).
Recent training studies imply that access to training opportunities is oftenviewed as a form of fringe benefit that firms can use to attract and retain higherquality workers. A survey of US firms (Barron, Berger & Black, 1997) found thatthere was no evidence that starting salaries were lower when workers receivedgreater on-the-job training, although on-the-job training did cause subsequentincreases in wages and productivity. In addition, large firms are much more likelythan smaller firms to provide formal on-the-job training than smaller firms and firmsoffering more numerous and generous benefits to their employees are more likelyto provide training (Frazis, Herz & Harrigan, 1995. The incidence of training is alsolikely to be higher in firms where employee turnover is low (Frazis et.al., 1998) andwhich use high-performance work systems (such as just-in-time or MRP) (Lynch& Black, 1998).
Traditional human capital theory holds that the employer can only afford tooffer training that builds firm specific skill. However, if workers view trainingopportunities as a significant form of fringe benefit, employers offering strongtraining opportunities can select the most able workers out of a pool of candidatesand pay them the same wage that firms offering less training must pay to less ableworkers remaining in the candidate pool. This allows employers to in effect recouptraining costs by getting a greater stock of ability at the same cost.
Viewing training as a cost of attracting and retaining quality workers is veryconsistent with the concepts of the new labor contract. The lessening of loyaltyunder the new labor contract is perhaps, in part, explained by the fact that firms areforced to provide access to training that is not specific to the firm, but enhances theworker's value in the competitive labor market (generally-valued training). Although
105
Journal of Economics and Economic Education Research, Volume 5, Number 1, 2004
human capital theory indicates that firms are not willing to pay the costs ofproviding generally-valued training, firms may pay the direct costs of such training,in return for obtaining and retaining higher quality workers at a given cost.
LABOR MARKET CHARACTERISTICS OF IT WORKERS
A number of studies of the IT field over the past 20 years have attemptedto explain job satisfaction and job turnover in terms of the unique characteristics ofIT workers and the job characteristics they desire. The motivating factors identifiedfor IT workers are similar to those described for workers in general under the newlabor contract.
Couger, Zawacki, and Oppermann (1979) studied motivational levels ofMIS managers and other managers. They found stronger growth needs scores andlower social needs scores for MIS managers. A later study (Zawacki, 1992)confirmed these results and suggested than managers must recognize this need forgrowth and new challenges to motivate IT workers. With respect to morespecific aspects of job motivation, Couger (1988) identified the top motivatingfactors for analysts and programmers as: the work itself, opportunity forachievement, opportunity for advancement, pay and benefits, recognition, andincreased responsibility. Job security, working conditions, company policies, andinterpersonal relations were ranked lower. Smits, McLean, and Tanner (1993) foundthat the desire for interesting and challenging work and task variety and autonomyare key motivational factors for high achieving IS professionals and a recent surveyIS professionals in the Midwest (Mak & Sockel, 2001) found that the employees'assessments of career development prospects with their current firm had asubstantial impact on retention.
It is worth noting that there is a distinction between worker satisfaction withthe work environment and worker turnover intentions. Guimaraes and Igbaria (1992)found that job satisfaction was the primary factor for IT workers to feelorganizational commitment. However, they found that job satisfaction had no directeffect on turnover intentions.
Stokes (2000) comments that reasons workers stay or leave an organization"vary as much as these professionals' skills and personalities and organizations'cultures and IT functions". He argues for the use of employability training and notesthat: "Successful firms accept the marketability of employability". While it may bebeneficial to use training as part of a retention strategy, Sheehan (2000) contends
106
Journal of Economics and Economic Education Research, Volume 5, Number 1, 2004
that organizations tend to use training for reward purposes rather than as adiscipline-driven, reskilling strategy.
Several of the studies reviewed above suggest that employers wishing tominimize voluntary turnover of IT workers should ensure that jobs are varied andchallenging and that they involve the opportunity for acquisition of new skills. Thenew labor contract literature also suggests that those characteristics are important forobtaining high-quality professional workers, but is less clear on retention. Workerswho are provided good access to skill improvement opportunities may have higherjob satisfaction, but this may not translate into higher retention.
Shortages of workers with specialized skills may force employers of ITworkers to provide training in these areas even though these skills are immediatelyvaluable to other competing firms. Firms must balance training costs and anincreased risk of losing trained workers against the increase in the ability level of theworkers they attract and the enhanced productivity of the workers during theiremployment with the firm. The choice may become one of: fail to provide trainingand retain a set of less qualified workers for a longer period of time, or providetraining and retain more able and skilled workers for a shorter period of time.
IMPACT ON EXPECTED VOLUNTARY LABOR TURNOVER
The alternative theories described above offer differing expectations withrespect to voluntary labor turnover of IT workers. Under the new labor contract withits lessened emphasis on loyalty, it would be expected that voluntary turnover wouldbe increasing across the board. However, if IT workers are on the leading edge ofthis trend, we would expect their voluntary turnover rates to be higher than those ofother professions that are less affected by the new economy. Human capital theoryreaches the same conclusion. Job skills that are more generally-valued have a morecompetitive labor market and thus there is less room for employers and employeesto strike a mutually beneficial bargain for the employee's labor. Labor turnoverwould be expected to be higher the more generally-valued a worker's set of skills.If IT makes the internal workings of a business more transparent, it makes skillsmore generally-valued and IT workers, on the leading edge of that transformationwould be expected to have a higher proportion of generally-valued skills, and thushigher rates of voluntary turnover.
On the other hand, the literature on job motivation of IT workers suggeststhat they are likely to be better satisfied and thus (probably) less likely to move to
107
Journal of Economics and Economic Education Research, Volume 5, Number 1, 2004
another job to the extent that their current job gives them access to the opportunityto learn new skills and the ability to perform interesting and fulfilling work. Thus,workers would generally be less likely to voluntarily leave jobs with more accessto learning new skills.
TURNOVER AND WAGE RATE
Also of interest in this study is the impact of voluntary job turnover on thewage of employees. Other things being equal, an employee would voluntarilychange jobs only if he or she received a wage premium for doing so. Labor marketanalyses that have measured wages longitudinally (so that a worker's current wagemay be compared to a former wage level for that same employee) have found theexpected positive wage effect for a voluntary job change (Keith & McWilliams,1999; Tomkins & Twomey 2000). However, cross sectional studies that comparethe wage levels of workers who have changed jobs with the wages of comparableworkers (equalizing for effects of age, sex, race, education level, and total workexperience) who have not changed jobs have often concluded that job-changers tendto have lower wages. Light and McGarry (1998), for example, observed a negativeimpact of job change on wage in a purely cross sectional study based on data fromthe NLSY. They postulated that jobs could be viewed as "experience goods" whereworkers will change jobs if the experience of the job is less favorable than expected.
Some researchers have suggested that cross sectional results showing lowerwages for job-changers than for job-stayers are due to adverse selection in the "usedworker" market (job-changers). Current employers are better informed about theabilities of their employees and thus are able to concentrate their retention effortson their better workers. Thus there is adverse selection in the market for "used"workers (Acemoglu & Pirchke, 1998; Greenwald, 1986; Waldman, 1984). Workerswho quit one job to move to another are likely to be those workers who were passedover for promotion or whose previous employer was unwilling to match analternative offer. Quitters may increase their salary, but still make less on averagethan those who do not change jobs.
Countering these adverse selection effects, aspects of the new labor contractseem to imply a measure of positive selection. The emphasis on the employee'sresponsibility to maintain employability suggests that companies believe that theyhave numbers of current employees whom they would not be willing to hire on theopen market. Presumably, this set of employees would not have access to voluntary
108
Journal of Economics and Economic Education Research, Volume 5, Number 1, 2004
job change and only those employees maintaining a current skill set would be ableto find alternative job offers.
Another factor contributing to positive selection among voluntary jobchangers is "poaching." A study of French workers (Hocquet, 2000) found thatworkers with trained in certain types of skills by their former employers earned asubstantial wage premium if they left that employer and went immediately toanother employer in the same sector. This suggests that workers are receivingtraining that produces skills that are valued by competing firms. To cite just acouple of examples from the IT field, United Health Care reported losing "abouthalf" of 600 new IT hires in 1997-98 to other employers (McGee & Davey, 1998)and a Gartner group study (Bittman, 1998) suggested that "Services providers likeIBM, EDS and CSAA grow their NT know-how by stealing talent away from theirend users with a minimum 35 (pay) percent increase."
The specificity of skill needs in IT is also an important factor that maycontribute to poaching behavior. Moore and Burke (2002) suggest that, "At anygiven time within the IT profession some skill-sets are more marketable than others.In today's environment, skills associated with say, network and databasemanagement (such as in Oracle database administration) and with enterpriseresource planning (ERP) systems (such as those in people-soft and SAP) are indemand." The sets of highly demand skills also tend to change rapidly. As Memishi(2000) notes "workers proficient in Novell were in huge demand about five yearsago and today that's not a problem. There are multiple skill sets and so if somethingnew comes down the pike and people aren't trained in that application, that's whenthere's a shortage."
Overall, theoretical models and past empirical results do not provide aclear-cut prediction as to the effects of job change on the wage level. Some evidencesuggests that in purely cross sectional studies (as will be the case for our analysis)wage rates of job changers have tended to fall below those of job-stayers. However,the new labor contract research suggests that this is changing and that positiveselection factors, including incentives for poaching those workers with the mosthighly desired skill-sets, may begin to outweigh the adverse selection factors leadingto higher wages among voluntary job-changers.
109
Journal of Economics and Economic Education Research, Volume 5, Number 1, 2004
CPS SURVEY DATA
The empirical component of this study is based upon data from the CurrentPopulation Survey (CPS which is household based. If a person changes theirresidence, they drop from the survey and the new occupant of that residence issurveyed. Thus, only job changes not involving changes in residence are includedin this study. Workers can be in the survey for 8 months. However, they are askedquestions about their wages only in months 4 and 8 in the survey. The data set usedhere is based upon data for the 4th and/or 8th months in the survey plus datameasuring voluntary job change over the prior 3 months - workers who reportedchanging employers in any one of the 3 previous months were coded as jobchangers. Individuals are included in our survey data only if they were surveyedthroughout months 1 through 4 or throughout months 5 through 8. The data set usedin this analysis covers a three year period (April 1998 through March 2001). It isrestricted to individuals 25 years of age and above, working full time, and reportingweekly earnings of at least $150. This allows us to focus the analysis on full-timepaid employment of workers who have completed their initial formal education.
Most of the variables used are standard demographic and economicmeasurements. The wage variable used is an average weekly wage estimatecompiled by the CPS by converting wage values reported over differing timeperiods (hourly, monthly, annually, etcetera) to a weekly bases (and, if necessaryconstructing values) using a standard procedure (US BLS, 2000). This wage istop-coded at $2881.61, or approximately $150,000 per year. Following Autor, Katzand Kreuger (1998), top coded wages are reported as 1.5 times the top code valueor $4322.42 per week to adjust for truncation bias. In the analyses that follow, lessthan two percent of any of the groups studied had top coded values.
Comparison of IT workers with workers in other professions is the majorfocus of this study. The detailed occupation code of workers was used to separateIT workers (codes 64 and 229) from other business and technical professionals.Professional workers and technicians in all other non health care related fields wereidentified as the base group of other comparable professional workers.
Data identifying the industry in which a worker is employed are also ofinterest. Industry code 732 Computer and Data Processing Services is the industrycategory that includes software and computer consulting services companies.Arguably, firms in this industry tend to provide their employees with more accessto new technology and provide workers with greater professional growthopportunities than companies that are not in computer related industries.
110
Journal of Economics and Economic Education Research, Volume 5, Number 1, 2004
Comparison of IT workers in this IT related industry with IT workers in less ITfocused industries allows us to determine whether this industry has distinct wageand turnover behavior.
EMPIRICAL RESULTS
Descriptive statistics for a number of qualitatively measured demographiccharacteristics that might be expected to impact wage and voluntary labor turnoverrates are presented in Table 1.
The education level of IT workers appears to be somewhat higher than thatof other technical occupations and management related occupations. Distribution ofemployment across industries shows that just over one-third of IT workers areemployed specifically in the Computer services industry, which constitutes only avery minor component of employment in the other occupation categories. ITworkers tend to be more concentrated in large cities than workers in the other twocategories. Finally, female workers are much more prevalent in the managementrelated occupations than in the IT and other technical occupation groups, whereas,Black and Hispanic workers are about equally represented across the threeoccupation categories, but are underrepresented across all of these occupationgroups relative to their prevalence in the general population.
Age is measured in individual years in the CPS data set. Table 2 shows thedistribution of employment by age grouped in 5-year age ranges and comparedacross occupation groups. Clearly the proportion of workers in the age groups upto age 40 is substantially higher in IT related occupations, than in the otheroccupational categories.
Table 3 presents summary data showing the average weekly wage forworkers at each age range across the occupation groups. The data suggest that youngworkers in IT related professions experience a substantial wage premium comparedwith the other occupation groups. However, this premium shrinks substantially withage.
We have not yet presented data about the rates of voluntary job change.Since these rates are one of the principal targets of our analysis, we present the jobchange data in Table 4 along with results of a statistical test of whether theproportions are equal across occupation groups.
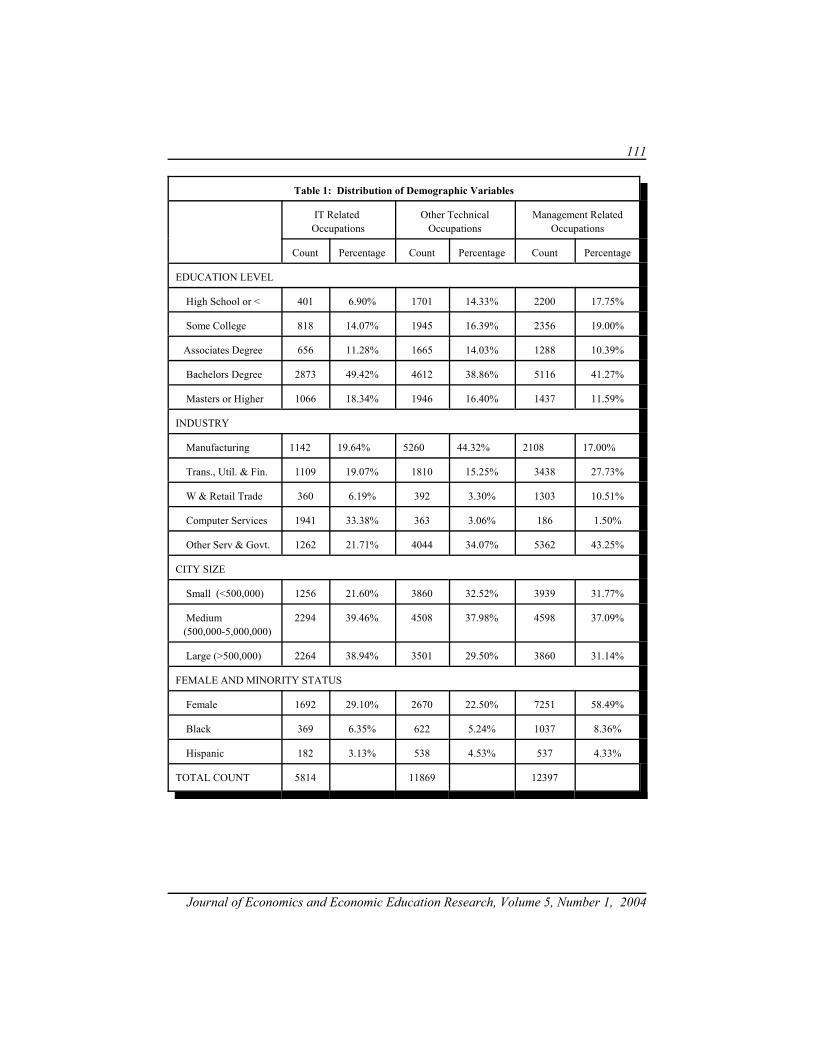
111
Journal of Economics and Economic Education Research, Volume 5, Number 1, 2004
Table 1: Distribution of Demographic Variables
IT Related Occupations
Other TechnicalOccupations
Management RelatedOccupations
Count Percentage Count Percentage Count Percentage
EDUCATION LEVEL
High School or < 401 6.90% 1701 14.33% 2200 17.75%
Some College 818 14.07% 1945 16.39% 2356 19.00%
Associates Degree 656 11.28% 1665 14.03% 1288 10.39%
Bachelors Degree 2873 49.42% 4612 38.86% 5116 41.27%
Masters or Higher 1066 18.34% 1946 16.40% 1437 11.59%
INDUSTRY
Manufacturing 1142 19.64% 5260 44.32% 2108 17.00%
Trans., Util. & Fin. 1109 19.07% 1810 15.25% 3438 27.73%
W & Retail Trade 360 6.19% 392 3.30% 1303 10.51%
Computer Services 1941 33.38% 363 3.06% 186 1.50%
Other Serv & Govt. 1262 21.71% 4044 34.07% 5362 43.25%
CITY SIZE
Small (<500,000) 1256 21.60% 3860 32.52% 3939 31.77%
Medium (500,000-5,000,000)
2294 39.46% 4508 37.98% 4598 37.09%
Large (>500,000) 2264 38.94% 3501 29.50% 3860 31.14%
FEMALE AND MINORITY STATUS
Female 1692 29.10% 2670 22.50% 7251 58.49%
Black 369 6.35% 622 5.24% 1037 8.36%
Hispanic 182 3.13% 538 4.53% 537 4.33%
TOTAL COUNT 5814 11869 12397
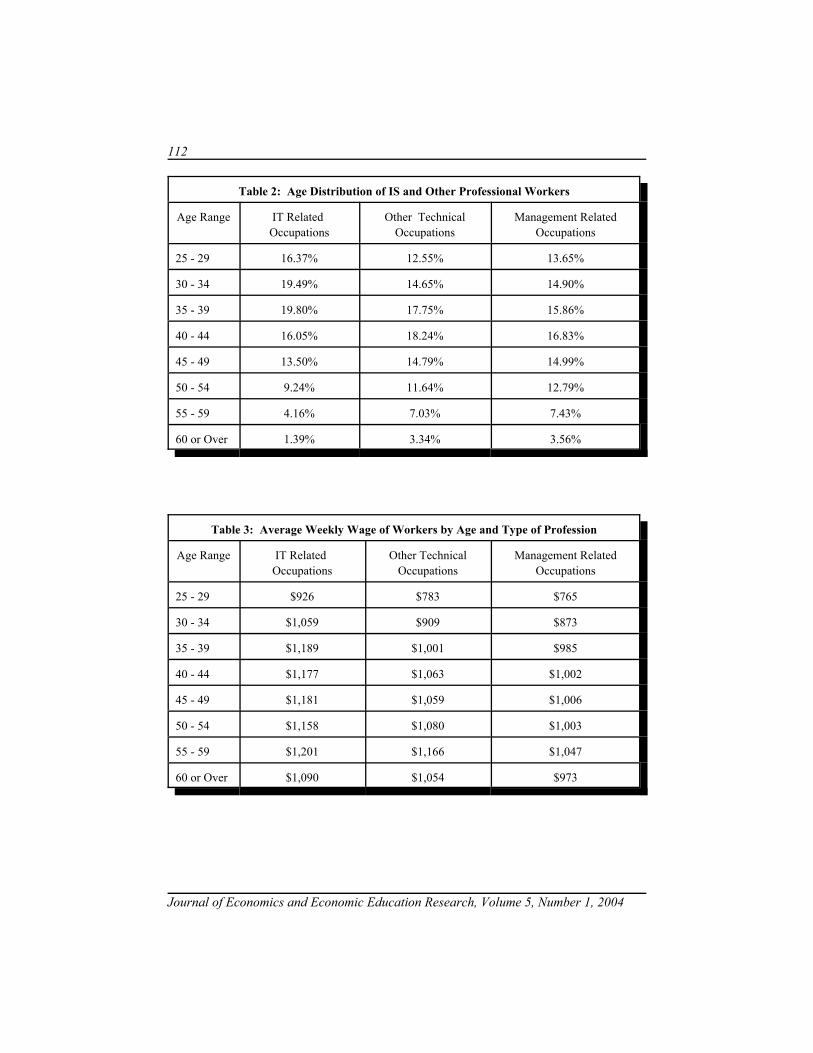
112
Journal of Economics and Economic Education Research, Volume 5, Number 1, 2004
Table 2: Age Distribution of IS and Other Professional Workers
Age Range IT Related Occupations
Other TechnicalOccupations
Management RelatedOccupations
25 - 29 16.37% 12.55% 13.65%
30 - 34 19.49% 14.65% 14.90%
35 - 39 19.80% 17.75% 15.86%
40 - 44 16.05% 18.24% 16.83%
45 - 49 13.50% 14.79% 14.99%
50 - 54 9.24% 11.64% 12.79%
55 - 59 4.16% 7.03% 7.43%
60 or Over 1.39% 3.34% 3.56%
Table 3: Average Weekly Wage of Workers by Age and Type of Profession
Age Range IT Related Occupations
Other TechnicalOccupations
Management RelatedOccupations
25 - 29 $926 $783 $765
30 - 34 $1,059 $909 $873
35 - 39 $1,189 $1,001 $985
40 - 44 $1,177 $1,063 $1,002
45 - 49 $1,181 $1,059 $1,006
50 - 54 $1,158 $1,080 $1,003
55 - 59 $1,201 $1,166 $1,047
60 or Over $1,090 $1,054 $973
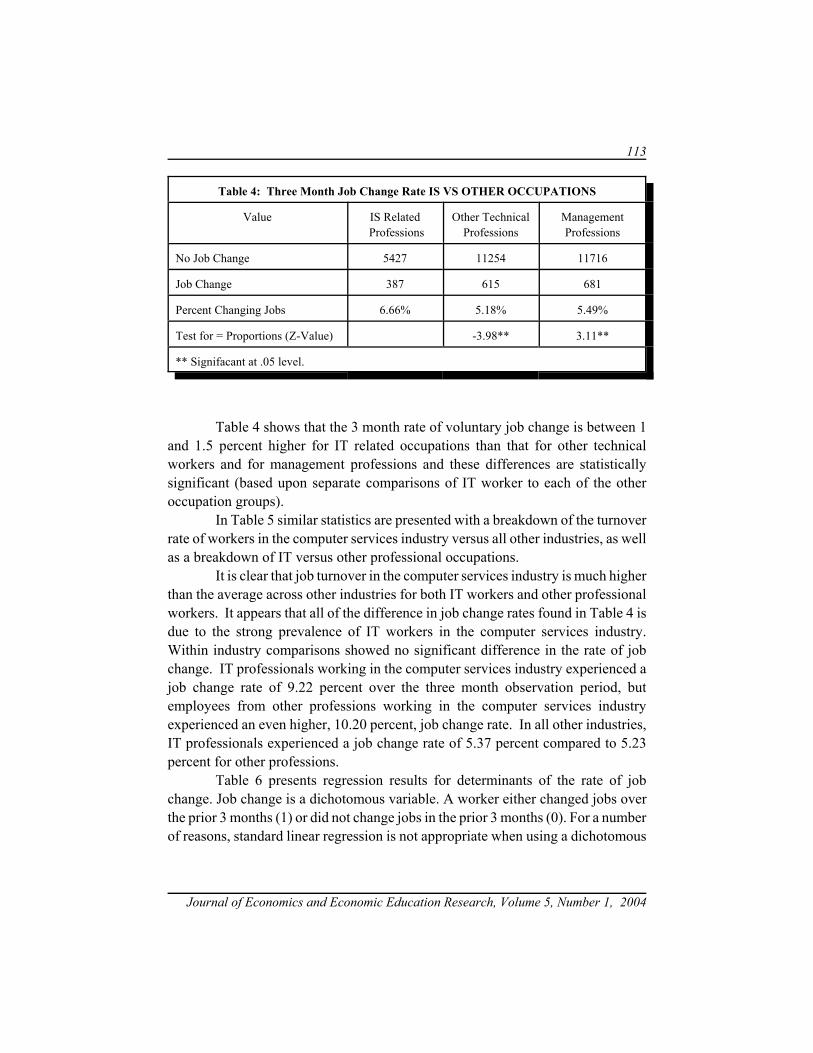
113
Journal of Economics and Economic Education Research, Volume 5, Number 1, 2004
Table 4: Three Month Job Change Rate IS VS OTHER OCCUPATIONS
Value IS Related Professions
Other TechnicalProfessions
ManagementProfessions
No Job Change 5427 11254 11716
Job Change 387 615 681
Percent Changing Jobs 6.66% 5.18% 5.49%
Test for = Proportions (Z-Value) -3.98** 3.11**
** Signifacant at .05 level.
Table 4 shows that the 3 month rate of voluntary job change is between 1and 1.5 percent higher for IT related occupations than that for other technicalworkers and for management professions and these differences are statisticallysignificant (based upon separate comparisons of IT worker to each of the otheroccupation groups).
In Table 5 similar statistics are presented with a breakdown of the turnoverrate of workers in the computer services industry versus all other industries, as wellas a breakdown of IT versus other professional occupations.
It is clear that job turnover in the computer services industry is much higherthan the average across other industries for both IT workers and other professionalworkers. It appears that all of the difference in job change rates found in Table 4 isdue to the strong prevalence of IT workers in the computer services industry.Within industry comparisons showed no significant difference in the rate of jobchange. IT professionals working in the computer services industry experienced ajob change rate of 9.22 percent over the three month observation period, butemployees from other professions working in the computer services industryexperienced an even higher, 10.20 percent, job change rate. In all other industries,IT professionals experienced a job change rate of 5.37 percent compared to 5.23percent for other professions.
Table 6 presents regression results for determinants of the rate of jobchange. Job change is a dichotomous variable. A worker either changed jobs overthe prior 3 months (1) or did not change jobs in the prior 3 months (0). For a numberof reasons, standard linear regression is not appropriate when using a dichotomous
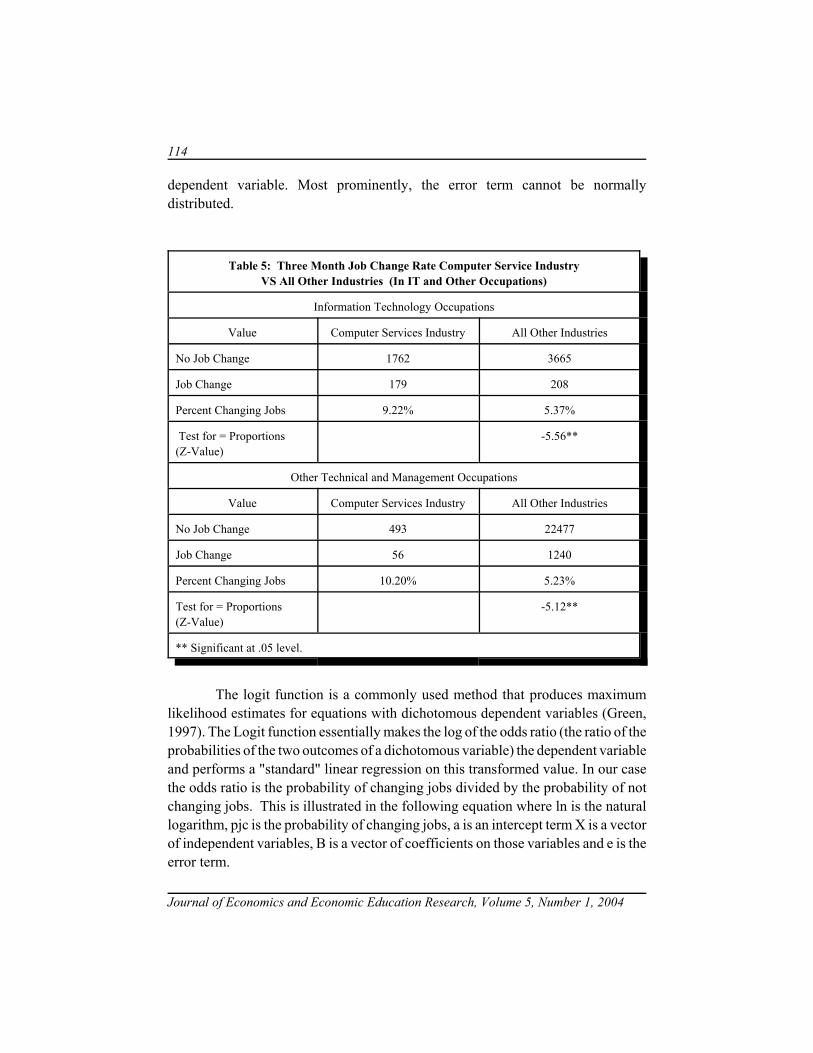
114
Journal of Economics and Economic Education Research, Volume 5, Number 1, 2004
dependent variable. Most prominently, the error term cannot be normallydistributed.
Table 5: Three Month Job Change Rate Computer Service IndustryVS All Other Industries (In IT and Other Occupations)
Information Technology Occupations
Value Computer Services Industry All Other Industries
No Job Change 1762 3665
Job Change 179 208
Percent Changing Jobs 9.22% 5.37%
Test for = Proportions(Z-Value)
-5.56**
Other Technical and Management Occupations
Value Computer Services Industry All Other Industries
No Job Change 493 22477
Job Change 56 1240
Percent Changing Jobs 10.20% 5.23%
Test for = Proportions(Z-Value)
-5.12**
** Significant at .05 level.
The logit function is a commonly used method that produces maximumlikelihood estimates for equations with dichotomous dependent variables (Green,1997). The Logit function essentially makes the log of the odds ratio (the ratio of theprobabilities of the two outcomes of a dichotomous variable) the dependent variableand performs a "standard" linear regression on this transformed value. In our casethe odds ratio is the probability of changing jobs divided by the probability of notchanging jobs. This is illustrated in the following equation where ln is the naturallogarithm, pjc is the probability of changing jobs, a is an intercept term X is a vectorof independent variables, B is a vector of coefficients on those variables and e is theerror term.
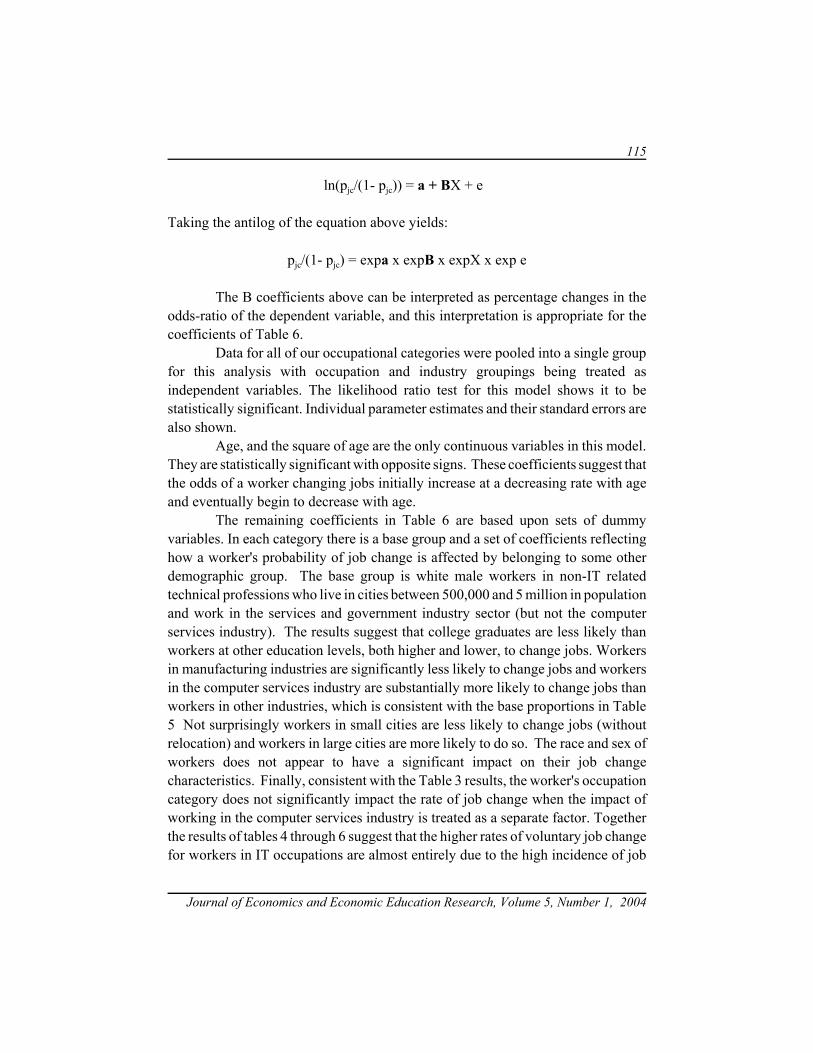
115
Journal of Economics and Economic Education Research, Volume 5, Number 1, 2004
ln(pjc/(1- pjc)) = a + BX + e
Taking the antilog of the equation above yields:
pjc/(1- pjc) = expa x expB x expX x exp e
The B coefficients above can be interpreted as percentage changes in theodds-ratio of the dependent variable, and this interpretation is appropriate for thecoefficients of Table 6.
Data for all of our occupational categories were pooled into a single groupfor this analysis with occupation and industry groupings being treated asindependent variables. The likelihood ratio test for this model shows it to bestatistically significant. Individual parameter estimates and their standard errors arealso shown.
Age, and the square of age are the only continuous variables in this model.They are statistically significant with opposite signs. These coefficients suggest thatthe odds of a worker changing jobs initially increase at a decreasing rate with ageand eventually begin to decrease with age.
The remaining coefficients in Table 6 are based upon sets of dummyvariables. In each category there is a base group and a set of coefficients reflectinghow a worker's probability of job change is affected by belonging to some otherdemographic group. The base group is white male workers in non-IT relatedtechnical professions who live in cities between 500,000 and 5 million in populationand work in the services and government industry sector (but not the computerservices industry). The results suggest that college graduates are less likely thanworkers at other education levels, both higher and lower, to change jobs. Workersin manufacturing industries are significantly less likely to change jobs and workersin the computer services industry are substantially more likely to change jobs thanworkers in other industries, which is consistent with the base proportions in Table5 Not surprisingly workers in small cities are less likely to change jobs (withoutrelocation) and workers in large cities are more likely to do so. The race and sex ofworkers does not appear to have a significant impact on their job changecharacteristics. Finally, consistent with the Table 3 results, the worker's occupationcategory does not significantly impact the rate of job change when the impact ofworking in the computer services industry is treated as a separate factor. Togetherthe results of tables 4 through 6 suggest that the higher rates of voluntary job changefor workers in IT occupations are almost entirely due to the high incidence of job
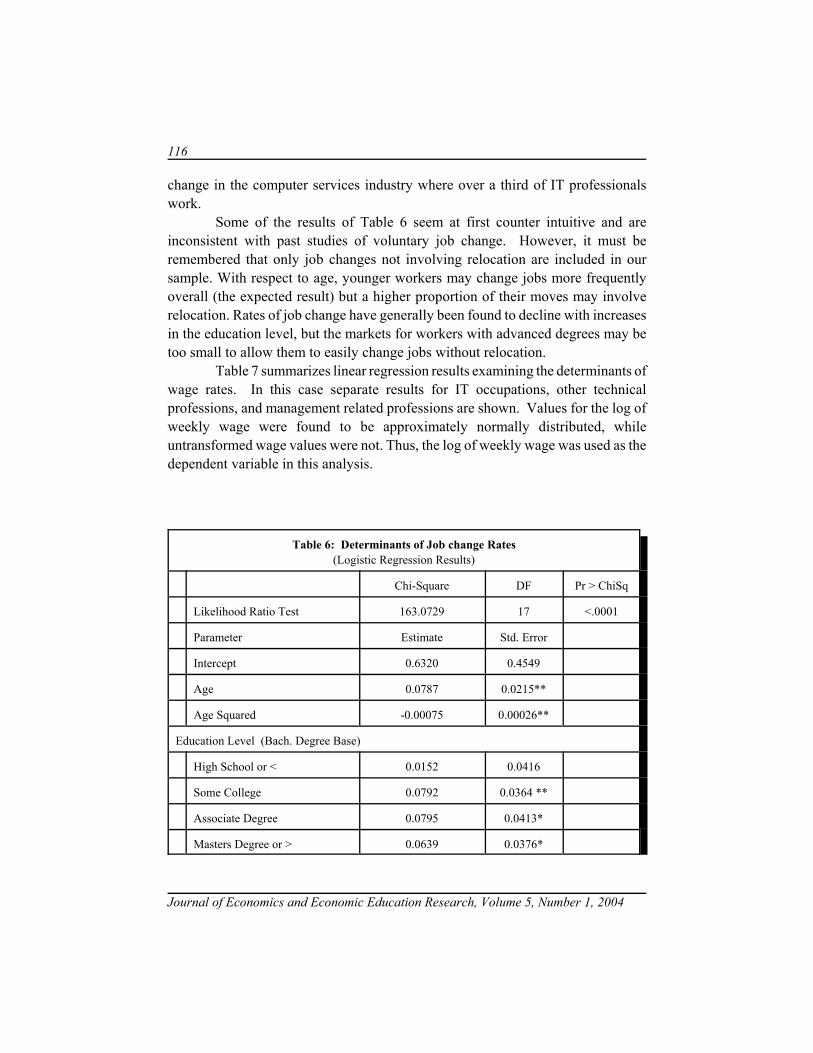
116
Journal of Economics and Economic Education Research, Volume 5, Number 1, 2004
change in the computer services industry where over a third of IT professionalswork.
Some of the results of Table 6 seem at first counter intuitive and areinconsistent with past studies of voluntary job change. However, it must beremembered that only job changes not involving relocation are included in oursample. With respect to age, younger workers may change jobs more frequentlyoverall (the expected result) but a higher proportion of their moves may involverelocation. Rates of job change have generally been found to decline with increasesin the education level, but the markets for workers with advanced degrees may betoo small to allow them to easily change jobs without relocation.
Table 7 summarizes linear regression results examining the determinants ofwage rates. In this case separate results for IT occupations, other technicalprofessions, and management related professions are shown. Values for the log ofweekly wage were found to be approximately normally distributed, whileuntransformed wage values were not. Thus, the log of weekly wage was used as thedependent variable in this analysis.
Table 6: Determinants of Job change Rates(Logistic Regression Results)
Chi-Square DF Pr > ChiSq
Likelihood Ratio Test 163.0729 17 <.0001
Parameter Estimate Std. Error
Intercept 0.6320 0.4549
Age 0.0787 0.0215**
Age Squared -0.00075 0.00026**
Education Level (Bach. Degree Base)
High School or < 0.0152 0.0416
Some College 0.0792 0.0364 **
Associate Degree 0.0795 0.0413*
Masters Degree or > 0.0639 0.0376*
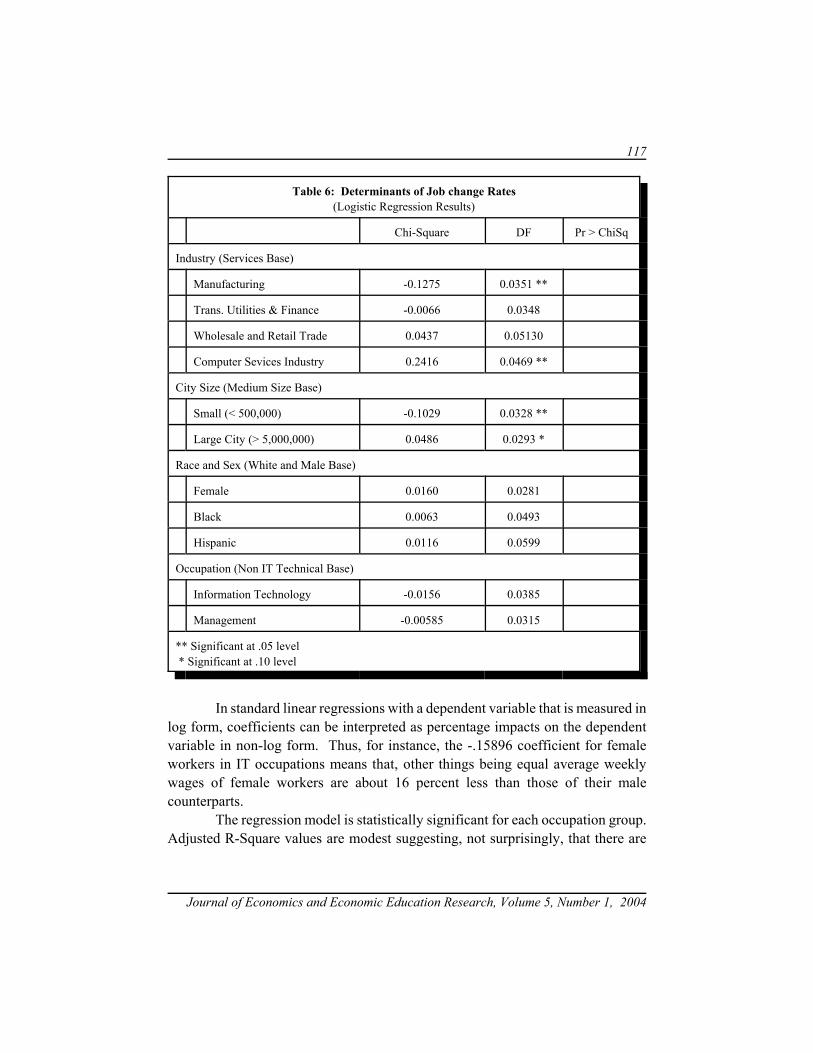
117
Table 6: Determinants of Job change Rates(Logistic Regression Results)
Chi-Square DF Pr > ChiSq
Journal of Economics and Economic Education Research, Volume 5, Number 1, 2004
Industry (Services Base)
Manufacturing -0.1275 0.0351 **
Trans. Utilities & Finance -0.0066 0.0348
Wholesale and Retail Trade 0.0437 0.05130
Computer Sevices Industry 0.2416 0.0469 **
City Size (Medium Size Base)
Small (< 500,000) -0.1029 0.0328 **
Large City (> 5,000,000) 0.0486 0.0293 *
Race and Sex (White and Male Base)
Female 0.0160 0.0281
Black 0.0063 0.0493
Hispanic 0.0116 0.0599
Occupation (Non IT Technical Base)
Information Technology -0.0156 0.0385
Management -0.00585 0.0315
** Significant at .05 level * Significant at .10 level
In standard linear regressions with a dependent variable that is measured inlog form, coefficients can be interpreted as percentage impacts on the dependentvariable in non-log form. Thus, for instance, the -.15896 coefficient for femaleworkers in IT occupations means that, other things being equal average weeklywages of female workers are about 16 percent less than those of their malecounterparts.
The regression model is statistically significant for each occupation group.Adjusted R-Square values are modest suggesting, not surprisingly, that there are
118
Journal of Economics and Economic Education Research, Volume 5, Number 1, 2004
many factors influencing individual wage rates which are outside the scope of thebroad set of demographic factors available for this study.
The age and age squared coefficients are similar across the occupationgroups and reflect a pattern of wage rates increasing at a decreasing rate in youngerage levels and decreasing in absolute terms for older workers. The somewhat largermagnitudes (in an absolute sense) of these coefficients among workers in IToccupations means that wages are expected to rise more rapidly with age initially,but that this rate of growth will also drop off more rapidly as age increases.
The month variable is an index that begins with a value of 1 in April of1998 and increases by one for each month thereafter. It is designed to capture thegeneral time trend of wages. This rate is about 0.4 percent per month or 4.8 percentper year for workers in IT occupations. The rate for management occupations isalmost identical to the rate for IT, while that of other technical occupations isslightly, but not significantly lower.
The Education level parameters suggest that the wage premiums forincreased education are systematically (and in many cases significantly) lower forIT occupations than for the other technical and management occupations. This maysuggest that formal education is less important, relative to subsequent on-the-job andnonacademic training and experience among IT professionals.
Industry differences are less pronounced for IT workers than for the otheroccupations. However, it should be noted that the services and government sector(the base sector in this analysis) includes the computer services industry that has alarge number of highly paid IT workers. This industry will be examined in detailin Table 8 below. City size has consistent effects across the occupation groups -workers in small cities on average earn less while workers in large cities earn more.The wage penalty for living in a small city is somewhat smaller for non-IT technicaloccupations. The wages of women and minorities are systematically lower acrossall of the occupational categories. The wage differential for female IT workers issignificantly smaller than that for the other two occupation categories, while thewage rate differential for Blacks is a bit larger than that for management relatedprofessions. Finally, the job change parameter shows that workers who had changedjobs in the previous three months earned slightly less than those not changing jobsamong both management and non-IT professional occupations. Neither of thesecoefficients was statistically significant. For IT related occupations, on the otherhand, job changers on average earned just over 5 percent more than those who hadnot changed jobs and this difference was statistically significant.
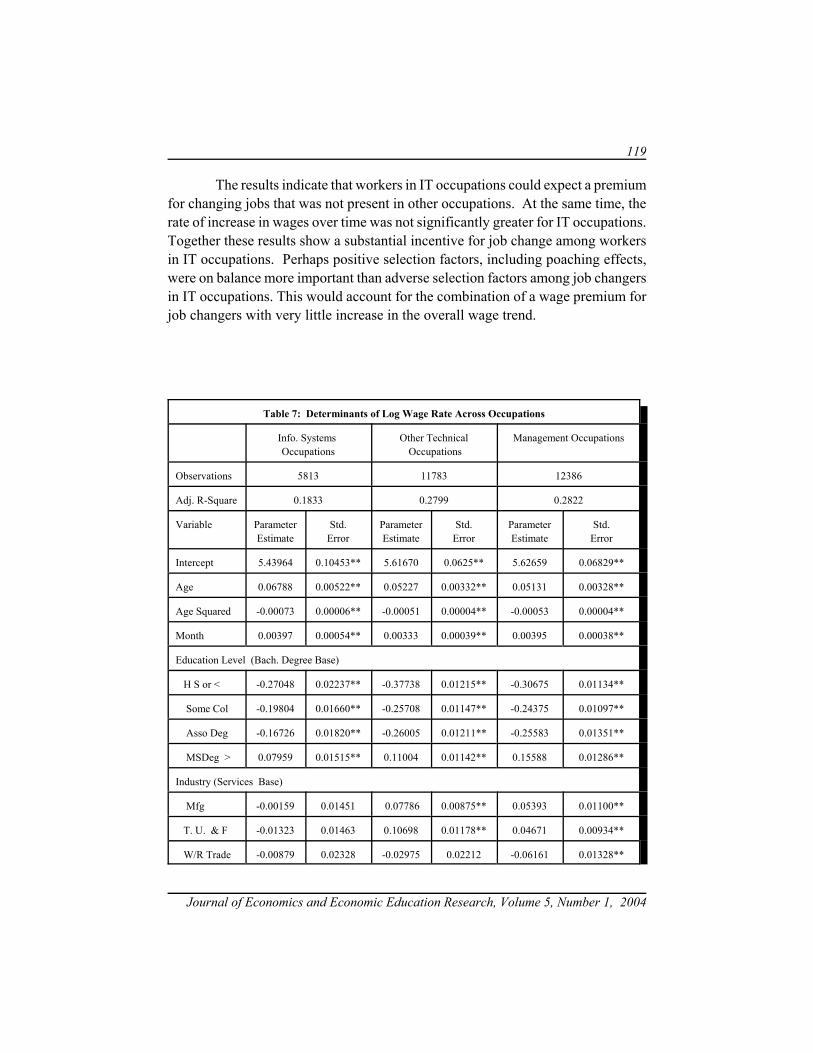
119
Journal of Economics and Economic Education Research, Volume 5, Number 1, 2004
The results indicate that workers in IT occupations could expect a premiumfor changing jobs that was not present in other occupations. At the same time, therate of increase in wages over time was not significantly greater for IT occupations.Together these results show a substantial incentive for job change among workersin IT occupations. Perhaps positive selection factors, including poaching effects,were on balance more important than adverse selection factors among job changersin IT occupations. This would account for the combination of a wage premium forjob changers with very little increase in the overall wage trend.
Table 7: Determinants of Log Wage Rate Across Occupations
Info. Systems Occupations
Other Technical Occupations
Management Occupations
Observations 5813 11783 12386
Adj. R-Square 0.1833 0.2799 0.2822
Variable ParameterEstimate
Std.Error
ParameterEstimate
Std. Error
ParameterEstimate
Std.Error
Intercept 5.43964 0.10453** 5.61670 0.0625** 5.62659 0.06829**
Age 0.06788 0.00522** 0.05227 0.00332** 0.05131 0.00328**
Age Squared -0.00073 0.00006** -0.00051 0.00004** -0.00053 0.00004**
Month 0.00397 0.00054** 0.00333 0.00039** 0.00395 0.00038**
Education Level (Bach. Degree Base)
H S or < -0.27048 0.02237** -0.37738 0.01215** -0.30675 0.01134**
Some Col -0.19804 0.01660** -0.25708 0.01147** -0.24375 0.01097**
Asso Deg -0.16726 0.01820** -0.26005 0.01211** -0.25583 0.01351**
MSDeg > 0.07959 0.01515** 0.11004 0.01142** 0.15588 0.01286**
Industry (Services Base)
Mfg -0.00159 0.01451 0.07786 0.00875** 0.05393 0.01100**
T. U. & F -0.01323 0.01463 0.10698 0.01178** 0.04671 0.00934**
W/R Trade -0.00879 0.02328 -0.02975 0.02212 -0.06161 0.01328**
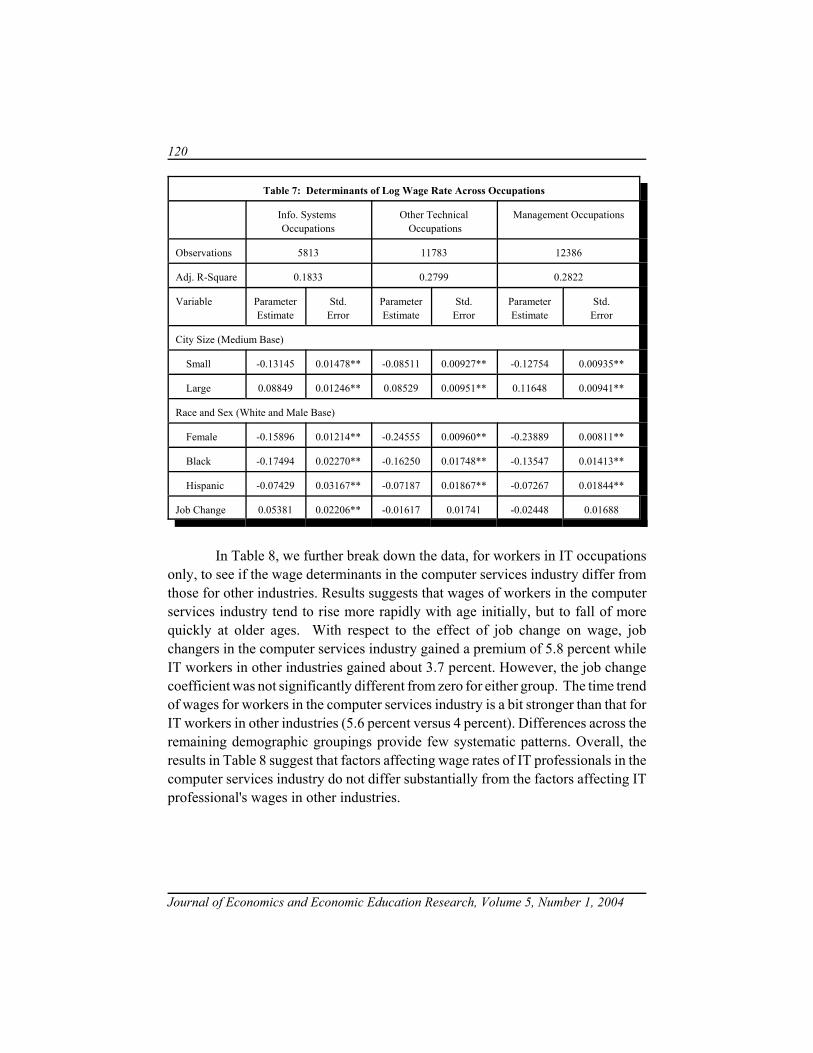
120
Table 7: Determinants of Log Wage Rate Across Occupations
Info. Systems Occupations
Other Technical Occupations
Management Occupations
Observations 5813 11783 12386
Adj. R-Square 0.1833 0.2799 0.2822
Variable ParameterEstimate
Std.Error
ParameterEstimate
Std. Error
ParameterEstimate
Std.Error
Journal of Economics and Economic Education Research, Volume 5, Number 1, 2004
City Size (Medium Base)
Small -0.13145 0.01478** -0.08511 0.00927** -0.12754 0.00935**
Large 0.08849 0.01246** 0.08529 0.00951** 0.11648 0.00941**
Race and Sex (White and Male Base)
Female -0.15896 0.01214** -0.24555 0.00960** -0.23889 0.00811**
Black -0.17494 0.02270** -0.16250 0.01748** -0.13547 0.01413**
Hispanic -0.07429 0.03167** -0.07187 0.01867** -0.07267 0.01844**
Job Change 0.05381 0.02206** -0.01617 0.01741 -0.02448 0.01688
In Table 8, we further break down the data, for workers in IT occupationsonly, to see if the wage determinants in the computer services industry differ fromthose for other industries. Results suggests that wages of workers in the computerservices industry tend to rise more rapidly with age initially, but to fall of morequickly at older ages. With respect to the effect of job change on wage, jobchangers in the computer services industry gained a premium of 5.8 percent whileIT workers in other industries gained about 3.7 percent. However, the job changecoefficient was not significantly different from zero for either group. The time trendof wages for workers in the computer services industry is a bit stronger than that forIT workers in other industries (5.6 percent versus 4 percent). Differences across theremaining demographic groupings provide few systematic patterns. Overall, theresults in Table 8 suggest that factors affecting wage rates of IT professionals in thecomputer services industry do not differ substantially from the factors affecting ITprofessional's wages in other industries.
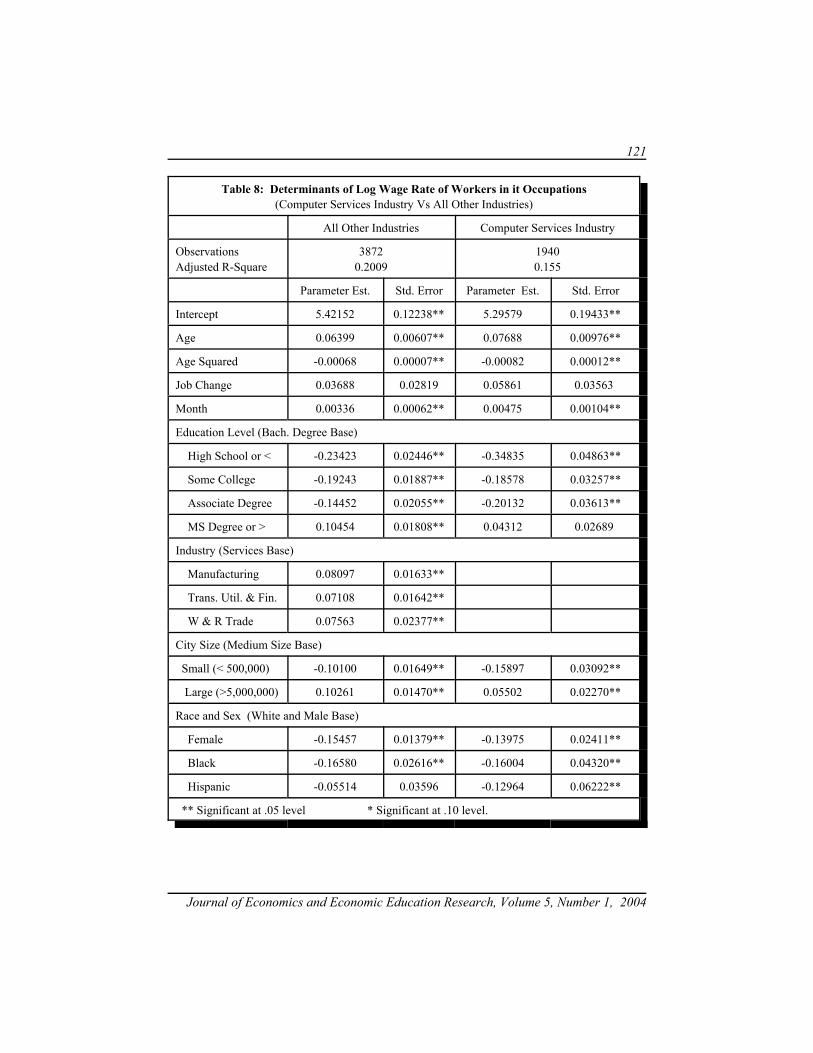
121
Journal of Economics and Economic Education Research, Volume 5, Number 1, 2004
Table 8: Determinants of Log Wage Rate of Workers in it Occupations(Computer Services Industry Vs All Other Industries)
All Other Industries Computer Services Industry
ObservationsAdjusted R-Square
38720.2009
19400.155
Parameter Est. Std. Error Parameter Est. Std. Error
Intercept 5.42152 0.12238** 5.29579 0.19433**
Age 0.06399 0.00607** 0.07688 0.00976**
Age Squared -0.00068 0.00007** -0.00082 0.00012**
Job Change 0.03688 0.02819 0.05861 0.03563
Month 0.00336 0.00062** 0.00475 0.00104**
Education Level (Bach. Degree Base)
High School or < -0.23423 0.02446** -0.34835 0.04863**
Some College -0.19243 0.01887** -0.18578 0.03257**
Associate Degree -0.14452 0.02055** -0.20132 0.03613**
MS Degree or > 0.10454 0.01808** 0.04312 0.02689
Industry (Services Base)
Manufacturing 0.08097 0.01633**
Trans. Util. & Fin. 0.07108 0.01642**
W & R Trade 0.07563 0.02377**
City Size (Medium Size Base)
Small (< 500,000) -0.10100 0.01649** -0.15897 0.03092**
Large (>5,000,000) 0.10261 0.01470** 0.05502 0.02270**
Race and Sex (White and Male Base)
Female -0.15457 0.01379** -0.13975 0.02411**
Black -0.16580 0.02616** -0.16004 0.04320**
Hispanic -0.05514 0.03596 -0.12964 0.06222**
** Significant at .05 level * Significant at .10 level.
122
Journal of Economics and Economic Education Research, Volume 5, Number 1, 2004
CONCLUSIONS
This paper has examined alternative theories of the impact of training andskills on the structure of wages and voluntary job change. Human capital theorysuggests that firms can only afford to pay for firm-specific training. However, thedynamics of the IT market suggest that firms are often forced to pay the direct costsof specialized training that has a very competitive market. The new labor contractmodel suggests that firms should view such training as a cost of attracting more ableemployees. By providing frequent opportunities for performance appraisal andsalary adjustments, the firm can recoup a sufficient return on this enhanced abilityto recoup its training costs, although job change rates are expected to be higheroverall due to the highly competitive skill sets developed.
Job satisfaction surveys within the IT industry have found that IT workersare generally more satisfied with their jobs when they have access to learning newskills. However, this greater job satisfaction may not translate into longer retention,if the skills learned have a highly competitive market.
Generally, the empirical results presented here support the concepts of thenew labor contract and suggest that IT workers, or at least IT workers in thecomputer services industry, may be on the leading edge of the movement to thisform of relationship between employees and employers. The higher rate ofvoluntary job change among computer service industry workers and the positivereturns to job change among IT workers (suggesting a predominance of positiveselection factors among job changers) are both compatible with new labor contractideas that: neither workers nor employers desire career length relationships and thatthe employer is expected to provide opportunities for training and skill development.
The nature of available data has imposed major limitations on thehypotheses that could be developed and the conclusions that could be drawn in thisstudy. The ideal data set for the analyses presented here should: follow workers ifthey relocate due to job change, provide estimates of the wage before and after jobchanges, track cumulative job changes over a longer period of time, and providedata about specific skills developed and training provided on the job. The costs ofdeveloping such an ideal data set at large scale may be prohibitive, but it should bepossible to test the impact of some of these elements through survey research andthe use of other predefined data sources.
It is also important to examine the responsiveness of the high-tech labormarket across the business cycle. This study covered a time period that waspredominantly part of an economic boom. If the new labor contract is rooted in
123
Journal of Economics and Economic Education Research, Volume 5, Number 1, 2004
changes that are making skills more generally-valued and less firm specific, firmswill have less incentive to retain skilled workers through economic downturns, sincethe ability to share in the returns of a firm-specifically trained workers skills duringgood times provides incentives for employers to retain them during recessions.
Finally, this paper and the literature it reviews suggest that the process ofskill development in the new economy is important area for future research. If skillsare indeed becoming more generally-valued, who will pay for them and how willthey be provide? Will firms be less willing to bear the costs of obtaining these skills(as economic theory suggests)? If the individual must bear all, or nearly all, of thecosts of acquiring skills will there be substantial under-investment in these skills?What is the role of the higher education community in the provision of these skillsand the re-skilling of workers as technology advances? All of these are importantquestions that need to be addressed as we work to understand the implications of thechanges in work relationships implied by the new labor contract.
REFERENCES
Acemoglu, D. & Pirchke J. (1998), Why do firms train? Theory and evidence. QuarterlyJournal of Economics, 113(1), 79-119.
Autor, D., Katz, L. & Krueger, A. (1998) Computing inequality: have computers changedthe labor market? Quarterly Journal of Economics, 113, 1169-1212.
Barron, J., Berger, M. & Black, D. (1997) Do workers pay for on-the-job training? Journalof Human Resources, 34, 235-252.
Becker, G. (1962) Investment in human capital: a theoretical analysis. Journal of PoliticalEconomy, 70(5), 9-49.
Bernstein, A. & Hamm, S. (1998) Is there really a techie shortage? Business Week, Issue3584, 93.
Bittman, T. (1998) Do you know where your NT specialists are? Insurance and Technology,23(8), 7.
Cappelli, P. (2000, January) A market-driven approach to retaining talent. Harvard BusinessReview, 103-111.
124
Journal of Economics and Economic Education Research, Volume 5, Number 1, 2004
Chilton, K. & Orlando, M. (1996) A new social contract for the American worker, Businessand Society Review, 24, 23-26.
Cougar, D., Zawacki R. & E. Oppermann, E. (1979) Motivation levels of MIS managersversus those of their employees. MIS Quarterly, 3(3), 47-56.
Cougar, D. (1988) Motivators versus demotivators in the IS environment. Journal of SystemsManagement, 39(6), 36-41.
Frazis, H., Herz, D. & Harrigan M. (1995) Employer-provided training: results from a newsurvey. Monthly Labor Review, 118(5), 3-17.
Frazis, H., Gittleman, M., Harrigan, M. & Joyce, M. (1998) Results from the 1995 surveyof employer-provided training. Monthly Labor Review, 121(6), 3-13.
Green, W. (1997). Econometric Analysis, 3rd Edition, Upper Saddle River, New Jersey:Prentice Hall.
Greenwald, B. (1986). Adverse selection in the labour market. Review of Economic Studies,53, 325-347.
Guimaraaes, T. & Igbaria, M. (1992) Determinants of turnover intentions comparing IC andIS personnel. Information Systems Research, 3(3), 273-303.
Hall, D. & Moss, J. (1998, Winter) The new protean career contract: helping organizationand employees adapt. Organizational Dynamics, 23-36.
Hocquet, L. (2000) Vocational training and the poaching externality: Evidence for France.In Education and Training in a Knowledge-Based Economy, Heijke H.& Muysken,J.( Eds.), New York: St. Martin's Press.
Keane, M. & Wolpin, K. (1997). The career decisions of young men, Journal of PoliticalEconomy, 105(3), 473-522.
Keith, K. & McWilliams, A. (1999). The returns of mobility and job search by gender.Industrial and Labor Relations Review, 52(3), 460-477.
Light, A. & McGarry, K. (1998). Job change patterns and the wages of young men, Reviewof Economics and Statistics, 80(2), 276-286.
125
Journal of Economics and Economic Education Research, Volume 5, Number 1, 2004
Lynch L. & Black, S. (1998) Beyond the incidence of employer-provided training. Industrialand Labor Relations Review, 52(1), 64-81.
McConnell, S. (1986) The role of computing in reshaping the work force. Monthly LaborReview, 119(8), 3-5.
Mak, B. & Sockel, H. (2001) A confirmatory factor analysis of IS employee motivation andretention, Information and Management, 38, 265-276.
McGee, M. & Davey, T.(1998) IT skills drought worsens. Information Week, 665, 30.
Memishi, R. (2000) Facing the shortage of information technology professionals. ElectronicCommerce World, 10(1), 24-29.
Mincer, J. (1962) Laborforce participation of married women. In Aspects of of LaborEconomics, Davis, G. (Ed.) NBER Conference Series No. 14, 63-97.
Moore, J. & Burke, L. (2002) How to turn around the 'turnover culture' in IT.Communications of the ACM, 45(2), 73-78.
Neal, D. (1997) The link between ability and specialization: an explanation for observedcorrelations between wages and mobility rates. Journal of Human Resources, 33,173-200.
Quinn, B., Anderson, P. & Finkelstein, S. (1996) Leveraging intellect. Academy ofManagement Executive, 10(3), 7-27.
Roehling, M., Cavanaugh, M., Moynihan, L. & Boswell, W. (2000) The nature of the newemployment relationship: A content analysis of the practitioner and academicliteratures. Human Resource Management, 39(4), 305-320.
Royalty, A. (1996) The effects of job turnover on the training of men and women. Industrialand Labor Relations Review, 49(3), 506-521.
Sheehan, L. (2000) Variables in the hiring equation: ensuring the right candidate is hired.Information Systems Management, 17(3), 21-32.
Smits, S., McLean, E. & Tanner, J. (1993) Managing high-achieving information systemsprofessionals. Journal of Management Information Systems, 9(4), 103-120.
Sommers, P. (1995) Workforce 2000. Industry Week, 244(10), 21.
126
Journal of Economics and Economic Education Research, Volume 5, Number 1, 2004
Stokes, S. (2000) Attracting and keeping IT talent. Information Systems Management, 17(3),8-16.
Tomkins, J. & Twomey, J. (2000). Occupational mobility in England. Applied Economics,32, 193-209.
U.S. BLS(2000). Current population survey technical paper 63 - design and methodology.
Zawacki, R. (1992) Motivating the IS people of the future. Information SystemsManagement, 9(2) 73-75.
Zuboff, S. (1992) Automate/informate: the two faces of intelligent technology.Organizational Dynamics, 20, 5-18.

127
Journal of Economics and Economic Education Research, Volume 5, Number 1, 2004
www.alliedacademies.org

128
Journal of Economics and Economic Education Research, Volume 5, Number 1, 2004
www.alliedacademies.org