Embed Size (px)
Citation preview
International Journal of Engineering and Technology Volume 5 No. 6, June, 2015
ISSN: 2049-3444 © 2015– IJET Publications UK. All rights reserved. 375
Aerodynamics Comparative Analysis of Cargo Truck Tricycles
Agarana David1, Ekuase Austin2, Odomagah Emmanuel Saturday2, Olah Samuel2, Dania David E1. 1Department of Research and Development, 2 Department of Manufacturing and Production
National Engineering Design Development Institute, Nnewi, Anambra State, Nigeria.
ABSTRACT
The study of drag and lift coefficients as well as pressure distribution on the surface of a road vehicle is mainly done by the analysis
of their aerodynamics. In this work, an aerodynamic comparative study is done on three different shapes of cargo truck tricycles,
with the major difference being their frontal shapes. CAD models of the cargo truck tricycles were created using Creo Element/Pro
5.0 Software. The Computational Fluid Dynamics (CFD) simulation was done using Solidworks software. An external flow analysis
was carried out for speeds of 40kmph, 60kmph, 80kmph, 100kmph and 120 kmph. The value of coefficient of lift to coefficient of
drag ratio is plotted against speeds and compared. Pressure and velocity distribution were analyzed for each body shape in relation to
fluid flow, drag and lift force. A model with good economic value is the best choice. Model 3 possesses the best aerodynamic
features of the three models created.
Keywords: Aerodynamics, Downforce, Drag, Lift.
INTRODUCTION
1.1 Motivation
Tricycle (locally called “kekenapep”) is now a very famous
mode of transportation, especially for short distance journeys
on the Nigerian roads. The sales and usage have enjoyed
quite a steady increase especially since many state
governments in Nigeria had placed different ban conditions
on motorcycle usage[1]. Tricycle in Nigeria has become a
household name, coming in different shapes and purposes.
The cargo tricycle is one of such; it could serve several
purposes but basically to transport goods and materials.
Therefore, the design of a cargo tricycle with good economic
value, especially in terms of safety and maintenance became a
step in the right direction. One way to achieve this is to
increase the stability and reduce the power consumption of
the tricycle as detailed in Lajos work [2].Therefore,
optimization of the aerodynamic lift can stabilize the tricycle
while its power consumption reduction can be achieved by
aerodynamic drag reduction[2].
Lift and drag are mechanical forces generated on the surface
of an object as itinteractswith a fluid [3].
According to Weigel [4]drag is an aerodynamic force that
opposes a vehicle’s motion through the air, caused by
interaction and contact of a solid body with a fluid. Unlike
other resistive forces, such as dry friction, which are
independent of velocity, drag forces depend on velocity. Drag
depends on the density of the air,the square of the velocity,
the size and shape of the body and a variable known as the
drag coefficient. The drag force of a vehicle is represented as;
D = 0.5ρV2ACd ……………………………………….(1)
where;
D = drag force
ρ = air density (the density of air at 250 C is 1.184kgm-3)(the
engineering toolbox)[5].
V = speed of the vehicle
Cd = coefficient of drag
A = cross-sectional area of the object (measured in a plane
perpendicular to its motion).
Benson [6] suggested that the reference area to be used for
computing the drag of a vehicle should be the frontal area
which is perpendicular to the flow direction of the fluid.
Yong and Chang [7], explained that important in road vehicle
design is the concept of aerodynamic lift, where pressure
differences lift the vehicle and reduce its downward normal
force, thereby jeopardizing stability and traction at high
speeds. In very simple terms, the flow over a vehicle's body is
lower in pressure than that underneath due to the vehicle's
shape and the longer path of travel over the vehicle top,
thereby producing an upward, destabilizing force to the
vehicle.
Lift is a component of force that is perpendicular to the
direction of flow of the air stream. In automobile design,
Giwaand Obiajulu[8], describes lift as an undesirable
phenomenon as it reduces traction, resulting to an unbalanced
design, as sliding of the tires may occur. The lift force of a
vehicle represented below;
L = 0.5ρV2ACl……………………………………………(2)
International Journal of Engineering and Technology (IJET) – Volume 5 No. 6, June, 2015
ISSN: 2049-3444 © 2015– IJET Publications UK. All rights reserved. 376
where;
L = lift force
ρ = air density (the density of air at 250 C is 1.184kgm-3)(the
engineering toolbox) [5]
V = speed of the vehicle
Cl = coefficient of lift
A = cross-sectional area of the object (measured in a plane
perpendicular to its motion).
Prasad [9] considered road vehicle as a bluff body. Bluff
bodies are characterized by a large region of separated flow, a
direct consequence of which is that they suffer from large
values of the drag coefficient. Although automotive
manufacturer have designed and produced a more streamlined
outer shape[reference,(who told you??)] car as a road vehicle
still carry the effect of a bluff body in aerodynamics test. The
drag value has been reduced significantly for passenger car
but it still not anywhere reaching the Cd for a formula one car
or jet-shaped vehicle. Studies on aerodynamics of road
vehicle benefits directly toward decreasing the fuel
consumption, which result from the end purpose to reduce the
drag coefficient. It has been one of the main concerns of
automotive research centers for decades. Muyl [10]showed
that 40% of drag coefficient depends on the external shape
with most of the effect comes from the rear geometry.
Execution of good aerodynamic design under stylistic
constraints requires an extensive understanding of the flow
phenomena and, especially, how the aerodynamics are
influenced by changes in body shape, Guilmineau,
[11].Vehicle aerodynamics includes three interacting flow
fields:
- Flow past vehicle body
- Flow past vehicle components (wheels, heat exchanger,
brakes, windshield),
- Flow in passenger compartment
The optimizing of aerodynamic features in a vehicle has the
objective of improving the flows around the vehicle and
consequently resulting to the following objectives;
- Reduction of fuel consumption
- More favorable comfort characteristics (mud deposition on
body, noise, ventilating and cooling of passenger
compartment)
-Improvement of driving characteristics (stability, handling,
traffic safety) evaluation, Lajos[2].
A road vehicle’s shape is primarily determined by functional,
economic and aesthetic arguments. The aerodynamic
characteristics are not usually,generated intentionally; they
are the consequences of, but not the reason for, the
shape. These "other than aerodynamic" considerations place
severe constraints on vehicle aero-dynamicists. Depending
on the specific purpose of each type of vehicle, the
objectives of aerodynamics differ widely. While low drag
is desirable for all road vehicles, other aerodynamic
properties are also significant. Hucho& Sovran [12], affirms
that though negative lift is decisive for the cornering
capability of race cars, but is of no importance for
trucks. The objective of this paper is to analyze the
aerodynamic performance of three different cargo tricycle
models and to identify the one with the best aerodynamic
performance.
1.2 Literature Review
Cooper [13] stated that for a typical truck, some of the
maneuvering room for aerodynamics would be closing the
gap between the cabin and the bucket (figure 5) and also
adding a well-streamlined tractor.
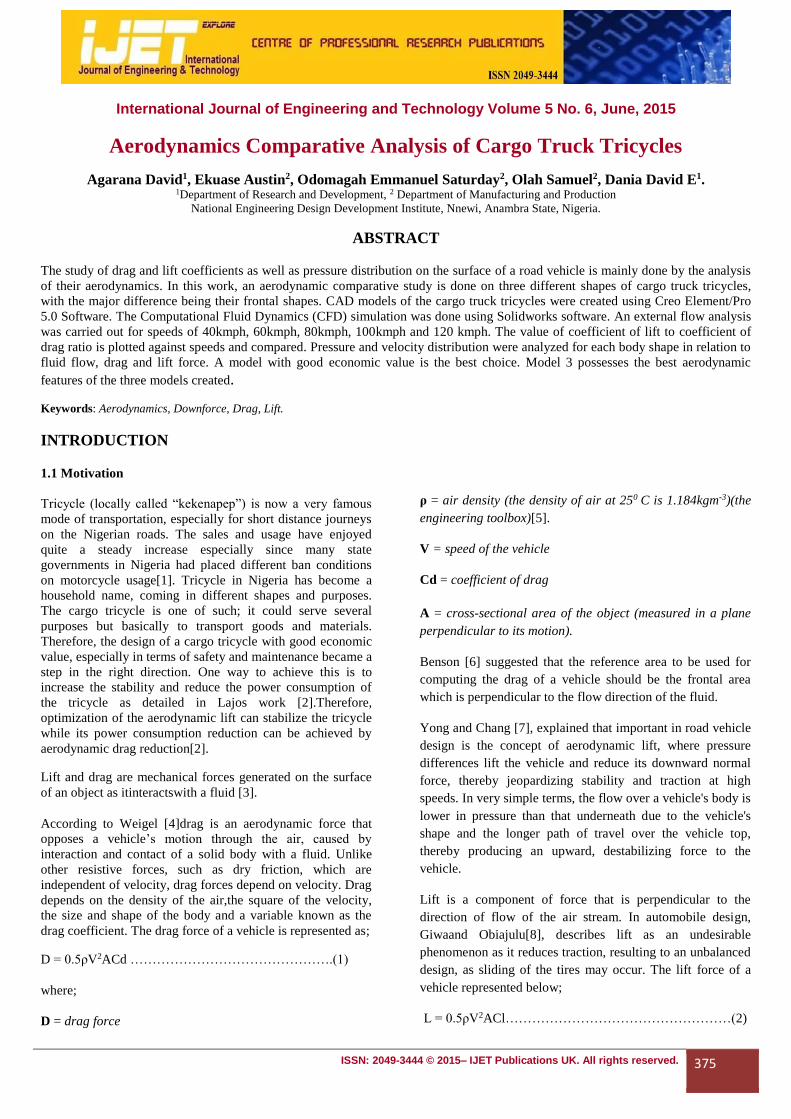
University of Maryland [14,15,16] made a serious effort to
improve truck fuel consumption by studying the
aerodynamics of tractors and trailers. Figure 1 shows a
progressive modification put into the modelling of a tractor-
trailer truck. With the exception of the full-height skirts and
streamlined tail, all the modifications could be implemented.
Even the seemingly impractical changes can be utilized in a
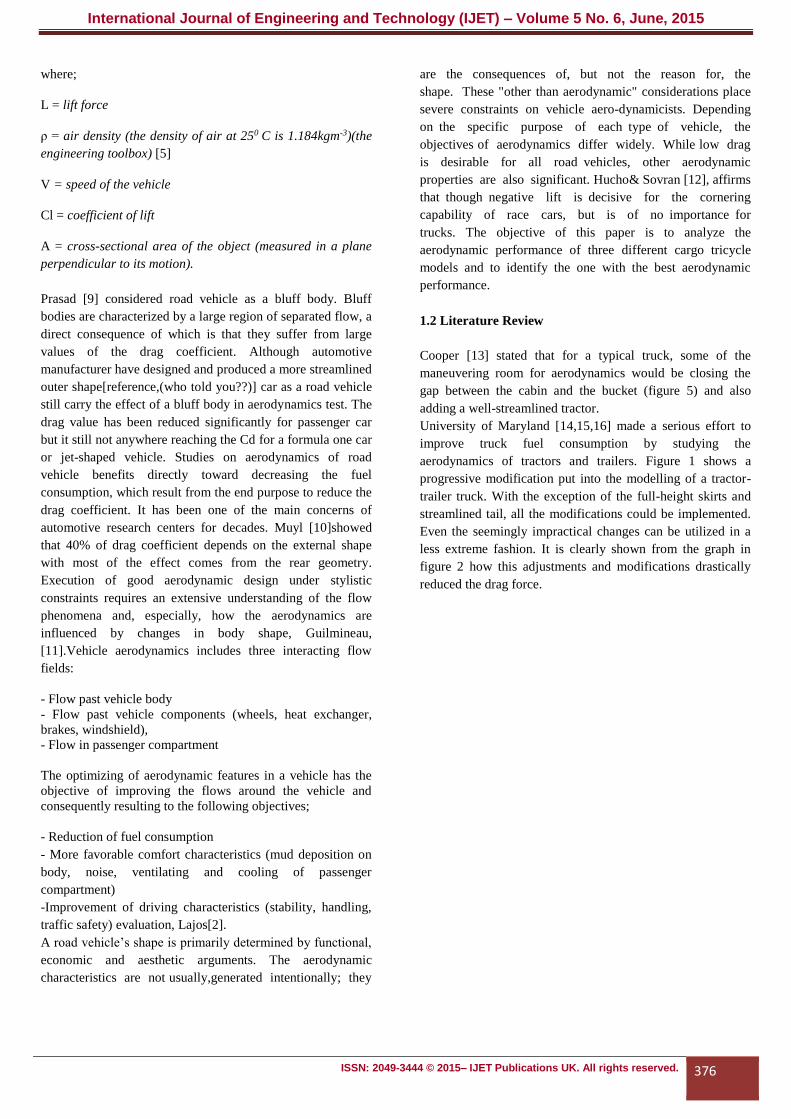
less extreme fashion. It is clearly shown from the graph in
figure 2 how this adjustments and modifications drastically
reduced the drag force.
International Journal of Engineering and Technology (IJET) – Volume 5 No. 6, June, 2015
ISSN: 2049-3444 © 2015– IJET Publications UK. All rights reserved. 377
Figure 1: Trail mobile study (Tractor-trailer models modifications. Source: University of Maryland Aerodynamic Development)
Figure 2: Graph of drag coefficient against Yaw angle. (source:University of Maryland Aerodynamic Development)
To determine the outcome of the effect of aerodynamics
features on a vehicle, a computational fluid dynamics (CFD)
is perform to mimic a real life condition and results like
coefficients of drag, lift and pressure distribution etc.
provides the platform to judge if a design is aerodynamically
okay or not. The importance of aerodynamics to several type
vehicle bodies model needs a development of drag and lift
estimation to know how much the vehicle performance on the
road against air resistance beside to improve the stability,
reducing noise and fuel consumption.
We have performed previous studies on Vehicle body shape
and Dynamic stability Analysis for three wheelers vehicle
[17, 18], hence aerodynamic Analysis of Cargo–type tricycle
will be studied in this research work.
2. METHODOLOGY
Different shapes of tricycles were modeled using Creo
Element/Pro 5.0 Software. The CFD simulation was done
using Solidworks flow simulations software.
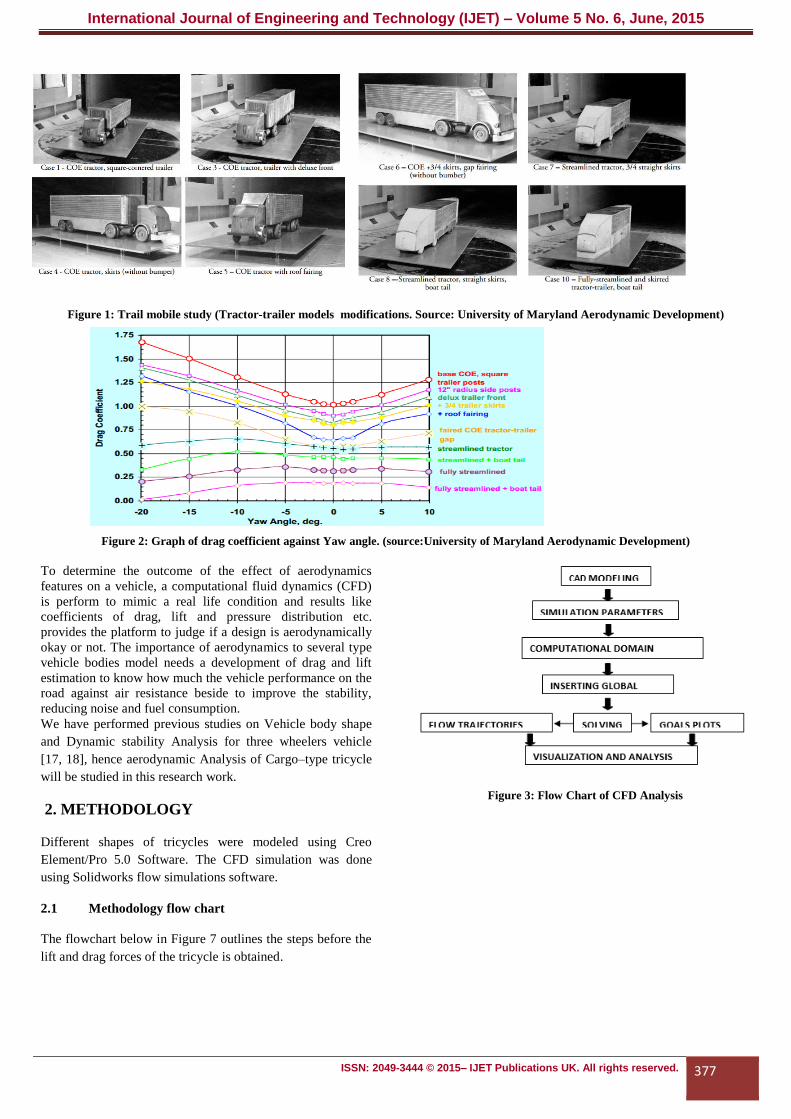
2.1 Methodology flow chart
The flowchart below in Figure 7 outlines the steps before the
lift and drag forces of the tricycle is obtained.
Figure 3: Flow Chart of CFD Analysis
International Journal of Engineering and Technology (IJET) – Volume 5 No. 6, June, 2015
ISSN: 2049-3444 © 2015– IJET Publications UK. All rights reserved. 378
2.2 Cad modeling
From general understanding of road vehicle aerodynamics, to
reduce the aerodynamic drag, two key points need to be
achieved. First is to decrease the high static pressure in the
front body of the car. Second is to recover the static pressure
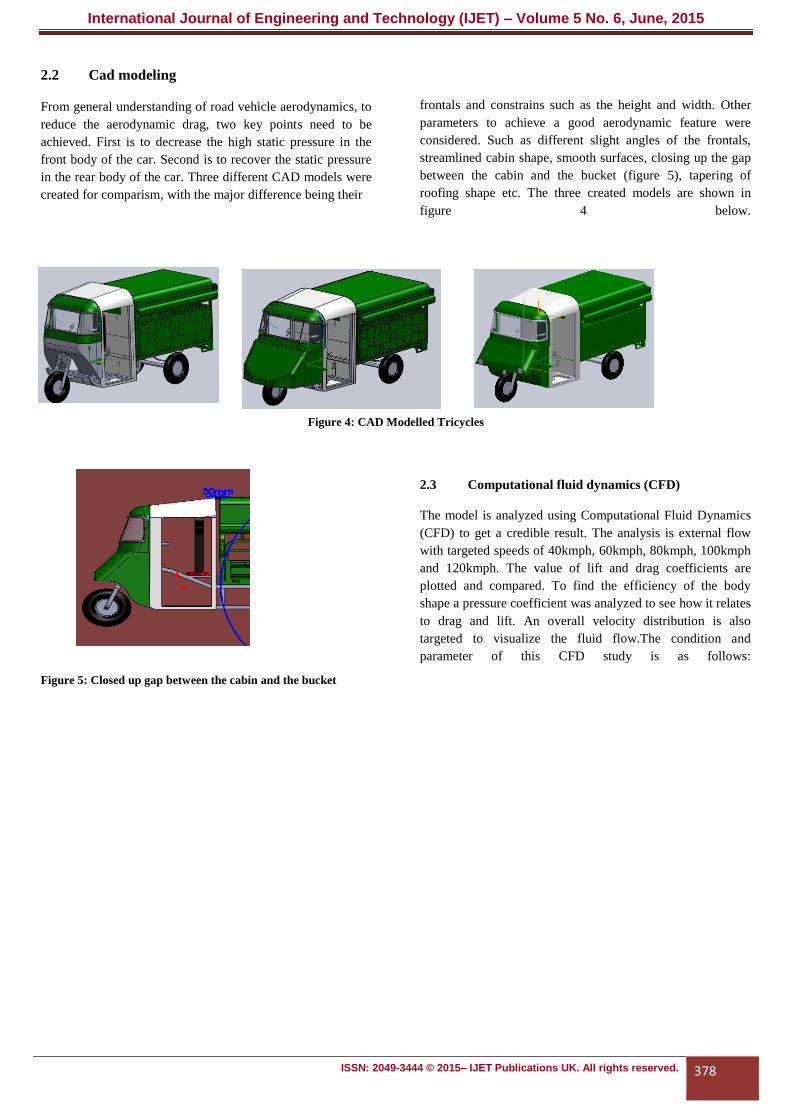
in the rear body of the car. Three different CAD models were
created for comparism, with the major difference being their
frontals and constrains such as the height and width. Other
parameters to achieve a good aerodynamic feature were
considered. Such as different slight angles of the frontals,
streamlined cabin shape, smooth surfaces, closing up the gap
between the cabin and the bucket (figure 5), tapering of
roofing shape etc. The three created models are shown in
figure 4 below.
Figure 4: CAD Modelled Tricycles
2.3 Computational fluid dynamics (CFD)
The model is analyzed using Computational Fluid Dynamics
(CFD) to get a credible result. The analysis is external flow
with targeted speeds of 40kmph, 60kmph, 80kmph, 100kmph
and 120kmph. The value of lift and drag coefficients are
plotted and compared. To find the efficiency of the body
shape a pressure coefficient was analyzed to see how it relates
to drag and lift. An overall velocity distribution is also
targeted to visualize the fluid flow.The condition and
parameter of this CFD study is as follows:
Figure 5: Closed up gap between the cabin and the bucket
International Journal of Engineering and Technology (IJET) – Volume 5 No. 6, June, 2015
ISSN: 2049-3444 © 2015– IJET Publications UK. All rights reserved. 379
Table 1: Conditions and Parameter of the CFD
Parameters Conditions
1 Vehicle speeds 40kmph, 60kmph, 80kmph, 100kmph and 120 kmph
2 Analysis type External
3 Fluid type Gas (air)
4 Flow Type Laminar and Turbulent
5 Pressure 101325 Pa
6 Temperature 293.2 K
7 Turbulence intensity 0.1%
8 Result resolution 4
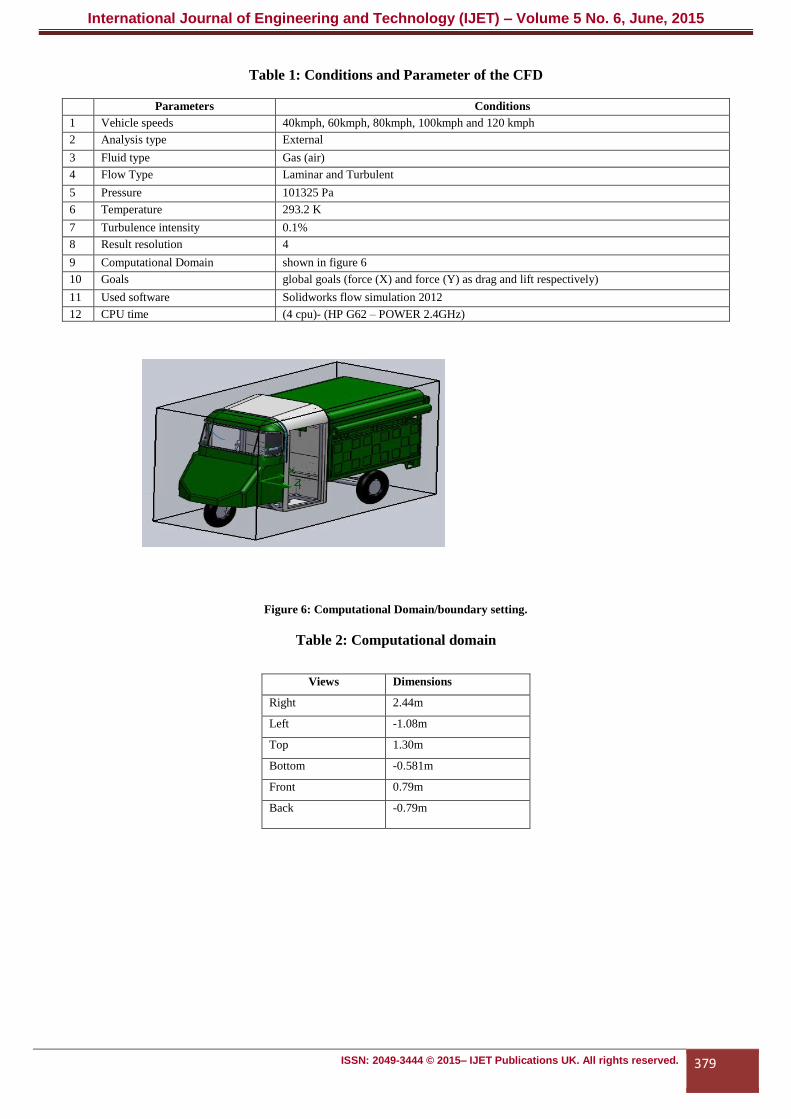
9 Computational Domain shown in figure 6
10 Goals global goals (force (X) and force (Y) as drag and lift respectively)
11 Used software Solidworks flow simulation 2012
12 CPU time (4 cpu)- (HP G62 – POWER 2.4GHz)
Figure 6: Computational Domain/boundary setting.
Table 2: Computational domain
Views Dimensions
Right 2.44m
Left -1.08m
Top 1.30m
Bottom -0.581m
Front 0.79m
Back -0.79m
International Journal of Engineering and Technology (IJET) – Volume 5 No. 6, June, 2015
ISSN: 2049-3444 © 2015– IJET Publications UK. All rights reserved. 380
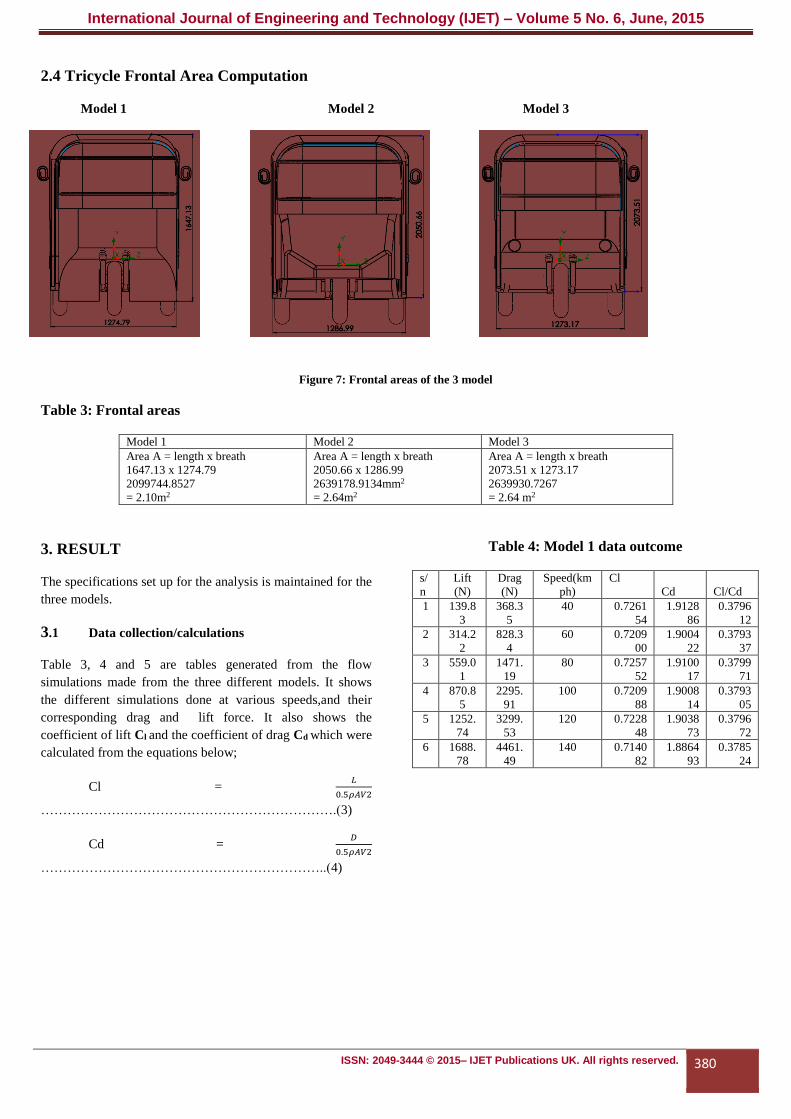
2.4 Tricycle Frontal Area Computation
Model 1 Model 2 Model 3
Figure 7: Frontal areas of the 3 model
Table 3: Frontal areas
Model 1 Model 2 Model 3
Area A = length x breath
1647.13 x 1274.79
2099744.8527
= 2.10m2
Area A = length x breath
2050.66 x 1286.99
2639178.9134mm2
= 2.64m2
Area A = length x breath
2073.51 x 1273.17
2639930.7267
= 2.64 m2
3. RESULT
The specifications set up for the analysis is maintained for the
three models.
3.1 Data collection/calculations
Table 3, 4 and 5 are tables generated from the flow
simulations made from the three different models. It shows
the different simulations done at various speeds,and their
corresponding drag and lift force. It also shows the
coefficient of lift Cl and the coefficient of drag Cd which were
calculated from the equations below;
Cl = 𝐿
0.5𝜌𝐴𝑉2
………………………………………………………….(3)
Cd = 𝐷
0.5𝜌𝐴𝑉2
………………………………………………………..(4)
Table 4: Model 1 data outcome
s/
n
Lift
(N)
Drag
(N)
Speed(km
ph)
Cl
Cd Cl/Cd
1 139.8
3
368.3
5
40 0.7261
54
1.9128
86
0.3796
12
2 314.2
2
828.3
4
60 0.7209
00
1.9004
22
0.3793
37
3 559.0
1
1471.
19
80 0.7257
52
1.9100
17
0.3799
71
4 870.8
5
2295.
91
100 0.7209
88
1.9008
14
0.3793
05
5 1252.
74
3299.
53
120 0.7228
48
1.9038
73
0.3796
72
6 1688.
78
4461.
49
140 0.7140
82
1.8864
93
0.3785
24
International Journal of Engineering and Technology (IJET) – Volume 5 No. 6, June, 2015
ISSN: 2049-3444 © 2015– IJET Publications UK. All rights reserved. 381
Table 5: Model 2 data outcome
s/
n
Lift
(N)
Drag
(N)
Speed(kmph
) Cl Cd Cl/Cd
1 -23.6 148.7 40 -
0.1540
7
0.97078
7
-
0.1587
1
2 -53.9 334.9 60 -
0.1554
6 0.96592
-
0.1609
4
3 -95.6 595.4 80 -
0.1560
3
0.97176
6
-
0.1605
6
4 -
149.
1
930.8 100 -
0.1551
8
0.96878
1
-
0.1601
8
5 -
214.
0
1339.
4
120 -
0.1552
3
0.97158
5
-
0.1597
7
6 -
291.
5
1820.
5
140 -
0.1549
5
0.96772
2
-
0.1601
2
Table 6: Model 3 data outcome
s/
n
Lift
(N)
Drag
(N)
Speed(kmp
h) Cl Cd Cl/Cd
1 34.56 99.81 40 0.1794
74
0.5183
25
0.3462
58
2 78.42 225.44 60 0.1799
15
0.5172
17
0.3478
53
3 138.4
1
399.03 80 0.1796
95
0.5180
53
0.3468
66
4 224.3
0
625.76 100 0.1857
01
0.5180
75
0.3584
44
5 307.8
6
897.98 120 0.1776
39
0.5181
46
0.3428
36
6 419.8
4
1225.0
8
140 0.1775
25
0.5180
12
0.3427
04
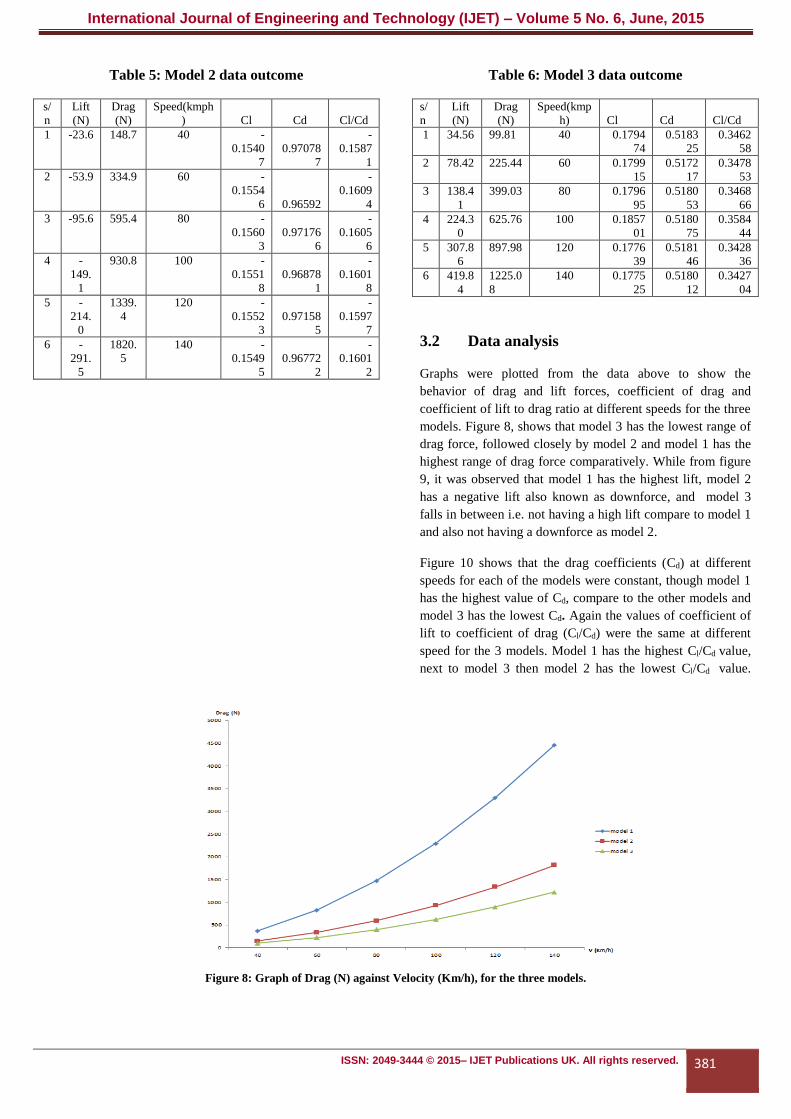
3.2 Data analysis
Graphs were plotted from the data above to show the
behavior of drag and lift forces, coefficient of drag and
coefficient of lift to drag ratio at different speeds for the three
models. Figure 8, shows that model 3 has the lowest range of
drag force, followed closely by model 2 and model 1 has the
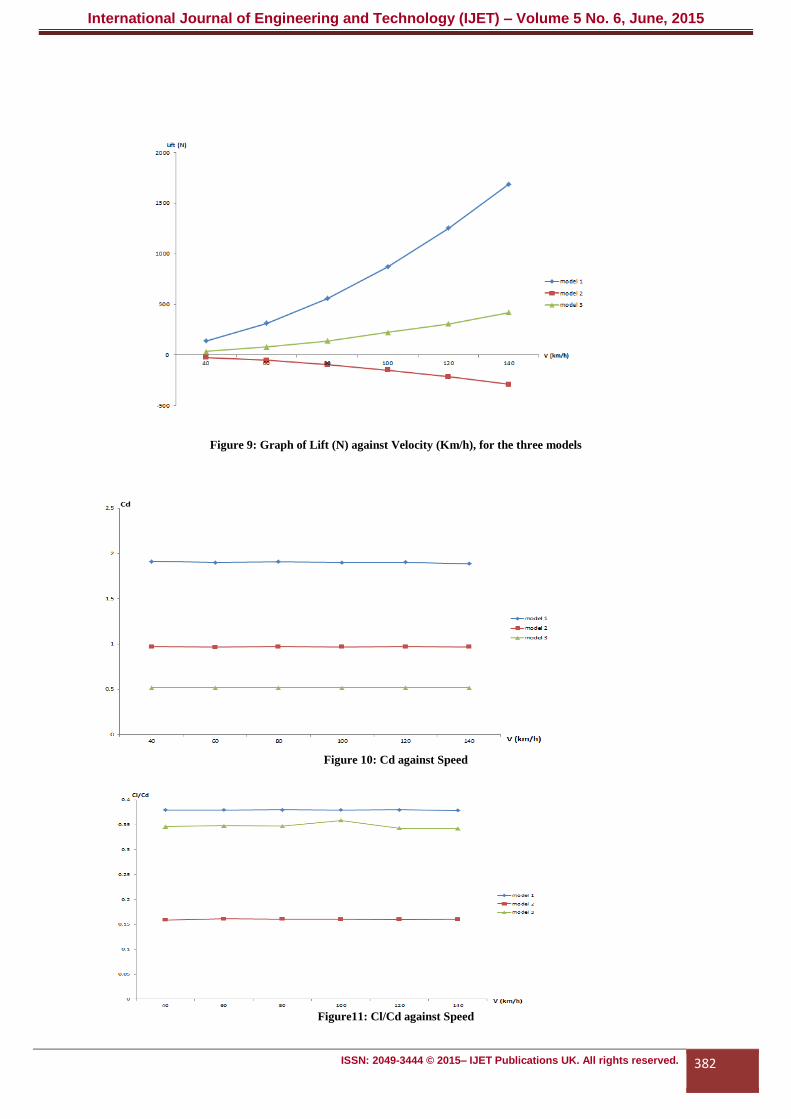
highest range of drag force comparatively. While from figure
9, it was observed that model 1 has the highest lift, model 2
has a negative lift also known as downforce, and model 3
falls in between i.e. not having a high lift compare to model 1
and also not having a downforce as model 2.
Figure 10 shows that the drag coefficients (Cd) at different
speeds for each of the models were constant, though model 1
has the highest value of Cd, compare to the other models and
model 3 has the lowest Cd. Again the values of coefficient of
lift to coefficient of drag (Cl/Cd) were the same at different
speed for the 3 models. Model 1 has the highest Cl/Cd value,
next to model 3 then model 2 has the lowest Cl/Cd value.
Figure 8: Graph of Drag (N) against Velocity (Km/h), for the three models.
International Journal of Engineering and Technology (IJET) – Volume 5 No. 6, June, 2015
ISSN: 2049-3444 © 2015– IJET Publications UK. All rights reserved. 382
Figure 9: Graph of Lift (N) against Velocity (Km/h), for the three models
Figure 10: Cd against Speed
Figure11: Cl/Cd against Speed
International Journal of Engineering and Technology (IJET) – Volume 5 No. 6, June, 2015
ISSN: 2049-3444 © 2015– IJET Publications UK. All rights reserved. 383
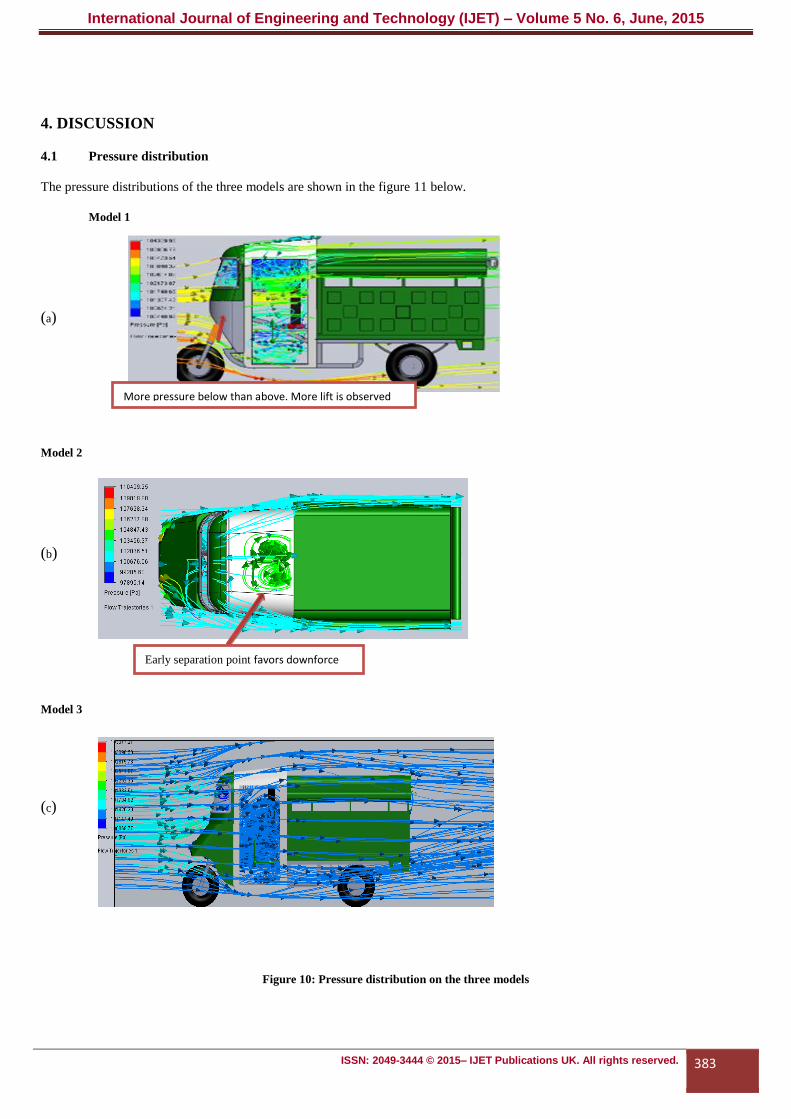
4. DISCUSSION
4.1 Pressure distribution
The pressure distributions of the three models are shown in the figure 11 below.
Model 1
(a)
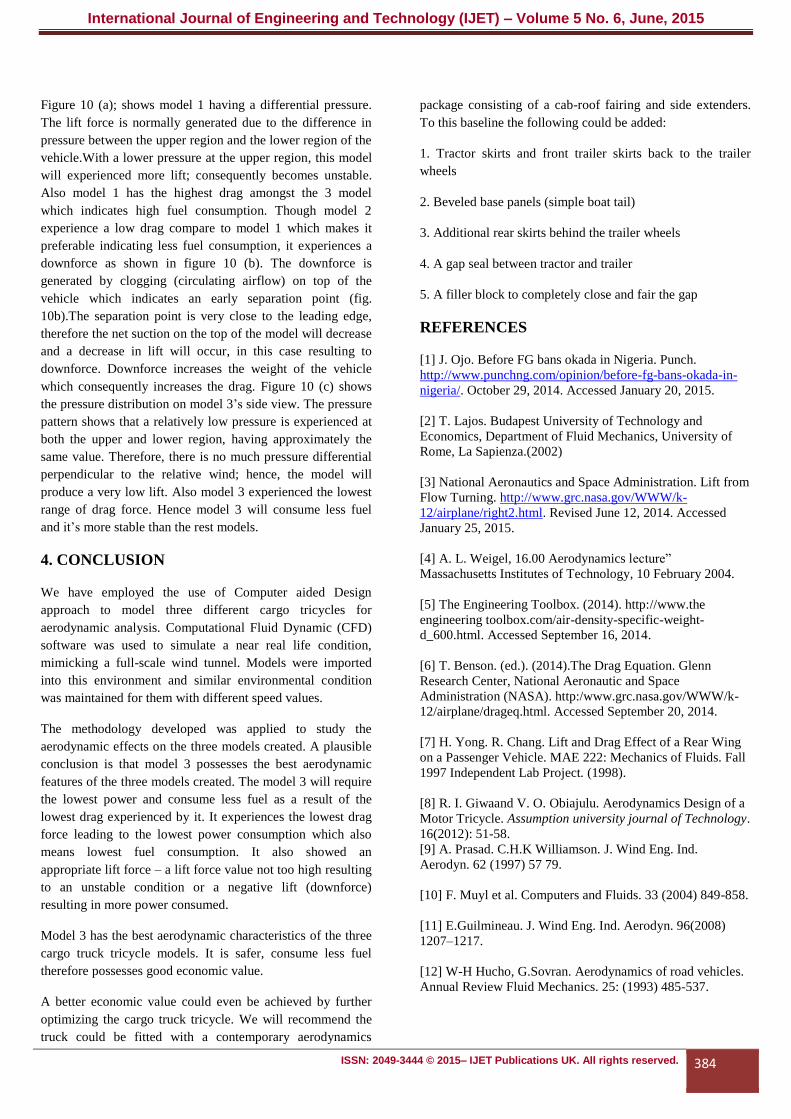
Model 2
(b)
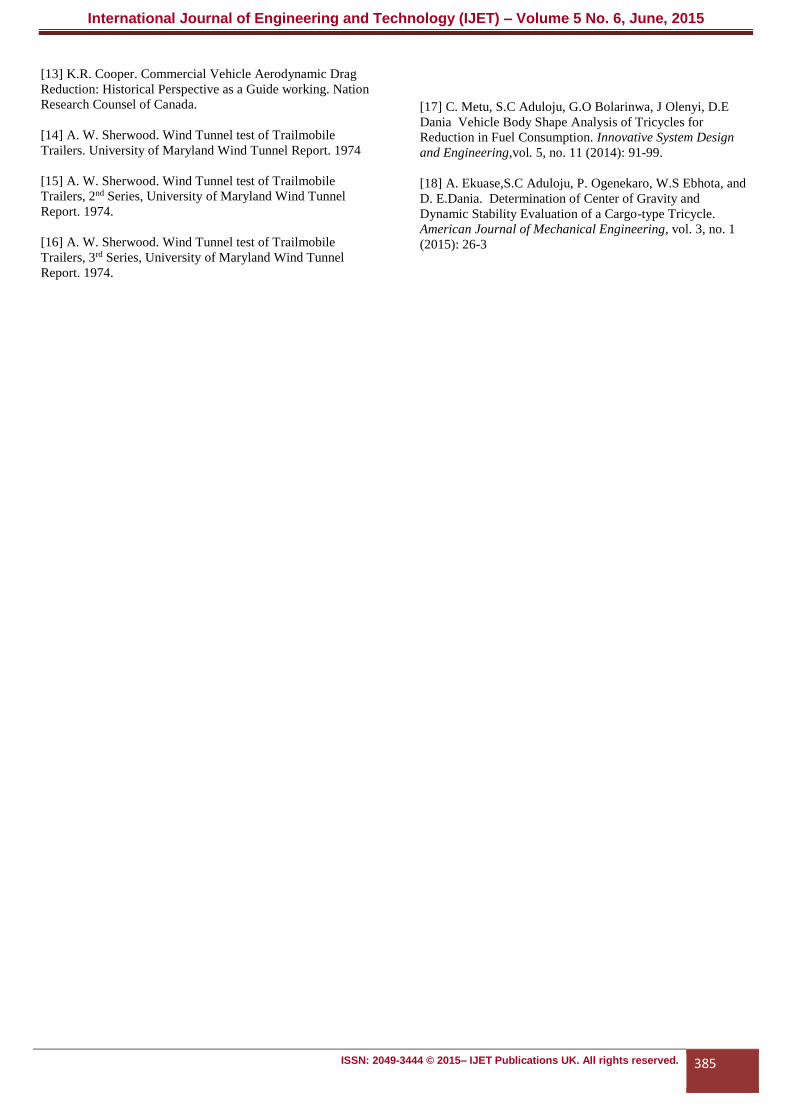
Model 3
(c)
Figure 10: Pressure distribution on the three models
Early separation point favors downforce
More pressure below than above. More lift is observed
International Journal of Engineering and Technology (IJET) – Volume 5 No. 6, June, 2015
ISSN: 2049-3444 © 2015– IJET Publications UK. All rights reserved. 384
Figure 10 (a); shows model 1 having a differential pressure.
The lift force is normally generated due to the difference in
pressure between the upper region and the lower region of the
vehicle.With a lower pressure at the upper region, this model
will experienced more lift; consequently becomes unstable.
Also model 1 has the highest drag amongst the 3 model
which indicates high fuel consumption. Though model 2
experience a low drag compare to model 1 which makes it
preferable indicating less fuel consumption, it experiences a
downforce as shown in figure 10 (b). The downforce is
generated by clogging (circulating airflow) on top of the
vehicle which indicates an early separation point (fig.
10b).The separation point is very close to the leading edge,
therefore the net suction on the top of the model will decrease
and a decrease in lift will occur, in this case resulting to
downforce. Downforce increases the weight of the vehicle
which consequently increases the drag. Figure 10 (c) shows
the pressure distribution on model 3’s side view. The pressure
pattern shows that a relatively low pressure is experienced at
both the upper and lower region, having approximately the
same value. Therefore, there is no much pressure differential
perpendicular to the relative wind; hence, the model will
produce a very low lift. Also model 3 experienced the lowest
range of drag force. Hence model 3 will consume less fuel
and it’s more stable than the rest models.
4. CONCLUSION
We have employed the use of Computer aided Design
approach to model three different cargo tricycles for
aerodynamic analysis. Computational Fluid Dynamic (CFD)
software was used to simulate a near real life condition,
mimicking a full-scale wind tunnel. Models were imported
into this environment and similar environmental condition
was maintained for them with different speed values.
The methodology developed was applied to study the
aerodynamic effects on the three models created. A plausible
conclusion is that model 3 possesses the best aerodynamic
features of the three models created. The model 3 will require
the lowest power and consume less fuel as a result of the
lowest drag experienced by it. It experiences the lowest drag
force leading to the lowest power consumption which also
means lowest fuel consumption. It also showed an
appropriate lift force – a lift force value not too high resulting
to an unstable condition or a negative lift (downforce)
resulting in more power consumed.
Model 3 has the best aerodynamic characteristics of the three
cargo truck tricycle models. It is safer, consume less fuel
therefore possesses good economic value.
A better economic value could even be achieved by further
optimizing the cargo truck tricycle. We will recommend the
truck could be fitted with a contemporary aerodynamics
package consisting of a cab-roof fairing and side extenders.
To this baseline the following could be added:
1. Tractor skirts and front trailer skirts back to the trailer
wheels
2. Beveled base panels (simple boat tail)
3. Additional rear skirts behind the trailer wheels
4. A gap seal between tractor and trailer
5. A filler block to completely close and fair the gap
REFERENCES
[1] J. Ojo. Before FG bans okada in Nigeria. Punch.
http://www.punchng.com/opinion/before-fg-bans-okada-in-
nigeria/. October 29, 2014. Accessed January 20, 2015.
[2] T. Lajos. Budapest University of Technology and
Economics, Department of Fluid Mechanics, University of
Rome, La Sapienza.(2002)
[3] National Aeronautics and Space Administration. Lift from
Flow Turning. http://www.grc.nasa.gov/WWW/k-
12/airplane/right2.html. Revised June 12, 2014. Accessed
January 25, 2015.
[4] A. L. Weigel, 16.00 Aerodynamics lecture”
Massachusetts Institutes of Technology, 10 February 2004.
[5] The Engineering Toolbox. (2014). http://www.the
engineering toolbox.com/air-density-specific-weight-
d_600.html. Accessed September 16, 2014.
[6] T. Benson. (ed.). (2014).The Drag Equation. Glenn
Research Center, National Aeronautic and Space
Administration (NASA). http:/www.grc.nasa.gov/WWW/k-
12/airplane/drageq.html. Accessed September 20, 2014.
[7] H. Yong. R. Chang. Lift and Drag Effect of a Rear Wing
on a Passenger Vehicle. MAE 222: Mechanics of Fluids. Fall
1997 Independent Lab Project. (1998).
[8] R. I. Giwaand V. O. Obiajulu. Aerodynamics Design of a
Motor Tricycle. Assumption university journal of Technology.
16(2012): 51-58.
[9] A. Prasad. C.H.K Williamson. J. Wind Eng. Ind.
Aerodyn. 62 (1997) 57 79.
[10] F. Muyl et al. Computers and Fluids. 33 (2004) 849-858.
[11] E.Guilmineau. J. Wind Eng. Ind. Aerodyn. 96(2008)
1207–1217.
[12] W-H Hucho, G.Sovran. Aerodynamics of road vehicles.
Annual Review Fluid Mechanics. 25: (1993) 485-537.
International Journal of Engineering and Technology (IJET) – Volume 5 No. 6, June, 2015
ISSN: 2049-3444 © 2015– IJET Publications UK. All rights reserved. 385
[13] K.R. Cooper. Commercial Vehicle Aerodynamic Drag
Reduction: Historical Perspective as a Guide working. Nation
Research Counsel of Canada.
[14] A. W. Sherwood. Wind Tunnel test of Trailmobile
Trailers. University of Maryland Wind Tunnel Report. 1974
[15] A. W. Sherwood. Wind Tunnel test of Trailmobile
Trailers, 2nd Series, University of Maryland Wind Tunnel
Report. 1974.
[16] A. W. Sherwood. Wind Tunnel test of Trailmobile
Trailers, 3rd Series, University of Maryland Wind Tunnel
Report. 1974.
[17] C. Metu, S.C Aduloju, G.O Bolarinwa, J Olenyi, D.E
Dania Vehicle Body Shape Analysis of Tricycles for
Reduction in Fuel Consumption. Innovative System Design
and Engineering,vol. 5, no. 11 (2014): 91-99.
[18] A. Ekuase,S.C Aduloju, P. Ogenekaro, W.S Ebhota, and
D. E.Dania. Determination of Center of Gravity and
Dynamic Stability Evaluation of a Cargo-type Tricycle.
American Journal of Mechanical Engineering, vol. 3, no. 1
(2015): 26-3