Embed Size (px)
Citation preview
Journal of Great Lakes Research xxx (2012) xxx–xxx
JGLR-00521; No. of pages: 13; 4C: 3, 4
Contents lists available at SciVerse ScienceDirect
Journal of Great Lakes Research
j ourna l homepage: www.e lsev ie r .com/ locate / jg l r
Mapping invasive Phragmites australis in the coastal Great Lakes with ALOS PALSARsatellite imagery for decision support
Laura L. Bourgeau-Chavez a,⁎, Kurt P. Kowalski b,1, Martha L. Carlson Mazur c,2, Kirk A. Scarbrough a,Richard B. Powell a, Colin N. Brooks a, Brian Huberty d,3, Liza K. Jenkins a, Elizabeth C. Banda a,David M. Galbraith b, Zachary M. Laubach a, Kevin Riordan a
a Michigan Tech Research Institute, Michigan Technological University, 3600 Green Ct., Suite 100, Ann Arbor, MI 48105, USAb U.S. Geological Survey, Great Lakes Science Center, 1451 Green Rd., Ann Arbor, MI 48105, USAc Earth and Environmental Sciences, Boston College, Devlin 213, 140 Commonwealth Avenue, Chestnut Hill, MA 02467, USAd U.S Fish & Wildlife Service Region 3 Ecological Services, 5600 American Blvd, West, Suite 990, Bloomington, MN 55437-1173, USA
⁎ Corresponding author. Tel: +734 913 6873.E-mail addresses: [email protected] (L.L. Bourgeau-C
(K.P. Kowalski), [email protected] (M.L. Carlson M(B. Huberty).
1 Fax: +1 734 214 8780.2 Fax: +1 617 552 2462.3 Fax: +1 612 713 5292.
0380-1330/$ – see front matter © 2012 International Ahttp://dx.doi.org/10.1016/j.jglr.2012.11.001
Please cite this article as: Bourgeau-Chavez, Limagery for decision support, J Great Lakes R
a b s t r a c t
a r t i c l e i n f oArticle history:Received 20 December 2011Accepted 2 November 2012Available online xxxx
Communicated by George Leshkevich
Index words:Synthetic Aperture Radar (SAR)Phragmites australisCommon reedInvasive speciesPALSARRemote sensing
The invasive variety of Phragmites australis (common reed) forms dense stands that can cause negative im-pacts on coastal Great Lakes wetlands including habitat degradation and reduced biological diversity. Earlytreatment is key to controlling Phragmites, therefore a map of the current distribution is needed. ALOSPALSAR imagery was used to produce the first basin-wide distribution map showing the extent of large,dense invasive Phragmites-dominated habitats in wetlands and other coastal ecosystems along the U.S.shore of the Great Lakes. PALSAR is a satellite imaging radar sensor that is sensitive to differences in plant bio-mass and inundation patterns, allowing for the detection and delineation of these tall (up to 5 m), high den-sity, high biomass invasive Phragmites stands. Classification was based on multi-season ALOS PALSAR L-band(23 cm wavelength) HH and HV polarization data. Seasonal (spring, summer, and fall) datasets were used toimprove discrimination of Phragmites by taking advantage of phenological changes in vegetation and inunda-tion patterns over the seasons. Extensive field collections of training and randomly selected validation datawere conducted in 2010–2011 to aid in mapping and for accuracy assessments. Overall basin-widemap accuracy was 87%, with 86% producer's accuracy and 43% user's accuracy for invasive Phragmites.The invasive Phragmites maps are being used to identify major environmental drivers of this invader'sdistribution, to assess areas vulnerable to new invasion, and to provide information to regional stakeholdersthrough a decision support tool.
© 2012 International Association for Great Lakes Research. Published by Elsevier B.V. All rights reserved.
Introduction
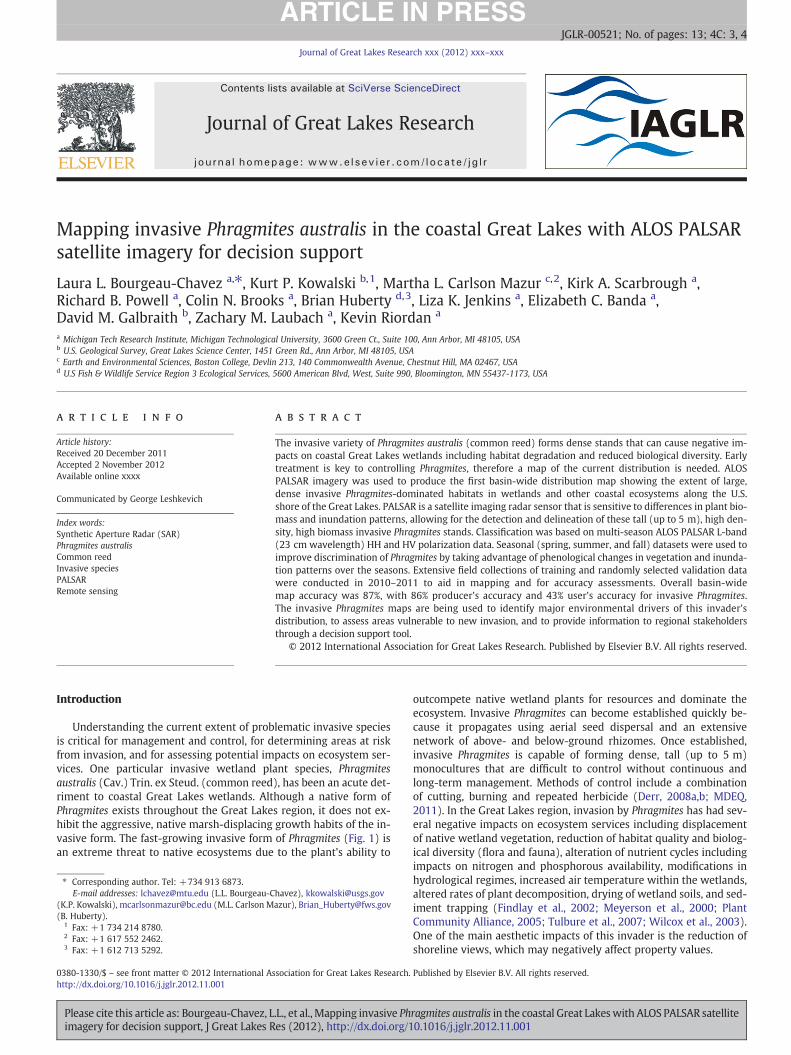
Understanding the current extent of problematic invasive speciesis critical for management and control, for determining areas at riskfrom invasion, and for assessing potential impacts on ecosystem ser-vices. One particular invasive wetland plant species, Phragmitesaustralis (Cav.) Trin. ex Steud. (common reed), has been an acute det-riment to coastal Great Lakes wetlands. Although a native form ofPhragmites exists throughout the Great Lakes region, it does not ex-hibit the aggressive, native marsh-displacing growth habits of the in-vasive form. The fast-growing invasive form of Phragmites (Fig. 1) isan extreme threat to native ecosystems due to the plant's ability to
havez), [email protected]), [email protected]
ssociation for Great Lakes Research.
.L., et al., Mapping invasive Phes (2012), http://dx.doi.org/1
outcompete native wetland plants for resources and dominate theecosystem. Invasive Phragmites can become established quickly be-cause it propagates using aerial seed dispersal and an extensivenetwork of above- and below-ground rhizomes. Once established,invasive Phragmites is capable of forming dense, tall (up to 5 m)monocultures that are difficult to control without continuous andlong-term management. Methods of control include a combinationof cutting, burning and repeated herbicide (Derr, 2008a,b; MDEQ,2011). In the Great Lakes region, invasion by Phragmites has had sev-eral negative impacts on ecosystem services including displacementof native wetland vegetation, reduction of habitat quality and biolog-ical diversity (flora and fauna), alteration of nutrient cycles includingimpacts on nitrogen and phosphorous availability, modifications inhydrological regimes, increased air temperature within the wetlands,altered rates of plant decomposition, drying of wetland soils, and sed-iment trapping (Findlay et al., 2002; Meyerson et al., 2000; PlantCommunity Alliance, 2005; Tulbure et al., 2007; Wilcox et al., 2003).One of the main aesthetic impacts of this invader is the reduction ofshoreline views, which may negatively affect property values.
Published by Elsevier B.V. All rights reserved.
ragmites australis in the coastal Great Lakeswith ALOS PALSAR satellite0.1016/j.jglr.2012.11.001
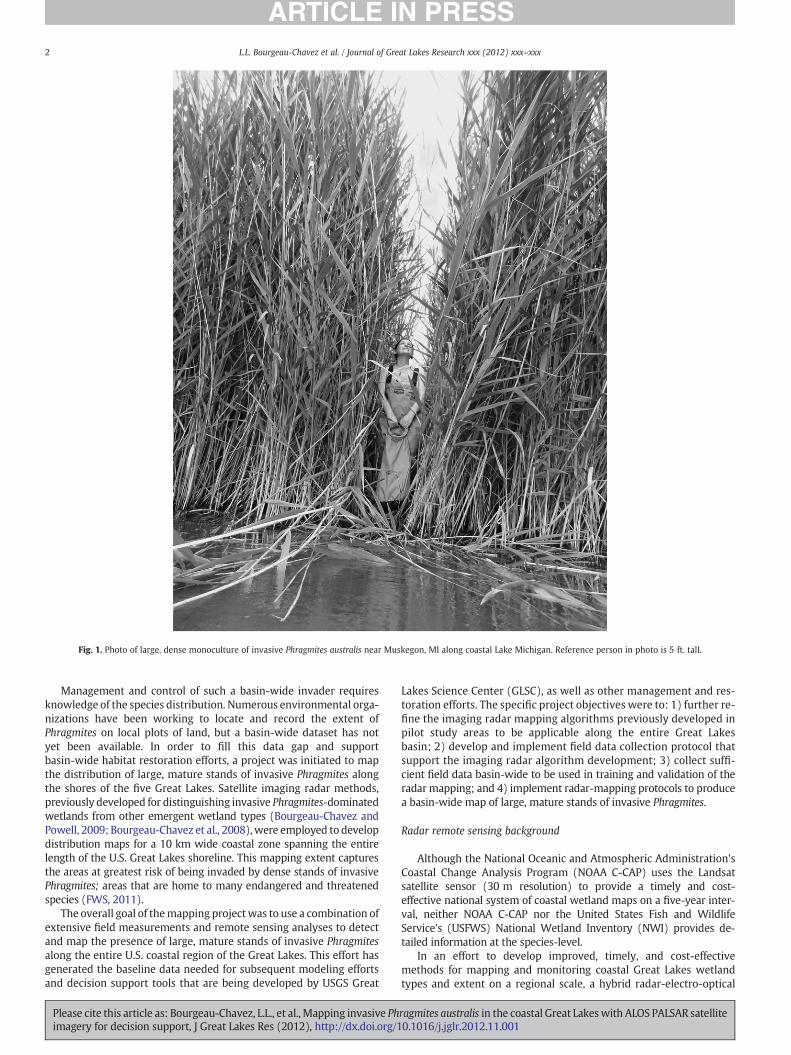
Fig. 1. Photo of large, dense monoculture of invasive Phragmites australis near Muskegon, MI along coastal Lake Michigan. Reference person in photo is 5 ft. tall.
2 L.L. Bourgeau-Chavez et al. / Journal of Great Lakes Research xxx (2012) xxx–xxx
Management and control of such a basin-wide invader requiresknowledge of the species distribution. Numerous environmental orga-nizations have been working to locate and record the extent ofPhragmites on local plots of land, but a basin-wide dataset has notyet been available. In order to fill this data gap and supportbasin-wide habitat restoration efforts, a project was initiated to mapthe distribution of large, mature stands of invasive Phragmites alongthe shores of the five Great Lakes. Satellite imaging radar methods,previously developed for distinguishing invasive Phragmites-dominatedwetlands from other emergent wetland types (Bourgeau-Chavez andPowell, 2009; Bourgeau-Chavez et al., 2008),were employed to developdistribution maps for a 10 km wide coastal zone spanning the entirelength of the U.S. Great Lakes shoreline. This mapping extent capturesthe areas at greatest risk of being invaded by dense stands of invasivePhragmites; areas that are home to many endangered and threatenedspecies (FWS, 2011).
The overall goal of themapping projectwas to use a combination ofextensive field measurements and remote sensing analyses to detectand map the presence of large, mature stands of invasive Phragmitesalong the entire U.S. coastal region of the Great Lakes. This effort hasgenerated the baseline data needed for subsequent modeling effortsand decision support tools that are being developed by USGS Great
Please cite this article as: Bourgeau-Chavez, L.L., et al., Mapping invasive Phimagery for decision support, J Great Lakes Res (2012), http://dx.doi.org/1
Lakes Science Center (GLSC), as well as other management and res-toration efforts. The specific project objectives were to: 1) further re-fine the imaging radar mapping algorithms previously developed inpilot study areas to be applicable along the entire Great Lakesbasin; 2) develop and implement field data collection protocol thatsupport the imaging radar algorithm development; 3) collect suffi-cient field data basin-wide to be used in training and validation of theradar mapping; and 4) implement radar-mapping protocols to producea basin-wide map of large, mature stands of invasive Phragmites.
Radar remote sensing background
Although the National Oceanic and Atmospheric Administration'sCoastal Change Analysis Program (NOAA C-CAP) uses the Landsatsatellite sensor (30 m resolution) to provide a timely and cost-effective national system of coastal wetland maps on a five-year inter-val, neither NOAA C-CAP nor the United States Fish and WildlifeService's (USFWS) National Wetland Inventory (NWI) provides de-tailed information at the species-level.
In an effort to develop improved, timely, and cost-effectivemethods for mapping and monitoring coastal Great Lakes wetlandtypes and extent on a regional scale, a hybrid radar-electro-optical
ragmites australis in the coastal Great Lakeswith ALOS PALSAR satellite0.1016/j.jglr.2012.11.001
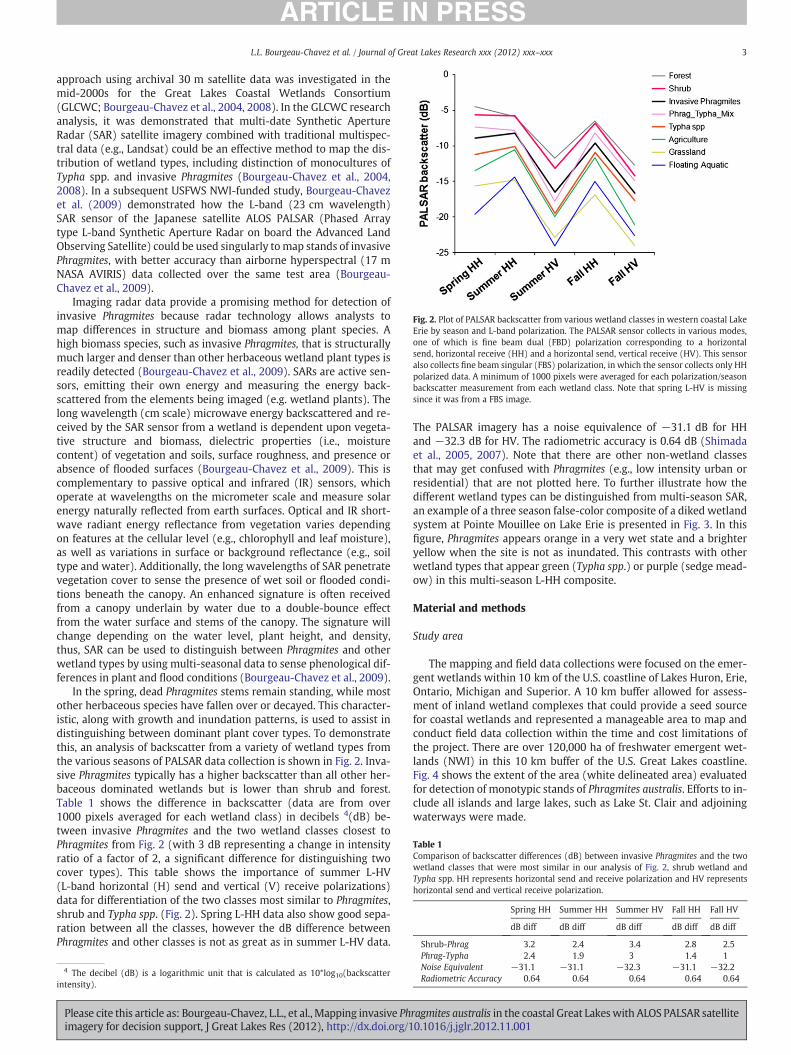
Fig. 2. Plot of PALSAR backscatter from various wetland classes in western coastal LakeErie by season and L-band polarization. The PALSAR sensor collects in various modes,one of which is fine beam dual (FBD) polarization corresponding to a horizontalsend, horizontal receive (HH) and a horizontal send, vertical receive (HV). This sensoralso collects fine beam singular (FBS) polarization, in which the sensor collects only HHpolarized data. A minimum of 1000 pixels were averaged for each polarization/seasonbackscatter measurement from each wetland class. Note that spring L-HV is missingsince it was from a FBS image.
Table 1Comparison of backscatter differences (dB) between invasive Phragmites and the twowetland classes that were most similar in our analysis of Fig. 2, shrub wetland andTypha spp. HH represents horizontal send and receive polarization and HV representshorizontal send and vertical receive polarization.
Spring HH Summer HH Summer HV Fall HH Fall HV
dB diff dB diff dB diff dB diff dB diff
Shrub-Phrag 3.2 2.4 3.4 2.8 2.5
3L.L. Bourgeau-Chavez et al. / Journal of Great Lakes Research xxx (2012) xxx–xxx
approach using archival 30 m satellite data was investigated in themid-2000s for the Great Lakes Coastal Wetlands Consortium(GLCWC; Bourgeau-Chavez et al., 2004, 2008). In the GLCWC researchanalysis, it was demonstrated that multi-date Synthetic ApertureRadar (SAR) satellite imagery combined with traditional multispec-tral data (e.g., Landsat) could be an effective method to map the dis-tribution of wetland types, including distinction of monocultures ofTypha spp. and invasive Phragmites (Bourgeau-Chavez et al., 2004,2008). In a subsequent USFWS NWI-funded study, Bourgeau-Chavezet al. (2009) demonstrated how the L-band (23 cm wavelength)SAR sensor of the Japanese satellite ALOS PALSAR (Phased Arraytype L-band Synthetic Aperture Radar on board the Advanced LandObserving Satellite) could be used singularly tomap stands of invasivePhragmites, with better accuracy than airborne hyperspectral (17 mNASA AVIRIS) data collected over the same test area (Bourgeau-Chavez et al., 2009).
Imaging radar data provide a promising method for detection ofinvasive Phragmites because radar technology allows analysts tomap differences in structure and biomass among plant species. Ahigh biomass species, such as invasive Phragmites, that is structurallymuch larger and denser than other herbaceous wetland plant types isreadily detected (Bourgeau-Chavez et al., 2009). SARs are active sen-sors, emitting their own energy and measuring the energy back-scattered from the elements being imaged (e.g. wetland plants). Thelong wavelength (cm scale) microwave energy backscattered and re-ceived by the SAR sensor from a wetland is dependent upon vegeta-tive structure and biomass, dielectric properties (i.e., moisturecontent) of vegetation and soils, surface roughness, and presence orabsence of flooded surfaces (Bourgeau-Chavez et al., 2009). This iscomplementary to passive optical and infrared (IR) sensors, whichoperate at wavelengths on the micrometer scale and measure solarenergy naturally reflected from earth surfaces. Optical and IR short-wave radiant energy reflectance from vegetation varies dependingon features at the cellular level (e.g., chlorophyll and leaf moisture),as well as variations in surface or background reflectance (e.g., soiltype and water). Additionally, the long wavelengths of SAR penetratevegetation cover to sense the presence of wet soil or flooded condi-tions beneath the canopy. An enhanced signature is often receivedfrom a canopy underlain by water due to a double-bounce effectfrom the water surface and stems of the canopy. The signature willchange depending on the water level, plant height, and density,thus, SAR can be used to distinguish between Phragmites and otherwetland types by using multi-seasonal data to sense phenological dif-ferences in plant and flood conditions (Bourgeau-Chavez et al., 2009).
In the spring, dead Phragmites stems remain standing, while mostother herbaceous species have fallen over or decayed. This character-istic, along with growth and inundation patterns, is used to assist indistinguishing between dominant plant cover types. To demonstratethis, an analysis of backscatter from a variety of wetland types fromthe various seasons of PALSAR data collection is shown in Fig. 2. Inva-sive Phragmites typically has a higher backscatter than all other her-baceous dominated wetlands but is lower than shrub and forest.Table 1 shows the difference in backscatter (data are from over1000 pixels averaged for each wetland class) in decibels 4(dB) be-tween invasive Phragmites and the two wetland classes closest toPhragmites from Fig. 2 (with 3 dB representing a change in intensityratio of a factor of 2, a significant difference for distinguishing twocover types). This table shows the importance of summer L-HV(L-band horizontal (H) send and vertical (V) receive polarizations)data for differentiation of the two classes most similar to Phragmites,shrub and Typha spp. (Fig. 2). Spring L-HH data also show good sepa-ration between all the classes, however the dB difference betweenPhragmites and other classes is not as great as in summer L-HV data.
4 The decibel (dB) is a logarithmic unit that is calculated as 10*log10(backscatterintensity).
Please cite this article as: Bourgeau-Chavez, L.L., et al., Mapping invasive Phimagery for decision support, J Great Lakes Res (2012), http://dx.doi.org/1
The PALSAR imagery has a noise equivalence of −31.1 dB for HHand −32.3 dB for HV. The radiometric accuracy is 0.64 dB (Shimadaet al., 2005, 2007). Note that there are other non-wetland classesthat may get confused with Phragmites (e.g., low intensity urban orresidential) that are not plotted here. To further illustrate how thedifferent wetland types can be distinguished from multi-season SAR,an example of a three season false-color composite of a diked wetlandsystem at Pointe Mouillee on Lake Erie is presented in Fig. 3. In thisfigure, Phragmites appears orange in a very wet state and a brighteryellow when the site is not as inundated. This contrasts with otherwetland types that appear green (Typha spp.) or purple (sedge mead-ow) in this multi-season L-HH composite.
Material and methods
Study area
The mapping and field data collections were focused on the emer-gent wetlands within 10 km of the U.S. coastline of Lakes Huron, Erie,Ontario, Michigan and Superior. A 10 km buffer allowed for assess-ment of inland wetland complexes that could provide a seed sourcefor coastal wetlands and represented a manageable area to map andconduct field data collection within the time and cost limitations ofthe project. There are over 120,000 ha of freshwater emergent wet-lands (NWI) in this 10 km buffer of the U.S. Great Lakes coastline.Fig. 4 shows the extent of the area (white delineated area) evaluatedfor detection of monotypic stands of Phragmites australis. Efforts to in-clude all islands and large lakes, such as Lake St. Clair and adjoiningwaterways were made.
Phrag-Typha 2.4 1.9 3 1.4 1Noise Equivalent −31.1 −31.1 −32.3 −31.1 −32.2Radiometric Accuracy 0.64 0.64 0.64 0.64 0.64
ragmites australis in the coastal Great Lakeswith ALOS PALSAR satellite0.1016/j.jglr.2012.11.001
Fig. 3. Three seasonal images of PALSAR L-HH data (top black and white images) over a diked wetland at Pointe Mouillee State Game Area on Lake Erie were used to create a red,green, blue false color composite (bottom images). The bottom left image is a zoom of the full PALSAR scene (shown in bottom right). This false color image highlights the differ-ences in water levels and phenologic condition of the vegetation over the seasons allowing the image analyst to distinguish vegetation types (e.g. Phragmites is orange in thiscomposite).
4 L.L. Bourgeau-Chavez et al. / Journal of Great Lakes Research xxx (2012) xxx–xxx
Due to funding limitations, the mapping project was focused onlyon the U.S. side of the Great Lakes. A mapping effort for portions of theCanadian side of the Great Lakes coast is underway by the Ministry ofNatural Resources using Landsat NDVI (Young et al., 2011). Similarly,a basin-wide mapping effort has been initiated by MTRI through anEPA-funded initiative that will use SAR-electro optical methods(Bourgeau-Chavez et al., 2004, 2008) for mapping wetland type andadjacent land use. This mapping effort will build from the Phragmitesproject database and include classification of invasive Phragmites onthe Canadian side of the Great Lakes using circa 2008–2010 data.
Imagery
The images used for mapping were from PALSAR on board theALOS platform. ALOS was launched in 2006 and continued to collectdata until it failed in April 2011 (see Rosenqvist et al., 2007 for a de-tailed review of the PALSAR sensor). During this time, particularly in2010, excellent coverage of the Great Lakes region was acquired bythe sensor and downloaded to the Alaska Satellite Facility (ASF) forprocessing, calibration and archive. The Fine Beam Dual (FBD) polar-ization mode data were the focus for the mapping due to the moder-ate resolution (20 m) and two polarimetric channels, horizontal sendand receive (L-HH) and horizontal send and vertical receive (L-HV).The L-HH polarized data have been found to be most useful for detec-tion of flooding beneath a canopy (Hess et al., 1995) while L-HV ismore sensitive to differences in biomass (Bourgeau-Chavez et al.,
Please cite this article as: Bourgeau-Chavez, L.L., et al., Mapping invasive Phimagery for decision support, J Great Lakes Res (2012), http://dx.doi.org/1
2009). The like-polarized data (L-HH) allow for detection of varia-tions in water levels over the season.
Based on previous wetland work with SAR (Bourgeau-Chavezet al., 2001, 2004, 2005, 2008, 2009), a three-date seasonal dataset(spring, summer, and fall) of PALSAR (FBD) images was selected asoptimal for mapping Phragmites and to differentiate Phragmites fromother wetland types. In the absence of the FBD data, FBS (Fine BeamSingle Polarization) data were selected (23 scenes). FBS data have asingle polarization, L-HH, and 10 m resolution but the same70×70 km footprint as FBD data. While the ideal dataset would in-clude three seasons of data with both polarizations, a minimum oftwo seasons of data with two polarizations were found to be suffi-cient for the detection and mapping of invasive Phragmites.
The minimum mapping unit (mmu) of 0.2 ha was defined by pro-ject needs and limitations of the resolution and nature of the SAR im-agery. Although the SAR imagery has 10–20 m resolution, due toinherent speckle noise, the effective mapping unit must be a multipleof the resolution cell. Speckle noise is a ‘salt and pepper’ effectresulting from the coherent radiation used by SAR systems. Basedon field data comparison to PALSAR map products, in the case of20 m resolution radar, 0.2 ha or 2×2.5 resolution cells is the mini-mum size which can be confidently mapped (Bourgeau-Chavezet al., 2009).
All PALSAR images were collected in descending orbits with an in-cidence angle of 34.3°, except for three FBS images which were of41.5° incidence angle. The difference in the incidence angle shouldnot have much effect on the ability to detect flooding beneath the
ragmites australis in the coastal Great Lakeswith ALOS PALSAR satellite0.1016/j.jglr.2012.11.001
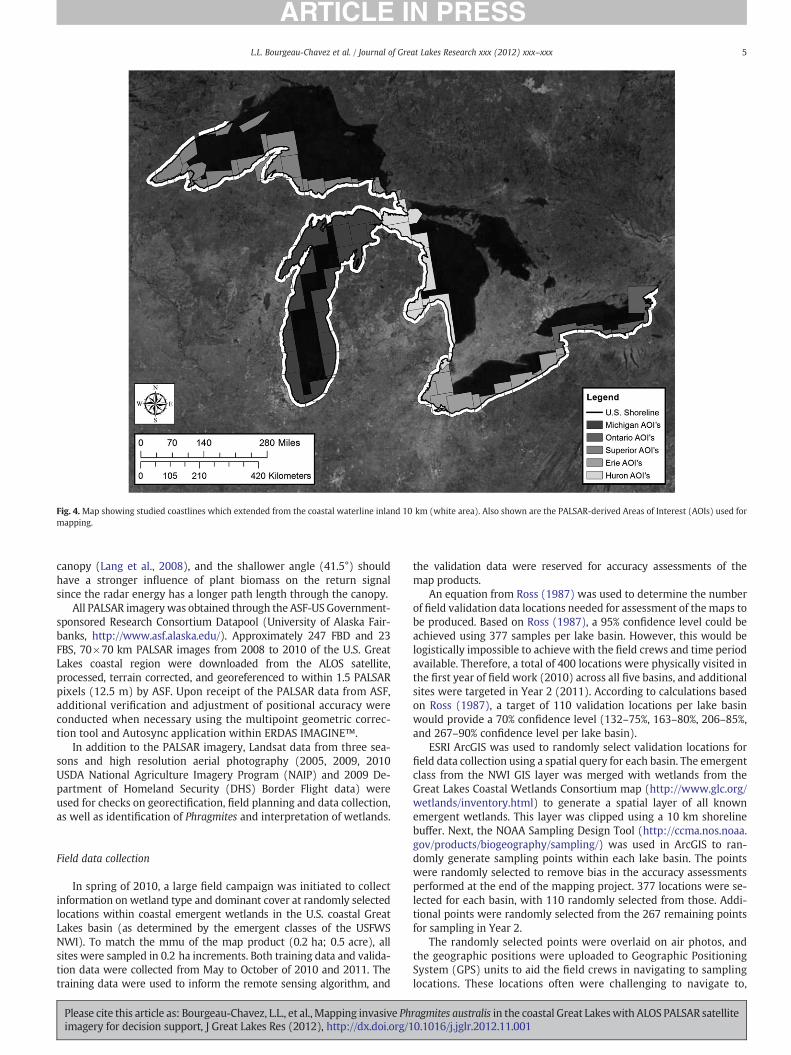
Fig. 4. Map showing studied coastlines which extended from the coastal waterline inland 10 km (white area). Also shown are the PALSAR-derived Areas of Interest (AOIs) used formapping.
5L.L. Bourgeau-Chavez et al. / Journal of Great Lakes Research xxx (2012) xxx–xxx
canopy (Lang et al., 2008), and the shallower angle (41.5°) shouldhave a stronger influence of plant biomass on the return signalsince the radar energy has a longer path length through the canopy.
All PALSAR imagery was obtained through the ASF-US Government-sponsored Research Consortium Datapool (University of Alaska Fair-banks, http://www.asf.alaska.edu/). Approximately 247 FBD and 23FBS, 70×70 km PALSAR images from 2008 to 2010 of the U.S. GreatLakes coastal region were downloaded from the ALOS satellite,processed, terrain corrected, and georeferenced to within 1.5 PALSARpixels (12.5 m) by ASF. Upon receipt of the PALSAR data from ASF,additional verification and adjustment of positional accuracy wereconducted when necessary using the multipoint geometric correc-tion tool and Autosync application within ERDAS IMAGINE™.
In addition to the PALSAR imagery, Landsat data from three sea-sons and high resolution aerial photography (2005, 2009, 2010USDA National Agriculture Imagery Program (NAIP) and 2009 De-partment of Homeland Security (DHS) Border Flight data) wereused for checks on georectification, field planning and data collection,as well as identification of Phragmites and interpretation of wetlands.
Field data collection
In spring of 2010, a large field campaign was initiated to collectinformation on wetland type and dominant cover at randomly selectedlocations within coastal emergent wetlands in the U.S. coastal GreatLakes basin (as determined by the emergent classes of the USFWSNWI). To match the mmu of the map product (0.2 ha; 0.5 acre), allsites were sampled in 0.2 ha increments. Both training data and valida-tion data were collected from May to October of 2010 and 2011. Thetraining data were used to inform the remote sensing algorithm, and
Please cite this article as: Bourgeau-Chavez, L.L., et al., Mapping invasive Phimagery for decision support, J Great Lakes Res (2012), http://dx.doi.org/1
the validation data were reserved for accuracy assessments of themap products.
An equation from Ross (1987) was used to determine the numberof field validation data locations needed for assessment of the maps tobe produced. Based on Ross (1987), a 95% confidence level could beachieved using 377 samples per lake basin. However, this would belogistically impossible to achieve with the field crews and time periodavailable. Therefore, a total of 400 locations were physically visited inthe first year of field work (2010) across all five basins, and additionalsites were targeted in Year 2 (2011). According to calculations basedon Ross (1987), a target of 110 validation locations per lake basinwould provide a 70% confidence level (132–75%, 163–80%, 206–85%,and 267–90% confidence level per lake basin).
ESRI ArcGIS was used to randomly select validation locations forfield data collection using a spatial query for each basin. The emergentclass from the NWI GIS layer was merged with wetlands from theGreat Lakes Coastal Wetlands Consortium map (http://www.glc.org/wetlands/inventory.html) to generate a spatial layer of all knownemergent wetlands. This layer was clipped using a 10 km shorelinebuffer. Next, the NOAA Sampling Design Tool (http://ccma.nos.noaa.gov/products/biogeography/sampling/) was used in ArcGIS to ran-domly generate sampling points within each lake basin. The pointswere randomly selected to remove bias in the accuracy assessmentsperformed at the end of the mapping project. 377 locations were se-lected for each basin, with 110 randomly selected from those. Addi-tional points were randomly selected from the 267 remaining pointsfor sampling in Year 2.
The randomly selected points were overlaid on air photos, andthe geographic positions were uploaded to Geographic PositioningSystem (GPS) units to aid the field crews in navigating to samplinglocations. These locations often were challenging to navigate to,
ragmites australis in the coastal Great Lakeswith ALOS PALSAR satellite0.1016/j.jglr.2012.11.001
6 L.L. Bourgeau-Chavez et al. / Journal of Great Lakes Research xxx (2012) xxx–xxx
sometimes requiring a boat or traversing through difficult terrain. Incontrast to the validation data protocol, random sampling was notthe most efficient way to collect the training data needed from a va-riety of wetlands types within each 70×70 km PALSAR scene tocharacterize the radar signature of each wetland type. Therefore,training sites were chosen via identification on air photos or in thefield via observation. Data collection protocol at the training siteswas identical to that of the validation sites, characterizing a 0.2 ha(40×50 m) area in the field.
Equipment for field data collection included laptop computers, airphoto maps, GPS units, and digital cameras with built-in GPS andcompass for geo-tagging the field photos, which were taken in fourcardinal directions. Parameters collected at each site included generalecosystem type (e.g., shrub wetland, emergent wetland, wet prairie,open water, floating aquatic, mudflat, and upland), percent cover bydominant cover type, dominant vegetation height and density (densitywas only recorded for Phragmites and Typha), water level, time of day,location (GPS coordinates collected in WGS 84 latitude and longitudecoordinates), and field-drawn maps for estimating extent of adjacentland cover features.
A web-based interface was developed for immediate entry of fielddata into the computer database for geographic analysis and interpre-tation. This database was then checked for quality control against thefield datasheets to reduce data entry or transcription errors at the endof the 2011 season. Once a list of errors was generated, a systematicapproach of correcting these errors was accomplished including re-trieval of data sheets completed in the field, analysis of field collectedphotos for potential verification of species present, and reassessmentof field collected GPS coordinates. Once quality control was complet-ed, the database was then linked to the uploaded GPS points collectedat the center of each training and validation location sampled in thefield. An ESRI shapefile was generated using all the attributes collect-ed in the field. This process allowed the image analysts to have all thefield data and field photos within the GIS available to them when cre-ating the map products.
Mapping
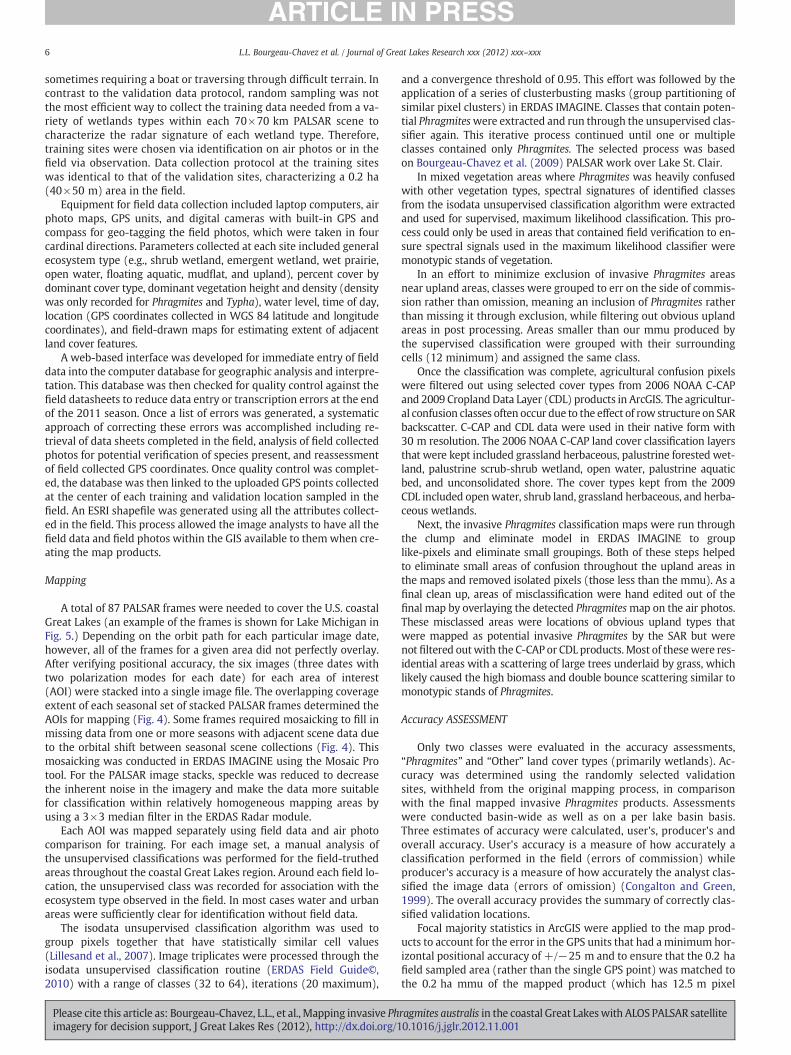
A total of 87 PALSAR frames were needed to cover the U.S. coastalGreat Lakes (an example of the frames is shown for Lake Michigan inFig. 5.) Depending on the orbit path for each particular image date,however, all of the frames for a given area did not perfectly overlay.After verifying positional accuracy, the six images (three dates withtwo polarization modes for each date) for each area of interest(AOI) were stacked into a single image file. The overlapping coverageextent of each seasonal set of stacked PALSAR frames determined theAOIs for mapping (Fig. 4). Some frames required mosaicking to fill inmissing data from one or more seasons with adjacent scene data dueto the orbital shift between seasonal scene collections (Fig. 4). Thismosaicking was conducted in ERDAS IMAGINE using the Mosaic Protool. For the PALSAR image stacks, speckle was reduced to decreasethe inherent noise in the imagery and make the data more suitablefor classification within relatively homogeneous mapping areas byusing a 3×3 median filter in the ERDAS Radar module.
Each AOI was mapped separately using field data and air photocomparison for training. For each image set, a manual analysis ofthe unsupervised classifications was performed for the field-truthedareas throughout the coastal Great Lakes region. Around each field lo-cation, the unsupervised class was recorded for association with theecosystem type observed in the field. In most cases water and urbanareas were sufficiently clear for identification without field data.
The isodata unsupervised classification algorithm was used togroup pixels together that have statistically similar cell values(Lillesand et al., 2007). Image triplicates were processed through theisodata unsupervised classification routine (ERDAS Field Guide©,2010) with a range of classes (32 to 64), iterations (20 maximum),
Please cite this article as: Bourgeau-Chavez, L.L., et al., Mapping invasive Phimagery for decision support, J Great Lakes Res (2012), http://dx.doi.org/1
and a convergence threshold of 0.95. This effort was followed by theapplication of a series of clusterbusting masks (group partitioning ofsimilar pixel clusters) in ERDAS IMAGINE. Classes that contain poten-tial Phragmiteswere extracted and run through the unsupervised clas-sifier again. This iterative process continued until one or multipleclasses contained only Phragmites. The selected process was basedon Bourgeau-Chavez et al. (2009) PALSAR work over Lake St. Clair.
In mixed vegetation areas where Phragmites was heavily confusedwith other vegetation types, spectral signatures of identified classesfrom the isodata unsupervised classification algorithm were extractedand used for supervised, maximum likelihood classification. This pro-cess could only be used in areas that contained field verification to en-sure spectral signals used in the maximum likelihood classifier weremonotypic stands of vegetation.
In an effort to minimize exclusion of invasive Phragmites areasnear upland areas, classes were grouped to err on the side of commis-sion rather than omission, meaning an inclusion of Phragmites ratherthan missing it through exclusion, while filtering out obvious uplandareas in post processing. Areas smaller than our mmu produced bythe supervised classification were grouped with their surroundingcells (12 minimum) and assigned the same class.
Once the classification was complete, agricultural confusion pixelswere filtered out using selected cover types from 2006 NOAA C-CAPand 2009 Cropland Data Layer (CDL) products in ArcGIS. The agricultur-al confusion classes often occur due to the effect of row structure on SARbackscatter. C-CAP and CDL data were used in their native form with30 m resolution. The 2006 NOAA C-CAP land cover classification layersthat were kept included grassland herbaceous, palustrine forested wet-land, palustrine scrub-shrub wetland, open water, palustrine aquaticbed, and unconsolidated shore. The cover types kept from the 2009CDL included openwater, shrub land, grassland herbaceous, and herba-ceous wetlands.
Next, the invasive Phragmites classification maps were run throughthe clump and eliminate model in ERDAS IMAGINE to grouplike-pixels and eliminate small groupings. Both of these steps helpedto eliminate small areas of confusion throughout the upland areas inthe maps and removed isolated pixels (those less than the mmu). As afinal clean up, areas of misclassification were hand edited out of thefinal map by overlaying the detected Phragmitesmap on the air photos.These misclassed areas were locations of obvious upland types thatwere mapped as potential invasive Phragmites by the SAR but werenot filtered outwith the C-CAP or CDL products.Most of thesewere res-idential areas with a scattering of large trees underlaid by grass, whichlikely caused the high biomass and double bounce scattering similar tomonotypic stands of Phragmites.
Accuracy ASSESSMENT
Only two classes were evaluated in the accuracy assessments,“Phragmites” and “Other” land cover types (primarily wetlands). Ac-curacy was determined using the randomly selected validationsites, withheld from the original mapping process, in comparisonwith the final mapped invasive Phragmites products. Assessmentswere conducted basin-wide as well as on a per lake basin basis.Three estimates of accuracy were calculated, user's, producer's andoverall accuracy. User's accuracy is a measure of how accurately aclassification performed in the field (errors of commission) whileproducer's accuracy is a measure of how accurately the analyst clas-sified the image data (errors of omission) (Congalton and Green,1999). The overall accuracy provides the summary of correctly clas-sified validation locations.
Focal majority statistics in ArcGIS were applied to the map prod-ucts to account for the error in the GPS units that had aminimum hor-izontal positional accuracy of +/−25 m and to ensure that the 0.2 hafield sampled area (rather than the single GPS point) was matched tothe 0.2 ha mmu of the mapped product (which has 12.5 m pixel
ragmites australis in the coastal Great Lakeswith ALOS PALSAR satellite0.1016/j.jglr.2012.11.001
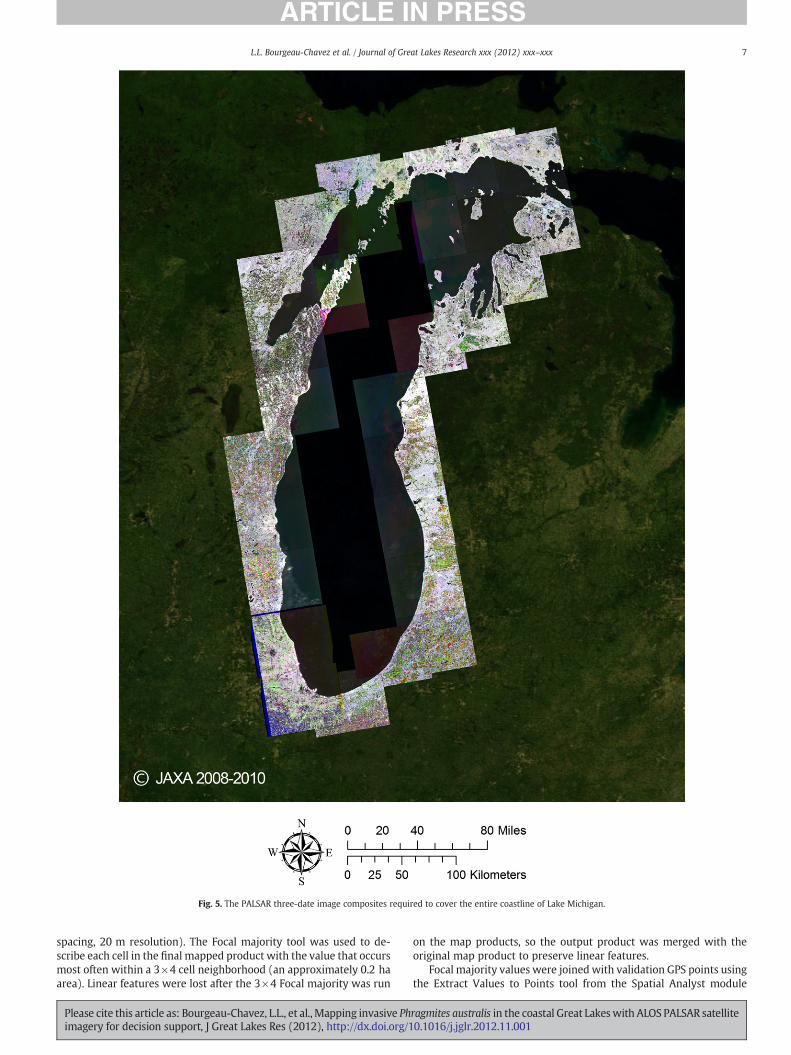
Fig. 5. The PALSAR three-date image composites required to cover the entire coastline of Lake Michigan.
7L.L. Bourgeau-Chavez et al. / Journal of Great Lakes Research xxx (2012) xxx–xxx
spacing, 20 m resolution). The Focal majority tool was used to de-scribe each cell in the final mapped product with the value that occursmost often within a 3×4 cell neighborhood (an approximately 0.2 haarea). Linear features were lost after the 3×4 Focal majority was run
Please cite this article as: Bourgeau-Chavez, L.L., et al., Mapping invasive Phimagery for decision support, J Great Lakes Res (2012), http://dx.doi.org/1
on the map products, so the output product was merged with theoriginal map product to preserve linear features.
Focal majority values were joined with validation GPS points usingthe Extract Values to Points tool from the Spatial Analyst module
ragmites australis in the coastal Great Lakeswith ALOS PALSAR satellite0.1016/j.jglr.2012.11.001
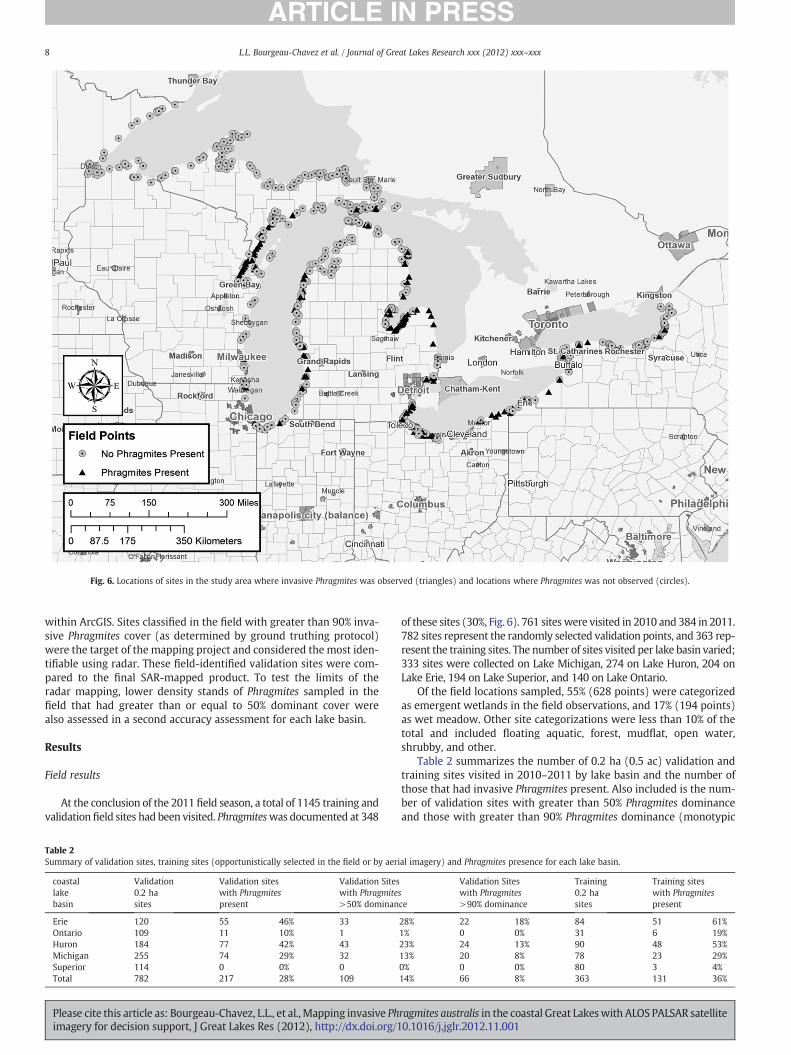
Fig. 6. Locations of sites in the study area where invasive Phragmites was observed (triangles) and locations where Phragmites was not observed (circles).
8 L.L. Bourgeau-Chavez et al. / Journal of Great Lakes Research xxx (2012) xxx–xxx
within ArcGIS. Sites classified in the field with greater than 90% inva-sive Phragmites cover (as determined by ground truthing protocol)were the target of the mapping project and considered the most iden-tifiable using radar. These field-identified validation sites were com-pared to the final SAR-mapped product. To test the limits of theradar mapping, lower density stands of Phragmites sampled in thefield that had greater than or equal to 50% dominant cover werealso assessed in a second accuracy assessment for each lake basin.
Results
Field results
At the conclusion of the 2011 field season, a total of 1145 training andvalidation field sites had been visited. Phragmiteswas documented at 348
Table 2Summary of validation sites, training sites (opportunistically selected in the field or by aeri
coastallakebasin
Validation0.2 hasites
Validation siteswith Phragmitespresent
Validation Siteswith Phragmite>50% dominan
Erie 120 55 46% 33Ontario 109 11 10% 1Huron 184 77 42% 43Michigan 255 74 29% 32Superior 114 0 0% 0Total 782 217 28% 109
Please cite this article as: Bourgeau-Chavez, L.L., et al., Mapping invasive Phimagery for decision support, J Great Lakes Res (2012), http://dx.doi.org/1
of these sites (30%, Fig. 6). 761 sites were visited in 2010 and 384 in 2011.782 sites represent the randomly selected validation points, and 363 rep-resent the training sites. The number of sites visited per lake basin varied;333 sites were collected on Lake Michigan, 274 on Lake Huron, 204 onLake Erie, 194 on Lake Superior, and 140 on Lake Ontario.
Of the field locations sampled, 55% (628 points) were categorizedas emergent wetlands in the field observations, and 17% (194 points)as wet meadow. Other site categorizations were less than 10% of thetotal and included floating aquatic, forest, mudflat, open water,shrubby, and other.
Table 2 summarizes the number of 0.2 ha (0.5 ac) validation andtraining sites visited in 2010–2011 by lake basin and the number ofthose that had invasive Phragmites present. Also included is the num-ber of validation sites with greater than 50% Phragmites dominanceand those with greater than 90% Phragmites dominance (monotypic
al imagery) and Phragmites presence for each lake basin.
sce
Validation Siteswith Phragmites>90% dominance
Training0.2 hasites
Training siteswith Phragmitespresent
28% 22 18% 84 51 61%1% 0 0% 31 6 19%23% 24 13% 90 48 53%13% 20 8% 78 23 29%0% 0 0% 80 3 4%14% 66 8% 363 131 36%
ragmites australis in the coastal Great Lakeswith ALOS PALSAR satellite0.1016/j.jglr.2012.11.001
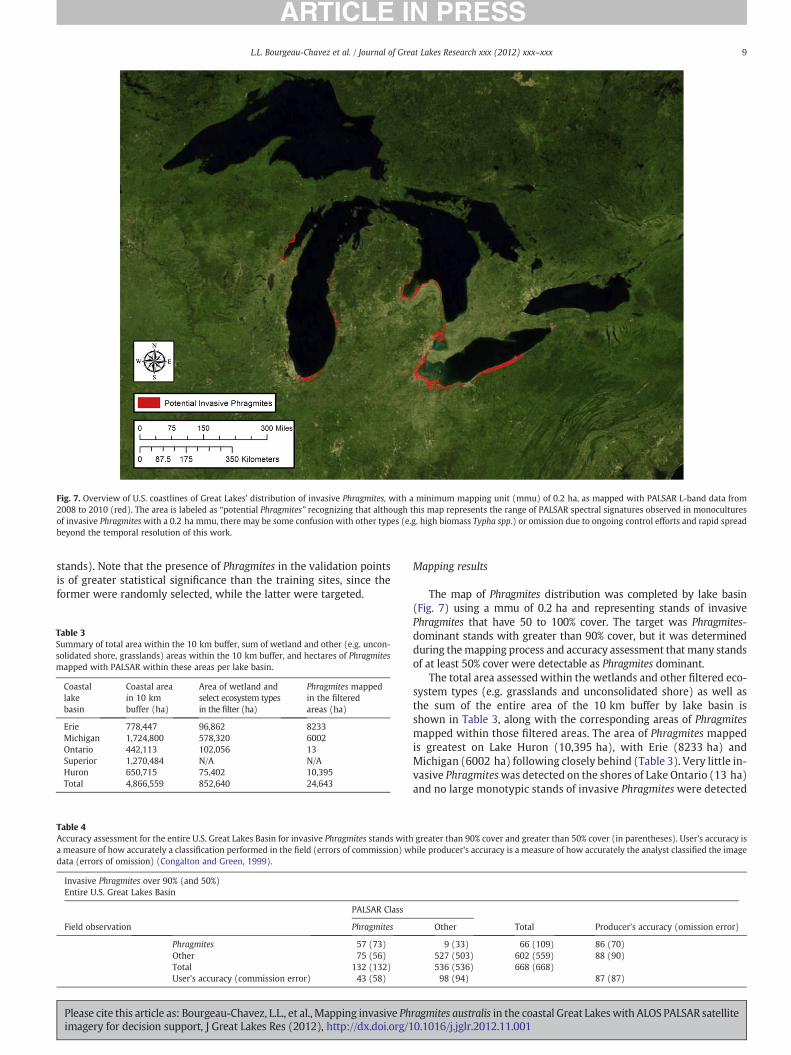
Fig. 7. Overview of U.S. coastlines of Great Lakes’ distribution of invasive Phragmites, with a minimum mapping unit (mmu) of 0.2 ha, as mapped with PALSAR L-band data from2008 to 2010 (red). The area is labeled as “potential Phragmites” recognizing that although this map represents the range of PALSAR spectral signatures observed in monoculturesof invasive Phragmiteswith a 0.2 ha mmu, there may be some confusion with other types (e.g. high biomass Typha spp.) or omission due to ongoing control efforts and rapid spreadbeyond the temporal resolution of this work.
9L.L. Bourgeau-Chavez et al. / Journal of Great Lakes Research xxx (2012) xxx–xxx
stands). Note that the presence of Phragmites in the validation pointsis of greater statistical significance than the training sites, since theformer were randomly selected, while the latter were targeted.
Table 3Summary of total area within the 10 km buffer, sum of wetland and other (e.g. uncon-solidated shore, grasslands) areas within the 10 km buffer, and hectares of Phragmitesmapped with PALSAR within these areas per lake basin.
Coastallakebasin
Coastal areain 10 kmbuffer (ha)
Area of wetland andselect ecosystem typesin the filter (ha)
Phragmites mappedin the filteredareas (ha)
Erie 778,447 96,862 8233Michigan 1,724,800 578,320 6002Ontario 442,113 102,056 13Superior 1,270,484 N/A N/AHuron 650,715 75,402 10,395Total 4,866,559 852,640 24,643
Table 4Accuracy assessment for the entire U.S. Great Lakes Basin for invasive Phragmites stands witha measure of how accurately a classification performed in the field (errors of commission) wdata (errors of omission) (Congalton and Green, 1999).
Invasive Phragmites over 90% (and 50%)Entire U.S. Great Lakes Basin
PALSAR Class
Field observation Phragmites
Phragmites 57 (73)Other 75 (56)Total 132 (132)User's accuracy (commission error) 43 (58)
Please cite this article as: Bourgeau-Chavez, L.L., et al., Mapping invasive Phimagery for decision support, J Great Lakes Res (2012), http://dx.doi.org/1
Mapping results
The map of Phragmites distribution was completed by lake basin(Fig. 7) using a mmu of 0.2 ha and representing stands of invasivePhragmites that have 50 to 100% cover. The target was Phragmites-dominant stands with greater than 90% cover, but it was determinedduring themapping process and accuracy assessment that many standsof at least 50% cover were detectable as Phragmites dominant.
The total area assessed within the wetlands and other filtered eco-system types (e.g. grasslands and unconsolidated shore) as well asthe sum of the entire area of the 10 km buffer by lake basin isshown in Table 3, along with the corresponding areas of Phragmitesmapped within those filtered areas. The area of Phragmites mappedis greatest on Lake Huron (10,395 ha), with Erie (8233 ha) andMichigan (6002 ha) following closely behind (Table 3). Very little in-vasive Phragmiteswas detected on the shores of Lake Ontario (13 ha)and no large monotypic stands of invasive Phragmiteswere detected
greater than 90% cover and greater than 50% cover (in parentheses). User's accuracy ishile producer's accuracy is a measure of how accurately the analyst classified the image
Other Total Producer's accuracy (omission error)
9 (33) 66 (109) 86 (70)527 (503) 602 (559) 88 (90)536 (536) 668 (668)98 (94) 87 (87)
ragmites australis in the coastal Great Lakeswith ALOS PALSAR satellite0.1016/j.jglr.2012.11.001
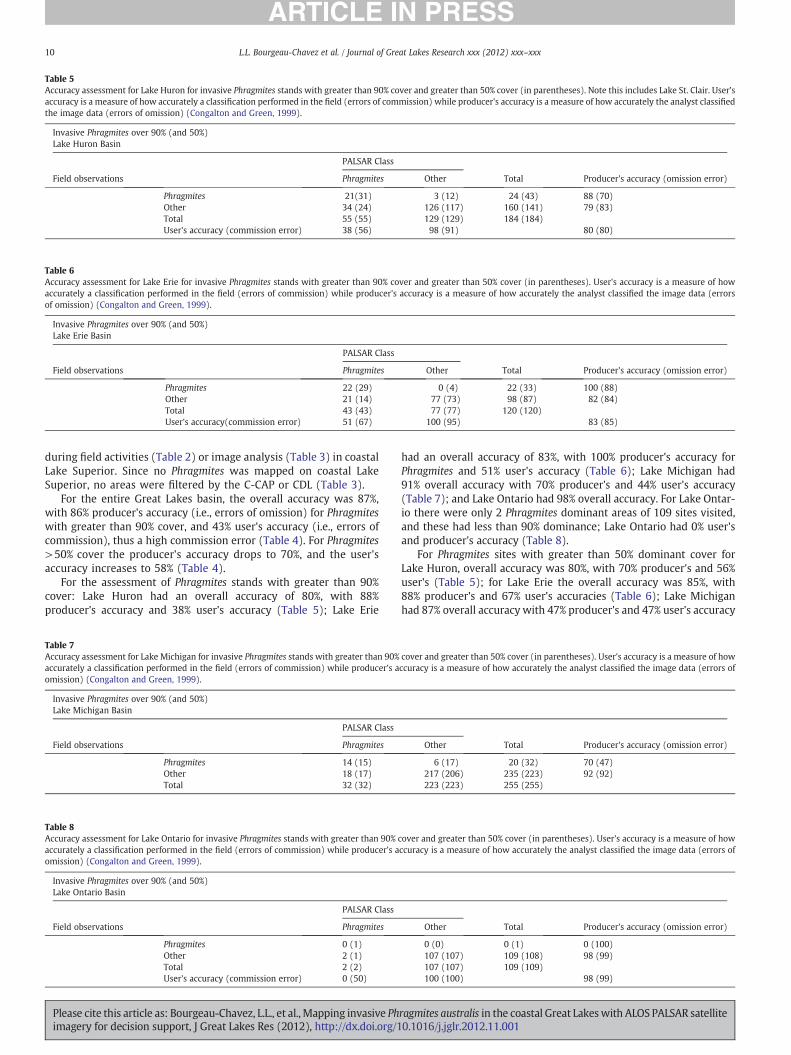
Table 5Accuracy assessment for Lake Huron for invasive Phragmites stands with greater than 90% cover and greater than 50% cover (in parentheses). Note this includes Lake St. Clair. User'saccuracy is a measure of how accurately a classification performed in the field (errors of commission) while producer's accuracy is a measure of how accurately the analyst classifiedthe image data (errors of omission) (Congalton and Green, 1999).
Invasive Phragmites over 90% (and 50%)Lake Huron Basin
PALSAR Class
Field observations Phragmites Other Total Producer's accuracy (omission error)
Phragmites 21(31) 3 (12) 24 (43) 88 (70)Other 34 (24) 126 (117) 160 (141) 79 (83)Total 55 (55) 129 (129) 184 (184)User's accuracy (commission error) 38 (56) 98 (91) 80 (80)
Table 6Accuracy assessment for Lake Erie for invasive Phragmites stands with greater than 90% cover and greater than 50% cover (in parentheses). User's accuracy is a measure of howaccurately a classification performed in the field (errors of commission) while producer's accuracy is a measure of how accurately the analyst classified the image data (errorsof omission) (Congalton and Green, 1999).
Invasive Phragmites over 90% (and 50%)Lake Erie Basin
PALSAR Class
Field observations Phragmites Other Total Producer's accuracy (omission error)
Phragmites 22 (29) 0 (4) 22 (33) 100 (88)Other 21 (14) 77 (73) 98 (87) 82 (84)Total 43 (43) 77 (77) 120 (120)User's accuracy(commission error) 51 (67) 100 (95) 83 (85)
10 L.L. Bourgeau-Chavez et al. / Journal of Great Lakes Research xxx (2012) xxx–xxx
during field activities (Table 2) or image analysis (Table 3) in coastalLake Superior. Since no Phragmites was mapped on coastal LakeSuperior, no areas were filtered by the C-CAP or CDL (Table 3).
For the entire Great Lakes basin, the overall accuracy was 87%,with 86% producer's accuracy (i.e., errors of omission) for Phragmiteswith greater than 90% cover, and 43% user's accuracy (i.e., errors ofcommission), thus a high commission error (Table 4). For Phragmites>50% cover the producer's accuracy drops to 70%, and the user'saccuracy increases to 58% (Table 4).
For the assessment of Phragmites stands with greater than 90%cover: Lake Huron had an overall accuracy of 80%, with 88%producer's accuracy and 38% user's accuracy (Table 5); Lake Erie
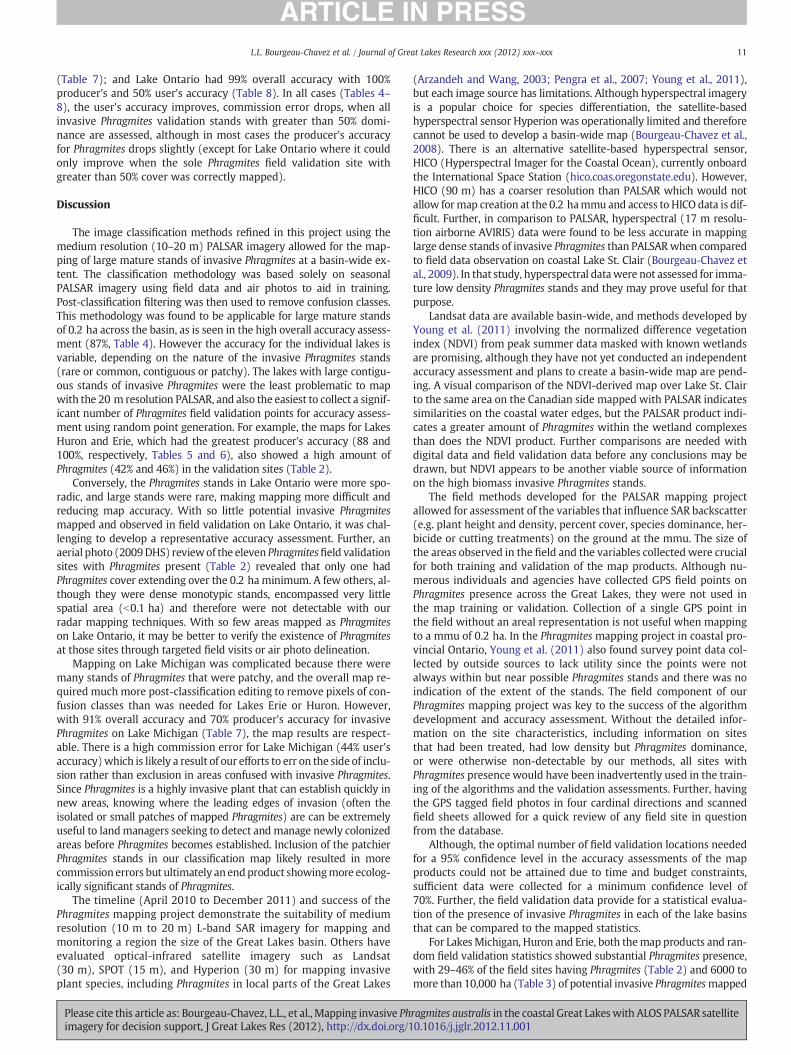
Table 7Accuracy assessment for Lake Michigan for invasive Phragmites stands with greater than 90%accurately a classification performed in the field (errors of commission) while producer's aomission) (Congalton and Green, 1999).
Invasive Phragmites over 90% (and 50%)Lake Michigan Basin
PALSAR Class
Field observations Phragmites
Phragmites 14 (15)Other 18 (17)Total 32 (32)
Table 8Accuracy assessment for Lake Ontario for invasive Phragmites stands with greater than 90%accurately a classification performed in the field (errors of commission) while producer's aomission) (Congalton and Green, 1999).
Invasive Phragmites over 90% (and 50%)Lake Ontario Basin
PALSAR Class
Field observations Phragmites
Phragmites 0 (1)Other 2 (1)Total 2 (2)User's accuracy (commission error) 0 (50)
Please cite this article as: Bourgeau-Chavez, L.L., et al., Mapping invasive Phimagery for decision support, J Great Lakes Res (2012), http://dx.doi.org/1
had an overall accuracy of 83%, with 100% producer's accuracy forPhragmites and 51% user's accuracy (Table 6); Lake Michigan had91% overall accuracy with 70% producer's and 44% user's accuracy(Table 7); and Lake Ontario had 98% overall accuracy. For Lake Ontar-io there were only 2 Phragmites dominant areas of 109 sites visited,and these had less than 90% dominance; Lake Ontario had 0% user'sand producer's accuracy (Table 8).
For Phragmites sites with greater than 50% dominant cover forLake Huron, overall accuracy was 80%, with 70% producer's and 56%user's (Table 5); for Lake Erie the overall accuracy was 85%, with88% producer's and 67% user's accuracies (Table 6); Lake Michiganhad 87% overall accuracy with 47% producer's and 47% user's accuracy
cover and greater than 50% cover (in parentheses). User's accuracy is a measure of howccuracy is a measure of how accurately the analyst classified the image data (errors of
Other Total Producer's accuracy (omission error)
6 (17) 20 (32) 70 (47)217 (206) 235 (223) 92 (92)223 (223) 255 (255)
cover and greater than 50% cover (in parentheses). User's accuracy is a measure of howccuracy is a measure of how accurately the analyst classified the image data (errors of
Other Total Producer's accuracy (omission error)
0 (0) 0 (1) 0 (100)107 (107) 109 (108) 98 (99)107 (107) 109 (109)100 (100) 98 (99)
ragmites australis in the coastal Great Lakeswith ALOS PALSAR satellite0.1016/j.jglr.2012.11.001
11L.L. Bourgeau-Chavez et al. / Journal of Great Lakes Research xxx (2012) xxx–xxx
(Table 7); and Lake Ontario had 99% overall accuracy with 100%producer's and 50% user's accuracy (Table 8). In all cases (Tables 4–8), the user's accuracy improves, commission error drops, when allinvasive Phragmites validation stands with greater than 50% domi-nance are assessed, although in most cases the producer's accuracyfor Phragmites drops slightly (except for Lake Ontario where it couldonly improve when the sole Phragmites field validation site withgreater than 50% cover was correctly mapped).
Discussion
The image classification methods refined in this project using themedium resolution (10–20 m) PALSAR imagery allowed for the map-ping of large mature stands of invasive Phragmites at a basin-wide ex-tent. The classification methodology was based solely on seasonalPALSAR imagery using field data and air photos to aid in training.Post-classification filtering was then used to remove confusion classes.This methodology was found to be applicable for large mature standsof 0.2 ha across the basin, as is seen in the high overall accuracy assess-ment (87%, Table 4). However the accuracy for the individual lakes isvariable, depending on the nature of the invasive Phragmites stands(rare or common, contiguous or patchy). The lakes with large contigu-ous stands of invasive Phragmites were the least problematic to mapwith the 20 m resolution PALSAR, and also the easiest to collect a signif-icant number of Phragmites field validation points for accuracy assess-ment using random point generation. For example, the maps for LakesHuron and Erie, which had the greatest producer's accuracy (88 and100%, respectively, Tables 5 and 6), also showed a high amount ofPhragmites (42% and 46%) in the validation sites (Table 2).
Conversely, the Phragmites stands in Lake Ontario were more spo-radic, and large stands were rare, making mapping more difficult andreducing map accuracy. With so little potential invasive Phragmitesmapped and observed in field validation on Lake Ontario, it was chal-lenging to develop a representative accuracy assessment. Further, anaerial photo (2009DHS) reviewof the eleven Phragmitesfield validationsites with Phragmites present (Table 2) revealed that only one hadPhragmites cover extending over the 0.2 haminimum. A few others, al-though they were dense monotypic stands, encompassed very littlespatial area (b0.1 ha) and therefore were not detectable with ourradar mapping techniques. With so few areas mapped as Phragmiteson Lake Ontario, it may be better to verify the existence of Phragmitesat those sites through targeted field visits or air photo delineation.
Mapping on Lake Michigan was complicated because there weremany stands of Phragmites that were patchy, and the overall map re-quired much more post-classification editing to remove pixels of con-fusion classes than was needed for Lakes Erie or Huron. However,with 91% overall accuracy and 70% producer's accuracy for invasivePhragmites on Lake Michigan (Table 7), the map results are respect-able. There is a high commission error for Lake Michigan (44% user'saccuracy)which is likely a result of our efforts to err on the side of inclu-sion rather than exclusion in areas confused with invasive Phragmites.Since Phragmites is a highly invasive plant that can establish quickly innew areas, knowing where the leading edges of invasion (often theisolated or small patches of mapped Phragmites) are can be extremelyuseful to landmanagers seeking to detect and manage newly colonizedareas before Phragmites becomes established. Inclusion of the patchierPhragmites stands in our classification map likely resulted in morecommission errors but ultimately an endproduct showingmore ecolog-ically significant stands of Phragmites.
The timeline (April 2010 to December 2011) and success of thePhragmites mapping project demonstrate the suitability of mediumresolution (10 m to 20 m) L-band SAR imagery for mapping andmonitoring a region the size of the Great Lakes basin. Others haveevaluated optical-infrared satellite imagery such as Landsat(30 m), SPOT (15 m), and Hyperion (30 m) for mapping invasiveplant species, including Phragmites in local parts of the Great Lakes
Please cite this article as: Bourgeau-Chavez, L.L., et al., Mapping invasive Phimagery for decision support, J Great Lakes Res (2012), http://dx.doi.org/1
(Arzandeh and Wang, 2003; Pengra et al., 2007; Young et al., 2011),but each image source has limitations. Although hyperspectral imageryis a popular choice for species differentiation, the satellite-basedhyperspectral sensor Hyperion was operationally limited and thereforecannot be used to develop a basin-wide map (Bourgeau-Chavez et al.,2008). There is an alternative satellite-based hyperspectral sensor,HICO (Hyperspectral Imager for the Coastal Ocean), currently onboardthe International Space Station (hico.coas.oregonstate.edu). However,HICO (90 m) has a coarser resolution than PALSAR which would notallow formap creation at the 0.2 hammu and access to HICO data is dif-ficult. Further, in comparison to PALSAR, hyperspectral (17 m resolu-tion airborne AVIRIS) data were found to be less accurate in mappinglarge dense stands of invasive Phragmites than PALSARwhen comparedto field data observation on coastal Lake St. Clair (Bourgeau-Chavez etal., 2009). In that study, hyperspectral datawere not assessed for imma-ture low density Phragmites stands and they may prove useful for thatpurpose.
Landsat data are available basin-wide, and methods developed byYoung et al. (2011) involving the normalized difference vegetationindex (NDVI) from peak summer data masked with known wetlandsare promising, although they have not yet conducted an independentaccuracy assessment and plans to create a basin-wide map are pend-ing. A visual comparison of the NDVI-derived map over Lake St. Clairto the same area on the Canadian side mapped with PALSAR indicatessimilarities on the coastal water edges, but the PALSAR product indi-cates a greater amount of Phragmites within the wetland complexesthan does the NDVI product. Further comparisons are needed withdigital data and field validation data before any conclusions may bedrawn, but NDVI appears to be another viable source of informationon the high biomass invasive Phragmites stands.
The field methods developed for the PALSAR mapping projectallowed for assessment of the variables that influence SAR backscatter(e.g. plant height and density, percent cover, species dominance, her-bicide or cutting treatments) on the ground at the mmu. The size ofthe areas observed in the field and the variables collected were crucialfor both training and validation of the map products. Although nu-merous individuals and agencies have collected GPS field points onPhragmites presence across the Great Lakes, they were not used inthe map training or validation. Collection of a single GPS point inthe field without an areal representation is not useful when mappingto a mmu of 0.2 ha. In the Phragmites mapping project in coastal pro-vincial Ontario, Young et al. (2011) also found survey point data col-lected by outside sources to lack utility since the points were notalways within but near possible Phragmites stands and there was noindication of the extent of the stands. The field component of ourPhragmites mapping project was key to the success of the algorithmdevelopment and accuracy assessment. Without the detailed infor-mation on the site characteristics, including information on sitesthat had been treated, had low density but Phragmites dominance,or were otherwise non-detectable by our methods, all sites withPhragmites presence would have been inadvertently used in the train-ing of the algorithms and the validation assessments. Further, havingthe GPS tagged field photos in four cardinal directions and scannedfield sheets allowed for a quick review of any field site in questionfrom the database.
Although, the optimal number of field validation locations neededfor a 95% confidence level in the accuracy assessments of the mapproducts could not be attained due to time and budget constraints,sufficient data were collected for a minimum confidence level of70%. Further, the field validation data provide for a statistical evalua-tion of the presence of invasive Phragmites in each of the lake basinsthat can be compared to the mapped statistics.
For LakesMichigan, Huron and Erie, both themap products and ran-dom field validation statistics showed substantial Phragmites presence,with 29–46% of the field sites having Phragmites (Table 2) and 6000 tomore than 10,000 ha (Table 3) of potential invasive Phragmitesmapped
ragmites australis in the coastal Great Lakeswith ALOS PALSAR satellite0.1016/j.jglr.2012.11.001
12 L.L. Bourgeau-Chavez et al. / Journal of Great Lakes Research xxx (2012) xxx–xxx
on these lakes. The results from the PALSAR mapping and the field val-idation data statistics showed that invasive Phragmites is less extensiveand problematic in the 2008–2010 timeframe on Lakes Ontario and Su-perior than the other Lake basins, with 10% Phragmites presence at therandomly selected (validation) wetlands of Lake Ontario and 0% onLake Superior, and only 13 ha of potential invasive Phragmitesmappedon Lake Ontario and 0 ha mapped on Superior. Three training locationswere observed on Lake Superior with invasive Phragmites presence(Table 2), and a few areas were indicated by outside sources, howeveranalysis of the imagery over these sites, as well as air photo interpreta-tion, indicated the stands were smaller than our mmu of 0.2 ha. Thedifferences observed by lake basin in Phragmites distribution may bedue to environmental drivers (e.g., nutrients or land use) or due to bio-logical mechanisms of invasion (e.g., propagule or seed dispersal). Thisis the subject of ongoing studies that may elucidate areas vulnerable tofuture invasion.
While our methods provided a basin-wide assessment of maturemonotypic stands of invasive Phragmites of 0.2 ha and larger, theycannot be used accurately to evaluate smaller patches (b50% coveror b0.2 ha area) or immature Phragmites stands. These need to beassessed using methods such as those focused on small catchmentswith high-resolution aerial photographs, hyperspectral images, orLiDAR data (e.g. Lopez et al., 2006; Wilcox et al., 2003). Suchhigh-resolution (e.g., 1 m) mapping of the entire 17,549 km GreatLakes coastline would be prohibitive in terms of timeliness and cost.Therefore, proximity to locations near large dense stands and fieldobservation can be used to indicate those critical areas that needhigher resolution focused mapping. Likewise, the maps of invasivePhragmites do not include the native variety, which lacks the biomassand structure of invasive Phragmites stands. While invasive Phragmi-tes usually creates dense monotypic stands of nearly 100% cover, na-tive Phragmites is much sparser and is generally intermixed withother wetland vegetation. Therefore, no confusion has been observednor is expected in the mapping due to the nature of the scattering ofSAR energy from high versus low biomass stands. With further algo-rithm development, mapping of sparse invasive stands or nativePhragmites may be possible with SAR. Nonetheless, the current mapproduct, with its capacity to detect large contiguous patches of Phrag-mites, provides an invaluable source for the decision support toolsbeing developed by USGS, habitat suitability modeling, and otherbasin-wide analysis efforts.
Decisions to accept higher levels of commission error help to ensurethat the mapped extent of potential Phragmites is inclusive of areas ofhighest concern to managers. Knowing the distribution of the maturestands allows resource managers to prioritize control efforts and scien-tists to better understand Phragmites distribution in the Great Lakesbasin. Given the negative impacts Phragmites can have on coastal eco-systems, distribution maps may be especially valuable to those chargedwith conducting and managing the many coastal habitat restorationprojects supported by the congressionally-funded Great Lakes Restora-tion Initiative.
Conclusions
Multi-season and multi-year ALOS PALSAR data, circa 2008–2010,were used to build a high accuracy dataset representing the distribu-tion of large, mature, monotypic Phragmites stands along the U.S.coast of the Great Lakes. As the first of its kind, this highly accuratedata set provides a benchmark that will allow national, regional,and local managers to visualize the extent of Phragmites invasion inthe Great Lakes and strategically plan efforts to manage existingpopulations and minimize new colonization. These data also providethe foundation for ongoing efforts to conduct habitat suitabilitymodeling for Phragmites and assess levels of vulnerability to new in-vasions. Landowners, managers, and decision makers will be able to
Please cite this article as: Bourgeau-Chavez, L.L., et al., Mapping invasive Phimagery for decision support, J Great Lakes Res (2012), http://dx.doi.org/1
access distribution maps and vulnerability assessments throughweb-based decision support tools developed by USGS.
Phragmites treatment and control operations are underway acrossthe Great Lakes region. These efforts, however, are most often smalloperations limited in geographic extent. The Michigan Departmentsof Environmental Quality and Natural Resources, in cooperationwith the Great Lakes Commission, have been hosting stakeholdermeetings to develop a Strategic Framework for the Managementand Control of Invasive Phragmites in Michigan (http://glc.org/ans/initiatives.html#phrag). It is only through coordinated regional andbasin-wide efforts that the ecological, recreational, and economicaleffects of widely distributed invasive species such as Phragmites willbe assessed, the areas vulnerable to future invasion predicted, andcontrol efforts implemented.
The potential invasive Phragmites distribution maps produced bythis project could be used to inform management and policy effortsas well as provide a baseline characterization for monitoring Phragmi-tes distribution over time. Unfortunately, the ALOS PALSAR failed inspring of 2011, but PALSAR-2 is planned for launch in the next coupleof years and may be used to track future vegetation changes. The circa2008–2010 Phragmites distribution maps will be made publicallyavailable for the U.S. portion of the Great Lakes coastline (http://www.glsc.usgs.gov) along with the spatially explicit field data (1145sites) and associated attributes collected as part of this mapping effort(http://mtri.org/Phragmites.html). An online map-based decisionsupport tool will enable the visualization of current Phragmites distri-bution at user-defined scales and display a variety of approaches forassessing vulnerability to future invasions (http://cida.usgs.gov/glri/phragmites/).
Acknowledgments
This project was funded by the U.S. EPA Great Lakes Restoration Ini-tiative. We would like to acknowledge all the field researchers withoutwhose assistance this project could not have been completed: AndrewKriegbaum, Jamey Anderson, Scott Stanton, Ashby Mizell (Gleichman),James Lange, Anthony Landon, Rick Dobson, and Nathaniel Jessee. Wewould also like to acknowledge Michelle Wienert for coordination offield activities including equipment management and travel planningand for creation and maintenance of the project website (http://www.mtri.org/Phragmites.html). For development of the online database,we recognize Tyler Erickson. For provision of additional field datawhich have been used in this project, we acknowledge Michigan Natu-ral Features Inventory. For assistance with review and editing of themanuscript, we thank Anthony Landon and Paul Seelbach. And last-ly, we thank Don Atwood and Rick Guritz of the Alaska Satellite Fa-cility for their diligence in terrain correction and georeferencing ofall of the PALSAR imagery. This publication is contribution 1688 ofthe U.S. Geological Survey Great Lakes Science Center. The findingsand conclusions in this article are those of the authors and do notnecessarily represent the views of the U.S. Fish and WildlifeService.
References
Arzandeh, S., Wang, J., 2003. Monitoring the change of Phragmites distribution usingsatellite data. Can. J. Remote. Sens. 29 (1), 224–235.
Bourgeau-Chavez, L.L., Powell, R.B., 2009. Mapping the invasive Phragmites with ALOSPALSAR radar imagery over the Saint Clair River Delta in the Great Lakes. Societyof Wetland Scientists 2009 Conference, Madison, Wisconsin (June 21-26, 2009).
Bourgeau-Chavez, L.L., Kasischke, E.S., Brunzell, S.M., Mudd, J.P., Smith, K.B., Frick, A.L.,2001. Analysis of spaceborne SAR data for wetland mapping in Virginia riparianecosystems. Int. J. Remote Sens. 22 (18), 3665–3687.
Bourgeau-Chavez, L.L., Riordan, K., Nowels, M., Miller, N., 2004. Final report to the GreatLakes Commission: remotely monitoring Great Lakes coastal wetlands using a hybridradar and multi-spectral sensor approach . (Project no. WETLANDS2-WPA-06:82).
Bourgeau-Chavez, L.L., Smith, K.B., Kasischke, E.S., Brunzell, S.M., Romanowicz, E.A.,Richardson, C.J., 2005. Remote monitoring regional scale inundation patters andhydroperiod in the Greater Everglades Ecosystem. Wetlands 25 (1), 176–191.
ragmites australis in the coastal Great Lakeswith ALOS PALSAR satellite0.1016/j.jglr.2012.11.001
13L.L. Bourgeau-Chavez et al. / Journal of Great Lakes Research xxx (2012) xxx–xxx
Bourgeau-Chavez, L.L., Lopez, A., Trebitz, A., Hollenhorst, T., Host, G.E., Huberty, B.,Gauthier, R.L., Hummer, J., 2008. Chapter 8, Landscape-based indicators in GreatLakes coastal wetlands monitoring plan: Great Lakes Coastal Wetlands Consor-tium. Project of the Great Lakes Commission, funded by the U.S. EPA GLNPO,March 2008 , pp. 143–171.
Bourgeau-Chavez, L.L., Riordan, K., Powell, R.B., Miller, N., Nowels, M., 2009. Improvingwetland characterization withmulti-sensor, multi-temporal SAR and optical/infrareddata fusion. In: Jedlovec, Gary (Ed.), Advances in Geoscience and Remote Sensing.InTech Publishers, India, pp. 679–708.
Congalton, R.G., Green, K., 1999. Assessing theAccuracy of Remotely SensedData: Principlesand Practices. Lewis Publications, Boca Raton, Florida, p. 137.
Derr, J.F., 2008a. Common reed (Phragmites australis) response to mowing and herbicideapplication. Inv. Plant Sci. Manage. 1, 12–16.
Derr, J.F., 2008b. Common reed (Phragmites australis) response to postemergenceherbicides. Inv. Plant Sci. Manage. 1, 153–157.
ERDAS, 2010. ERDAS Field Guide, June 2010 edition. ERDAS Inc., Norcross, Georgia,p. 842.
Findlay, S.E.G., Dye, S., Keuhn, K.A., 2002. Microbial growth and nitrogen retention inlitter of Phragmites australis compared to Typha angustifolia. Wetlands 22 (3),616–625.
FWS, 2011. http://www.fws.gov/midwest/greatlakes/endangeredsp.htm.Hess, L., Melack, J., Filoso, S., Wang, Y., 1995. Delineation of inundated areas and vege-
tation along the Amazon floodplain with the SIR-C synthetic aperture radar. IEEETrans. Geosci. Remote. Sens. 22 (4), 896–904.
hico.coas.oregonstate.edu (accessed on March 3, 2012).Lang, M.W., Townsend, P.A., Kasischke, E.S., 2008. Influence of incidence angle on
detecting flooded forests using C-HH synthetic aperture radar data. Remote.Sens. Environ. 112 (10), 3898–3907.
Lillesand, T., Kiefer, R.W., Chipman, J., 2007. Remote Sensing and Image Interpretation,sixth ed. Wiley and Sons, p. 804.
Lopez, R.D., Heggem, D.T., Sutton, D., Ehli, T., Van Remortel, R., Evanson, E., Bice, L.,2006. Using landscape metrics to develop indicators of Great Lakes coastal wetlandcondition. U.S. EPA Report EOA/600/X-06/002, p. 77.
Please cite this article as: Bourgeau-Chavez, L.L., et al., Mapping invasive Phimagery for decision support, J Great Lakes Res (2012), http://dx.doi.org/1
MDEQ, 2011. http://www.michigan.gov/deq/0,4561,7-135-3313_3677_8314-178183–,00.html (accessed on March 3, 2012).
Meyerson, L.A., Saltonstall, K., Windham, L., Kiviat, E., Findlay, S., 2000. A comparison ofPhragmites australis in freshwater and brackish marsh environments in NorthAmerica. Wetl. Ecol. Manag. 8, 89–103.
Pengra, B., Johnston, C., Loveland, T., 2007. Mapping an invasive plant, Phragmites australis,in coastal wetlands using the EO-1 Hyperion hyperspectral sensor. Remote Sens.Environ. 108, 74–81.
Plant Community Alliance, 2005. Fact Sheet: Giant Reed. Plant Conservation Alliance AlienPlant Working Group. U.S. Bureau of Land Management, Washington, D.C., p. 2(http://www.nps.gov/plants/alien/fact/phau1.htm, Accessed September 20, 2010).
Rosenqvist, A., Shimada, M., Ito, N., Watanabe, M., 2007. ALOS PALSAR: a pathfinder mis-sion for global-scalemonitoring of the environment. IEEE Trans. Geosci. Remote. Sens.45 (11), 3307–3316.
Ross, S.M., 1987. Introduction to Probability and Statistics for Engineers and Scientists.John Wiley, New York.
Shimada, M., Rosenqvist, A., Watanabe, M., Tadono, T., 2005. The polarmetric and inter-ferometric potential of ALOS PALSAR. Proceedings of the POLinSAR 2005Workshop,17 – 21 January 2005, ESRIN, Frascati, Italy.
Shimada, M., Isoguchi, O., Tadono, T., Higuchi, R., Isono, K., 2007. PALSAR CALVAL sum-mary (JAXA-PI193). Earth Observation Research and application Center (EORC).Japan Aerospace and Exploration Agency, (JAXA), Sengen 2-1-1, Tsukuba, Ibaraki,Japan.
Tulbure, M.G., Johnston, C.A., Auger, D., 2007. Rapid invasion of a Great Lakes coastalwetland by non-native Phragmites australis and Typha. J. Great Lakes Res. 33 (3),269–279.
Wilcox, K.L., Petrie, S.A., Maynard, L.A., Meyer, S.W., 2003. Historical distribution andabundance of Phragmites australis at Long Point, Lake Erie, Ontario. J. Great LakesRes. 29 (4), 664–680.
Young, B.E., Young, G., Hogg, A.R., 2011. Using Landsat TM NDVI change detection toidentify Phragmites infestation in southern Ontario coastal wetlands., InventoryMonitoring and Assessment, Ont. Min. Nat. Resources, Peterborough, ON. Unpubl.Report, pp. 32.
ragmites australis in the coastal Great Lakeswith ALOS PALSAR satellite0.1016/j.jglr.2012.11.001