Embed Size (px)
Citation preview
Journal of Hydrology xxx (2011) xxx–xxx
Contents lists available at ScienceDirect
Journal of Hydrology
journal homepage: www.elsevier .com/ locate / jhydrol
A survey of groundwater levels and hydrogeochemistry in irrigated fieldsin the Karamay Agricultural Development Area, northwest China: Implications forsoil and groundwater salinity resulting from surface water transfer for irrigation
Dongmei Han a, Xianfang Song a,⇑, Matthew J. Currell b, Guoliang Cao c, Yinghua Zhang a, Yuehu Kang a
a Key Laboratory of Water Cycle & Related Land Surface Processes, Institute of Geographic Sciences and Natural Resources Research, Chinese Academy of Sciences,Beijing 100101, Chinab School of Civil, Environmental and Chemical Engineering, RMIT University, Melbourne 3001, Australiac Department of Geological Sciences, University of Alabama, Tuscaloosa, AL 35487, USA
a r t i c l e i n f o s u m m a r y
Article history:Received 24 November 2010Received in revised form 8 February 2011Accepted 12 March 2011Available online xxxxThis manuscript was handled by L. Charlet,Editor-in-Chief, with the assistance of P.J.Depetris, Associate Editor
Keywords:Arid regionGroundwater storageIrrigationHydrochemistryStable isotope
0022-1694/$ - see front matter � 2011 Elsevier B.V. Adoi:10.1016/j.jhydrol.2011.03.052
⇑ Corresponding author. Present address: Jia11#,trict,100101 Beijing, PR China. Tel./fax: +86 10 64889
E-mail address: [email protected] (X. Song).
Please cite this article in press as: Han, D., et aDevelopment Area, northwest China: Implicat(2011), doi:10.1016/j.jhydrol.2011.03.052
Analysis of the water budget, along with hydrochemistry and stable isotopes in shallow groundwaterwere carried out in the Karamay Agricultural Development Area (KADA) in order to assess the impactof transfer of irrigation water from the IrtySh River, in particular in relation to the mechanisms of salini-zation and the nature of the water table regime. In terms of aquifer dynamics, the addition of the irriga-tion water without any groundwater abstraction has caused a sharp rise in the water table is and thedevelopment of serious soil salinity, together with an almost complete attenuation of inter-seasonalwater table oscillations. The mean rise in the groundwater table from September 1997 to October2009 was 6.9 m, representing an accumulated total water storage change of close to 150 million cubicmeters. The analysis of aquifer water budget shows that infiltration of irrigation water occupied over90% of the total recharge of the groundwater in the KADA. Sources of groundwater recharge and mech-anisms of salinization in the KADA were also investigated using geochemical and isotopic techniques. Thegroundwater is characterized by Cl(SO4)–Na type, generally becoming more Na and Cl dominated withincreasing salinity. The total dissolved solids (TDS) content of the groundwater ranges from 0.5 g/L toover 65 g/L, with greater TDS values in areas of low topographic relief and shallow water tables. Wherethe sediments are more permeable (e.g. due to the presence of palaeochannels), TDS values are generallylower and the seasonal water table fluctuations greater. The ratios of K/Cl, Ca/Cl, Na/Cl, and Mg/Cldecrease with increasing Cl� concentrations especially in the shallow groundwater from 10 to 15 mdepth, indicating hydrogeochemical evolution via minor water-rock interaction (feldspar weathering)and significant evaporation. The stable isotopic compositions show a characteristic evaporation effectin the shallow groundwater and confirm that direct infiltration of precipitation is generally not a volu-metrically important source of recharge to the shallow aquifer. Preferential recharge of river water afterirrigation events and/or precipitation from rare heavy rain events is likely responsible for the depletedd2H and d18O values in some of the groundwater samples. The negative relationship between deuteriumexcess and d18O values indicates that even in groundwater with relatively depleted d2H and d18O values,evaporation has occurred to a significant degree. Careful management of water quantity and quality andimplementation of salinity management strategies are considered necessary in order to reduce the risk offurther salt accumulation and damage to farming and local ecosystems.
� 2011 Elsevier B.V. All rights reserved.
1. Introduction
Water scarcity is most acute in arid and semiarid regions, whichcover almost one third of the Earth’s land surface (Froehlich andYurtsever, 1995). Due to water shortage, the extreme climate andvulnerable eco-environments in arid regions, particularly in the
ll rights reserved.
Datun Road, Chaoyang Dis-849.
l. A survey of groundwater levions for soil and groundwater
northwest of China, certain eco-environmental problems, causedby the exploitation and utilization of water resources (e.g., salinesoils, rising groundwater levels, water quality problems) have be-come ubiquitous and continue to be an important topic of world-wide study.
The Kalamay agricultural development area (KADA) is locatedon a 194.3 km2 alluvial plain situated in the northwest margin ofthe Junggar Basin, Xinjiang province and is one of the most arid re-gions in the northwest of China. It is characterized by low precip-itation, high evapotranspiration and strong winds. The area is
els and hydrogeochemistry in irrigated fields in the Karamay Agriculturalsalinity resulting from surface water transfer for irrigation. J. Hydrol.
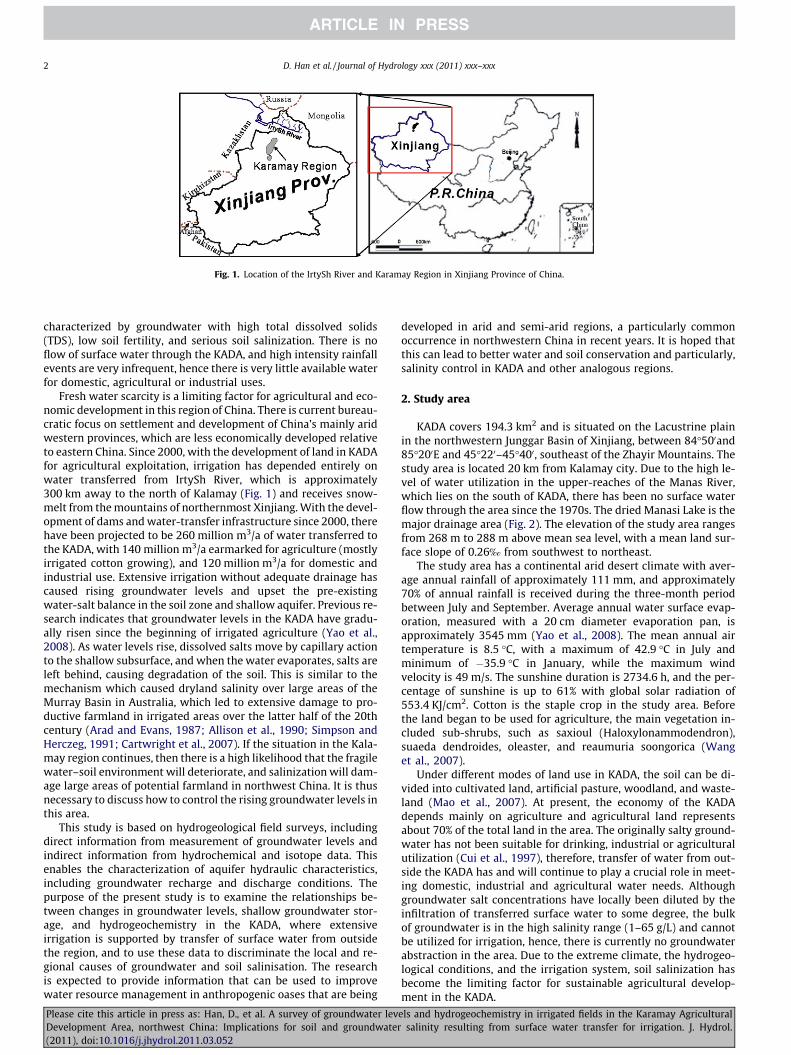
Fig. 1. Location of the IrtySh River and Karamay Region in Xinjiang Province of China.
2 D. Han et al. / Journal of Hydrology xxx (2011) xxx–xxx
characterized by groundwater with high total dissolved solids(TDS), low soil fertility, and serious soil salinization. There is noflow of surface water through the KADA, and high intensity rainfallevents are very infrequent, hence there is very little available waterfor domestic, agricultural or industrial uses.
Fresh water scarcity is a limiting factor for agricultural and eco-nomic development in this region of China. There is current bureau-cratic focus on settlement and development of China’s mainly aridwestern provinces, which are less economically developed relativeto eastern China. Since 2000, with the development of land in KADAfor agricultural exploitation, irrigation has depended entirely onwater transferred from IrtySh River, which is approximately300 km away to the north of Kalamay (Fig. 1) and receives snow-melt from the mountains of northernmost Xinjiang. With the devel-opment of dams and water-transfer infrastructure since 2000, therehave been projected to be 260 million m3/a of water transferred tothe KADA, with 140 million m3/a earmarked for agriculture (mostlyirrigated cotton growing), and 120 million m3/a for domestic andindustrial use. Extensive irrigation without adequate drainage hascaused rising groundwater levels and upset the pre-existingwater-salt balance in the soil zone and shallow aquifer. Previous re-search indicates that groundwater levels in the KADA have gradu-ally risen since the beginning of irrigated agriculture (Yao et al.,2008). As water levels rise, dissolved salts move by capillary actionto the shallow subsurface, and when the water evaporates, salts areleft behind, causing degradation of the soil. This is similar to themechanism which caused dryland salinity over large areas of theMurray Basin in Australia, which led to extensive damage to pro-ductive farmland in irrigated areas over the latter half of the 20thcentury (Arad and Evans, 1987; Allison et al., 1990; Simpson andHerczeg, 1991; Cartwright et al., 2007). If the situation in the Kala-may region continues, then there is a high likelihood that the fragilewater–soil environment will deteriorate, and salinization will dam-age large areas of potential farmland in northwest China. It is thusnecessary to discuss how to control the rising groundwater levels inthis area.
This study is based on hydrogeological field surveys, includingdirect information from measurement of groundwater levels andindirect information from hydrochemical and isotope data. Thisenables the characterization of aquifer hydraulic characteristics,including groundwater recharge and discharge conditions. Thepurpose of the present study is to examine the relationships be-tween changes in groundwater levels, shallow groundwater stor-age, and hydrogeochemistry in the KADA, where extensiveirrigation is supported by transfer of surface water from outsidethe region, and to use these data to discriminate the local and re-gional causes of groundwater and soil salinisation. The researchis expected to provide information that can be used to improvewater resource management in anthropogenic oases that are being
Please cite this article in press as: Han, D., et al. A survey of groundwater levDevelopment Area, northwest China: Implications for soil and groundwater(2011), doi:10.1016/j.jhydrol.2011.03.052
developed in arid and semi-arid regions, a particularly commonoccurrence in northwestern China in recent years. It is hoped thatthis can lead to better water and soil conservation and particularly,salinity control in KADA and other analogous regions.
2. Study area
KADA covers 194.3 km2 and is situated on the Lacustrine plainin the northwestern Junggar Basin of Xinjiang, between 84�500and85�200E and 45�220–45�400, southeast of the Zhayir Mountains. Thestudy area is located 20 km from Kalamay city. Due to the high le-vel of water utilization in the upper-reaches of the Manas River,which lies on the south of KADA, there has been no surface waterflow through the area since the 1970s. The dried Manasi Lake is themajor drainage area (Fig. 2). The elevation of the study area rangesfrom 268 m to 288 m above mean sea level, with a mean land sur-face slope of 0.26‰ from southwest to northeast.
The study area has a continental arid desert climate with aver-age annual rainfall of approximately 111 mm, and approximately70% of annual rainfall is received during the three-month periodbetween July and September. Average annual water surface evap-oration, measured with a 20 cm diameter evaporation pan, isapproximately 3545 mm (Yao et al., 2008). The mean annual airtemperature is 8.5 �C, with a maximum of 42.9 �C in July andminimum of �35.9 �C in January, while the maximum windvelocity is 49 m/s. The sunshine duration is 2734.6 h, and the per-centage of sunshine is up to 61% with global solar radiation of553.4 KJ/cm2. Cotton is the staple crop in the study area. Beforethe land began to be used for agriculture, the main vegetation in-cluded sub-shrubs, such as saxioul (Haloxylonammodendron),suaeda dendroides, oleaster, and reaumuria soongorica (Wanget al., 2007).
Under different modes of land use in KADA, the soil can be di-vided into cultivated land, artificial pasture, woodland, and waste-land (Mao et al., 2007). At present, the economy of the KADAdepends mainly on agriculture and agricultural land representsabout 70% of the total land in the area. The originally salty ground-water has not been suitable for drinking, industrial or agriculturalutilization (Cui et al., 1997), therefore, transfer of water from out-side the KADA has and will continue to play a crucial role in meet-ing domestic, industrial and agricultural water needs. Althoughgroundwater salt concentrations have locally been diluted by theinfiltration of transferred surface water to some degree, the bulkof groundwater is in the high salinity range (1–65 g/L) and cannotbe utilized for irrigation, hence, there is currently no groundwaterabstraction in the area. Due to the extreme climate, the hydrogeo-logical conditions, and the irrigation system, soil salinization hasbecome the limiting factor for sustainable agricultural develop-ment in the KADA.
els and hydrogeochemistry in irrigated fields in the Karamay Agriculturalsalinity resulting from surface water transfer for irrigation. J. Hydrol.
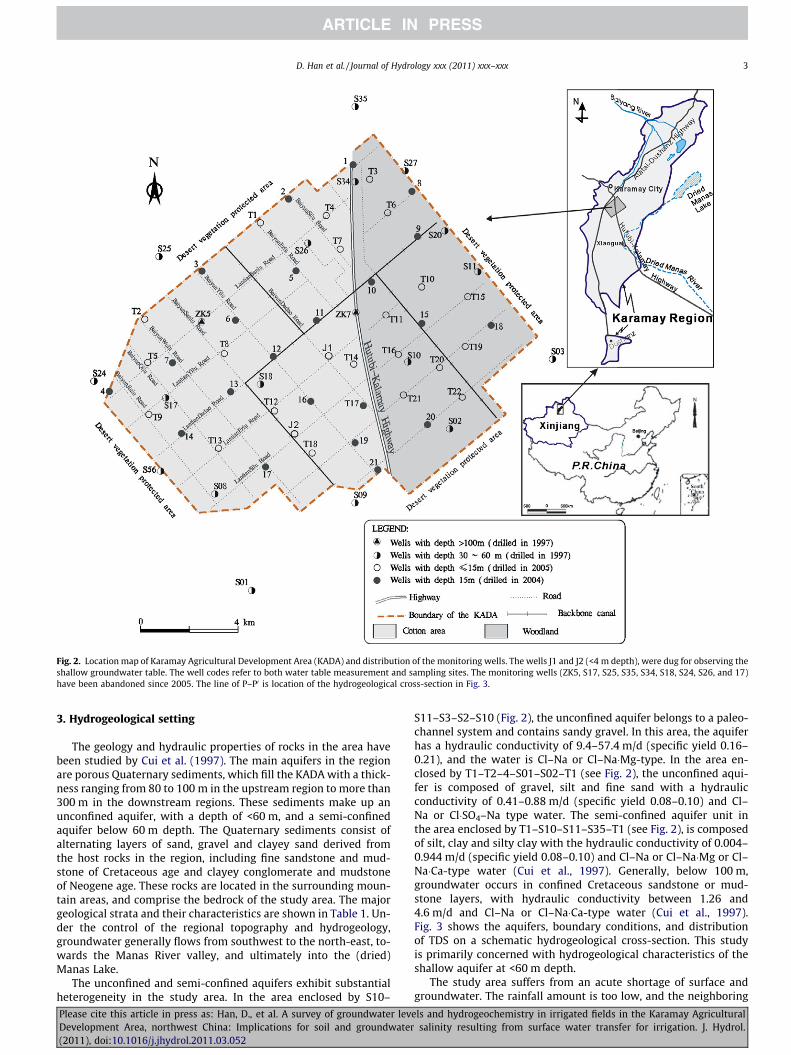
Fig. 2. Location map of Karamay Agricultural Development Area (KADA) and distribution of the monitoring wells. The wells J1 and J2 (<4 m depth), were dug for observing theshallow groundwater table. The well codes refer to both water table measurement and sampling sites. The monitoring wells (ZK5, S17, S25, S35, S34, S18, S24, S26, and 17)have been abandoned since 2005. The line of P–P0 is location of the hydrogeological cross-section in Fig. 3.
D. Han et al. / Journal of Hydrology xxx (2011) xxx–xxx 3
3. Hydrogeological setting
The geology and hydraulic properties of rocks in the area havebeen studied by Cui et al. (1997). The main aquifers in the regionare porous Quaternary sediments, which fill the KADA with a thick-ness ranging from 80 to 100 m in the upstream region to more than300 m in the downstream regions. These sediments make up anunconfined aquifer, with a depth of <60 m, and a semi-confinedaquifer below 60 m depth. The Quaternary sediments consist ofalternating layers of sand, gravel and clayey sand derived fromthe host rocks in the region, including fine sandstone and mud-stone of Cretaceous age and clayey conglomerate and mudstoneof Neogene age. These rocks are located in the surrounding moun-tain areas, and comprise the bedrock of the study area. The majorgeological strata and their characteristics are shown in Table 1. Un-der the control of the regional topography and hydrogeology,groundwater generally flows from southwest to the north-east, to-wards the Manas River valley, and ultimately into the (dried)Manas Lake.
The unconfined and semi-confined aquifers exhibit substantialheterogeneity in the study area. In the area enclosed by S10–
Please cite this article in press as: Han, D., et al. A survey of groundwater levDevelopment Area, northwest China: Implications for soil and groundwater(2011), doi:10.1016/j.jhydrol.2011.03.052
S11–S3–S2–S10 (Fig. 2), the unconfined aquifer belongs to a paleo-channel system and contains sandy gravel. In this area, the aquiferhas a hydraulic conductivity of 9.4–57.4 m/d (specific yield 0.16–0.21), and the water is Cl–Na or Cl–Na�Mg-type. In the area en-closed by T1–T2–4–S01–S02–T1 (see Fig. 2), the unconfined aqui-fer is composed of gravel, silt and fine sand with a hydraulicconductivity of 0.41–0.88 m/d (specific yield 0.08–0.10) and Cl–Na or Cl�SO4–Na type water. The semi-confined aquifer unit inthe area enclosed by T1–S10–S11–S35–T1 (see Fig. 2), is composedof silt, clay and silty clay with the hydraulic conductivity of 0.004–0.944 m/d (specific yield 0.08–0.10) and Cl–Na or Cl–Na�Mg or Cl–Na�Ca-type water (Cui et al., 1997). Generally, below 100 m,groundwater occurs in confined Cretaceous sandstone or mud-stone layers, with hydraulic conductivity between 1.26 and4.6 m/d and Cl–Na or Cl–Na�Ca-type water (Cui et al., 1997).Fig. 3 shows the aquifers, boundary conditions, and distributionof TDS on a schematic hydrogeological cross-section. This studyis primarily concerned with hydrogeological characteristics of theshallow aquifer at <60 m depth.
The study area suffers from an acute shortage of surface andgroundwater. The rainfall amount is too low, and the neighboring
els and hydrogeochemistry in irrigated fields in the Karamay Agriculturalsalinity resulting from surface water transfer for irrigation. J. Hydrol.
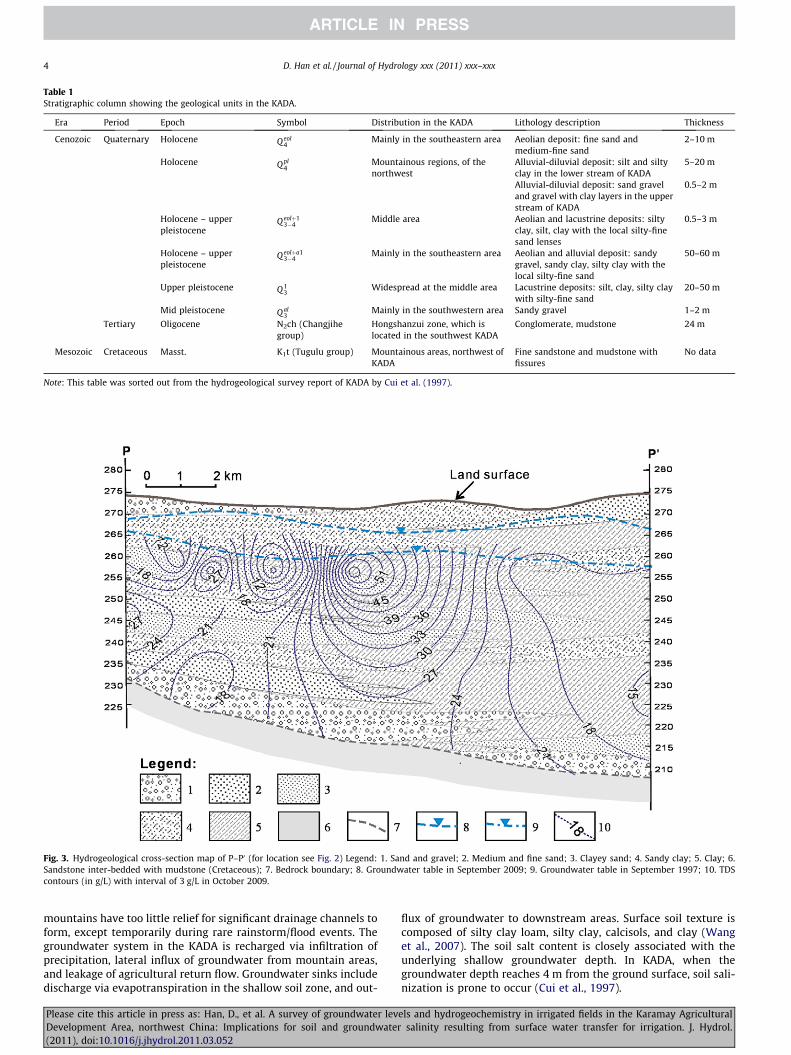
Table 1Stratigraphic column showing the geological units in the KADA.
Era Period Epoch Symbol Distribution in the KADA Lithology description Thickness
Cenozoic Quaternary Holocene Qeol4
Mainly in the southeastern area Aeolian deposit: fine sand andmedium-fine sand
2–10 m
Holocene Qpl4
Mountainous regions, of thenorthwest
Alluvial-diluvial deposit: silt and siltyclay in the lower stream of KADA
5–20 m
Alluvial-diluvial deposit: sand graveland gravel with clay layers in the upperstream of KADA
0.5–2 m
Holocene – upperpleistocene
Qeolþ13�4
Middle area Aeolian and lacustrine deposits: siltyclay, silt, clay with the local silty-finesand lenses
0.5–3 m
Holocene – upperpleistocene
Qeolþa13�4
Mainly in the southeastern area Aeolian and alluvial deposit: sandygravel, sandy clay, silty clay with thelocal silty-fine sand
50–60 m
Upper pleistocene Q13
Widespread at the middle area Lacustrine deposits: silt, clay, silty claywith silty-fine sand
20–50 m
Mid pleistocene Qal3
Mainly in the southwestern area Sandy gravel 1–2 m
Tertiary Oligocene N2ch (Changjihegroup)
Hongshanzui zone, which islocated in the southwest KADA
Conglomerate, mudstone 24 m
Mesozoic Cretaceous Masst. K1t (Tugulu group) Mountainous areas, northwest ofKADA
Fine sandstone and mudstone withfissures
No data
Note: This table was sorted out from the hydrogeological survey report of KADA by Cui et al. (1997).
Fig. 3. Hydrogeological cross-section map of P–P0 (for location see Fig. 2) Legend: 1. Sand and gravel; 2. Medium and fine sand; 3. Clayey sand; 4. Sandy clay; 5. Clay; 6.Sandstone inter-bedded with mudstone (Cretaceous); 7. Bedrock boundary; 8. Groundwater table in September 2009; 9. Groundwater table in September 1997; 10. TDScontours (in g/L) with interval of 3 g/L in October 2009.
4 D. Han et al. / Journal of Hydrology xxx (2011) xxx–xxx
mountains have too little relief for significant drainage channels toform, except temporarily during rare rainstorm/flood events. Thegroundwater system in the KADA is recharged via infiltration ofprecipitation, lateral influx of groundwater from mountain areas,and leakage of agricultural return flow. Groundwater sinks includedischarge via evapotranspiration in the shallow soil zone, and out-
Please cite this article in press as: Han, D., et al. A survey of groundwater levDevelopment Area, northwest China: Implications for soil and groundwater(2011), doi:10.1016/j.jhydrol.2011.03.052
flux of groundwater to downstream areas. Surface soil texture iscomposed of silty clay loam, silty clay, calcisols, and clay (Wanget al., 2007). The soil salt content is closely associated with theunderlying shallow groundwater depth. In KADA, when thegroundwater depth reaches 4 m from the ground surface, soil sali-nization is prone to occur (Cui et al., 1997).
els and hydrogeochemistry in irrigated fields in the Karamay Agriculturalsalinity resulting from surface water transfer for irrigation. J. Hydrol.
D. Han et al. / Journal of Hydrology xxx (2011) xxx–xxx 5
4. Materials and methods
Groundwater monitoring bores (total 52) were installed by theDepartment of Geological Investigation, Design & Research Insti-tute of Water Conservancy & Hydropower in the Xinjiang UygurAutonomous Region of China. Locations of the 52 wells are shownin Fig. 2. Among these, one deep monitoring well with a depth of100.5 m and eight shallow monitoring wells with depths between40 and 55 m were established in 1997; 21 shallow monitoringwells with depths of 15 m were established in 2004 and 22 shallowmonitoring wells with depths between 10 and 15 m were estab-lished in 2005. Three of these wells are located in the desert, 30on cotton-producing land, and 19 on the woodland (Fig. 2).
The wells have been in use for various groundwater monitoringpurposes in the KADA. Field campaigns were carried out in theKADA for the purpose of investigating groundwater dynamicsand water quality changes under the extensive irrigation regime.Water sampling at different aquifer depths was conducted duringtwo periods from August 2008 to October 2009. Data from 52observation wells has been monitored on a monthly basis by theAgricultural Development office of Kalamay prior to August 2008.Groundwater storage variations were calculated from field mea-surements of groundwater levels in shallow monitoring wellsthroughout the aquifer.
Groundwater sampling in the 52 wells was carried out twice, indifferent seasons (47 samples in August 2008 and 50 samples inOctober 2009, see Table 2). Samples were collected in cleaned100 mL polyethylene bottles, tightly capped and stored at 4 �C un-til analysis. Samples for cation analysis were preserved in acid-washed polyethylene bottles, and acidified to pH < 2 with 6 NHNO3. Conductivity, pH, and temperature were measured using aportable WM-22EP meter in the field. Alkalinity was determinedon filtered samples in the field, by titration with H2SO4 (0.25 N).The anions (Cl�, SO2�
4 and NO�3 ) were analyzed using Ion Chroma-tography (ICS-1500) in the Laboratory of Hydrochemical Composi-tion Analysis, Institute of Geology and Geophysics, ChineseAcademy of Sciences. In the Key Laboratory of Water Cycle & Re-lated Land Surface Processes, Institute of Geographic Sciencesand Natural Resources Research, China Academy of Sciences, theconcentrations of the cations (Na, Mg, Ca and K), together with Band Li were measured using inductively coupled plasma analysis(ICP-OES); and stable isotope ratios (d2H and d18O) were measuredusing a Finnigan MAT253 mass spectrometer after on-line pyroly-sis with a Thermo Finnigan TC/EA. The d2H and d18O values weremeasured relative to international standards that were calibratedusing V-SMOW (Vienna Standard Mean Ocean Water) and reportedin conventional d (‰) notation. The analytical precision is ±2‰ ford2H and ±0.3‰ for d18O. Major ion and stable isotope data are pre-sented in Table 2.
5. Results and discussion
5.1. Groundwater hydraulics and water table fluctuations
Surface water transfer from the IrtySh River commenced in2000 with the beginning of land exploitation. Due to the gentletopography and extensive irrigation without any drainage systems,groundwater levels have subsequently risen substantially. Fig. 4shows the change in the shallow water-table depth distributionand groundwater flow direction from September 1997 to Septem-ber 2009. Prior to land exploitation, in September 1997, the flowdirection was towards the northeast, and the hydraulic gradientof shallow groundwater was 3.1‰ in the upstream area, decreasingin the east of the area to �0.5‰, possibly reflecting an escalation inthe hydraulic conductivity of the aquifer material. It can be seen
Please cite this article in press as: Han, D., et al. A survey of groundwater levDevelopment Area, northwest China: Implications for soil and groundwater(2011), doi:10.1016/j.jhydrol.2011.03.052
from Fig. 4 that water table depths in September 1997 ranged from10 m in the upstream area to 18 m in the downstream area, grad-ually increasing along the groundwater flow path. These depths aregenerally too great for significant direct groundwater evaporationto have occurred in 1997. In 2009, the water table was generallymuch closer to the ground surface (<5 m in most areas) and thegroundwater flow directions were far more complex – includinga number of local groundwater mounds and depressions (note thatthe shallow water table was able to be characterized in muchgreater detail after 2005, with the addition of new shallow moni-toring wells).
According to field measurements that investigated the relation-ship between soil types, soil salts and groundwater table depth,4 m is the critical water table depth at which shallow groundwateris likely to be affected by continuous evaporation, causing precip-itation of salts (Cui et al., 1997). The monitoring data show that thearea of land in the KADA where the water table was within 4 m ofthe ground was 7.4 km2 in August 2005, increasing to 99.9 km2 inAugust 2008, and up to 115.8 km2 in October 2009. By 2009, thearea over which the water table depth was greater than 4 m haddecreased to 78.5 km2 (i.e., it was smaller than the area wherethe water table was within 4 m of the surface). This indicates a ra-pid increase in the area exposed to salinization via direct evapora-tion from the shallow groundwater in the last decade.
Fig. 5 shows the change in water levels over time in some rep-resentative wells from the region. Water table depth in the shallowmonitoring wells (10–15 m depth) ranged between 1.5 and 12.4 min May 2005, and 0.9 and 7.9 m in May 2009. Water table depthmeasured in the wells between 30 and 50 m depth changed from5.8 to 19.8 m in September 1997, to 5.3 to 17.0 m in September2009. The variation in water table depths over this period is hencegreater in the shallow wells (drilled in 2005) than the deeper pre-existing wells, indicating an attenuation of the influence of irriga-tion water at depth, which indicates a degree of semi-confinedbehavior. The response in the deeper wells is however variable,for example, relatively large water level fluctuations are seen inS02 (Fig. 5b), where the aquifer is highly permeable, located in apalaeochannel. The water levels in wells located outside of KADA(e.g. S01, S03 and S09 in Fig. 5b), show minimal variation between1997 and 2009 (Fig. 5b), indicating that the water table is underdynamic equilibrium and is impacted only to a small degree bythe irrigation in the KADA area.
The main growing period for cotton (the staple crop) is fromMay to October, during which most irrigation occurs, with peakvolumes applied during July–August. It can be seen from Fig. 5 thatwater levels oscillate over the course of a year, partly due to theseasonal influence of the irrigation cycle, with water levels increas-ing during and immediately after this period. However, this is notalways the case, and different water levels in different wells appearto rise or fall at different times of the year. This may be due to dif-ferent timing in the application of irrigation water and/or differenttime lags between the irrigation season and the water level rise(e.g. due to differing hydraulic properties across the region). Duringthe irrigation period of 2008 (Fig. 5), the shallow wells (10–15 mdepth) are generally characterized by increasing water tables,while the groundwater level in the 30–60 m depth wells is gener-ally stable, with the exception of well S20 (51 m depth, screened infine sand), which may be directly affected by irrigation leakagefrom the upper aquifer. At the end of the irrigation period, thegroundwater levels tend to drop in many of the 10–15 m depthwells (e.g., well 12, T11, T17, screened in sand and gravel sedi-ments). However, water levels in the 30–60 m depth wells tendto increase from November 2008 to April 2009, indicating a de-layed response to the input of irrigation water occurring at depth.Some of the 10–15 m depth wells (e.g., well 1 & T15), show acontinuing rise in water levels after the irrigation season. Both of
els and hydrogeochemistry in irrigated fields in the Karamay Agriculturalsalinity resulting from surface water transfer for irrigation. J. Hydrol.
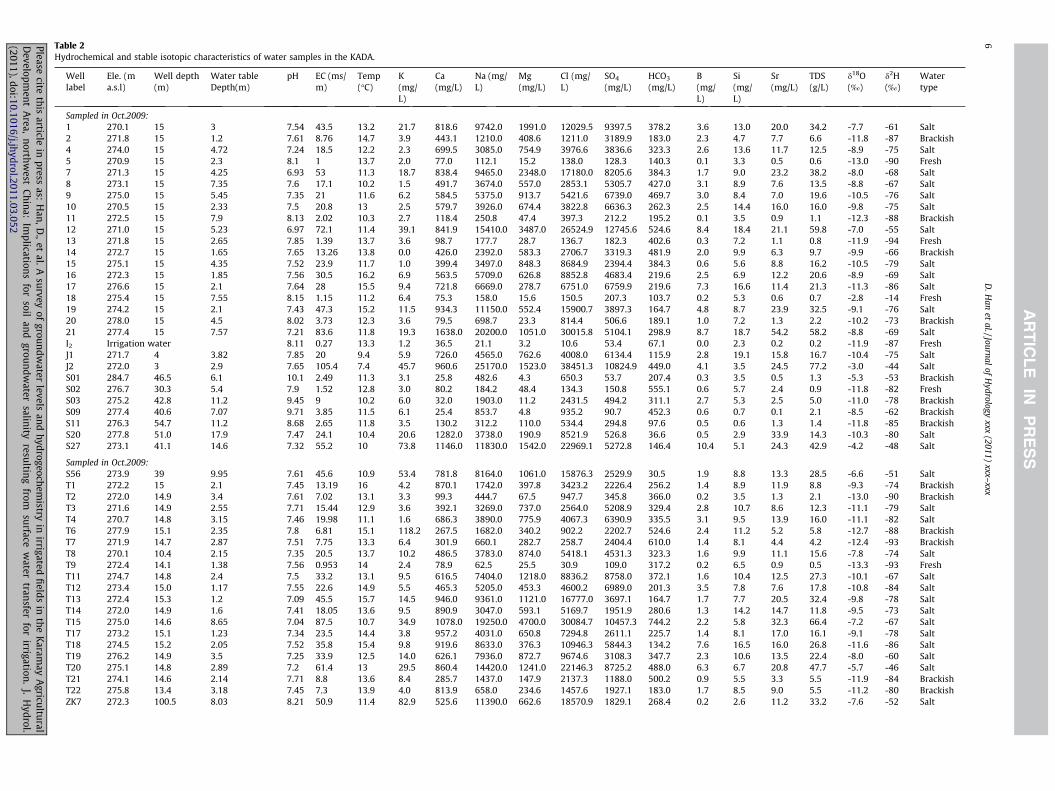
Table 2Hydrochemical and stable isotopic characteristics of water samples in the KADA.
Welllabel
Ele. (ma.s.l)
Well depth(m)
Water tableDepth(m)
pH EC (ms/m)
Temp(�C)
K(mg/L)
Ca(mg/L)
Na (mg/L)
Mg(mg/L)
Cl (mg/L)
SO4
(mg/L)HCO3
(mg/L)B(mg/L)
Sig/
Sr(mg/L)
TDS(g/L)
d18O(‰)
d2H(‰)
Watertype
Sampled in Oct.2009:1 270.1 15 3 7.54 43.5 13.2 21.7 818.6 9742.0 1991.0 12029.5 9397.5 378.2 3.6 .0 20.0 34.2 -7.7 -61 Salt2 271.8 15 1.2 7.61 8.76 14.7 3.9 443.1 1210.0 408.6 1211.0 3189.9 183.0 2.3 7 7.7 6.6 -11.8 -87 Brackish4 274.0 15 4.72 7.24 18.5 12.2 2.3 699.5 3085.0 754.9 3976.6 3836.6 323.3 2.6 .6 11.7 12.5 -8.9 -75 Salt5 270.9 15 2.3 8.1 1 13.7 2.0 77.0 112.1 15.2 138.0 128.3 140.3 0.1 3 0.5 0.6 -13.0 -90 Fresh7 271.3 15 4.25 6.93 53 11.3 18.7 838.4 9465.0 2348.0 17180.0 8205.6 384.3 1.7 0 23.2 38.2 -8.0 -68 Salt8 273.1 15 7.35 7.6 17.1 10.2 1.5 491.7 3674.0 557.0 2853.1 5305.7 427.0 3.1 9 7.6 13.5 -8.8 -67 Salt9 275.0 15 5.45 7.35 21 11.6 6.2 584.5 5375.0 913.7 5421.6 6739.0 469.7 3.0 4 7.0 19.6 -10.5 -76 Salt10 270.5 15 2.33 7.5 20.8 13 2.5 579.7 3926.0 674.4 3822.8 6636.3 262.3 2.5 .4 16.0 16.0 -9.8 -75 Salt11 272.5 15 7.9 8.13 2.02 10.3 2.7 118.4 250.8 47.4 397.3 212.2 195.2 0.1 5 0.9 1.1 -12.3 -88 Brackish12 271.0 15 5.23 6.97 72.1 11.4 39.1 841.9 15410.0 3487.0 26524.9 12745.6 524.6 8.4 .4 21.1 59.8 -7.0 -55 Salt13 271.8 15 2.65 7.85 1.39 13.7 3.6 98.7 177.7 28.7 136.7 182.3 402.6 0.3 2 1.1 0.8 -11.9 -94 Fresh14 272.7 15 1.65 7.65 13.26 13.8 0.0 426.0 2392.0 583.3 2706.7 3319.3 481.9 2.0 9 6.3 9.7 -9.9 -66 Brackish15 275.1 15 4.35 7.52 23.9 11.7 1.0 399.4 3497.0 848.3 8684.9 2394.4 384.3 0.6 6 8.8 16.2 -10.5 -79 Salt16 272.3 15 1.85 7.56 30.5 16.2 6.9 563.5 5709.0 626.8 8852.8 4683.4 219.6 2.5 9 12.2 20.6 -8.9 -69 Salt17 276.6 15 2.1 7.64 28 15.5 9.4 721.8 6669.0 278.7 6751.0 6759.9 219.6 7.3 .6 11.4 21.3 -11.3 -86 Salt18 275.4 15 7.55 8.15 1.15 11.2 6.4 75.3 158.0 15.6 150.5 207.3 103.7 0.2 3 0.6 0.7 -2.8 -14 Fresh19 274.2 15 2.1 7.43 47.3 15.2 11.5 934.3 11150.0 552.4 15900.7 3897.3 164.7 4.8 7 23.9 32.5 -9.1 -76 Salt20 278.0 15 4.5 8.02 3.73 12.3 3.6 79.5 698.7 23.3 814.4 506.6 189.1 1.0 2 1.3 2.2 -10.2 -73 Brackish21 277.4 15 7.57 7.21 83.6 11.8 19.3 1638.0 20200.0 1051.0 30015.8 5104.1 298.9 8.7 .7 54.2 58.2 -8.8 -69 SaltI2 Irrigation water 8.11 0.27 13.3 1.2 36.5 21.1 3.2 10.6 53.4 67.1 0.0 3 0.2 0.2 -11.9 -87 FreshJ1 271.7 4 3.82 7.85 20 9.4 5.9 726.0 4565.0 762.6 4008.0 6134.4 115.9 2.8 .1 15.8 16.7 -10.4 -75 SaltJ2 272.0 3 2.9 7.65 105.4 7.4 45.7 960.6 25170.0 1523.0 38451.3 10824.9 449.0 4.1 5 24.5 77.2 -3.0 -44 SaltS01 284.7 46.5 6.1 10.1 2.49 11.3 3.1 25.8 482.6 4.3 650.3 53.7 207.4 0.3 5 0.5 1.3 -5.3 -53 BrackishS02 276.7 30.3 5.4 7.9 1.52 12.8 3.0 80.2 184.2 48.4 134.3 150.8 555.1 0.6 7 2.4 0.9 -11.8 -82 FreshS03 275.2 42.8 11.2 9.45 9 10.2 6.0 32.0 1903.0 11.2 2431.5 494.2 311.1 2.7 3 2.5 5.0 -11.0 -78 BrackishS09 277.4 40.6 7.07 9.71 3.85 11.5 6.1 25.4 853.7 4.8 935.2 90.7 452.3 0.6 7 0.1 2.1 -8.5 -62 BrackishS11 276.3 54.7 11.2 8.68 2.65 11.8 3.5 130.2 312.2 110.0 534.4 294.8 97.6 0.5 6 1.3 1.4 -11.8 -85 BrackishS20 277.8 51.0 17.9 7.47 24.1 10.4 20.6 1282.0 3738.0 190.9 8521.9 526.8 36.6 0.5 9 33.9 14.3 -10.3 -80 SaltS27 273.1 41.1 14.6 7.32 55.2 10 73.8 1146.0 11830.0 1542.0 22969.1 5272.8 146.4 10.4 1 24.3 42.9 -4.2 -48 Salt
Sampled in Oct.2009:S56 273.9 39 9.95 7.61 45.6 10.9 53.4 781.8 8164.0 1061.0 15876.3 2529.9 30.5 1.9 8 13.3 28.5 -6.6 -51 SaltT1 272.2 15 2.1 7.45 13.19 16 4.2 870.1 1742.0 397.8 3423.2 2226.4 256.2 1.4 9 11.9 8.8 -9.3 -74 BrackishT2 272.0 14.9 3.4 7.61 7.02 13.1 3.3 99.3 444.7 67.5 947.7 345.8 366.0 0.2 5 1.3 2.1 -13.0 -90 BrackishT3 271.6 14.9 2.55 7.71 15.44 12.9 3.6 392.1 3269.0 737.0 2564.0 5208.9 329.4 2.8 .7 8.6 12.3 -11.1 -79 SaltT4 270.7 14.8 3.15 7.46 19.98 11.1 1.6 686.3 3890.0 775.9 4067.3 6390.9 335.5 3.1 5 13.9 16.0 -11.1 -82 SaltT6 277.9 15.1 2.35 7.8 6.81 15.1 118.2 267.5 1682.0 340.2 902.2 2202.7 524.6 2.4 .2 5.2 5.8 -12.7 -88 BrackishT7 271.9 14.7 2.87 7.51 7.75 13.3 6.4 301.9 660.1 282.7 258.7 2404.4 610.0 1.4 1 4.4 4.2 -12.4 -93 BrackishT8 270.1 10.4 2.15 7.35 20.5 13.7 10.2 486.5 3783.0 874.0 5418.1 4531.3 323.3 1.6 9 11.1 15.6 -7.8 -74 SaltT9 272.4 14.1 1.38 7.56 0.953 14 2.4 78.9 62.5 25.5 30.9 109.0 317.2 0.2 5 0.9 0.5 -13.3 -93 FreshT11 274.7 14.8 2.4 7.5 33.2 13.1 9.5 616.5 7404.0 1218.0 8836.2 8758.0 372.1 1.6 .4 12.5 27.3 -10.1 -67 SaltT12 273.4 15.0 1.17 7.55 22.6 14.9 5.5 465.3 5205.0 453.3 4600.2 6989.0 201.3 3.5 8 7.6 17.8 -10.8 -84 SaltT13 272.4 15.3 1.2 7.09 45.5 15.7 14.5 946.0 9361.0 1121.0 16777.0 3697.1 164.7 1.7 7 20.5 32.4 -9.8 -78 SaltT14 272.0 14.9 1.6 7.41 18.05 13.6 9.5 890.9 3047.0 593.1 5169.7 1951.9 280.6 1.3 .2 14.7 11.8 -9.5 -73 SaltT15 275.0 14.6 8.65 7.04 87.5 10.7 34.9 1078.0 19250.0 4700.0 30084.7 10457.3 744.2 2.2 8 32.3 66.4 -7.2 -67 SaltT17 273.2 15.1 1.23 7.34 23.5 14.4 3.8 957.2 4031.0 650.8 7294.8 2611.1 225.7 1.4 1 17.0 16.1 -9.1 -78 SaltT18 274.5 15.2 2.05 7.52 35.8 15.4 9.8 919.6 8633.0 376.3 10946.3 5844.3 134.2 7.6 .5 16.0 26.8 -11.6 -86 SaltT19 276.2 14.9 3.5 7.25 33.9 12.5 14.0 626.1 7936.0 872.7 9674.6 3108.3 347.7 2.3 .6 13.5 22.4 -8.0 -60 SaltT20 275.1 14.8 2.89 7.2 61.4 13 29.5 860.4 14420.0 1241.0 22146.3 8725.2 488.0 6.3 7 20.8 47.7 -5.7 -46 SaltT21 274.1 14.6 2.14 7.71 8.8 13.6 8.4 285.7 1437.0 147.9 2137.3 1188.0 500.2 0.9 5 3.3 5.5 -11.9 -84 BrackishT22 275.8 13.4 3.18 7.45 7.3 13.9 4.0 813.9 658.0 234.6 1457.6 1927.1 183.0 1.7 5 9.0 5.5 -11.2 -80 BrackishZK7 272.3 100.5 8.03 8.21 50.9 11.4 82.9 525.6 11390.0 662.6 18570.9 1829.1 268.4 0.2 6 11.2 33.2 -7.6 -52 Salt
6D
.Han
etal./Journal
ofH
ydrologyxxx
(2011)xxx–
xxx
Pleasecite
thisarticle
inpress
as:H
an,D.,
etal.A
surveyof
groundw
aterlevels
andhydrogeochem
istryin
irrigatedfi
eldsin
theK
aramay
Agricultural
Developm
entA
rea,northw
estChina:
Implications
forsoil
andgroundw
atersalinity
resulting
fromsu
rfacew
atertransfer
forirrigation.
J.H
ydrol.(2011),doi:10.1016/j.jhydrol.2011.03.052
(mL)
134.133.9.8.8.143.187.9.5.6.165.8.7.182.193.3.5.5.0.0.2.5.
8.8.3.109.118.9.6.107.7.145.8.16106.5.8.2.
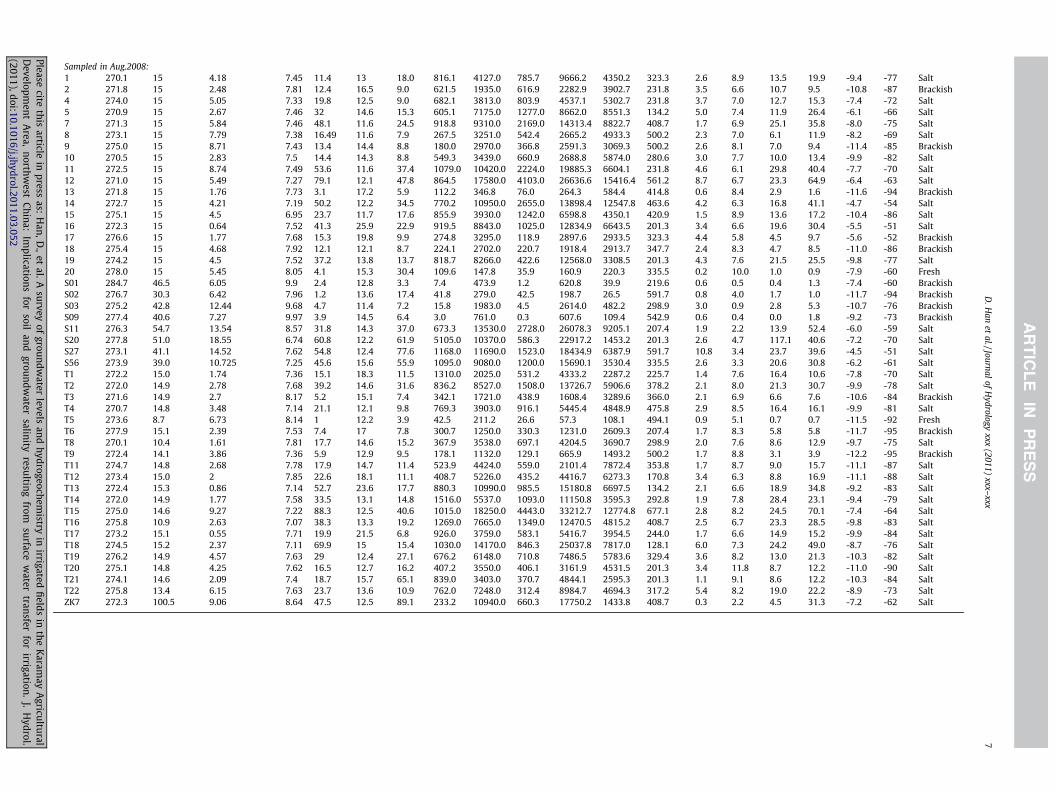
Sampled in Aug.2008:1 270.1 15 4.18 7.45 11.4 13 18.0 816.1 4127.0 785.7 9666.2 4350.2 323.3 2.6 8.9 13.5 19.9 -9.4 -77 Salt2 271.8 15 2.48 7.81 12.4 16.5 9.0 621.5 1935.0 616.9 2282.9 3902.7 231.8 3.5 6.6 10.7 9.5 -10.8 -87 Brackish4 274.0 15 5.05 7.33 19.8 12.5 9.0 682.1 3813.0 803.9 4537.1 5302.7 231.8 3.7 7.0 12.7 15.3 -7.4 -72 Salt5 270.9 15 2.67 7.46 32 14.6 15.3 605.1 7175.0 1277.0 8662.0 8551.3 134.2 5.0 7.4 11.9 26.4 -6.1 -66 Salt7 271.3 15 5.84 7.46 48.1 11.6 24.5 918.8 9310.0 2169.0 14313.4 8822.7 408.7 1.7 6.9 25.1 35.8 -8.0 -75 Salt8 273.1 15 7.79 7.38 16.49 11.6 7.9 267.5 3251.0 542.4 2665.2 4933.3 500.2 2.3 7.0 6.1 11.9 -8.2 -69 Salt9 275.0 15 8.71 7.43 13.4 14.4 8.8 180.0 2970.0 366.8 2591.3 3069.3 500.2 2.6 8.1 7.0 9.4 -11.4 -85 Brackish10 270.5 15 2.83 7.5 14.4 14.3 8.8 549.3 3439.0 660.9 2688.8 5874.0 280.6 3.0 7.7 10.0 13.4 -9.9 -82 Salt11 272.5 15 8.74 7.49 53.6 11.6 37.4 1079.0 10420.0 2224.0 19885.3 6604.1 231.8 4.6 6.1 29.8 40.4 -7.7 -70 Salt12 271.0 15 5.49 7.27 79.1 12.1 47.8 864.5 17580.0 4103.0 26636.6 15416.4 561.2 8.7 6.7 23.3 64.9 -6.4 -63 Salt13 271.8 15 1.76 7.73 3.1 17.2 5.9 112.2 346.8 76.0 264.3 584.4 414.8 0.6 8.4 2.9 1.6 -11.6 -94 Brackish14 272.7 15 4.21 7.19 50.2 12.2 34.5 770.2 10950.0 2655.0 13898.4 12547.8 463.6 4.2 6.3 16.8 41.1 -4.7 -54 Salt15 275.1 15 4.5 6.95 23.7 11.7 17.6 855.9 3930.0 1242.0 6598.8 4350.1 420.9 1.5 8.9 13.6 17.2 -10.4 -86 Salt16 272.3 15 0.64 7.52 41.3 25.9 22.9 919.5 8843.0 1025.0 12834.9 6643.5 201.3 3.4 6.6 19.6 30.4 -5.5 -51 Salt17 276.6 15 1.77 7.68 15.3 19.8 9.9 274.8 3295.0 118.9 2897.6 2933.5 323.3 4.4 5.8 4.5 9.7 -5.6 -52 Brackish18 275.4 15 4.68 7.92 12.1 12.1 8.7 224.1 2702.0 220.7 1918.4 2913.7 347.7 2.4 8.3 4.7 8.5 -11.0 -86 Brackish19 274.2 15 4.5 7.52 37.2 13.8 13.7 818.7 8266.0 422.6 12568.0 3308.5 201.3 4.3 7.6 21.5 25.5 -9.8 -77 Salt20 278.0 15 5.45 8.05 4.1 15.3 30.4 109.6 147.8 35.9 160.9 220.3 335.5 0.2 10.0 1.0 0.9 -7.9 -60 FreshS01 284.7 46.5 6.05 9.9 2.4 12.8 3.3 7.4 473.9 1.2 620.8 39.9 219.6 0.6 0.5 0.4 1.3 -7.4 -60 BrackishS02 276.7 30.3 6.42 7.96 1.2 13.6 17.4 41.8 279.0 42.5 198.7 26.5 591.7 0.8 4.0 1.7 1.0 -11.7 -94 BrackishS03 275.2 42.8 12.44 9.68 4.7 11.4 7.2 15.8 1983.0 4.5 2614.0 482.2 298.9 3.0 0.9 2.8 5.3 -10.7 -76 BrackishS09 277.4 40.6 7.27 9.97 3.9 14.5 6.4 3.0 761.0 0.3 607.6 109.4 542.9 0.6 0.4 0.0 1.8 -9.2 -73 BrackishS11 276.3 54.7 13.54 8.57 31.8 14.3 37.0 673.3 13530.0 2728.0 26078.3 9205.1 207.4 1.9 2.2 13.9 52.4 -6.0 -59 SaltS20 277.8 51.0 18.55 6.74 60.8 12.2 61.9 5105.0 10370.0 586.3 22917.2 1453.2 201.3 2.6 4.7 117.1 40.6 -7.2 -70 SaltS27 273.1 41.1 14.52 7.62 54.8 12.4 77.6 1168.0 11690.0 1523.0 18434.9 6387.9 591.7 10.8 3.4 23.7 39.6 -4.5 -51 SaltS56 273.9 39.0 10.725 7.25 45.6 15.6 55.9 1095.0 9080.0 1200.0 15690.1 3530.4 335.5 2.6 3.3 20.6 30.8 -6.2 -61 SaltT1 272.2 15.0 1.74 7.36 15.1 18.3 11.5 1310.0 2025.0 531.2 4333.2 2287.2 225.7 1.4 7.6 16.4 10.6 -7.8 -70 SaltT2 272.0 14.9 2.78 7.68 39.2 14.6 31.6 836.2 8527.0 1508.0 13726.7 5906.6 378.2 2.1 8.0 21.3 30.7 -9.9 -78 SaltT3 271.6 14.9 2.7 8.17 5.2 15.1 7.4 342.1 1721.0 438.9 1608.4 3289.6 366.0 2.1 6.9 6.6 7.6 -10.6 -84 BrackishT4 270.7 14.8 3.48 7.14 21.1 12.1 9.8 769.3 3903.0 916.1 5445.4 4848.9 475.8 2.9 8.5 16.4 16.1 -9.9 -81 SaltT5 273.6 8.7 6.73 8.14 1 12.2 3.9 42.5 211.2 26.6 57.3 108.1 494.1 0.9 5.1 0.7 0.7 -11.5 -92 FreshT6 277.9 15.1 2.39 7.53 7.4 17 7.8 300.7 1250.0 330.3 1231.0 2609.3 207.4 1.7 8.3 5.8 5.8 -11.7 -95 BrackishT8 270.1 10.4 1.61 7.81 17.7 14.6 15.2 367.9 3538.0 697.1 4204.5 3690.7 298.9 2.0 7.6 8.6 12.9 -9.7 -75 SaltT9 272.4 14.1 3.86 7.36 5.9 12.9 9.5 178.1 1132.0 129.1 665.9 1493.2 500.2 1.7 8.8 3.1 3.9 -12.2 -95 BrackishT11 274.7 14.8 2.68 7.78 17.9 14.7 11.4 523.9 4424.0 559.0 2101.4 7872.4 353.8 1.7 8.7 9.0 15.7 -11.1 -87 SaltT12 273.4 15.0 2 7.85 22.6 18.1 11.1 408.7 5226.0 435.2 4416.7 6273.3 170.8 3.4 6.3 8.8 16.9 -11.1 -88 SaltT13 272.4 15.3 0.86 7.14 52.7 23.6 17.7 880.3 10990.0 985.5 15180.8 6697.5 134.2 2.1 6.6 18.9 34.8 -9.2 -83 SaltT14 272.0 14.9 1.77 7.58 33.5 13.1 14.8 1516.0 5537.0 1093.0 11150.8 3595.3 292.8 1.9 7.8 28.4 23.1 -9.4 -79 SaltT15 275.0 14.6 9.27 7.22 88.3 12.5 40.6 1015.0 18250.0 4443.0 33212.7 12774.8 677.1 2.8 8.2 24.5 70.1 -7.4 -64 SaltT16 275.8 10.9 2.63 7.07 38.3 13.3 19.2 1269.0 7665.0 1349.0 12470.5 4815.2 408.7 2.5 6.7 23.3 28.5 -9.8 -83 SaltT17 273.2 15.1 0.55 7.71 19.9 21.5 6.8 926.0 3759.0 583.1 5416.7 3954.5 244.0 1.7 6.6 14.9 15.2 -9.9 -84 SaltT18 274.5 15.2 2.37 7.11 69.9 15 15.4 1030.0 14170.0 846.3 25037.8 7817.0 128.1 6.0 7.3 24.2 49.0 -8.7 -76 SaltT19 276.2 14.9 4.57 7.63 29 12.4 27.1 676.2 6148.0 710.8 7486.5 5783.6 329.4 3.6 8.2 13.0 21.3 -10.3 -82 SaltT20 275.1 14.8 4.25 7.62 16.5 12.7 16.2 407.2 3550.0 406.1 3161.9 4531.5 201.3 3.4 11.8 8.7 12.2 -11.0 -90 SaltT21 274.1 14.6 2.09 7.4 18.7 15.7 65.1 839.0 3403.0 370.7 4844.1 2595.3 201.3 1.1 9.1 8.6 12.2 -10.3 -84 SaltT22 275.8 13.4 6.15 7.63 23.7 13.6 10.9 762.0 7248.0 312.4 8984.7 4694.3 317.2 5.4 8.2 19.0 22.2 -8.9 -73 SaltZK7 272.3 100.5 9.06 8.64 47.5 12.5 89.1 233.2 10940.0 660.3 17750.2 1433.8 408.7 0.3 2.2 4.5 31.3 -7.2 -62 Salt
D.H
anet
al./Journalof
Hydrology
xxx(2011)
xxx–xxx
7
Pleasecite
thisarticle
inpress
as:H
an,D.,
etal.A
surveyof
groundwater
levelsand
hydrogeochemistry
inirrigated
fields
inthe
Karam
ayA
gricultural
Developm
entA
rea,northw
estChina:
Implications
forsoil
andgroundw
atersalinity
resulting
fromsu
rfacew
atertransfer
forirrigation.
J.H
ydrol.(2011),doi:10.1016/j.jhydrol.2011.03.052
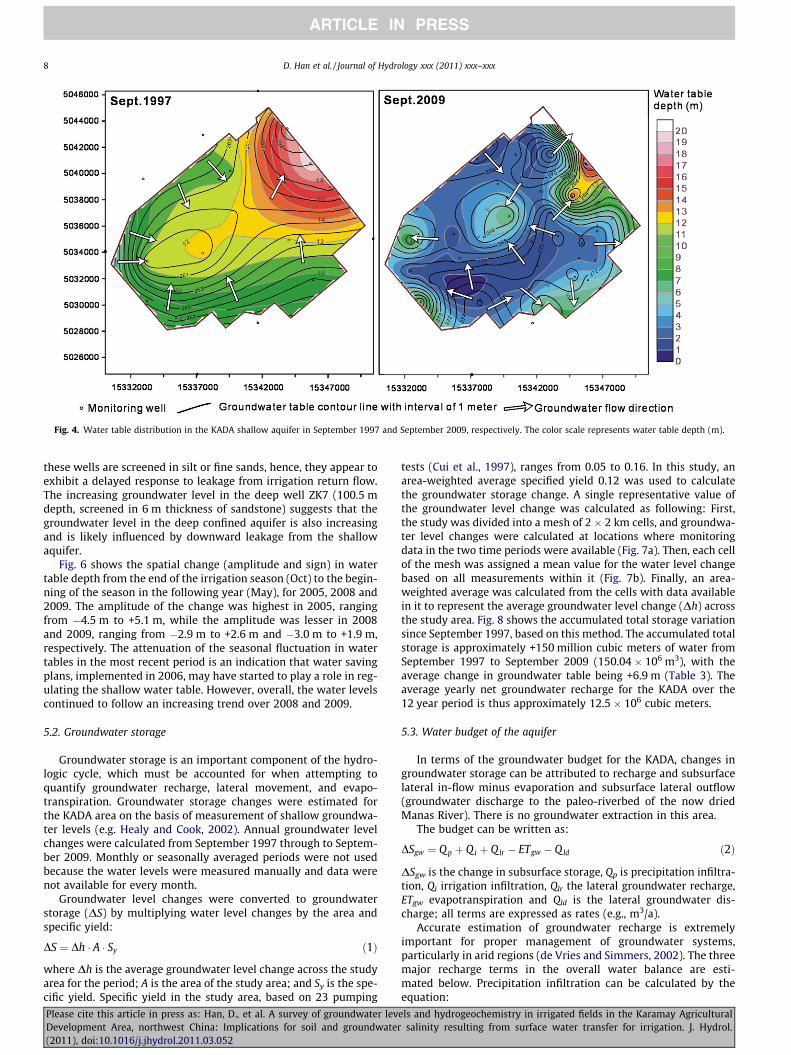
Fig. 4. Water table distribution in the KADA shallow aquifer in September 1997 and September 2009, respectively. The color scale represents water table depth (m).
8 D. Han et al. / Journal of Hydrology xxx (2011) xxx–xxx
these wells are screened in silt or fine sands, hence, they appear toexhibit a delayed response to leakage from irrigation return flow.The increasing groundwater level in the deep well ZK7 (100.5 mdepth, screened in 6 m thickness of sandstone) suggests that thegroundwater level in the deep confined aquifer is also increasingand is likely influenced by downward leakage from the shallowaquifer.
Fig. 6 shows the spatial change (amplitude and sign) in watertable depth from the end of the irrigation season (Oct) to the begin-ning of the season in the following year (May), for 2005, 2008 and2009. The amplitude of the change was highest in 2005, rangingfrom �4.5 m to +5.1 m, while the amplitude was lesser in 2008and 2009, ranging from �2.9 m to +2.6 m and �3.0 m to +1.9 m,respectively. The attenuation of the seasonal fluctuation in watertables in the most recent period is an indication that water savingplans, implemented in 2006, may have started to play a role in reg-ulating the shallow water table. However, overall, the water levelscontinued to follow an increasing trend over 2008 and 2009.
5.2. Groundwater storage
Groundwater storage is an important component of the hydro-logic cycle, which must be accounted for when attempting toquantify groundwater recharge, lateral movement, and evapo-transpiration. Groundwater storage changes were estimated forthe KADA area on the basis of measurement of shallow groundwa-ter levels (e.g. Healy and Cook, 2002). Annual groundwater levelchanges were calculated from September 1997 through to Septem-ber 2009. Monthly or seasonally averaged periods were not usedbecause the water levels were measured manually and data werenot available for every month.
Groundwater level changes were converted to groundwaterstorage (DS) by multiplying water level changes by the area andspecific yield:
DS ¼ Dh � A � Sy ð1Þ
where Dh is the average groundwater level change across the studyarea for the period; A is the area of the study area; and Sy is the spe-cific yield. Specific yield in the study area, based on 23 pumping
Please cite this article in press as: Han, D., et al. A survey of groundwater levDevelopment Area, northwest China: Implications for soil and groundwater(2011), doi:10.1016/j.jhydrol.2011.03.052
tests (Cui et al., 1997), ranges from 0.05 to 0.16. In this study, anarea-weighted average specified yield 0.12 was used to calculatethe groundwater storage change. A single representative value ofthe groundwater level change was calculated as following: First,the study was divided into a mesh of 2 � 2 km cells, and groundwa-ter level changes were calculated at locations where monitoringdata in the two time periods were available (Fig. 7a). Then, each cellof the mesh was assigned a mean value for the water level changebased on all measurements within it (Fig. 7b). Finally, an area-weighted average was calculated from the cells with data availablein it to represent the average groundwater level change (Dh) acrossthe study area. Fig. 8 shows the accumulated total storage variationsince September 1997, based on this method. The accumulated totalstorage is approximately +150 million cubic meters of water fromSeptember 1997 to September 2009 (150.04 � 106 m3), with theaverage change in groundwater table being +6.9 m (Table 3). Theaverage yearly net groundwater recharge for the KADA over the12 year period is thus approximately 12.5 � 106 cubic meters.
5.3. Water budget of the aquifer
In terms of the groundwater budget for the KADA, changes ingroundwater storage can be attributed to recharge and subsurfacelateral in-flow minus evaporation and subsurface lateral outflow(groundwater discharge to the paleo-riverbed of the now driedManas River). There is no groundwater extraction in this area.
The budget can be written as:
DSgw ¼ Qp þ Qi þ Q lr � ETgw � Q ld ð2Þ
DSgw is the change in subsurface storage, Qp is precipitation infiltra-tion, Qi irrigation infiltration, Qlr the lateral groundwater recharge,ETgw evapotranspiration and Qld is the lateral groundwater dis-charge; all terms are expressed as rates (e.g., m3/a).
Accurate estimation of groundwater recharge is extremelyimportant for proper management of groundwater systems,particularly in arid regions (de Vries and Simmers, 2002). The threemajor recharge terms in the overall water balance are esti-mated below. Precipitation infiltration can be calculated by theequation:
els and hydrogeochemistry in irrigated fields in the Karamay Agriculturalsalinity resulting from surface water transfer for irrigation. J. Hydrol.
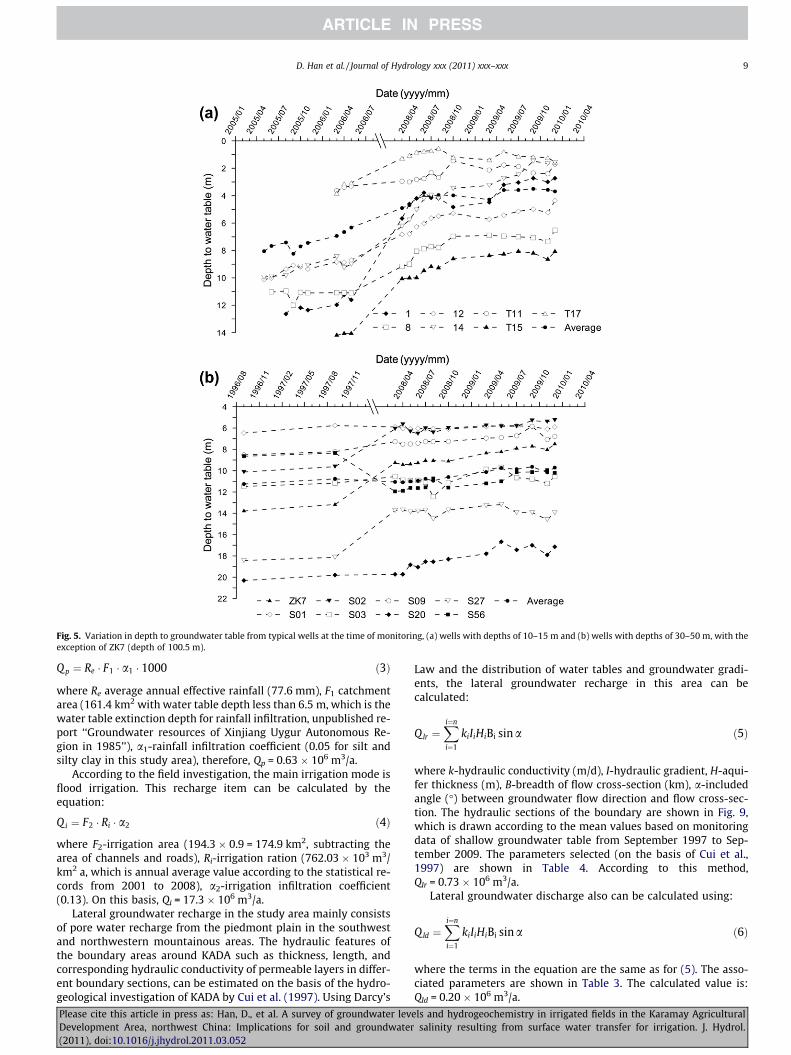
Fig. 5. Variation in depth to groundwater table from typical wells at the time of monitoring, (a) wells with depths of 10–15 m and (b) wells with depths of 30–50 m, with theexception of ZK7 (depth of 100.5 m).
D. Han et al. / Journal of Hydrology xxx (2011) xxx–xxx 9
Q p ¼ Re � F1 � a1 � 1000 ð3Þ
where Re average annual effective rainfall (77.6 mm), F1 catchmentarea (161.4 km2 with water table depth less than 6.5 m, which is thewater table extinction depth for rainfall infiltration, unpublished re-port ‘‘Groundwater resources of Xinjiang Uygur Autonomous Re-gion in 1985’’), a1-rainfall infiltration coefficient (0.05 for silt andsilty clay in this study area), therefore, Qp = 0.63 � 106 m3/a.
According to the field investigation, the main irrigation mode isflood irrigation. This recharge item can be calculated by theequation:
Q i ¼ F2 � Ri � a2 ð4Þ
where F2-irrigation area (194.3 � 0.9 = 174.9 km2, subtracting thearea of channels and roads), Ri-irrigation ration (762.03 � 103 m3/km2 a, which is annual average value according to the statistical re-cords from 2001 to 2008), a2-irrigation infiltration coefficient(0.13). On this basis, Qi = 17.3 � 106 m3/a.
Lateral groundwater recharge in the study area mainly consistsof pore water recharge from the piedmont plain in the southwestand northwestern mountainous areas. The hydraulic features ofthe boundary areas around KADA such as thickness, length, andcorresponding hydraulic conductivity of permeable layers in differ-ent boundary sections, can be estimated on the basis of the hydro-geological investigation of KADA by Cui et al. (1997). Using Darcy’s
Please cite this article in press as: Han, D., et al. A survey of groundwater levDevelopment Area, northwest China: Implications for soil and groundwater(2011), doi:10.1016/j.jhydrol.2011.03.052
Law and the distribution of water tables and groundwater gradi-ents, the lateral groundwater recharge in this area can becalculated:
Qlr ¼Xi¼n
i¼1
kiIiHiBi sin a ð5Þ
where k-hydraulic conductivity (m/d), I-hydraulic gradient, H-aqui-fer thickness (m), B-breadth of flow cross-section (km), a-includedangle (�) between groundwater flow direction and flow cross-sec-tion. The hydraulic sections of the boundary are shown in Fig. 9,which is drawn according to the mean values based on monitoringdata of shallow groundwater table from September 1997 to Sep-tember 2009. The parameters selected (on the basis of Cui et al.,1997) are shown in Table 4. According to this method,Qlr = 0.73 � 106 m3/a.
Lateral groundwater discharge also can be calculated using:
Qld ¼Xi¼n
i¼1
kiIiHiBi sin a ð6Þ
where the terms in the equation are the same as for (5). The asso-ciated parameters are shown in Table 3. The calculated value is:Qld = 0.20 � 106 m3/a.
els and hydrogeochemistry in irrigated fields in the Karamay Agriculturalsalinity resulting from surface water transfer for irrigation. J. Hydrol.
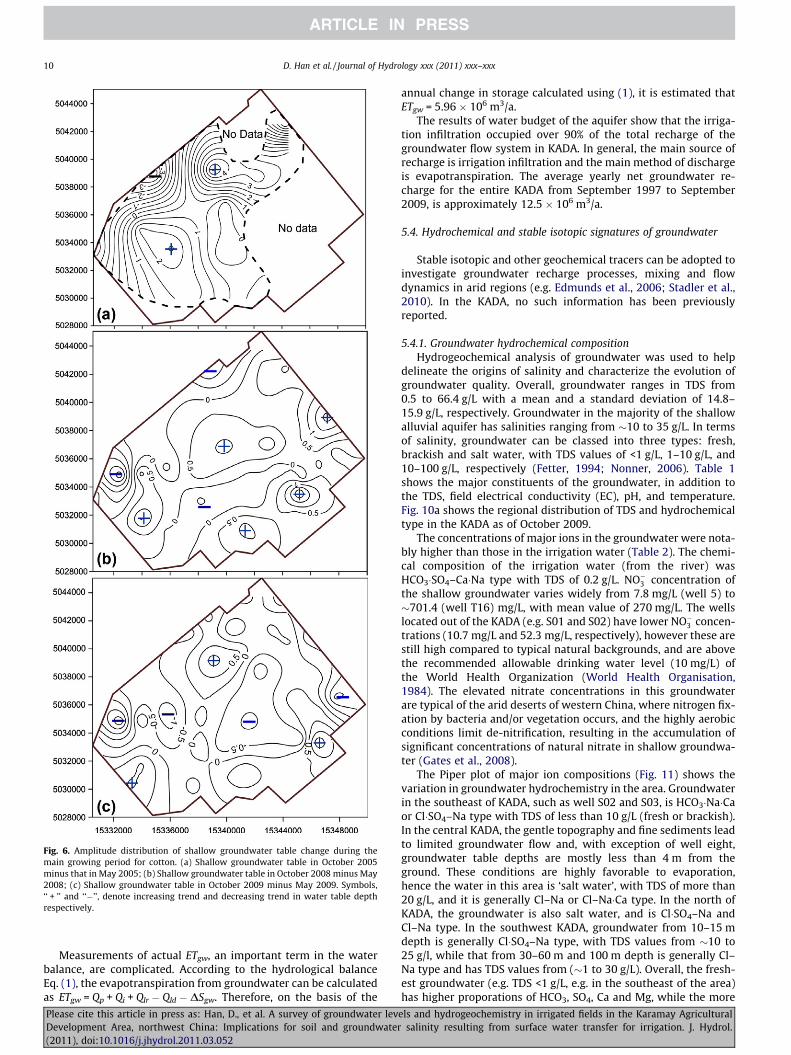
Fig. 6. Amplitude distribution of shallow groundwater table change during themain growing period for cotton. (a) Shallow groundwater table in October 2005minus that in May 2005; (b) Shallow groundwater table in October 2008 minus May2008; (c) Shallow groundwater table in October 2009 minus May 2009. Symbols,‘‘ + ’’ and ‘‘�’’, denote increasing trend and decreasing trend in water table depthrespectively.
10 D. Han et al. / Journal of Hydrology xxx (2011) xxx–xxx
Measurements of actual ETgw, an important term in the waterbalance, are complicated. According to the hydrological balanceEq. (1), the evapotranspiration from groundwater can be calculatedas ETgw = Qp + Qi + Qlr � Qld � DSgw. Therefore, on the basis of the
Please cite this article in press as: Han, D., et al. A survey of groundwater levDevelopment Area, northwest China: Implications for soil and groundwater(2011), doi:10.1016/j.jhydrol.2011.03.052
annual change in storage calculated using (1), it is estimated thatETgw = 5.96 � 106 m3/a.
The results of water budget of the aquifer show that the irriga-tion infiltration occupied over 90% of the total recharge of thegroundwater flow system in KADA. In general, the main source ofrecharge is irrigation infiltration and the main method of dischargeis evapotranspiration. The average yearly net groundwater re-charge for the entire KADA from September 1997 to September2009, is approximately 12.5 � 106 m3/a.
5.4. Hydrochemical and stable isotopic signatures of groundwater
Stable isotopic and other geochemical tracers can be adopted toinvestigate groundwater recharge processes, mixing and flowdynamics in arid regions (e.g. Edmunds et al., 2006; Stadler et al.,2010). In the KADA, no such information has been previouslyreported.
5.4.1. Groundwater hydrochemical compositionHydrogeochemical analysis of groundwater was used to help
delineate the origins of salinity and characterize the evolution ofgroundwater quality. Overall, groundwater ranges in TDS from0.5 to 66.4 g/L with a mean and a standard deviation of 14.8–15.9 g/L, respectively. Groundwater in the majority of the shallowalluvial aquifer has salinities ranging from �10 to 35 g/L. In termsof salinity, groundwater can be classed into three types: fresh,brackish and salt water, with TDS values of <1 g/L, 1–10 g/L, and10–100 g/L, respectively (Fetter, 1994; Nonner, 2006). Table 1shows the major constituents of the groundwater, in addition tothe TDS, field electrical conductivity (EC), pH, and temperature.Fig. 10a shows the regional distribution of TDS and hydrochemicaltype in the KADA as of October 2009.
The concentrations of major ions in the groundwater were nota-bly higher than those in the irrigation water (Table 2). The chemi-cal composition of the irrigation water (from the river) wasHCO3�SO4–Ca�Na type with TDS of 0.2 g/L. NO�3 concentration ofthe shallow groundwater varies widely from 7.8 mg/L (well 5) to�701.4 (well T16) mg/L, with mean value of 270 mg/L. The wellslocated out of the KADA (e.g. S01 and S02) have lower NO�3 concen-trations (10.7 mg/L and 52.3 mg/L, respectively), however these arestill high compared to typical natural backgrounds, and are abovethe recommended allowable drinking water level (10 mg/L) ofthe World Health Organization (World Health Organisation,1984). The elevated nitrate concentrations in this groundwaterare typical of the arid deserts of western China, where nitrogen fix-ation by bacteria and/or vegetation occurs, and the highly aerobicconditions limit de-nitrification, resulting in the accumulation ofsignificant concentrations of natural nitrate in shallow groundwa-ter (Gates et al., 2008).
The Piper plot of major ion compositions (Fig. 11) shows thevariation in groundwater hydrochemistry in the area. Groundwaterin the southeast of KADA, such as well S02 and S03, is HCO3�Na�Caor Cl�SO4–Na type with TDS of less than 10 g/L (fresh or brackish).In the central KADA, the gentle topography and fine sediments leadto limited groundwater flow and, with exception of well eight,groundwater table depths are mostly less than 4 m from theground. These conditions are highly favorable to evaporation,hence the water in this area is ‘salt water’, with TDS of more than20 g/L, and it is generally Cl–Na or Cl–Na�Ca type. In the north ofKADA, the groundwater is also salt water, and is Cl�SO4–Na andCl–Na type. In the southwest KADA, groundwater from 10–15 mdepth is generally Cl�SO4–Na type, with TDS values from �10 to25 g/l, while that from 30–60 m and 100 m depth is generally Cl–Na type and has TDS values from (�1 to 30 g/L). Overall, the fresh-est groundwater (e.g. TDS <1 g/L, e.g. in the southeast of the area)has higher proporations of HCO3, SO4, Ca and Mg, while the more
els and hydrogeochemistry in irrigated fields in the Karamay Agriculturalsalinity resulting from surface water transfer for irrigation. J. Hydrol.
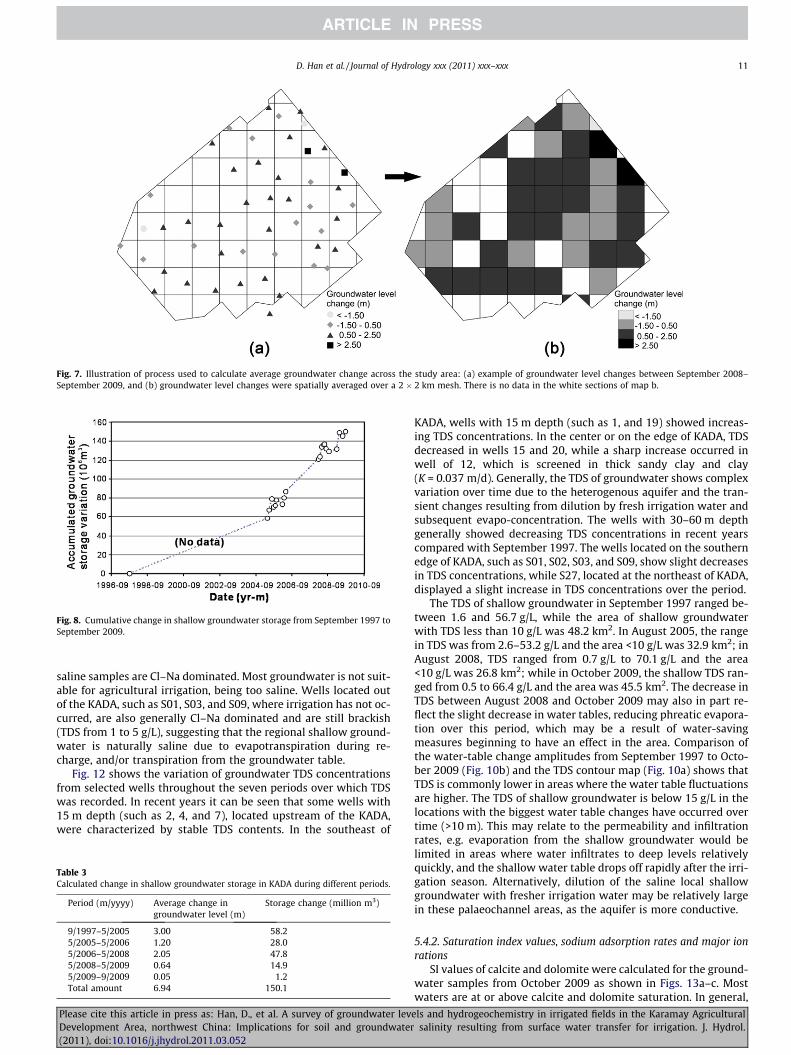
Fig. 7. Illustration of process used to calculate average groundwater change across the study area: (a) example of groundwater level changes between September 2008–September 2009, and (b) groundwater level changes were spatially averaged over a 2 � 2 km mesh. There is no data in the white sections of map b.
Fig. 8. Cumulative change in shallow groundwater storage from September 1997 toSeptember 2009.
D. Han et al. / Journal of Hydrology xxx (2011) xxx–xxx 11
saline samples are Cl–Na dominated. Most groundwater is not suit-able for agricultural irrigation, being too saline. Wells located outof the KADA, such as S01, S03, and S09, where irrigation has not oc-curred, are also generally Cl–Na dominated and are still brackish(TDS from 1 to 5 g/L), suggesting that the regional shallow ground-water is naturally saline due to evapotranspiration during re-charge, and/or transpiration from the groundwater table.
Fig. 12 shows the variation of groundwater TDS concentrationsfrom selected wells throughout the seven periods over which TDSwas recorded. In recent years it can be seen that some wells with15 m depth (such as 2, 4, and 7), located upstream of the KADA,were characterized by stable TDS contents. In the southeast of
Table 3Calculated change in shallow groundwater storage in KADA during different periods.
Period (m/yyyy) Average change ingroundwater level (m)
Storage change (million m3)
9/1997–5/2005 3.00 58.25/2005–5/2006 1.20 28.05/2006–5/2008 2.05 47.85/2008–5/2009 0.64 14.95/2009–9/2009 0.05 1.2Total amount 6.94 150.1
Please cite this article in press as: Han, D., et al. A survey of groundwater levDevelopment Area, northwest China: Implications for soil and groundwater(2011), doi:10.1016/j.jhydrol.2011.03.052
KADA, wells with 15 m depth (such as 1, and 19) showed increas-ing TDS concentrations. In the center or on the edge of KADA, TDSdecreased in wells 15 and 20, while a sharp increase occurred inwell of 12, which is screened in thick sandy clay and clay(K = 0.037 m/d). Generally, the TDS of groundwater shows complexvariation over time due to the heterogenous aquifer and the tran-sient changes resulting from dilution by fresh irrigation water andsubsequent evapo-concentration. The wells with 30–60 m depthgenerally showed decreasing TDS concentrations in recent yearscompared with September 1997. The wells located on the southernedge of KADA, such as S01, S02, S03, and S09, show slight decreasesin TDS concentrations, while S27, located at the northeast of KADA,displayed a slight increase in TDS concentrations over the period.
The TDS of shallow groundwater in September 1997 ranged be-tween 1.6 and 56.7 g/L, while the area of shallow groundwaterwith TDS less than 10 g/L was 48.2 km2. In August 2005, the rangein TDS was from 2.6–53.2 g/L and the area <10 g/L was 32.9 km2; inAugust 2008, TDS ranged from 0.7 g/L to 70.1 g/L and the area<10 g/L was 26.8 km2; while in October 2009, the shallow TDS ran-ged from 0.5 to 66.4 g/L and the area was 45.5 km2. The decrease inTDS between August 2008 and October 2009 may also in part re-flect the slight decrease in water tables, reducing phreatic evapora-tion over this period, which may be a result of water-savingmeasures beginning to have an effect in the area. Comparison ofthe water-table change amplitudes from September 1997 to Octo-ber 2009 (Fig. 10b) and the TDS contour map (Fig. 10a) shows thatTDS is commonly lower in areas where the water table fluctuationsare higher. The TDS of shallow groundwater is below 15 g/L in thelocations with the biggest water table changes have occurred overtime (>10 m). This may relate to the permeability and infiltrationrates, e.g. evaporation from the shallow groundwater would belimited in areas where water infiltrates to deep levels relativelyquickly, and the shallow water table drops off rapidly after the irri-gation season. Alternatively, dilution of the saline local shallowgroundwater with fresher irrigation water may be relatively largein these palaeochannel areas, as the aquifer is more conductive.
5.4.2. Saturation index values, sodium adsorption rates and major ionrations
SI values of calcite and dolomite were calculated for the ground-water samples from October 2009 as shown in Figs. 13a–c. Mostwaters are at or above calcite and dolomite saturation. In general,
els and hydrogeochemistry in irrigated fields in the Karamay Agriculturalsalinity resulting from surface water transfer for irrigation. J. Hydrol.
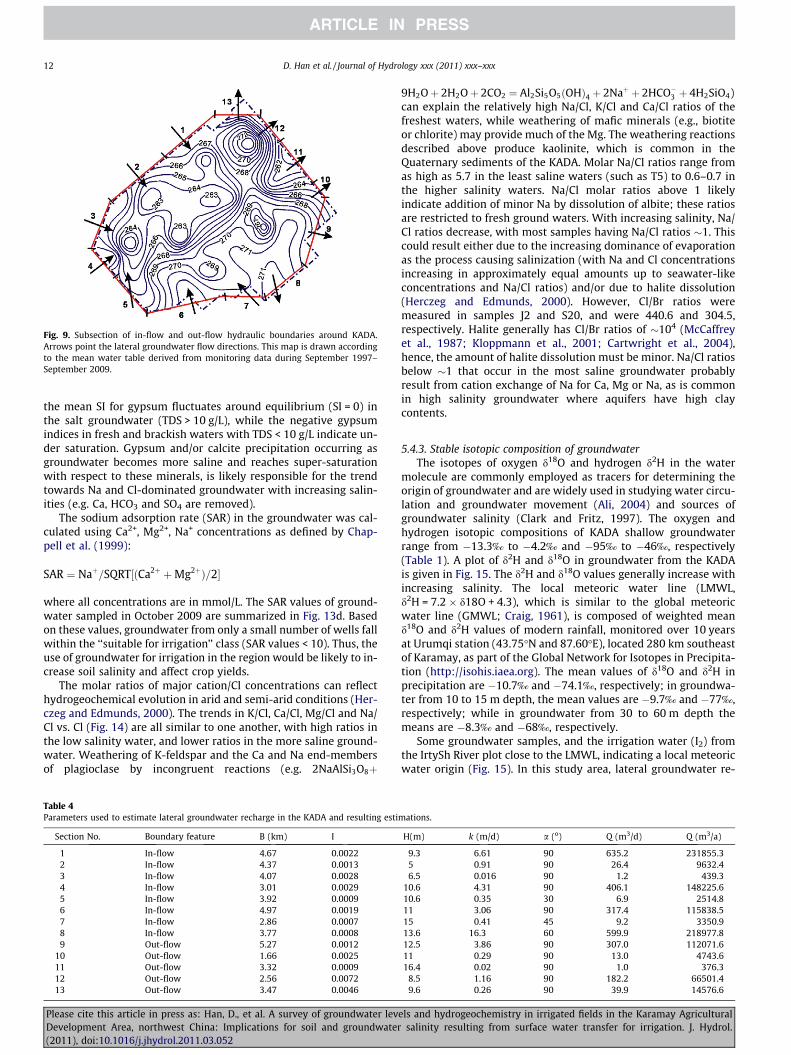
Fig. 9. Subsection of in-flow and out-flow hydraulic boundaries around KADA.Arrows point the lateral groundwater flow directions. This map is drawn accordingto the mean water table derived from monitoring data during September 1997–September 2009.
12 D. Han et al. / Journal of Hydrology xxx (2011) xxx–xxx
the mean SI for gypsum fluctuates around equilibrium (SI = 0) inthe salt groundwater (TDS > 10 g/L), while the negative gypsumindices in fresh and brackish waters with TDS < 10 g/L indicate un-der saturation. Gypsum and/or calcite precipitation occurring asgroundwater becomes more saline and reaches super-saturationwith respect to these minerals, is likely responsible for the trendtowards Na and Cl-dominated groundwater with increasing salin-ities (e.g. Ca, HCO3 and SO4 are removed).
The sodium adsorption rate (SAR) in the groundwater was cal-culated using Ca2+, Mg2+, Na+ concentrations as defined by Chap-pell et al. (1999):
SAR ¼ Naþ=SQRT½ðCa2þ þMg2þÞ=2�
where all concentrations are in mmol/L. The SAR values of ground-water sampled in October 2009 are summarized in Fig. 13d. Basedon these values, groundwater from only a small number of wells fallwithin the ‘‘suitable for irrigation’’ class (SAR values < 10). Thus, theuse of groundwater for irrigation in the region would be likely to in-crease soil salinity and affect crop yields.
The molar ratios of major cation/Cl concentrations can reflecthydrogeochemical evolution in arid and semi-arid conditions (Her-czeg and Edmunds, 2000). The trends in K/Cl, Ca/Cl, Mg/Cl and Na/Cl vs. Cl (Fig. 14) are all similar to one another, with high ratios inthe low salinity water, and lower ratios in the more saline ground-water. Weathering of K-feldspar and the Ca and Na end-membersof plagioclase by incongruent reactions (e.g. 2NaAlSi3O8þ
Table 4Parameters used to estimate lateral groundwater recharge in the KADA and resulting esti
Section No. Boundary feature B (km) I
1 In-flow 4.67 0.00222 In-flow 4.37 0.00133 In-flow 4.07 0.00284 In-flow 3.01 0.00295 In-flow 3.92 0.00096 In-flow 4.97 0.00197 In-flow 2.86 0.00078 In-flow 3.77 0.00089 Out-flow 5.27 0.0012
10 Out-flow 1.66 0.002511 Out-flow 3.32 0.000912 Out-flow 2.56 0.007213 Out-flow 3.47 0.0046
Please cite this article in press as: Han, D., et al. A survey of groundwater levDevelopment Area, northwest China: Implications for soil and groundwater(2011), doi:10.1016/j.jhydrol.2011.03.052
9H2Oþ 2H2Oþ 2CO2 ¼ Al2Si5O5ðOHÞ4 þ 2Naþ þ 2HCO�3 þ 4H2SiO4)can explain the relatively high Na/Cl, K/Cl and Ca/Cl ratios of thefreshest waters, while weathering of mafic minerals (e.g., biotiteor chlorite) may provide much of the Mg. The weathering reactionsdescribed above produce kaolinite, which is common in theQuaternary sediments of the KADA. Molar Na/Cl ratios range fromas high as 5.7 in the least saline waters (such as T5) to 0.6–0.7 inthe higher salinity waters. Na/Cl molar ratios above 1 likelyindicate addition of minor Na by dissolution of albite; these ratiosare restricted to fresh ground waters. With increasing salinity, Na/Cl ratios decrease, with most samples having Na/Cl ratios �1. Thiscould result either due to the increasing dominance of evaporationas the process causing salinization (with Na and Cl concentrationsincreasing in approximately equal amounts up to seawater-likeconcentrations and Na/Cl ratios) and/or due to halite dissolution(Herczeg and Edmunds, 2000). However, Cl/Br ratios weremeasured in samples J2 and S20, and were 440.6 and 304.5,respectively. Halite generally has Cl/Br ratios of �104 (McCaffreyet al., 1987; Kloppmann et al., 2001; Cartwright et al., 2004),hence, the amount of halite dissolution must be minor. Na/Cl ratiosbelow �1 that occur in the most saline groundwater probablyresult from cation exchange of Na for Ca, Mg or Na, as is commonin high salinity groundwater where aquifers have high claycontents.
5.4.3. Stable isotopic composition of groundwaterThe isotopes of oxygen d18O and hydrogen d2H in the water
molecule are commonly employed as tracers for determining theorigin of groundwater and are widely used in studying water circu-lation and groundwater movement (Ali, 2004) and sources ofgroundwater salinity (Clark and Fritz, 1997). The oxygen andhydrogen isotopic compositions of KADA shallow groundwaterrange from �13.3‰ to �4.2‰ and �95‰ to �46‰, respectively(Table 1). A plot of d2H and d18O in groundwater from the KADAis given in Fig. 15. The d2H and d18O values generally increase withincreasing salinity. The local meteoric water line (LMWL,d2H = 7.2 � d18O + 4.3), which is similar to the global meteoricwater line (GMWL; Craig, 1961), is composed of weighted meand18O and d2H values of modern rainfall, monitored over 10 yearsat Urumqi station (43.75�N and 87.60�E), located 280 km southeastof Karamay, as part of the Global Network for Isotopes in Precipita-tion (http://isohis.iaea.org). The mean values of d18O and d2H inprecipitation are �10.7‰ and �74.1‰, respectively; in groundwa-ter from 10 to 15 m depth, the mean values are �9.7‰ and �77‰,respectively; while in groundwater from 30 to 60 m depth themeans are �8.3‰ and �68‰, respectively.
Some groundwater samples, and the irrigation water (I2) fromthe IrtySh River plot close to the LMWL, indicating a local meteoricwater origin (Fig. 15). In this study area, lateral groundwater re-
mations.
H(m) k (m/d) a (o) Q (m3/d) Q (m3/a)
9.3 6.61 90 635.2 231855.35 0.91 90 26.4 9632.46.5 0.016 90 1.2 439.3
10.6 4.31 90 406.1 148225.610.6 0.35 30 6.9 2514.811 3.06 90 317.4 115838.515 0.41 45 9.2 3350.913.6 16.3 60 599.9 218977.812.5 3.86 90 307.0 112071.611 0.29 90 13.0 4743.616.4 0.02 90 1.0 376.3
8.5 1.16 90 182.2 66501.49.6 0.26 90 39.9 14576.6
els and hydrogeochemistry in irrigated fields in the Karamay Agriculturalsalinity resulting from surface water transfer for irrigation. J. Hydrol.
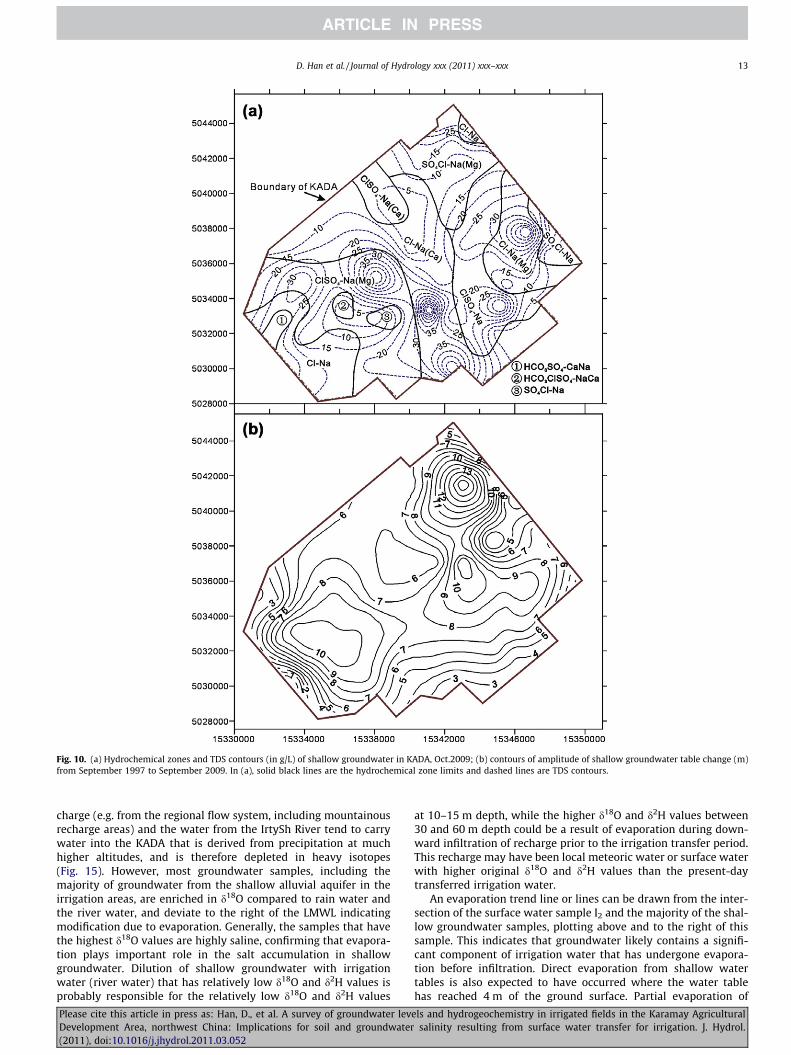
Fig. 10. (a) Hydrochemical zones and TDS contours (in g/L) of shallow groundwater in KADA, Oct.2009; (b) contours of amplitude of shallow groundwater table change (m)from September 1997 to September 2009. In (a), solid black lines are the hydrochemical zone limits and dashed lines are TDS contours.
D. Han et al. / Journal of Hydrology xxx (2011) xxx–xxx 13
charge (e.g. from the regional flow system, including mountainousrecharge areas) and the water from the IrtySh River tend to carrywater into the KADA that is derived from precipitation at muchhigher altitudes, and is therefore depleted in heavy isotopes(Fig. 15). However, most groundwater samples, including themajority of groundwater from the shallow alluvial aquifer in theirrigation areas, are enriched in d18O compared to rain water andthe river water, and deviate to the right of the LMWL indicatingmodification due to evaporation. Generally, the samples that havethe highest d18O values are highly saline, confirming that evapora-tion plays important role in the salt accumulation in shallowgroundwater. Dilution of shallow groundwater with irrigationwater (river water) that has relatively low d18O and d2H values isprobably responsible for the relatively low d18O and d2H values
Please cite this article in press as: Han, D., et al. A survey of groundwater levDevelopment Area, northwest China: Implications for soil and groundwater(2011), doi:10.1016/j.jhydrol.2011.03.052
at 10–15 m depth, while the higher d18O and d2H values between30 and 60 m depth could be a result of evaporation during down-ward infiltration of recharge prior to the irrigation transfer period.This recharge may have been local meteoric water or surface waterwith higher original d18O and d2H values than the present-daytransferred irrigation water.
An evaporation trend line or lines can be drawn from the inter-section of the surface water sample I2 and the majority of the shal-low groundwater samples, plotting above and to the right of thissample. This indicates that groundwater likely contains a signifi-cant component of irrigation water that has undergone evapora-tion before infiltration. Direct evaporation from shallow watertables is also expected to have occurred where the water tablehas reached 4 m of the ground surface. Partial evaporation of
els and hydrogeochemistry in irrigated fields in the Karamay Agriculturalsalinity resulting from surface water transfer for irrigation. J. Hydrol.
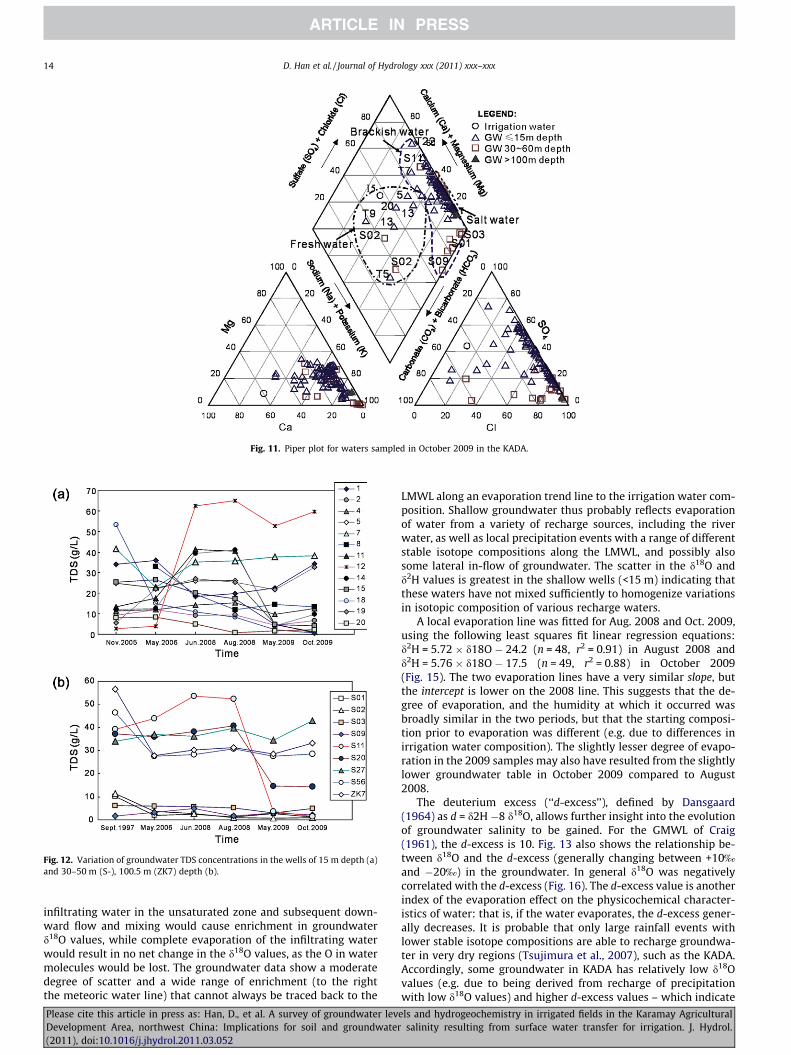
Fig. 11. Piper plot for waters sampled in October 2009 in the KADA.
Fig. 12. Variation of groundwater TDS concentrations in the wells of 15 m depth (a)and 30–50 m (S-), 100.5 m (ZK7) depth (b).
14 D. Han et al. / Journal of Hydrology xxx (2011) xxx–xxx
infiltrating water in the unsaturated zone and subsequent down-ward flow and mixing would cause enrichment in groundwaterd18O values, while complete evaporation of the infiltrating waterwould result in no net change in the d18O values, as the O in watermolecules would be lost. The groundwater data show a moderatedegree of scatter and a wide range of enrichment (to the rightthe meteoric water line) that cannot always be traced back to the
Please cite this article in press as: Han, D., et al. A survey of groundwater levDevelopment Area, northwest China: Implications for soil and groundwater(2011), doi:10.1016/j.jhydrol.2011.03.052
LMWL along an evaporation trend line to the irrigation water com-position. Shallow groundwater thus probably reflects evaporationof water from a variety of recharge sources, including the riverwater, as well as local precipitation events with a range of differentstable isotope compositions along the LMWL, and possibly alsosome lateral in-flow of groundwater. The scatter in the d18O andd2H values is greatest in the shallow wells (<15 m) indicating thatthese waters have not mixed sufficiently to homogenize variationsin isotopic composition of various recharge waters.
A local evaporation line was fitted for Aug. 2008 and Oct. 2009,using the following least squares fit linear regression equations:d2H = 5.72 � d18O � 24.2 (n = 48, r2 = 0.91) in August 2008 andd2H = 5.76 � d18O � 17.5 (n = 49, r2 = 0.88) in October 2009(Fig. 15). The two evaporation lines have a very similar slope, butthe intercept is lower on the 2008 line. This suggests that the de-gree of evaporation, and the humidity at which it occurred wasbroadly similar in the two periods, but that the starting composi-tion prior to evaporation was different (e.g. due to differences inirrigation water composition). The slightly lesser degree of evapo-ration in the 2009 samples may also have resulted from the slightlylower groundwater table in October 2009 compared to August2008.
The deuterium excess (‘‘d-excess’’), defined by Dansgaard(1964) as d = d2H �8 d18O, allows further insight into the evolutionof groundwater salinity to be gained. For the GMWL of Craig(1961), the d-excess is 10. Fig. 13 also shows the relationship be-tween d18O and the d-excess (generally changing between +10‰
and �20‰) in the groundwater. In general d18O was negativelycorrelated with the d-excess (Fig. 16). The d-excess value is anotherindex of the evaporation effect on the physicochemical character-istics of water: that is, if the water evaporates, the d-excess gener-ally decreases. It is probable that only large rainfall events withlower stable isotope compositions are able to recharge groundwa-ter in very dry regions (Tsujimura et al., 2007), such as the KADA.Accordingly, some groundwater in KADA has relatively low d18Ovalues (e.g. due to being derived from recharge of precipitationwith low d18O values) and higher d-excess values – which indicate
els and hydrogeochemistry in irrigated fields in the Karamay Agriculturalsalinity resulting from surface water transfer for irrigation. J. Hydrol.
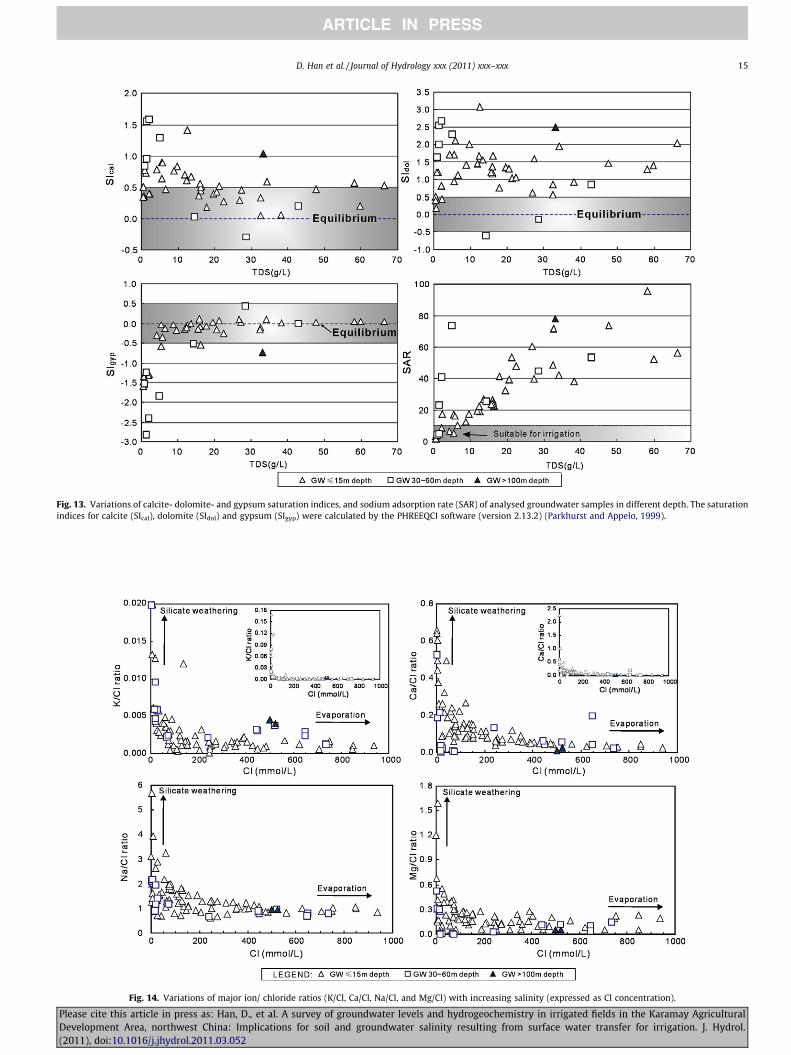
Fig. 13. Variations of calcite- dolomite- and gypsum saturation indices, and sodium adsorption rate (SAR) of analysed groundwater samples in different depth. The saturationindices for calcite (SIcal), dolomite (SIdol) and gypsum (SIgyp) were calculated by the PHREEQCI software (version 2.13.2) (Parkhurst and Appelo, 1999).
Fig. 14. Variations of major ion/ chloride ratios (K/Cl, Ca/Cl, Na/Cl, and Mg/Cl) with increasing salinity (expressed as Cl concentration).
D. Han et al. / Journal of Hydrology xxx (2011) xxx–xxx 15
Please cite this article in press as: Han, D., et al. A survey of groundwater levels and hydrogeochemistry in irrigated fields in the Karamay AgriculturalDevelopment Area, northwest China: Implications for soil and groundwater salinity resulting from surface water transfer for irrigation. J. Hydrol.(2011), doi:10.1016/j.jhydrol.2011.03.052
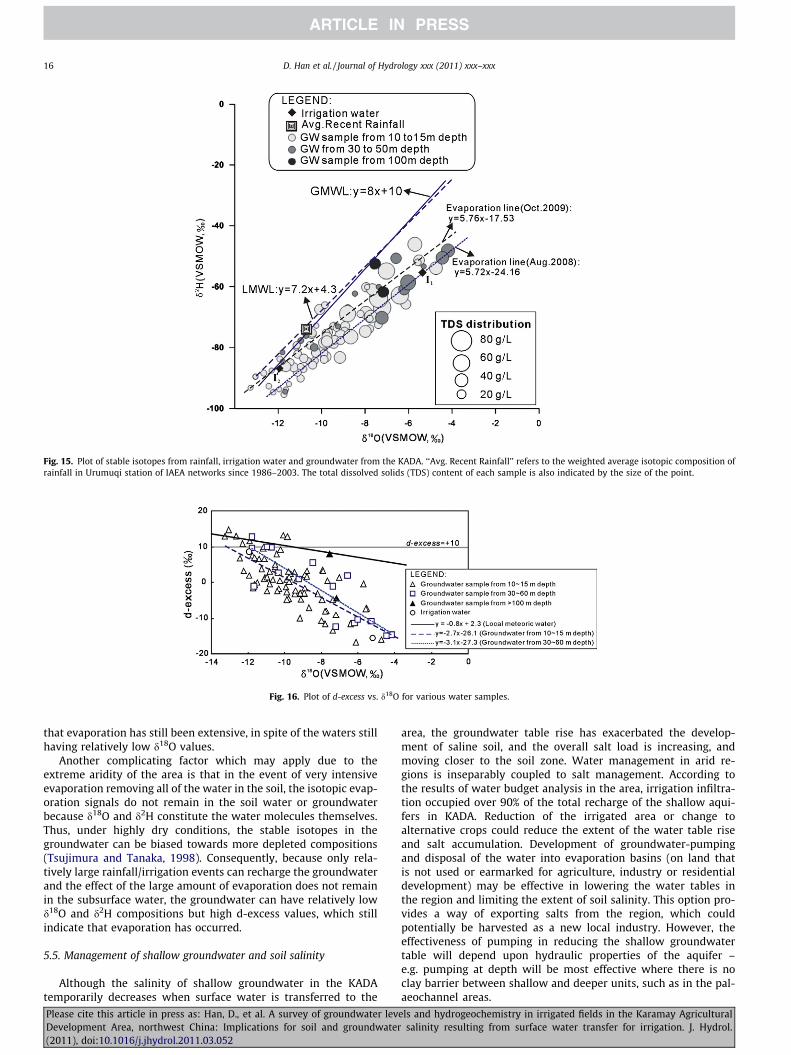
Fig. 15. Plot of stable isotopes from rainfall, irrigation water and groundwater from the KADA. ‘‘Avg. Recent Rainfall’’ refers to the weighted average isotopic composition ofrainfall in Urumuqi station of IAEA networks since 1986–2003. The total dissolved solids (TDS) content of each sample is also indicated by the size of the point.
Fig. 16. Plot of d-excess vs. d18O for various water samples.
16 D. Han et al. / Journal of Hydrology xxx (2011) xxx–xxx
that evaporation has still been extensive, in spite of the waters stillhaving relatively low d18O values.
Another complicating factor which may apply due to theextreme aridity of the area is that in the event of very intensiveevaporation removing all of the water in the soil, the isotopic evap-oration signals do not remain in the soil water or groundwaterbecause d18O and d2H constitute the water molecules themselves.Thus, under highly dry conditions, the stable isotopes in thegroundwater can be biased towards more depleted compositions(Tsujimura and Tanaka, 1998). Consequently, because only rela-tively large rainfall/irrigation events can recharge the groundwaterand the effect of the large amount of evaporation does not remainin the subsurface water, the groundwater can have relatively lowd18O and d2H compositions but high d-excess values, which stillindicate that evaporation has occurred.
5.5. Management of shallow groundwater and soil salinity
Although the salinity of shallow groundwater in the KADAtemporarily decreases when surface water is transferred to the
Please cite this article in press as: Han, D., et al. A survey of groundwater levDevelopment Area, northwest China: Implications for soil and groundwater(2011), doi:10.1016/j.jhydrol.2011.03.052
area, the groundwater table rise has exacerbated the develop-ment of saline soil, and the overall salt load is increasing, andmoving closer to the soil zone. Water management in arid re-gions is inseparably coupled to salt management. According tothe results of water budget analysis in the area, irrigation infiltra-tion occupied over 90% of the total recharge of the shallow aqui-fers in KADA. Reduction of the irrigated area or change toalternative crops could reduce the extent of the water table riseand salt accumulation. Development of groundwater-pumpingand disposal of the water into evaporation basins (on land thatis not used or earmarked for agriculture, industry or residentialdevelopment) may be effective in lowering the water tables inthe region and limiting the extent of soil salinity. This option pro-vides a way of exporting salts from the region, which couldpotentially be harvested as a new local industry. However, theeffectiveness of pumping in reducing the shallow groundwatertable will depend upon hydraulic properties of the aquifer –e.g. pumping at depth will be most effective where there is noclay barrier between shallow and deeper units, such as in the pal-aeochannel areas.
els and hydrogeochemistry in irrigated fields in the Karamay Agriculturalsalinity resulting from surface water transfer for irrigation. J. Hydrol.
D. Han et al. / Journal of Hydrology xxx (2011) xxx–xxx 17
Using advanced irrigation equipment for water-saving couldalso result in limiting the rise in water tables, however, unlesswater brought in to the area by transfer of river water is reducedor balanced by removal of water (e.g. via pumping and disposal),the overall salt load in the area is still likely to increase and movetowards the surface. Subsurface drainage systems, such as diggingdrainage ditches treated by anti-seepage, could also be designed toprevent residual soil water from recharge into shallow aquifer andmaintain a lower water table, thereby avoiding concentration ofsalts in the root zone. Additionally, planting trees, such as poplarand desert date, can be regarded as ‘‘biological drainage’’ playingan important role in water table control (although the salt toler-ance of the plants is limited, and the plants cannot remove salts,only water). Careful consideration and adoption of appropriatewater management practices may yet be able to avoid irreversibleand quasi-irreversible damage to the productivity and health of thelocal agricultural and ecological environment.
In addition to counter-measures for managing shallow ground-water and controlling soil salinity, further specific research couldbe performed, such as building models for drivers of shallow watertable, and water-salt balance models.
6. Conclusions
The KADA presents a case study of arid-region groundwatersalinization under the influence of agricultural irrigation fromtransferred surface water. In this research, physical data (e.g. waterlevel changes, geologic data) were used to characterize the waterbudget in the region, and the various factors that are importantin controlling water levels. Over irrigation in KADA has led to sub-stantial groundwater level rise in the shallow aquifer. The meanrise of groundwater table was 6.9 m from September 1997 to Sep-tember 2009. The accumulated total net storage change is close to150 million cubic meters from September 1997 to September2009. Irrigation was found to constitute >90% of recharge, whileevapotranspiration is the primary discharge mechanism.
Chemical analysis of groundwater samples collected from theKADA was also carried out in order to investigate the hydro-chemistry of the Quaternary shallow aquifer and better charac-terize the quality impacts of irrigation on the groundwater. Inmost of the shallow groundwater the TDS and Cl concentrationsare high (mean values of 20 and 8.3 g/L, respectively); �65% ofsampled waters are classed as salt water (>10 g/L) and areCl(SO4)–Na type. Solutes in groundwater in the KADA are de-rived by evapotranspiration of shallow groundwater with minorrock weathering, halite dissolution, and possibly ion exchange.Gypsum and calcite precipitation are likely responsible for thetrend towards Na–Cl dominated major ion chemistry withincreasing salinity. The calculated SAR results for shallowgroundwater indicate that most water is not suitable for irriga-tion. That saline groundwater dominantly occurs in regions oflow hydraulic conductivity between palaeochannels, suggeststhat the variation in salinity may be due to the rate at whichgroundwater recharges.
Stable isotope data show that much of the shallow groundwaterin KADA is enriched in d18O, deviating from the LMWL, indicatinginfiltration of irrigation water that had undergone evaporation.Some groundwater has relatively low d18O values and higher d-ex-cess, suggesting the waters that recharged the aquifer (e.g. fromvery heavy rain events or transferred surface water) had lower ini-tial d18O values, but were still subject to evaporation. The data inthis paper can provide an important basis for the further study ofthe groundwater environment in the KADA, and other analogousregions. Further characterization of the water and salt balance inthe area could be achieved using additional geochemical and geo-
Please cite this article in press as: Han, D., et al. A survey of groundwater levDevelopment Area, northwest China: Implications for soil and groundwater(2011), doi:10.1016/j.jhydrol.2011.03.052
physical information, and there is potential for modeling as thedensity of monitoring data increases over subsequent years.
Acknowledgements
This work was supported by the West Planning Action Program(No.KZCX2-XB2-13) of the Chinese Academy of Sciences, entitled‘‘Water Saving Irrigation for water-salt adjustment and control inthe saline land of North China’’ and was financially supported bythe National Natural Science Foundation of China (No.40801018). The authors would like to thank Mr.Meng, Director ofthe office of Karamay Agricultural Development for providingimportant information on the groundwater in KADA. Thanks arealso to Mr.Chang Fuhai for support in the field survey.
References
Ali, M. Subyani, 2004. Use of chloride-mass balance and environmental isotopes forevaluation of groundwater recharge in the alluvial aquifer, Wadi Tharad, westSaudi Arabia. Environmental Geology 46, 741–749.
Allison, G.B., Cook, P.G., Barnett, S.R., Walker, G.R., Jolly, I.D., Hughes, M.W., 1990.Land clearance and river salinisation in the Murray Basin, Australia. Journal ofHydrology 119, 1–20.
Arad, A., Evans, R., 1987. The hydrogeology, hydrochemistry and environmentalisotopes of the Campaspe River aquifer system, north-central Victoria, Australia.Journal of Hydrology 95, 63–86.
Cartwright, I., Weaver, T.R., Fulton, S., Nichol, C., Reid, M., Cheng, X., 2004.Hydrogeochemical and isotopic constraints on the origins of dryland salinity,Murray Basin, Victoria, Australia. Applied Geochemistry 19, 1233–1254.
Cartwright, I., Weaver, T.R., Stone, D., Reid, M., 2007. Constraining modern andhistorical recharge from bore hydrographs, 3H, 14C and chloride concentrations:applications to dual-porosity aquifers in dryland salinity areas, Murray Basin,Australia. Journal of Hydrology 332, 69–92.
Chappell, N.A., Ternan, J.L., Bidin, K., 1999. Correlation of physicochemicalproperties and sub-erosional landforms with aggregate stability variations ina tropical Ultisol disturbed by forestry operations. Soil & Tillage Research 50,55–71.
Clark, I.D., Fritz, P., 1997. Environmental Isotopes in Hydrogeology. LewisPublishers, Boca Raton, pp. 144–207.
Craig, H., 1961. Standard for reporting concentration of deuterium and oxygen-18 innatural water. Science 133, 1833–1834.
Cui, D., Liu, Z.Y., Luo, Z.H., Wen, J., 1997. Hydrogeological survey report of ecologicalagricultural are in Karamay arid region 9–11.
Dansgaard, W., 1964. Stable isotopes in precipitation. Tellus 16, 436–438.De Vries, J.J., Simmers, I., 2002. Groundwater recharge: an overview of processes
and challenges. Hydrogeology Journal 10, 5–17.Edmunds, W.M., Ma, J., Aeschbach-Hertig, W., Kipfer, R., Darbyshire, D.P.F., 2006.
Groundwater recharge history and hydrogeochemical evolution in the MinqinBasin, North West China. Applied Geochemistry 21 (12), 2148–2170.
Fetter, C.W., 1994. Applied hydrogeology. Prentice Hall, Englewood Cliffs.Froehlich, K., Yurtsever, Y., 1995. Isotope techniques for water resources in arid and
semiarid regions. In: Adar, E.M., Leibundgut, C. (Eds.), Application of Tracers inArid Zone Hydrology (Proceedings of the Vienna Symposium. IAHSPubl.no.232:3–12, August 1994.
Gates, J.B., Bohlke, J.K., Edmunds, W.M., 2008. Ecohydrological factors affectingnitrate concentrations in a phreatic desert aquifer in northwestern China.Environmental Science and Technology 42, 3531–3537.
Healy, R.W., Cook, P.G., 2002. Using groundwater levels to estimate recharge.Hydrogeology Journal 10, 91–109.
Herczeg, A.L., Edmunds, W.M., 2000. Inorganic ions as tracers. In: Cook, P., Herczeg,A. (Eds.), Environmental Tracers in Subsurface Hydrology. Kluwer AcademicPublishers, Boston, pp. 31–77.
Kloppmann, W., Négrel, Ph., Casanova, J., Klinge, H., Schelkes, K., Guerrot, C., 2001.Halite dissolution derived brines in the vicinity of a Permian salt dome (NGerman Basin). Evidence from boron, strontium, oxygen, and hydrogenisotopes. Geochimica et Cosmochimica Acta 65, 4087–4101.
Mao, J.M., Tian, C.Y., Wen, Q.K., Wu, H.Q., Wang, X.Y., Zhang, S.Y., 2007. Study on soilqualitative characteristics of different land utilization way in agriculturaldevelopment zones of Karamay. Journal of Xinjiang Agricultural University 30(2), 41–44 (in Chinese).
McCaffrey, M.A., Lazar, B., Holland, H.D., 1987. The evaporation path of seawaterand the coprecipitation of Br� and K+ with halite. Journal of SedimentaryPetrology 57, 928–937.
Nonner, J.C., 2006. Introduction to Hydrogeology. Taylor & Francis Group plc,London, UK, p186.
Parkhurst, D.L., Appelo, C.A.J., 1999. User’s guide to PHREEQC-a computer programfor speciation, reaction-path, 1D-transport, and inverse geochemicalcalculation: US Geological Survey. Water-Resour Investig Rep 99-4259, 312.
Simpson, H.J., Herczeg, A.L., 1991. Salinity and evaporation in the River MurrayBasin, Australia. Journal of Hydrology 124, 1–27.
Stadler, S., Osenbrück, K., Suckow, A.O., Himmelsbach, T., Hötzl, H., 2010.Groundwater flow regime, recharge and regional-scale solute transport in the
els and hydrogeochemistry in irrigated fields in the Karamay Agriculturalsalinity resulting from surface water transfer for irrigation. J. Hydrol.
18 D. Han et al. / Journal of Hydrology xxx (2011) xxx–xxx
semi-arid Kalahari of Botswana derived from isotope hydrology andhydrochemistry. Journal of Hydrology 388, 291–303.
Tsujimura, M., Tanaka, T., 1998. Evaluation of evaporation rate from forested soilsurface using stable isotopic composition of soil water in a headwater basin.Hydrological Processes 12, 2093–2103.
Tsujimura, M., Abe, Y., Tanaka, T., Shimada, J., Higuchi, S., Yamanaka, T., Davva, G.,Oyunbaatar, D., 2007. Stable isotopic and geochemical characteristics ofgroundwater in Kherlen River basin, a semi-arid region in eastern Mongolia.Journal of Hydrology 333, 47–57.
Please cite this article in press as: Han, D., et al. A survey of groundwater levDevelopment Area, northwest China: Implications for soil and groundwater(2011), doi:10.1016/j.jhydrol.2011.03.052
Wang, X.Y., Tian, C.Y., Wen, Q.K., Wu, H.Q., Mao, J.M., 2007. Influence of landutilization way on soil salt in Karamay agricultural development zones. Journalof Xinjiang Agricultural University 30 (2), 38–40, in Chinese.
World Health Organisation, 1984. Guidelines for Drinking Water Quality, vol. 1.World Health Org., Geneva.
Yao, X.R., Pan, C.D., Zhang, H.H., Li, D.M., Chang, F.H., 2008. Study on the water-soilenvironmental characteristics in Karamay agricultural development regionafter land exploitation. Journal of Xinjiang Agricultural University 31 (1), 1–6(in Chinese).
els and hydrogeochemistry in irrigated fields in the Karamay Agriculturalsalinity resulting from surface water transfer for irrigation. J. Hydrol.