Embed Size (px)
Citation preview
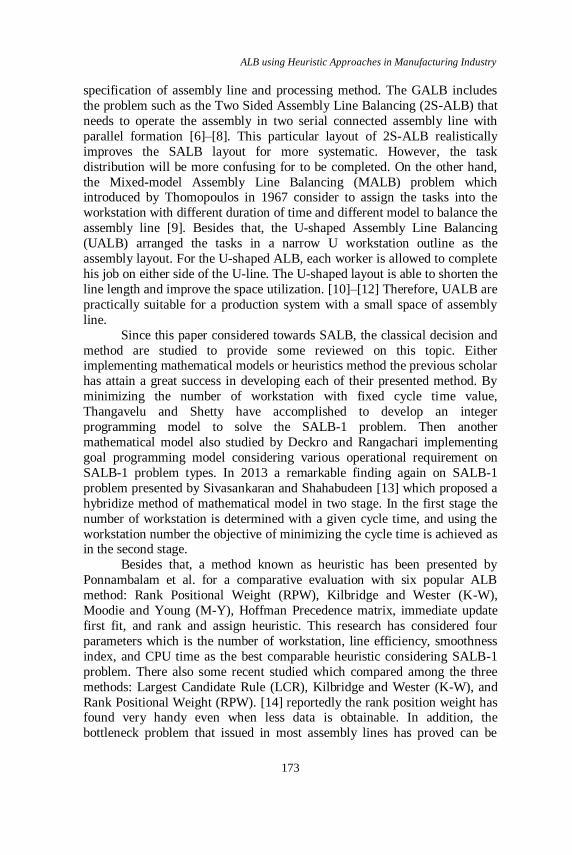
Journal of Mechanical Engineering Vol SI 4(2), 171-185, 2017
___________________
ISSN 1823- 5514, eISSN 2550-164X Received for review: 2017-04-28
© 2017 Faculty of Mechanical Engineering, Accepted for publication: 2017-05-13
Universiti Teknologi MARA (UiTM), Malaysia. Published: 2017-09-15
Assembly Line Balancing using Heuristic Approaches in Manufacturing Industry
Muhammad Razif Abdullah Make, Mohd Fadzil Faisae
Rashid*, Muhamad Magffierah Razali, Manugari
Perumal
Manufacturing Focus Group, Faculty of Mechanical
Engineering, Universiti Malaysia Pahang, 26600, Pekan,
Pahang, Malaysia.
ABSTRACT
Assembly Line Balancing (ALB) plays a vital function especially in the
production line. The installation of an assembly line is a long-term decision
and requires large capital of investments. It is important that such a system is
designed and balanced so that it able to work efficiently as possible. Many
previous researches have proposed different heuristic approach in optimizing
the assembly line. However little attention is given toward simulation
analysis as proved of the proposed method. In this paper, a real industrial
data of simple ALB problem is optimized and simulated for minimizing the
number of workstation. Three proposed heuristics in order to improve the efficiency of the production are reviewed before a discrete simulation
approach is used to compare the optimized performance. The anticipated
performance of computational result is obtained from the problem
comprising the workstation and labour performance output.
Keywords: Assembly line balancing, Largest candidate rule, Kilbridge and
Wester method, Ranked positional weight, Simulation method
Introduction
An assembly system is usually designed for plants that comprise with a set of
sequential elements (assembly task) to be performed on each assigned
workstation. It comes crucially important for the manufacturing system and
assembly line since the process need to be optimized with the correct
sequence order. Literally, the development of assembly line was introduced

Muhammad Razif Abdullah Make et al.
172
in 1913 by Henry Ford throughout his successful automotive plants for mass
production used. Initiated by his idea a balanced approach towards the
assembly line has been presented named Assembly Line Balancing (ALB).
Since that numerous evolution and improvement has been reported towards
the ALB problem and the optimization method. Besides that, in 1955 the first
mathematically formulation for ALB problem has been presented by
Salveson focusing on equalified and fast solution approach for solving the line balancing problem. Nowadays the research still continued with more
beneficial and improvisation of each previous method. The widely applied in
many production systems again has brought to a new birth of the application
and method on the ALB.
Generally, the study on ALB has been classified into two classes
either Simple Assembly Line Balancing (SALB) [1, 2] or General Assembly
Line Balancing (GALB). Fig. 1 describes the classification of ALB with
some problem type examples. Basically, the assembly line in the SALB
category consist of a straight line workstation that connected each other for
completing each assigned task before the final product is released.
Considering the numerous number of tasks, the correct and appropriate distribution of tasks into the workstation are needed. As shown in Fig. 1,
several types of problem are classed under the SALB with different
consideration of objective function. First, SALB type-1 (SALB-1) problem
consists of assigning tasks to minimize the number of workstation with fixed
cycle time. While for SALB type-2 (SALB-2), the objective is to minimize
the cycle time with fixed workstation number. Next is SALB for type-E
problem which generally focus to maximize the line efficiency. The SALB-E
type is believed to consider both objectives on SALB type-1 and type-2 as
proposed to maximised the assembly line efficiency [3]–[5].
Assembly Line Balancing
(ALB)
Simple Assembly Line
Balancing (SALB)
General Assembly Line
Balancing (GALB)
SALB-1 SALB-2 SALB-E 2S-ALB UALBMALB
Fig.1 ALB classification
In solving the ALB problem another class of GALB also has been
introduced. Because of different condition towards ALB this problem has
placed separately against SALB. This classified problem usually involves
with more massive scale series of production implementing different
ALB using Heuristic Approaches in Manufacturing Industry
173
specification of assembly line and processing method. The GALB includes
the problem such as the Two Sided Assembly Line Balancing (2S-ALB) that
needs to operate the assembly in two serial connected assembly line with
parallel formation [6]–[8]. This particular layout of 2S-ALB realistically
improves the SALB layout for more systematic. However, the task
distribution will be more confusing for to be completed. On the other hand,
the Mixed-model Assembly Line Balancing (MALB) problem which introduced by Thomopoulos in 1967 consider to assign the tasks into the
workstation with different duration of time and different model to balance the
assembly line [9]. Besides that, the U-shaped Assembly Line Balancing
(UALB) arranged the tasks in a narrow U workstation outline as the
assembly layout. For the U-shaped ALB, each worker is allowed to complete
his job on either side of the U-line. The U-shaped layout is able to shorten the
line length and improve the space utilization. [10]–[12] Therefore, UALB are
practically suitable for a production system with a small space of assembly
line.
Since this paper considered towards SALB, the classical decision and
method are studied to provide some reviewed on this topic. Either implementing mathematical models or heuristics method the previous scholar
has attain a great success in developing each of their presented method. By
minimizing the number of workstation with fixed cycle time value,
Thangavelu and Shetty have accomplished to develop an integer
programming model to solve the SALB-1 problem. Then another
mathematical model also studied by Deckro and Rangachari implementing
goal programming model considering various operational requirement on
SALB-1 problem types. In 2013 a remarkable finding again on SALB-1
problem presented by Sivasankaran and Shahabudeen [13] which proposed a
hybridize method of mathematical model in two stage. In the first stage the
number of workstation is determined with a given cycle time, and using the
workstation number the objective of minimizing the cycle time is achieved as in the second stage.
Besides that, a method known as heuristic has been presented by
Ponnambalam et al. for a comparative evaluation with six popular ALB
method: Rank Positional Weight (RPW), Kilbridge and Wester (K-W),
Moodie and Young (M-Y), Hoffman Precedence matrix, immediate update
first fit, and rank and assign heuristic. This research has considered four
parameters which is the number of workstation, line efficiency, smoothness
index, and CPU time as the best comparable heuristic considering SALB-1
problem. There also some recent studied which compared among the three
methods: Largest Candidate Rule (LCR), Kilbridge and Wester (K-W), and
Rank Positional Weight (RPW). [14] reportedly the rank position weight has found very handy even when less data is obtainable. In addition, the
bottleneck problem that issued in most assembly lines has proved can be

Muhammad Razif Abdullah Make et al.
174
reduced through this kind of approach [15]. Mohammed et al. [14] also have
done to study on imitating of two stages gear box procedure. Then the three
methods of LCR, K-W and RPW have narrow down as to select the best
method on minimum assembly time with better performance of essential
retailing cost. This research also has found that RPW is the best method
compared to other two. Another heuristic on SALB-1 has develop by Jiao
et.al. in 2006 for Web-based interactive advisor method with objective to minimize the number of excess workstation. In his study, he also has
simulated the line balancing to evaluate the lines performance.
Literally this paper is focused on presenting three different heuristic
methods: Largest Candidate Rule (LCR), Kilbridge and Wester (K-W)
method and Rank Position Weight (RPW) method which traditionally
popular in solving the SALB problem. A real industrial SALB data set then
will be tested for minimizing the excess number of workstation with the best
sequence of assigned task. Besides, a simulation of current and after the
optimization will further discussed. Therefore, the particular feature of the
three heuristic method and simulation activity will further expose.
Assembly Line Balancing Methods The existing heuristic method in solving SALB problem has promising a
better finding. Besides the favourable advantage in implementing ALB
method have revealed the capability in maintaining the good efficiency on
each generated solution. Many researchers also have been devoted to
consider this SALB type problem even it classically exposed in the past few
decades. In this section, the detail explanation with a real industrial data is
presented. The comparable result of three different methods then will proved the strength and stability of ALB method in solving the real industrial data
set. In completing this studied only a single data set are considered that taken
from manufacturing industry.
In adopting three ALB methods into this real industrial problem each
working element from Table 1 that related towards the assembly process is
relevant to be transformed into a precedence relation diagram. This is
necessarily important to provide a flow of every processing element in
making the desired product. Fig. 2 illustrates the precedence relation diagram
with 12 number of tasks in the studied industry. The circle indicated the
assembly task, while the arrows linked represent the precedence relation with
other task. The related data of the processing duration also specified on top of each circle (assembly task).

ALB using Heuristic Approaches in Manufacturing Industry
175
Table 1: Assembly data
Working element Time Predecessor
1 4.7 -
2 2.5 1
3 5.7 1
4 4.3 2,3
5 6.3 4
6 6.8 5
7 6.8 6 8 10.4 7
9 12.8 8
10 4.7 9
11 2.7 10
12 7.2 11
1
3
4 5 7
12
96 108 11
2
4.7
2.5
5.7
4.3 6.3 6.8 6.8 10.4 12.8 4.7 2.7
7.2
Figure 2: Precedence relation diagram
For the selected manufacturing process, only 12 working element are
involved to be distributed among the workers and also workstation in the
assembly line. The analysis adopting three ALB method with aim to obtain
the optimal number of workstation in the manufacturing assembly line are
conducted based on every constructed figure and data. The heuristic method
that to be present are :-
1. Largest candidate rule
2. Kilbridge and Wester‟s method
3. Ranked positional weights method
Largest candidate rule (LCR) In this method the working element from Table 1 will be arranged in
descending order by refering to the processing time on every working
element. The worker then will be assigned to the first element that satisfy the

Muhammad Razif Abdullah Make et al.
176
precedence relation (Fig. 2). Table 2 have shown the descending order of
each processing time for every working element. Then, based from Table 2
the arrangement of each working element are arranged to satisfy the
precedence order. From the element in Table 3 the workstation are asigned
considering with the maximum cycle time which is 30. The element also are
grouped together without exceeding the maximum cycle time value.
Table 2. Descending time
working element
Table 3. Grouped element
Element Time Predece
ssor
9 12.8 8 8 10.4 7 12 7.2 11 6 6.8 5 7 6.8 6 5 6.3 4 3 5.7 1 1 4.7 -
10 4.7 9 4 4.3 2,3 11 2.7 10
2 2.5 1
Element Time Total time
Work station
1 4.7
23.4 1 3 5.7 2 2.5 4 4.3 5 6.3
6 6.8 24.0 2 7 6.8
8 10.4
9 12.8
27.4 3 10 4.7
11 2.7
12 7.2
By implementing this LCR method the assembly task have been
assigned in only three number of workstation. The arrangemant of element
then have obtain 27.4 as the maximum processing time.
Kilbridge and Wester’s (K-W) This heuristic method has received a lot of attention since it first introduce in
1961. Where the elements in this method are set into the workstation
according to the position from the precedence relation diagram. For this K-W
method each nodes (working element) from the precedence diagram are
grouped together into a vertical columns. The listing element then is
tabulated depend on the column position. Meanwhile the node selection will then provide a base sequence of arrangement with each processing time
needed. Table 4 below shows the element with each assigned column that
extract from Fig. 3. The obtained arrangement then used to construct a few of
workstation as shown in Table 5.

ALB using Heuristic Approaches in Manufacturing Industry
177
Figure 3: Column arrangement for K-W method
The grouped element are selected and arranged from left to right as
each nodes and arrows are depicted from the precedence relation diagram
(Fig. 2) which significantly moving towards the right side. By this K-W
method the assign column has successfully separates the working element
into several sections as to provide a selection choice for each node before the
maximum cycle time are reached. Therefore, for this problem as 30 minute is
the maximum cycle time, the grouped element shall not exceed this duration.
As shown in Table 5 the total processing time for workstation 1 is only 23.5
minute, while workstation 2 need 24 minute and 27.4 minutes which is the
maximum processing time needed by workstation 3 to complete it assigned
working element or tasks.
Table 4: Element arrangement with
column
Table 5: Grouped element
Element Column Time Total time
1 A 4.7 4.7 2 B 2.5
8.2 3 B 5.7
4 C 4.3 4.3 5 D 6.3 6.3 6 E 6.8 6.8 7 F 6.8 6.8 8 G 10.4 10.4 9 H 12.8 12.8 10 I 4.7 4.7 11 J 2.7 2.7
12 K 7.2 7.2
Element
Time Total time
Work station
1 4.7
23.5 1
2 2.5
3 5.7
4 4.3
5 6.3
6 6.8
24.0 2 7 6.8
8 10.4
9 12.8
27.4 3 10 4.7 11 2.7 12 7.2

Muhammad Razif Abdullah Make et al.
178
Rank Position Weight (RPW) This RPW method generally was introduce by Helgeson and Birnie in 1961.
It significantly represent for more efficient as to assign the working element
into each workstation. In the RPW method a cumulative processing time are
need to be calculated before it sorted in descending order. However, the precedence relation diagram from Fig. 2 is important to be considered as to
express the flow and it predecessor. Besides, only the related element that
connected towards the cumulative nodes will be considered. For example on
working element 2 which the arrow chain only take 4 until 12 as it successor.
Means the RPW value for element 2, are the cumulative of all processing
time except for working element 1 and 3. The RPW value then are arranged
in descending order as shown in Table 6 together with it predecessor. Generally this approach has adopted both the processing time of the
element and the position from the precedence relation diagram. The
cumulative value which in descending order is worthy and applicable to be
used as the assigned assembly sequence. Beside that, the RPW method also
assign the best cycle time and workstation required for the production line. As the given cycle time which is 30 minute the summation of time required
of each workstation should only be equal or less than the 30 minute. Table 7
shows the grouped element after implementing the RPW method with only
three number of workstations. Besides the maximum time (cycle time)
required for the assembly is reduced into 27.4 without considering any
available manpower.
Table 6: Element arrangement with
RPW descending order data
Table 7: Grouped element
Element
Time RPW Predece
ssor
1 4.7 74.9 - 3 5.7 67.7 1 2 2.5 64.5 1 4 4.3 62 2,3 5 6.3 57.7 4
6 6.8 51.4 5 7 6.8 44.6 6 8 10.4 37.8 7 9 12.8 27.4 8 10 4.7 14.6 9 11 2.7 9.9 10 12 7.2 7.2 11
Element
Time Total time
Work station
1 4.7
23.5 1 3 5.7 2 2.5 4 4.3 5 6.3
6 6.8 24 2 7 6.8
8 10.4
9 12.8
27.4 3 10 4.7 11 2.7 12 7.2

ALB using Heuristic Approaches in Manufacturing Industry
179
The recognition on RPW method for numerous real aplication has
been reported in many studied. This method also can reduce the assemblies
bottleneck problem with synchronies workstation. Initially the assembly line
of real industrial layout for this problem is occupied 5 number of
workstation. The reduction from five into three number of workstation with
grouped element is impressive. However, from this studied the other two
method also have shown no difference in the result of grouped element in the assembly line with 27.4 minutes as the highest processing time.
Assembly Simulation and Improvement
In this section the analysis of SALB-1 problem is further discussed with the
aid of Witness simulation software comparing before and after improvement.
For this purpose every information towards the assembly process and layout
are considered. This actually intended to provide a real situation on the
assembly line with comparable performance of the production system.
Initially the assembly line has been equipped with five number of
workstation. But from the earlier proposed method of LCR, K-W, and RPW
approach the workstation is able to be reduced into three. Hence for this
section a comparable performance on ALB simulation before and after
improvement are sudied.
Initial assembly line
For the initial assembly line five number of workstation are prepared as
depicted in Fig. 4. The small circle (red) on the left present as a former or
product that moving from one to another workstation until it fully complete
all the assigned work. While the green block respectively is the workstation
that connected to complete each working element before shipping process
that considered finished.
Figure 4: Simulation of initial assembly line
From the simulation three different parameter are analysed comparing idle, busy and blocked percentage. Idle actually is the time associated with
waiting, or a machinery which not being used. While busy means the
working activity in completing the assigned working element. The highest

Muhammad Razif Abdullah Make et al.
180
idle percentage is shown in Fig. 5 at workstation 5 with 64.59%. Meanwhile
the highest busy percentage is at workstation 4 with 99.87%. The percentage
become synchronized where once workstation 4 is busy the workstation 5
become idle. Besides in this initial simulation the blockage percentage only
shown in the first three workstation with 51.55%, 61.92% and 51.18%
respectively. The blockage plays an important role in where high block
percentage will disturb the flow of working order in the assembly line to complete the mission due to high workload.
Figure 5: Results of initial workstation simulation
Improvised assembly line
The ALB method have suggested three workstation as the optimal number of
workstation with only 27.4 minute as the best cycle time. Each workstation
are studied to provide a comparison before and after the optimization
considering the same parameter idle, busy and blockage percentage. Fig. 6
illustrated the three number of workstation (green block) after the reduction
from five workstations. The comparable result using Witness simulation is
used to identify whether the results obtain from the ALB method is
applicable.
Figure 6: Improvised simulation of assembly line
020406080
100
WS1 WS2 WS3 WS4 WS5
IDLE (%) 1.78 0.06 0.08 0.13 64.59
BUSY (%) 46.67 38.02 48.73 99.87 35.41
BLOCKED (%) 51.55 61.92 51.18 0 0

ALB using Heuristic Approaches in Manufacturing Industry
181
Fig.7 it depicted the improvised simulation result in only three
number of workstation. The favourable result have proved with successfully
increase the busy percentages in all of workstation, which previously only
certain workstation shows the high percentage result as workstation 4 is the
highest. The idle percentage also presented with minimum result as 1.78% is
the highest among those three workstations. Besides reducing the workstation
number, the simulation also showed the encouraging result towards blockage percentage. Only two workstations presented with a small percentage of
blockage which respectively in workstation 1 and 2. The decreasing blockage
and increasing busy percentage have shown the improvement achieved in the
suggested layout.
Figure 7: Results of improvised workstation simulation
Line balancing analysis In this subsection the analysis is further discuss involve with the number of
labor and the output product. The relationship between labors number and
output are determined and analyze still using Witness simulation software.
The three assigned workstation is fixed considering different situation with
increasing number of labors. Generally this analysis is modified to obtain the optimum output for the assembly line. Below presents different situation for
balancing approach with increasing number of labors.
Situation 1: 3 workstation and each workstation have 1 labors (3 labors)
Situation 2: Additional 1 labor with 3 workstation (4 labors)
Situation 3: Additional 1 labor to be shared on workstation 1 and 2 (5 labors)
Situation 4: Each 3 workstation is assigned with 2 worker (6 labors)
The particular situation are studied with comparable result that stated
on Fig 8. This figure depicted the division of labor activity on idle and busy
020406080
100
WS1 WS2 WS3
IDLE (%) 1.78 0.09 0.17
BUSY (%) 86.15 87.53 99.83
BLOCKED (%) 12.6 12.39 0

Muhammad Razif Abdullah Make et al.
182
percentage for every situation with increasing number of labor. The gray
section from Fig. 8 indicated as the idle percentage while black section
presents as the busy percentage. Situation 2 presents 4 labors that shows the
higher idle percentage in two workstation with 43.02% and 43.01%
respectively. Since the idle is higher means the busy percentage will
significantly drop. Meanwhile the other situation have greatly shows the
minimum idle percentage which below than 20%. Next the workstation progress also classified into four different
situation. Fig. 9 below have illustrated the percentage graph on each
workstation considering idle, busy and blockage percentage. In Fig. 9
situation 2 also shows the higher idle percentage which 43.02% followed by
situation 3. In situation 3 the busy working percentage has been interrupted
by the blockaged that present with black section. The higher blockaged
percentage means the greater disturbance of working flow in the assembly
line. However the output result have significantly propotional to the number
of labor. The next figure have graphically present the output of the four
proposed situations.
Figure 8: Percentage of labor activity based on situation
Figure 9: Percentage of workstation progress based on situation
020406080
100
1 2 3 1 2 3 4 1 2 3 4 5 1 2 3 4 5 6
No oflabor
(Situation1)
No of labor(Situation 2)
No of labor(Situation 3)
No of labor(Situation 4)
Idle (%) Busy (%)
020406080
100
1 2 3 1 2 3 1 2 3 1 2 3
No ofworkstation(Situation 1)
No ofworkstation(Situation 2)
No ofworkstation(Situation 3)
No ofworkstation(Situation 4)
Idle (%) Busy (%) Blockage (%)

ALB using Heuristic Approaches in Manufacturing Industry
183
Figure 10: The line balancing output graph
From the simulation of line balancing result the generated output
shows with better improvement as the increased number of labor. Situation 1
which only used 3 labors that respectively assigned to each workstation
produced 1049 output. Meanwhile, with one additional assigned labor the
output have increased to 1197 in situation 2. Then a greater improvement has
shown after the assigned labor is added to five with 1796 output. The
incremental progress are continuously increase until the number of labor is
six that successfully shows the higher output with 499 product difference. Therefore as the improvement made from the erlier workstation layout the
ALB optimization with simulation method has successfully proved
applicable and is appropriate to be implemented on the assembly line.
Discussion Since all the three ALB approach in this study are successfully minimize the
workstation number it significantly indicated this real industrial data could
become another simple ALB banchmark problem. Only 12 working element
are studied in assigning each element towards the minimum workstation. The previous optimization result have considered LCR, K-W and RPW method
but it have shows the same computed result with only three number of
workstation. Generally in an assembly line each working element are need to
be investigated for every difference aspect before being placed in the
appropriate workstation.
The simulated analysis of the SALB-1 problem also has been
previously discussed for initial and improvised layout from five into three
number of workstations. From the simulation three parameter are examined
which idle, busy and the blockage percentages. Then as expected the three
number of workstation is able to have a better result which all the
workstation shows better busy percentage depicted in Fig.7. Another line balancing analysis also have been examined considering the performance of
1049 1197
1796 2098
0
500
1000
1500
2000
2500
0 2 4 6 8
Ou
tpu
t
Number of labor
Muhammad Razif Abdullah Make et al.
184
workstation and labor which resulting the number of output. In determining
the best number of labor and bigger output this research is able to become as
a guideline or an example of implementing the real simulation for the
assembly line as the improvement method. Besides by implementing this
simulation approach the assembly production output also can be measured in
certain duration of processing time. Which the production output is able to be
determine before conducting the real assembly process. It is important that such a system is to be designed and measured so that it able to work
efficiently as planned apart to avoid losses
Conclusion
In this paper three ALB heuristic methods are discussed for the SALB-1
problem to minimize the number of workstation. This study was undertaken
to implement heuristic methods with simulation to compare the assembly
line. The minimization number of workstation has become as the main
objective for the ALB method while the simulation approach is aimed to provide a real measure of each performance and the production output.
Further simulation evaluation of labor number also presented. The
comparison performance of improvised assembly line and labor have
influence to be investigated to provide some clear explanation through it
achievement.
Although the real industrial data used in this study is good as to
provide the real assembly condition, the assembly problem is still considered
simple. Hence as the future work the more complex problem with more
intricate assembly process will be considered using the discussed ALB and
simulation method. This study also fit to investigate the other heuristic or
combinatorial ALB simulation whether the proposed method is reliable for to be implemented.
Acknowledgments The authors would like to acknowledge the Ministry of Higher Education,
Malaysia and Universiti Malaysia Pahang for supporting this research under
the FRGS grant RDU140103 and PRGS170319.
References [1] C. G. S. Sikora, T. C. Lopes, D. Schibelbain, and L. Magatão,
“Integer based formulation for the simple assembly line balancing
problem with multiple identical tasks,” Comput. Ind. Eng., 104, 134–
144, (2017).
[2] T. Pape, “Heuristics and lower bounds for the simple assembly line
balancing problem type 1: Overview, computational tests and improvements,” Eur. J. Oper. Res., 240 (1), 32–42, (2015).
ALB using Heuristic Approaches in Manufacturing Industry
185
[3] M. Jusop and M. F. F. Ab Rashid, “A review on simple assembly line
balancing type-e problem,” IOP Conf. Ser. Mater. Sci. Eng., 100,
012005, (2015).
[4] R. Esmaeilbeigi, B. Naderi, and P. Charkhgard, “The type E simple
assembly line balancing problem: A mixed integer linear
programming formulation,” Comput. Oper. Res., 64, 168–177,
(2015). [5] A. García-Villoria and R. Pastor, “Erratum to „A solution procedure
for type E simple assembly line balancing problem,‟” Comput. Ind.
Eng., 66 (1), 201–202, (2013).
[6] M. R. Abdullah Make, M. F. F. Ab. Rashid, and M. M. Razali, “A
review of two-sided assembly line balancing problem,” Int. J. Adv.
Manuf. Technol., 89 (5), 1743–1763, (2017).
[7] M. R. A. Make, M. F. F. Rashid, and M. M. Razali, “Modelling of
Two-sided Assembly Line Balancing Problem with Resource
Constraints,” IOP Conf. Ser. Mater. Sci. Eng., 160, 012005, (2016).
[8] Q. Tang, Z. Li, and L. Zhang, “An effective discrete artificial bee
colony algorithm with idle time reduction techniques for two-sided assembly line balancing problem of type-II,” Comput. Ind. Eng., 97,
146–156, (2016).
[9] M. M. Razali, M. F. F. Rashid, and M. R. A. Make, “Mathematical
Modelling of Mixed-Model Assembly Line Balancing Problem with
Resources Constraints,” IOP Conf. Ser. Mater. Sci. Eng., 160,
012002, (2016).
[10] N. Kumar and D. Mahto, “Assembly Line Balancing : A Review of,”
Assem. Line Balanc. a Rev. Dev. Trends Approach To Ind. Appl., 13
(2), 807–811, (2013).
[11] M. Li, Q. Tang, Q. Zheng, X. Xia, and C. A. Floudas, “Rules-based
heuristic approach for the U-shaped assembly line balancing
problem,” Appl. Math. Model., 48, 423–439, (2017). [12] M. H. Alavidoost, H. Babazadeh, and S. T. Sayyari, “An interactive
fuzzy programming approach for bi-objective straight and U-shaped
assembly line balancing problem,” Appl. Soft Comput. J., 40, 221–
235, (2016).
[13] P. and P. S. Sivasankaran, “Modelling hybrid single model assembly
line balancing problem,” The Journal for Practising Managers, 37
(1), 26–36 (2013).
[14] R. M. A. Hamza and J. Y. Al-manaa, “Selection of Balancing
Method for Manual Assembly Line of Two Stages Gearbox,” Glob.
Perspect. Eng. Manag., 2 (2), 70–81, (2013).
[15] S. T. Ghutukade and Dr. Suresh M. Sawant, “Use of Ranked Position Weighted Method for,” Int. J. Adv. Eng. Res. Stud., 5–7, (2013).