Embed Size (px)
Citation preview

December 2014, vol 11, No. 2Journal of Occupational Safety and Health
47
Lot 1, Jalan 15/1, Section 15, 43650 Bandar Baru Bangi, Selangor Darul Ehsan.Tel : 03-8769 2100 Fax : 03-8926 2900
www.niosh.com.my
National Institute of Occupational Safety and Health
Ministry of Human Resources
National Institute of Occupational Safety and Health (NIOSH)
Ministry of Human Resources Malaysia
Institut Keselamatan dan Kesihatan Pekerjaan Negara
Kementerian Sumber Manusia
December 2014, Vol 11, No 2ISSN 1675-5456
PP13199/12/2012 (032005)
Journal Of OccupationalSafety And Health

Journal of Occupational Safety and HealthDecember 2014, vol 11, No. 2
48
Journal of Occupational
Safety and Health
Editor-in-chief Ir. Haji Rosli bin Husin
Executive Director NIOSH, Malaysia
Editorial Board Y Bhg. Dato’ Prof Ir. Dr. Ibrahim Hussein Universiti Tenaga Nasional (UNITEN), Malaysia Prof. Madya Dr. Ismail Bahari Lynas Malaysia Sdn Bhd, Malaysia Dr. Krishna Gopal Rampal Perdana University Graduate School of Medicine, Malaysia Dr. Abu Hasan Samad Allianze University College of Medical Sciences, Malaysia Mr. Andrew Anthony Joseph Arul OSH Consultant, Malaysia Dr. Jeffereli Shamsul Bahrin BASF Asia-Pacific Service Centre Sdn. Bhd. Prof Madya Dr. Shamsul Bahari Shamsudin University Malaysia Sabah, Malaysia
Editorial Management Committee Ayop Salleh NIOSH, Malaysia Fadzil Osman NIOSH, Malaysia Tn Haji Mohd Esa Baruji NIOSH, Malaysia Khairunizam Mustapa NIOSH, Malaysia Reamy Md Zein NIOSH, Malaysia Amiruddin Abdul Aziz NIOSH, Malaysia
Secretariat
Saupi Nazri Mamat Roslina Md Husin Nor Akmar Yussuf
Siti Badariah Abu Bakar
The Journal
- Aims to serve as a forum for the sharing of research findings and information across broad areas in Occupational Safety and Health.
- Publishes original research reports, topical article reviews, book reviews, case reports, short communications, invited editorial and letters to editor.
- Welcomes articles in Occupational Safety and Health related fields.

December 2014, vol 11, No. 2Journal of Occupational Safety and Health
87
Journal of OccupationalSafety and Health
Vol. 11 No. 2December 2014
Contents
1. Cumulative Occupational Exposure Assessment for Mineral Dust Using Finnish Job-Exposure Matrix (FINJEM)Fauziah Nordin , Frank de Vocht , Richard Booton , Philip Barber, Katie McCalman , Andrew Povey
2. Issues On Occupational Safety And Health At Workplace Among Older Fishermen In MalaysiaMohd Rizal Hussain, Anita Abd Rahman, Rosnah Mohd Yusuff, Nabilah Latif, Sharifah Norazizan Syed Abd Rashid & Haslinda Abdullah
3. Occupational Heat Stress And Physiology Parameters Of Male Workers In A Steel Plant Factory At Pasir Gudang, JohorShamsul B.S.1 and Dubashini N.2
4. EFFECT OF PESTICIDES ON ACTIVITIES OF Alanine aminotransferase (ALAT) AND γ-glutamyltranspeptidase (GGT) IN BLOOD AMONG VEGETABLES FARMER IN MUAR, JOHOR, MALAYSIAShamsul B.S.1 and Hang Yap T.2
5. DNA Changes in Lymphocytes among Malaysian Traffic Police Officers Exposed to Air PollutantsNur S Sulaiman. 1 & Zurahanim F.A. 1
47-56
57-62
63-68
69-76
77-82
i

Journal of Occupational Safety and HealthDecember 2014, vol 11, No. 2
88ii
Introducing the Journal ofOccupational Safety and Health
From the Editor in Chief
The National Institute of Occupational Safety and Health (NIOSH) is delighted to announce the publication of Journal of Occupational Safety and Health.(JOSH).
JOSH is devoted to enhancing the knowledge and practice of occupational safety and health by widely disseminating research articles and applied studies of highest quality.
JOSH provides a solid base to bridge the issues and concerns related to occupational safety and health. JOSH offers scholarly, peer-reviewed articles, including correspondence, regular papers, articles and short reports, announcements and etc.
It is intended that this journal should serve the OSH community, practitioners, students and public while providing vital information for the promotion of workplace health and safety.
Apart from that JOSH aims:
• To promote debate and discussion on practical and theoretical aspects of OSH
• To encourage authors to comment critically on current OSH practices and discuss new concepts and emerging theories in OSH
• To inform OSH practitioners and students of current issues
JOSH is poised to become an essential resource in our efforts to promote and protect the safety and health of workers.
Workplace safety is a priority. Much needs to be done to encourage employees, employers and industries to put occupational safety and health at the top of their agenda. The most important thing is our commitment in taking action; our commitment to make the necessary changes to ensure that safety is at the forefront of everyone’s thinking.
The Journal of Occupational Safety and Health, (JOSH) the first to be published in Malaysia, aims to boost awareness on safety and health in the workplace.
It is no longer sufficient to simply identifying the hazards and assessing the risks. We aim to increase understanding on the OSH management system. We aim to strengthen commitment to workplace safety and better working conditions. We believe these aims can be achieved through participations and involvement from every industry.
We hope the contents of the journal will be read and reviewed by a wider audience hence it will have a broader academic base, and there should be an increased cumulative experience to draw on for debate and comment within the journal.
It is our hope that the journal will benefit all readers, as our purpose is to serve the interest of everybody from all industries. Prime Focus will be on issues that are of direct relevance to our day-to-day practices.
I would personally like to take this opportunity to welcome all our readers and contributors to the first issue of the journal. I look forward to receive contributions from the OSH community in Malaysia and elsewhere for our next issues.
Ir. Hj. Rosli Bin HusinEditor-in-chief

December 2014, vol 11, No. 2Journal of Occupational Safety and Health
47
Introduction
Occupational exposure is an important risk factor for respiratory ill-health, which includes lung cancer and Chronic Obstructive Pulmonary Diseases (COPD). Mineral dust is one of the most occupational respiratory toxins which can lead to occupational lung diseases. Mineral dust particularly asbestos is classified by IARC as carcinogenic to humans1 because it is thought to cause lung cancer. Previous epidemiologic studies also show strong associations between asbestos or other mineral dusts (OMD) exposure and respiratory health risk2,3,4. The importance of asbestos and other mineral dusts for the development of respiratory symptoms and airflow obstruction has been well established as reported in population-based study5.
Lung cancer is often accompanied by a variety of pathological changes within the adjacent lung. Recent studies have suggested a central role of chronic inflammation in the pathogenesis of both COPD and lung
cancer. Exposure to occupational toxicants, includes mineral dusts; induces the inflammatory process which releases inflammatory cells leading to alveolar wall destruction and mucus hypersecretion. The shared mechanisms of chronic inflammation in both diseases, or in the progression of COPD increases the susceptibility for lung tumorigenesis up to 4.5-fold6.
There is an increased risk of lung cancer associated with airway obstruction (lower percentage of forced expiratory volume in one second (FEV1) predicted). Higher risk of getting lung cancer was found among patients with severe airway obstruction, ie with an FEV1 < 40% of predicted (OR, 95% CI = 9.6, 1.5-60.1)7.
Occupational inhaled harmful particles have been known to play a role in several lung diseases, including chronic obstructive pulmonary disease (COPD) and lung cancer. The magnitude of the associations differs across studies. Differences in the sources and physical or chemical properties of asbestos or OMD exposure, level
Cumulative Occupational Exposure Assessment for Mineral Dust Using Finnish Job-Exposure Matrix (FINJEM)
Fauziah Nordin1,3, Frank de Vocht1, Richard Booton2, Philip Barber2, Katie McCalman2, Andrew Povey1
1Centre for Occupational & Environmental Health, Faculty of Medical & Human Sciences, The University of Manchester, United Kingdom 2North West Lung Centre, Wythenshawe Hospital, Manchester, United Kingdom
3Institute for Public Health, Ministry of Health Malaysia, WP Kuala Lumpur, Malaysia
Corresponding author: Dr Fauziah Nordin, Institute for Public Health, Ministry of Health Malaysia, Jalan Bangsar, 50590 WP Kuala Lumpur, Malaysia (Tel: +60322979400, Fax: +60322823114, email: [email protected] )
______________________________________________________________________________
Abstract
Mineral dust is classified by International Agency for Research on Cancer (IARC) as carcinogenic to humans because it is thought to cause lung cancer. Studies show strong associations between asbestos or other mineral dusts (OMD) exposure and respiratory health risk. The aim of the study was to examine the relationship between airflow obstruction (AFO) and cumulative occupational exposure to mineral dust, using the Finnish Job Exposure Matrix (FINJEM), in a population historically at high risk of lung cancer. The quantitative estimation of cumulative exposure to asbestos and OMD were calculated using the FINJEM from the data obtained at the baseline assessment in the Wythenshawe Respiratory Health Study (WRHS). The study was a population-based observational cohort study comprises all patients, aged 50- 75, registered with a General Practitioner (GP) practices in Wythenshawe District, Manchester. Among 257 study subjects who were assessed at baseline, 165 (64.2%) reported that they have been exposed to any occupational hazards, 56 (21.8% subcohort exposed) to asbestos and 42 (16.3% subcohort exposed) to OMD. There was a significant positive correlation between occupational exposure to OMD (Pearson correlation coefficient, r = 0.47, p = 0.01). They were 5 times higher risk to get airflow obstruction among those who have been exposed to low level of asbestos compared to non-exposed, after adjustment for gender, age and smoking (adjusted Odds Ratio (aOR) = 5.76, 95% Confidence Interval (CI) = 1.37 – 24.1). However, no significant association was found between level of exposure to OMD and airflow obstruction. It is suggested that workplace exposure to mineral dusts is sufficient to produce measurable airflow obstruction evidence of occupational respiratory ill-health. The findings from this study supports the FINJEM could be used in epidemiological study and a potential cost-effective exposure assessment particularly in examining the relationship between cumulative occupational exposures with respiratory ill-health.
_____________________________________________________________________________
December 2014, vol 11, No. 2 : 47-56
Journal of Occupational Safety and HealthDecember 2014, vol 11, No. 2
48
of exposure and the prevalence or airflow obstruction (AFO) among the studied population may contribute to heterogeneity in exposure-response relationship between studies. Large potential of misclassification of biologically significant exposure hinder detection of true elevated exposure-response relationships. The frequently lacking information on smoking habits in workers cohorts may lead to inaccurate risk estimates because of the prevailing role of smoking in respiratory ill-health patients8.
Occupational exposure assessment in population-based study gives a major challenge due to the wide range of occupations in different types of industries involved. Previous studies investigated the association between occupational exposures and risk of developing respiratory ill-health which includes COPD and lung cancer proved to show the links by using the general population Job-Exposure Matrix (JEM)5,9,10. The Finnish Job-Exposure Matrix (FINJEM) is a tool yielding quantitative estimation of cumulative occupational exposure which represents a potentially cost-effective exposure assessment tool11. Moreover, it is applied since the previous exposure assessment at individual’s level was not available in the study population. This paper is deemed to justify further analysis using the FINJEM-based method to study relationship between mineral dust exposure and airflow obstruction thus may assist in targeting a high risk population for lung cancer screening in the primary care setting.
The aim of the study was to examine the relationship between airflow obstruction (AFO) and cumulative occupational exposure to mineral dust, using the Finnish Job Exposure Matrix (FINJEM), in a population historically at high risk of lung cancer. To achieve these aims, the estimation of exposure to asbestos and other mineral dusts (OMD) were calculated using the Finnish Job-Exposure Matrix (FINJEM) from the data obtained at the baseline assessment in the Wythenshawe Respiratory Health Study (WRHS). The extent of exposure assessment thus looking at the association between airflow obstruction and occupational exposure were explored.
Methodology
Study population
Participants were part of the Wythenshawe Respiratory Health Study (WRHS) 2010, which looked for an early detection of respiratory ill-health in high risk populations. WRHS was a population-based observational cohort study comprises all patients, aged 50- 75, registered with a GP practices in Wythenshawe District, Manchester. Data on life-time occupational history was captured from the job questionnaire interviewed at the baseline study assessment. Occupation was initially coded according to the Standard Occupational Classification (2000)33, using self-reported information on job title, type of work, type of company,
period of employment and type of exposure. Exposure estimates were calculated based on occupation-specific estimates and the distribution of occupations within industries.
FINJEM was used to assign exposure information to individual workers. For each year of the total occupational history of each individual in the dataset, exposure was estimated using the time specific exposure information for occupational groups according to code of occupation (oCODE)12,13,14. All the information of every subjects were coded and calculated for the average exposure estimation in the excel database constructed for this study before transferred to SPSS database for descriptive and statistical tests analysis.
Statistical Analysis
Those workers exposed to inorganic mineral dust were analysed to look at the quantitative estimation of cumulative exposure of each subjects. Log transformed using the natural log function was carried out to create a new variable to reduce skewness for further analysis, for both quantitative data on cumulative exposure to asbestos and OMD. Pearson Chi-squared tests were used to test an association between different level of occupational exposure and outcome measure, airflow obstruction (AFO). Linear regression analysis was performed to assess the relationship between the forced expiratory volume in one second (FEV1 % predicted) and log-transformed cumulative occupational exposure to asbestos and OMD.
Multivariate analysis of airflow obstruction and the occupational exposure with potential confounders were then carried out using multiple linear regression (MLR) and the results are presented as Pearson correlation coefficient, r and the overall p -value. Statistical significance was assumed at p < 0.05.
Results
Among 257 study subjects who were seen and been interviewed at baseline, 165 (64.2%) reported that they have been exposed to any occupational hazards with different type of exposure to cancer-causing agents, namely dust, mist and/or fumes, mineral and/or chemicals and ionizing radiation or radioactive materials at some times in their working lives.
Occupational Exposure to Asbestos
With regards to asbestos exposure, 56 (21.8% subcohort exposed) subjects reported ever been exposed to asbestos. Based on FINJEM’s code of occupation (aCODE), 21 occupational subgroups were found to be exposed to asbestos in this study. Most often reported jobs were metal smelting furnacemen, aCODE 630 subgroups (n = 27, 12.9%) followed by occupations in manufacturing, aCODE 759 (n = 25, 12.0%). Other subgroups are distributed in table 1.

December 2014, vol 11, No. 2Journal of Occupational Safety and Health
49
Table 1. Code of occupation (aCODE) and the list of occupation with exposure to asbestos based on FINJEM for exposed study subjects
8
Table 1. Code of occupation (aCODE) and the list of occupation with exposure to asbestos based on FINJEM for exposed study subjects
aCODE
List of occupations with asbestos exposure
n
%
400
490
530
630
651
652
653
654
655
660
663
680
690
695
697
698
699
736
759
770
781
Miners, shot firers etc. Miners and quarrymen, nec Railway engine and lorry drivers, steam engine firemen Metal smelting furnacemen Fitter-assemblers etc. Machine and engine mechanics Sheet metal workers Plumbers Welders and flame cutters Electricians Electronics and telecommunications Workmen Painters, lacquerers and floor layers Bricklayers, plasterers and tile setters Insulation workers Assisting building workers Assisting construction workers, nec Building occupations, nec Refinery workers, other occupations in the chemical industry Occupations in manufacturing, nec Crane operators etc. Warehousemen
5 1 8
27
16 4 7 1 6
12 7 9
16 7
19
15
12 1
25 8 3
2.4
0.5
3.8
12.9
7.7
1.9
3.3
0.5
3.0
5.7
3.3
4.3
7.7
3.3
9.1
7.2
5.7
0.5
12.0
3.8
1.4

Journal of Occupational Safety and HealthDecember 2014, vol 11, No. 2
50
Table 2 shows the summary of occupational exposure to asbestos among the study subjects. The mean of total years exposed was 24.1 ± 15.6 years with the mean cumulative exposure of 199.1 ± 342.2 f/cm3. Average exposure ranged from 0.1 f/cm3 to 47.1 f/cm3
with a mean of 10.0 ± 11.6 f/cm3.
Occupational Exposure to Other Mineral Dusts (OMD)
When looking at the exposure to other mineral dusts (OMD), 42 (16.3% subcohort exposed) subjects reported ever been exposed to OMD. Based on FINJEM’s code of occupation (aCODE), 12 occupational subgroups were found to be exposed to OMD in this study. Most
often reported jobs were assisting construction workers, aCODE 698 subgroups (n = 34, 22.1%) followed by assisting building workers, aCODE 697 (n = 27, 17.5%) and occupations in smelting, metallurgical and foundry work, aCODE 639 (n = 25, 16.2%). Other occupational subgroups are distributed in table 3.
Table 4 shows the summary of occupational exposure to OMD among the study subjects. The mean of total years exposed was 21.9 ± 14.6 years with the mean cumulative exposure of 3888.5 ± 3711.6 mg/m³. Average exposure ranged from 11.2 mg/m³ to 370.0 mg/m³, with a mean of 173.9 ± 91.6 mg/m³.
Table 2. Summary of total years, cumulative exposure and average occupational exposure to asbestos
Table 3. Code of occupation (aCODE) and the list of occupation with exposure to other mineral dusts (OMD) based on FINJEM for exposed study subjects
9
Table 2 shows the summary of occupational exposure to asbestos among the
study subjects. The mean of total years exposed was 24.1 ± 15.6 years with the
mean cumulative exposure of 199.1 ± 342.2 f/cm3. Average exposure ranged
from 0.1 f/cm3 to 47.1 f/cm3 with a mean of 10.0 ± 11.6 f/cm3.
Table 2. Summary of total years, cumulative exposure and average occupational exposure to asbestos
Occupational exposure to asbestos
Mean ± SD
Range
Total years (years) Cumulative Exposure (f/cm3) Average Exposure (f/cm3)
24.1 ± 15.6
199.1 ± 342.2
10.0 ± 11.6
1.0 – 47.0
2.4 – 2212.3
0.1 – 47.1
3.2. Occupational Exposure to Other Mineral Dusts (OMD)
When looking at the exposure to other mineral dusts (OMD), 42 (16.3%
subcohort exposed) subjects reported ever been exposed to OMD. Based on
FINJEM’s code of occupation (aCODE), 12 occupational subgroups were
found to be exposed to OMD in this study. Most often reported jobs were
assisting construction workers, aCODE 698 subgroups (n = 34, 22.1%)
followed by assisting building workers, aCODE 697 (n = 27, 17.5%) and
occupations in smelting, metallurgical and foundry work, aCODE 639 (n = 25,
16.2%). Other occupational subgroups are distributed in table 3.
Table 4 shows the summary of occupational exposure to OMD among the
study subjects. The mean of total years exposed was 21.9 ± 14.6 years with the
10
mean cumulative exposure of 3888.5 ± 3711.6 mg/m³. Average exposure
ranged from 11.2 mg/m³ to 370.0 mg/m³, with a mean of 173.9 ± 91.6 mg/m³.
Table 3. Code of occupation (aCODE) and the list of occupation with exposure to other mineral dusts (OMD) based on FINJEM for exposed study subjects
aCODE
List of occupations with other mineral dusts (OMD) exposure
n
%
410
630
639
690
695
697
698
699
719
736
758
831
Well drilling and quarrying Metal smelting furnacemen Occupations in smelting, metallurgical and foundry work, nec Bricklayers, plasterers and tile setters Insulation workers Assisting building workers Assisting construction workers, nec Building occupations, nec Occupations related to glass, ceramic and fine earthenware, nec Refinery workers, other occupations in the chemical industry Concrete-mixer operators and cast concrete product workers Charworkers
3
19
25
17 6
27
34 3 2 2 3
13
2.0
12.3
16.2
11.0
4.0
17.5
22.1
1.9
1.3
1.3
2.0
8.4
Table 4. Summary of total years, cumulative exposure and average occupational exposure to other mineral dusts (OMD)
Occupational exposure to other mineral dusts (OMD)
Mean ± SD
Range
Total years (years)
Cumulative Exposure (mg/m³)
Average Exposure (mg/m³)
21.9 ± 14.6
3888.5 ± 3711.6
173.9 ± 91.6
1.0 – 47.0
240.0 – 13980.0
11.2 – 370.0

December 2014, vol 11, No. 2Journal of Occupational Safety and Health
51
Relationship Between Airflow Obstruction and Occupational Exposure to Asbestos
The relationship between airflow obstruction (percentage of FEV1 predicted) with log average estimated asbestos exposure at the workplace was explored by using a multiple linear regression model with adjustment for confounding factors (age, sex, smoking status).
Multiple Linear Regression of Relationship Between Airflow Obstruction and Occupational Exposure to Asbestos
The scatterplot in figure 1 suggests a dose-response relationship between occupational exposure to asbestos and respiratory ill-health by looking at the airflow obstruction. The percentage of FEV1 predicted levels decreased with an increase of asbestos exposure, however it was not statistically significant (Pearson correlation coefficient, r = 0.19, p = 0.26) (Figure 1).
Airflow Obstruction and Occupational Exposure to Asbestos Comparing Smokers and Non-smokers
Both figure 2 and 3 compare the relationship between airflow obstruction (percentage of FEV1 predicted) and
log-transformed cumulative occupational exposure to asbestos among smokers comparing to non-smokers. No significant difference were found in both groups; smokers (Pearson correlation coefficient, r = 0.11, p = 0.53) vs. non-smokers (r = 0.56, p = 0.15).
Table 4. Summary of total years, cumulative exposure and average occupational exposure to other mineral dusts (OMD)
10
mean cumulative exposure of 3888.5 ± 3711.6 mg/m³. Average exposure
ranged from 11.2 mg/m³ to 370.0 mg/m³, with a mean of 173.9 ± 91.6 mg/m³.
Table 3. Code of occupation (aCODE) and the list of occupation with exposure to other mineral dusts (OMD) based on FINJEM for exposed study subjects
aCODE
List of occupations with other mineral dusts (OMD) exposure
n
%
410
630
639
690
695
697
698
699
719
736
758
831
Well drilling and quarrying Metal smelting furnacemen Occupations in smelting, metallurgical and foundry work, nec Bricklayers, plasterers and tile setters Insulation workers Assisting building workers Assisting construction workers, nec Building occupations, nec Occupations related to glass, ceramic and fine earthenware, nec Refinery workers, other occupations in the chemical industry Concrete-mixer operators and cast concrete product workers Charworkers
3
19
25
17 6
27
34 3 2 2 3
13
2.0
12.3
16.2
11.0
4.0
17.5
22.1
1.9
1.3
1.3
2.0
8.4
Table 4. Summary of total years, cumulative exposure and average occupational exposure to other mineral dusts (OMD)
Occupational exposure to other mineral dusts (OMD)
Mean ± SD
Range
Total years (years)
Cumulative Exposure (mg/m³)
Average Exposure (mg/m³)
21.9 ± 14.6
3888.5 ± 3711.6
173.9 ± 91.6
1.0 – 47.0
240.0 – 13980.0
11.2 – 370.0
Figure 1. Relationship between airflow obstruction and occupational exposure to asbestos
Figure 2. Relationship between airflow obstruction and occupational exposure to asbestos among smokers
Figure 3. Relationship between airflow obstruction and occupational exposure to asbestos among non-smokers
11
3.3. Relationship Between Airflow Obstruction and Occupational
Exposure to Asbestos
The relationship between airflow obstruction (percentage of FEV1 predicted)
with log average estimated asbestos exposure at the workplace was explored by
using a multiple linear regression model with adjustment for confounding
factors (age, sex, smoking status).
3.3.1. Multiple Linear Regression of Relationship Between Airflow
Obstruction and Occupational Exposure to Asbestos
The scatterplot in figure 1 suggests a dose-response relationship between
occupational exposure to asbestos and respiratory ill-health by looking at the
airflow obstruction. The percentage of FEV1 predicted levels decreased with an
increase of asbestos exposure, however it was not statistically significant
(Pearson correlation coefficient, r = 0.19, p = 0.26) (Figure 1).
Figure 1. Relationship between airflow obstruction and occupational exposure to asbestos
12
3.3.2. Airflow Obstruction and Occupational Exposure to Asbestos
Comparing Smokers and Non-smokers
Both figure 2 and 3 compare the relationship between airflow obstruction
(percentage of FEV1 predicted) and log-transformed cumulative occupational
exposure to asbestos among smokers comparing to non-smokers. No
significant difference were found in both groups; smokers (Pearson correlation
coefficient, r = 0.11, p = 0.53) vs. non-smokers (r = 0.56, p = 0.15).
3.3.3. Airflow Obstruction by Level of Exposure to Asbestos
To assess the risk of airflow obstruction at level of asbestos exposure, the data
were further categorised into different level. Since there is no clear definition
Figure 2. Relationship between airflow obstruction and occupational exposure to asbestos among smokers
Figure 3. Relationship between airflow obstruction and occupational exposure to asbestos among non-smokers

Journal of Occupational Safety and HealthDecember 2014, vol 11, No. 2
52
Airflow Obstruction by Level of Exposure to Asbestos
To assess the risk of airflow obstruction at level of asbestos exposure, the data were further categorised into different level. Since there is no clear definition on different level of an elevated asbestos exposure, the data were ranked and divided into tertiles; (low, medium or high) according to an average of cumulative occupational asbestos exposure estimated in fibres per cubic centimetre of air (f/cm3).
There was strong association found between level of exposure to asbestos and airflow obstruction. They were 4.40 times higher risk to get airflow obstruction compared to non exposed among those who have been exposed to low level of asbestos (95% CI = 1.53 – 12.6). After adjustment for gender, age and smoking, the risk became higher (aOR = 5.76, 95% CI = 1.37 – 24.1) (Table 5). No significant association was found between airflow obstruction and those who have been exposed to medium level. However, those who have been exposed to high level of asbestos was 6.45 times higher risk to get airflow obstruction compared to non exposed (95% CI = 1.54 – 27.0).
Relationship Between Airflow Obstruction and Occupational Exposure to Other Mineral Dusts (OMD)
The relationship between airflow obstruction (percentage of FEV1 predicted) with log average estimated other mineral dusts (OMD) exposure at the workplace was explored by using a multiple linear regression model with adjustment for confounding factors (age, sex, smoking status).
Multiple Linear Regression of Relationship Between Airflow Obstruction and Occupational Exposure to Other Mineral Dusts (OMD)
The scatterplot in figure 4 suggests a dose-response relationship between occupational exposure to other mineral dusts (OMD) and respiratory ill-health by looking at the airflow obstruction.
Surprisingly, there was a significant positive correlation between occupational exposure to other mineral dusts (OMD). The percentage of FEV1 predicted levels increased with an increase of OMD exposure, (Pearson correlation coefficient, r = 0.47, p = 0.01). The coefficient of determination, R2 = 0.157; indicating that as OMD exposure increase, percentage of FEV1
predicted also increase by 15.7%. (Figure 4)
Airflow Obstruction and Occupational Exposure to Other Mineral Dusts (OMD) Comparing Smokers and Non-smokers
Both figure 5 and 6 show the relationship between airflow obstruction (percentage of FEV1 predicted) and log-transformed cumulative occupational exposure to OMD among smokers comparing to non-smokers. A weak relationship was found among smokers (Pearson
Table 5. Airflow obstruction by level of exposure to asbestos
13
on different level of an elevated asbestos exposure, the data were ranked and
divided into tertiles; (low, medium or high) according to an average of
cumulative occupational asbestos exposure estimated in fibres per cubic
centimetre of air (f/cm3).
There was strong association found between level of exposure to asbestos and
airflow obstruction. They were 4.40 times higher risk to get airflow obstruction
compared to non exposed among those who have been exposed to low level of
asbestos (95% CI = 1.53 – 12.6). After adjustment for gender, age and
smoking, the risk became higher (aOR = 5.76, 95% CI = 1.37 – 24.1) (Table
5). No significant association was found between airflow obstruction and those
who have been exposed to medium level. However, those who have been
exposed to high level of asbestos was 6.45 times higher risk to get airflow
obstruction compared to non exposed (95% CI = 1.54 – 27.0).
Table 5. Airflow obstruction by level of exposure to asbestos
Level of exposure (N=228)
Airflow
obstruction Yes/ No (% Yes)
Crude Odds
Ratio (95% CI)a
Adjusted Odds
Ratio (95% CI)a
Asbestos exposure Nob Low Medium High
25/157 (13.7) 7/ 10 (41.2) 6/ 11 (35.3) 6/ 6 (50.0)
1* 4.40 (1.53 – 12.6) 3.43 (1.16 – 10.1) 6.28 (1.88 – 21.0)
1* 5.76 (1.37 – 24.1) 3.71 (0.94 – 14.7) 6.45 (1.54 – 27.0)
aOdds ratio is incidence of Airflow Obstruction (AFO) in level of exposure to asbestos group versus incidence in subjects in groupb dAdjusted odds ratio (aOR) for gender, age and smoking *significant association, p <0.05 obtained using chi-square test
Figure 4. Relationship between airflow obstruction and occupational exposure to other mineral dusts (OMD)
14
3.4. Relationship Between Airflow Obstruction and Occupational
Exposure to Other Mineral Dusts (OMD)
The relationship between airflow obstruction (percentage of FEV1 predicted)
with log average estimated other mineral dusts (OMD) exposure at the
workplace was explored by using a multiple linear regression model with
adjustment for confounding factors (age, sex, smoking status).
3.4.1. Multiple Linear Regression of Relationship Between Airflow
Obstruction and Occupational Exposure to Other Mineral Dusts (OMD)
The scatterplot in figure 4 suggests a dose-response relationship between
occupational exposure to other mineral dusts (OMD) and respiratory ill-health
by looking at the airflow obstruction.
AAvveerraaggee EEssttiimmaatteedd OOMMDD EExxppoossuurree
Figure 4. Relationship between airflow obstruction and occupational exposure to other mineral dusts (OMD)

December 2014, vol 11, No. 2Journal of Occupational Safety and Health
53
correlation coefficient, r = 0.36, p = 0.06) but not among non-smokers (r = 0.68, p = 0.21).
Airflow Obstruction by Level of Exposure to Other Mineral Dusts (OMD)
Similar to asbestos exposure, the data on other mineral dusts (OMD) exposure were further categorised into different level and been ranked and divided into tertiles; low, medium or high according to average of cumulative occupational OMD exposure estimated in milligram per cubic meter of air (mg/m3).
They were 8 times higher risk to get airflow obstruction compared to non exposed among those who have been exposed to low level of other mineral dusts (OMD) (95% CI = 2.65 – 28.2), However, no significant association was found after adjustment for gender, age and smoking (Table 6).
Table 6. Airflow obstruction by level of exposure to other mineral dusts (OMD)
16
3.4.3. Airflow Obstruction by Level of Exposure to Other Mineral Dusts
(OMD)
Similar to asbestos exposure, the data on other mineral dusts (OMD) exposure
were further categorised into different level and been ranked and divided into
tertiles; low, medium or high according to average of cumulative occupational
OMD exposure estimated in milligram per cubic meter of air (mg/m3).
Table 6. Airflow obstruction by level of exposure to other mineral dusts (OMD)
Level of exposure
(N=228)
Airflow
obstruction Yes/ No (% Yes)
Crude Odds
Ratio (95% CI)a
Adjusted Odds
Ratio (95% CI)a
OMD exposure Nob Low Medium High
30/162 (15.6) 8/ 5 (61.5) 1/ 8 (11.1) 5/ 9 (35.7)
1* 8.64 (2.65 – 28.2) 0.68 (0.08 – 5.60) 3.00 (0.94 – 9.57)
1
7.18 (1.70 – 30.3) 0.23 (0.02 – 2.34) 1.17 (0.27 – 5.15)
aOdds ratio is incidence of Airflow Obstruction (AFO) in level of exposure to OMD group versus incidence in subjects in groupb dAdjusted odds ratio (aOR) for gender, age and smoking *significant association, p <0.05 obtained using chi-square test
They were 8 times higher risk to get airflow obstruction compared to non
exposed among those who have been exposed to low level of other mineral
dusts (OMD) (95% CI = 2.65 – 28.2), However, no significant association was
found after adjustment for gender, age and smoking (Table 6).
4. DISCUSSION
This study was designed to investigate the relationship between airflow
obstruction (AFO) and cumulative occupational exposure to mineral dusts,
Figure 5. Relationship between airflow obstruction and occupational exposure to other mineral dust (OMD) among smokers
Figure 6. Relationship between airflow obstruction and occupational exposure to other mineral dust (OMD) among non-smokers
15
Surprisingly, there was a significant positive correlation between occupational
exposure to other mineral dusts (OMD). The percentage of FEV1 predicted
levels increased with an increase of OMD exposure, (Pearson correlation
coefficient, r = 0.47, p = 0.01). The coefficient of determination, R2 = 0.157;
indicating that as OMD exposure increase, percentage of FEV1 predicted also
increase by 15.7%. (Figure 4)
3.4.2. Airflow Obstruction and Occupational Exposure to Other
Mineral Dusts (OMD) Comparing Smokers and Non-smokers
Both figure 5 and 6 show the relationship between airflow obstruction
(percentage of FEV1 predicted) and log-transformed cumulative occupational
exposure to OMD among smokers comparing to non-smokers. A weak
relationship was found among smokers (Pearson correlation coefficient, r =
0.36, p = 0.06) but not among non-smokers (r = 0.68, p = 0.21).
Figure 5. Relationship between airflow obstruction and occupational exposure to other mineral dust (OMD) among smokers
Figure 6. Relationship between airflow obstruction and occupational exposure to other mineral dust (OMD) among non-smokers

Journal of Occupational Safety and HealthDecember 2014, vol 11, No. 2
54
Discussion
This study was designed to investigate the relationship between airflow obstruction (AFO) and cumulative occupational exposure to mineral dusts, using the Finnish Job Exposure Matrix (FINJEM), in a population historically at high risk of lung cancer.
Based on our findings, occupation-specific exposure prevalence shows metal smelting furnacemen (aCODE 630) entailing highest exposure to asbestos and assisting construction workers (aCODE 698) involving highest exposure to other mineral dusts as given by FINJEM in the study population. The FINJEM was found to assign different cumulative exposures based on the occupational history in the population-based study. The advantages of using job-exposure matrix in estimating exposure for epidemiological studies has been described and discussed in previous studies10,11,12,14. Without having industrial hygiene measurement data with traditional exposure information in this study, estimated cumulative exposure could be measured to determine whether occupational exposure to asbestos and OMD are associated to an airflow obstruction. The same application using FINJEM have been used in previous studies looking at the chronic diseases and cumulative occupational exposure15,16,17. Our findings are consistent with the studies which show that metal smelting furnacemen and workers exposed to metal dusts and foundry fumes have a higher exposure to asbestos18,19,20. Similarly, assisting or people who involve in construction workers have a higher exposure to cement and other mineral dusts with provision of industrial hygiene measurement and personal sampling of those hazards at the workplace21,22.
We found there were 21.8% subcohort exposed subjects reported ever been exposed to asbestos at some times in their working lives in this study. Similar findings on the prevalence of ever exposed to asbestos were found ranged from 13.1 to 24.5% in population-based studies conducted in France23 and Central and Eastern European countries4. Asbestos has been used in so many ways since so many years and many workers in various occupation groups were involved and exposed to asbestos worldwide. It is consistent to the WHO report with estimation of 125 million people occupationally exposed to asbestos globally every year24 and also the report by OSHA, NIOSH that estimated 1.3 million employees particularly in construction and general industry in the USA face significant asbestos exposure on the job25.
There were 16.3% subcohort exposed subjects reported ever been exposed to other mineral dusts (OMD) in the study. The operational definition following to the Finnish Job-Exposure Matrix (FINJEM), exposure to other mineral dusts (OMD) was defined as occupational, inhalatory exposure to mineral dusts (eg, silicates, amorphous silica, stone, granular talc, clay, cement) except pure quartz, asbestos or manmade mineral fibres (MMMF)12,13. The limitation in estimating the exposure
using FINJEM was we were unable to describe each type of defined OMD and only discuss on the finding found for a group of OMD. However, WHO global report and previous studies acknowledged the exposure to mineral dust is a significant occupational hazard in working populations worldwide, particularly among construction workers, concrete production and cement industry, etc, which need crucial monitoring on the exposure-related health problem as we were looked into in this study, the airflow obstruction among exposed subjects26, 27.
A strong association was found in this study between estimated cumulative exposure to asbestos and airflow obstruction. They were 5 times higher risk to get airflow obstruction among those who have been exposed to low level of asbestos compared to non-exposed. The findings demonstrate a negative relationship between occupational exposure to asbestos and airflow obstruction. However it was not statistically significant and not influenced by cigarette smoking. These data were in agreement with several recently expressed opinions which showed exposure to asbestos was more strongly associated with decreased lung parameters in spirometry test, while smoking was one of major contributing factor to reduced lung parameters, particularly FEV1/FVC21,28. A recent meta-analysis showed a similar opinion but stated that those reductions in lung parameters were found even in those workers without radiological changes3.
Unlike some previous studies which did not support a causal role of exposure to asbestos in the development of airflow obstruction28,30 presumably they focused on smokers and/or subjects with previously diagnosed asbestosis were included which possibly could contributed to the restrictive pattern in spirometry test. Although our study sample may not be representative of all people occupationally exposed to asbestos, the strength was the study population was selected from GP registered population in the study areas not merely for screening purposes.
In this study, we did not find any association between level of exposure to OMD and airflow obstruction after adjustment for gender, age and smoking. Those subjects who had an exposure to OMD did not have an increased risk of airflow obstruction and it was not in accordance with previous studies. A cohort study among male construction workers reported that occupational exposure to airborne inorganic dust (asbestos, man-made mineral fibres, dust from cement, concrete and quartz) increases mortality due to chronic obstructive pulmonary disease, even among never-smokers26,30. Another study also found similar finding and reported that cement workers seem to be at high risk of developing COPD caused by cumulative total dust exposure independent of smoking habit30,31, which support the theory that dust-induced obstructive lung diseases and smoke-induced obstructive lung problem occur through similar mechanism.

December 2014, vol 11, No. 2Journal of Occupational Safety and Health
55
The major strength of the present study is that we were able to measure the occupational exposure assessment in population-based study using the Finnish Job-Exposure Matrix (FINJEM)5,8. This retrospective assessment of the study subjects was based on their recorded occupations without any previous exposure assessment at individual’s21,32. Similar advantages were reported by previous studies which had been using this FINJEM as an objective tool for exposure assessment data which cover major physical, chemical, microbiological, ergonomics and psychosocial factors.
Conclusion
It is suggested that workplace asbestos exposure sufficient to produce measurable airflow obstruction evidence of asbestos-related respiratory ill-health. Importantly, we established that the reduction in lung parameters and hence causing an airflow obstruction as one of risk for lung cancer were found among those workers who have been exposed to asbestos at workplace. This is relevant for medical surveillance among those high risk workers.
This study supports using FINJEM as a potentially cost-effective exposure assessment particularly in examining the relationship between airflow obstruction and cumulative occupational exposure to lung carcinogens particularly asbestos and OMD in a population historically at high risk of lung cancer. It could be used not only in epidemiological studies but also serves as an information tool for policy making, risk assessment and hazard surveillance.
References
(1). International Labour Organization (ILO). The International Agency for Research on Cancer. Lists of IARC Evaluations According to IARC Monographs. IPCS, Geneva, 1993. Available from: http://www.ilo.org/public/english/protection/safework/cis/products/safetytm/iarclist.htm
(2). Guha N, Merletti F, Steenland NK, Altieri A, Cogliano V & Straif K. Lung Cancer Risk in Painters: A Meta-Analysis. Environ. Health Perspect. 2010; 118: 303–312.
(3). Wilken D, Garrido MV, Manuwald U & Baur X. Lung function in asbestos-exposed workers, a systematic review and meta-analysis. J. Occup. Med. Toxicol. Lond. Engl. 2011; 6: 21.
(4). Carel R, Olsson AC, Boffetta P. Occupational exposure to asbestos and man-made vitreous fibres and risk of lung cancer: a multicentre case-control study in Europe. Occup. Environ. Med. 2007; 64(8): 502–508.
(5). Matheson MC, Benke G, Raven J, Sim MR, Kromhout H, Vermeulen R, Johns DP, Walters &
Abramson MJ. Biological dust exposure in the workplace is a risk factor for chronic obstructive pulmonary disease. Thorax. 2005; 60: 645 –651.
(6). Yao H & Rahman I. Current concepts on the role of inflammation in COPD and lung cancer. Curr. Opin. Pharmacol. 2009; 9: 375–383.
(7). Kishi K, Gurney JW, Schroeder DR, Scanlon PD, Swensen SJ & Jett JR. The correlation of emphysema or airway obstruction with the risk of lung cancer: a matched case-controlled study. Eur. Respir. J. 2002; 19(6), 1093–1098.
(8). Lenters V, Vermeulen R & Heederik D. A Meta-analysis of Asbestos and Lung Cancer: Is Better Quality Exposure Assessment Associated with Steeper Slopes of the Exposure-Response Relationships. Environ. Health Perspect. 2011; 119(11): 1547–1555.
(9). Preller L, van den Bosch LMC, van den Brandt PA, Kauppinen T & Goldbohm A. Occupational exposure to silica and lung cancer risk in the Netherlands. Occup. Environ. Med. 2010; 67: 657 –663.
(10). Dosemeci M, Cocco P, Gómez M, Stewart PA & Heineman EF. Effects of three features of a job-exposure matrix on risk estimates. Epidemiol. Camb. Mass. 1994; 5: 124–127.
(11). Kauppinen, T., Toikkanen, J. & Pukkala, E. From cross-tabulations to multipurpose exposure information systems: a new job-exposure matrix. Am. J. Ind. Med. 1998; 33, 409–417.
(12). Kauppinen, T. Finnish Occupational Exposure Databases. Appl. Occup. Environ. Hyg. 2001; 16, 154–158.
(13). Pukkala, E. et al. National job-exposure matrix in analyses of census-based estimates of occupational cancer risk. Scand. J. Work. Environ. Health. 2005; 31, 97–107.
(14). Benke G, Sim M, Fritschi L & Aldred G. Beyond the job exposure matrix (JEM): the task exposure matrix (TEM). Ann. Occup. Hyg. 2000; 44: 475–482.
(15). Karipidis KK, Benke G, Sim MR, Fritschi L, Vajdic C, Kricker A & Armstrong B. Non-Hodgkin lymphoma and occupational radiation exposure assessed using local data. Occup. Med. Oxf. Engl. 2009; 59(6): 437–439.
(16). Karipidis KK, Benke G, Sim MR, Kauppinen T, Kricker A, Hughes AM, Brulich AE, Vajdic CM, Kaldor J, Armstrong B & Fritschi L. Occupational

Journal of Occupational Safety and HealthDecember 2014, vol 11, No. 2
56
exposure to ionizing and non-ionizing radiation and risk of non-Hodgkin lymphoma. Int. Arch. Occup. Environ. Health. 2007; 80(8): 663–670
(17). McElroy JA, Egan KM, Titus-Ernstoff L, Anderson HA, Trentham-Dietz A, Hampton JM, Newcomb PA. Occupational exposure to electromagnetic field and breast cancer risk in a large, population-based, case-control study in the United States. J. Occup. Environ. Med. Am. Coll. Occup. Environ. Med. 2007; 49(3): 266–274.
(18). Schwartz DA, Fuortes LJ, Galvin JR, Burmeister LF, Schmidt LE, Leistikow BN, Lamarte PL, and Merchant JA. Asbestos-induced Pleural Fibrosis and Impaired Lung function. Am. Rev. Respir. Dis. 1990; 141(2): 321–326.
(19). Ostiguy G, Vaillancourt C & Begin R. Respiratory health of workers exposed to metal dusts and foundry fumes in a copper refinery. Occup. Environ. Med. 1995; 52: 204–210.
(20). Teschke K, Morgan MS, Checkoway H, Franklin G, Spinelli JJ, van Belle G, Weiss NS. Mesothelioma surveillance to locate sources of exposure to asbestos. Can. J. Public Health. 1997; 88(3): 163–168.
(21). Bergdahl IA, Torén K, Eriksson K, Hedlund U, Nilsson T, Flodin R, Järvholm B. Increased mortality in COPD among construction workers exposed to inorganic dust. Eur. Respir. J. 2004; 23(3): 402–406.
(22). Peters S, Thomassen Y, Fechter-Rink E & Kromhout H. Personal exposure to inhalable cement dust among construction workers. J. Phys. Conf. Ser. 2009; 151.
(23). Goldberg M, Banaei A, Goldberg S, Auvert B, Luce D, Guéguen A. Past occupational exposure to asbestos among men in France. Scand. J. Work. Environ. Health 2000; 26(1), 52–61.
(24). The World Health Report 2006 - working together for health (WHO 2006) Available from: http://www.who.int/whr/2006/en/ [Accessed 2 June 2013]
(25). Asbestos. Workplace Safety and Health. The National Institute for Occupational Safety and Health (NIOSH). Centers for Disease Control and Prevention (CDC). Available from: http://www.cdc.gov/niosh/topics/asbestos/ [Accessed 15 June 2013]
(26). Hochgatterer K, Moshammer H & Haluza D. Dust Is in the Air: Effects of Occupational Exposure to Mineral Dust on Lung Function in a 9-year Study. Lung. 2013; 191: 257–263.
(27). GR Wagner. Screening and surveillance of workers exposed to mineral dusts. World Health Organization. WHO 2006. Available from: http://www.who.int/occupational_health/publications/mineraldust/en/ [Accessed 12 July 2013]
(28). Wang X, Yano E, Wang Z, Wang M & Christiani DC. Adverse effects of asbestos exposure and smoking on lung function. Am. J. Ind. Med. 2006; 49: 337–342.
(29). Van Loon AJ, Kant IJ, Swaen GM, Goldbohm RA, Kremer AM & Van Den Brandt PA Occupational exposure to carcinogens and risk of lung cancer: results from The Netherlands cohort study. Occup. Environ. Med. 1997; 54(11): 817–824.
(30). Churg A, Zay K & Li K. Mechanisms of mineral dust-induced emphysema. Environ. Health Perspect. 1997; 105: 1215–1218.
(31). Mwaiselage J, Bråtveit M, Moen BE & Mashalla Y. Respiratory symptoms and chronic obstructive pulmonary disease among cement factory workers. Scand. J. Work. Environ. Health. 2005; 31: 316–323.
(32). Alguacil J, Porta M, Malats N, Kauppinen T, Kogevinas M, Benavides FG, Partanen T & Carrato A. Occupational exposure to organic solvents and K-ras mutations in exocrine pancreatic cancer. Carcinogenesis. 2002; 23(1): 101 –106.
(33). Office for National Statistics. Standard Occupational Classification 2000 (SOC 2000). Available from: http://www.ons.gov.uk/ons/guide-method/classifications/archived-standard-classifications/standard-occupational-classification-2000/index.html [Accessed 20 April 2013].

December 2014, vol 11, No. 2Journal of Occupational Safety and Health
57
Introduction
The fisheries sector (including marine capture fisheries, aquaculture, and inland fisheries) is an important sub-sector in Malaysia and plays a significant role in the national economy development. Fish is largely consumed by the population and the fishery industry is also a source of employment for those living in the coastal areas. Based on statistic by Department of Fisheries Malaysia (DOF) in 2010, this sector contributed 2,014,534.84 metric tonnes of fish production, valued at RM9,495.28 million, an increase of 8.86 percent and 10.02 percent both in quantity and in value compared to the year 2009. Furthermore, in the same year this sector contributed 1.3 percent to national Gross Domestic Product (GDP). Apart from that, it is also a source of employment, foreign exchange and a source of cheap animal protein supply for population in the country. Fish constitutes 60-70% of the national animal protein intake, with per caput consumption of 47.8 kg per year. The rate of demand for fish as the main source of protein is expected to increase from the current annual consumption of 630 000 tonnes to over 1 579 800 tonnes by 2010 (using an estimated population of 26 330 000 with a per caput consumption
of 60 kg/year). In 1997, the fisheries sector provides employment for more than 79 000 fishermen (FAO, 2001). Although the development of the fisheries sector is growing well, the safety and health of workers should not be ignored or overlooked as accidents and injuries were also reported fishermen while at workplace. Department of Occupational Safety and Health Malaysia statistic has shown that the fisheries sector is the second highest reported cases of workplace accidents for the year 1994-2008, as shown in Figure 1 below. Therefore, this paper was to explore occupational safety issues at workplace especially among older fishermen in Malaysia, where its finding is hope to serve as reference value in planning programs and strategies for intervention in reducing injuries and accidents among older fisherman towards safe environment in workplace.
December 2014, vol 11, No. 2 : 57-62
Issues On Occupational Safety And Health At Workplace Among Older Fishermen In Malaysia
Mohd Rizal Hussain, Anita Abd Rahman, Rosnah Mohd Yusuff, Nabilah Latif, Sharifah Norazizan Syed Abd Rashid & Haslinda Abdullah
Institute of Gerontology, Universiti Putra Malaysia, 43400 Serdang, Selangor, Malaysia
Correspondence Author: Mohd Rizal Hussain, Institute of Gerontology, Universiti Putra Malaysia, 43400 Serdang, Selangor.
Tel. no: 03-89472737, fax: no.:03-89472744, e-mail:[email protected]
_____________________________________________________________________________
Abstract
The fisheries sector is an important sub-sector in Malaysia and plays a significant role in the national economy development. Fish is largely consumed by the population and the fishery industry is also a source of employment for those living in the coastal areas. However, sea fishing is a dangerous and risky occupation. Previous studies have shown that occupational accidents and injuries among fishermen are prevalent. Thus, this study was conducted to explore occupational safety issues among older fishermen in Malaysia. A total of 397 fishermen age 45 years and above in the states of Terengganu, Kedah and Perak were interviewed by trained enumerator using a questionnaire that focused on the safety problems at work and what are the causes of these problems. Data was analyzed using Statistical Program for Social Science (SPSS). Majority of respondents were male, Malay, married and had primary school education. The finding also showed that almost one-third of the respondents reported that they had experienced boat accidents mostly caused by bad weather. One-fifth of the respondents in this study have experienced accidents/physical injury in their workplace, with animal bites and being stung identified as the main contributor. Falls was reported by almost half of the respondents and slippery floor, strong waves and tripping were identified as the major causes. Few of the identified safety problems among these fishermen such as fall and animal bites are preventable and therefore future improvement can be designed to create a safer and better workplace for the fisheries sectors.
Keywords: Safety, older fishermen, workplace, Malaysia, hazard
_____________________________________________________________________________

Journal of Occupational Safety and HealthDecember 2014, vol 11, No. 2
58
Literature review
Older workers
Previous studies have defined older workers in various terminology, for example according to Bourne (1982) and Warr (2000), the term of ‘older workers’ has been used to refer to employees aged 40 to those aged over 75 years old depending on the purpose and field of study. Thus, in the study of labor market participation, the term of ‘older workers’ typically refer to employees aged 50 or 55 years old and over. It was chosen because most of the countries, this age group have lower participation rates in the labor market (OECD, 2005). However, according to Muijnck and Zwinkels (2002), researchers who studied on older workers in an organization often place limits on the 40 or 45 of age and see the “old” as referring to knowledge skills and attitudes that have been obsolete. Therefore, it has been suggested that the use of “chronological age” may be an inadequate handling of the age factor in the work environment (Avolio et al., 1984; Settersten and Mayer, 1997; Sterns and Alexander, 1987; Sterns and Miklos, 1995; Wolf et al., 1995). However, in this study we used 45 years old as the cut off as defined by WHO for older workers in Malaysia.
Safety and Health Issues among Older Fishermen
Many previous studies highlighted that sea fishing, which is a part of fisheries sector, is hazardous and risky occupation (Jin, Kite-Powell and Talley, 2001; Morel, Amalberti and Chauvin, 2008; Murray, Fitzpatrick and O’Connell, 1997; Lise, Henrik & Olaf, 2008). Finding also showed that majority of hospitalized injuries among Alaska commercial fishermen are causes by machinery (Jennifer and Chelsea, 2008). As fisherman, working on wet, slippery, handling heavy equipment, cables and ropes are a familiar situation. Furthermore, inclement weather and the poisonous spines of some fish are considered natural hazards (Sprent, 1988). Falls were also reported as a major contributor to commercial fishing fatalities among Alaska fisherman. The most common circumstances associated with falling overboard were working with fishing gear, being alone on deck, losing
balance or slipping, heavy weather, gear entanglement, and alcohol consumption (Devin and Jennifer, 2007). This problem also evident internationally where Abraham (2001) reported that falls overboard in the U.S represent 25% of all fishing fatalities, compared to 27% in Norway, Denmark (30%), Ireland (20%) and Iceland (33%).
Materials and methodology
Participants
Data was obtained from a cross-sectional study entitled ‘Workplace Safety and Health among Older Workers: Programs and Strategies for Intervention’ conducted between the years 2009-2011 by the Institute of Gerontology, Universiti Putra Malaysia. A total of 397 sea fisherman aged 45 years and above from the states of Terengganu, Kedah and Perak in Peninsular Malaysia voluntarily participated this study. Participants were identified through Persatuan Nelayan (Fisherman Welfare Association) from every districts/areas in that states. Each district/area provided around 25-30 sea fishermen to be as respondents in this study.
Instruments
Respondents were interviewed face-to-face by enumerator using questionnaires that were developed based on inputs and information given by fishermen from an earlier Focus Group Discussion (FGD). This FGD was chosen as a guideline in the qualitative method where complex themes can be selected to be the topic for discussion and analysis. FGD is a good approach to gather people from similar backgrounds or experiences to discuss a specific topic of interest. The strength of FGD relies on allowing the participants to agree or disagree with each other so that it provides an insight idea on how a group thinks about an issue, coordinate the range of opinion and ideas, and make judgement on the inconsistencies and variations that exists in a particular community in terms of beliefs and their experiences and practices (Krueger and Casey, 2009; Morgan, 1997; Stewart, Shamdasani and Rook, 2007). In addition
Table 1 Industrial Accidents Reported by Sectors, Malaysia, 1994-2008
16
Table 1 Industrial Accidents Reported by Sectors, Malaysia, 1994-2008
Sectors 1994 1997 2000 2003 2006 2008 Agriculture, forestry and fishing 27,268 24,390 13,293 8,796 5,739 3,962 Mining and quarrying 1,406 763 643 736 541 368 Manufacturing 68,281 37,829 42,915 33,901 27,066 19,041 Utility 588 372 592 513 515 524 Construction 4,536 3,648 4,966 5,113 4,500 3,814 Trading 9,173 9,248 15,472 13,576 11,783 11,342 Transportation 4,437 3,276 4,800 4,142 3,653 3,305 Financial 592 367 7,293 6,195 5,386 718 Real estate, renting & business services 2,830 3,731 6,581 5,617 4,832 4,405 Total1 125,506 89,049 98,281 81,003 68,008 56,095
Note 1 Total accident reported include total commuting accidents Source: Labor and Human Resources Statistics (various issues), Kuala Lumpur, Ministry of Human Resource
Table 2 Demographic background of respondents
Items N % Mean SD Gender i. Male ii. Female
396 1
99.7 0.3
Race i. Malay ii. Chinese iii. Indian iv. Others
358 39 - -
90.2 9.8 - -
Age 397 100 56.43 7.748 Level of education i. Never been school ii. Primary education iii. Lower secondary education iv. Upper secondary education v. Higher education vi. Others
25 259 73 33 5 2
6.3 65.2 18.4 8.3 1.3 0.5
Marital status i. Never married ii. Now married iii. Divorced/separated iv. Widowed
18 359 5 15
4.5 90.4 1.3 3.8
Household size 5.4 2.573 Monthly income 884.15 588.781

December 2014, vol 11, No. 2Journal of Occupational Safety and Health
59
to details of demographic background and fishing background, the questionnaire also included several aspects related to safety issues at workplace such as:
i) Safety problems at workplace: the respondents indicated type of problems that they were faced at workplace whether boat accident, accident/physical injury caused by machinery, equipment, building infrastructure and public facilities, chemical, animal or others, fall and etc.
ii) Factor causing safety problems at workplace: this consisted question on how safety problems are happened whether causing by shallow/narrow river confluence, beacon lamp not function/available, jetty/port is busy or congested, bad weather, not wearing/using personal protection equipment, slippery floor, tripping over equipment, or machine while working and etc.
Analysis
Data was analyzed using SPSS (Statistical Programme for Social Sciences). Level of significance was set at p<0.05 (two-tailed). Descriptive analysis was performed to identify frequency, percentage, mean and standard deviation on background demographic items (gender, race, age, level of education, marital status, household size, years fishing and monthly income) and safety issues at workplace.
Result
Table 2 details the demographic background of the respondents. It shows that most of respondents were male (99.7%), Malay (90.2%), average age was 56.43 years old (SD=7.748), primary school education (65.2%), married (90.4%) and with an average household and monthly income size of 5.4 (SD=2.573) and RM884.15 (SD=RM588.781) respectively.
In response to the questions about safety issues at workplace, Table 3 showed that 27.7 percent of respondents reported having experience boat accident during working, with reasons such as bad weather (15.4%), poor boat condition (13.9%), beacon lamp not working/available (7.3%), busy and congested jetty/port (3.3%), shallow/narrow river confluence (3.0%) and confusion of similar colour signal light for all situations (1.3%).
Finding also showed that accident/physical injury is another issue reported by respondent at workplace, with possible causes due to animals (15.1%), equipment (4.3%), machinery (3.3%), chemical (0.5%) and building infrastructure or public facilities (0.3%). Several factors were identified contributing to those problems above, which mostly by animals bite and sting (11.6%), respondents were not wearing/using personal protection equipment (5.0%), no personal protection equipment available/provided (4.3%), using equipment/machinery/chemical without caution (3.3%), lack of knowledge/
Table 2 Demographic background of respondents
16
Table 1 Industrial Accidents Reported by Sectors, Malaysia, 1994-2008
Sectors 1994 1997 2000 2003 2006 2008 Agriculture, forestry and fishing 27,268 24,390 13,293 8,796 5,739 3,962 Mining and quarrying 1,406 763 643 736 541 368 Manufacturing 68,281 37,829 42,915 33,901 27,066 19,041 Utility 588 372 592 513 515 524 Construction 4,536 3,648 4,966 5,113 4,500 3,814 Trading 9,173 9,248 15,472 13,576 11,783 11,342 Transportation 4,437 3,276 4,800 4,142 3,653 3,305 Financial 592 367 7,293 6,195 5,386 718 Real estate, renting & business services 2,830 3,731 6,581 5,617 4,832 4,405 Total1 125,506 89,049 98,281 81,003 68,008 56,095
Note 1 Total accident reported include total commuting accidents Source: Labor and Human Resources Statistics (various issues), Kuala Lumpur, Ministry of Human Resource
Table 2 Demographic background of respondents
Items N % Mean SD Gender i. Male ii. Female
396 1
99.7 0.3
Race i. Malay ii. Chinese iii. Indian iv. Others
358 39 - -
90.2 9.8 - -
Age 397 100 56.43 7.748 Level of education i. Never been school ii. Primary education iii. Lower secondary education iv. Upper secondary education v. Higher education vi. Others
25 259 73 33 5 2
6.3 65.2 18.4 8.3 1.3 0.5
Marital status i. Never married ii. Now married iii. Divorced/separated iv. Widowed
18 359 5 15
4.5 90.4 1.3 3.8
Household size 5.4 2.573 Monthly income 884.15 588.781

Journal of Occupational Safety and HealthDecember 2014, vol 11, No. 2
60
exposure on aspects of safety at workplace (3.0%) and unsatisfactory/damage of machinery/equipment/building infrastructure and public facilities (1.5%). Respondents also reported experience problem on fall (50.6%) during work, which mostly causes by slippery floor (44.3%), strong wave (41.3%) and tripping over equipment/machine (20.7%).
Discussion
Even though the analysis only focused on problems and factors that contributed to safety issues at workplace among fisherman, finding is helpful in given us the scenario of work environment faced by fisherman in their daily work. Almost one-third of respondents reported
Table 3 Safety problems and factors causing safety problems faced by respondents at workplace
Safety problems N % Factors causing safety problems N % Boat accident i. Yes ii. No
110 287
27.7 72.3
Shallow/narrow river confluence i. Yes ii. No
12 385
3.0 97.0
Busy and congested jetty/port i. Yes ii. No
13 384
3.3 96.7
Beacon lamp not working/available i. Yes ii. No
29 368
7.3 92.7
Poor boat condition (damage, too old) i. Yes ii. No
55 342
13.9 86.1
Bad weather i. Yes ii. No
61 336
15.4 84.6
Confusion of similar colour signal light for all situations i. Yes ii. No
5 392
1.3 98.7
Accident/physical injury caused by machinery i. Yes ii. No
13 384
3.3 96.7
Not wearing/using personal protection equipment i. Yes ii. No
20 377
5.0 95.0
Accident/physical injury caused by equipment i. Yes ii. No
17 380
4.3 95.7
No personal protection equipment available/provided i. Yes ii. No
17 380
4.3 95.7
Accident/physical injury caused by building/public facilities i. Yes ii. No
1 396
0.3 99.7
Using equipment/machinery/chemical without caution i. Yes ii. No
13 384
3.3 96.7
Accident/physical injury caused by chemical i. Yes ii. No
2 395
0.5 99.5
Unsatisfactory/damage of machinery/equipment personal protection equipment/ building infrastructure and public facilities i. Yes ii. No
6 391
1.5 98.5
Accident/physical injury caused by animal i. Yes ii. No
60 337
15.1 84.9
Lack of knowledge/exposure on aspects of safety at workplace i. Yes ii. No
12 385
3.0 97.0
Animals bite or sting i. Yes ii. No
46 351
11.6 88.4
18
Fall i. Yes ii. No
201 196
50.6 49.4
Strong wave i. Yes ii. No
164 233
41.3 58.7
Slippery floor i. Yes ii. No
176 221
44.3 55.7
Tripping over equipment/machine i. Yes ii. No
82 315
20.7 79.3
Table 3 Safety problems and factors causing safety problems faced by respondents at workplace

December 2014, vol 11, No. 2Journal of Occupational Safety and Health
61
that they have experienced boat accident, which mostly caused by bad weather. It is not surprising because Malaysia is a country that is of equatorial climate, giving it a warm and wet weather due to its proximity to the equator. On an average, Malaysia receives about 6 hours of sunshine each day with cloud formations occasionally leading to rainfall. There are two monsoon winds that influence the rainfall at different intervals of the year. The Southwest Monsoon usually occurs between May till September, bringing rainfall to the western side of Peninsular Malaysia. On the other hand, the Northeast Monsoon starts from November and lasts till March to areas on the east side of Peninsular Malaysia. As this monsoon wind is particularly strong, it often brings heavy rain to the west side of Peninsular Malaysia. This finding is similar to Yue, Roland and Casey (2005) where weather condition contributed fishing boat incidents in Atlantic Canada.
Accident/physical injury is common problem among fisherman (Norrish & Cryer, 1990). Therefore, it shows that almost one-fifth of respondents in this study experienced this problem in their workplace, where animals bite and sting were identified as the main contributor to this problem followed by lack awareness among respondents in using personal protection equipment when working. This finding is similar with other studies, where commercial fishermen are exposed to specific hazards including marine animals as well as more widespread hazards such as mechanical equipment, fatigue and stress (Holland, 1969; Schilling, 1971; Barss, 1985; Jeays, 1987; Dutkiewicz, Jablonski, & Olenchock, 1988; Sutherland and Flin, 1989). In this study, falls was reported to affect the highest number of respondents, approximately almost half of respondents. Slippery floor was identified the major contributor to this problem. For fishermen, work capacity is very largely determined by the condition of the legs; therefore, leg injury can be a serious matter in commercial fishing (Olaf, 2000). Therefore, it is important for every fisherman to avoid any hazards that can lead to risk of falling during working.
Conclusion
Safety is a critical issue that needs to give fully attention by everyone, including at workplace. Although the current Marine Act or the Fisheries Ordinance, 1985 (Act 317) in Malaysia do not include legal aspects of the fishermen mainly in the aspects of occupational safety and health in the workplace, but it also needs to be given serious attention. Interventions and guideline related to safety and health at workplace for fishermen should be developed and provided. By identifying problems and factors that contributed to this issue, it will help us in future to improve workplace to become more safe and comfortable for older workers.
Acknowledgement
We would like to thanks all the participants, research assistants and researchers in involving the study.
References
(1). FAO. Safety at sea as an integral part of fisheries management. FAO Fisheries Circular No. 966, Roma, 2001.
(2). Jin, D., Kite-Powell, H. & Talley, W. (2001). The safety of commercial fishing: Determinants of vessel total losses and injuries. Journal of Safety Research, 32, 209-228.
(3). Morel, G., Amalberti, R. & Chauvin, C. (2008). Articulating the differences between safety and resilience: the decision-making process of professional sea-fishing skippers. Human Factors: The Journal of the Human Factors and Ergonomics Society, 50(1), 1-16.
(4). Murray, M., Fitzpatrick, D. & O’Connell, C. (1997). Fishermens blues: Factors related to accidents and safety among Newfoundland fishermen. Work and Stress: An International Journal of Work, Health & Organization, 11(3), 292-297.
(5). Lise, H.L., Henrik, L.H. & Olaf, C.J. (2008). Fatal occupational accidents in Danish fishing vessels 1989-2005. International Journal of Injury Control and Safety Promotion, 15(2), 109-117.
(6). Jennifer, M. Lincoln & Chelsea, C. (2008). Woodward. Reducing commercial fishing deck hazards with engineering solutions for winch design. Journal of Safety Research, 39(2), 231-235.
(7). Sprent, P. (1988). Taking risks: The science of uncertainty. London: Penguin.
(8). Devin, L. Lucas & Jennifer, M. (2007). Lincoln. Fatal falls overboard on commercial fishing vessels in Alaska. American journal of industrial medicine, 50, 962-968.
(9). Abraham, P.P. (2001). International comparison of occupational injuries among commercial fishers of selected northern countries and regions. Barents Newsletter on Occupational Health and Safety, 4(1): 24-28.
(10). Krueger, R.A. and Casey, M.A. Focus groups: A practical guide for applied research. Thousand Oaks, London, New Delhi: Sage Publications, Inc., 2009.
Journal of Occupational Safety and HealthDecember 2014, vol 11, No. 2
62
(11). Morgan, D. L. Focus groups as qualitative research, 16. Sage Publications, Inc., 1997.
(12). Stewart, D. W., Shamdasani, P. N., & Rook, D. W. Focus groups: Theory and practice: Sage Publications, Inc., 2007.
(13). Yue, W., Ronald, P. & Casey, H. The effect of weather factors on the severity of fishing boat accidents in Atlantic Canada. Risk Management 2005; 7(3): 21-40.
(14). Norrish, A.E. & Cryer, P.C. Work related injury in New Zealand commercial fishermen. Br J Ind Med 1990; 47: 726-732.
(15). Holland, Martin D. Trawler safety-final report of the committee of inquiry into trawler safety. London: HMSO, 1969.
(16). Schilling, R.S.F. Hazards of deep-sea fishing. Br J Ind Med 1971; 28: 27-35.
(17). Barss, P.G. Penetrating wounds caused by needle-fish in Oceania. Med J Aust 1985; 143: 617-22.
(18). Jeays, L.W. Safety for fisherman on trawlers. Sydney: National Occupational Health and Safety Commission, 1987.
(19). Dutkiewicz, J,, Jablonski, L. & Olenchock, S.A. Occupational biohazards: a review. Am J Ind Med 1988; 14: 605-23.
(20). Sutherland, K.M. & Flin, R.H. Stress at sea: a review of working conditions in the offshore oil and fishing industries. Work and Stress 1989; 3: 269-85.
(21). Olaf, C. Jensen. Non-fatal occupational fall and slip injuries among commercial fishermen analyzed by use of the NOMESCO injury registration system. American Journal of Industrial Medicine 2000; 37: 637-644.
(22). Bourne, B. Effects of aging on work satisfaction, performance and motivation. Aging and Work 1982; 5(1): 37-47.
(23). Warr, P. Job performance and the ageing workforce. In Chmiel, N. (Ed.), Introduction to Work and Organizational Psychology: A European Perspective (pp. 407-423). Blackwell Publishers, Oxford, 2000.
(24). OECD. Ageing and Employment Policies, The Netherlands, 2005.
(25). Muijnck, J.A. & Zwinkels, W.S. Older Employees in SME’s: A Literature Review on the Use of Older Employees. In Onderzoek voor Bedrijf & Beleid, Zoetermeer. The SME-Organization: EIM. The Netherlands, 2002.
(26). Avolio, B.J., Barrett, G.V. and Sterns, H.L. Alternatives to age for assessing occupational performance capacity. Experimental Aging Research 1984; 70(2): 101-5.
(27). Settersten, R.A. and Mayer, K.U. The measurement of age, age structuring, and the life course. Annual Review of Sociology 1997; 23: 233-61.
(28). Sterns, H.L. and Alexander, R.A. Industrial gerontology: the aging individual and work. In Schaie, K.W. (Ed.), Annual Review of Gerontology and Geriatrics, Vol. 7, (pp. 243-64), Springer Publishing Company, New York, NY, 1987.
(29). Sterns, H.L. and Miklos, S.M. The aging worker in a changing environment: organizational and Individual Issues. Journal of Vocational Behavior 1995; 47(3): 248-68.
(30). Wolf, G., London, M., Casey, J. and Pufahl, J. Career experience and motivation as predictors of training behaviors and outcomes for displaced engineers. Journal of Vocational Behavior 1995; 47(3): 316-31.

December 2014, vol 11, No. 2Journal of Occupational Safety and Health
63
Occupational Heat Stress And Physiology Parameters Of Male Workers In A Steel Plant Factory At Pasir Gudang, Johor
Shamsul B.S.1 and Dubashini N.2 1Center of Occupational Safety and Health, University Malaysia Sabah, 88400 UMS Road, Kota Kinabalu, Sabah.
2Department of Community Health, Faculty of Medicine and Health Sciences, Universiti Putra Malaysia, 43400 Serdang, Selangor,Malaysia
Correspondence address : Assoc. Prof. Dr. Shamsul Bahari Shamsudin, Center of Occupational Safety and Health, UNIVERSITY MALAYSIA SABAH, 88400 UMS Road, Kota Kinabalu, Sabah.
Tel. No : +6088 - 320000 ext. 1661 (Office), Fax No : +6088 - 320126, E-mail : [email protected]
______________________________________________________________________________
Abstract
A cross-sectional study was conducted in a steel plant in Pasir Gudang, Johor. The main objective of this study was to determine heat stress and its effect on physiological changes such as body core temperature, blood pressure, pulse rate and heart rate recovery among male workers steel plant. A total of 60 workers from steel plant were selected. Physiological parameters such as body core temperature, blood pressure, pulse rate and heart rate recovery were measured by standard and systematic technique. Environmental parameter such as WBGT(in) and WBGT(out) was measured by using QUESTEMP° 34 Thermal Environment and meanwhile for air velocity was measured by using Velocicheck Model TSI 8850. Self-administered questionnaire was used to determine respondents’ socio-economic background, daily activities and status of health. The range of body core temperature was between 36.0°C to 37.6°C. The range of systolic blood pressure and diastolic blood pressure was between 100 to 120 mmHg and 60 to 90mmHg. The mean for WBGT (in) is 29.1°C and the mean for air velocity is 0.23m/s. The One-Way ANOVA shows that there were no significant differences for heat stress index between before, 2 hours after and 8 hours after work. The Pearson Correlation Test showed that there are weak correlation between heat stress index and body core temperature and also body core temperature and blood pressure. There are strong significant relationship (p<0.05) between body core temperature (8 hours after work) and pulse rate (8 hours after work). This study revealed that workers should be working based on 50% work and 50% rest hourly because they are at the risk of heat stress.
Keywords: Heat stress, Physiological Changes, WBGT(in)
_____________________________________________________________________________Introduction
The American Conference of Government Industrial Hygienists (ACGIH, 2001) defines heat stress as “the net heat load to which a worker may be exposed” Heat strain is defined as “the overall physiological response resulting from heat stress”. This study aims to assess the specificity of heat and its effects on physiological changes such as core body temperature, blood pressure, pulse rate and pulse recovery rate among male workers at a steel plant. Heat illness is the result of excessive strain on the body and is a highly variables human response to heat stress. ACGIH (2001) has identified the thresholds for illness in terms of core body temperature. While these thresholds may be exceeded by some individuals without ill effect, the application of these guidelines will ensure protection of workers and teams, as a single illness affects the safety of the workers who are exposed to overheating environment. The threshold level of core temperature associated with loss of judgment and reaction time is 38°C. At a core temperature of 38.6°C and above, physical heat strain has begun and, if not treated, will progress to acute heat illness and eventually
the life-threatening condition of heat stroke (ACGIH, 2001).
Assertive heat is a hazard that increases the risk of interference environment firmness heat. The most significant physiological response shown is an increase in body temperature, pulse rate and sweating a lot (Lucas et al, 2014). The severity of heat occurs due to three factors: working conditions, workload and clothing (Chen et al, 2014). The rate of heat exchange between the skin and the environment depends on the conduction process, convection, radiation and evaporation (Crider et al, 2014). The working environment of heat will increase the risk of heat stress among workers, especially in the workplace that has poor ventilation and low humidity (Dang and Dowell, 2014).
A study in Malaysia found that the average comfortable temperature for the normal population in Malaysia is between 24.0°C to 28.0°C and an ambient temperature of above 28.0°C raises the risk of heat stress (Mohd Peter and Shanmugavelu, 1999). The human body can compensate for the temperature rose to 42.0°C and
December 2014, vol 11, No. 2 : 63-68Research Article

Journal of Occupational Safety and HealthDecember 2014, vol 11, No. 2
64
decreased to 32.0°C before the physiological functions of the body and damage occurs (Pardo, 1998). Assessment and control of thermal stress requires knowledge of the physical components of the environment such as temperature or humidity affects the heat exchange between human beings and the environment (Logan and Bernard, 1999).
Methodology
This cross-sectional study was conducted over three months. Data was collected at one of the multi-national steel plant site in Pasir Gudang, Johor. Purposive sampling was used based on the inclusion criteria set out in this study which were, worker who were exposed to heat for minimum 8 hours or more at work, working experience more than 1 year and not suffering from any diseases such as heart disease or hypertension. Total of 60 workers were selected in this study.
A questionnaire was used to determine socio-demographic information, daily activities and health status of the respondents. Face to face interviews with respondents were conducted using a same technique and method. Environmental heat conditions during working activities were monitored using QUESTEMPº34 digital instruments to record ambient air temperature, natural wet bulb temperature, radiant (globe) temperature, and air speed. These data were used to calculate a WBGT(in) heat index value for the exposure. WBGT(in) for low radiant heat exposures such as in steel plant is calculated as;
WBGT(in) = 0.7 Tnwb + 0.3 Tglobe
Where, Tnwb = natural wet bulb temperature
Tglobe = globe temperature
(NIOSH, 1986; ISO, 1989)
The Time Weighted Average (TWA) of occupational workplace areas was taken 3 times; before work, 2 hours of work and completion of work task. Wind velocity was measured by using wind speed measurements model Velocicheck TSI 8850 and the average reading for the whole 8 hours of work taken.
Body core temperature measurements were taken using Instant Ear Thermometer Model MC509. The blood pressure of respondent determined manually using a Sphygmomanometer Model Riester. Heart rate is taken by measuring the radial artery pulse in a minute (60 seconds). In the general population, sustained heart-rate levels associated with excessive heat strain vary between 180 beats per minute (bpm) less the person’s age (ACGIH, 2001; NIOSH, 1986). Because of the variety of ages and cardiovascular conditioning found in the population of steel plant workers and the variety of often
physically demanding activities they performed, it was difficult to assess heat strain by means of peak heart rate alone. Another means of assessing heat strain is through the recovery heart rate. The reference sets a limit of 110 bpm for a recovery time of 1 minute (ACGIH, 2001; NIOSH, 1986). Another means of assessing recovery is to compare recovery heart rate to fully resting heart rate. Recovery heart rate was taken as the heart rate 2.5 minutes after resting (P3) and was compared to the pulse rate of workers in the first 30 seconds (P1), while the subject was wearing an apparatus but before activities were begun. A rise in this resting rate indicates accumulated strain in the person. Reading of core body temperature, blood pressure and pulse rate was taken 3 times; before work, 2 hours of work and completion of work task.
Pre-testing of questionnaire was conducted on 10% of respondents in the steel plant. QUESTEMP °34 and Velocicheck TSI Model 8850 was calibrated every day before the observations were made. Calibration is carried out based on the Standard Operation Procedure (SOP) stated in the instrument manual.
All data obtained from the measurements and questionnaires were analyzed using SPSS for Windows Version 19.1. These data were tested using descriptive methods to determine the number of respondents, frequency, mean, range, and standard deviation of each variable ambient temperature, wind velocity, temperature and weight, blood pressure, pulse rate, pulse rate and recovery. Descriptive test used for the determination of respondent socio-demographic status information. One-way ANOVA and Pearson correlation test was used to determine differences and relationships.
Results
Table 1 shows the socio-demographic information of the respondents. Mean age of the 60 respondents were 32.4years. Mean height and weight of respondents, respectively, are 1.71m and 68.52kg. The mean body mass index is 23.18kg/m2, the mean number of years of formal education was 11.2 years and the mean total household income is RM 1758.30. The majority of the respondents were Malays, 52 (86.6%), and Indians (4 respondents) and others (4 respondents), none workers are Chinese. Fifty one respondents (85%) are married and 9 (15%) are not married. The majority of respondents had an education level of high school with the highest number of 43 respondents (71.6%).
Table 2 shows the temperature WBGT(in) and wind velocity in the Electrical Arc Furnace (EAF), Ladle Furnace (LF) and Continuous Casting Machine (CCM). The range of WBGT (in) in the three working areas (EAF, LF and CCM) of the steel plant is 27.9°C to 34.9°C and the wind velocity range is between 0.17 to 0.29m/s. Table 3 shows the mean and range of body core

December 2014, vol 11, No. 2Journal of Occupational Safety and Health
65
temperature, blood pressure, pulse rate and pulse rate of recovery. The body core temperature before work, 2 hours of the work and the complete 8 hours work ranges from 36.0°C to 37.6°C. Range of systolic and diastolic blood pressure is between 100 and 120 mmHg and 60 to 90 mmHg. Pulse rate pulse range is 64 to 84 per minute. The difference recovery rate of pulse P1 and P3 are 0 to 6 pulses.
Figure 1 shows the acute health complaints due to thermal stress since starting work in factory. Thirty nine respondents (65%) experienced fatigue, 20 (33.3%) had irregular movement, 27 (45%) had headache, 10 (16.7%) complained of nausea, 9 (15%) anorexia and 21 (35%) experienced muscle spasms. Meanwhile, there are 2
respondents (3.3%) who had experience suffering from fainting during the first month they started working in this factory.
The results of comparative One-way ANOVA on level of WBGT(in) between areas of work EAF, LF and CCM showed there is no significant differences. This means that employees who work in these three areas are exposed to the same risk of indoor heat temperature. In Table 4 of the Pearson correlation test showed there is no significant correlation between the parameters of heat stress index with all physiological parameters.
Table 5 shows the correlation between body core temperature and blood pressure, pulse rate and pulse recovery. This test showed no significant relationship
13
Table 1: Socio-demography of respondents
Variables Range Mean ± S.D
Age (years) 23 – 45 32.4 ± 5.26 Height (m) 1.60 – 1.79 1.71 ± 0.05 Weight (kg) 52.0 – 76.4 68.52 ± 6.15 Body Mass Index (kg/m²) 20.31– 24.84 23.18 ± 1.30 Years of formal education (years) 6 – 17 11.2 ± 2.09 Household income (RM) 1125 – 4210 1758.3 ± 629.44
Ethnics Frequency Percentage (%)
Malays 52 86.6 Indian 4 6.7 Others 4 6.7
Marital Status Frequency Percentage (%)
Married 51 85 Not Married 9 15
Educational Level Frequency Percentage (%)
Primary 1 1.7 Secondary 43 71.6 Diploma 12 20.0 Degree 4 6.7 N=60
Table 2: Temperature of WBGT(in) and wind speed at working area.
Variables Areas Range Mean ± S.D
WBGT (in)°C EAF 31.1-34.9 32.7 ± 1.2 LF 29.8-33.4 31.4 ± 0.94 CCM 27.9-32.8 29.3 ± 1.14 Average WBGT(in)°C 27.9-34.9 31.1 Wind speed (m/s) EAF 0.17-0.22 0.19 ± 0.02 LF 0.18-0.27 0.23 ± 0.02 CCM 0.24-0.29 0.27 ± 0.01 Average wind speed (m/s) 0.17-0.29 0.23 N=60
Table 1: Socio-demography of respondents
Table 2: Temperature of WBGT(in) and wind speed at working area.

Journal of Occupational Safety and HealthDecember 2014, vol 11, No. 2
66
14
Figure 1: Distributions of acute health complaint related to heat stress
Table 3: Descriptive information of body core temperature, blood pressure, heart rate and recovery heart rate
Body core temperature (°C) Range Mean ± S.D
Before work 36.0 – 37.2 36.53 ± 0.35 2 hours work 36.3 – 37.6 36.97 ± 0.34 After work 36.1 – 37.5 36.78 ± 0.34
Blood pressure (mmHg)
Before work (systolic/diastolic) 100/60 – 120/90 2 hours work (systolic/diastolic) 100/60 – 130/95 After work (systolic/diastolic) 100/60 – 130/95
Heart rate per minute
Before work 64 – 84 74.27 ± 5.32 2 hours work 66 – 84 74.37 ± 4.80 After work 66 – 84 74.50 ± 5.03
Heart rate recovery
Difference of P3 and P1 0 - 6 0.40 ± 1.01 N=60
Fatigue (65%)
Irregular movement (33.3%)
Headache (45%)
Nausea (16.7%)
Anorexia (15%)
Muscle spasms (35%)
Fainting (3.3%)
0 15 30 45 60 75 (%)
% complaints
Acute health
complaints
between body core temperature and blood pressure and pulse rate of recovery. There is only a significant relationship between body core temperature (after complete 8 hours of work) with pulse rate (after complete 8 hours of work), with p=0.042.
Discussion
The WBGT(in) in the EAF is higher than the LF and CCM area. This is because in the EAF is the first process there is iron smelting in a furnace with a high temperature of 1000°C to 1650°C. The mean overall WBGT(in) was 31.1°C. Predicted correction value of WBGT(in) heat stress exposure based on Clothes Adjusted Corrections Index of WBGT(in) produced
by ACGIH (2003). Correction value is -2°C adjusted for cotton types clothes, therefore the final value WBGT(in) of heat stress exposure is 29.1°C. Clothing is important in determining heat stress yet little guidance is provided in the standard. The use of absorbing sweat clothes constant factor in the WBGT(in) equation would enhance validity for work in the sun. Use of the proposed ‘clothed WBGT(in)’ would enhance validity and should be further investigated (Parsons, 2006).
The mean wind velocity at the steel plant was 0.23m/s, while the limit for thermal comfort is determined by wind velocity is 0.25m/s (ACGIH, 2003). Working space is limited, narrow and the weather is one of the significant factors that lead to low wind velocity (Bisesi
Table 3: Descriptive information of body core temperature, blood pressure, heart rate and recovery heart rate
Figure 1: Distributions of acute health complaint related to heat stress

December 2014, vol 11, No. 2Journal of Occupational Safety and Health
67
15
Table 4: Pearson correlation of Heat Stress Index WBGT(in) with physiological parameters.
Body core temperature (°C) r value p value
Before work 0.224 0.371 2 hours work 0.141 0.577 After work 0.283 0.256
Blood pressure (mmHg)
Before work (systolic/diastolic) 0.292 0.239 2 hours work (systolic/diastolic) 0.207 0.409 After work (systolic/diastolic) 0.346 0.159
Heart rate per minute
Before work -0.130 0.608 2 hours work -0.141 0.577 After work -0.061 0.809
Heart rate recovery
P1: heart rate for 30 seconds -0.044 0.861 P3: heart rate for 2.5 minutes -0.190 0.450 N=60
Table 5: Pearson correlation of Body Core Temperature (°C) with physiological parameters.
Blood pressure (mmHg)
Before work (systolic/diastolic) 0.066 0.615 2 hours work (systolic/diastolic) 0.080 0.542 After work (systolic/diastolic) 0.007 0.959
Heart rate per minute
Before work 0.201 0.123 2 hours work 0.229 0.079 After work 0.264 0.042*
Heart rate recovery
P1: heart rate for 30 seconds 0.201 0.123 P3: heart rate for 2.5 minutes 0.225 0.084 N=60 * Significant at p≤0.05
Table 4: Pearson correlation of Heat Stress Index WBGT(in) with physiological parameters.
Table 5: Pearson correlation of Body Core Temperature (°C) with physiological parameters.
and Kohn, 1997). The results showed that the EAF has a low wind velocity than prescribed by ACGIH (2003) compared with the LF and CCM areas. This proves the workers in the EAF having most discomfort thermal compare to workers in the LF and CCM areas.
Differences in the rate of recovery pulse shows the difference of P1 and P3 were less than 10. According to ACGIH (2001), this difference shows high heat stress experience by workers and need prolong recovery. Duration of workers exposed to heat should be reduced based on ACGIH (2003) guideline. The study found there is no significant correlation between the Heat Stress Index with body core temperature of the workers. There are studies concerning the response of extreme
temperatures on thermoregulatory showed no significant increase of body core temperature during extreme exercise (Montain et al, 2000).
Results shows there is a significant correlation between body core temperatures and pulse rate fully after 8 hours working periods. Pulse rate is influenced by the reaction and movement temperature, the heart beat and the workplace environment. An increase in the body’s core temperature will result in the need VO2max (maximum volume of oxygen) will increase. Requirements VO2max is a measure of the total volume that needs to be supplied to the muscles to function effectively. This causes the heart to pump harder and pulse will be increased (Minard, 1973).

Journal of Occupational Safety and HealthDecember 2014, vol 11, No. 2
68
Reference guideline produce by ACGIH (2001), determine the working posture of the respondent to accomplish the task in the standing mode and the average energy used for one hour is 36 kcal. The total energy used when movements of the respondent whole body while working are 300kcal/h. It can be concluded that the minimum metabolic rate of work after 8 hours is 336kcal/h. Based on the same guideline the Heat Stress Index of this workplace environment fall under the moderate category. Any system of controlling health and safety in hot environment should be embedded in management systems, including training of operators that can be used effectively worldwide.
Conclusion
The average temperature WBGT(in) at the steel plant was 29.1°C. Based on Threshold Limit Value (TLV) for WBGT(in) guideline (ACGIH, 2003), for moderate work this is in the category of mild stress workload and the recommended time is work duration to 50% and 50% rest every hour. Only in the EAF area has a low wind velocity based on guideline prescribed by ACGIH (2003). Workers in the EAF have the most thermal discomfort disorder compare to workers in the LF and CCM area. Continuous heat exposure to workers can affect the physiology of the body that will affect their health status. Measures such as engineering controls, administrative controls, training and monitoring of work and use of personal protective equipment should be emphasized in order to reduce the risk of heat stress.
References
(1). ACGIH - American Conference of Governmental Industrial Hygienists. 2003. Threshold Limit Values for Chemical Substance and Physical Agents and Biological Exposure Indices, Cincinnati, 2003 : American Conference of Governmental. Available : www.interstateproducts.com [2014, Sept. 20].
(2). ACGIH - American Conference of Governmental Industrial Hygienists. 2001. TLVs and BEIs–Threshold Limit Values for Chemical Substances and Physical Agents and Biologi-cal Exposure Indices. ACGIH, Cincinnati, OH, 2001, pp.180-188. [http://www.cdc.gov/niosh/mining/UserFiles/works/pdfs/asohs.pdf]
(3). Bisesi MS, Kohn JP.1997. Industrial Hygiene Evaluation Methods. In: Allan JR. Thermal Stress in Occupations.USA : Lewis Publishers,1997:175-181.
(4). Chen WY, Lo CL, Chen CP, Juang YJ, Yoon C, Tsai PJ. 2014. Prioritizing Factors Associated with Thermal Stresses Imposed on Workers in Steel and Iron Casting Industries Using the Monte Carlo Simulation and Sensitivity Analysis. J Occup
Health. 2014 Sep 11. [https://www.jstage.jst.go.jp/article/joh/advpub/0/advpub_14-0078-FS/_article]
(5). Crider KG, Maples EH, Gohlke JM. 2014. Incorporating occupational risk in heat stress vulnerability mapping. J Environ Health. 2014 Jul-Aug;77(1):16-22.
(6). Dang BN and Dowell CH. 2014. Factors associated with heat strain among workers at an aluminum smelter in Texas. J Occup Environ Med. 2014 Mar;56(3):313-8.
(7). ISO - International Organization for Standardization (ISO). 1989. Hot Environments–Estimation of the Heat Stress on Working Man, Based on WBGT Index (Wet Bulb Globe Temperature). International Standard ISO 7243. 1989.
(8). Logan PW and Bernard TE. 1999. Heat stress and strain in an aluminum smelter. Am Ind Hyg Assoc J. 1999 Sep-Oct;60(5):659-65.
(9). Lucas RA, Epstein Y and Kjellstrom T. 2014. Excessive occupational heat exposure: A significant ergonomic challenge and health risk for current and future workers. Extrem Physiol Med. 2014 Jul 23;3:14.
(10). Mirnad D. 1973. Industrial Environment,its Evaluation and Control – Physiological of Heat Stress. USA: WB Saunder,1973
(11). Mohd Peter D, Shanmugavelu S. 1999. Thermal Comfort Study-UPM Experience. Livestock Centre MARDI, Serdang : Penerbit UPM.
(12). Montain SJ, Latzka WA, Sawka MN. 2000. Extreme temperatures effect on thermoregulation during exercise in the heat. Journal of Applied Physiology.2000; 89(3) : 1123-1130.
(13). NIOSH - National Institute for Occupational Safety and Health. 1986. Division of Standards Development and Technology Transfer. Criteria for a Recommended Standard: Occupational Exposure to Hot Environments, Revised Criteria. DHHS (NIOSH) Publication No. 86-113, 1986
(14). Pardo A. 1998. Overview of Occupational Hygiene. USA : CRC Press Inc.
(15). Parsons K. 2006. Heat Stress Standard ISO 7243 and its Global Application. Industrial Health, 2006:44, 368–379

December 2014, vol 11, No. 2Journal of Occupational Safety and Health
69
EFFECT OF PESTICIDES ON ACTIVITIES OF Alanine aminotransferase (ALAT) AND γ-glutamyltranspeptidase (GGT) IN BLOOD AMONG
VEGETABLES FARMER IN MUAR, JOHOR, MALAYSIA
Shamsul B.S.1 and Hang Yap T.2 1 Centre of Occupational Safety and Health, Universiti Malaysia Sabah, 88400 Kota Kinabalu, Sabah, Malaysia. 2Department of Community Health, Faculty of Medicine and Health Sciences, Universiti Putra Malaysia, 43400
Serdang, Selangor,Malaysia
Correspondence address: Associate Prof. Dr. Shamsul Bahari Shamsudin (Ph.D), Centre of Occupational Safety and Health, Universiti Malaysia Sabah, 88400 Kota Kinabalu, Sabah, Malaysia. Phone : +6013-8888004 Fax : +6088-320126
Email: [email protected]
______________________________________________________________________________
Abstract
Most vegetable farmers are using agricultural chemicals on their farms. Many of these chemicals are used to control pests and are known as pesticides. Pesticides can be categorised according to their chemical basis. Most of the more toxic pesticides fall into chemical groups of organophosphates, carbamates and bipyridyls. The general objective is to study the level of liver enzymes as a result of being exposed to pesticides among the farmers in Muar, Johor. The specific objectives of the study are to identify relationship between pesticide exposure duration with the liver enzyme level, frequency of handling the pesticides and using PPE when applying the pesticides, comparing of the liver enzyme level between exposure group and comparative group and finally identifying the factor which can influence the liver enzyme lever at farmer who exposed to pesticides. The cross sectional study on the effect of pesticides to the liver enzymes among vegetable farmers at Muar, Johor was conducted by using the liver enzymes such as Alanine aminotransferase (ALAT) and γ-glutamyltranspeptidase (GGT) as indicators. 92 workers were selected as respondents, where 47 respondents are in the exposed group and the other 45 respondents in the comparative group. Respondents had been selected from farmers in Muar as the exposed group and respondents from Terengganu Health District Office as the comparative group. The selection of the respondents was made through purposive sampling from list provided. The liver enzyme levels were measured by taking blood from respondent. The Automated Analyser Hitachi 902 was used in the blood analysis. Two types of the liver enzymes (ALAT and GGT) were analyzed. Mean GGT for exposed group was 63.5 Units/L and ALAT was 61.9 Units/L, significantly higher compared to comparative group while the mean of GGT was 20.7 Units/L and ALAT was 23 Units/L. Non-parametric difference Mann-Whitney U test showed there was significant different between exposed and comparative group on GGT (Z=-6.535; p£0.001) and ALAT level (Z=-5.315; p≤0.001). Five occupational factors have been measured in this study was years of working, number of pesticide used per day, frequency of handling pesticide per day, pesticide spraying duration and personal protective equipment (PPE) scores. Result showed both GGT and ALAT enzymes level has significant correlations with pesticide spraying duration (r=412; p=0.004 & r=0.445; p=0.002) and personal protective equipment (PPE) scores (r=-0.397; p=0.006 & r=-0.478; p=0.001). Pesticides spraying duration was the occupational exposure factor which has most influence on GGT (β=0.710; p<0.001) and ALAT (β=0.574; p<0.001) enzymes level among exposed group after adjustments for all confounders in this study. This study found there are significant differences of liver enzyme (GGT & ALAT) levels between exposed group and comparative group due to pesticides exposure. This study also found there are significant correlations between liver enzyme (GGT & ALAT) levels with pesticide spraying durations (hours) and PPE score.
Key words: Pesticides, ALAT, GGT, PPE and vegetables farmers
_____________________________________________________________________________
Introduction
Pesticides are toxic chemicals that are widely used throughout the world. This broad category of compounds includes approximately 600 different active ingredients in use and a far greater number of commercial products. The main application of pesticides is in agriculture, although its use for public health programmes such as
malaria or rodent control is also significant in some areas of the world (García 1998; Stopford 1999). Agricultural workers are exposed to pesticides primarily through mixing of chemicals, loading into dispensers, application, clean up, and disposal of empty chemical containers (El Sebae 1993; Geoffrey et al. 2003).
Pesticide damage primarily at the nervous system and neurobehavioral functions test method have been
December 2014, vol 11, No. 2 : 69-76Research Article
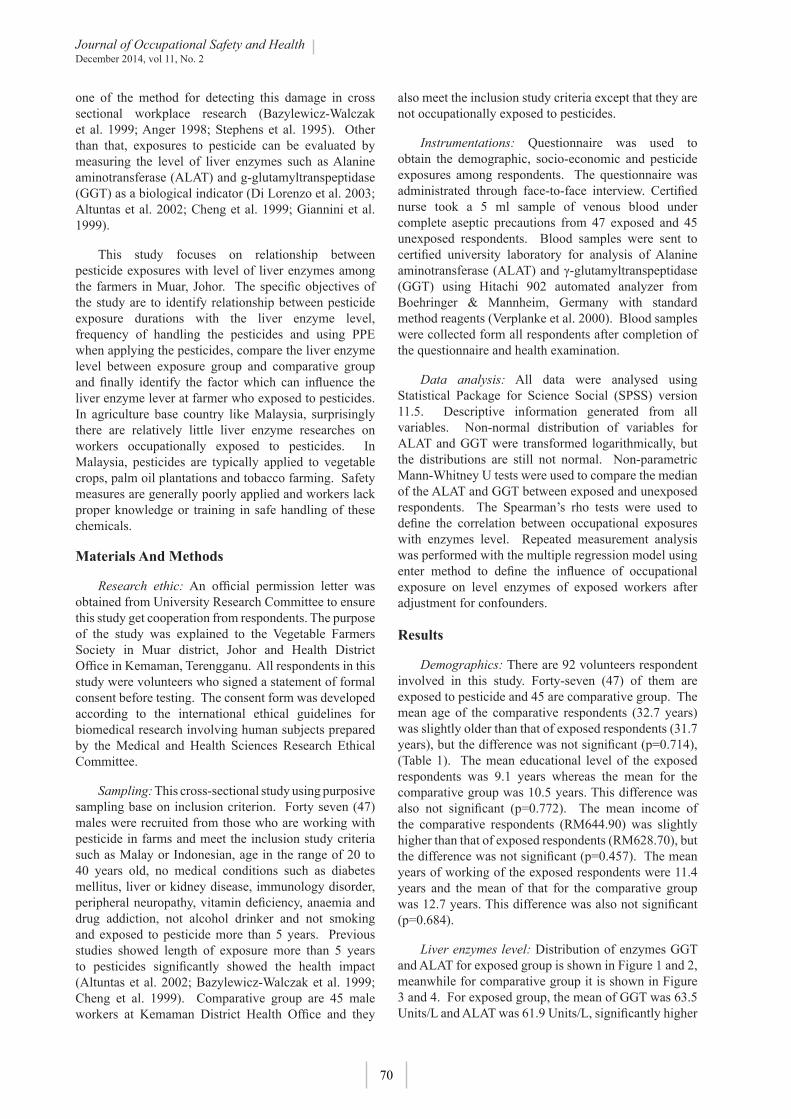
Journal of Occupational Safety and HealthDecember 2014, vol 11, No. 2
70
one of the method for detecting this damage in cross sectional workplace research (Bazylewicz-Walczak et al. 1999; Anger 1998; Stephens et al. 1995). Other than that, exposures to pesticide can be evaluated by measuring the level of liver enzymes such as Alanine aminotransferase (ALAT) and g-glutamyltranspeptidase (GGT) as a biological indicator (Di Lorenzo et al. 2003; Altuntas et al. 2002; Cheng et al. 1999; Giannini et al. 1999).
This study focuses on relationship between pesticide exposures with level of liver enzymes among the farmers in Muar, Johor. The specific objectives of the study are to identify relationship between pesticide exposure durations with the liver enzyme level, frequency of handling the pesticides and using PPE when applying the pesticides, compare the liver enzyme level between exposure group and comparative group and finally identify the factor which can influence the liver enzyme lever at farmer who exposed to pesticides. In agriculture base country like Malaysia, surprisingly there are relatively little liver enzyme researches on workers occupationally exposed to pesticides. In Malaysia, pesticides are typically applied to vegetable crops, palm oil plantations and tobacco farming. Safety measures are generally poorly applied and workers lack proper knowledge or training in safe handling of these chemicals.
Materials And Methods
Research ethic: An official permission letter was obtained from University Research Committee to ensure this study get cooperation from respondents. The purpose of the study was explained to the Vegetable Farmers Society in Muar district, Johor and Health District Office in Kemaman, Terengganu. All respondents in this study were volunteers who signed a statement of formal consent before testing. The consent form was developed according to the international ethical guidelines for biomedical research involving human subjects prepared by the Medical and Health Sciences Research Ethical Committee.
Sampling: This cross-sectional study using purposive sampling base on inclusion criterion. Forty seven (47) males were recruited from those who are working with pesticide in farms and meet the inclusion study criteria such as Malay or Indonesian, age in the range of 20 to 40 years old, no medical conditions such as diabetes mellitus, liver or kidney disease, immunology disorder, peripheral neuropathy, vitamin deficiency, anaemia and drug addiction, not alcohol drinker and not smoking and exposed to pesticide more than 5 years. Previous studies showed length of exposure more than 5 years to pesticides significantly showed the health impact (Altuntas et al. 2002; Bazylewicz-Walczak et al. 1999; Cheng et al. 1999). Comparative group are 45 male workers at Kemaman District Health Office and they
also meet the inclusion study criteria except that they are not occupationally exposed to pesticides.
Instrumentations: Questionnaire was used to obtain the demographic, socio-economic and pesticide exposures among respondents. The questionnaire was administrated through face-to-face interview. Certified nurse took a 5 ml sample of venous blood under complete aseptic precautions from 47 exposed and 45 unexposed respondents. Blood samples were sent to certified university laboratory for analysis of Alanine aminotransferase (ALAT) and γ-glutamyltranspeptidase (GGT) using Hitachi 902 automated analyzer from Boehringer & Mannheim, Germany with standard method reagents (Verplanke et al. 2000). Blood samples were collected form all respondents after completion of the questionnaire and health examination.
Data analysis: All data were analysed using Statistical Package for Science Social (SPSS) version 11.5. Descriptive information generated from all variables. Non-normal distribution of variables for ALAT and GGT were transformed logarithmically, but the distributions are still not normal. Non-parametric Mann-Whitney U tests were used to compare the median of the ALAT and GGT between exposed and unexposed respondents. The Spearman’s rho tests were used to define the correlation between occupational exposures with enzymes level. Repeated measurement analysis was performed with the multiple regression model using enter method to define the influence of occupational exposure on level enzymes of exposed workers after adjustment for confounders.
Results
Demographics: There are 92 volunteers respondent involved in this study. Forty-seven (47) of them are exposed to pesticide and 45 are comparative group. The mean age of the comparative respondents (32.7 years) was slightly older than that of exposed respondents (31.7 years), but the difference was not significant (p=0.714), (Table 1). The mean educational level of the exposed respondents was 9.1 years whereas the mean for the comparative group was 10.5 years. This difference was also not significant (p=0.772). The mean income of the comparative respondents (RM644.90) was slightly higher than that of exposed respondents (RM628.70), but the difference was not significant (p=0.457). The mean years of working of the exposed respondents were 11.4 years and the mean of that for the comparative group was 12.7 years. This difference was also not significant (p=0.684).
Liver enzymes level: Distribution of enzymes GGT and ALAT for exposed group is shown in Figure 1 and 2, meanwhile for comparative group it is shown in Figure 3 and 4. For exposed group, the mean of GGT was 63.5 Units/L and ALAT was 61.9 Units/L, significantly higher

December 2014, vol 11, No. 2Journal of Occupational Safety and Health
71
compared to comparative group while the mean of GGT was 20.7 Units/L and ALAT was 23 Units/L. All of this data distribution was not normally distributed. Non-parametric difference Mann-Whitney U test showed there was significant difference between exposed and comparative group on GGT (p≤0.001) and ALAT level (p≤0.001), (Table 2).
Occupational factors and liver enzymes: Five occupational factors have been measured in this study which are years of working, number of pesticide used per day, frequency of handling pesticide per day, pesticide spraying durations and personal protective equipment (PPE) scores. Result showed both GGT and ALAT enzyme levels have significant correlation with pesticide spraying durations (p=0.004; p=0.002) and personal protective equipment (PPE) scores (p=0.006; p=0.001), (Table 2). Pesticides spraying duration was the
occupational exposure factor which has most influence on GGT (p<0.001), (Table 3) and ALAT (p<0.001), (Table 4) enzyme levels among exposed group after adjustments for all confounders in this study.
Discussion
Table 1 showed this exposed and comparative group also have been matched successfully with their age (p=0.714), educational level (years) (p=0.772), income (RM) (p=0.457) and years of working (years) (p=0.684).
Results showed that was a significant difference between exposed and comparative groups for GGT and ALAT enzyme levels. Mean value for GGT enzyme of exposed group was 63.5 ± 46.5 U/L which is 3 times higher compared to the comparative group which was 20.7 ± 23.1 U/L. Same pattern of results for enzyme
14
Table 1 : Socio-economic background for all respondents
Variable
Mean SD
t
value
p value
Exposed (n=47)
Comparative
(n=45)
Age (years)
31.7 8.1
32.7 10.4
-0.944
0.714
Educational level (years)
9.1 2.9
10.5 2.2
-0.872
0.772
Income (RM)
628.7 86.2
644.9 94.4
-1.083
0.457
Years of working (years)
11.4 6.1
12.7 9.0
-0.788
0.684
N=92 Table 2 : Correlations between enzymes GGT and ALAT with occupational
factors among exposed workers
Occupational factors
GGT level (Units/L)
ALAT level
(Units/L)
r value
p value
r value
p value
Years of working (years)
0.144
0.333
-0.026
0.863
No. of pesticide used per day
-0.215
0.146
-0.258
0.080
Frequency of handling pesticide per day
0.142
0.341
0.106
0.476
Pesticide spraying duration (hours)
0.412
0.004**
0.445
0.002**
PPE scores
-0.397
0.006**
-0.478
0.001**
N=47 ** Significant at p 0.01, correlations using Spearman’s rho Test

Journal of Occupational Safety and HealthDecember 2014, vol 11, No. 2
72
ALAT, where the mean value for exposed group was 61.9 ± 68.9 U/L meanwhile for comparative group was 22.9 ± 10.8 U/L.
Increments of liver enzymes are significantly higher among individuals who were exposed to pesticides and that was the fact supported by many previous studies (Arndt et al. 1998; Mage et al. 2000; Bazylewicz-Walczak 1999). Study by Azizi 2000, purposely to investigate the effects of insecticides on liver enzymes among sprayers working at Health Department of Kuala Lumpur Municipal Council also found that AST, ALAT and GGT enzymes were significantly higher in exposed group compared to comparative group. Upfal, 1992 in his study also found that liver enzyme levels among technical and services electronic workers are higher and not normal and they caused by exposure to organic
solvents such as xylene, acetone, benzene and others.
This study also found that pesticide spraying durations and total PPE scores were the only factors significantly influencing the level of GGT and ALAT enzyme of exposed group. Other factors such as years of working, number of pesticides used per day and frequency of handling pesticides per day was not significantly correlated with level of liver enzymes. Study by Arndt 1998, found that were no significant correlations between exposure duration of organic solvents on increasing of liver enzymes among construction workers, but the level of liver enzymes are significantly higher compared to normal populations. Bazylewicz-Walczak, 1999 in his study found that years of education, pesticides spraying durations and total PPE score were the major factors contributed to liver enzymes increment among
17
Enzyme GGT (units/L)
200.0180.0
160.0140.0
120.0100.0
80.060.0
40.020.0
Freq
uenc
y16
14
12
10
8
6
4
2
0
Std. Dev = 46.54 Mean = 63.5
N = 47.00
Figure 1 : Distributions of enzyme GGT among exposed respondents
Enzyme ALT (units/L)
325.0300.0
275.0250.0
225.0200.0
175.0150.0
125.0100.0
75.050.0
25.0
Freq
uenc
y
30
20
10
0
Std. Dev = 68.96 Mean = 61.9
N = 47.00
Figure 2 : Distributions of enzyme ALAT among exposed respondents

December 2014, vol 11, No. 2Journal of Occupational Safety and Health
73
15
Table 3 : The influence of occupational exposure on GGT enzyme level of exposed
workers after adjustments for confounders
Independent Variable
GGT enzyme level (Units/L)
Regression coefficient ()
t
value
p
value
Constant ()
-147.402
-1.372
0.178
Age (years)
0.353
0.892
0.378
Educational level (years)
-0.198
-1.153
0.256
Household income (RM)
0.411
1.006
0.321
Years of working (years)
-0.850
-1.937
0.060
No. of pesticide used per day
0.085
0.622
0.538
Frequency of handling pesticide per day
0.341
2.427
0.020*
Pesticide spraying durations (hours)
0.710
6.676
0.001**
PPE scores
-0.159
-1.348
0.186
N=47 * Significant at p 0.05 ** Significant at p 0.01 r = 0.798 R2 = 0.561 (enter method) F = 8.345 p 0.001
agriculture workers. Another study by Tomei et al. 1998, found there were significant correlation between years of working with liver enzymes level among environmental disinfestation workers.
Study by Sunding and Zivin 2000, found that pesticide poisoning was influenced by the frequency of handling pesticide per day, number of pesticide used per day and pesticide spraying durations. This study also found the levels of enzyme GGT and ALAT of exposed group was significantly influenced by pesticide spraying durations (r=0.412; p=0.004), (r=0.445; p=0.002) and total PPE scores (r=-0.397; p=0.006), (r=-0.478; p=0.001).
Others study by Tomei et al. 1998 and Giannini et al. 1999 were designed to study the liver damage cause by toxic waste and pesticides in occupational exposure. These study found the amount of pesticide dose, duration of spraying time and the PPE application have a significant correlations with liver diseases.
This study also has the confounding factors such as
demographic and socio-economic factors. In multiple regression statistical analysis after adjustment of the confounding factors, result shows that frequency of handling pesticide per day (β=0.341; p=0.020) and pesticide spraying duration (hours) (b=0.710; p<0.001) influence the enzyme GGT level among exposed workers. Meanwhile this study also found that years of working (years) (β=-1.121; p=0.034) and pesticide spraying duration (hours) (β=0.574; p<0.001) influence the enzyme ALAT level among exposed workers, after adjustment of the confounding factors. Study by Sunding and Zivin 2000, also found the supportive results which is after adjustment of their study confounding factors they still get the significant correlation between GGT level with frequency of handling pesticide per day, number of pesticide used per day and pesticide spraying durations.
Conclusion
In conclusion, this study found there are significant differences of liver enzyme (GGT & ALAT) levels between exposed group and comparative group due to pesticides exposure. Other than that this study also

Journal of Occupational Safety and HealthDecember 2014, vol 11, No. 2
74
found there are significant correlations between liver enzyme (GGT & ALAT) level with pesticide spraying durations (hours) and PPE score. After adjustment of the confounding factors, result shows that frequency of handling pesticide per day and pesticide spraying duration (hours) influence the enzyme GGT level among exposed workers, meanwhile years of working and pesticide spraying duration (hours) influence the enzyme ALAT level among exposed workers.
Aknowledgement
This study could not have been achieved without the complete cooperation of the vegetable farmers from Muar district, Johor especially Mr. Tan Hang Wee and Mr. Koo Yao Jin and the staff of Kemaman District Health Office, Terengganu, to whom we are very grateful. We express our gratitude to Ms. Siti Hawa Zaid and Ms. Faeida Elymie Abdul Rahim from the Biotech Laboratory for their technical assistance in the fieldwork and the laboratory analyses. We are grateful to Dr. Kamaria and Mr. Loh Swee Ann for their help in the analysis of liver function variables. The workers at the regional occupational health services in Clinic Bukit Gambir, Muar especially Mrs. Lee Jing Wen and Ms. Lim Kah Yin have been very helpful in the collection of
biological samples of the exposed workers.
References
(1). Altuntas, I., Delibas, N., Demirci, M., Kilinc, I. and Tamer, N. : 2002, The effects of methidathion on lipid peroxidation and some liver enzymes: role of vitamins E and C. Arch Toxicol. 76(8), 470-3.
(2). Anger, W.K., Storzbach, D. and Amler, R.W. : 1998, Human behavioral neurotoxicology: workplace and community assessments. In: Rom WN, ed. Environmental and occupational medicine, 3rd edn. Philadelphia: Lippencott-Raven, pp 709–28.
(3). Arndt, V., Brenner, H., Rothenbacher, D., Zschenderlein, B., Fraisse, E. and Fliedner, T.M. : 1998, Elevated Liver Enzyme Activity In Construction Workers : Prevalence And Impact On Early Retirement And All Cause Mortality. Int Arch Occupational Enviromental Health. 71, 405-412.
(4). Azizi, M.N. : 2000, Effects of insecticides on liver enzymes among sprayer working at Health Department of Kuala Lumpur Municipal Council. Msc Thesis, University Putra Malaysia.
16
Table 4 : The influence of occupational exposure on ALAT enzyme level of
exposed workers after adjustments for confounders
Independent Variable
ALAT enzyme level (Units/L)
Regression coefficient ()
t
value
p
value
Constant ()
-190.279
-1.027
0.311
Age (years)
0.653
1.418
0.164
Educational level (years)
-0.156
-0.778
0.441
Household income (RM)
0.274
0.576
0.568
Years of working (years)
-1.121
-2.196
0.034*
No. of pesticide used per day
-0.020
-0.127
0.899
Frequency of handling pesticide per day
0.218
1.336
0.189
Pesticide spraying durations (hours)
0.574
4.635
0.001**
PPE scores
-0.111
-0.809
0.424
N=47 * Significant at p 0.05 ** Significant at p 0.01 r = 0.713 R2 = 0.405 (enter method) F = 4.919 p 0.001

December 2014, vol 11, No. 2Journal of Occupational Safety and Health
75
18
Enzyme GGT (units/L)
120.0110.0
100.090.0
80.070.0
60.050.0
40.030.0
20.010.0
0.0
Freq
uenc
y
30
20
10
0
Std. Dev = 23.09 Mean = 20.7
N = 45.00
Figure 3 : Distributions of enzyme GGT among comparative respondents
Enzyme ALT (units/L)
55.050.0
45.040.0
35.030.0
25.020.0
15.010.0
5.0
Freq
uenc
y
16
14
12
10
8
6
4
2
0
Std. Dev = 10.87 Mean = 23.0
N = 45.00
Figure 4 : Distributions of enzyme ALAT among comparative respondents
(5). Bazylewicz-Walczak, B., Majczakowa, W. and Szymczak, M. : 1999, Behavioral effects of occupational exposure to organophosphorous pesticides in female greenhouse planting workers. Neurotoxicology. 20, 819–26.
(6). Cheng, T.J., Huang, M.L., You, N.C., Du, C.L. and Chau, T.T. : 1999, Abnormal liver function in workers exposed to low levels of ethylene dichloride and vinyl chloride monomer. J Occup Environ Med. 41(12), 1128-33.
(7). Di Lorenzo, L., Corfiati, M., Bulfaro, D., Liuzzi, G., Zenzola, M. and Soleo, L. : 2003, Aspartate aminotransferase (AST) to alanine aminotransferase (ALT) ratio in health surveillance of workers exposed to vinyl chloride monomer. G Ital Med Lav
Ergon. 25(3), 109-11.
(8). El Sebae AH. : 1993, Special problems experienced with pesticide use in developing countries. Regul Toxicol Pharmacol. 17, 287–91.
(9). García AM. : 1998, Occupational exposure to pesticides and congenital malformations: a review of mechanisms, methods and results. Am J Ind Med. 33, 232–40.
(10). Geoffrey, C. M., Mehler, L. N., Rosales, R., and Baum, L. : 2003, Acute Pesticide-Related Illness Among Working Youths 1988-1999. American Journal of Public Health. 93, 605-610.
(11). Giannini, E., Botta, F., Fasoli, A., Ceppa, P., Risso, D., Lantieri, P.B., Celle, G. and Testa, R. :

Journal of Occupational Safety and HealthDecember 2014, vol 11, No. 2
76
1999, Progressive liver functional impairment is associated with an increase in AST/ALT ratio. Dig Dis Sci. 44(6), 1249-53.
(12). Mage, D.T., Alanvanja, M.C.R., Sandler, D.P., Mcdonnell, C.J., Kross, B., Rowland, A. and Blair. A. : 2000, A Model For Predicting The Frequency Of High Pesticide Exposure Events In The Agricultural Health Study. Enviromental Research Section. 83, 67-71.
(13). Stephens, R., Spurgeon, A. and Calvert, I.A. : 1995, Neuropsychological effects of long term exposure to organophosphates in sheep dip. Lancet. 345, 1135–9.
(14). Stopford, W. : 1999, The Toxic Effects Of Pesticides. Van Nastrand Reinhold, New York. pp 211-228.
(15). Sunding, D. and Zivin, J. : 2000, Insect Population Dynamics, Pesticide Use And Farm worker Health.
American Agricultural Economics. 82, 527-540.
(16). Tomei, F., Biagi, M., Baccolo, T.P., Tomao, E., Giuntoli, P. and Rosati, M.V. : 1998, Liver Damage Among Environmental Disinfestations Workers. J. Occup Health. 40, 193-197.
(17). Upfal, M. : 1992, Liver Enzymes among Microelectronics Equipment Maintenance Technicians. Journal Occupational Medicine. 34(4), 384-390.
(18). Verplanke, A.J.W., Bloemen, L.J., Brouwer, E.J., Van Sittert, N.J., Boogaard, P.J., Herber, R.F.M. and De Wolff, F.A. : 2000, Occupational exposure to cis-1,3-dichloropropene: biological effect monitoring of kidney and liver function. Occup Environ Med 57, 745-751.
December 2014, vol 11, No. 2Journal of Occupational Safety and Health
77
DNA Changes in Lymphocytes among Malaysian Traffic Police Officers Exposed to Air Pollutants
Nur S Sulaiman. 1 & Zurahanim F.A. 1 1 Environmental Health Research Centre, Institute for Medical Research, Jalan Pahang, Kuala Lumpur, 50588,
Malaysia
Correspondence address: Dr. Nur Suffia Sulaiman, Environmental Health Research Centre, Institute for Medical Research, Jalan Pahang, 50588 Kuala Lumpur. Phone : 03-2616 2733/ 012 335 3234 Fax :03-2692 6542
Email: [email protected]
______________________________________________________________________________
Abstract
Traffic policemen are exposed to air pollutants in their daily work. Air pollutants which may come from vehicle exhaust, contains genotoxic and carcinogenic substances, such as polycyclic aromatic hydrocarbons (PAHs) and benzene. To compare the DNA damage in lymphocytes of traffic policemen exposed to air pollution with non-exposed indoor workers and if any other individual, occupational and environmental factors were associated with DNA damage. A cross-sectional study was undertaken to determine DNA damage in peripheral blood lymphocytes in three urban areas in Klang Valley in Malaysia among traffic policemen and control indoor workers. Single Cell Gel Electrophoresis (SCGE) or Comet Assay was carried out on blood samples to determine the extent of DNA damage. A total of 66 participants, comprising of 34 traffic police officers and 32 indoor office workers were recruited. There was a significant difference between the percentage of mean Percent Tail DNA (damaged DNA) of the two groups, that is 6.4% among the traffic police officers and 5.7% among indoor workers. Number of cigarette-years showed a significant, moderate association with increased DNA damage in lymphocytes. There was increased DNA damage in lymphocytes of traffic police officers compared to indoor workers. Other factors associated with increased DNA damage was the number of cigarette-years and geographical location. More studies are required to look at the long term effects or constant exposure to environmental vehicle exhaust. Steps should be taken to reduce exposure to air pollutants among traffic policemen.
Key words: DNA damage, Comet assay, single-cell gel electrophoresis, policemen, air pollution.
_____________________________________________________________________________
Introduction
Outdoor workers are exposed to outdoor air pollution which may occur naturally or are man-made. With industrialization, many factories and vehicles emit smoke which affect air quality. Exposure to constituents of air pollution can damage bio-molecules in humans and animals and cause diseases such as cancer (Kampa,2008; Moller,2008; Risom, 2005). Man-made air pollution consists of polycyclic aromatic hydrocarbons (PAH) and volatile organic compounds (VOC) which derive from combustion processes associated with industries and traffic vehicles (Moller;2008). Exposure to outdoor air pollution and its particulate matter has been classified as carcinogenic to humans by the International Agency for Research in Cancer (IARC,2014). Increased DNA damage was seen in lymphocytes of workers exposed to traffic exhaust and persons living in areas with air pollution. Oxidative DNA damage in circulating lymphocytes has been associated with exposure to ozone, benzene, carcinogenic polycyclic aromatic hydrocarbon (c-PAH) concentrations in air (Fanou,2006; Palli,2009; Singh 2007a; Sul,2005).
Studies have been conducted to look at the DNA damage among workers exposed to air pollutants, which include outdoor workers, policemen in Prague and Rome, coke oven workers, and rickshaw pullers (Carere, 2002; Novotna, 2007;Tovalin,2006;Wang, 2007). Greater DNA damage was seen among outdoor workers in Mexico City and related to higher levels of PM 2.5, ozone and some VOCs (Carere, 2002). A study among Prague policemen outdoors showed higher DNA damage in those who worked outdoors compared to indoors (Wang, 2007). DNA damage in lymphocytes may be affected by other factors, such as air pollution exposure levels, tobacco smoking and genotype variability (Carere, 2002; Novotna,2007; Singh,2007b). Physical activity and dietary intake of micronutrients such as certain vitamins may also play a role in DNA damage in blood lymphocytes (Fenech,2011, Lee, 2009;Pandey,2006;Singh, 2007b).
Many environmental and occupational studies use the Comet Assay (Single Cell Gell Electrophoresis) to evaluate DNA damage (Faust, 2004; Moller, 2006; Velverde,2009). The alkaline comet assay detects DNA
December 2014, vol 11, No. 2 : 77-82

Journal of Occupational Safety and HealthDecember 2014, vol 11, No. 2
78
double strand breaks, single-strand breaks, alkali labile sites and DNA cross-linking. Isolated peripheral blood lymphocytes undergo electrophoresis on agar and cells are seen as ‘comets’. Damaged DNA will be seen as ‘comet tails’ which are analysed. DNA damage can be estimated with the use of a computerized automated image analysis system (Velverde,2009). Percent Tail DNA (%Tail DNA) appears to be the best measurement to conceptualize DNA damage (Kumaravel,2006;Moller,2006).
The aim of this study was to compare the DNA damage in lymphocytes of traffic policemen exposed to air pollution with non-exposed indoor workers and if any other individual, occupational and environmental factors were associated with DNA damage.
Materials And Methods
Study subjects: A cross-sectional study was undertaken in Klang Valley, Malaysia, under non-haze conditions, among volunteer traffic police officers in the urban areas of Kuala Lumpur, Ampang and Shah Alam in Malaysia. All areas were busy urban areas with many offices and heavy traffic circulation. As for the non-exposed group, they were indoor office workers from the same areas who were not occupationally exposed to strong chemicals, petroleum fumes, air pollution or physically strenuous activities. Only male participants were chosen as the vast majority of traffic policemen are males in Malaysia and controls were matched by age and location to the exposed study samples.
Self-administered questionnaires: Participants filled out questionnaires, for demographic details and factors that may contribute to DNA damage such as smoking habits, prior physical activity, hobbies, recreational activity, mode of transportation and other exposures to air pollution such as proximity of living quarters to high traffic areas, factories and petrol kiosks.
Blood sampling: Blood was collected by finger prick at mid-morning for both groups of workers, which coincide with after the early morning traffic duty for traffic policemen. Samples were taken in dim lighting conditions (to reduce DNA damage by UV light) and transported in heparinised plain tubes, shielded from light. The samples were transported at 4°C to the laboratory where they were processed immediately, also in dim lighting conditions.
DNA damage analysis: For DNA damage analysis, the alkaline version of the Single Cell Gell Electrophoresis (SCGE) or Comet Assay was carried out on blood samples to determine the extent of DNA damage to lymphocytes. Ten-microlitres of blood was mixed with 80 µl of low melting agar (LMA). This mixture was placed on a layer of solidified normal melting agar on a slide and covered with a coverslip. The slide was placed in a cold lysis buffer solution: 2.5M NaCl, 10mM Dinatrium EDTA,
10mM Tris, 1% Triton X-100 and 10% DMSO. After 1 hour, slides were removed and drained, and placed in electrophoresis apparatus filled with electrophoresis buffer (freshly made and cold): 300mM NaOH, 1 mM EDTA and left for 20 minutes for the DNA to unwind. Electrophoresis was later carried out (voltage of 25 V, current of 300 mA) for 20 minutes. The slides were then drained and washed with a neutralisation buffer (3 times, with 5 minutes in between). The drained slides were then stained with 45µl of ethidium bromide, placed in light-proof boxes and kept moist with PBS. Two slides were prepared for each respondent. An Olympus fluorescence microscope connected with a CCD camera was used to capture pictures of 50 lymphocytes on each slide, at random, for analysis of DNA damage. A total of 100 pictures of lymphocytes were analysed for damage using the Komet 6.0 Software (Kinetic Imaging Ltd.) on a computer. Average percent tail DNA readings were taken for each respondent.
Statistical analyses: For data analysis, the statistical software SPSS Version 16.0 was used. Data was examined for skewness and as there was normal distribution, parametric tests were carried out. Continuous variables were analysed by Independent-Samples T-test and one-way ANOVA (analysis of variance). Pearson’s correlation was used to determine correlations between risk factors and DNA damage (% tail DNA).
Ethical approval: The study was conducted with the approval of the Medical Research Ethics Committee of the Ministry of Health, Malaysia. Respondents were given information leaflets and briefed on the details of the study. Informed consent was obtained from each respondent.
Results
There were 66 respondents in the study, which comprised of 34 male traffic police officers and 32 male indoor office workers which consisted of hospital attendants, clerks, researchers, executives, trainers and operators. There was no significant difference between age and smoking status between the traffic policemen and the indoor workers group. However, the policemen significantly smoked more cigarettes per day, compared to the indoor worker group. They were all significantly more exposed to environmental tobacco smoke (passive smoking) either at home or at their workplaces compared to the indoor workers, where 84.4% were exposed (see Table 1).
All the traffic policemen used motorcycles for mode of transportation while the indoor workers used mostly motorcycles (56.3%), followed by cars (31.3%), bus (9.4%) and the minority walked to work (3.1%). For the exposed group, the majority (73.5%, n=25) worked 5 years or less in traffic duty, with a mean of 6 working days a week (mean=6.2, s.d.=1.0) with 7

December 2014, vol 11, No. 2Journal of Occupational Safety and Health
79
17
TABLES 1-3
Table 1. Demographic details of respondents and exposure to tobacco
Traffic Policemen (n=34)
Indoor workers (n= 32)
p-value
Age (mean, s.d.) 35.2 (s.d.=9.21) 36.6 (s.d.=10.99) 0.59 Smoking status (n, % ) 18 (52.9%) 15 (46.9%) 0.62
Cigarettes per day (mean, s.d.) 15.83 (s.d.=5.22) 8.28 (s.d.=6.11) <0.001* Environmental tobacco smoke (n,%) 34 (100%) 27 (84.4%) 0.023*
Workplace: Kuala Lumpur
Ampang Shah Alam
10 10 14
12 10 10
0.674
Mean years in service (mean, s.d.) 13.70 (s.d.=8.98) 10.51 (s.d.=11.26) 0.207 *denotes significance of p-value <0.05
Table 2. DNA damage among respondents DNA damage
(%Tail DNA) p-value
Respondent Group Traffic Policemen 6.42 Controls 5.74 0.042*
Smoking Status Smokers 6.18 Non-smokers 6.00 0.589
Geographical location Kuala Lumpur 5.62
Ampang 5.90
Shah Alam 6.69 0.023*
(*)denotes significance of p-value which is less than 0.05
hours of daily exposure to traffic (mean=6.8, s.d.=2.4). The majority of traffic policemen (79%, n=27) did not wear any face masks while on duty, while 12 % (n=4) used them sometimes and 9 % (n=3) rarely used them. It was commented by some respondents that face masks hindered their use of their police whistles while on duty.
DNA damage: Overall, there was significantly more DNA damage among the traffic policemen. The mean % tail DNA among the traffic policemen was 6.42% (s.d.=1.60), while in the non-exposed indoor workers, it was 5.74% (s.d.=1.04) (p=0.042). (Figure 1)
By geographical location, overall, respondents from Kuala Lumpur had the lowest DNA damage, % tail DNA was 5.62% in Kuala Lumpur, 5.90% in Ampang and highest at Shah Alam, at 6.69%. There was a significant difference between the % tail DNA percentage between Shah Alam and Kuala Lumpur (p=0.023). This was similarly reflected among the police traffic officers, where there was a significant difference between % tail DNA of all three areas, with Shah Alam having the highest DNA damage (7.69%), followed by Ampang (6.39%) and Kuala Lumpur which had the lowest DNA damage (4.69%) (p< 0.001) as shown in Figure 2 and Table 2.
There was no significant difference of DNA damage (% tail DNA) between smokers and non-smokers in general. However, a significantly moderate increase in DNA damage was associated with the number of cigarette-years of respondents (multiplication of sticks of cigarettes and years of smoking) (r=0.425, p=0.014). No significant correlation was found between age and DNA damage. See Tables 2 and 3.
Among the police officers, there was no significant increase in the percentage of Tail DNA with years in traffic duty or weekly hours of exposure. Due to the small sample size and that all the traffic policemen used motorcycles as their main mode of transport, analysis of DNA damage according to most frequent mode of transport was not feasible. Information on other exposures to air pollution such as part-time work or hobbies involving petrol or strong chemicals, or living near petrol kiosks, heavy traffic areas, rubbish dumping grounds or printing factories were also obtained. Respondents were also asked if they had engaged in rigorous exercise (which could also induce DNA damage) on the morning before their blood was taken. However, very few respondents answered “yes” to any of these factors, so they could not be analysed.
18
Table 3. Correlation between DNA damage and individual and working factors
Factors Correlation, r p-value
Age 0.085 0.499
Cigarette-years
(‘cigarettes a day’ x ‘number of years of smoking’)
0.425 0.014*
Years in traffic duty (for policemen) 0.216 0.221
(*)denotes significance of p-value which is less than 0.05
FIGURES 1 & 2
Figure 1. Distribution of %Tail DNA among respondents
Figure 1. Distribution of %Tail DNA among respondents
19
Figure 2. Distribution of %Tail DNA among traffic police officers at different workplaces.
Figure 2. Distribution of %Tail DNA among traffic police officers at different workplaces.

Journal of Occupational Safety and HealthDecember 2014, vol 11, No. 2
80
17
TABLES 1-3
Table 1. Demographic details of respondents and exposure to tobacco
Traffic Policemen (n=34)
Indoor workers (n= 32)
p-value
Age (mean, s.d.) 35.2 (s.d.=9.21) 36.6 (s.d.=10.99) 0.59 Smoking status (n, % ) 18 (52.9%) 15 (46.9%) 0.62
Cigarettes per day (mean, s.d.) 15.83 (s.d.=5.22) 8.28 (s.d.=6.11) <0.001* Environmental tobacco smoke (n,%) 34 (100%) 27 (84.4%) 0.023*
Workplace: Kuala Lumpur
Ampang Shah Alam
10 10 14
12 10 10
0.674
Mean years in service (mean, s.d.) 13.70 (s.d.=8.98) 10.51 (s.d.=11.26) 0.207 *denotes significance of p-value <0.05
Table 2. DNA damage among respondents DNA damage
(%Tail DNA) p-value
Respondent Group Traffic Policemen 6.42 Controls 5.74 0.042*
Smoking Status Smokers 6.18 Non-smokers 6.00 0.589
Geographical location Kuala Lumpur 5.62
Ampang 5.90
Shah Alam 6.69 0.023*
(*)denotes significance of p-value which is less than 0.05
18
Table 3. Correlation between DNA damage and individual and working factors
Factors Correlation, r p-value
Age 0.085 0.499
Cigarette-years
(‘cigarettes a day’ x ‘number of years of smoking’)
0.425 0.014*
Years in traffic duty (for policemen) 0.216 0.221
(*)denotes significance of p-value which is less than 0.05
FIGURES 1 & 2
Figure 1. Distribution of %Tail DNA among respondents
Discussion
Many factors can influence DNA damage. Such factors include age, smoking, gender, diet, exercise and exposure to air pollution (Fenech,2011; Moller,2006). A pooled analysis also found a negative correlation with latitude and DNA damage (Moller,2006). Genotype variability also appears to play a role in a person’s susceptibility to DNA damage and vitamin C tended to protect DNA integrity (Novotna,2007).
Our preliminary study reflects similar results of increased DNA damage in lymphocytes of outdoor workers exposed to air pollutants such as in other studies (Novotna,2007; Palli,2009;Tovalin,2006). A study among police officers in Prague found that among non-smoking police officers, those who worked outdoors had more DNA damage in lymphocytes compared to those who worked indoors, and this damage showed inter-seasonal variability, with more DNA damage seen in the colder climate, when there was a higher level of c-PAHs (carcinogenic polycyclic aromatic hydrocarbons) and particulate matter (PM 2.5) in the air (Giovanelli,2006; Novotna,2007). Seasonal variability may not be applicable to the tropical climate of a country like Malaysia. Studies among persons exposed to increased traffic air pollution, such as children in Thailand (Buthbumrung,2008), residents in urban areas in Benin (Fanou,2006) and Shenyang city in China (Ishikawa,2006), also showed increased DNA damage in lymphocytes. Another study carried out at Mexico City and Puebla showed that DNA damage in lymphocytes
increased with more exposure to particulate matter, PM 2.5, ozone, and 1-ethyl, 2-methyl benzene exposure (Tovalin,2006). A study among residents in Florence, Italy also showed a positive association between DNA damage and exposure to air pollution, and this was also seen among those who were occupationally exposed (Palli,2009). A recent cohort study following up Taiwanese traffic conductors between the years 2009 to 2011 provide further evidence to link between exposure to fine particulates in air pollution to DNA damage (Huang,2012).
Another occupational health study looked at rickshaw pullers in India, where heavy physical activity for 7 to 9 hours of pulling rickshaws in polluted outdoor air caused increased DNA damage compared to other outdoor workers who did not engage in heavy physical activity outdoors (Pandey,2006). Smoking and increasing age have been shown to be associated with peripheral lymphocytic DNA damage in some studies (Carere,2002; Fracasso,2006; Moller,2006; Zhu,2001). Our study showed a moderate significant correlation between cigarette-years (number of cigarettes per day multiplied by number of years of smoking) and DNA damage seen in lymphocytes (r=0.43, p=0.014). However, no significant relationship was found between age and DNA damage in our sample.
Geographical variations may occur due to the topography of the area where respondents were tested. In general, significantly higher DNA damage was found in persons working in Shah Alam in our study. The reason

December 2014, vol 11, No. 2Journal of Occupational Safety and Health
81
for this is uncertain. Further studies are required to look at air quality indices which may vary between the three urban sites. In past years, Shah Alam suffered poor air quality (more so than the neighbouring cities) when Malaysia was affected by trans-boundary haze. In this study, environmental factors, such as the topography or existence of factories, may have a role in the level of air pollutants exposure among traffic policemen and DNA damage that occurs in lymphocytes.
Study limitations include the cross-sectional study design which shows only the DNA damage of participants at one point of time. The results should be interpreted with care as there was a small sample size and that it was conducted on volunteers. Another limitation is that workers commute daily and may live in one area and work in another city. Future studies could focus on a longitudinal study and include more respondents to allow analysis of occupational, environmental or other individual exposure factors. Personal air samplers for workers to wear would capture real-time air exposures to the different types and levels of air pollutants at the breathing zone. A concurrent study on air quality in the geographical locations will give more insight on environmental factors which affect exposure to air pollutants among exposed workers. Also, the availability of an automated DNA damage analyser would increase efficiency of sample analysis, as analysing DNA damage individually for each sample of blood lymphocyte is time-consuming.
Policemen should be educated to be aware of the hazards of exhaust fumes and encouraged to wear respirators or masks for protection. Masks designed for police should take into account their need to blow whistles and communicate to drivers to direct traffic effectively. Reduction of exposure to such fumes can be achieved by reducing traffic duty hours and rotation of schedules between police officers. More steps could be taken to encourage the public to take public transport, car pool or use electric cars to reduce traffic emissions. Traffic policemen should also be followed up with health assessments (Gupta, 2011). It would also be recommendable that all cancer registries include the occupation of patients. This would facilitate detection of malignancies among different categories of workers and prompt any preventive measures.
Conclusion
There was increased DNA damage in lymphocytes of traffic police officers compared to indoor workers. Other factors associated with increased DNA damage was the number of cigarette-years and geographical location of Shah Alam, compared to Kuala Lumpur and Ampang. More studies are required to look at the long term effects of constant exposure to environmental vehicle exhaust. Efforts should be taken to reduce traffic policemen exposure to exhaust fumes.
Acknowledgements
We would like to thank the Director General of the Ministry of Health, Director of the Institute for Medical Research (IMR), Kuala Lumpur and the Head of the Environmental Health Research Centre (EHRC),IMR, for their support in this study. We greatly appreciate Dr Nor Fadilah Rajab for her technical expertise and all research officers and medical lab technicians involved. Many thanks to the Department of Environment, Royal Malaysian Police and all office workers involved in this study.
References
(1). Buthbumrung, N., Mahidol, C., Navasumrit, P., Promvijit,J., Hunsonti,P., Autrup, H., Ruchirawat, M. (2008). Oxidative DNA damage and influence of genetic polymorphisms among urban and rural schoolchildren exposed to benzene. Chemical-Biological Interactions, 172 , 185-194.
(2). Carere, A., Andreoli,C., Galati, R., Leopardi, P., Marcon, F., Rosati, M.V.,...Crebelli, R. (2002). Biomonitoring of exposure to urban air pollutants: analysis of sister chromatid exchanges and DNA lesions in peripheral lymphocytes of traffic policemen. Mutation Research, 518, 215–224.
(3). Fanou, L.A., Mobio, T.A., Creppy, E.E., Fayomi, B., Fustoni, S., Moller, P., …Autrup,H.(2006). Survey of air pollution in Cotonou, Benin- air monitoring and biomarkers. Science of the Total Environment, 358, 85-96.
(4). Faust, F.,Kassie, F., Knasmüller, S., Boedecker, R.H., Mann, M., Mersch-Sundermann, V. (2004). The use of the alkaline comet assay with lymphocytes in human biomonitoring studies. Mutation Research, 566, 209–229.
(5). Fenech, M. & Bonassi, S. (2011). The effect of age, gender, diet and lifestyle on DNA damage measures using micronucleus frequency in human peripheral blood lymphocytes. Mutagenesis, 26(1), 43-49.
(6). Fracasso, M.E., Doria, D.,Franceschetti, P., Perbellini, L. & Romeo, L. (2006). DNA damage and repair capacity by comet assay in lymphocytes of white-collar active smokers and passive smokers (non- and ex-smokers) at workplace. Toxicology Letters, 167,131-141.
(7). Giovannelli, L., Pitozzi, V., Moretti, S., Boddi, V. & Dolara, P. (2006). Seasonal variations of DNA damage in human lymphocytes: Correlation with different environmental variables. Mutation Research, 593, 143-152.
(8). Gupta, S.,Mittal,S.,Kumar A.,Singh K.D. (2011).
Journal of Occupational Safety and HealthDecember 2014, vol 11, No. 2
82
Respiratory effects of air pollutants among non-smoking traffic policemen of Patiala, India. Lung India,28 (4),253-257.
(9). Huang, H-B, Lai, C-H., Chen, G-W., Lin, Y-Y., Jaakkola,J.J.K., Liou, S.H & Wang, S.L. (2012).Traffic-related air pollution and DNA damage: a longitudinal study in Taiwanese traffic conductors. PLOS ONE 7(5): e37412. doi:10.1371/journal.pone.0037412
(10). International Agency for Research on Cancer (IARC). (2013). The carcinogenicity of outdoor air pollution. Lancet Oncology, 14, 1262-1263.
(11). Ishikawa, H., Tian, Y., Piao, F., Duan, Z., Zhang, Y., Ma, M.,…Yokoyama, K.(2006). Genotoxic damage in female residents exposed to environmental air pollution in Shenyang city, China. Cancer Letters,240, 29-35.
(12). Kampa M. & Castanas E. (2008). Human health effects of air pollution. Environmental Pollution, 151, 362-367.
(13). Kumaravel, T.S. & Jha, A.N. (2006). Reliable Comet Assay measurements for detecting DNA damage induced by ionising radiation and chemicals. Mutation Research, 605,7-16.
(14). Lee, L.K., Shahar, S. & Rajab, N.F. (2009). Serum folate concentration, cognitive impairment and DNA damage among elderly individuals in Malaysia. Nutrition Research, 29, 327-334.
(15). Moller, P., Folkmann, J.K., Forchhammer, L, Brauner, E.V., Danielsen, P.H., Rissom, L. & Loft, S. (2008). Air pollution, oxidative damage to DNA and carcinogenesis. Cancer Letters, 266, 84-97.
(16). Novotna, B., Topinka, J.,Solansky, I., Chvatalova, I., Lnenickova, Z. & Sram, R.J. (2007). Impact of air pollution and genotype variability on DNA damage in Prague Policemen. Toxicology Letters, 172,(Issues 1-2), 37-47.
(17). Palli, D., Sera, F., Giovanelli, L., Masala, G., Grechi, D., Bendinelli, B.,… Saieva, C. (2009). Environmental ozone exposure and oxidative DNA damage in adult residents of Florence. Environmental Pollution, 157, 1521-1525.
(18). Pandey, A.K., Bajpayee, M., Parmar, D., Rastogi, S., Mathur, N., Seth,P.K. & Dhawan, A. (2006). DNA damage in lymphocytes of Indian risckshaw pullers as measured by the alkaline Comet Assay. Environmental and Molecular Mutagenesis, 47, 25-30.
(19). Risom, L., Moller P. & Loft, S. (2005). Oxidative
stress-induced DNA damage by particulate air pollution. Mutation Research, 592, 119-137.
(20). Singha, R., Kaur, B., Kalina, I., Popov, T.A., Georgieva, T., Garte, S.,…Farmer,P.B.(2007). Effects of environmental air pollution on endogenous oxidative DNA damage in humans. Mutation Research, 620, 71-82.
(21). Singhb,R., Sram, R.J., Binkova, B., Kalina, I., Popov, T.A., Georgieva, T.,…Farmer,P.B.(2007). The relationship between biomarkers of oxidative DNA damage, polycyclic aromatic hydrocarbons DNA adducts, antioxidant status and genetic susceptibility following exposure to environmental air pollution in humans. Mutation Research, 620,(1-2):83-92.
(22). Sul, D., Lee, E., Lee, M-Y., Oh, E., Im, H., Lee, J. ,…Kang,S.K. (2005). DNA damage in lymphocytes of benzene exposed workers correlates with trans, trans-muconic acids and breath benzene levels. Mutation Research, 582, 61-70.
(23). Tovalin, H., Valverde, M., Morandi, M.T., Blanco, S., Whitehead,L.& Rojas, E. (2006). DNA damage in outdoor workers occupationally exposed to environmental air pollutants. Occupational and Environmental Medicine, 63, 230-236.
(24). Velverde, M. & Rojas, E. (2009).Environmental and occupational biomonitoring using the comet assay. Mutation Research, 681, 93–109.
(25). Moller, P. Assessment of reference values for DNA damage detected by the comet assay in human blood cell DNA. (2006). Mutation Research, 612, 84-104.
(26). Wang,H., Chen,W., Zheng,H., Guo,L., Liang, H. , Yang, X.,…Wu, T. (2007) Association between plasma BDPE-Alb adduct concentrations and DNA damage of peripheral blood lymphocytes among coke oven workers. Occupational and Environmental Medicine, 64, 753-758.
(27). Zhu,C.Q., Lam, T.H. & Jiang, C.Q. (2001). Lymphocyte DNA damage in bus manufacturing workers. Mutation Research, 491, 173–181.

December 2014, vol 11, No. 2Journal of Occupational Safety and Health
83

Journal of Occupational Safety and HealthDecember 2014, vol 11, No. 2
84
GUIDELINES FOR CONTRIBUTORS
The Journal of Occupational Safety and Health is concerned with areas of current information in occupational safety and health issues in Malaysia and throughout the world.
General Guidelines• Manuscripts should be sent to the Secretariat, Journal of Occupational Safety and Health, Communication,
Business and Information Dissemination Division (CBID), NIOSH, Lot 1 Jalan 15/1, Section 15, 43650 Bandar Baru Bangi, Selangor, Malaysia (fax: 6 03-8926 5655, tel: 6 03 -89113879/3867/3871, email: [email protected]). Please send hardcopy and softcopy of original submissions.
• Prepare manuscripts in accordance with the guidelines given below.
• Submit a cover sheet including: article title, author(s) name(s), affiliation(s), and complete mailing address, phone, fax, and e-mail address of the corresponding author. If at any time during the review or publication process this contact information changes, please contact the secretariat with the updated information.
• Manuscripts must be printed double spaced on A4-sized paper using 12-point type (font Times New Roman). Include page numbers.
• Organisation of material for original research should follow standard reporting format - “Introduction”, “Methodology”, “Results”, “Discussion” and “Conclusion”.
• For editorials, review articles, short communication and case studies, appropriate headings should be inserted to provide a general outline of the material.
• Clarity of language and presentation are essential, and care should be taken to avoid unnecessary technical terminology. The publication uses English spelling (UK).
• An abstract, up to 250 words, should accompany the manuscript. This should summarize the study and include the subheadings “Introduction”, “Methodology”, “Results” and “Conclusion”. It may not be necessary for all subheadings to be included, based on the nature of the manuscript.
• Authors must include five keywords or phrases for indexing.
• Each author should complete a declaration form.
• Define all abbreviations.
• Permission to reproduce published material must be obtained in writing from the copyright holder and acknowledged in the manuscript.
• Keep a copy of the manuscript for reference.
• The editorial office retains the customary right to style.
• All material submitted for publication is assumed to be submitted exclusively to the journal unless otherwise stated.
• Copyright of all material published lies in NIOSH Malaysia.
• Once your manuscript is accepted for publication, it may be reproduced with the consent, stored in the retrieval system or transmitted in any form or by any means, electronic, mechanical and photocopying with the consent and permission by the publisher. Application for permission should be addressed to : CBID, NIOSH, Lot 1, Jalan 15/1 Section 15, 43650 Bandar Baru Bangi, Selangor Darul Ehsan, Malaysia. e-mail: [email protected]

December 2014, vol 11, No. 2Journal of Occupational Safety and Health
85
References:All references must be formatted in accordance with the Publication Manual of the American Psychological Association (APA), Fifth Edition.
For example:Journal Articles:Smith, A.B., Adams, K.D., & Jones, L.J. (1992). The hazards of living in a volcano. Journal of Safety Research, 23(1),81-94.
Book:Perez, A.K., Little, T.H., & Brown, Y.J. (1999). Safety in numbers. Itasca, IL: National Safety Council.
On-line Publication:National Institute of Occupational Safety and Health. Sick Building Syndrome. www.niosh.com.my/safetytips.asp?safetyid=1 (accessed October 2004)
Government Publication:Ministry of Health Malaysia & Academy of Medicine Malaysia (2003). Clinical Practise Guidelines on Management of Obesity 2003.
Tables and Figures:Tables and figures should be on separate sheets from the text, in accordance with APA style, numbered consecutively and given a short but explicit title. Title for table should be above table. Title for figures should be below figure, Figures must be supplied as glossy photographs or professionally or electronically drawn artwork using heavy white paper and black ink. A notation should be made in the text showing approximately where each table or figure should appear (e.g., Insert Table 3 here). When referring to a particular table or figure in the text always use its number. All tables will be re-set in the production process. All figures will be scanned from the original.
Computer Disks:If you send a computer disk with your submission, please label it with the author(s) name(s) and manuscript title. Disks will not be returned. Only Microsoft Word format is accepted.
Contributor’s copy:Each author will receive 1 copy of the journal.
Subscription InformationJournal of Occupational Safety and Health (ISSN 1675-5456) is published bi-annually
by Communication, Business and Information Dissemination Division (CBID), NIOSH,Malaysia. Subscription prices are available upon request from the publisher or from
www.niosh.com.my Issues are sent by standard mail. For orders, claims, productenquiries and advertising information, contact Ms Roslina / Ms Nor Akmar / Ms Siti Badariah
603-8911 3879 / 3867 / 3871 or [email protected]
Advertising RatesEnquiries to be directed to the secretariat.
Secretariat AddressNational Institute of Occupational Safety and Health
Lot 1, Jalan 15/1, Section 15, 43650 Bandar Baru BangiSelangor Darul Ehsan, Malaysia
Tel.: 603-8911 3879 / 3867 / 3871 Fax.: 603-8926 5655Email: [email protected] Website: www.niosh.com.my

Journal of Occupational Safety and HealthDecember 2014, vol 11, No. 2
86
New book…Now Available!
Order Today!
ANTHROPOMETRIC RESEARCHIN MALAYSIA
First published in 2013 ISBN: 978-967-12137-2-8Price: RM58.00 Published by: National Institute of Occupational Safety and Health (NIOSH), Malaysia
Anthropometry has long been a subject that needs attention as Malaysia is moving into a developed nation status. Malaysia’s Vision 2020 has definitely put us on the right track in achieving its status and also not forgetting as we move along in the industry, new technologies and advances are ensuing rapidly. Infrastructure wise, we have reached world-class level and up-to-date OSH information come hand-in-hand to supply and contribute in ensuring optimization and appropriate practice of human factors utilization.
The Anthropometric Research in Malaysia book is a compilation of researches made in Malaysia consisting of different focus and subject matters that cover particularly on the well-being of school children, the work force and retired individuals which are showing the effects either happening during the duration of tenure and/or having the effects later on in the future. This book serves as an eye-opener on the effects and risks faced by individuals ranging from school children to adults on the importance of having the proper facilities and equipment in enhancing peak performance and also the prevention of facing future health risks.
This book can be purchased at NIOSH Library Bandar Baru Bangi, Selangor, Malaysia.
To order, visit us online at www.niosh.com.my, email: [email protected], or contact NIOSH Libraryby phone (603)-89113884/3890, Fax: 03-89265655 (Mr Mohammad Affendi Mohammad Zahari).

December 2014, vol 11, No. 2Journal of Occupational Safety and Health
49
Journal of Occupational
Safety and Health
Editor-in-chief Ir. Haji Rosli bin Husin
Executive Director NIOSH, Malaysia
Editorial Board Y Bhg. Dato’ Prof Ir. Dr. Ibrahim Hussein Universiti Tenaga Nasional (UNITEN), Malaysia Prof. Madya Dr. Ismail Bahari Lynas Malaysia Sdn Bhd, Malaysia Dr. Krishna Gopal Rampal Perdana University Graduate School of Medicine, Malaysia Dr. Abu Hasan Samad Allianze University College of Medical Sciences, Malaysia Mr. Andrew Anthony Joseph Arul OSH Consultant, Malaysia Dr. Jeffereli Shamsul Bahrin BASF Asia-Pacific Service Centre Sdn. Bhd. Prof Madya Dr. Shamsul Bahari Shamsudin University Malaysia Sabah, Malaysia
Editorial Management Committee Ayop Salleh NIOSH, Malaysia Fadzil Osman NIOSH, Malaysia Tn Haji Mohd Esa Baruji NIOSH, Malaysia Khairunizam Mustapa NIOSH, Malaysia Reamy Md Zein NIOSH, Malaysia Amiruddin Abdul Aziz NIOSH, Malaysia
Secretariat
Saupi Nazri Mamat Roslina Md Husin Nor Akmar Yussuf
Siti Badariah Abu Bakar
The Journal
- Aims to serve as a forum for the sharing of research findings and information across broad areas in Occupational Safety and Health.
- Publishes original research reports, topical article reviews, book reviews, case reports, short communications, invited editorial and letters to editor.
- Welcomes articles in Occupational Safety and Health related fields.

Journal of Occupational Safety and HealthDecember 2014, vol 11, No. 2
50
Lot 1, Jalan 15/1, Section 15, 43650 Bandar Baru Bangi, Selangor Darul Ehsan.Tel : 03-8769 2100 Fax : 03-8926 2900
www.niosh.com.my
National Institute of Occupational Safety and Health
Ministry of Human Resources
National Institute of Occupational Safety and Health (NIOSH)
Ministry of Human Resources Malaysia
Institut Keselamatan dan Kesihatan Pekerjaan Negara
Kementerian Sumber Manusia
December 2014, Vol 11, No 2ISSN 1675-5456
PP13199/12/2012 (032005)
Journal Of OccupationalSafety And Health