Embed Size (px)
Citation preview
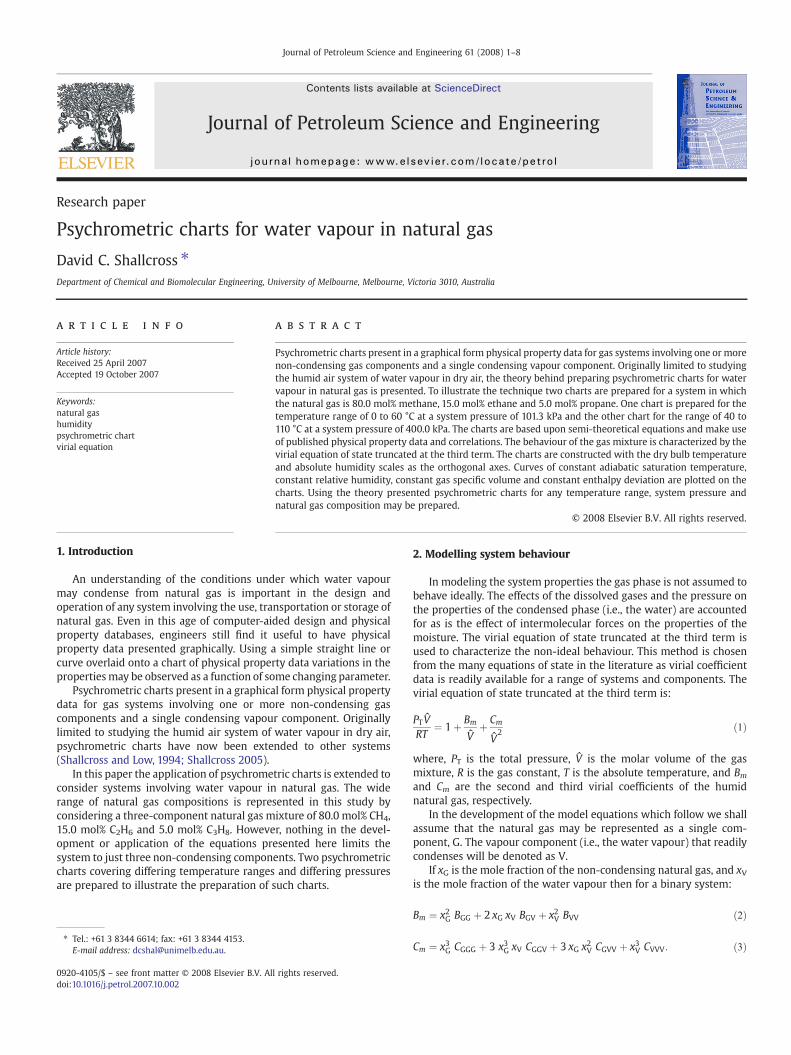
Journal of Petroleum Science and Engineering 61 (2008) 1–8
Contents lists available at ScienceDirect
Journal of Petroleum Science and Engineering
j ourna l homepage: www.e lsev ie r.com/ locate /pet ro l
Research paper
Psychrometric charts for water vapour in natural gas
David C. Shallcross ⁎Department of Chemical and Biomolecular Engineering, University of Melbourne, Melbourne, Victoria 3010, Australia
a r t i c l e i n f o
⁎ Tel.: +61 3 8344 6614; fax: +61 3 8344 4153.E-mail address: [email protected].
0920-4105/$ – see front matter © 2008 Elsevier B.V. Aldoi:10.1016/j.petrol.2007.10.002
a b s t r a c t
Article history:Received 25 April 2007Accepted 19 October 2007
Psychrometric charts present in a graphical form physical property data for gas systems involving one or morenon-condensing gas components and a single condensing vapour component. Originally limited to studyingthe humid air system of water vapour in dry air, the theory behind preparing psychrometric charts for watervapour in natural gas is presented. To illustrate the technique two charts are prepared for a system in whichthe natural gas is 80.0 mol% methane, 15.0 mol% ethane and 5.0 mol% propane. One chart is prepared for thetemperature range of 0 to 60 °C at a system pressure of 101.3 kPa and the other chart for the range of 40 to110 °C at a system pressure of 400.0 kPa. The charts are based upon semi-theoretical equations and make useof published physical property data and correlations. The behaviour of the gas mixture is characterized by thevirial equation of state truncated at the third term. The charts are constructed with the dry bulb temperatureand absolute humidity scales as the orthogonal axes. Curves of constant adiabatic saturation temperature,constant relative humidity, constant gas specific volume and constant enthalpy deviation are plotted on thecharts. Using the theory presented psychrometric charts for any temperature range, system pressure andnatural gas composition may be prepared.
© 2008 Elsevier B.V. All rights reserved.
Keywords:natural gashumiditypsychrometric chartvirial equation
1. Introduction
An understanding of the conditions under which water vapourmay condense from natural gas is important in the design andoperation of any system involving the use, transportation or storage ofnatural gas. Even in this age of computer-aided design and physicalproperty databases, engineers still find it useful to have physicalproperty data presented graphically. Using a simple straight line orcurve overlaid onto a chart of physical property data variations in thepropertiesmay be observed as a function of some changing parameter.
Psychrometric charts present in a graphical form physical propertydata for gas systems involving one or more non-condensing gascomponents and a single condensing vapour component. Originallylimited to studying the humid air system of water vapour in dry air,psychrometric charts have now been extended to other systems(Shallcross and Low, 1994; Shallcross 2005).
In this paper the application of psychrometric charts is extended toconsider systems involving water vapour in natural gas. The widerange of natural gas compositions is represented in this study byconsidering a three-component natural gas mixture of 80.0 mol% CH4,15.0 mol% C2H6 and 5.0 mol% C3H8. However, nothing in the devel-opment or application of the equations presented here limits thesystem to just three non-condensing components. Two psychrometriccharts covering differing temperature ranges and differing pressuresare prepared to illustrate the preparation of such charts.
l rights reserved.
2. Modelling system behaviour
In modeling the system properties the gas phase is not assumed tobehave ideally. The effects of the dissolved gases and the pressure onthe properties of the condensed phase (i.e., the water) are accountedfor as is the effect of intermolecular forces on the properties of themoisture. The virial equation of state truncated at the third term isused to characterize the non-ideal behaviour. This method is chosenfrom the many equations of state in the literature as virial coefficientdata is readily available for a range of systems and components. Thevirial equation of state truncated at the third term is:
PTVRT
¼ 1þ Bm
Vþ Cm
V2 ð1Þ
where, PT is the total pressure, V is the molar volume of the gasmixture, R is the gas constant, T is the absolute temperature, and Bmand Cm are the second and third virial coefficients of the humidnatural gas, respectively.
In the development of the model equations which follow we shallassume that the natural gas may be represented as a single com-ponent, G. The vapour component (i.e., the water vapour) that readilycondenses will be denoted as V.
If xG is the mole fraction of the non-condensing natural gas, and xVis the mole fraction of the water vapour then for a binary system:
Bm ¼ x2G BGG þ 2 xG xV BGV þ x2V BVV ð2Þ
Cm ¼ x3G CGGG þ 3 x3G xV CGGV þ 3 xG x2V CGVV þ x3V CVVV: ð3Þ
2 D.C. Shallcross / Journal of Petroleum Science and Engineering 61 (2008) 1–8
Here Bii is the second virial coefficient of pure component i, BGV isthe second virial interaction (or cross) coefficient for the binarysystem, Ciii is the third virial coefficient of pure component i, and,CGGV and CGVV are the third virial interaction parameters.
A gas is saturated with a vapour when the partial pressure of thevapour is equal to its vapour pressure at the particular temperature.For an ideal system we could write an expression relating the molefraction of the condensing vapour component at saturation, V, to itsvapour pressure:
xVs ¼ PVPT
ð4Þ
and
xGs ¼ PT � PVPT
ð5Þ
where, xVs and xGs are the mole fractions of components V and Grespectively at saturation, and PV is the vapour pressure of componentV. However, since the system is not ideal an enhancement factor isused to account for the non-idealities in the system. Eq. (4) becomes,
xVs ¼ f PVPT
: ð6Þ
A similar expression may be written for the non-condensing gascomponent G:
xGs ¼ PT � f PVPT
: ð7Þ
The enhancement factor accounts for the effects of the dissolvedgases and pressure on the properties of the condensed phase, and theeffect of intermolecular forces on the properties of the moisture itself.The enhancement factor may be written in terms of the virial co-efficients and the other properties of the system (Hyland and Wexler,1983):
ln f ¼ 1þ jPVð Þ PT � PVð Þ � 12 j P2
T � P2V
� �RT
" #VVc þln 1� kHxGsPTð Þ
� 2x3Gs 2� 3xGsð ÞP2T
RTð Þ2BGG BGV þ x2GsPT
RTBGG � 2x2GsPT
RTBGV
� PT � PV � x2GsPTRT
� �BGG � x2Gs 1� 3xGsð Þ 1� xGsð ÞP2
T
RTð Þ2BGGBVV
þ 6x2Gs 1� xGsð Þ2P2T
RTð Þ2BVV BGV � 2x2Gs 1� xGsð Þ 1� 3xGsð ÞP2
T
RTð Þ2B2GV
� P2V � 1þ 3xGsð Þ 1� xGsð Þ3P2
T
2 RTð Þ2" #
B2VV � 3x4GsP
2T
2 RTð Þ2B2GG
þ 3x2Gs 1þ 2xGsð ÞP2T
2 RTð Þ2CGGV � 3x2Gs 1� xGsð ÞP2
T
RTð Þ2CGVV
� 1þ 2xGsð Þ 1� xGsð Þ2P2T � P2
V
2 RTð Þ2" #
CVVV þ x3GsP2T
RTð Þ2CGGG: ð8Þ
Here κ is the isothermal compressibility of the condensing com-ponent (i.e. the water), VVc is the molar volume of the condensedcomponent V (either as a liquid or a solid), and kH is the Henry's Lawconstant to account for the solubility of component G in the con-densed phase. For a given temperature and total pressure, PT, Eqs. (7)and (8) may be solved iteratively for the enhancement factor, f, andthe mole fraction of component G at saturation, xGs. In practice this isdone by first setting f=1. xGs is then calculated using Eq. (7) and thenthis value is used in Eq. (8) to calculate an estimate for the enhance-ment factor, f. The value for xGs is then re-calculated. The cycle is then
repeated until the values for f and xGs no longer change significantlybetween successive calculations.
The absolute humidity at saturation, Hs, is the mass of the vapourcomponent V permass of component G. It may be expressed in terms ofthemole fractions of the two components in the gas phase at saturation:
Hs ¼ xVsxGs
MWV
MWGð9Þ
where MWi is the molecular weight of component i.The psychrometric charts are constructed with temperature plotted
on the x-axis and absolute humidity on the orthogonal y-axis. Thesaturation line that describes the boundary of the psychrometric chart isdrawn by plotting the absolute humidity at saturation, Hs, as a functionof temperature for a specified total pressure.
The relative humidity, ϕ, is defined as the ratio of the mole fractionof the vapour component, xV, in a given sample of the two-componentmixture to the mole fraction, xVs, in a sample of the mixture which issaturated with the vapour component at that temperature. Thus,
/ ¼ xVxVs
: ð10Þ
In order to construct the curves of constant relative humidity anexpression is required which relates the absolute humidity to therelative humidity, temperature and total pressure. It may be shownthat (Shallcross and Low, 1994):
H ¼ Hs/ 1� f PV=PTð Þ1� /f PV=PT
: ð11Þ
To construct the constant relative humidity curves, the systempressure, PT, is first specified. Then for a given value of ϕ, the variablesf, Hs and PV are calculated for varying temperatures. These values arethen used in Eq. (11) to calculate the absolute humidity as a function oftemperature. When plotted this data yields the constant relativehumidity curves.
The specific volume of a humidmixture, ν, is defined as the volumeof the mixture per unit mass of the dry gas:
m ¼ VxG MWG
: ð12Þ
Applying this definition and using Eq. (1) curves of constant spe-cific volume may be plotted for a given system pressure.
Thewet bulb temperature is usually considered as the temperaturemeasured by a cylindrical thermometer, the outside surface of whichis kept wet with the liquid of the condensing component V, in this casewater. As the moist gas passes the thermometer some of the waterevaporates resulting in a cooling effect that causes the temperature ofthe wet bulb thermometer to drop. The drier the gas, the greater thewet bulb depression. As the wet bulb temperature is a function of notonly the dry bulb temperature and absolute humidity, but also suchfactors as the gas velocity past the thermometer, the diameter ofthe thermometer and the extent of radiative heat transfer, it is notpossible to predict the wet bulb temperatures with precision.Consequently we choose to plot instead curves of constant adiabaticsaturation temperature.
For the conventional air–water system the adiabatic saturationtemperature, Tad, is defined as the temperature at which water (liquidor solid), by evaporating intomoist air at a given dry bulb temperature,T, and absolute humidity, H, can bring air to saturation adiabatically atthe same temperature, Tad, while the pressure PT, is maintainedconstant (ASHRAE, 1989). The adiabatic saturation temperature is alsoknown as the thermodynamic wet bulb temperature.
For a given G–V system, it may be defined as the temperature atwhich component V, present as either a liquid or a solid, by

Fig. 1. Psychrometric chart for the water vapour–natural gas system at 101.3 kPa.
3D.C.Shallcross
/Journal
ofPetroleum
Scienceand
Engineering61
(2008)1–8

Fig. 2. Psychrometric chart for the water vapour–natural gas system at 400.0 kPa.
4D.C.Shallcross
/Journal
ofPetroleum
Scienceand
Engineering61
(2008)1–8

5D.C. Shallcross / Journal of Petroleum Science and Engineering 61 (2008) 1–8
evaporating into the moist gas mixture at a given dry bulbtemperature, T, and absolute humidity, H, can bring that mixture tosaturation adiabatically at the same temperature, Tad, while thepressure, PT, is maintained constant.
The calculation and representation of the specific enthalpy of thegas mixture requires special attention. The specific of the two-component gas mixture is calculated by summing the ideal gas stateenthalpy and the residual enthalpy:
h ¼ xG hoG þZ T
ToCPG VdT
� �þ xV hoV þ
Z T
ToCPV VdT
� �
þ RT TdBm
dT� Bm
� �1
Vmþ T
2dCm
dT� Cm
� �1
V2m
24
35: ð13Þ
In this equation To is the enthalpy datum temperature, CPG and CPVare the ideal gas heat capacity of the gas and vapour respectively, and,ĥoG and ĥoV are the enthalpy corrections for both componentsnecessary to ensure that the enthalpy, ĥ, is in fact zero at the enthalpydatum condition.
Because of the nature of the equations governing the constructionof the constant adiabatic saturation temperature curves, lines ofconstant gas mixture enthalpy will lie nearly parallel to the adiabaticsaturation temperature curves. Rather than plotting two sets of curveshaving nearly the same slope, which would result in a chart difficult toread, the gasmixture enthalpy data is presented in a different form. Anenthalpy deviation term, ĥdev, is defined as being the differencebetween the true specific enthalpy of a gas mixture and the specificenthalpy of the gas saturated at its adiabatic saturation temperature:
hdev ¼ h� hS;as: ð14Þ
When curves of constant enthalpy deviation are plotted on thepsychrometric chart then the true specific enthalpy of a gas mixturecan be determined by adding the enthalpy deviation for the point onthe chart representing the mixture, to the enthalpy of the gas satu-rated at its adiabatic saturation temperature.
3. Chart preparation and production
Using the equations presented here aswell as the physical propertydata in Appendix A psychrometric charts have been prepared for a
Fig. 3. Enhancement factor as a function of dry bulb temperature at different pressures.
natural gas of representation composition. The natural gas is assumedto be represented by a three-component mixture of 80.0 mol%methane, 15.0 mol% ethane and 5.0 mol% propane. Neither the theorynor the equations presented here limit the natural gas to just threecomponents. The only limitation is on the availability of the relevantphysical property data. Charts are presented for the dry bulb tempera-ture range of 0 to 60 °C at 101.3 kPa system pressure, and for the drybulb temperature range of 40 to 110 °C at a system pressure of 400 kPa.
The model equations and physical property data were coded into aFORTRAN program for each system. This program generates a filecontaining a set of instructions in the Postscript graphics language.When sent to a Postscript laser printer the two psychrometric chartspresented in Figs. 1 and 2 are generated. If the charts are printed usinga resolution of 600 dpi (23.6 dots/mm) then the curvesmay be plottedto a precision of about 0.01 °C.
The layout of Fig. 1 is typical of the psychrometric chart producedby the process. Dry bulb temperature is plotted on the x-axis withabsolute humidity plotted on the y-axis. The relative humidity, spe-cific volume, adiabatic saturation temperature and enthalpy deviationcurves are all plotted as functions of dry bulb temperature andabsolute humidity. The layout of the chart is self-explanatory. Theenthalpy datum condition for the water is taken as liquid water at itsvapour pressure at 0.01 °C.
4. Discussion
The position of the saturation curve and hence the shape of thepsychrometric chart is influenced by the magnitude of the variation inthe enhancement factor with temperature. Fig. 3 shows the variationin the enhancement factor with temperature for water vapour in therepresentative natural gas mixture at six different pressures rangingfrom 0.100 MPa to 1.000 MPa. The enhancement factor increases withincreasing and the enhancement factor typically lies in the range,1.00b fb1.04.
All the correlations used to predict physical property behaviour inthis work have been the subject of extensive experimental studies tovalidate them. This current study simply takes these accepted cor-relations and applies them to produce graphical representations of thedata in the formof the psychrometric charts. All correlations have beenapplied well within their limitations. This technique has been suc-cessfully employed in the past by Shallcross and Low (1994) to developcharts for thewater vapour in air systemwhich agree extremely closelywith those published by ASHRAE (1989) for that system.
5. Concluding remarks
Using published physical property data and correlation, and equa-tions presented here, two high-precision psychrometric charts havebeen constructed for water vapour in a gas mixture of methane,ethane and propane. These charts illustrate how the techniques pre-sented here may be used to prepare psychrometric charts for watervapour in natural gas of any composition, provided the requiredphysical property data is available.
Appendix A. Physical property data
The construction of the charts requires information on the physicalproperties of both the water vapour and the non-condensinghydrocarbon gas mixture. As the charts are only as reliable as thedata available the most accurate and consistent data sets have beenused from the literature.
A.1. Water vapour
For water vapour the molecular weight is taken as 18.015, thecritical temperature as 647.35 K, the critical pressure as 22.118 MPa,

Table 1Molecular weight, critical point and acentric factor data
Gas MW TC(K)
PC(MPa)
VC
(m3/kmol)ZC ω
Methane 16.043 190.56 4.599 0.0986 0.286 0.0115Ethane 30.069 305.32 4.872 0.1455 0.279 0.0995Propane 44.096 369.83 4.248 0.2000 0.276 0.1523
6 D.C. Shallcross / Journal of Petroleum Science and Engineering 61 (2008) 1–8
the compressibility factor at the critical point as 0.261 and the acentricfactor as 0.348.
The second virial coefficient for water vapour is taken as (Hylandand Wexler, 1983):
B ¼ T 0:05820� 0:012234e1734:29=T�
ðA:1Þ
where B is expressed in cm3/mol and T is expressed in Kelvin.The third virial coefficient for water vapour is presented by Hyland
andWexler (1983) in its pressure series form. Expressing it in terms ofthe volume series form it is:
C¼T2 752:82�2:31788e3645:09=T þ1:49755e3468:58=T �14:2446e1734:29=Th i
�10�4
ðA:2Þwhere, C is expressed in cm6/mol2 and T is expressed in Kelvin.
The vapour pressure of water over the temperature range from 0 °Cto 200 °C is taken as (Hyland and Wexler, 1983):
ln PV ¼X3i¼�1
ciTi þ 6:5459673 ln T ðA:3Þ
where, PV is the vapour pressure expressed in Pa, T is the absolutetemperature in Kelvin, and
c�1 ¼ �5:8002206� 103
c0 ¼ 1:3914993c1 ¼ �4:8640239� 10�2
c2 ¼ 4:1764768� 10�5
c3 ¼ �1:4452093� 10�7:
Kell (1975) gives the isothermal compressibility of saturated liquidwater over the temperature range from 0 to 150 °C as:
j ¼
P5i¼0
ci ti
1þ c6t
0BBB@
1CCCA� 10�11 ðA:4Þ
where, κ is expressed in 1/Pa, t is expressed in °C and
for 0-V tV100-C for 100-V t V150-Cc0 ¼ 5:088496� 10 c0 ¼ 5:0884917� 10c1 ¼ 6:163813� 10�1 c1 ¼ 6:2590623� 10�1
c2 ¼ 1:459187� 10�3 c2 ¼ 1:3848668� 10�3
c3 ¼ 2:008438� 10�5 c3 ¼ 2:1603427� 10�5
c4 ¼ �5:847727� 10�8 c4 ¼ �7:2087667� 10�8
c5 ¼ 4:104110� 10�10 c5 ¼ 4:6545054� 10�10
c6¼1:967348� 10�2 c6¼1:9859983� 10�2
:
For ice the isothermal compressibility is (Hyland and Wexler,1983):
j ¼ 8:875þ 0:0165Tð Þ � 10�11 ðA:5Þwhere, κ is expressed in 1/Pa, and T is expressed in Kelvin.
The molar volume of water is taken as:
VVC ¼ �61692:295þ 291:8088TP5i¼0
ciTi
ðA:6Þ
where VVcis the molar volume of water is expressed in cm3/mol, and
c0 ¼ �2403:360201c1 ¼ �1:40758895c2 ¼ 0:1068287657c3 ¼ �2:914492351� 10�4
c4 ¼ 3:73497936� 10�6
c5 ¼ �2:1203787� 10�10
:
This correlation is based upon one for the density of water as afunction of temperature presented by Hyland andWexler (1983). Overthe temperature range from 173.15 K to 273.16 K the same workersgive the molar volume of ice as:
VVC ¼ 19:276404� 4:50266� 10�4T þ 6:9468� 10�4T2 ðA:7Þ
where VVcis the molar volume of ice is expressed in cm3/mol, and T is
expressed in Kelvin.Keenan et al. (1978) tabulates the latent heat of vapourization of
water. Regression of the data between 0 and 110 °C yields thecorrelation:
k ¼ 2501:40� 2:37341t þ 0:000805207t2 � 1:69018� 10�5t3
þ 1:81383� 10�8t4 ðA:8Þ
where, λ is expressed in kJ/kg, and t is expressed in °C.McGowan (1980) tabulates the enthalpy of water data to seven
significant figures. Non-linear regression of the data between 0 and110 °C yields the correlation:
hf¼�0:00115þ 4:21965t þ 0:198652t2 � 2:93514� 10�6t3 þ 1:003624� 10�7t4
1þ 0:0476516t
ðA:9Þwhere, hf is expressed in kJ/kg, t is expressed in °C, and, the enthalpydatum condition is taken as liquid at 0 °C.
A.2. Natural gas
The natural gas used in this study is assumed to have a compositionof 80.00 mol% CH4, 15.00 mol% C2H6 and 5.00 mol% C3H8. The averagemolecular weight is 19.549. The critical point data for the three gascomponents are presented in Table 1.
Since some of the correlations that follow require single values ofTC, PC, VC, ZC and ω for air these must be calculated. Kay's rule is usedto calculate a pseudo-critical temperature T′C for air:
T VC ¼Xi
xiTCiðA:10Þ
summed over all components.For the pseudo-critical pressure, P′C , the recommendations of Reid
et al. (1977) are followed:
PVC ¼ RP
i xiZCi
� �T VCP
i xiVCi
� : ðA:11Þ
The acentric factor for the natural gas is simply taken as
xV¼Xi
xi xi: ðA:12Þ
The pseudo-critical compressibility factor, Z′C, is calculated from
ZVC ¼ Z 0ð Þ þ xVZ 1ð Þ ðA:13Þ
where Z (0)=0.2901 and Z (1)=−0.0879 at the critical point (Lee andKesler, 1975).

Table 3Ideal gas specific heat capacity coefficients for Eq. (A.29)
Gas c1×10−4 c2×10−4 c3×10−3 c4×10−4 c5×10−2
Methane 3.3298 7.9933 2.0869 4.1602 9.9196Ethane 4.0326 13.422 1.6555 7.3223 7.5287Propane 5.1920 19.245 1.6265 11.680 7.2360
7D.C. Shallcross / Journal of Petroleum Science and Engineering 61 (2008) 1–8
The pseudo-critical volume, V′C , is calculated from
V VC ¼ Z VCRT VCPVC
: ðA:14Þ
Thus, for the natural gas mixture
T VC ¼ 216:74 K PVC ¼ 4:630 MPa VC ¼ 0:1118 m3=kmolZVC ¼ 0:287 xV¼ 0:0317
While a correlation for a second virial coefficient of the natural gasmixture is not available, correlations for the three gas components arepresented by Rowley et al. (2001). These correlations are of the form:
B ¼ c1 þ c2Tþ c3T3 þ
c4T8 þ
c5T9 ðA:15Þ
where B is expressed in cm3/mol and T is expressed in Kelvin. Valuesfor the five parameters for each of the three natural gas componentsare presented in Table 2.
The second virial coefficient of the natural gas mixture, BGG, isgiven by:
BGG ¼Xi
Xj
xi xj Bij: ðA:16Þ
Here, Bii is the second virial coefficient of pure component i, Bij isthe second virial cross-coefficient, and xi is the mole fraction ofcomponent i. Pitzer (1990) recommends that the second virial cross-coefficients be estimated using the empirical correlation:
Bij ¼ V cij c1 þ xijc2 þc3 þ xijc4
Trijþ c5 þ xijc6
T2rij
þ c7 þ xijc8T6rij
" #ðA:17Þ
where the critical properties Tcij, Vcij and ωij are defined as:
Tcij ¼ffiffiffiffiffiffiffiffiffiffiffiTci Tcj
qðA:18Þ
V cij ¼V1=3ci
þ V1=3cj
2
0@
1A
3
ðA:19Þ
xij ¼xi þ xj
2: ðA:20Þ
In Eq. (A.17),
c1 ¼ 0:442259 c2 ¼ 0:725650c3 ¼ �0:980970 c4 ¼ 0:218714c5 ¼ �0:611142 c6 ¼ �1:24976c7 ¼ �0:11515624 c8 ¼ �0:189187
:
Reliable correlations for the third virial coefficients for the threecomponents of the natural gas mixture are not available so the gen-eralized empirical correlation of Orbey and Vera (1983) is used toestimate this property for each component:
CP2C
RTð Þ2¼ g1 þ x g2 ðA:21Þ
where, C is the third virial coefficient, PC is the critical pressure, TC isthe critical temperature, R is the universal gas constant, ω is the
Table 2Second virial coefficient parameters for Eq. (A.15)
Gas c1 c2×10−4 c3×10−8 c4×10−18 c5×10−20
Methane 51.075 −2.5181 −2.5601 5.9777 −5.7697Ethane 80.950 −6.1710 −14.350 67.600 −97.400Propane 112.70 −9.9200 −45.100 309.00 −705.00
acentric factor, and g1 and g2 are both functions of the reducedtemperature:
g1 ¼ 0:01407þ 0:02432T2:8r
� 0:00313T10:5r
ðA:22Þ
g2 ¼ �0:02676þ 0:01770T2:8r
þ 0:040T3:0r
� 0:003T6:0r
� 0:00228T10:5r
: ðA:23Þ
The third virial coefficient of the natural gas mixture, CGGG, is givenby:
CGGG ¼Xi
Xj
Xk
xi xj xk Bij: ðA:24Þ
Here CGGG is the third virial coefficient of pure component i, andCijk is a third virial cross-coefficient which is estimated using theempirical correlation of Orbey and Vera (1983):
Cijk ¼ CijCikCjk� �1=3 ðA:25Þ
where
Cij ¼R TcijPcij
!2
g1 þ xij g2� �
: ðA:26Þ
Here the cross-critical temperature, Tcij, is defined in Eq. (A.18) andthe cross-critical pressure is defined as
Pcij ¼ 4 Zci þ Zcj�
TcijZci ZcjPci
� �1=3
þ Zci ZcjPcj
!1=324
353
: ðA:27Þ
In Eq. (A.26), g1 and g2 are both functions of Trij as defined in Eqs.(A.22) and (A.23) respectively.
The ideal gas heat capacity for each component of the natural gas isassumed to be related to temperature by an equation of the form(Rowley et al., 2001):
CP ¼ c1 þ c2c3=T
sinh c3=Tð Þ� �2
þ c4c5=T
cosh c5=Tð Þ� �2
ðA:28Þ
where, CP is expressed in J/(kmol K) and T is expressed in Kelvin.Values for the five parameters for each of the three components arepresented in Table 3.
Table 4Henry's Law coefficients for Eq. (A.30) for the gas components in water
Gas c1 c2×10−4 c3
Methane −215.301 1.0447 29.7802Ethane −250.812 1.2695 34.7413Propane −283.828 1.4434 39.4740

8 D.C. Shallcross / Journal of Petroleum Science and Engineering 61 (2008) 1–8
When integrated an expression for the change in specific enthalpybetween T1 and T2 may be derived:
Dh ¼ c1 T2 � T1ð Þ þ c2c3 coth c3=T2ð Þ � coth c3=T1ð Þ½ �þ c4c5 tanh c5=T2ð Þ � tanh c5=T1ð Þ½ �: ðA:29Þ
The solubility of the gas component in the liquid is considered bymaking use of Henry's Law constants, kH. Based upon the data andregressions presented in the volumes of the Solubility Data Series,(Hayduk, 1982; Hayduk, 1986; Kertes, 1987) Henry's Law constantsmay be related to temperature through equations of the form:
kH ¼ 1exp c1 þ c2
T þ c3ln Tð Þ� � : ðA:30Þ
For the solubility of the three alkanes in water the appropriatecoefficients are presented in Table 4.
A.3. Henry's Law constants
Henry's Law constant for a mixture may be calculated from thecomposition of the gas and the values of the Henry's Law constants forthe individual components:
1kNG–VH
¼Xj
xjk j–VH
ðA:31Þ
where kHNG–V is the Henry's Law constant for the natural gas mixture inliquid V, xj is the mole fraction of component j in the dry gas mixtureand kH
j –V is the Henry's Law constant for gas component j in liquid V.Thus, Henry's law constant for natural gas in water:
1kNG–VH
¼ 0:8000
kCH4–VH
þ 0:1500
kC2H6–VH
þ 0:0500
kC3H6–VH
: ðA:32Þ
References
ASHRAE, 1989. ASHRAE Handbook — Fundamentals SI Edition, American Society ofHeating, Refrigerating and Air-Conditioning Engineers, Atlanta, USA.
Hayduk, W., 1982. Solubility data series – Volume 9 – Ethane. Pergamon Press, Oxford.Hayduk, W., 1986. Solubility data series – Volume 24 – Propane. Pergamon Press,
Oxford.Hyland, R.W., Wexler, A., 1983. Formulations for the thermodynamic properties of dry
air from 173.15 K to 473.15 K, and of saturated moist air from 173.15 K to 372.15 K atpressure to 5 MPa. ASHRAE Trans. 89, 520–535.
Keenan, J.H., Keyes, F.G., Hill, P.G., Moore, J.G., 1978. Steam Tables ThermodynamicProperties ofWater Including Vapour, Liquid and Solid Phases. JohnWiley and Sons,New York.
Kell, G.S., 1975. Density, thermal expansivity, and compressibility of liquid water from 0°to 150 °C: correlations and tables for atmospheric pressure and saturation reviewedand expressed on 1968 temperature scale. J. Chem. Eng. Data 20, 97–105.
Kertes, A.S., 1987. Solubility data series – Volume 27/28 – Methane. Pergamon Press,Oxford.
Lee, B.I., Kesler, M.G., 1975. A generalised thermodynamic correlation based on thethree-parameter corresponding states. AIChE J. 21, 510–527.
McGowan, J.C., 1980. Isothermal compressibility of liquids, In: Weast, R.C., Astle, M.J.(Eds.), CRC Handbook of Chemistry and Physics, 60th ed. CRC Press, Boca Racon,Florida. F-16 – F-20.
Orbey, H., Vera, J.H., 1983. Correlation for the third virial coefficient using Tc, Pc andw asparameters. AIChE J. 29, 107–113.
Pitzer, K.S., 1990. Second virial coefficients for mixed gases of low polarity. Fluid PhaseEquilib. 59, 109–113.
Reid, R.C., Prausnitz, J.M., Sherwood, T.K., 1977. The properties of gases and liquids, 3rded. McGraw-Hill Book Company, New York.
Rowley, R.L.,Wilding,W.V., Oscarson, J.L., Yang, Y., Rowley, R.J., Daubert, T.E., Danner, R.P.,2001. DIPPR data compilation of pure compound properties. AIChE, New York.
Shallcross, D.C., 2005. Preparation of psychrometric charts for water vapour in Martianatmosphere. Int. J. Heat Mass Transfer 48 (9), 1785–1796.
Shallcross, D.C., Low, S.L., 1994. Construction of psychrometric charts for systems otherthan water vapour in air. Chem. Eng. Res. Des. 72 (6), 763–776.