Embed Size (px)
Citation preview

lable at ScienceDirect
Journal of Power Sources 264 (2014) 92e99
Contents lists avai
Journal of Power Sources
journal homepage: www.elsevier .com/locate/ jpowsour
Deformation of PEM fuel cell gas diffusion layers under compressiveloading: An analytical approach
Vahid Norouzifard*, Majid BahramiLaboratory for Alternative Energy Conversion (LAEC), Mechatronic Systems Engineering, Simon Fraser University, BC V3T 0A3, Canada
h i g h l i g h t s
� A new mechanistic model has been developed to predict the PEMFCs GDL’s behavior under compression.� Unit cell approach has been utilized to model the GDL’s complex microstructure.� The model takes into account microstructural parameters and properties of the fibrous porous medium.
a r t i c l e i n f o
Article history:Received 9 October 2013Received in revised form12 March 2014Accepted 10 April 2014Available online 24 April 2014
Keywords:Gas diffusion layerPorous mediaFuel cellBeam theoryMechanical behaviorCompression
* Corresponding author.E-mail addresses: [email protected] (V. No
(M. Bahrami).
http://dx.doi.org/10.1016/j.jpowsour.2014.04.0570378-7753/� 2014 Elsevier B.V. All rights reserved.
a b s t r a c t
In the PEM fuel cell stack, the fibrous porous gas diffusion layer (GDL) provides mechanical support forthe membrane assembly against the compressive loads imposed by bipolar plates. In this study, a newmechanistic model is developed using fundamental beam theory that can accurately predict the me-chanical deflection of GDL under compressive loads. The present analytical model is built on a unit cellapproach, which assumes a simplified geometry for the complex and random GDL microstructure. Themodel includes salient microstructural parameters and properties of the fibrous porous mediumincluding: carbon fiber diameter, fiber elastic modulus, pore size distribution, and porosity. Carbon fiberbending is proved to be the main deformation mechanism at the unit cell level. A comprehensive opticalmeasurement study with statistical analysis is performed to determine the geometrical parameters ofthe model for a number of commercially available GDL samples. A comparison between the presentmodel and our experimental stressestrain data shows a good agreement for the linear deformationregion, where the compressive pressure is higher than 1 MPa.
� 2014 Elsevier B.V. All rights reserved.
1. Introduction resistances is essential. To insure proper contact between layers
A proton exchange membrane (PEM) fuel cell consists of a five-layered structure called the membrane electrode assembly (MEA),which is sandwiched between bipolar plates [1]. The gas diffusionlayer (GDL), one of the main components in the membrane elec-trode assembly (MEA), is a carbon fiber based highly porous mediain the form of paper or cloth. Fig. 1 shows microstructure of a GDLcaptured by scanning electron microscope (SEM). The main dutiesof the GDL in a fuel cell stack include: acting as a mechanicalsupport, providing electronic conductivity between components,providing reactant access to catalyst layers as well as removinggenerated heat and reaction products [2]. To collect generatedelectricity and heat from the cell, an appropriate contact betweenthe membrane layers with low thermal and electrical contact
rouzifard), [email protected]
and also to seal the cell, the MEA layers are compressed betweenthe bipolar plates by an initial normal pressure applied during theassembling process. In addition to the assembly pressure, extracompressive loads are applied on the GDL during the fuel celloperation due to hygro-thermal loading and membrane swelling[3e9]. The flexible, porous microstructure of the GDL deformsconsiderably when subjected to such compressive loadings. Thedeformation results in significant changes in the GDL’s propertiessuch as porosity, permeability, diffusivity, electrical and thermalbulk conductivities and contact resistances [1]. These propertychanges can significantly impact the transport phenomena, overallperformance and life of the fuel cell stack. Therefore, the me-chanical behavior of GDL under compression must be understood.In recent years, a number of studies have focused on the experi-mental and analytical investigation of the mechanical [10e15] aswell as thermal [2,16e19] and electrical [11] behavior of the GDLand its interfacial interaction [1,2,17,20e23] under compressiveloading.

Fig. 1. SEM image of the fibrous microstructure of a PEMFC gas diffusion layer, GDL:SIGRACET SGL 24 BA.
V. Norouzifard, M. Bahrami / Journal of Power Sources 264 (2014) 92e99 93
The majority of the existing studies on the GDL’s mechanicaldeformation were focused on numerical simulation of inhomoge-neous compression of GDL under the bipolar plates’ ribs using finiteelement method (FEM) [1,6,8,24e26]. In all of these studies, com-mercial FEM software was utilized for mechanical modeling. Due tothe high porosity (78% and higher), GDLs show a nonlinear me-chanical behavior in through plane compression. To develop amorerealistic FEM model for GDL in the fuel cell, Garcia-Salaberri et al.[1] created an empirical nonlinear stressestrain relationship bycurve fitting widespread data sets available in the literature.Although such empirical relationships can resolve the FEM modelsrequirements, they do not explain the dependency of the me-chanical behavior as a function of the GDL microstructure.
Developing a reliable mechanical model that can accuratelypredict the behavior of the GDL under compressive loads byconsidering its salient porous microstructure properties will pro-vide an accurate stressestrain relationship for the GDL deformationduring compression and increase the accuracy of FEM simulations.Moreover, the mechanical model will be useful to model the GDLbulk and interfacial transport phenomenon in the MEA.
Xing et al. [27] determined an optimum clamping pressurearound 0.77 MPa for SGL 10 BB GDL type and operating voltage of0.7 V and concluded that the optimum clamping pressure will in-crease when the operating voltage increases. Therefore, dependingon the fuel cell operating condition, the operating pressure can behigher than 0.8 MPa. GDL compression test data [10,11,28] shows acompression modulus that increases from a small value, then,beyond a critical pressure remains constant. Nitta [28] determinedcompressive stress of 1 MPa to be the critical stress for SGL 10 BAGDL and related the linear deformation region between pressures1e3.5MPa to the crushing of the hydrophobic pores in the GDL. Ourstudy focuses on the modeling of the GDL mechanical behavior inpressures higher than 1MPa, which is the operation pressure rangeof PEM fuel cells in high operating voltages. We plan to address thestress range below 1 MPa in our future study.
In this paper, we develop a new mechanistic analytical modelthat predicts the compressive stressestrain relationship of carbonpaper GDLs from their microstructural parameters such as fiberdiameter and elastic modulus, pore size distribution and porosity. Aunit cell approach is used in which the random, complex micro-structure of real materials is modeled by a simplified geometry that
is assumed to be repeated throughout the media. The unit cellapproach has been successfully used by our group for modelingGDL’s thermal conductivity, thermal contact resistance, andpermeability [2,18,29,30]. Fundamental beam bending theory isused to model carbon fiber bending as the main deformationmechanism at the unit cell level and the overall GDL deformation iscalculated from the summation of all unit cells’ deformations. Todetermine the effective unit cell length, the distance betweenadjacent fiber intersections and pore area are measured optically atrandom locations on several off-the-shelf sample GDLs. The effec-tive unit cell length is determined using a statistical analysis bycalculating parameters such as the mean standard deviation andcoefficient of variation of each GDL sample.
2. Analytical model development
Paper-based carbon fiber GDLs have a fibrous layered structurein which each layer consists of randomly distributed carbon fibers.Based on the deformation mechanism of the structure, an appro-priate geometrical model is needed to represent the random andcomplex structure of the GDL as simply as possible. Fig. 2 shows theproposed unit cell for the GDL modeling, the same unit cell hasbeen used consistently in our previous GDL thermal [2,18] andpermeability models [29,30]. This simple geometric model includesall the salient GDL microstructural characteristics needed to cap-ture the mechanical behavior under compression. As shown inFig. 2, each fiber acts as a bending beam in which the fibers belowand above the contact spot act as the supports and concentratedforces, respectively. Each fiber in a unit cell can be divided intosmall parts with two supports at the ends and one concentratedload in between, see the dashed line in Fig. 2c. Based on theinteraction between neighboring unit cells, the boundary conditionshown in Fig. 2d can be considered with good approximation.Deflection of the unit cell beam, d, under a specified load, F, can bedetermined by the well-known beam bending theory [31] as:
d ¼ 64Fl3
3pEd4
�� n6 þ 3n5 � 3n4 þ n3
�(1)
where, l, E and d are the unit cell length, carbon fibers elasticmodulus in longitudinal direction and fiber diameter, respectivelyand n is the fraction that shows the location of the bending load onthe beam, as shown in Fig. 3. n is a random parameter and its valuevaries between zero and one. Therefore, the average value off(n)¼�n6þ 3n5� 3n4þn3 for 0� n� 1 can be calculated by inte-gration of f. Substituting the average value of f in Eq. (1) gives:
d ¼ 16Fl3
105pEd4(2)
A mechanical model is needed to relate the GDL total defor-mation to the unit cell deflection. Fig. 3 presents a schematic of theGDL layered structure under compressive loads in which the layersact as stacked disc springs each of which has an effective stiffness ofkl. Assuming equal stiffness for all layers of GDL, the total throughthickness deformation of GDL can be written as:
dGDL ¼XM1
dl ¼MFkl
(3)
where, dl and M are the layer deformation and number of the GDLlayers, respectively. The number of layers, M, can be obtained fromthe GDL thickness and fibers diameter, by:

Fig. 2. Schematics of the proposed geometrical model for the GDL (a) isometric view,(b) top view, (c) cross-view section and (d) unit cell beam and boundary condition.
V. Norouzifard, M. Bahrami / Journal of Power Sources 264 (2014) 92e9994
M ¼ td
(4)
As shown in Fig. 3, each layer is composed of unit cell beams thatact as parallel springs under compressive load. Therefore, thestiffness of a GDL layer is equal to the summation of the unit cellsstiffness. Using Eq. (2) to calculate the stiffness of the unit cell, theeffective stiffness of a GDL layer is calculated as:
kl ¼XN1
ki ¼105pE16
XN1
d4il3i
(5)
where, N and li are the number and length of the unit cell beams ineach layer, respectively. N is estimated by calculating the number ofpores in one layer. Microscopic images show that both N and li haverandom distributions and vary throughout GDL layers. In this paper,a comprehensive optical study is performed to estimate theappropriate number of measurements needed to statisticallydetermine the effective unit cells length using a microscope, asshown in sample images presented in Fig. 4. A random distributionis found for the effective unit cell length for GDL samples studied,which will be presented in the following section. Correlation be-tween statistical parameters of independent randomvariables withtheir simple algebraic products can be found in the literature [32],therefore, the summation appeared in Eq. (5) can be calculatedusing the statistical parameters of unit cell length distribution suchas mean value and coefficient of variation as:
XN1
d4il3i
¼ Nmd4
l3¼ N
m4dm3l
�1þ 6C2
l
��1þ 6C2
d
�(6)
where, m and C are the random variable mean and coefficient ofvariation, l and d are indices for the unit cell length and fiberdiameter, respectively. Appendix A shows the derivation of Eq. (6).Using the GDL geometrical model presented in Fig. 2, each pore iscomposed of four unit cell beams that belong to two neighboringlayer. Therefore, each pore has two unit cells from the same layerand shares fibers with the neighbor pores. Thus, the total number ofunit cells in each layer can be estimated by the total number ofpores in the layer. Considering that the summation of all pore areasand the area occupied by fibers should be equal to the sample area,the number of unit cells in one layer can be calculated as:
N ¼ Asε
mApore
(7)
where, As, ε and mAporeare the sample area, porosity, and pore area
mean value, respectively. Substituting Eqs. (4)e(7) into Eq. (3)gives:
dGDL ¼ 16tFm3l mApore
105pEm5dAsε�1þ 6C2
l
��1þ 6C2
d
� (8)
After non-dimensionalization of Eq. (8), a new compact rela-tionship between the compressive strain, e, and stress, s, is ob-tained as follows:
e ¼ 16s105pE
�ld
�5
eff(9)
where
�ld
�eff
¼0@ m3l mApore
εm5d
�1þ 6C2
l
��1þ 6C2
d
�1A1
5
(10)
In the next section, the developed analytical results arecompared with our and others’ experimental data.

Fig. 3. GDL mechanical deformation model schematic.
Fig. 4. Microscopic image of (a) SGL SEGRACET 25 AA, (b) SGL 24 AA, and (c) TGP-H-60 GDL samples with 92, 88, and 78% porosity, measurement of the unit cell length and porearea between fibers.
Fig. 5. Measured mean value for unit cell length versus number of optical measure-ments for SGL 24 AA, SGL 25 AA and TORAY TGP-H-120 GDLs.
V. Norouzifard, M. Bahrami / Journal of Power Sources 264 (2014) 92e99 95
3. Results and discussion
3.1. Statistical measurements
As seen in Eqs. (8) and (10), to model the GDL mechanicaldeformation, the mean and standard deviation of the geometricalparameters of the microstructure are needed, including the dis-tance between two adjacent intersections between fibers (calledthe unit cell beam length in the present study), fiber diameter, andpores area. It should be noted that themicrostructure parameters ofthe GDL varies from manufacturer to manufacturer, thus, optical(microscopic) measurements and the statistical analysis should beperformed for each new material. Fig. 4 shows an optical imagetaken fromGDL samples: SGL SEGRACET 24AA and 25AA, and TorayTGP-H-60; the unit cell lengths and pore area are marked. In orderto determine a sufficient number of measurements for each sample,a sensitivity analysis is performed. We systematically increased thenumber of optical measurements by increments of 150 and calcu-lated the variation of themean and standard deviation. Figs. 5 and 6show the unit cell length mean and the standard deviation versusthe number of optical measurements for SGL 24AA and 25AA, andToray TGP-H-120 GDL samples. As seen in Figs. 5 and 6, the value ofboth statistical parameters plateau after approximately 600random optical measurements, beyond this, the average value ofboth parameter values becomes independent from the statisticalpopulation size. The probability density of the measured dataversus unit cell length is presented in Fig. 7 for two commerciallyavailable GDL samples SGL 25AA and SGL 24AA. All the measuredstatistical and previously reported properties as well as othergeometrical characteristics of the SIGRACET SGL 24AA, 25AA, and10 BA and Toray TGP-H-060 and TGP-H-120 GDLs needed in thepresent model, Eqs. (9) and (10), are listed in Table 1.
3.2. Model validation
To validate the present model, compression tests were per-formed on commercially available SEGRACET SGL 24AA and 25AA.The results of compression tests on TORAY TGP-H-60 and TGP-H-120 GDL samples previously performed in our group [2] and SEG-RACET SGL 10 BA data from literature [28] were also used in modelvalidation. Fig. 8 shows the schematic of the experimental appa-ratus used to perform compression tests on the GDL samples. Themachine was originally designed for the thermal contact resistance
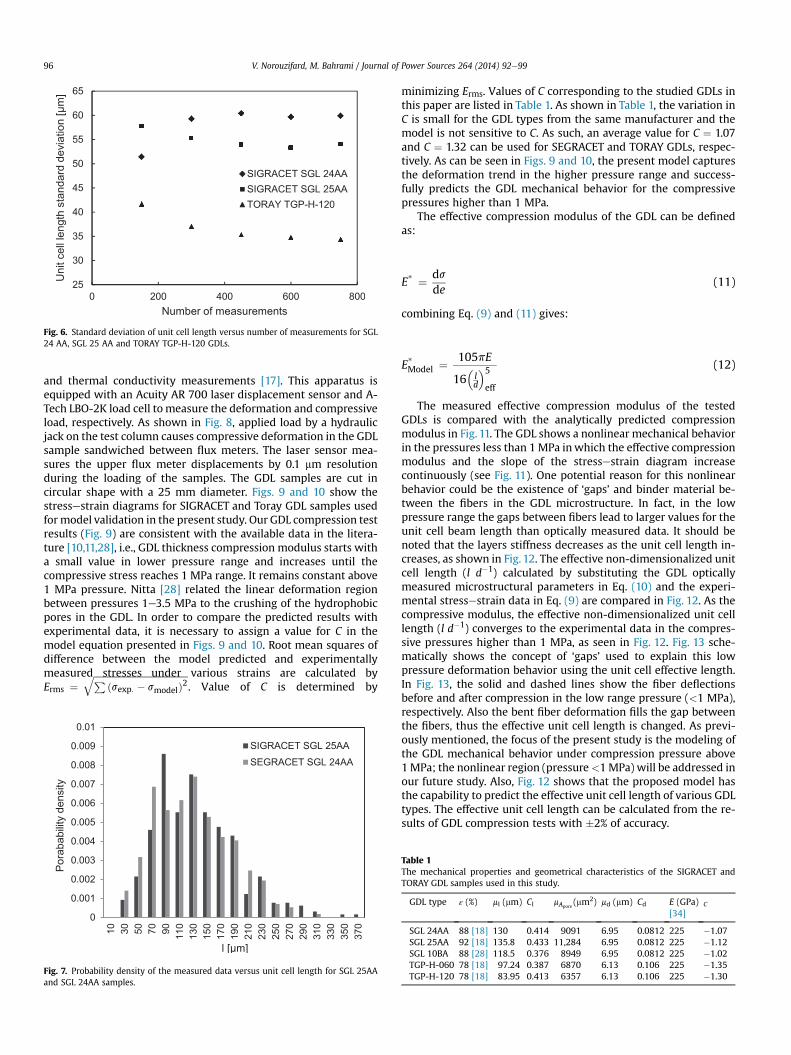
Fig. 6. Standard deviation of unit cell length versus number of measurements for SGL24 AA, SGL 25 AA and TORAY TGP-H-120 GDLs.
V. Norouzifard, M. Bahrami / Journal of Power Sources 264 (2014) 92e9996
and thermal conductivity measurements [17]. This apparatus isequipped with an Acuity AR 700 laser displacement sensor and A-Tech LBO-2K load cell tomeasure the deformation and compressiveload, respectively. As shown in Fig. 8, applied load by a hydraulicjack on the test column causes compressive deformation in the GDLsample sandwiched between flux meters. The laser sensor mea-sures the upper flux meter displacements by 0.1 mm resolutionduring the loading of the samples. The GDL samples are cut incircular shape with a 25 mm diameter. Figs. 9 and 10 show thestressestrain diagrams for SIGRACET and Toray GDL samples usedformodel validation in the present study. Our GDL compression testresults (Fig. 9) are consistent with the available data in the litera-ture [10,11,28], i.e., GDL thickness compression modulus starts witha small value in lower pressure range and increases until thecompressive stress reaches 1 MPa range. It remains constant above1 MPa pressure. Nitta [28] related the linear deformation regionbetween pressures 1e3.5 MPa to the crushing of the hydrophobicpores in the GDL. In order to compare the predicted results withexperimental data, it is necessary to assign a value for C in themodel equation presented in Figs. 9 and 10. Root mean squares ofdifference between the model predicted and experimentallymeasured stresses under various strains are calculated byErms ¼
ffiffiffiffiffiffiffiffiffiffiffiffiffiffiffiffiffiffiffiffiffiffiffiffiffiffiffiffiffiffiffiffiffiffiffiffiffiffiffiffiffiP ðsexp: � smodelÞ2q
. Value of C is determined by
Fig. 7. Probability density of the measured data versus unit cell length for SGL 25AAand SGL 24AA samples.
minimizing Erms. Values of C corresponding to the studied GDLs inthis paper are listed in Table 1. As shown in Table 1, the variation inC is small for the GDL types from the same manufacturer and themodel is not sensitive to C. As such, an average value for C ¼ 1.07and C ¼ 1.32 can be used for SEGRACET and TORAY GDLs, respec-tively. As can be seen in Figs. 9 and 10, the present model capturesthe deformation trend in the higher pressure range and success-fully predicts the GDL mechanical behavior for the compressivepressures higher than 1 MPa.
The effective compression modulus of the GDL can be definedas:
E* ¼ dsde
(11)
combining Eq. (9) and (11) gives:
E*Model ¼105pE
16�ld
�5eff
(12)
The measured effective compression modulus of the testedGDLs is compared with the analytically predicted compressionmodulus in Fig. 11. The GDL shows a nonlinear mechanical behaviorin the pressures less than 1MPa inwhich the effective compressionmodulus and the slope of the stressestrain diagram increasecontinuously (see Fig. 11). One potential reason for this nonlinearbehavior could be the existence of ‘gaps’ and binder material be-tween the fibers in the GDL microstructure. In fact, in the lowpressure range the gaps between fibers lead to larger values for theunit cell beam length than optically measured data. It should benoted that the layers stiffness decreases as the unit cell length in-creases, as shown in Fig. 12. The effective non-dimensionalized unitcell length (l d�1) calculated by substituting the GDL opticallymeasured microstructural parameters in Eq. (10) and the experi-mental stressestrain data in Eq. (9) are compared in Fig. 12. As thecompressive modulus, the effective non-dimensionalized unit celllength (l d�1) converges to the experimental data in the compres-sive pressures higher than 1 MPa, as seen in Fig. 12. Fig. 13 sche-matically shows the concept of ‘gaps’ used to explain this lowpressure deformation behavior using the unit cell effective length.In Fig. 13, the solid and dashed lines show the fiber deflectionsbefore and after compression in the low range pressure (<1 MPa),respectively. Also the bent fiber deformation fills the gap betweenthe fibers, thus the effective unit cell length is changed. As previ-ously mentioned, the focus of the present study is the modeling ofthe GDL mechanical behavior under compression pressure above1MPa; the nonlinear region (pressure<1MPa) will be addressed inour future study. Also, Fig. 12 shows that the proposed model hasthe capability to predict the effective unit cell length of various GDLtypes. The effective unit cell length can be calculated from the re-sults of GDL compression tests with �2% of accuracy.
Table 1The mechanical properties and geometrical characteristics of the SIGRACET andTORAY GDL samples used in this study.
GDL type ε (%) ml (mm) Cl mApore(mm2) md (mm) Cd E (GPa)
[34]C
SGL 24AA 88 [18] 130 0.414 9091 6.95 0.0812 225 �1.07SGL 25AA 92 [18] 135.8 0.433 11,284 6.95 0.0812 225 �1.12SGL 10BA 88 [28] 118.5 0.376 8949 6.95 0.0812 225 �1.02TGP-H-060 78 [18] 97.24 0.387 6870 6.13 0.106 225 �1.35TGP-H-120 78 [18] 83.95 0.413 6357 6.13 0.106 225 �1.30

Fig. 8. (a) Photograph and (b) schematic view of experimental apparatus used forcompression tests.
Fig. 9. Model results (lines) compared to experimental stressestrain data (points) forSGL 25 AA, 24AA, and 10BA [28] GDLs.
Fig. 10. Model results (lines) compared to experimental stressestrain data (points) forToray TGP-H-060 and TGP-H-060 [17] GDLs.
Fig. 11. The GDL through plane compressive deformation modulus versus stress.
V. Norouzifard, M. Bahrami / Journal of Power Sources 264 (2014) 92e99 97
3.3. Uncertainty analysis
From stress definition, s¼ F/A, uncertainties in the force andsample area measurements can cause uncertainty in the stress. Theuncertainty of the stressestrain data, included in the plots, iscalculated as follows [33]:
EðsÞ ¼ffiffiffiffiffiffiffiffiffiffiffiffiffiffiffiffiffiffiffiffiffiffiffiffiffiffiffiffiffiffiffiffiffiffiffiffiffiffiffiffiffiffiffi�EðFÞF
�2
þ�EðAÞA
�2s
(13)
where, Eð$Þ indicates the uncertainty of the parameters, F and A arethe measured force and the sample area, respectively. Using load
cell and the amplifier manufacturers’ technical specifications, theuncertainty in the measured force was less than 1%. A circularcutter is used to cut the samples from the GDL sheets. The diameterof the cutter is about 1/16 of inch larger than the flux meters 1-inchdiameter. Therefore, the area of the flux meters is determinant. Thedimensions of the flux meters can change due to temperature

Fig. 12. The unit cell non-dimensionalized length factor versus stress.
V. Norouzifard, M. Bahrami / Journal of Power Sources 264 (2014) 92e9998
variation during the experiments. Since, the temperature variationswas not considerable, the area uncertainty is negligible.
For the strain, ε ¼ 1� t0=t, uncertainty sources are thedeformed GDL thickness, t0, measurement and the GDL initialthickness, t. The GDL thickness during deformation was measuredusing a laser displacement sensor that has a resolution of 0.005% ofthe measurement span based on the manufacturer technical data.Therefore, the strain uncertainty arises from displacement sensor isnegligible. Another source is the GDL initial thickness variation,which is determined about �7.89% according to the GDL’s datasheet provided by the manufacturers. The uncertainty of the strain,included in the plots as well, is calculated as follows [33]:
EðεÞ ¼ffiffiffiffiffiffiffiffiffiffiffiffiffiffiffiffiffiffiffiffiffiffiffiffiffiffiffiffiffiffiffiffiffiffiffiffiffiffiffiffiffiffiffi�Eðt0Þt0
�2þ�EðtÞt
�2s
(14)
where, t0 and t are the GDL compressed and initial thicknesses,respectively. Then, 7.89% uncertainty is calculated for the strainmeasurements.
4. Conclusion
In this paper, a novel analytical model was developed to predictthe mechanical behavior of carbon fiber based GDLs under throughplane compression. A unit cell approach was used to model thegeometry of the GDL microstructure. Bending of carbon fibers wasconsidered as themainmechanism responsible for the deformationof the GDL. The present model took into account salient GDLmicrostructural characteristics and properties such as carbon fiber
Fig. 13. Effect of the gap between fibers on the effective unit cell during the GDLcompression (dashed lines show fiber location after GDL compression).
diameter, elastic modulus, pore size distribution, and porosity. Acomprehensive optical measurement study was performed to sta-tistically determine effective geometric parameters needed in theproposed unit cell model. We measured compressive strainestressfor a number of commercially available SGL GDL samples. Com-parison between the model results with the experimental stressestrain data showed that the present model could accurately predictthe mechanical behavior of the GDL in the linear area, where thecompressive pressures were higher than 1 MPa. Therefore, themodel can be used for GDL deformation simulations as well asinvestigation of the GDL structural parameters (e.g. fibers diameter,pore size and porosity) effects on themechanical behavior strength.It can also provide guidelines and engineering insight formanufacturing more efficient gas diffusion layers.
Appendix A
Using relationships reported by Mischke [32] for mean andstandard deviation of simple algebraic operations on the inde-pendent random variables, the following equations can be written:
mxy ¼ mxmy (A.1)
mx4 ¼ m4x
�1þ 6C2
x
�(A.2)
m 1x3
¼ 1m3x
�1þ 6C2
x
�(A.3)
where, C is the coefficient of variation and can be calculated as
Cx ¼ bsx
mx(A.4)
where, m and bs are the mean and standard deviation, respectively.Considering Eqs. (A.1)e(A.3), md4=l3 can be written as
md4
l3¼ md4m 1
l3¼ m4d
�1þ 6C2
d
� 1m3l
�1þ 6C2
l
�(A.5)
References
[1] P.A. García-Salaberri, M. Vera, R. Zaera, Int. J. Hydrogen Energy 36 (2011)11856e11870.
[2] E. Sadeghi, N. Djilali, M. Bahrami, J. Power Sources 195 (2010) 8104e8109.[3] A. Kusoglu, M.H. Santare, A.M. Karlsson, S. Cleghorn, W.B. Johnson,
J. Electrochem. Soc. 157 (2010) B705.[4] A. Kusoglu, A.M. Karlsson, M.H. Santare, S. Cleghorn, W.B. Johnson, J. Power
Sources 161 (2006) 987e996.[5] R. Solasi, Y. Zou, X. Huang, K. Reifsnider, D. Condit, J. Power Sources 167 (2007)
366e377.[6] Z. Lu, C. Kim, A.M. Karlsson, J.C. Cross, M.H. Santare, J. Power Sources 196
(2011) 4646e4654.[7] M.N. Silberstein, M.C. Boyce, J. Power Sources 196 (2011) 3452e3460.[8] Y. Zhou, G. Lin, A.J. Shih, S.J. Hu, J. Power Sources 192 (2009) 544e551.[9] A. Kusoglu, A.M. Karlsson, M.H. Santare, S. Cleghorn, W.B. Johnson, J. Power
Sources 170 (2007) 345e358.[10] S. Escribano, J.-F. Blachot, J. Ethève, A. Morin, R. Mosdale, J. Power Sources 156
(2006) 8e13.[11] J. Kleemann, F. Finsterwalder, W. Tillmetz, J. Power Sources 190 (2009) 92e
102.[12] K.K. Poornesh, C.D. Cho, G.B. Lee, Y.S. Tak, J. Power Sources 195 (2010) 2718e
2730.[13] V. Radhakrishnan, P. Haridoss, Mater. Des. 32 (2011) 861e868.[14] M.F. Serincan, U. Pasaogullari, J. Power Sources 196 (2011) 1314e1320.[15] I. Nitta, T. Hottinen, O. Himanen, M. Mikkola, J. Power Sources 171 (2007) 26e
36.[16] E. Sadeghi, M. Bahrami, N. Djilali, J. Power Sources 179 (2008) 200e208.[17] E. Sadeghi, N. Djilali, M. Bahrami, J. Power Sources 196 (2011) 246e254.[18] H. Sadeghifar, M. Bahrami, N. Djilali, J. Power Sources 233 (2013) 369e379.[19] I. Nitta, O. Himanen, M. Mikkola, Fuel Cells 8 (2008) 111e119.

V. Norouzifard, M. Bahrami / Journal of Power Sources 264 (2014) 92e99 99
[20] Z. Wu, S. Wang, L. Zhang, S.J. Hu, J. Power Sources 189 (2009) 1066e1073.[21] Z. Wu, Y. Zhou, G. Lin, S. Wang, S.J. Hu, J. Power Sources 182 (2008) 265e269.[22] Y. Zhou, G. Lin, A.J. Shih, S.J. Hu, J. Power Sources 163 (2007) 777e783.[23] I. Nitta, O. Himanen, M. Mikkola, Electrochem. Commun. 10 (2008) 47e51.[24] P. Zhou, C.W. Wu, G.J. Ma, J. Power Sources 159 (2006) 1115e1122.[25] P. Zhou, C.W. Wu, G.J. Ma, J. Power Sources 163 (2007) 874e881.[26] P. Zhou, C.W. Wu, J. Power Sources 170 (2007) 93e100.[27] X.Q. Xing, K.W. Lum, H.J. Poh, Y.L. Wu, J. Power Sources 195 (2010) 62e68.[28] I. Nitta, Inhomogeneous Compression of PEMFC Gas Diffusion Layers, Helsinki
University of Technology, 2008.
[29] A. Tamayol, F. McGregor, M. Bahrami, J. Power Sources 204 (2012) 94e99.[30] A. Tamayol, K.W. Wong, M. Bahrami, Phys. Rev. E 85 (2012) 026318.[31] J. Shigley, C. Mischke, R. Budynas, Mechanical Engineering Design, eighth ed.,
McGraw-Hill, 2006.[32] C.R. Mischke, Mathematical Model Building, Iowa State University Press,
1980.[33] J.R. Taylor, An Introduction to Error, University Science Books, Sansalito, 1997.[34] M. Mathias, J. Roth, J. Fleming, W. Lehnert, Handbook of Fuel Cells, John Wiley
& Sons, 2003.